Zip Codes with the Highest Percentage of Population Employed in Food Preparation & Serving in Amarillo, TX
RELATED REPORTS & OPTIONS
Food Preparation & Serving
Amarillo
Compare Zip Codes
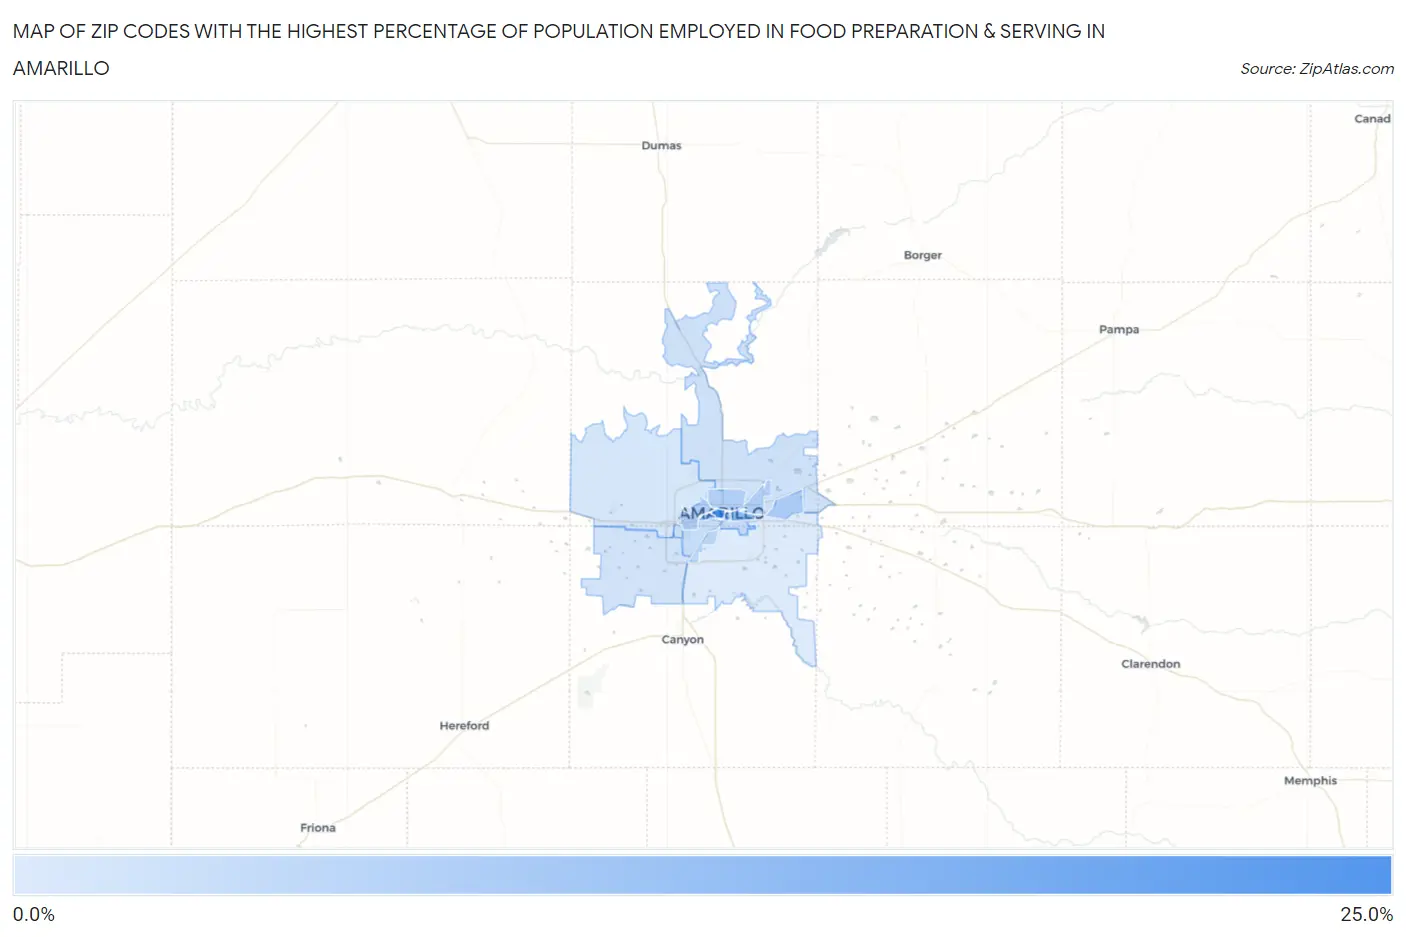
Map of Zip Codes with the Highest Percentage of Population Employed in Food Preparation & Serving in Amarillo
0.0%
25.0%
Zip Codes with the Highest Percentage of Population Employed in Food Preparation & Serving in Amarillo, TX
| Zip Code | % Employed | vs State | vs National | |
| 1. | 79101 | 23.9% | 5.4%(+18.6)#20 | 5.3%(+18.6)#346 |
| 2. | 79104 | 14.2% | 5.4%(+8.89)#60 | 5.3%(+8.96)#1,113 |
| 3. | 79102 | 12.1% | 5.4%(+6.79)#86 | 5.3%(+6.86)#1,617 |
| 4. | 79111 | 9.7% | 5.4%(+4.34)#154 | 5.3%(+4.41)#2,891 |
| 5. | 79106 | 9.0% | 5.4%(+3.67)#199 | 5.3%(+3.74)#3,506 |
| 6. | 79107 | 8.6% | 5.4%(+3.28)#231 | 5.3%(+3.35)#3,924 |
| 7. | 79110 | 7.5% | 5.4%(+2.12)#347 | 5.3%(+2.19)#5,598 |
| 8. | 79109 | 6.1% | 5.4%(+0.718)#551 | 5.3%(+0.783)#9,115 |
| 9. | 79103 | 5.9% | 5.4%(+0.574)#585 | 5.3%(+0.639)#9,595 |
| 10. | 79108 | 4.9% | 5.4%(-0.427)#827 | 5.3%(-0.361)#13,249 |
| 11. | 79119 | 4.6% | 5.4%(-0.795)#916 | 5.3%(-0.729)#14,800 |
| 12. | 79121 | 4.6% | 5.4%(-0.798)#918 | 5.3%(-0.732)#14,814 |
| 13. | 79124 | 3.9% | 5.4%(-1.46)#1,067 | 5.3%(-1.39)#17,546 |
| 14. | 79118 | 3.0% | 5.4%(-2.32)#1,264 | 5.3%(-2.26)#21,153 |
1
Common Questions
What are the Top 10 Zip Codes with the Highest Percentage of Population Employed in Food Preparation & Serving in Amarillo, TX?
Top 10 Zip Codes with the Highest Percentage of Population Employed in Food Preparation & Serving in Amarillo, TX are:
What zip code has the Highest Percentage of Population Employed in Food Preparation & Serving in Amarillo, TX?
79101 has the Highest Percentage of Population Employed in Food Preparation & Serving in Amarillo, TX with 23.9%.
What is the Percentage of Population Employed in Food Preparation & Serving in Amarillo, TX?
Percentage of Population Employed in Food Preparation & Serving in Amarillo is 7.2%.
What is the Percentage of Population Employed in Food Preparation & Serving in Texas?
Percentage of Population Employed in Food Preparation & Serving in Texas is 5.4%.
What is the Percentage of Population Employed in Food Preparation & Serving in the United States?
Percentage of Population Employed in Food Preparation & Serving in the United States is 5.3%.