Zip Codes with the Highest Percentage of Population Employed in Food Preparation & Serving in Minnesota
RELATED REPORTS & OPTIONS
Food Preparation & Serving
Minnesota
Compare Zip Codes
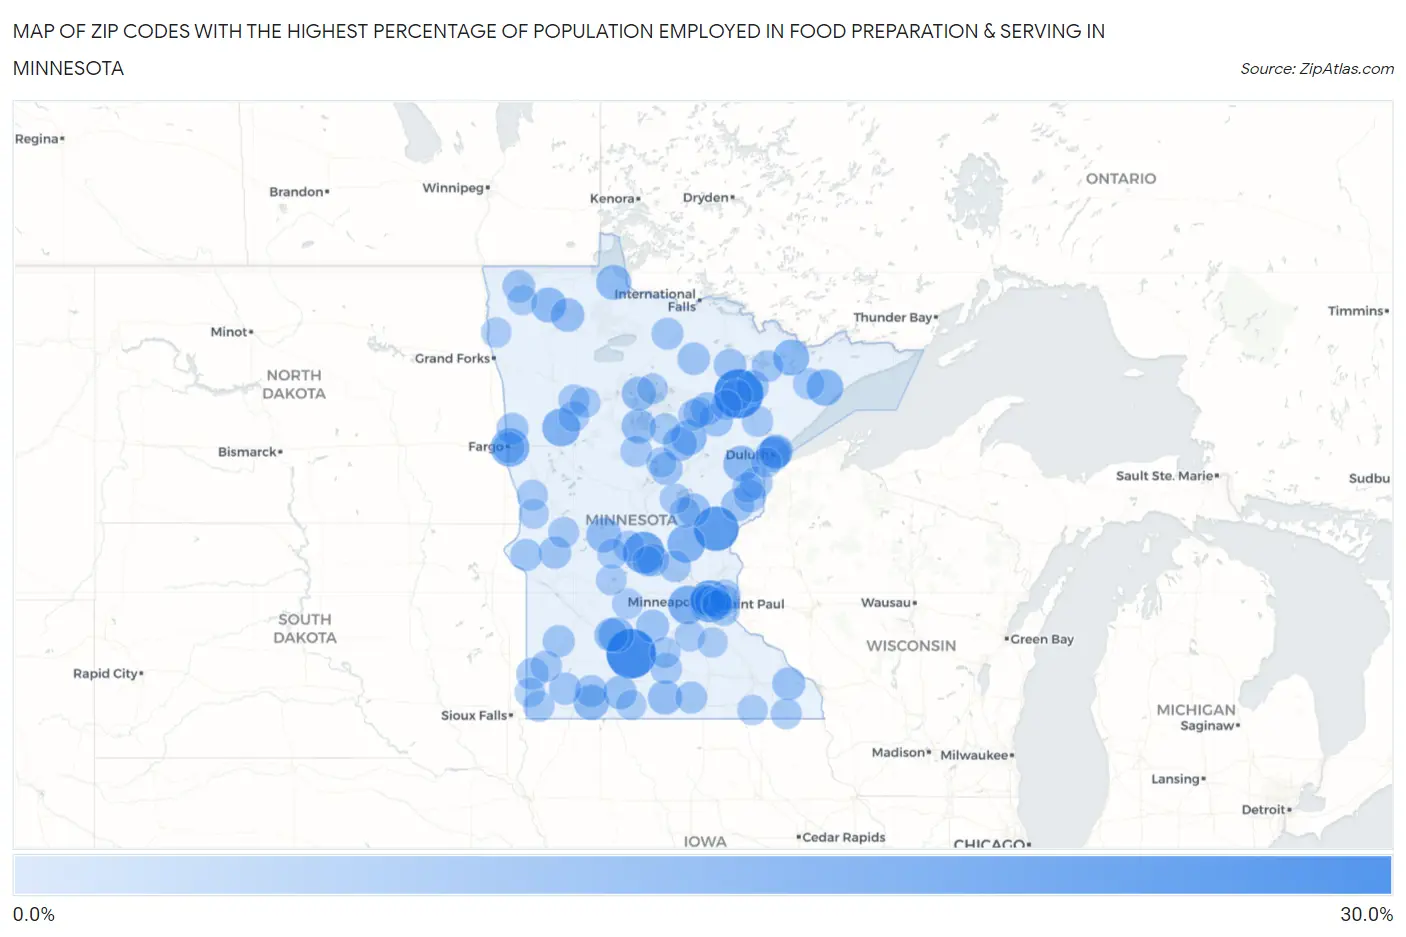
Map of Zip Codes with the Highest Percentage of Population Employed in Food Preparation & Serving in Minnesota
0.0%
30.0%
Zip Codes with the Highest Percentage of Population Employed in Food Preparation & Serving in Minnesota
| Zip Code | % Employed | vs State | vs National | |
| 1. | 56030 | 28.6% | 4.7%(+23.8)#1 | 5.3%(+23.3)#239 |
| 2. | 55758 | 28.0% | 4.7%(+23.3)#2 | 5.3%(+22.7)#247 |
| 3. | 55036 | 23.1% | 4.7%(+18.3)#3 | 5.3%(+17.8)#384 |
| 4. | 55455 | 20.3% | 4.7%(+15.6)#4 | 5.3%(+15.0)#486 |
| 5. | 56321 | 19.7% | 4.7%(+14.9)#5 | 5.3%(+14.4)#524 |
| 6. | 56563 | 16.4% | 4.7%(+11.6)#6 | 5.3%(+11.1)#811 |
| 7. | 55384 | 16.1% | 4.7%(+11.4)#7 | 5.3%(+10.8)#851 |
| 8. | 56591 | 15.6% | 4.7%(+10.9)#8 | 5.3%(+10.3)#900 |
| 9. | 56363 | 15.4% | 4.7%(+10.7)#9 | 5.3%(+10.2)#924 |
| 10. | 55603 | 14.1% | 4.7%(+9.38)#10 | 5.3%(+8.82)#1,142 |
| 11. | 55796 | 13.6% | 4.7%(+8.83)#11 | 5.3%(+8.27)#1,263 |
| 12. | 55780 | 13.5% | 4.7%(+8.75)#12 | 5.3%(+8.20)#1,283 |
| 13. | 55333 | 13.0% | 4.7%(+8.23)#13 | 5.3%(+7.67)#1,401 |
| 14. | 55748 | 12.9% | 4.7%(+8.17)#14 | 5.3%(+7.61)#1,420 |
| 15. | 56161 | 12.6% | 4.7%(+7.84)#15 | 5.3%(+7.29)#1,503 |
| 16. | 56686 | 12.5% | 4.7%(+7.74)#16 | 5.3%(+7.19)#1,526 |
| 17. | 56759 | 12.4% | 4.7%(+7.70)#17 | 5.3%(+7.14)#1,536 |
| 18. | 56389 | 12.2% | 4.7%(+7.46)#18 | 5.3%(+6.91)#1,599 |
| 19. | 56484 | 11.7% | 4.7%(+6.98)#19 | 5.3%(+6.42)#1,771 |
| 20. | 55785 | 11.7% | 4.7%(+6.94)#20 | 5.3%(+6.38)#1,787 |
| 21. | 56023 | 11.7% | 4.7%(+6.93)#21 | 5.3%(+6.37)#1,789 |
| 22. | 56663 | 11.4% | 4.7%(+6.63)#22 | 5.3%(+6.08)#1,892 |
| 23. | 55806 | 11.3% | 4.7%(+6.62)#23 | 5.3%(+6.06)#1,900 |
| 24. | 55404 | 11.1% | 4.7%(+6.40)#24 | 5.3%(+5.84)#1,989 |
| 25. | 56724 | 11.1% | 4.7%(+6.38)#25 | 5.3%(+5.83)#2,005 |
| 26. | 55812 | 11.0% | 4.7%(+6.23)#26 | 5.3%(+5.67)#2,076 |
| 27. | 56270 | 10.9% | 4.7%(+6.18)#27 | 5.3%(+5.63)#2,095 |
| 28. | 56160 | 10.8% | 4.7%(+6.05)#28 | 5.3%(+5.50)#2,164 |
| 29. | 56386 | 10.5% | 4.7%(+5.79)#29 | 5.3%(+5.24)#2,314 |
| 30. | 55403 | 10.5% | 4.7%(+5.79)#30 | 5.3%(+5.23)#2,321 |
| 31. | 55742 | 10.5% | 4.7%(+5.73)#31 | 5.3%(+5.18)#2,343 |
| 32. | 55805 | 10.5% | 4.7%(+5.73)#32 | 5.3%(+5.17)#2,347 |
| 33. | 55366 | 10.4% | 4.7%(+5.63)#33 | 5.3%(+5.07)#2,396 |
| 34. | 55952 | 10.3% | 4.7%(+5.59)#34 | 5.3%(+5.04)#2,408 |
| 35. | 55716 | 10.3% | 4.7%(+5.58)#35 | 5.3%(+5.02)#2,423 |
| 36. | 56301 | 10.1% | 4.7%(+5.34)#36 | 5.3%(+4.79)#2,577 |
| 37. | 56441 | 10.0% | 4.7%(+5.30)#37 | 5.3%(+4.74)#2,609 |
| 38. | 55072 | 10.0% | 4.7%(+5.28)#38 | 5.3%(+4.72)#2,623 |
| 39. | 55749 | 9.9% | 4.7%(+5.16)#39 | 5.3%(+4.61)#2,710 |
| 40. | 55723 | 9.8% | 4.7%(+5.12)#40 | 5.3%(+4.56)#2,753 |
| 41. | 55792 | 9.8% | 4.7%(+5.11)#41 | 5.3%(+4.55)#2,762 |
| 42. | 56639 | 9.8% | 4.7%(+5.07)#42 | 5.3%(+4.52)#2,800 |
| 43. | 56734 | 9.8% | 4.7%(+5.04)#43 | 5.3%(+4.49)#2,820 |
| 44. | 56267 | 9.8% | 4.7%(+5.02)#44 | 5.3%(+4.47)#2,841 |
| 45. | 55712 | 9.6% | 4.7%(+4.89)#45 | 5.3%(+4.34)#2,949 |
| 46. | 56137 | 9.6% | 4.7%(+4.85)#46 | 5.3%(+4.30)#2,990 |
| 47. | 56141 | 9.4% | 4.7%(+4.67)#47 | 5.3%(+4.12)#3,137 |
| 48. | 56164 | 9.4% | 4.7%(+4.64)#48 | 5.3%(+4.08)#3,168 |
| 49. | 56239 | 9.3% | 4.7%(+4.58)#49 | 5.3%(+4.02)#3,229 |
| 50. | 56546 | 9.2% | 4.7%(+4.44)#50 | 5.3%(+3.88)#3,356 |
| 51. | 56240 | 9.2% | 4.7%(+4.43)#51 | 5.3%(+3.88)#3,360 |
| 52. | 56032 | 9.1% | 4.7%(+4.36)#52 | 5.3%(+3.80)#3,430 |
| 53. | 56627 | 9.1% | 4.7%(+4.36)#53 | 5.3%(+3.80)#3,433 |
| 54. | 55411 | 9.0% | 4.7%(+4.31)#54 | 5.3%(+3.76)#3,481 |
| 55. | 55713 | 9.0% | 4.7%(+4.31)#55 | 5.3%(+3.75)#3,483 |
| 56. | 55055 | 8.9% | 4.7%(+4.22)#56 | 5.3%(+3.66)#3,575 |
| 57. | 55782 | 8.9% | 4.7%(+4.17)#57 | 5.3%(+3.61)#3,618 |
| 58. | 55308 | 8.9% | 4.7%(+4.13)#58 | 5.3%(+3.57)#3,659 |
| 59. | 56562 | 8.8% | 4.7%(+4.09)#59 | 5.3%(+3.54)#3,700 |
| 60. | 56170 | 8.8% | 4.7%(+4.06)#60 | 5.3%(+3.50)#3,740 |
| 61. | 56001 | 8.8% | 4.7%(+4.05)#61 | 5.3%(+3.50)#3,743 |
| 62. | 56435 | 8.7% | 4.7%(+4.00)#62 | 5.3%(+3.44)#3,809 |
| 63. | 55607 | 8.6% | 4.7%(+3.84)#63 | 5.3%(+3.29)#4,004 |
| 64. | 56331 | 8.6% | 4.7%(+3.83)#64 | 5.3%(+3.28)#4,013 |
| 65. | 56672 | 8.3% | 4.7%(+3.58)#65 | 5.3%(+3.02)#4,310 |
| 66. | 55724 | 8.3% | 4.7%(+3.58)#66 | 5.3%(+3.02)#4,311 |
| 67. | 56156 | 8.3% | 4.7%(+3.53)#67 | 5.3%(+2.97)#4,361 |
| 68. | 55090 | 8.2% | 4.7%(+3.51)#68 | 5.3%(+2.96)#4,386 |
| 69. | 56651 | 8.2% | 4.7%(+3.48)#69 | 5.3%(+2.93)#4,419 |
| 70. | 56566 | 8.2% | 4.7%(+3.46)#70 | 5.3%(+2.90)#4,454 |
| 71. | 55922 | 8.1% | 4.7%(+3.36)#71 | 5.3%(+2.81)#4,576 |
| 72. | 56082 | 8.0% | 4.7%(+3.31)#72 | 5.3%(+2.76)#4,668 |
| 73. | 56339 | 8.0% | 4.7%(+3.29)#73 | 5.3%(+2.74)#4,697 |
| 74. | 55744 | 7.9% | 4.7%(+3.21)#74 | 5.3%(+2.66)#4,817 |
| 75. | 55414 | 7.9% | 4.7%(+3.18)#75 | 5.3%(+2.62)#4,877 |
| 76. | 56359 | 7.9% | 4.7%(+3.14)#76 | 5.3%(+2.59)#4,929 |
| 77. | 56621 | 7.9% | 4.7%(+3.13)#77 | 5.3%(+2.58)#4,938 |
| 78. | 55722 | 7.9% | 4.7%(+3.13)#78 | 5.3%(+2.58)#4,939 |
| 79. | 56543 | 7.8% | 4.7%(+3.09)#79 | 5.3%(+2.54)#5,002 |
| 80. | 56450 | 7.8% | 4.7%(+3.06)#80 | 5.3%(+2.51)#5,064 |
| 81. | 56228 | 7.8% | 4.7%(+3.06)#81 | 5.3%(+2.51)#5,070 |
| 82. | 56288 | 7.8% | 4.7%(+3.05)#82 | 5.3%(+2.49)#5,090 |
| 83. | 56681 | 7.8% | 4.7%(+3.04)#83 | 5.3%(+2.48)#5,109 |
| 84. | 56071 | 7.7% | 4.7%(+3.00)#84 | 5.3%(+2.44)#5,174 |
| 85. | 55756 | 7.7% | 4.7%(+2.96)#85 | 5.3%(+2.41)#5,223 |
| 86. | 55128 | 7.7% | 4.7%(+2.92)#86 | 5.3%(+2.37)#5,292 |
| 87. | 55746 | 7.6% | 4.7%(+2.91)#87 | 5.3%(+2.35)#5,312 |
| 88. | 56325 | 7.6% | 4.7%(+2.89)#88 | 5.3%(+2.33)#5,348 |
| 89. | 55103 | 7.6% | 4.7%(+2.84)#89 | 5.3%(+2.29)#5,426 |
| 90. | 56369 | 7.6% | 4.7%(+2.84)#90 | 5.3%(+2.28)#5,433 |
| 91. | 56710 | 7.5% | 4.7%(+2.81)#91 | 5.3%(+2.25)#5,489 |
| 92. | 55961 | 7.5% | 4.7%(+2.80)#92 | 5.3%(+2.24)#5,503 |
| 93. | 55808 | 7.5% | 4.7%(+2.77)#93 | 5.3%(+2.22)#5,554 |
| 94. | 56442 | 7.5% | 4.7%(+2.75)#94 | 5.3%(+2.20)#5,585 |
| 95. | 56144 | 7.4% | 4.7%(+2.65)#95 | 5.3%(+2.09)#5,783 |
| 96. | 56732 | 7.4% | 4.7%(+2.65)#96 | 5.3%(+2.09)#5,784 |
| 97. | 55057 | 7.4% | 4.7%(+2.64)#97 | 5.3%(+2.08)#5,803 |
| 98. | 56181 | 7.4% | 4.7%(+2.62)#98 | 5.3%(+2.07)#5,837 |
| 99. | 56565 | 7.4% | 4.7%(+2.62)#99 | 5.3%(+2.07)#5,841 |
| 100. | 55107 | 7.3% | 4.7%(+2.60)#100 | 5.3%(+2.04)#5,882 |
Common Questions
What are the Top 10 Zip Codes with the Highest Percentage of Population Employed in Food Preparation & Serving in Minnesota?
Top 10 Zip Codes with the Highest Percentage of Population Employed in Food Preparation & Serving in Minnesota are:
What zip code has the Highest Percentage of Population Employed in Food Preparation & Serving in Minnesota?
56030 has the Highest Percentage of Population Employed in Food Preparation & Serving in Minnesota with 28.6%.
What is the Percentage of Population Employed in Food Preparation & Serving in the State of Minnesota?
Percentage of Population Employed in Food Preparation & Serving in Minnesota is 4.7%.
What is the Percentage of Population Employed in Food Preparation & Serving in the United States?
Percentage of Population Employed in Food Preparation & Serving in the United States is 5.3%.