Zip Codes with the Highest Percentage of Population Employed in Food Preparation & Serving in Spring, TX
RELATED REPORTS & OPTIONS
Food Preparation & Serving
Spring
Compare Zip Codes
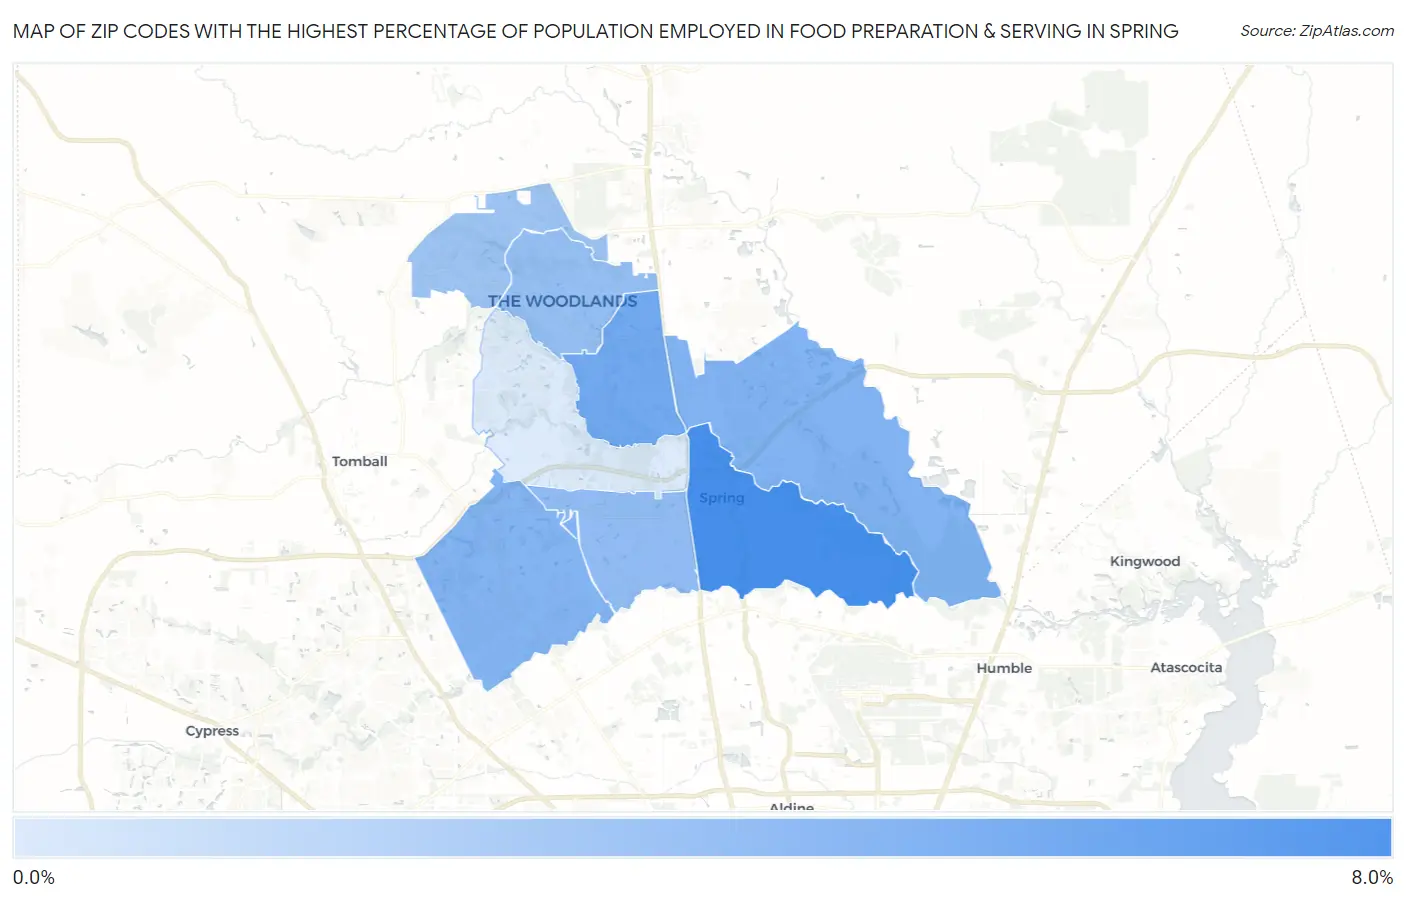
Map of Zip Codes with the Highest Percentage of Population Employed in Food Preparation & Serving in Spring
0.0%
8.0%
Zip Codes with the Highest Percentage of Population Employed in Food Preparation & Serving in Spring, TX
| Zip Code | % Employed | vs State | vs National | |
| 1. | 77373 | 6.2% | 5.4%(+0.804)#532 | 5.3%(+0.869)#8,862 |
| 2. | 77380 | 4.8% | 5.4%(-0.558)#855 | 5.3%(-0.492)#13,790 |
| 3. | 77386 | 4.4% | 5.4%(-0.987)#949 | 5.3%(-0.922)#15,584 |
| 4. | 77379 | 4.3% | 5.4%(-1.04)#961 | 5.3%(-0.977)#15,851 |
| 5. | 77388 | 3.8% | 5.4%(-1.53)#1,083 | 5.3%(-1.46)#17,826 |
| 6. | 77381 | 3.7% | 5.4%(-1.67)#1,116 | 5.3%(-1.60)#18,424 |
| 7. | 77382 | 3.4% | 5.4%(-1.95)#1,173 | 5.3%(-1.88)#19,608 |
| 8. | 77389 | 1.5% | 5.4%(-3.82)#1,502 | 5.3%(-3.76)#25,935 |
1
Common Questions
What are the Top 5 Zip Codes with the Highest Percentage of Population Employed in Food Preparation & Serving in Spring, TX?
Top 5 Zip Codes with the Highest Percentage of Population Employed in Food Preparation & Serving in Spring, TX are:
What zip code has the Highest Percentage of Population Employed in Food Preparation & Serving in Spring, TX?
77373 has the Highest Percentage of Population Employed in Food Preparation & Serving in Spring, TX with 6.2%.
What is the Percentage of Population Employed in Food Preparation & Serving in Spring, TX?
Percentage of Population Employed in Food Preparation & Serving in Spring is 6.3%.
What is the Percentage of Population Employed in Food Preparation & Serving in Texas?
Percentage of Population Employed in Food Preparation & Serving in Texas is 5.4%.
What is the Percentage of Population Employed in Food Preparation & Serving in the United States?
Percentage of Population Employed in Food Preparation & Serving in the United States is 5.3%.