Zip Codes with the Highest Percentage of Population Employed in Food Preparation & Serving in Georgetown, TX
RELATED REPORTS & OPTIONS
Food Preparation & Serving
Georgetown
Compare Zip Codes
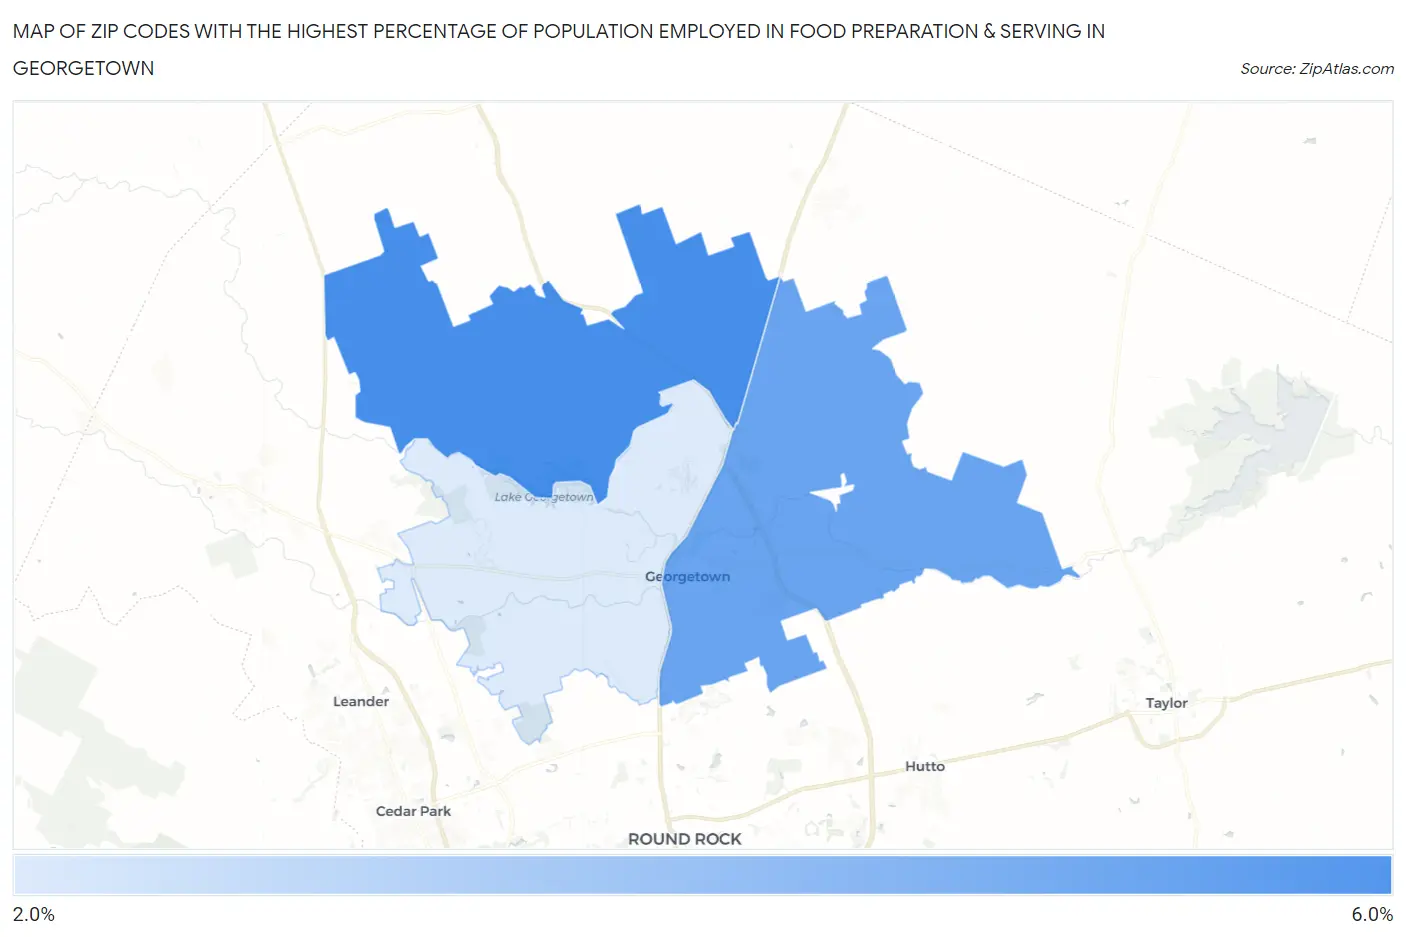
Map of Zip Codes with the Highest Percentage of Population Employed in Food Preparation & Serving in Georgetown
0.0%
6.0%
Zip Codes with the Highest Percentage of Population Employed in Food Preparation & Serving in Georgetown, TX
| Zip Code | % Employed | vs State | vs National | |
| 1. | 78633 | 5.2% | 5.4%(-0.138)#749 | 5.3%(-0.073)#12,092 |
| 2. | 78626 | 4.7% | 5.4%(-0.689)#890 | 5.3%(-0.623)#14,317 |
| 3. | 78628 | 2.9% | 5.4%(-2.45)#1,283 | 5.3%(-2.38)#21,651 |
1
Common Questions
What are the Top Zip Codes with the Highest Percentage of Population Employed in Food Preparation & Serving in Georgetown, TX?
Top Zip Codes with the Highest Percentage of Population Employed in Food Preparation & Serving in Georgetown, TX are:
What zip code has the Highest Percentage of Population Employed in Food Preparation & Serving in Georgetown, TX?
78633 has the Highest Percentage of Population Employed in Food Preparation & Serving in Georgetown, TX with 5.2%.
What is the Percentage of Population Employed in Food Preparation & Serving in Georgetown, TX?
Percentage of Population Employed in Food Preparation & Serving in Georgetown is 4.6%.
What is the Percentage of Population Employed in Food Preparation & Serving in Texas?
Percentage of Population Employed in Food Preparation & Serving in Texas is 5.4%.
What is the Percentage of Population Employed in Food Preparation & Serving in the United States?
Percentage of Population Employed in Food Preparation & Serving in the United States is 5.3%.