Zip Codes with the Highest Percentage of Population Employed in Food Preparation & Serving in Grand Prairie, TX
RELATED REPORTS & OPTIONS
Food Preparation & Serving
Grand Prairie
Compare Zip Codes
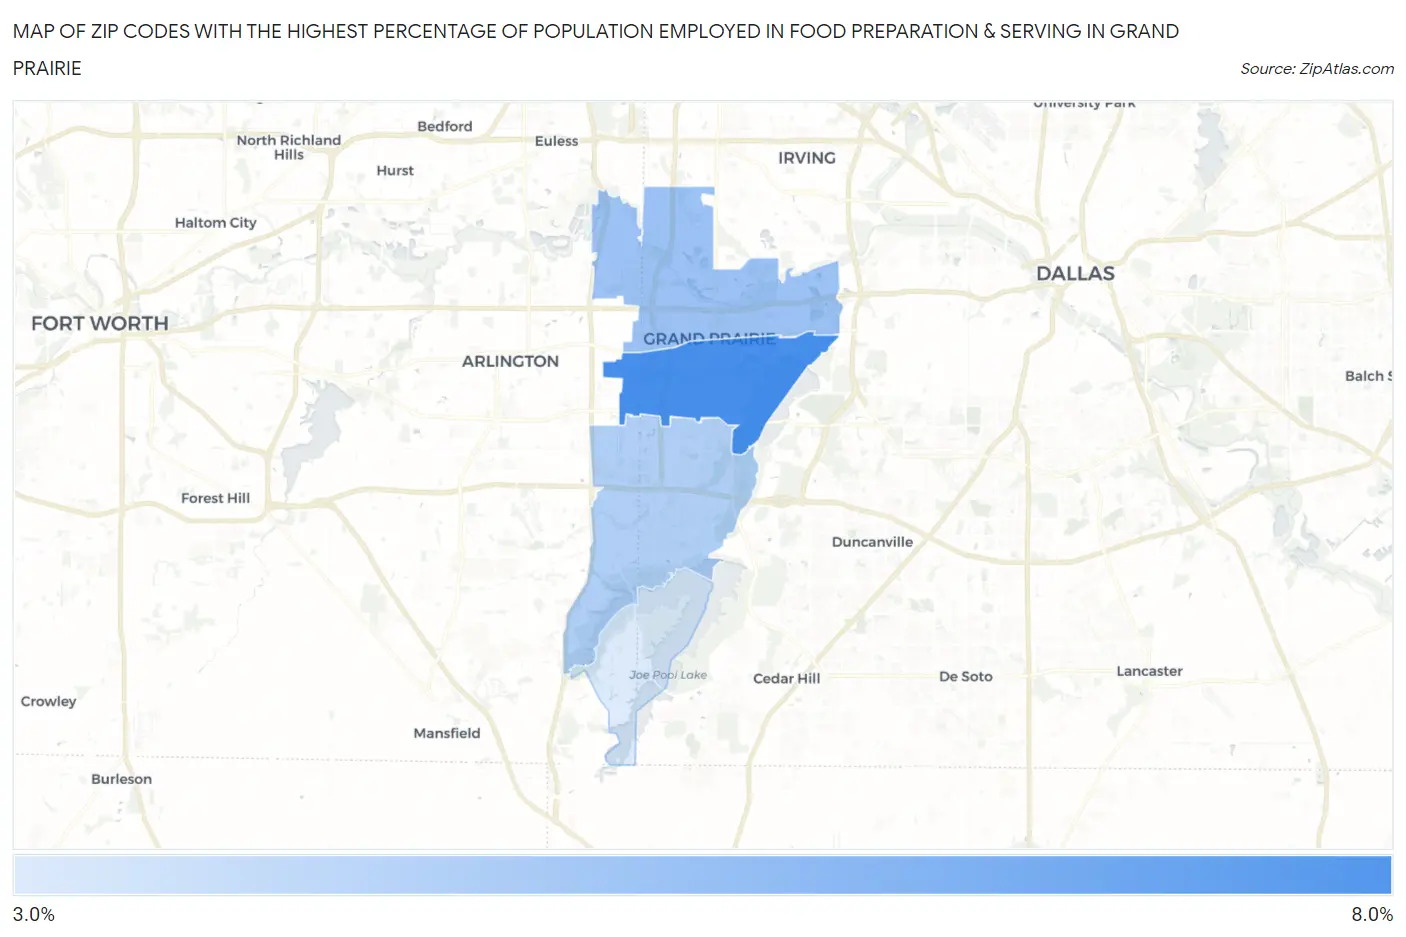
Map of Zip Codes with the Highest Percentage of Population Employed in Food Preparation & Serving in Grand Prairie
0.0%
8.0%
Zip Codes with the Highest Percentage of Population Employed in Food Preparation & Serving in Grand Prairie, TX
| Zip Code | % Employed | vs State | vs National | |
| 1. | 75051 | 6.6% | 5.4%(+1.25)#469 | 5.3%(+1.32)#7,586 |
| 2. | 75050 | 5.1% | 5.4%(-0.280)#790 | 5.3%(-0.215)#12,648 |
| 3. | 75052 | 4.7% | 5.4%(-0.666)#884 | 5.3%(-0.601)#14,217 |
| 4. | 75054 | 3.9% | 5.4%(-1.45)#1,065 | 5.3%(-1.38)#17,512 |
1
Common Questions
What are the Top 3 Zip Codes with the Highest Percentage of Population Employed in Food Preparation & Serving in Grand Prairie, TX?
Top 3 Zip Codes with the Highest Percentage of Population Employed in Food Preparation & Serving in Grand Prairie, TX are:
What zip code has the Highest Percentage of Population Employed in Food Preparation & Serving in Grand Prairie, TX?
75051 has the Highest Percentage of Population Employed in Food Preparation & Serving in Grand Prairie, TX with 6.6%.
What is the Percentage of Population Employed in Food Preparation & Serving in Grand Prairie, TX?
Percentage of Population Employed in Food Preparation & Serving in Grand Prairie is 5.1%.
What is the Percentage of Population Employed in Food Preparation & Serving in Texas?
Percentage of Population Employed in Food Preparation & Serving in Texas is 5.4%.
What is the Percentage of Population Employed in Food Preparation & Serving in the United States?
Percentage of Population Employed in Food Preparation & Serving in the United States is 5.3%.