Zip Codes with the Highest Percentage of Population Employed in Food Preparation & Serving in Cleveland, TX
RELATED REPORTS & OPTIONS
Food Preparation & Serving
Cleveland
Compare Zip Codes
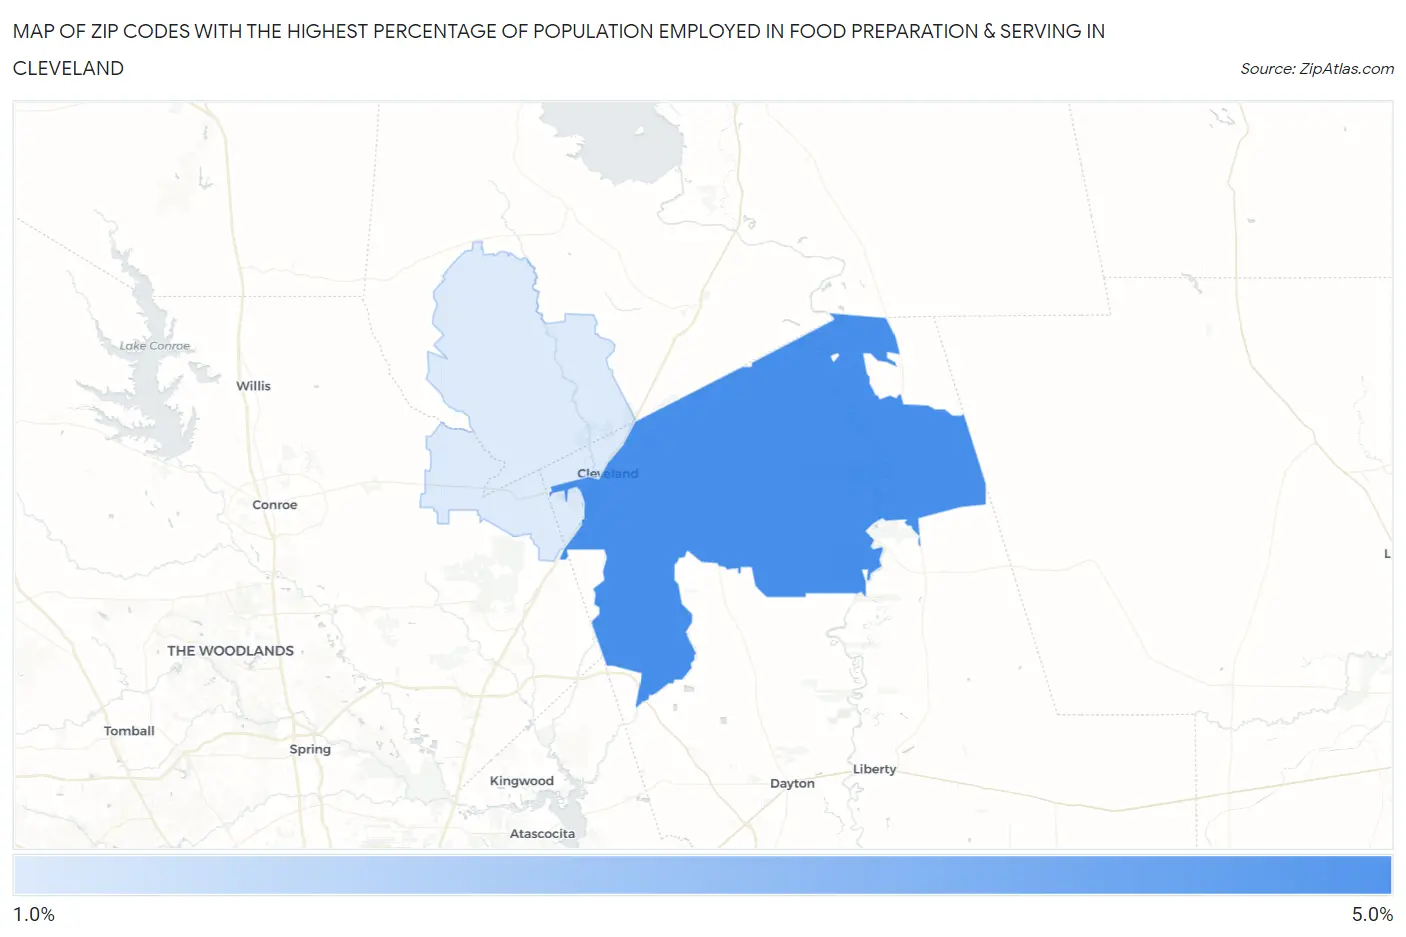
Map of Zip Codes with the Highest Percentage of Population Employed in Food Preparation & Serving in Cleveland
0.0%
5.0%
Zip Codes with the Highest Percentage of Population Employed in Food Preparation & Serving in Cleveland, TX
| Zip Code | % Employed | vs State | vs National | |
| 1. | 77327 | 4.6% | 5.4%(-0.781)#908 | 5.3%(-0.716)#14,746 |
| 2. | 77328 | 1.7% | 5.4%(-3.61)#1,478 | 5.3%(-3.55)#25,434 |
1
Common Questions
What are the Top Zip Codes with the Highest Percentage of Population Employed in Food Preparation & Serving in Cleveland, TX?
Top Zip Codes with the Highest Percentage of Population Employed in Food Preparation & Serving in Cleveland, TX are:
What zip code has the Highest Percentage of Population Employed in Food Preparation & Serving in Cleveland, TX?
77327 has the Highest Percentage of Population Employed in Food Preparation & Serving in Cleveland, TX with 4.6%.
What is the Percentage of Population Employed in Food Preparation & Serving in Cleveland, TX?
Percentage of Population Employed in Food Preparation & Serving in Cleveland is 4.6%.
What is the Percentage of Population Employed in Food Preparation & Serving in Texas?
Percentage of Population Employed in Food Preparation & Serving in Texas is 5.4%.
What is the Percentage of Population Employed in Food Preparation & Serving in the United States?
Percentage of Population Employed in Food Preparation & Serving in the United States is 5.3%.