Cities with the Highest Percentage of Population Employed in Educational Services in Kentucky
RELATED REPORTS & OPTIONS
Educational Services
Kentucky
Compare Cities
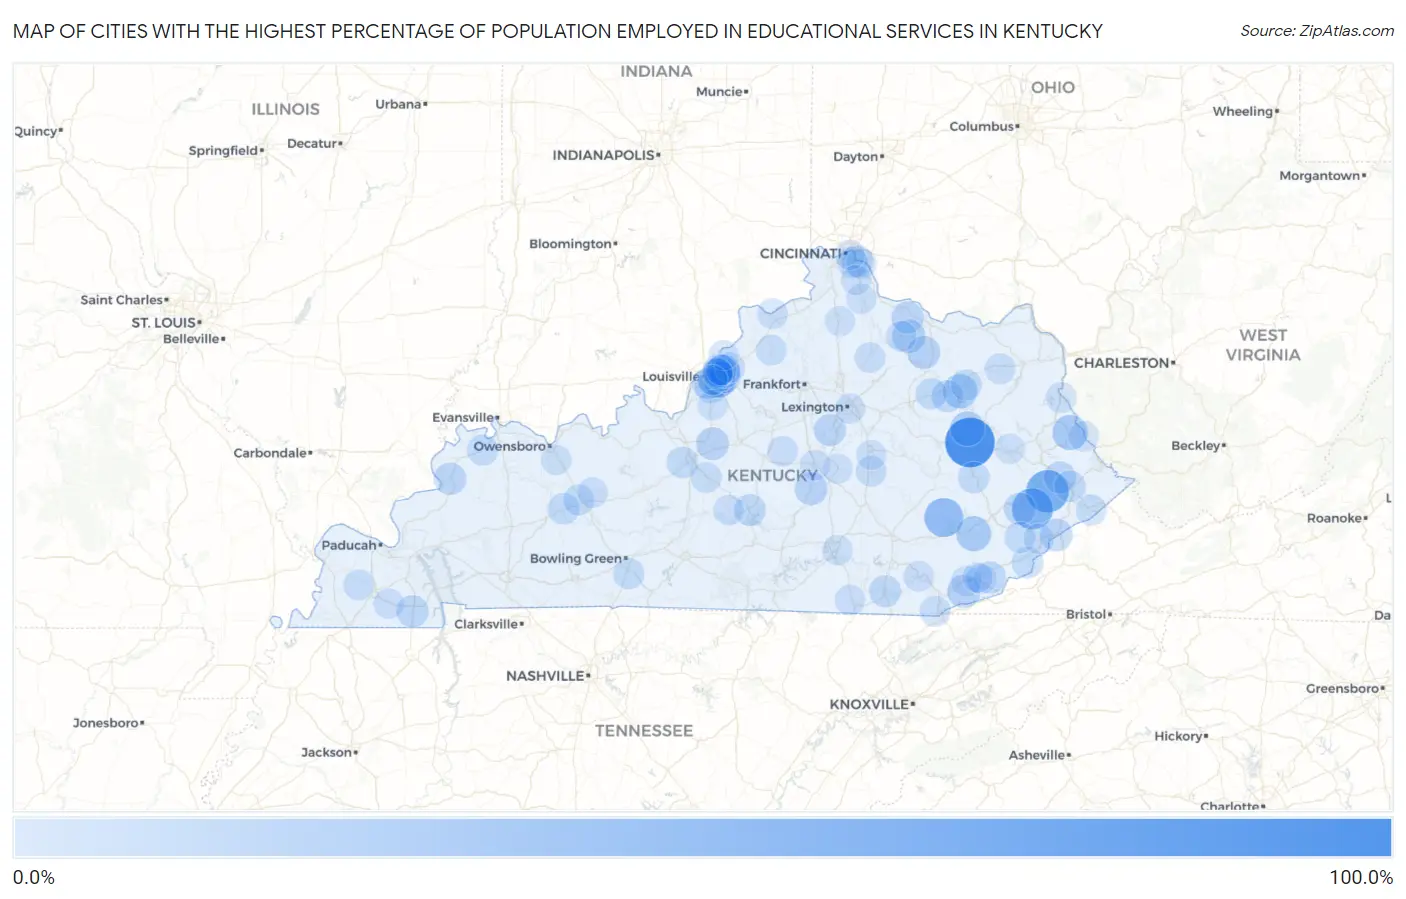
Map of Cities with the Highest Percentage of Population Employed in Educational Services in Kentucky
0.0%
100.0%
Cities with the Highest Percentage of Population Employed in Educational Services in Kentucky
| City | % Employed | vs State | vs National | |
| 1. | Hazel Green | 100.0% | 9.5%(+90.5)#1 | 9.3%(+90.7)#18 |
| 2. | Mcdowell | 67.7% | 9.5%(+58.2)#2 | 9.3%(+58.4)#77 |
| 3. | Pippa Passes | 61.3% | 9.5%(+51.7)#3 | 9.3%(+52.0)#105 |
| 4. | St. Joseph | 53.8% | 9.5%(+44.3)#4 | 9.3%(+44.5)#168 |
| 5. | Oneida | 51.3% | 9.5%(+41.7)#5 | 9.3%(+42.0)#192 |
| 6. | Inez | 35.3% | 9.5%(+25.8)#6 | 9.3%(+26.0)#549 |
| 7. | Hyden | 34.7% | 9.5%(+25.2)#7 | 9.3%(+25.4)#581 |
| 8. | Ezel | 32.9% | 9.5%(+23.4)#8 | 9.3%(+23.6)#665 |
| 9. | Lakeview Heights | 32.4% | 9.5%(+22.8)#9 | 9.3%(+23.0)#695 |
| 10. | Curdsville | 31.0% | 9.5%(+21.4)#10 | 9.3%(+21.6)#769 |
| 11. | Van Lear | 27.9% | 9.5%(+18.3)#11 | 9.3%(+18.6)#982 |
| 12. | Sardis | 27.3% | 9.5%(+17.7)#12 | 9.3%(+18.0)#1,037 |
| 13. | Meadowview Estates | 26.3% | 9.5%(+16.8)#13 | 9.3%(+17.0)#1,111 |
| 14. | Elizaville | 26.2% | 9.5%(+16.6)#14 | 9.3%(+16.9)#1,127 |
| 15. | Pathfork | 26.1% | 9.5%(+16.5)#15 | 9.3%(+16.8)#1,137 |
| 16. | Murray Hill | 25.6% | 9.5%(+16.0)#16 | 9.3%(+16.2)#1,195 |
| 17. | Boston | 25.5% | 9.5%(+15.9)#17 | 9.3%(+16.1)#1,205 |
| 18. | Hustonville | 24.4% | 9.5%(+14.9)#18 | 9.3%(+15.1)#1,313 |
| 19. | Payne Gap | 24.2% | 9.5%(+14.7)#19 | 9.3%(+14.9)#1,340 |
| 20. | Sturgis | 22.7% | 9.5%(+13.2)#20 | 9.3%(+13.4)#1,564 |
| 21. | Wilmore | 22.6% | 9.5%(+13.1)#21 | 9.3%(+13.3)#1,591 |
| 22. | Murray | 22.2% | 9.5%(+12.6)#22 | 9.3%(+12.9)#1,663 |
| 23. | Betsy Layne | 22.2% | 9.5%(+12.6)#23 | 9.3%(+12.9)#1,664 |
| 24. | Germantown | 22.1% | 9.5%(+12.6)#24 | 9.3%(+12.8)#1,670 |
| 25. | Lincolnshire | 22.0% | 9.5%(+12.5)#25 | 9.3%(+12.7)#1,692 |
| 26. | Pleasant Ridge | 22.0% | 9.5%(+12.4)#26 | 9.3%(+12.6)#1,698 |
| 27. | Hindman | 21.7% | 9.5%(+12.2)#27 | 9.3%(+12.4)#1,733 |
| 28. | Williamsburg | 21.4% | 9.5%(+11.8)#28 | 9.3%(+12.1)#1,801 |
| 29. | Ages | 21.2% | 9.5%(+11.7)#29 | 9.3%(+11.9)#1,824 |
| 30. | Salt Lick | 20.8% | 9.5%(+11.3)#30 | 9.3%(+11.5)#1,920 |
| 31. | Hills And Dales | 20.6% | 9.5%(+11.1)#31 | 9.3%(+11.3)#1,974 |
| 32. | Campbellsville | 20.6% | 9.5%(+11.0)#32 | 9.3%(+11.3)#1,978 |
| 33. | Cambridge | 19.8% | 9.5%(+10.3)#33 | 9.3%(+10.5)#2,173 |
| 34. | Lynch | 19.8% | 9.5%(+10.3)#34 | 9.3%(+10.5)#2,174 |
| 35. | Cecilia | 19.7% | 9.5%(+10.2)#35 | 9.3%(+10.4)#2,195 |
| 36. | Poplar Hills | 19.6% | 9.5%(+10.0)#36 | 9.3%(+10.3)#2,240 |
| 37. | Silver Grove | 19.5% | 9.5%(+9.98)#37 | 9.3%(+10.2)#2,252 |
| 38. | Jackson | 19.3% | 9.5%(+9.75)#38 | 9.3%(+9.97)#2,314 |
| 39. | Philpot | 19.2% | 9.5%(+9.63)#39 | 9.3%(+9.86)#2,343 |
| 40. | Pikeville | 19.1% | 9.5%(+9.61)#40 | 9.3%(+9.83)#2,351 |
| 41. | Rockport | 19.0% | 9.5%(+9.51)#41 | 9.3%(+9.73)#2,372 |
| 42. | Owingsville | 18.9% | 9.5%(+9.31)#42 | 9.3%(+9.53)#2,430 |
| 43. | Yelvington | 18.7% | 9.5%(+9.18)#43 | 9.3%(+9.40)#2,481 |
| 44. | Wildwood | 18.4% | 9.5%(+8.88)#44 | 9.3%(+9.11)#2,588 |
| 45. | Blackey | 18.2% | 9.5%(+8.64)#45 | 9.3%(+8.87)#2,692 |
| 46. | Plano | 17.7% | 9.5%(+8.17)#46 | 9.3%(+8.39)#2,861 |
| 47. | Corydon | 17.7% | 9.5%(+8.12)#47 | 9.3%(+8.35)#2,872 |
| 48. | Morehead | 17.6% | 9.5%(+8.02)#48 | 9.3%(+8.25)#2,921 |
| 49. | Broeck Pointe | 17.6% | 9.5%(+8.02)#49 | 9.3%(+8.24)#2,922 |
| 50. | Beaver Dam | 17.3% | 9.5%(+7.80)#50 | 9.3%(+8.03)#3,009 |
| 51. | Hodgenville | 17.2% | 9.5%(+7.65)#51 | 9.3%(+7.87)#3,079 |
| 52. | Olive Hill | 17.0% | 9.5%(+7.42)#52 | 9.3%(+7.64)#3,189 |
| 53. | Bancroft | 16.9% | 9.5%(+7.36)#53 | 9.3%(+7.59)#3,218 |
| 54. | Middlesborough | 16.8% | 9.5%(+7.23)#54 | 9.3%(+7.46)#3,276 |
| 55. | Wellington | 16.7% | 9.5%(+7.13)#55 | 9.3%(+7.35)#3,326 |
| 56. | Elkhorn City | 16.6% | 9.5%(+7.02)#56 | 9.3%(+7.25)#3,421 |
| 57. | Highland Heights | 16.4% | 9.5%(+6.82)#57 | 9.3%(+7.05)#3,503 |
| 58. | Audubon Park | 16.3% | 9.5%(+6.81)#58 | 9.3%(+7.03)#3,510 |
| 59. | Mount Olivet | 16.3% | 9.5%(+6.79)#59 | 9.3%(+7.01)#3,524 |
| 60. | New Castle | 16.3% | 9.5%(+6.77)#60 | 9.3%(+7.00)#3,528 |
| 61. | Fancy Farm | 16.2% | 9.5%(+6.70)#61 | 9.3%(+6.92)#3,578 |
| 62. | Berea | 16.2% | 9.5%(+6.69)#62 | 9.3%(+6.91)#3,583 |
| 63. | Cynthiana | 16.2% | 9.5%(+6.61)#63 | 9.3%(+6.84)#3,630 |
| 64. | Sorgho | 16.1% | 9.5%(+6.56)#64 | 9.3%(+6.79)#3,660 |
| 65. | Meadowbrook Farm | 16.0% | 9.5%(+6.46)#65 | 9.3%(+6.68)#3,719 |
| 66. | Louisa | 15.7% | 9.5%(+6.18)#66 | 9.3%(+6.41)#3,866 |
| 67. | Carrollton | 15.7% | 9.5%(+6.14)#67 | 9.3%(+6.37)#3,891 |
| 68. | Mackville | 15.7% | 9.5%(+6.11)#68 | 9.3%(+6.34)#3,909 |
| 69. | Coldiron | 15.4% | 9.5%(+5.89)#69 | 9.3%(+6.11)#4,048 |
| 70. | Barbourville | 15.4% | 9.5%(+5.89)#70 | 9.3%(+6.11)#4,049 |
| 71. | Warfield | 15.4% | 9.5%(+5.84)#71 | 9.3%(+6.07)#4,074 |
| 72. | Danville | 15.4% | 9.5%(+5.83)#72 | 9.3%(+6.05)#4,093 |
| 73. | Harlan | 15.4% | 9.5%(+5.82)#73 | 9.3%(+6.05)#4,097 |
| 74. | Norwood | 15.2% | 9.5%(+5.69)#74 | 9.3%(+5.91)#4,169 |
| 75. | Rosine | 15.1% | 9.5%(+5.55)#75 | 9.3%(+5.78)#4,243 |
| 76. | Summersville | 15.1% | 9.5%(+5.53)#76 | 9.3%(+5.75)#4,256 |
| 77. | Whitesburg | 15.1% | 9.5%(+5.51)#77 | 9.3%(+5.74)#4,263 |
| 78. | Melbourne | 14.9% | 9.5%(+5.38)#78 | 9.3%(+5.60)#4,365 |
| 79. | Stearns | 14.9% | 9.5%(+5.36)#79 | 9.3%(+5.59)#4,372 |
| 80. | Thornhill | 14.9% | 9.5%(+5.35)#80 | 9.3%(+5.58)#4,385 |
| 81. | Farmington | 14.9% | 9.5%(+5.35)#81 | 9.3%(+5.58)#4,386 |
| 82. | Spring Valley | 14.7% | 9.5%(+5.14)#82 | 9.3%(+5.37)#4,527 |
| 83. | Masonville | 14.4% | 9.5%(+4.91)#83 | 9.3%(+5.13)#4,719 |
| 84. | Barbourmeade | 14.4% | 9.5%(+4.91)#84 | 9.3%(+5.13)#4,720 |
| 85. | Coldstream | 14.4% | 9.5%(+4.86)#85 | 9.3%(+5.08)#4,753 |
| 86. | Lexington | 14.4% | 9.5%(+4.81)#86 | 9.3%(+5.04)#4,789 |
| 87. | Loyall | 14.2% | 9.5%(+4.66)#87 | 9.3%(+4.89)#4,932 |
| 88. | Ferguson | 14.1% | 9.5%(+4.59)#88 | 9.3%(+4.82)#4,989 |
| 89. | Williamstown | 14.1% | 9.5%(+4.53)#89 | 9.3%(+4.76)#5,036 |
| 90. | Goshen | 14.0% | 9.5%(+4.51)#90 | 9.3%(+4.73)#5,061 |
| 91. | Lancaster | 14.0% | 9.5%(+4.50)#91 | 9.3%(+4.73)#5,069 |
| 92. | Salyersville | 14.0% | 9.5%(+4.49)#92 | 9.3%(+4.72)#5,074 |
| 93. | Windy Hills | 14.0% | 9.5%(+4.48)#93 | 9.3%(+4.71)#5,090 |
| 94. | Butler | 13.9% | 9.5%(+4.38)#94 | 9.3%(+4.60)#5,184 |
| 95. | Northfield | 13.8% | 9.5%(+4.29)#95 | 9.3%(+4.51)#5,258 |
| 96. | Woodlawn | 13.8% | 9.5%(+4.22)#96 | 9.3%(+4.45)#5,310 |
| 97. | Pioneer Village | 13.7% | 9.5%(+4.20)#97 | 9.3%(+4.42)#5,330 |
| 98. | Claryville | 13.7% | 9.5%(+4.12)#98 | 9.3%(+4.35)#5,382 |
| 99. | Seneca Gardens | 13.6% | 9.5%(+4.05)#99 | 9.3%(+4.27)#5,457 |
| 100. | Richmond | 13.6% | 9.5%(+4.05)#100 | 9.3%(+4.27)#5,458 |
Common Questions
What are the Top 10 Cities with the Highest Percentage of Population Employed in Educational Services in Kentucky?
Top 10 Cities with the Highest Percentage of Population Employed in Educational Services in Kentucky are:
#1
100.0%
#2
67.7%
#3
61.3%
#4
51.3%
#5
35.3%
#6
34.7%
#7
32.9%
#8
32.4%
#9
27.3%
#10
26.3%
What city has the Highest Percentage of Population Employed in Educational Services in Kentucky?
Hazel Green has the Highest Percentage of Population Employed in Educational Services in Kentucky with 100.0%.
What is the Percentage of Population Employed in Educational Services in the State of Kentucky?
Percentage of Population Employed in Educational Services in Kentucky is 9.5%.
What is the Percentage of Population Employed in Educational Services in the United States?
Percentage of Population Employed in Educational Services in the United States is 9.3%.