Cities with the Highest Poverty Level Among Married Couples in South Dakota
RELATED REPORTS & OPTIONS
Highest Poverty | Married Couple
South Dakota
Compare Cities
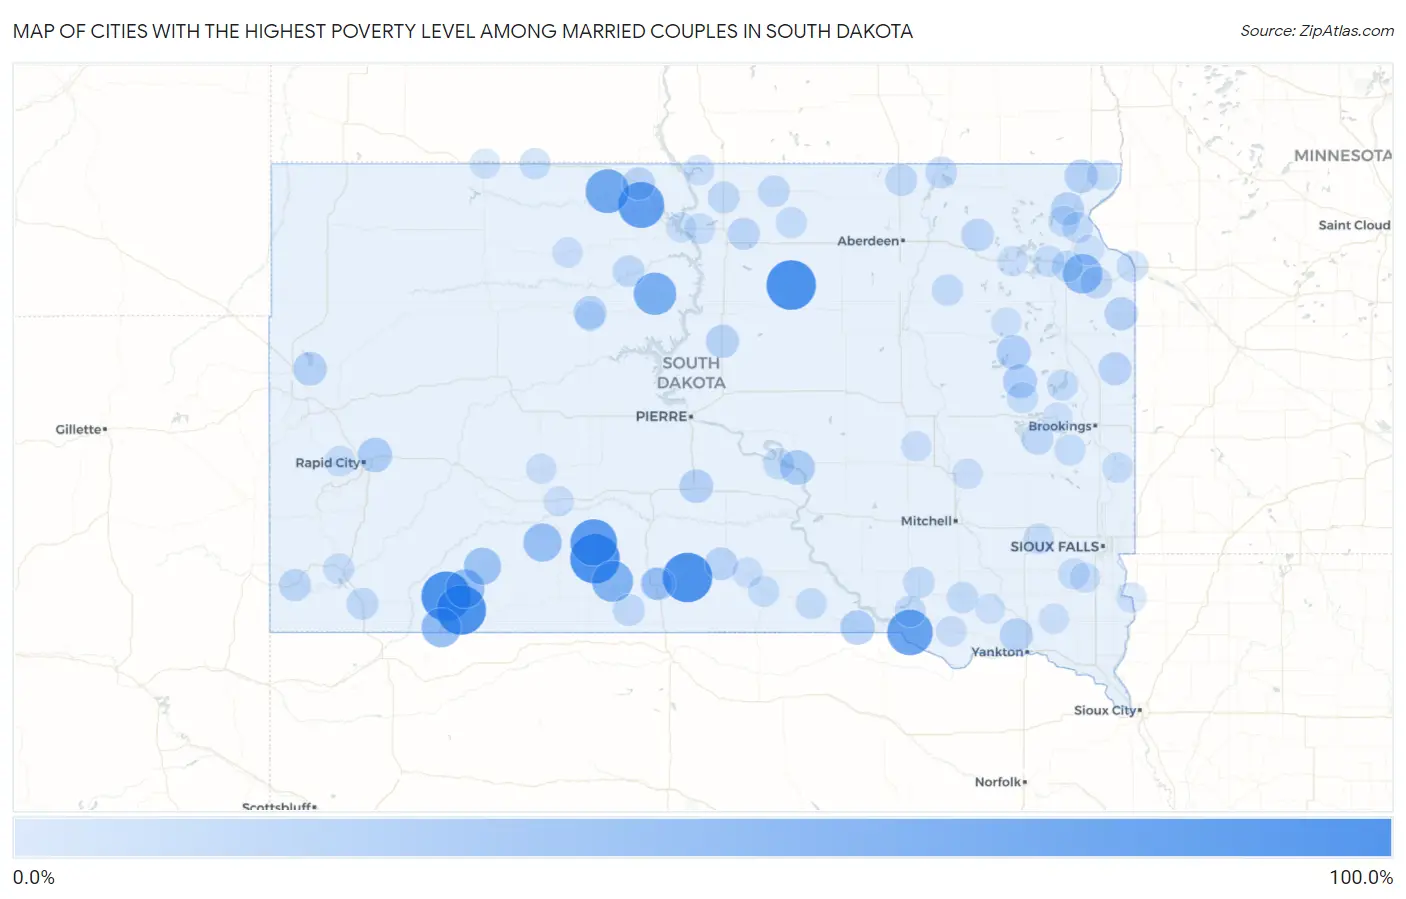
Map of Cities with the Highest Poverty Level Among Married Couples in South Dakota
0.0%
100.0%
Cities with the Highest Poverty Level Among Married Couples in South Dakota
| City | Married Couples Poverty | vs State | vs National | |
| 1. | Manderson White Horse Creek | 100.0% | 3.4%(+96.6)#1 | 4.5%(+95.5)#6 |
| 2. | Wounded Knee | 100.0% | 3.4%(+96.6)#2 | 4.5%(+95.5)#14 |
| 3. | Swift Bird | 100.0% | 3.4%(+96.6)#3 | 4.5%(+95.5)#32 |
| 4. | Norris | 100.0% | 3.4%(+96.6)#4 | 4.5%(+95.5)#40 |
| 5. | Okreek | 100.0% | 3.4%(+96.6)#5 | 4.5%(+95.5)#53 |
| 6. | Peever Flats | 100.0% | 3.4%(+96.6)#6 | 4.5%(+95.5)#56 |
| 7. | Mayfield Colony | 100.0% | 3.4%(+96.6)#7 | 4.5%(+95.5)#82 |
| 8. | Onaka | 100.0% | 3.4%(+96.6)#8 | 4.5%(+95.5)#97 |
| 9. | Corn Creek | 85.7% | 3.4%(+82.4)#9 | 4.5%(+81.3)#114 |
| 10. | Clark Colony | 84.6% | 3.4%(+81.3)#10 | 4.5%(+80.2)#116 |
| 11. | Little Eagle | 82.6% | 3.4%(+79.2)#11 | 4.5%(+78.1)#121 |
| 12. | Marty | 80.0% | 3.4%(+76.6)#12 | 4.5%(+75.5)#129 |
| 13. | Wakpala | 77.8% | 3.4%(+74.4)#13 | 4.5%(+73.3)#140 |
| 14. | Bullhead | 71.4% | 3.4%(+68.1)#14 | 4.5%(+67.0)#163 |
| 15. | Cherry Creek | 66.7% | 3.4%(+63.3)#15 | 4.5%(+62.2)#185 |
| 16. | La Plant | 65.0% | 3.4%(+61.6)#16 | 4.5%(+60.5)#206 |
| 17. | Parmelee | 58.8% | 3.4%(+55.5)#17 | 4.5%(+54.4)#281 |
| 18. | Horse Creek | 54.5% | 3.4%(+51.2)#18 | 4.5%(+50.1)#328 |
| 19. | Marvin | 50.0% | 3.4%(+46.6)#19 | 4.5%(+45.5)#402 |
| 20. | Pine Ridge | 49.4% | 3.4%(+46.1)#20 | 4.5%(+45.0)#406 |
| 21. | Porcupine | 47.3% | 3.4%(+43.9)#21 | 4.5%(+42.8)#438 |
| 22. | Wanblee | 44.0% | 3.4%(+40.6)#22 | 4.5%(+39.5)#512 |
| 23. | Kyle | 38.6% | 3.4%(+35.3)#23 | 4.5%(+34.2)#679 |
| 24. | Fort Thompson | 28.1% | 3.4%(+24.7)#24 | 4.5%(+23.6)#1,161 |
| 25. | Ashland Heights | 26.3% | 3.4%(+22.9)#25 | 4.5%(+21.8)#1,311 |
| 26. | Fairfax | 25.9% | 3.4%(+22.6)#26 | 4.5%(+21.5)#1,342 |
| 27. | Naples | 25.0% | 3.4%(+21.6)#27 | 4.5%(+20.5)#1,449 |
| 28. | Bryant | 24.2% | 3.4%(+20.8)#28 | 4.5%(+19.7)#1,532 |
| 29. | Glendale Colony | 23.5% | 3.4%(+20.2)#29 | 4.5%(+19.1)#1,603 |
| 30. | Fruitdale | 22.2% | 3.4%(+18.9)#30 | 4.5%(+17.8)#1,758 |
| 31. | Vivian | 22.2% | 3.4%(+18.9)#31 | 4.5%(+17.8)#1,768 |
| 32. | New Effington | 21.2% | 3.4%(+17.8)#32 | 4.5%(+16.8)#1,887 |
| 33. | Antelope | 20.8% | 3.4%(+17.5)#33 | 4.5%(+16.4)#1,921 |
| 34. | Revillo | 20.0% | 3.4%(+16.6)#34 | 4.5%(+15.5)#2,063 |
| 35. | Agar | 20.0% | 3.4%(+16.6)#35 | 4.5%(+15.5)#2,069 |
| 36. | Utica | 20.0% | 3.4%(+16.6)#36 | 4.5%(+15.5)#2,075 |
| 37. | Sisseton | 19.8% | 3.4%(+16.4)#37 | 4.5%(+15.3)#2,101 |
| 38. | North Eagle Butte | 19.4% | 3.4%(+16.1)#38 | 4.5%(+15.0)#2,149 |
| 39. | Brandt | 19.0% | 3.4%(+15.7)#39 | 4.5%(+14.6)#2,207 |
| 40. | New Witten | 18.2% | 3.4%(+14.8)#40 | 4.5%(+13.7)#2,376 |
| 41. | Mclaughlin | 18.1% | 3.4%(+14.7)#41 | 4.5%(+13.6)#2,397 |
| 42. | Pierpont | 17.2% | 3.4%(+13.9)#42 | 4.5%(+12.8)#2,567 |
| 43. | West Brule | 16.7% | 3.4%(+13.3)#43 | 4.5%(+12.2)#2,674 |
| 44. | Edgemont | 15.7% | 3.4%(+12.3)#44 | 4.5%(+11.2)#2,928 |
| 45. | Java | 15.2% | 3.4%(+11.9)#45 | 4.5%(+10.8)#3,039 |
| 46. | Mission | 14.8% | 3.4%(+11.5)#46 | 4.5%(+10.4)#3,128 |
| 47. | St Francis | 14.3% | 3.4%(+10.9)#47 | 4.5%(+9.82)#3,285 |
| 48. | Frederick | 14.3% | 3.4%(+10.9)#48 | 4.5%(+9.82)#3,303 |
| 49. | Kenel | 14.3% | 3.4%(+10.9)#49 | 4.5%(+9.82)#3,307 |
| 50. | Whitehorse | 14.3% | 3.4%(+10.9)#50 | 4.5%(+9.82)#3,312 |
| 51. | Oldham | 14.3% | 3.4%(+10.9)#51 | 4.5%(+9.82)#3,317 |
| 52. | Twin Brooks | 14.3% | 3.4%(+10.9)#52 | 4.5%(+9.82)#3,335 |
| 53. | Oelrichs | 13.9% | 3.4%(+10.5)#53 | 4.5%(+9.43)#3,426 |
| 54. | Mound City | 13.6% | 3.4%(+10.3)#54 | 4.5%(+9.17)#3,514 |
| 55. | Hecla | 13.4% | 3.4%(+10.1)#55 | 4.5%(+8.97)#3,587 |
| 56. | Eureka | 13.2% | 3.4%(+9.81)#56 | 4.5%(+8.72)#3,669 |
| 57. | Armour | 12.5% | 3.4%(+9.14)#57 | 4.5%(+8.04)#3,924 |
| 58. | Ravinia | 12.5% | 3.4%(+9.14)#58 | 4.5%(+8.04)#3,971 |
| 59. | Oahe Acres | 12.1% | 3.4%(+8.76)#59 | 4.5%(+7.66)#4,116 |
| 60. | Summit | 11.9% | 3.4%(+8.50)#60 | 4.5%(+7.40)#4,235 |
| 61. | Lower Brule | 11.8% | 3.4%(+8.40)#61 | 4.5%(+7.30)#4,277 |
| 62. | Conde | 11.8% | 3.4%(+8.40)#62 | 4.5%(+7.30)#4,296 |
| 63. | Tripp | 11.6% | 3.4%(+8.22)#63 | 4.5%(+7.12)#4,373 |
| 64. | Morristown | 11.1% | 3.4%(+7.75)#64 | 4.5%(+6.65)#4,614 |
| 65. | Ortley | 11.1% | 3.4%(+7.75)#65 | 4.5%(+6.65)#4,619 |
| 66. | Erwin | 11.1% | 3.4%(+7.75)#66 | 4.5%(+6.65)#4,620 |
| 67. | Big Stone City | 10.9% | 3.4%(+7.58)#67 | 4.5%(+6.48)#4,681 |
| 68. | Agency Village | 10.9% | 3.4%(+7.55)#68 | 4.5%(+6.45)#4,704 |
| 69. | Hosmer | 10.4% | 3.4%(+7.08)#69 | 4.5%(+5.99)#4,976 |
| 70. | Burke | 10.3% | 3.4%(+6.92)#70 | 4.5%(+5.82)#5,077 |
| 71. | Colome | 10.3% | 3.4%(+6.89)#71 | 4.5%(+5.79)#5,094 |
| 72. | Chancellor | 10.2% | 3.4%(+6.81)#72 | 4.5%(+5.71)#5,145 |
| 73. | Lake Poinsett | 10.1% | 3.4%(+6.71)#73 | 4.5%(+5.62)#5,190 |
| 74. | Peever | 10.0% | 3.4%(+6.64)#74 | 4.5%(+5.54)#5,266 |
| 75. | Nunda | 10.0% | 3.4%(+6.64)#75 | 4.5%(+5.54)#5,285 |
| 76. | Hot Springs | 9.9% | 3.4%(+6.50)#76 | 4.5%(+5.40)#5,346 |
| 77. | Canistota | 9.8% | 3.4%(+6.46)#77 | 4.5%(+5.36)#5,377 |
| 78. | Johnson Siding | 9.2% | 3.4%(+5.82)#78 | 4.5%(+4.72)#5,812 |
| 79. | Flandreau | 8.6% | 3.4%(+5.23)#79 | 4.5%(+4.13)#6,267 |
| 80. | Pollock | 8.6% | 3.4%(+5.21)#80 | 4.5%(+4.11)#6,276 |
| 81. | Glenham | 8.6% | 3.4%(+5.21)#81 | 4.5%(+4.11)#6,283 |
| 82. | Avon | 8.1% | 3.4%(+4.74)#82 | 4.5%(+3.65)#6,660 |
| 83. | Artesian | 7.7% | 3.4%(+4.33)#83 | 4.5%(+3.23)#7,063 |
| 84. | Philip | 7.6% | 3.4%(+4.25)#84 | 4.5%(+3.15)#7,118 |
| 85. | Webster | 7.5% | 3.4%(+4.15)#85 | 4.5%(+3.05)#7,208 |
| 86. | Rosholt | 7.5% | 3.4%(+4.14)#86 | 4.5%(+3.04)#7,217 |
| 87. | Lennox | 7.4% | 3.4%(+4.08)#87 | 4.5%(+2.98)#7,270 |
| 88. | Isabel | 7.4% | 3.4%(+4.04)#88 | 4.5%(+2.95)#7,322 |
| 89. | Alpena | 7.3% | 3.4%(+3.98)#89 | 4.5%(+2.88)#7,391 |
| 90. | Kadoka | 7.3% | 3.4%(+3.95)#90 | 4.5%(+2.86)#7,416 |
| 91. | Winner | 7.1% | 3.4%(+3.75)#91 | 4.5%(+2.65)#7,641 |
| 92. | Mobridge | 6.7% | 3.4%(+3.31)#92 | 4.5%(+2.22)#8,110 |
| 93. | Irene | 6.7% | 3.4%(+3.30)#93 | 4.5%(+2.20)#8,131 |
| 94. | Fairview | 6.7% | 3.4%(+3.30)#94 | 4.5%(+2.20)#8,159 |
| 95. | Lemmon | 6.5% | 3.4%(+3.16)#95 | 4.5%(+2.06)#8,293 |
| 96. | Wilmot | 6.4% | 3.4%(+3.05)#96 | 4.5%(+1.95)#8,438 |
| 97. | Garden City | 6.2% | 3.4%(+2.89)#97 | 4.5%(+1.79)#8,671 |
| 98. | Arlington | 6.0% | 3.4%(+2.68)#98 | 4.5%(+1.58)#8,923 |
| 99. | Scotland | 6.0% | 3.4%(+2.60)#99 | 4.5%(+1.50)#9,010 |
| 100. | Eagle Butte | 6.0% | 3.4%(+2.59)#100 | 4.5%(+1.49)#9,019 |
Common Questions
What are the Top 10 Cities with the Highest Poverty Level Among Married Couples in South Dakota?
Top 10 Cities with the Highest Poverty Level Among Married Couples in South Dakota are:
#1
100.0%
#2
100.0%
#3
100.0%
#4
100.0%
#5
100.0%
#6
85.7%
#7
82.6%
#8
80.0%
#9
71.4%
#10
65.0%
What city has the Highest Poverty Level Among Married Couples in South Dakota?
Manderson White Horse Creek has the Highest Poverty Level Among Married Couples in South Dakota with 100.0%.
What is the Poverty Level Among Married Couples in the State of South Dakota?
Poverty Level Among Married Couples in South Dakota is 3.4%.
What is the Poverty Level Among Married Couples in the United States?
Poverty Level Among Married Couples in the United States is 4.5%.