Mount Morris, PA
Mount Morris Map
Mount Morris Overview
688
TOTAL POPULATION
344
MALE POPULATION
344
FEMALE POPULATION
100.00
MALES / 100 FEMALES
100.00
FEMALES / 100 MALES
46.5
MEDIAN AGE
3.0
AVG FAMILY SIZE
2.2
AVG HOUSEHOLD SIZE
$33,342
PER CAPITA INCOME
$69,231
AVG FAMILY INCOME
$65,000
AVG HOUSEHOLD INCOME
12.4%
WAGE / INCOME GAP [ % ]
87.6¢/ $1
WAGE / INCOME GAP [ $ ]
0.39
INEQUALITY / GINI INDEX
306
LABOR FORCE [ PEOPLE ]
51.8%
PERCENT IN LABOR FORCE
2.0%
UNEMPLOYMENT RATE
Mount Morris Zip Codes
Mount Morris Area Codes
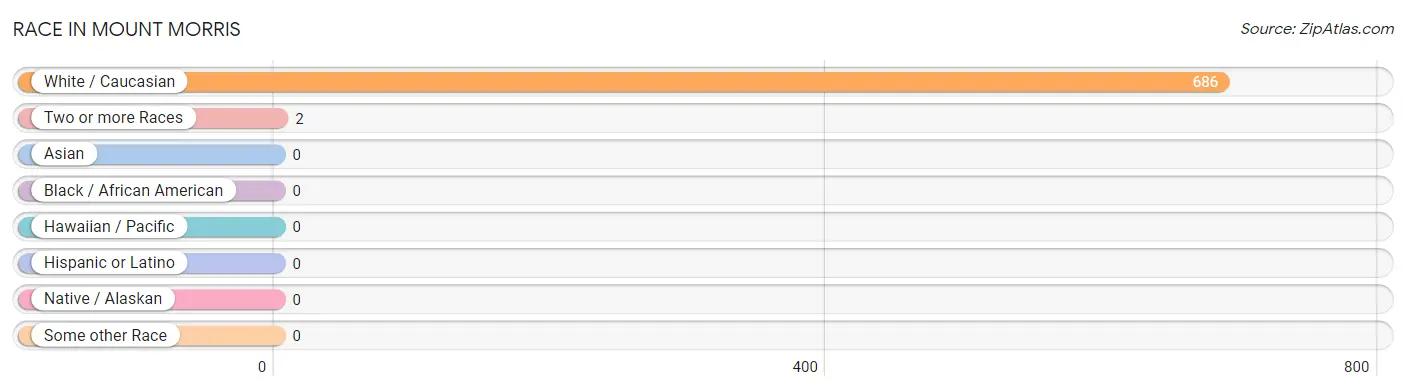
Race in Mount Morris
The most populous races in Mount Morris are White / Caucasian (686 | 99.7%), and Two or more Races (2 | 0.3%).
| Race | # Population | % Population |
| Asian | 0 | 0.0% |
| Black / African American | 0 | 0.0% |
| Hawaiian / Pacific | 0 | 0.0% |
| Hispanic or Latino | 0 | 0.0% |
| Native / Alaskan | 0 | 0.0% |
| White / Caucasian | 686 | 99.7% |
| Two or more Races | 2 | 0.3% |
| Some other Race | 0 | 0.0% |
| Total | 688 | 100.0% |
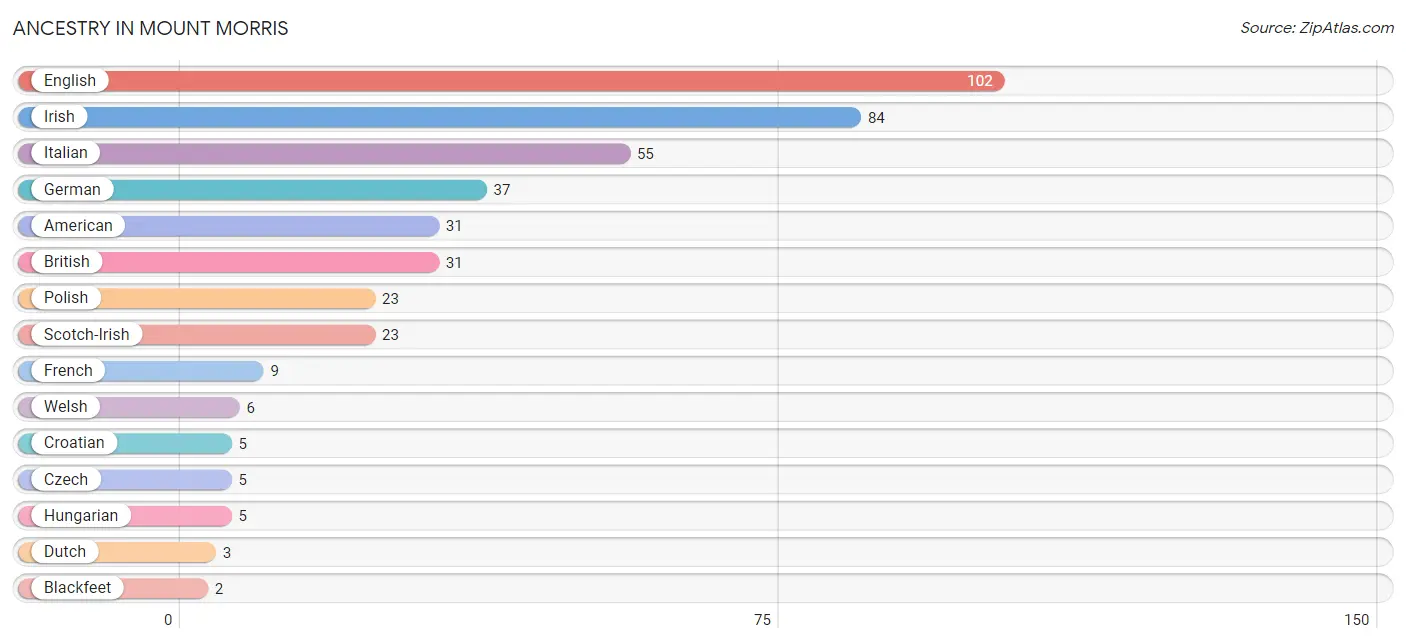
Ancestry in Mount Morris
The most populous ancestries reported in Mount Morris are English (102 | 14.8%), Irish (84 | 12.2%), Italian (55 | 8.0%), German (37 | 5.4%), and American (31 | 4.5%), together accounting for 44.9% of all Mount Morris residents.
| Ancestry | # Population | % Population |
| American | 31 | 4.5% |
| Blackfeet | 2 | 0.3% |
| British | 31 | 4.5% |
| Cherokee | 2 | 0.3% |
| Croatian | 5 | 0.7% |
| Czech | 5 | 0.7% |
| Czechoslovakian | 2 | 0.3% |
| Dutch | 3 | 0.4% |
| English | 102 | 14.8% |
| French | 9 | 1.3% |
| German | 37 | 5.4% |
| Hungarian | 5 | 0.7% |
| Irish | 84 | 12.2% |
| Italian | 55 | 8.0% |
| Polish | 23 | 3.3% |
| Scotch-Irish | 23 | 3.3% |
| Welsh | 6 | 0.9% | View All 17 Rows |
Immigrants in Mount Morris

| Immigration Origin | # Population | % Population | View All 0 Rows |
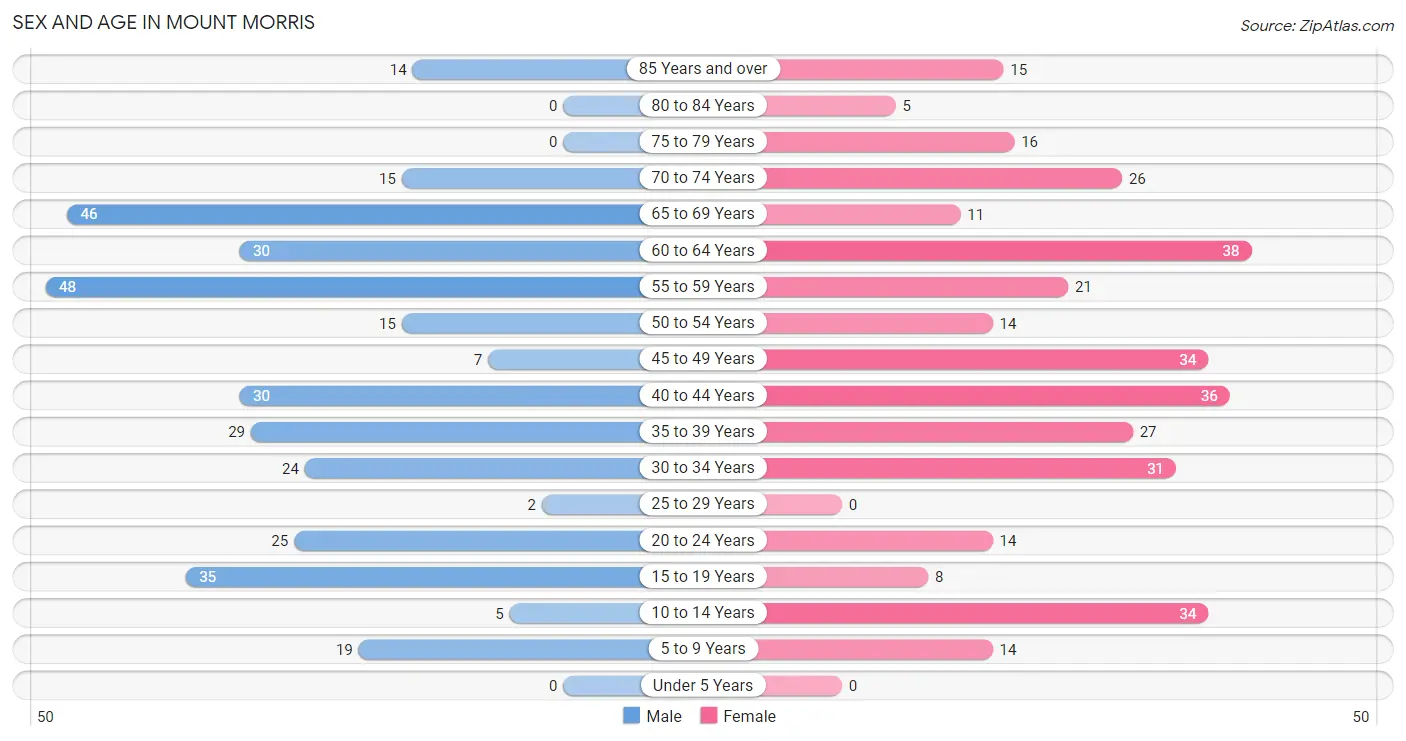
Sex and Age in Mount Morris
Sex and Age in Mount Morris
The most populous age groups in Mount Morris are 55 to 59 Years (48 | 14.0%) for men and 60 to 64 Years (38 | 11.1%) for women.
| Age Bracket | Male | Female |
| Under 5 Years | 0 (0.0%) | 0 (0.0%) |
| 5 to 9 Years | 19 (5.5%) | 14 (4.1%) |
| 10 to 14 Years | 5 (1.5%) | 34 (9.9%) |
| 15 to 19 Years | 35 (10.2%) | 8 (2.3%) |
| 20 to 24 Years | 25 (7.3%) | 14 (4.1%) |
| 25 to 29 Years | 2 (0.6%) | 0 (0.0%) |
| 30 to 34 Years | 24 (7.0%) | 31 (9.0%) |
| 35 to 39 Years | 29 (8.4%) | 27 (7.9%) |
| 40 to 44 Years | 30 (8.7%) | 36 (10.5%) |
| 45 to 49 Years | 7 (2.0%) | 34 (9.9%) |
| 50 to 54 Years | 15 (4.4%) | 14 (4.1%) |
| 55 to 59 Years | 48 (14.0%) | 21 (6.1%) |
| 60 to 64 Years | 30 (8.7%) | 38 (11.1%) |
| 65 to 69 Years | 46 (13.4%) | 11 (3.2%) |
| 70 to 74 Years | 15 (4.4%) | 26 (7.6%) |
| 75 to 79 Years | 0 (0.0%) | 16 (4.6%) |
| 80 to 84 Years | 0 (0.0%) | 5 (1.5%) |
| 85 Years and over | 14 (4.1%) | 15 (4.4%) |
| Total | 344 (100.0%) | 344 (100.0%) |
Families and Households in Mount Morris
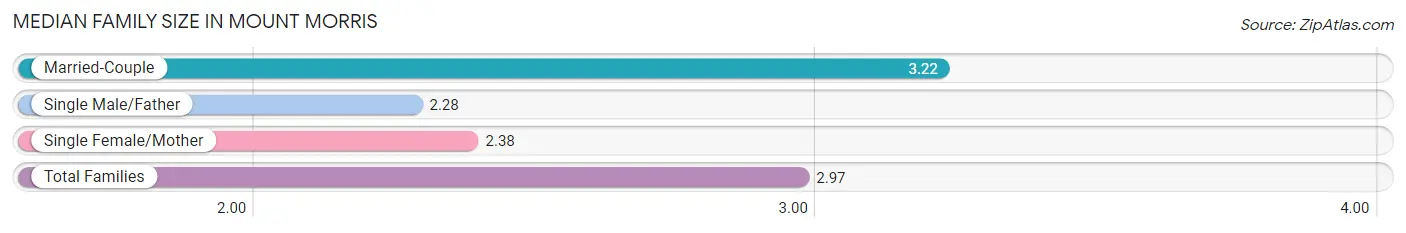
Median Family Size in Mount Morris
The median family size in Mount Morris is 2.97 persons per family, with married-couple families (127 | 72.2%) accounting for the largest median family size of 3.22 persons per family. On the other hand, single male/father families (25 | 14.2%) represent the smallest median family size with 2.28 persons per family.
| Family Type | # Families | Family Size |
| Married-Couple | 127 (72.2%) | 3.22 |
| Single Male/Father | 25 (14.2%) | 2.28 |
| Single Female/Mother | 24 (13.6%) | 2.38 |
| Total Families | 176 (100.0%) | 2.97 |
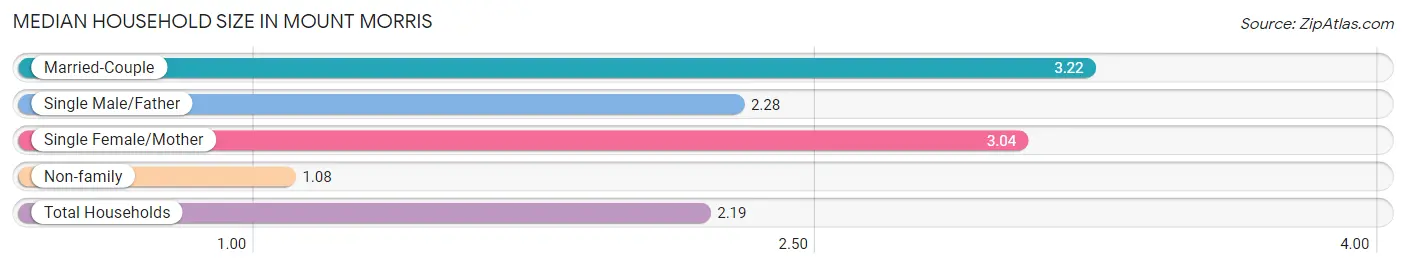
Median Household Size in Mount Morris
The median household size in Mount Morris is 2.19 persons per household, with married-couple households (127 | 40.5%) accounting for the largest median household size of 3.22 persons per household. non-family households (138 | 44.0%) represent the smallest median household size with 1.08 persons per household.
| Household Type | # Households | Household Size |
| Married-Couple | 127 (40.5%) | 3.22 |
| Single Male/Father | 25 (8.0%) | 2.28 |
| Single Female/Mother | 24 (7.6%) | 3.04 |
| Non-family | 138 (44.0%) | 1.08 |
| Total Households | 314 (100.0%) | 2.19 |
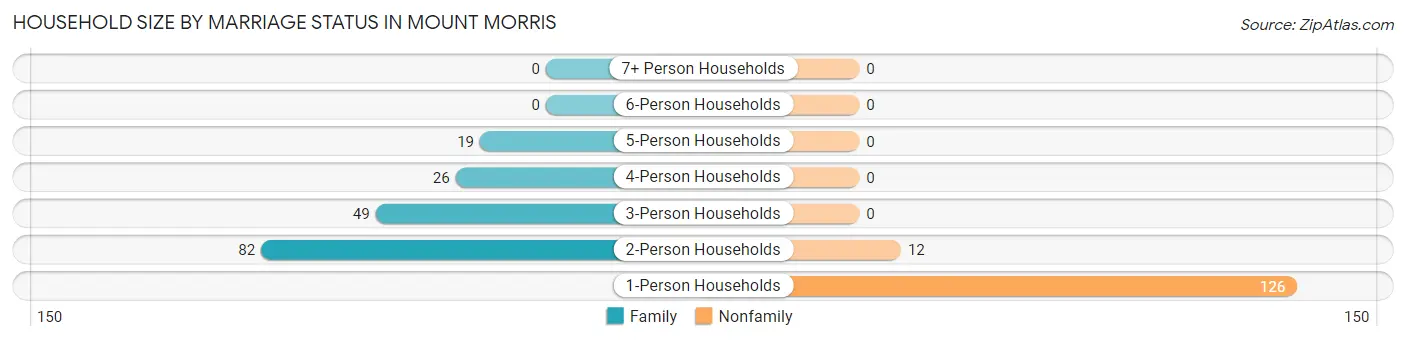
Household Size by Marriage Status in Mount Morris
Out of a total of 314 households in Mount Morris, 176 (56.0%) are family households, while 138 (44.0%) are nonfamily households. The most numerous type of family households are 2-person households, comprising 82, and the most common type of nonfamily households are 1-person households, comprising 126.
| Household Size | Family Households | Nonfamily Households |
| 1-Person Households | - | 126 (40.1%) |
| 2-Person Households | 82 (26.1%) | 12 (3.8%) |
| 3-Person Households | 49 (15.6%) | 0 (0.0%) |
| 4-Person Households | 26 (8.3%) | 0 (0.0%) |
| 5-Person Households | 19 (6.0%) | 0 (0.0%) |
| 6-Person Households | 0 (0.0%) | 0 (0.0%) |
| 7+ Person Households | 0 (0.0%) | 0 (0.0%) |
| Total | 176 (56.0%) | 138 (44.0%) |
Female Fertility in Mount Morris
Fertility by Age in Mount Morris
| Age Bracket | Women with Births | Births / 1,000 Women |
| 15 to 19 years | 0 (0.0%) | 0.0 |
| 20 to 34 years | 0 (0.0%) | 0.0 |
| 35 to 50 years | 0 (0.0%) | 0.0 |
| Total | 0 (0.0%) | 0.0 |
Fertility by Age by Marriage Status in Mount Morris
| Age Bracket | Married | Unmarried |
| 15 to 19 years | 0 (0.0%) | 0 (0.0%) |
| 20 to 34 years | 0 (0.0%) | 0 (0.0%) |
| 35 to 50 years | 0 (0.0%) | 0 (0.0%) |
| Total | 0 (0.0%) | 0 (0.0%) |
Fertility by Education in Mount Morris
| Educational Attainment | Women with Births | Births / 1,000 Women |
| Less than High School | 0 (0.0%) | 0.0 |
| High School Diploma | 0 (0.0%) | 0.0 |
| College or Associate's Degree | 0 (0.0%) | 0.0 |
| Bachelor's Degree | 0 (0.0%) | 0.0 |
| Graduate Degree | 0 (0.0%) | 0.0 |
| Total | 0 (0.0%) | 0.0 |
Fertility by Education by Marriage Status in Mount Morris
| Educational Attainment | Married | Unmarried |
| Less than High School | 0 (0.0%) | 0 (0.0%) |
| High School Diploma | 0 (0.0%) | 0 (0.0%) |
| College or Associate's Degree | 0 (0.0%) | 0 (0.0%) |
| Bachelor's Degree | 0 (0.0%) | 0 (0.0%) |
| Graduate Degree | 0 (0.0%) | 0 (0.0%) |
| Total | 0 (0.0%) | 0 (0.0%) |
Income in Mount Morris
Income Overview in Mount Morris
Per Capita Income in Mount Morris is $33,342, while median incomes of families and households are $69,231 and $65,000 respectively.
| Characteristic | Number | Measure |
| Per Capita Income | 688 | $33,342 |
| Median Family Income | 176 | $69,231 |
| Mean Family Income | 176 | $78,356 |
| Median Household Income | 314 | $65,000 |
| Mean Household Income | 314 | $71,869 |
| Income Deficit | 176 | $0 |
| Wage / Income Gap (%) | 688 | 12.35% |
| Wage / Income Gap ($) | 688 | 87.65¢ per $1 |
| Gini / Inequality Index | 688 | 0.39 |
Earnings by Sex in Mount Morris
Average Earnings in Mount Morris are $51,103, $53,625 for men and $47,000 for women, a difference of 12.3%.
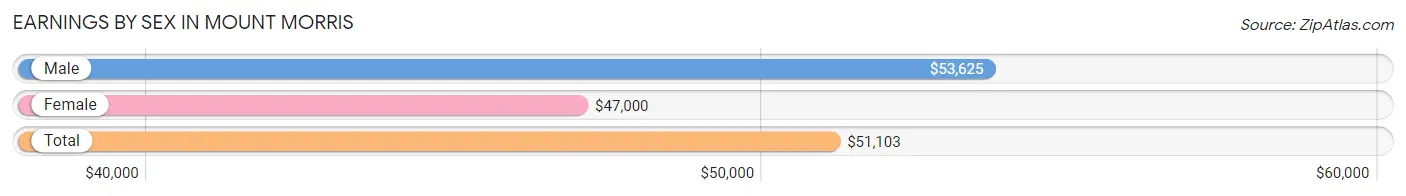
| Sex | Number | Average Earnings |
| Male | 171 (55.7%) | $53,625 |
| Female | 136 (44.3%) | $47,000 |
| Total | 307 (100.0%) | $51,103 |
Earnings by Sex by Income Bracket in Mount Morris
The most common earnings brackets in Mount Morris are $65,000 to $74,999 for men (43 | 25.2%) and $5,000 to $7,499 for women (18 | 13.2%).
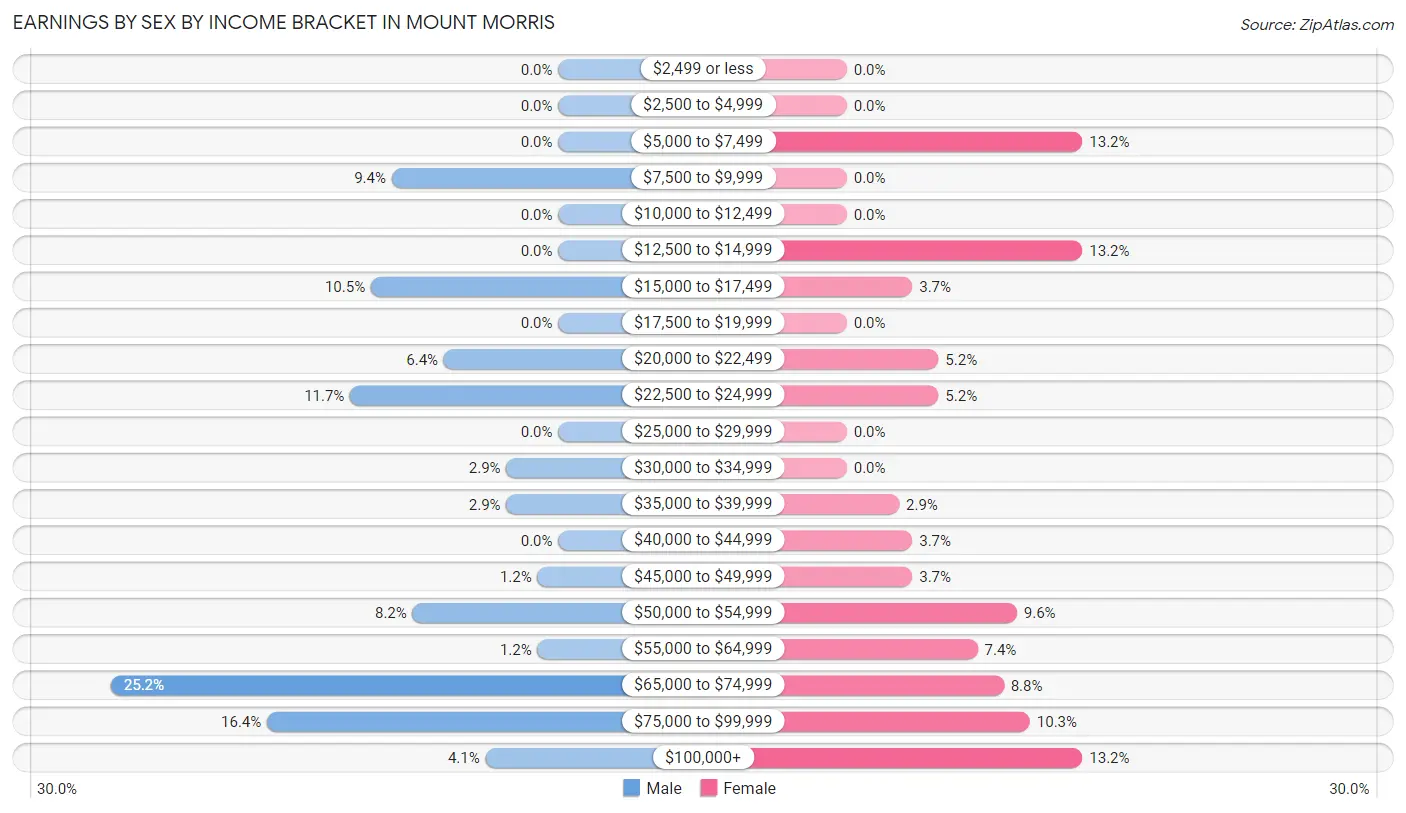
| Income | Male | Female |
| $2,499 or less | 0 (0.0%) | 0 (0.0%) |
| $2,500 to $4,999 | 0 (0.0%) | 0 (0.0%) |
| $5,000 to $7,499 | 0 (0.0%) | 18 (13.2%) |
| $7,500 to $9,999 | 16 (9.4%) | 0 (0.0%) |
| $10,000 to $12,499 | 0 (0.0%) | 0 (0.0%) |
| $12,500 to $14,999 | 0 (0.0%) | 18 (13.2%) |
| $15,000 to $17,499 | 18 (10.5%) | 5 (3.7%) |
| $17,500 to $19,999 | 0 (0.0%) | 0 (0.0%) |
| $20,000 to $22,499 | 11 (6.4%) | 7 (5.1%) |
| $22,500 to $24,999 | 20 (11.7%) | 7 (5.1%) |
| $25,000 to $29,999 | 0 (0.0%) | 0 (0.0%) |
| $30,000 to $34,999 | 5 (2.9%) | 0 (0.0%) |
| $35,000 to $39,999 | 5 (2.9%) | 4 (2.9%) |
| $40,000 to $44,999 | 0 (0.0%) | 5 (3.7%) |
| $45,000 to $49,999 | 2 (1.2%) | 5 (3.7%) |
| $50,000 to $54,999 | 14 (8.2%) | 13 (9.6%) |
| $55,000 to $64,999 | 2 (1.2%) | 10 (7.3%) |
| $65,000 to $74,999 | 43 (25.2%) | 12 (8.8%) |
| $75,000 to $99,999 | 28 (16.4%) | 14 (10.3%) |
| $100,000+ | 7 (4.1%) | 18 (13.2%) |
| Total | 171 (100.0%) | 136 (100.0%) |
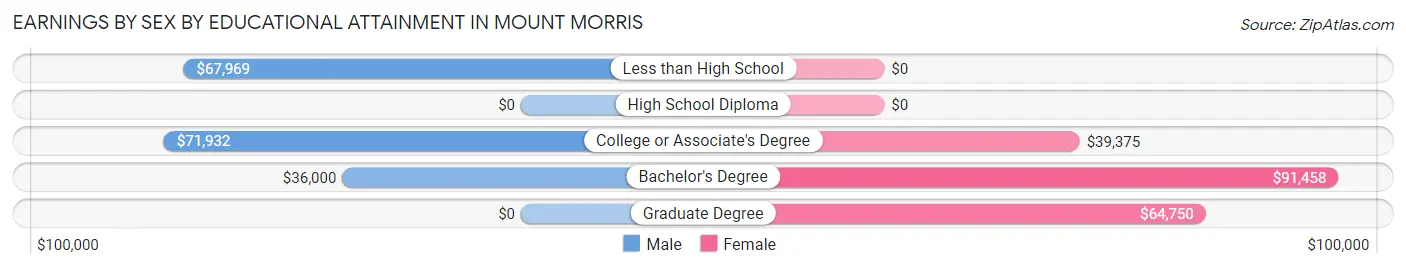
Earnings by Sex by Educational Attainment in Mount Morris
Average earnings in Mount Morris are $69,048 for men and $51,154 for women, a difference of 25.9%. Men with an educational attainment of college or associate's degree enjoy the highest average annual earnings of $71,932, while those with bachelor's degree education earn the least with $36,000. Women with an educational attainment of bachelor's degree earn the most with the average annual earnings of $91,458, while those with college or associate's degree education have the smallest earnings of $39,375.
| Educational Attainment | Male Income | Female Income |
| Less than High School | $67,969 | $0 |
| High School Diploma | - | - |
| College or Associate's Degree | $71,932 | $39,375 |
| Bachelor's Degree | $36,000 | $91,458 |
| Graduate Degree | - | - |
| Total | $69,048 | $51,154 |
Family Income in Mount Morris
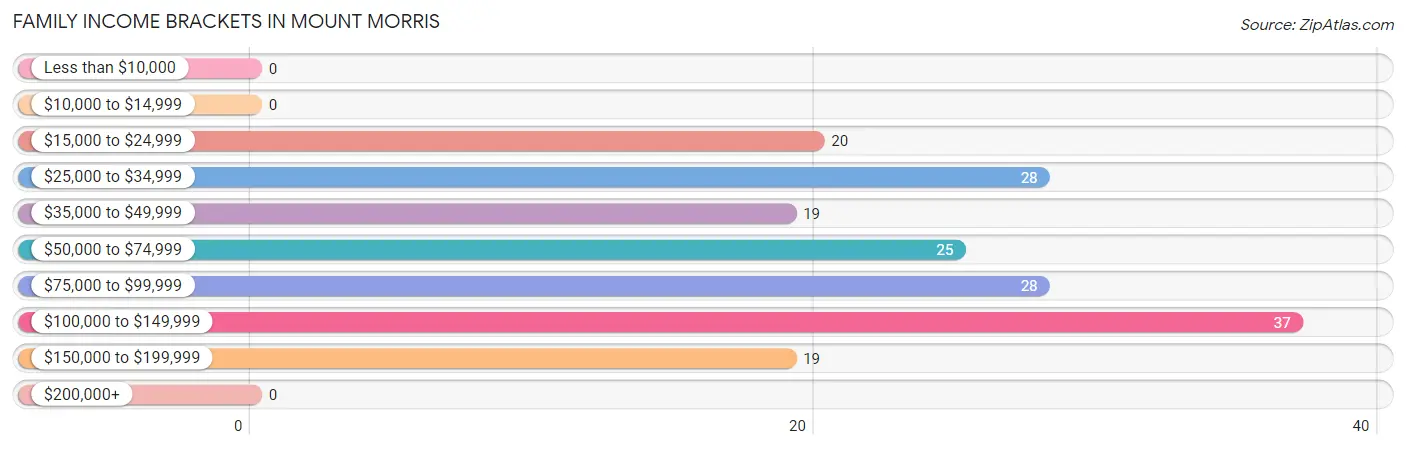
Family Income Brackets in Mount Morris
According to the Mount Morris family income data, there are 37 families falling into the $100,000 to $149,999 income range, which is the most common income bracket and makes up 21.0% of all families.
| Income Bracket | # Families | % Families |
| Less than $10,000 | 0 | 0.0% |
| $10,000 to $14,999 | 0 | 0.0% |
| $15,000 to $24,999 | 20 | 11.4% |
| $25,000 to $34,999 | 28 | 15.9% |
| $35,000 to $49,999 | 19 | 10.8% |
| $50,000 to $74,999 | 25 | 14.2% |
| $75,000 to $99,999 | 28 | 15.9% |
| $100,000 to $149,999 | 37 | 21.0% |
| $150,000 to $199,999 | 19 | 10.8% |
| $200,000+ | 0 | 0.0% |
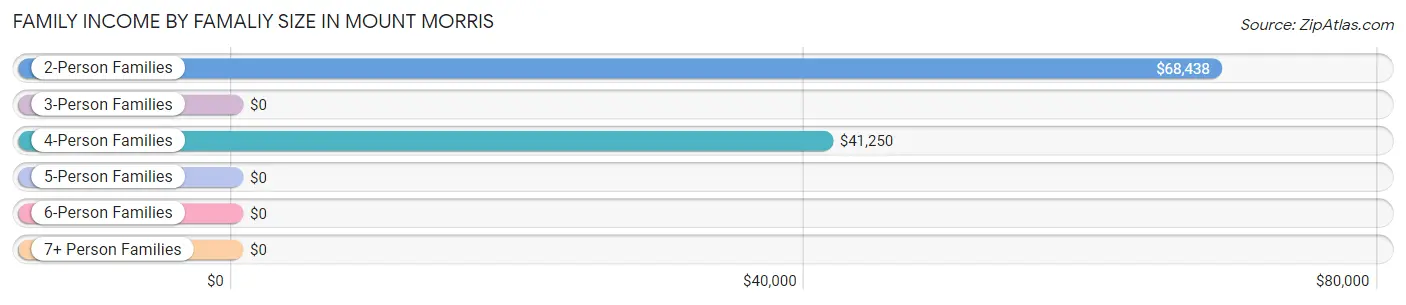
Family Income by Famaliy Size in Mount Morris
2-person families (100 | 56.8%) account for the highest median family income in Mount Morris with $68,438 per family, while 2-person families (100 | 56.8%) have the highest median income of $34,219 per family member.
| Income Bracket | # Families | Median Income |
| 2-Person Families | 100 (56.8%) | $68,438 |
| 3-Person Families | 31 (17.6%) | $0 |
| 4-Person Families | 26 (14.8%) | $41,250 |
| 5-Person Families | 19 (10.8%) | $0 |
| 6-Person Families | 0 (0.0%) | $0 |
| 7+ Person Families | 0 (0.0%) | $0 |
| Total | 176 (100.0%) | $69,231 |
Family Income by Number of Earners in Mount Morris
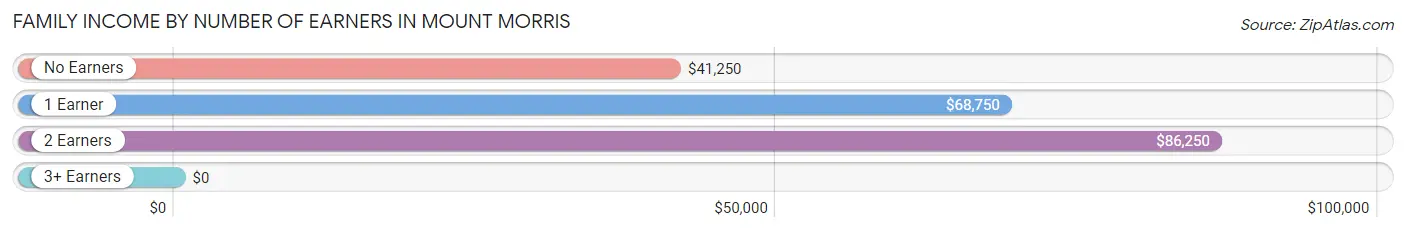
| Number of Earners | # Families | Median Income |
| No Earners | 38 (21.6%) | $41,250 |
| 1 Earner | 67 (38.1%) | $68,750 |
| 2 Earners | 62 (35.2%) | $86,250 |
| 3+ Earners | 9 (5.1%) | $0 |
| Total | 176 (100.0%) | $69,231 |
Household Income in Mount Morris
Household Income Brackets in Mount Morris
With 54 households falling in the category, the $100,000 to $149,999 income range is the most frequent in Mount Morris, accounting for 17.2% of all households.
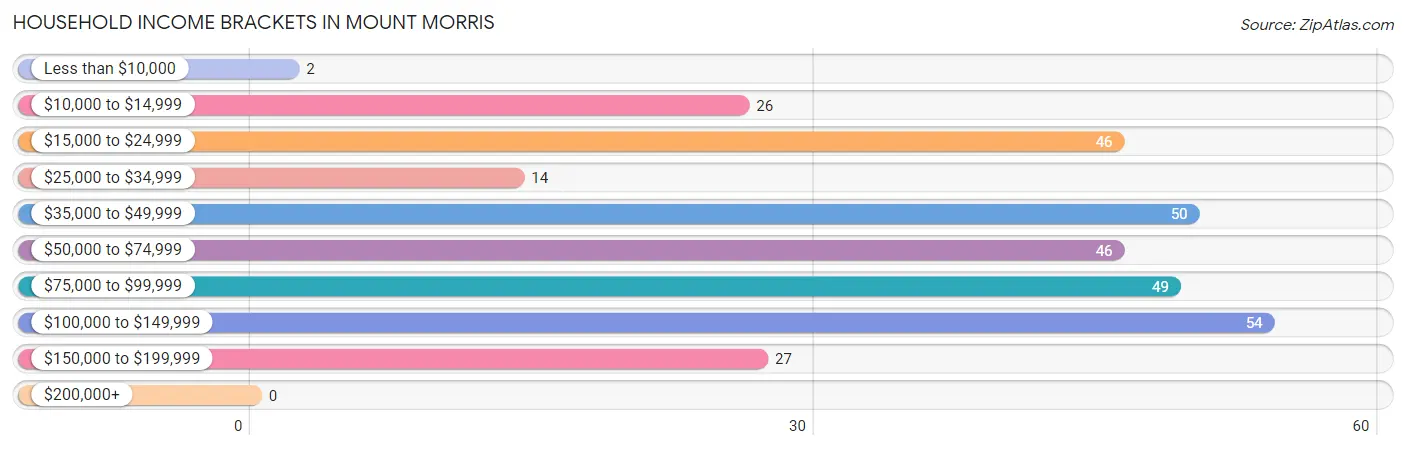
| Income Bracket | # Households | % Households |
| Less than $10,000 | 2 | 0.6% |
| $10,000 to $14,999 | 26 | 8.3% |
| $15,000 to $24,999 | 46 | 14.6% |
| $25,000 to $34,999 | 14 | 4.5% |
| $35,000 to $49,999 | 50 | 15.9% |
| $50,000 to $74,999 | 46 | 14.6% |
| $75,000 to $99,999 | 49 | 15.6% |
| $100,000 to $149,999 | 54 | 17.2% |
| $150,000 to $199,999 | 27 | 8.6% |
| $200,000+ | 0 | 0.0% |
Household Income by Householder Age in Mount Morris
The median household income in Mount Morris is $65,000, with the highest median household income of $120,000 found in the 25 to 44 years age bracket for the primary householder. A total of 72 households (22.9%) fall into this category.
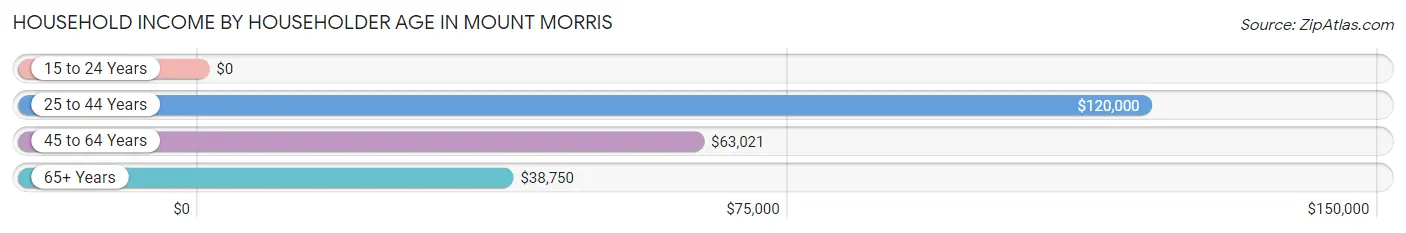
| Income Bracket | # Households | Median Income |
| 15 to 24 Years | 0 (0.0%) | $0 |
| 25 to 44 Years | 72 (22.9%) | $120,000 |
| 45 to 64 Years | 111 (35.3%) | $63,021 |
| 65+ Years | 131 (41.7%) | $38,750 |
| Total | 314 (100.0%) | $65,000 |
Poverty in Mount Morris
Income Below Poverty by Sex and Age in Mount Morris
With 19.2% poverty level for males and 10.5% for females among the residents of Mount Morris, 15 year old males and 5 year old females are the most vulnerable to poverty, with 17 males (100.0%) and 7 females (100.0%) in their respective age groups living below the poverty level.
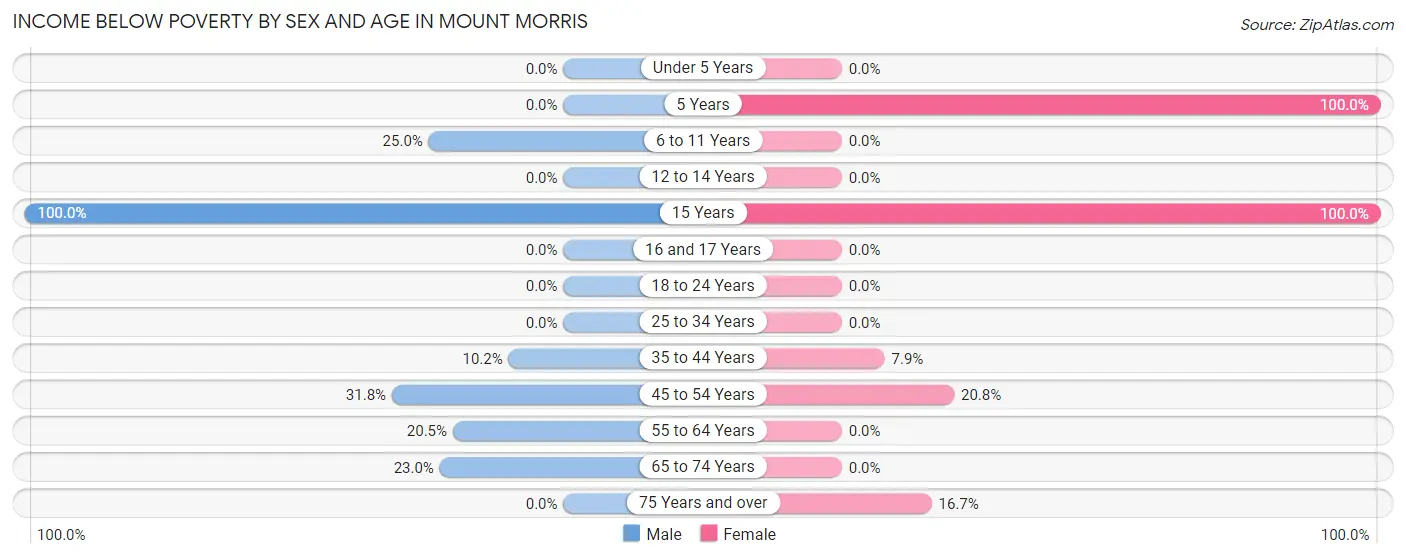
| Age Bracket | Male | Female |
| Under 5 Years | 0 (0.0%) | 0 (0.0%) |
| 5 Years | 0 (0.0%) | 7 (100.0%) |
| 6 to 11 Years | 6 (25.0%) | 0 (0.0%) |
| 12 to 14 Years | 0 (0.0%) | 0 (0.0%) |
| 15 Years | 17 (100.0%) | 8 (100.0%) |
| 16 and 17 Years | 0 (0.0%) | 0 (0.0%) |
| 18 to 24 Years | 0 (0.0%) | 0 (0.0%) |
| 25 to 34 Years | 0 (0.0%) | 0 (0.0%) |
| 35 to 44 Years | 6 (10.2%) | 5 (7.9%) |
| 45 to 54 Years | 7 (31.8%) | 10 (20.8%) |
| 55 to 64 Years | 16 (20.5%) | 0 (0.0%) |
| 65 to 74 Years | 14 (23.0%) | 0 (0.0%) |
| 75 Years and over | 0 (0.0%) | 6 (16.7%) |
| Total | 66 (19.2%) | 36 (10.5%) |
Income Above Poverty by Sex and Age in Mount Morris
According to the poverty statistics in Mount Morris, males aged 16 and 17 years and females aged 6 to 11 years are the age groups that are most secure financially, with 100.0% of males and 100.0% of females in these age groups living above the poverty line.
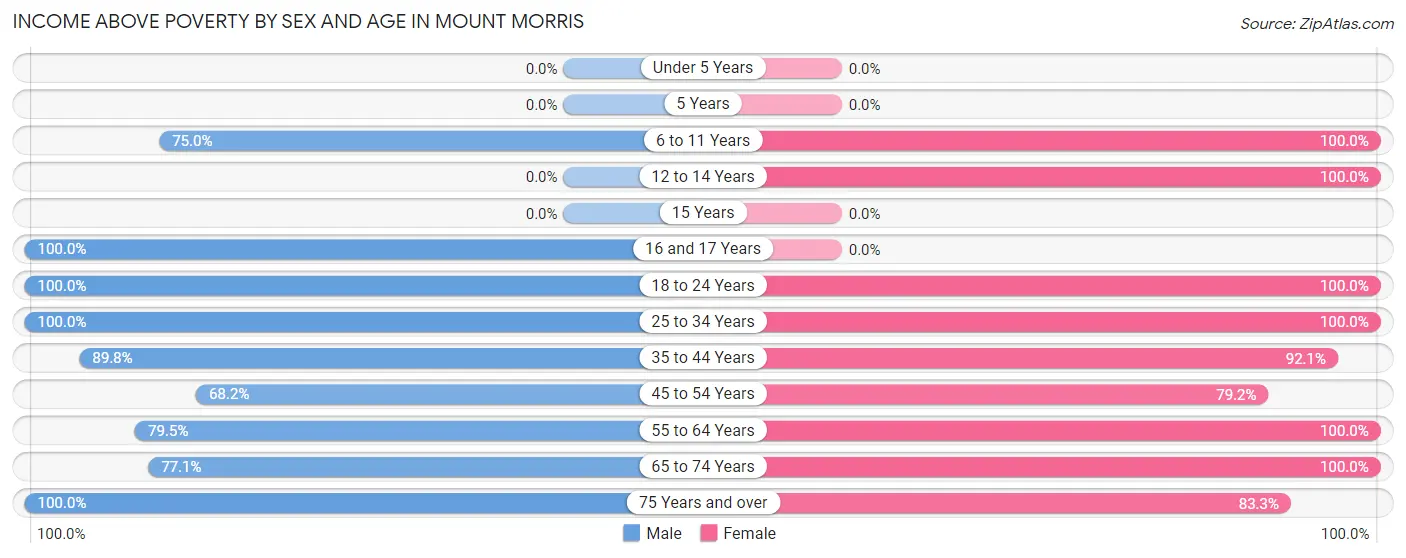
| Age Bracket | Male | Female |
| Under 5 Years | 0 (0.0%) | 0 (0.0%) |
| 5 Years | 0 (0.0%) | 0 (0.0%) |
| 6 to 11 Years | 18 (75.0%) | 30 (100.0%) |
| 12 to 14 Years | 0 (0.0%) | 11 (100.0%) |
| 15 Years | 0 (0.0%) | 0 (0.0%) |
| 16 and 17 Years | 16 (100.0%) | 0 (0.0%) |
| 18 to 24 Years | 27 (100.0%) | 14 (100.0%) |
| 25 to 34 Years | 26 (100.0%) | 31 (100.0%) |
| 35 to 44 Years | 53 (89.8%) | 58 (92.1%) |
| 45 to 54 Years | 15 (68.2%) | 38 (79.2%) |
| 55 to 64 Years | 62 (79.5%) | 59 (100.0%) |
| 65 to 74 Years | 47 (77.0%) | 37 (100.0%) |
| 75 Years and over | 14 (100.0%) | 30 (83.3%) |
| Total | 278 (80.8%) | 308 (89.5%) |
Income Below Poverty Among Married-Couple Families in Mount Morris
The poverty statistics for married-couple families in Mount Morris show that 3.9% or 5 of the total 127 families live below the poverty line. Families with 1 or 2 children have the highest poverty rate of 25.0%, comprising of 5 families. On the other hand, families with no children have the lowest poverty rate of 0.0%, which includes 0 families.
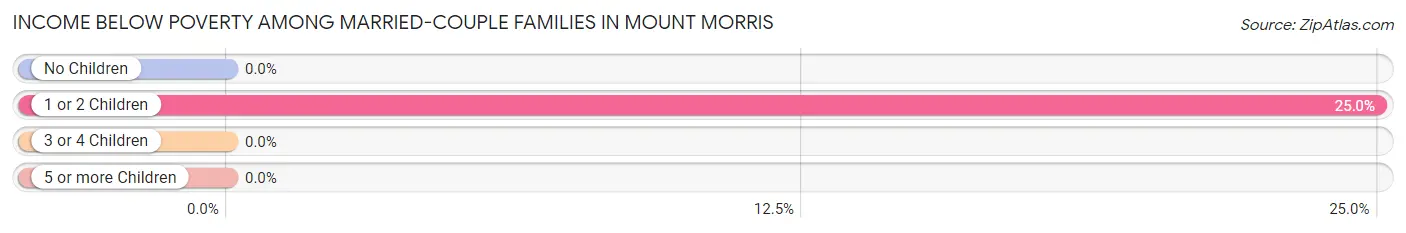
| Children | Above Poverty | Below Poverty |
| No Children | 93 (100.0%) | 0 (0.0%) |
| 1 or 2 Children | 15 (75.0%) | 5 (25.0%) |
| 3 or 4 Children | 14 (100.0%) | 0 (0.0%) |
| 5 or more Children | 0 (0.0%) | 0 (0.0%) |
| Total | 122 (96.1%) | 5 (3.9%) |
Income Below Poverty Among Single-Parent Households in Mount Morris
According to the poverty data in Mount Morris, 56.0% or 14 single-father households and 25.0% or 6 single-mother households are living below the poverty line. Among single-father households, those with 1 or 2 children have the highest poverty rate, with 14 households (73.7%) experiencing poverty. Likewise, among single-mother households, those with 1 or 2 children have the highest poverty rate, with 6 households (100.0%) falling below the poverty line.
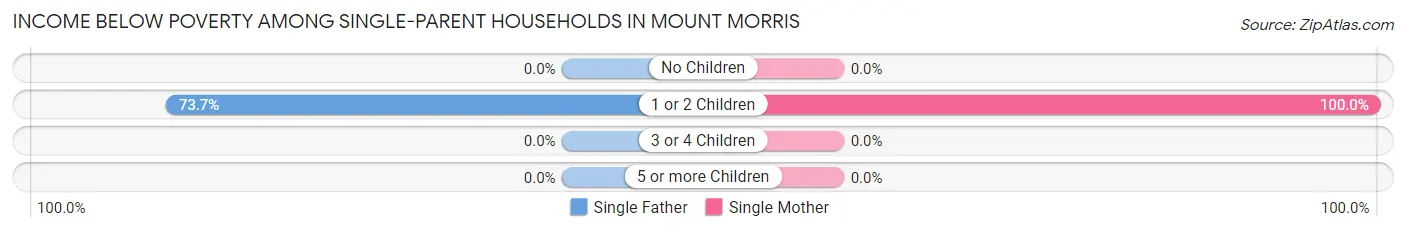
| Children | Single Father | Single Mother |
| No Children | 0 (0.0%) | 0 (0.0%) |
| 1 or 2 Children | 14 (73.7%) | 6 (100.0%) |
| 3 or 4 Children | 0 (0.0%) | 0 (0.0%) |
| 5 or more Children | 0 (0.0%) | 0 (0.0%) |
| Total | 14 (56.0%) | 6 (25.0%) |
Income Below Poverty Among Married-Couple vs Single-Parent Households in Mount Morris
The poverty data for Mount Morris shows that 5 of the married-couple family households (3.9%) and 20 of the single-parent households (40.8%) are living below the poverty level. Within the married-couple family households, those with 1 or 2 children have the highest poverty rate, with 5 households (25.0%) falling below the poverty line. Among the single-parent households, those with 1 or 2 children have the highest poverty rate, with 20 household (80.0%) living below poverty.
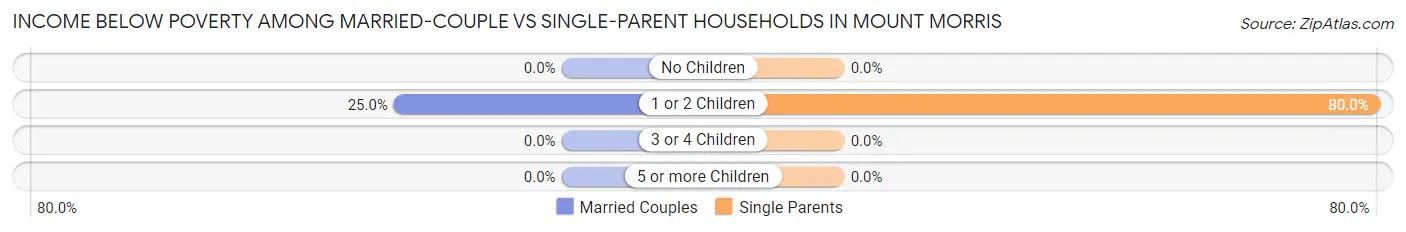
| Children | Married-Couple Families | Single-Parent Households |
| No Children | 0 (0.0%) | 0 (0.0%) |
| 1 or 2 Children | 5 (25.0%) | 20 (80.0%) |
| 3 or 4 Children | 0 (0.0%) | 0 (0.0%) |
| 5 or more Children | 0 (0.0%) | 0 (0.0%) |
| Total | 5 (3.9%) | 20 (40.8%) |
Employment Characteristics in Mount Morris
Employment by Class of Employer in Mount Morris
Among the 300 employed individuals in Mount Morris, private company employees (181 | 60.3%), local government employees (39 | 13.0%), and not-for-profit organizations (32 | 10.7%) make up the most common classes of employment.
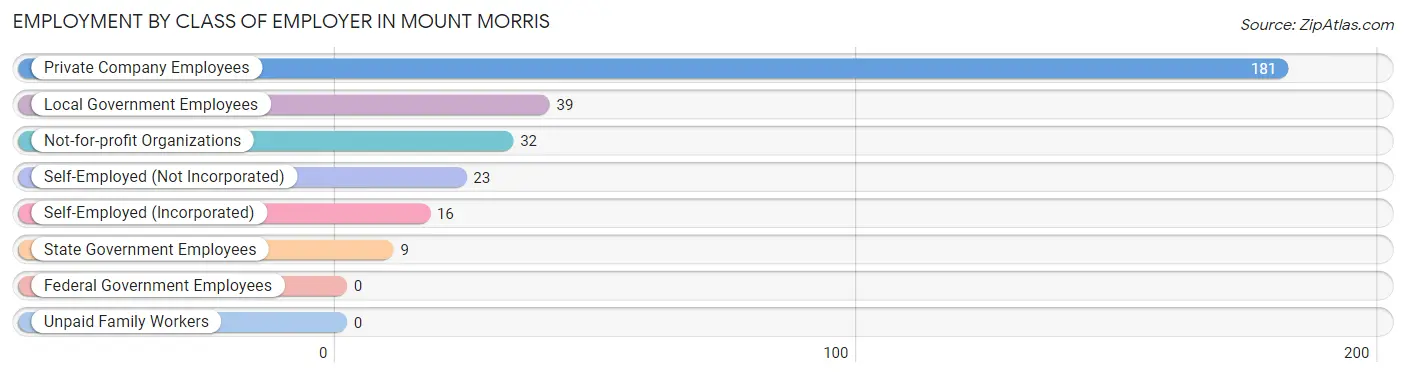
| Employer Class | # Employees | % Employees |
| Private Company Employees | 181 | 60.3% |
| Self-Employed (Incorporated) | 16 | 5.3% |
| Self-Employed (Not Incorporated) | 23 | 7.7% |
| Not-for-profit Organizations | 32 | 10.7% |
| Local Government Employees | 39 | 13.0% |
| State Government Employees | 9 | 3.0% |
| Federal Government Employees | 0 | 0.0% |
| Unpaid Family Workers | 0 | 0.0% |
| Total | 300 | 100.0% |
Employment Status by Age in Mount Morris
According to the labor force statistics for Mount Morris, out of the total population over 16 years of age (591), 51.8% or 306 individuals are in the labor force, with 2.0% or 6 of them unemployed. The age group with the highest labor force participation rate is 25 to 29 years, with 100.0% or 2 individuals in the labor force. Within the labor force, the 35 to 44 years age range has the highest percentage of unemployed individuals, with 5.6% or 6 of them being unemployed.
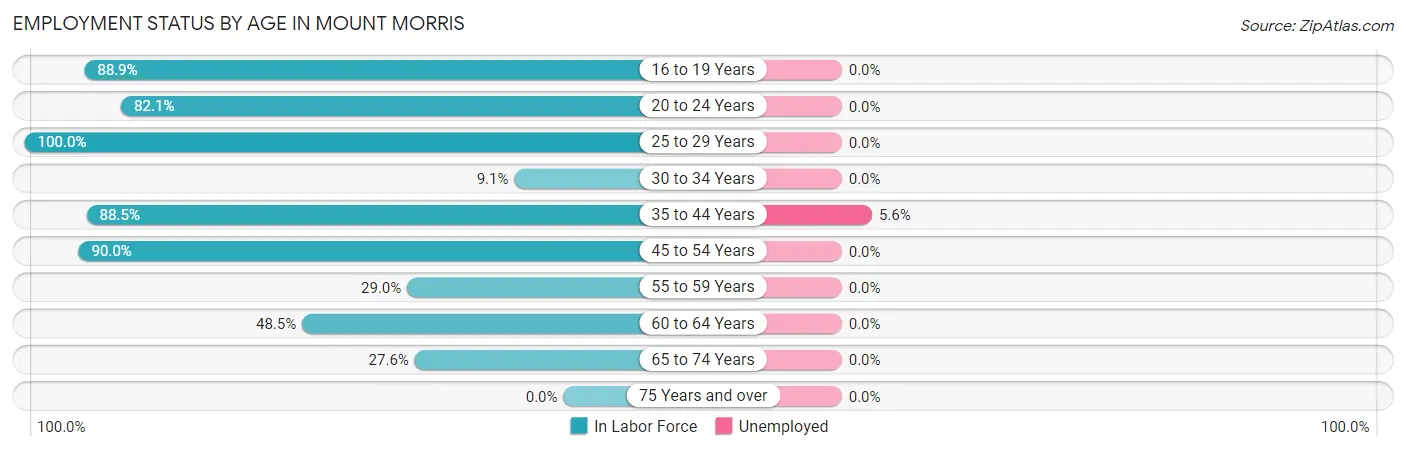
| Age Bracket | In Labor Force | Unemployed |
| 16 to 19 Years | 16 (88.9%) | 0 (0.0%) |
| 20 to 24 Years | 32 (82.1%) | 0 (0.0%) |
| 25 to 29 Years | 2 (100.0%) | 0 (0.0%) |
| 30 to 34 Years | 5 (9.1%) | 0 (0.0%) |
| 35 to 44 Years | 108 (88.5%) | 6 (5.6%) |
| 45 to 54 Years | 63 (90.0%) | 0 (0.0%) |
| 55 to 59 Years | 20 (29.0%) | 0 (0.0%) |
| 60 to 64 Years | 33 (48.5%) | 0 (0.0%) |
| 65 to 74 Years | 27 (27.6%) | 0 (0.0%) |
| 75 Years and over | 0 (0.0%) | 0 (0.0%) |
| Total | 306 (51.8%) | 6 (2.0%) |
Employment Status by Educational Attainment in Mount Morris
According to labor force statistics for Mount Morris, 59.8% of individuals (231) out of the total population between 25 and 64 years of age (386) are in the labor force, with 2.6% or 6 of them being unemployed. The group with the highest labor force participation rate are those with the educational attainment of bachelor's degree or higher, with 96.1% or 73 individuals in the labor force. Within the labor force, individuals with high school diploma education have the highest percentage of unemployment, with 12.2% or 6 of them being unemployed.
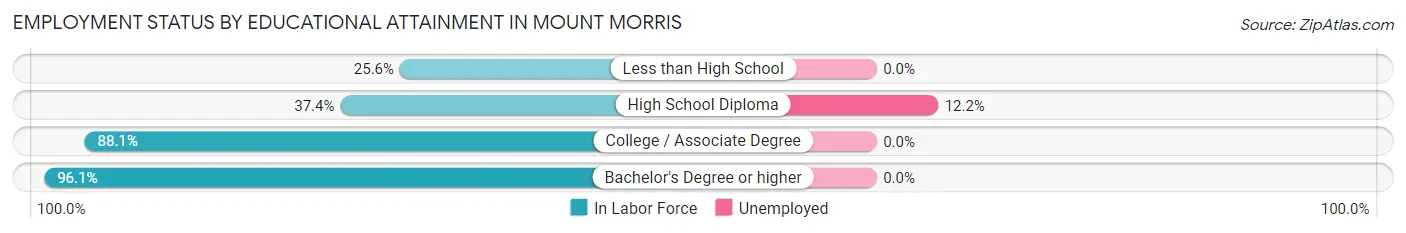
| Educational Attainment | In Labor Force | Unemployed |
| Less than High School | 20 (25.6%) | 0 (0.0%) |
| High School Diploma | 49 (37.4%) | 16 (12.2%) |
| College / Associate Degree | 89 (88.1%) | 0 (0.0%) |
| Bachelor's Degree or higher | 73 (96.1%) | 0 (0.0%) |
| Total | 231 (59.8%) | 10 (2.6%) |
Employment Occupations by Sex in Mount Morris
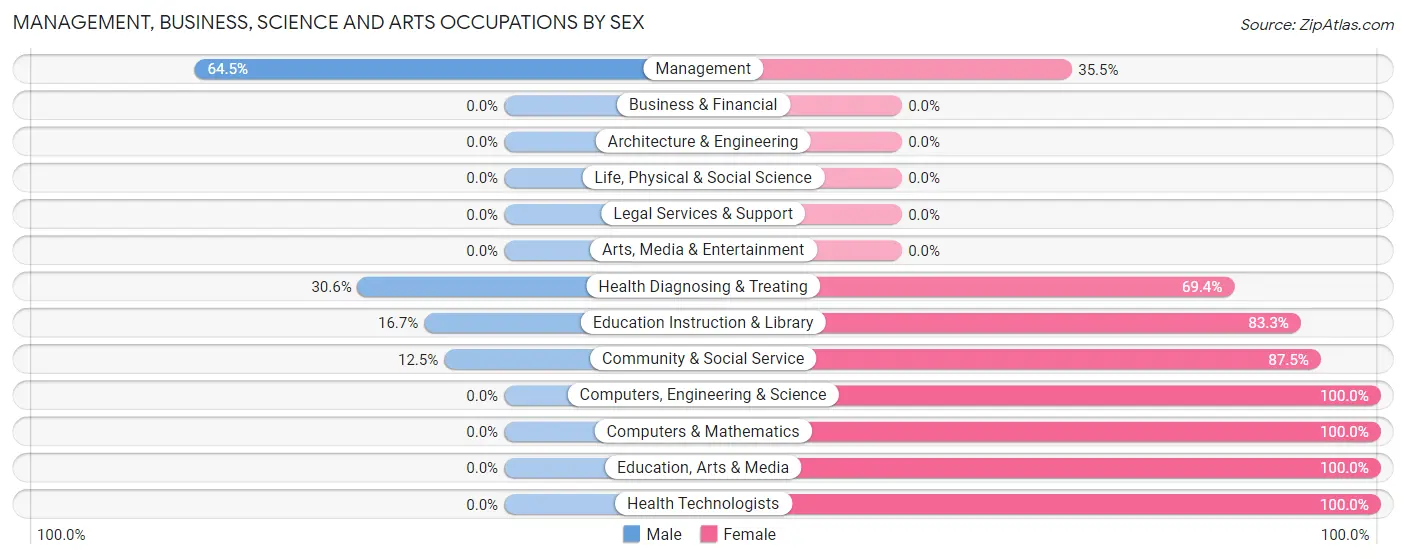
Management, Business, Science and Arts Occupations
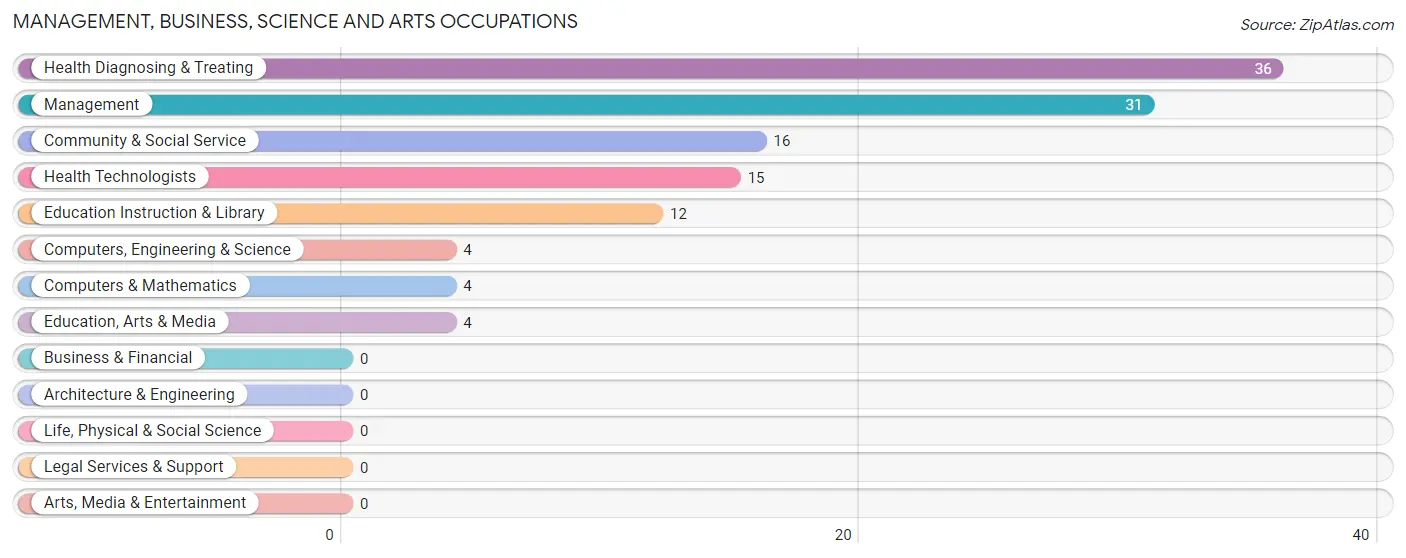
The most common Management, Business, Science and Arts occupations in Mount Morris are Health Diagnosing & Treating (36 | 12.0%), Management (31 | 10.3%), Community & Social Service (16 | 5.3%), Health Technologists (15 | 5.0%), and Education Instruction & Library (12 | 4.0%).
Management, Business, Science and Arts Occupations by Sex
Within the Management, Business, Science and Arts occupations in Mount Morris, the most male-oriented occupations are Management (64.5%), Health Diagnosing & Treating (30.6%), and Education Instruction & Library (16.7%), while the most female-oriented occupations are Computers, Engineering & Science (100.0%), Computers & Mathematics (100.0%), and Education, Arts & Media (100.0%).
| Occupation | Male | Female |
| Management | 20 (64.5%) | 11 (35.5%) |
| Business & Financial | 0 (0.0%) | 0 (0.0%) |
| Computers, Engineering & Science | 0 (0.0%) | 4 (100.0%) |
| Computers & Mathematics | 0 (0.0%) | 4 (100.0%) |
| Architecture & Engineering | 0 (0.0%) | 0 (0.0%) |
| Life, Physical & Social Science | 0 (0.0%) | 0 (0.0%) |
| Community & Social Service | 2 (12.5%) | 14 (87.5%) |
| Education, Arts & Media | 0 (0.0%) | 4 (100.0%) |
| Legal Services & Support | 0 (0.0%) | 0 (0.0%) |
| Education Instruction & Library | 2 (16.7%) | 10 (83.3%) |
| Arts, Media & Entertainment | 0 (0.0%) | 0 (0.0%) |
| Health Diagnosing & Treating | 11 (30.6%) | 25 (69.4%) |
| Health Technologists | 0 (0.0%) | 15 (100.0%) |
| Total (Category) | 33 (37.9%) | 54 (62.1%) |
| Total (Overall) | 171 (57.0%) | 129 (43.0%) |
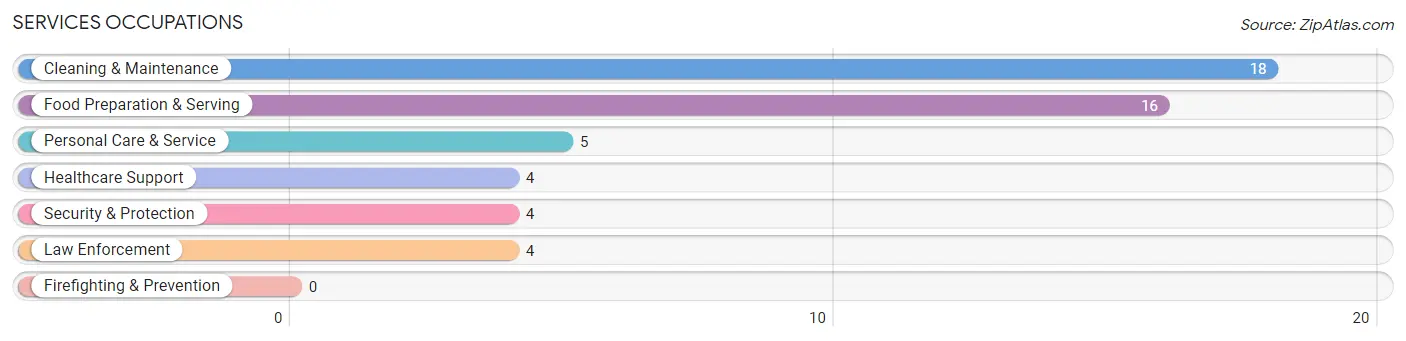
Services Occupations
The most common Services occupations in Mount Morris are Cleaning & Maintenance (18 | 6.0%), Food Preparation & Serving (16 | 5.3%), Personal Care & Service (5 | 1.7%), Healthcare Support (4 | 1.3%), and Security & Protection (4 | 1.3%).
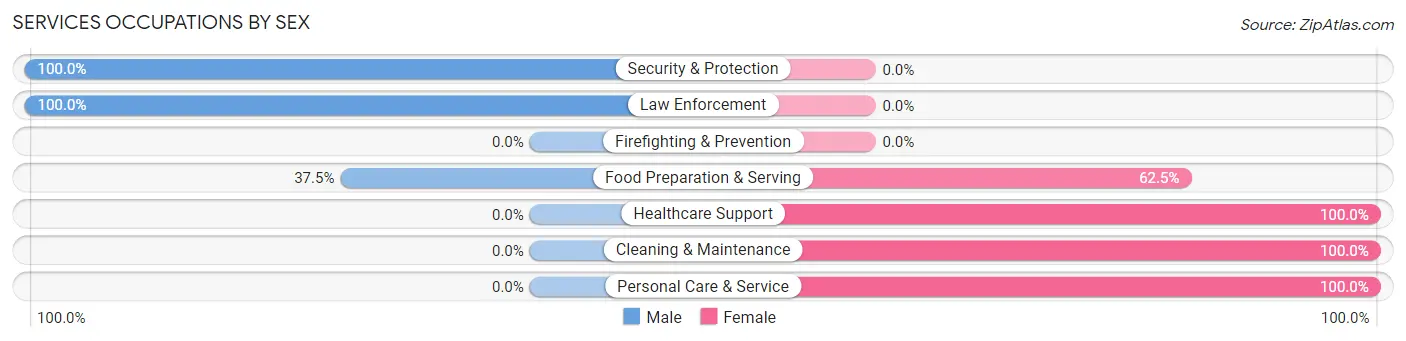
Services Occupations by Sex
Within the Services occupations in Mount Morris, the most male-oriented occupations are Security & Protection (100.0%), Law Enforcement (100.0%), and Food Preparation & Serving (37.5%), while the most female-oriented occupations are Healthcare Support (100.0%), Cleaning & Maintenance (100.0%), and Personal Care & Service (100.0%).
| Occupation | Male | Female |
| Healthcare Support | 0 (0.0%) | 4 (100.0%) |
| Security & Protection | 4 (100.0%) | 0 (0.0%) |
| Firefighting & Prevention | 0 (0.0%) | 0 (0.0%) |
| Law Enforcement | 4 (100.0%) | 0 (0.0%) |
| Food Preparation & Serving | 6 (37.5%) | 10 (62.5%) |
| Cleaning & Maintenance | 0 (0.0%) | 18 (100.0%) |
| Personal Care & Service | 0 (0.0%) | 5 (100.0%) |
| Total (Category) | 10 (21.3%) | 37 (78.7%) |
| Total (Overall) | 171 (57.0%) | 129 (43.0%) |
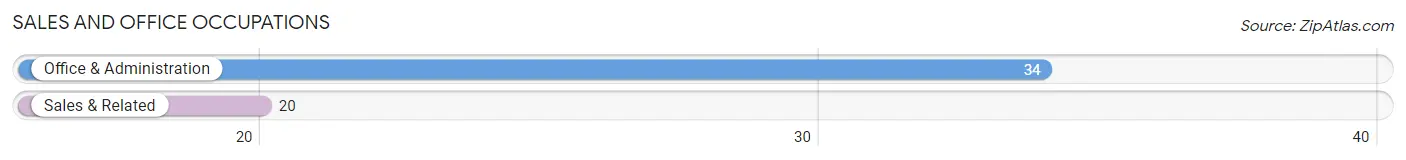
Sales and Office Occupations
The most common Sales and Office occupations in Mount Morris are Office & Administration (34 | 11.3%), and Sales & Related (20 | 6.7%).
Sales and Office Occupations by Sex
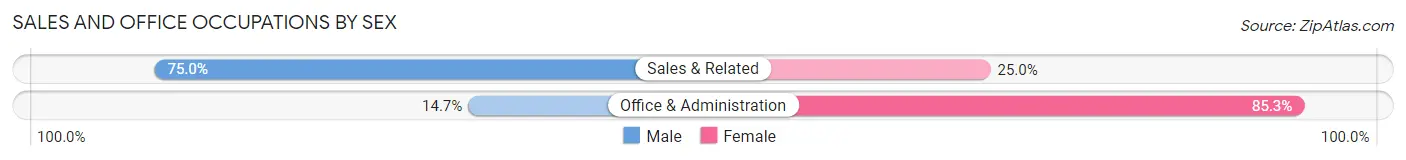
| Occupation | Male | Female |
| Sales & Related | 15 (75.0%) | 5 (25.0%) |
| Office & Administration | 5 (14.7%) | 29 (85.3%) |
| Total (Category) | 20 (37.0%) | 34 (63.0%) |
| Total (Overall) | 171 (57.0%) | 129 (43.0%) |
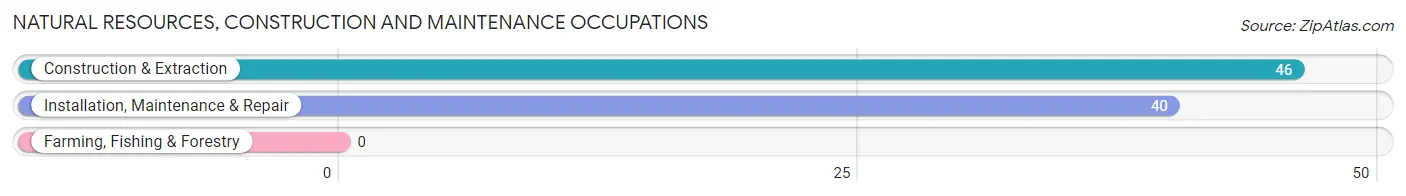
Natural Resources, Construction and Maintenance Occupations
The most common Natural Resources, Construction and Maintenance occupations in Mount Morris are Construction & Extraction (46 | 15.3%), and Installation, Maintenance & Repair (40 | 13.3%).
Natural Resources, Construction and Maintenance Occupations by Sex
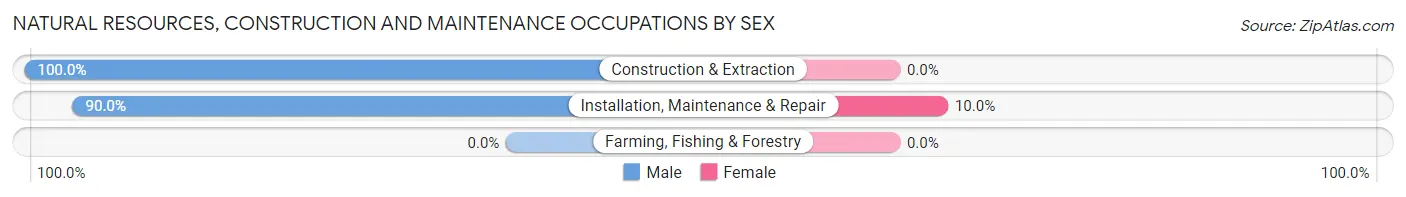
| Occupation | Male | Female |
| Farming, Fishing & Forestry | 0 (0.0%) | 0 (0.0%) |
| Construction & Extraction | 46 (100.0%) | 0 (0.0%) |
| Installation, Maintenance & Repair | 36 (90.0%) | 4 (10.0%) |
| Total (Category) | 82 (95.4%) | 4 (4.6%) |
| Total (Overall) | 171 (57.0%) | 129 (43.0%) |
Production, Transportation and Moving Occupations
The most common Production, Transportation and Moving occupations in Mount Morris are Material Moving (16 | 5.3%), and Transportation (10 | 3.3%).
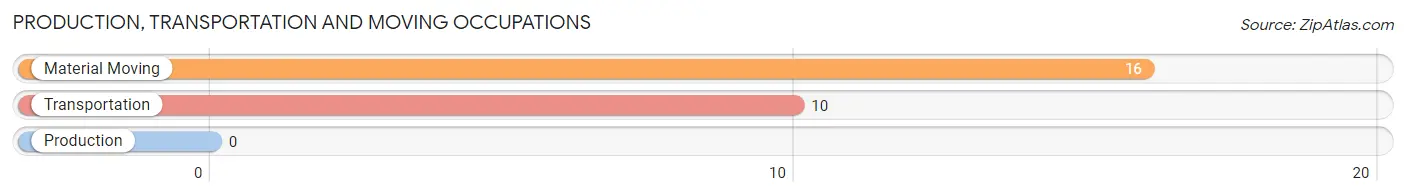
Production, Transportation and Moving Occupations by Sex
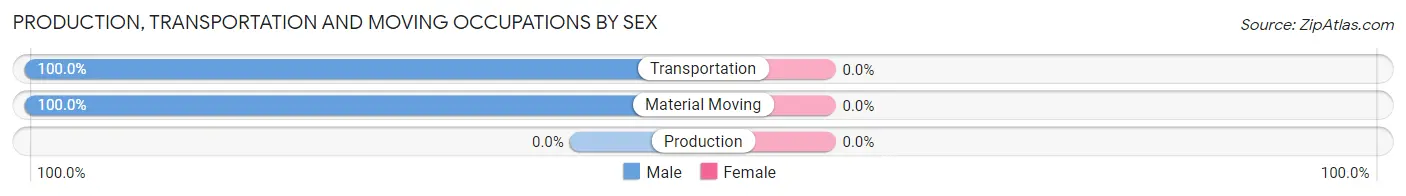
| Occupation | Male | Female |
| Production | 0 (0.0%) | 0 (0.0%) |
| Transportation | 10 (100.0%) | 0 (0.0%) |
| Material Moving | 16 (100.0%) | 0 (0.0%) |
| Total (Category) | 26 (100.0%) | 0 (0.0%) |
| Total (Overall) | 171 (57.0%) | 129 (43.0%) |
Employment Industries by Sex in Mount Morris
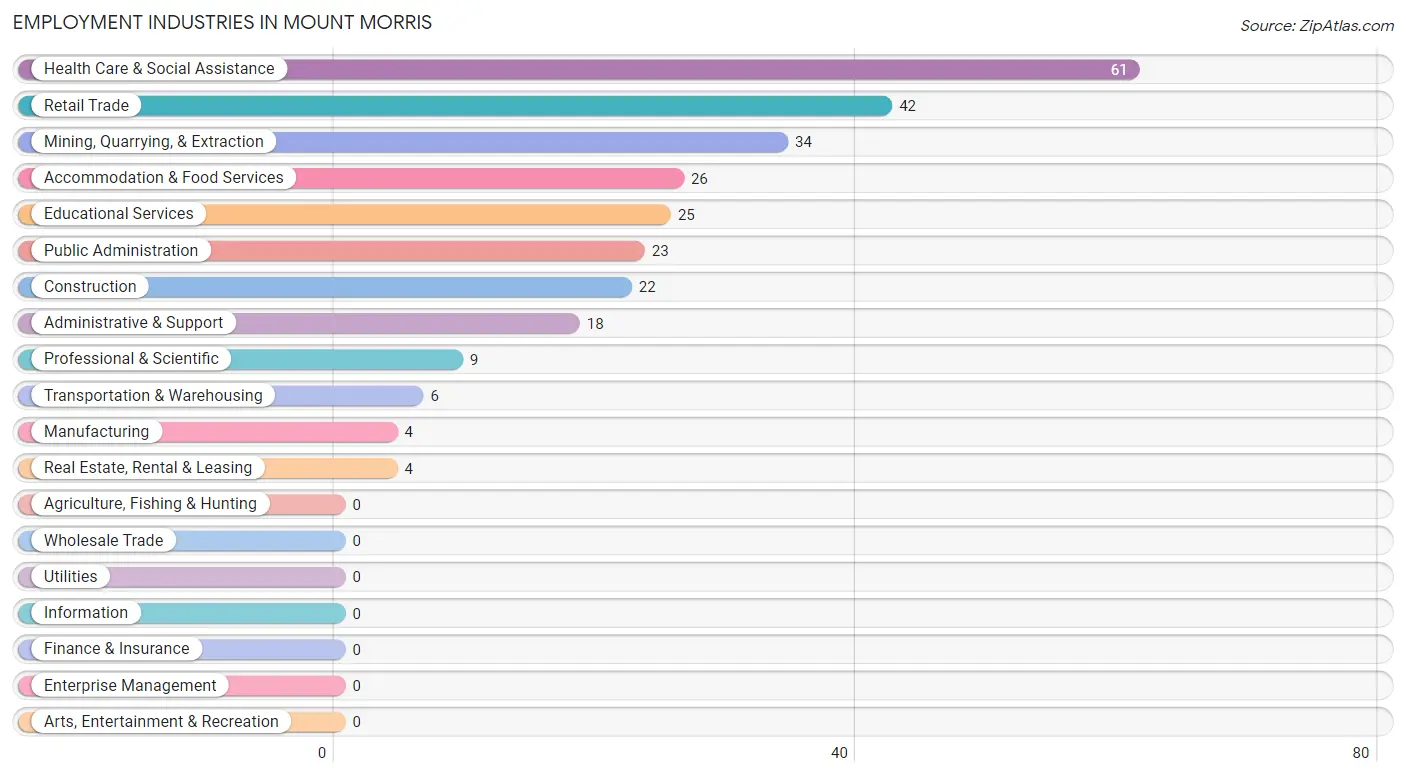
Employment Industries in Mount Morris
The major employment industries in Mount Morris include Health Care & Social Assistance (61 | 20.3%), Retail Trade (42 | 14.0%), Mining, Quarrying, & Extraction (34 | 11.3%), Accommodation & Food Services (26 | 8.7%), and Educational Services (25 | 8.3%).
Employment Industries by Sex in Mount Morris
The Mount Morris industries that see more men than women are Mining, Quarrying, & Extraction (100.0%), Construction (100.0%), and Retail Trade (100.0%), whereas the industries that tend to have a higher number of women are Manufacturing (100.0%), Professional & Scientific (100.0%), and Administrative & Support (100.0%).
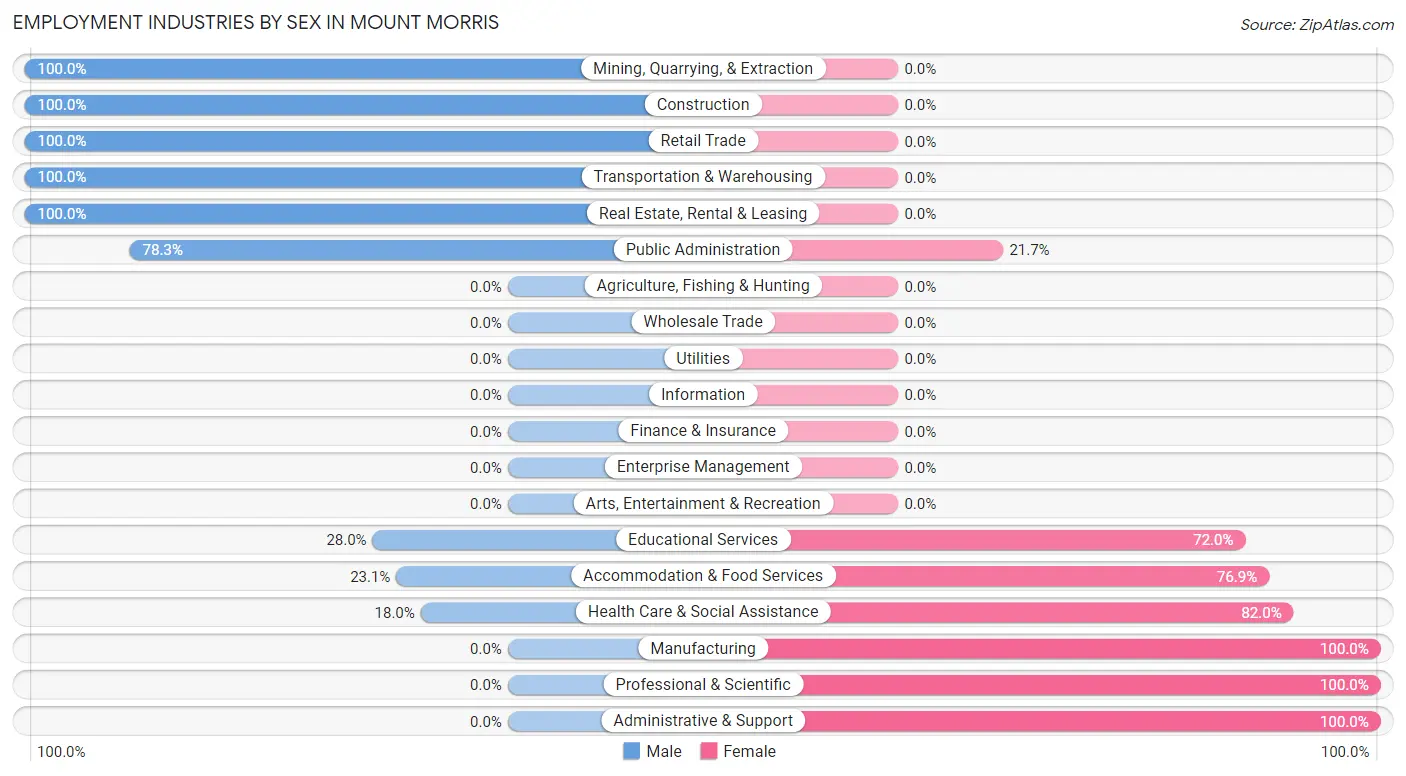
| Industry | Male | Female |
| Agriculture, Fishing & Hunting | 0 (0.0%) | 0 (0.0%) |
| Mining, Quarrying, & Extraction | 34 (100.0%) | 0 (0.0%) |
| Construction | 22 (100.0%) | 0 (0.0%) |
| Manufacturing | 0 (0.0%) | 4 (100.0%) |
| Wholesale Trade | 0 (0.0%) | 0 (0.0%) |
| Retail Trade | 42 (100.0%) | 0 (0.0%) |
| Transportation & Warehousing | 6 (100.0%) | 0 (0.0%) |
| Utilities | 0 (0.0%) | 0 (0.0%) |
| Information | 0 (0.0%) | 0 (0.0%) |
| Finance & Insurance | 0 (0.0%) | 0 (0.0%) |
| Real Estate, Rental & Leasing | 4 (100.0%) | 0 (0.0%) |
| Professional & Scientific | 0 (0.0%) | 9 (100.0%) |
| Enterprise Management | 0 (0.0%) | 0 (0.0%) |
| Administrative & Support | 0 (0.0%) | 18 (100.0%) |
| Educational Services | 7 (28.0%) | 18 (72.0%) |
| Health Care & Social Assistance | 11 (18.0%) | 50 (82.0%) |
| Arts, Entertainment & Recreation | 0 (0.0%) | 0 (0.0%) |
| Accommodation & Food Services | 6 (23.1%) | 20 (76.9%) |
| Public Administration | 18 (78.3%) | 5 (21.7%) |
| Total | 171 (57.0%) | 129 (43.0%) |
Education in Mount Morris
School Enrollment in Mount Morris
The most common levels of schooling among the 122 students in Mount Morris are high school (43 | 35.2%), middle school (34 | 27.9%), and elementary school (26 | 21.3%).
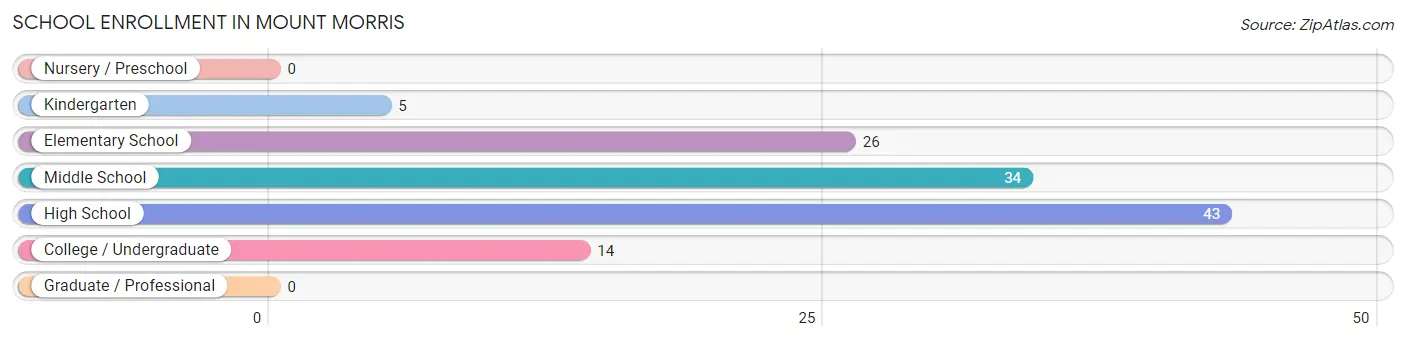
| School Level | # Students | % Students |
| Nursery / Preschool | 0 | 0.0% |
| Kindergarten | 5 | 4.1% |
| Elementary School | 26 | 21.3% |
| Middle School | 34 | 27.9% |
| High School | 43 | 35.2% |
| College / Undergraduate | 14 | 11.5% |
| Graduate / Professional | 0 | 0.0% |
| Total | 122 | 100.0% |
School Enrollment by Age by Funding Source in Mount Morris
Out of a total of 122 students who are enrolled in schools in Mount Morris, 5 (4.1%) attend a private institution, while the remaining 117 (95.9%) are enrolled in public schools. The age group of 5 to 9 year old has the highest likelihood of being enrolled in private schools, with 5 (19.2% in the age bracket) enrolled. Conversely, the age group of 10 to 14 year olds has the lowest likelihood of being enrolled in a private school, with 39 (100.0% in the age bracket) attending a public institution.
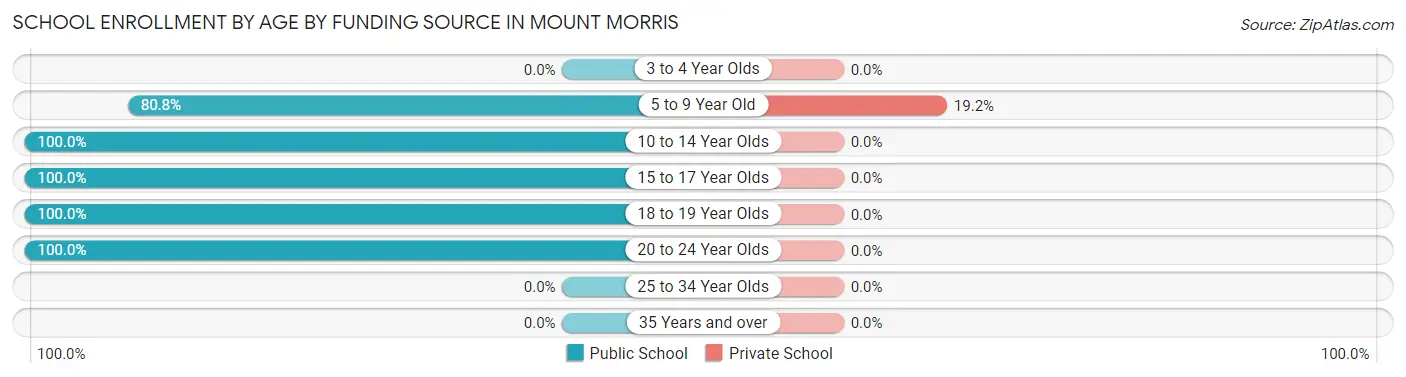
| Age Bracket | Public School | Private School |
| 3 to 4 Year Olds | 0 (0.0%) | 0 (0.0%) |
| 5 to 9 Year Old | 21 (80.8%) | 5 (19.2%) |
| 10 to 14 Year Olds | 39 (100.0%) | 0 (0.0%) |
| 15 to 17 Year Olds | 41 (100.0%) | 0 (0.0%) |
| 18 to 19 Year Olds | 2 (100.0%) | 0 (0.0%) |
| 20 to 24 Year Olds | 14 (100.0%) | 0 (0.0%) |
| 25 to 34 Year Olds | 0 (0.0%) | 0 (0.0%) |
| 35 Years and over | 0 (0.0%) | 0 (0.0%) |
| Total | 117 (95.9%) | 5 (4.1%) |
Educational Attainment by Field of Study in Mount Morris
Science & technology (17 | 21.5%), business (15 | 19.0%), communications (10 | 12.7%), psychology (9 | 11.4%), and engineering (8 | 10.1%) are the most common fields of study among 79 individuals in Mount Morris who have obtained a bachelor's degree or higher.
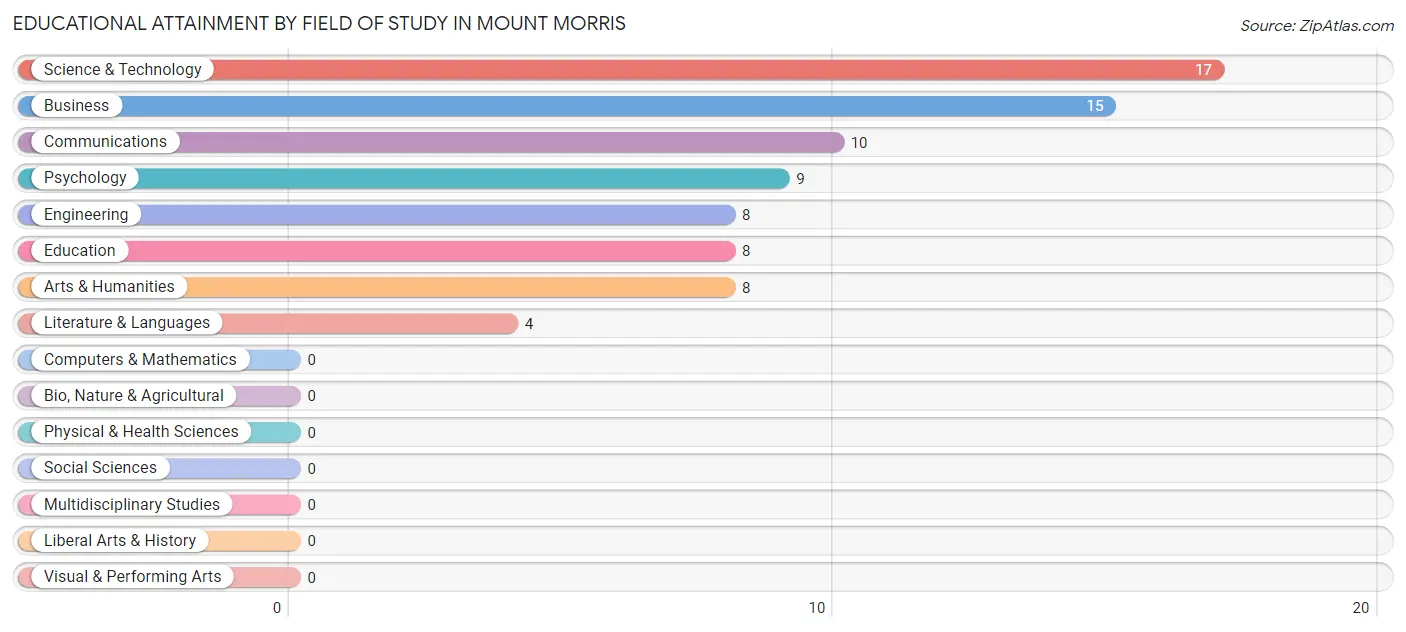
| Field of Study | # Graduates | % Graduates |
| Computers & Mathematics | 0 | 0.0% |
| Bio, Nature & Agricultural | 0 | 0.0% |
| Physical & Health Sciences | 0 | 0.0% |
| Psychology | 9 | 11.4% |
| Social Sciences | 0 | 0.0% |
| Engineering | 8 | 10.1% |
| Multidisciplinary Studies | 0 | 0.0% |
| Science & Technology | 17 | 21.5% |
| Business | 15 | 19.0% |
| Education | 8 | 10.1% |
| Literature & Languages | 4 | 5.1% |
| Liberal Arts & History | 0 | 0.0% |
| Visual & Performing Arts | 0 | 0.0% |
| Communications | 10 | 12.7% |
| Arts & Humanities | 8 | 10.1% |
| Total | 79 | 100.0% |
Transportation & Commute in Mount Morris
Vehicle Availability by Sex in Mount Morris
The most prevalent vehicle ownership categories in Mount Morris are males with 3 vehicles (93, accounting for 54.4%) and females with 3 vehicles (54, making up 72.1%).
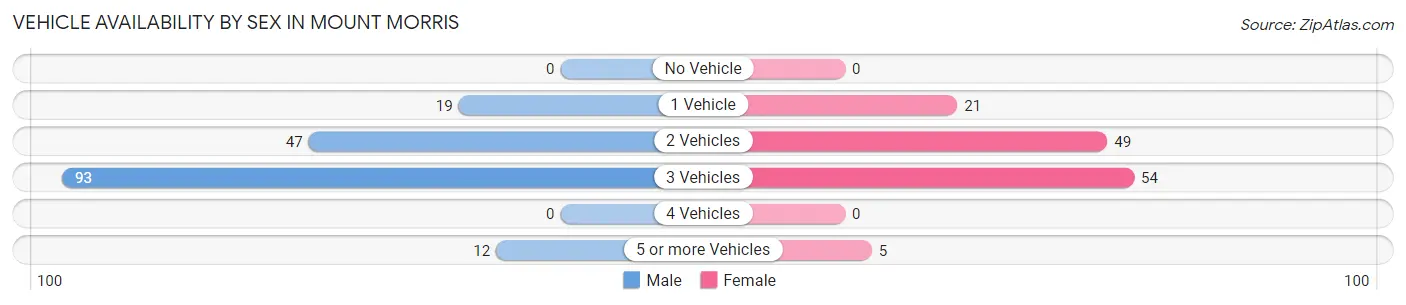
| Vehicles Available | Male | Female |
| No Vehicle | 0 (0.0%) | 0 (0.0%) |
| 1 Vehicle | 19 (11.1%) | 21 (16.3%) |
| 2 Vehicles | 47 (27.5%) | 49 (38.0%) |
| 3 Vehicles | 93 (54.4%) | 54 (41.9%) |
| 4 Vehicles | 0 (0.0%) | 0 (0.0%) |
| 5 or more Vehicles | 12 (7.0%) | 5 (3.9%) |
| Total | 171 (100.0%) | 129 (100.0%) |
Commute Time in Mount Morris
The most frequently occuring commute durations in Mount Morris are 20 to 24 minutes (82 commuters, 28.0%), 30 to 34 minutes (52 commuters, 17.7%), and 15 to 19 minutes (39 commuters, 13.3%).
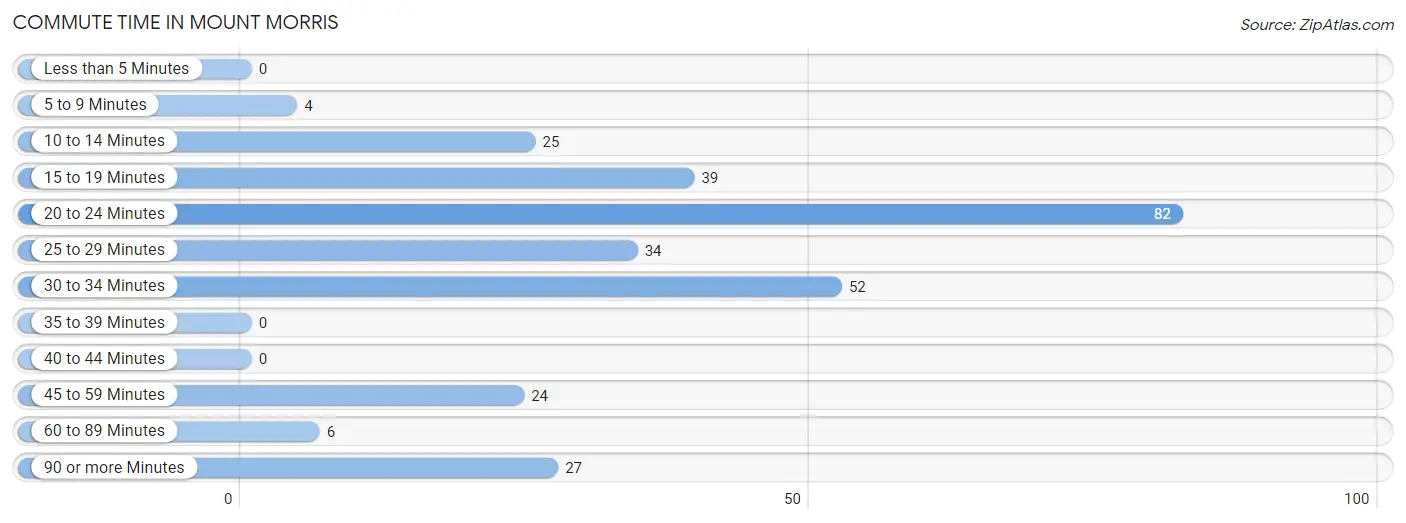
| Commute Time | # Commuters | % Commuters |
| Less than 5 Minutes | 0 | 0.0% |
| 5 to 9 Minutes | 4 | 1.4% |
| 10 to 14 Minutes | 25 | 8.5% |
| 15 to 19 Minutes | 39 | 13.3% |
| 20 to 24 Minutes | 82 | 28.0% |
| 25 to 29 Minutes | 34 | 11.6% |
| 30 to 34 Minutes | 52 | 17.7% |
| 35 to 39 Minutes | 0 | 0.0% |
| 40 to 44 Minutes | 0 | 0.0% |
| 45 to 59 Minutes | 24 | 8.2% |
| 60 to 89 Minutes | 6 | 2.1% |
| 90 or more Minutes | 27 | 9.2% |
Commute Time by Sex in Mount Morris
The most common commute times in Mount Morris are 20 to 24 minutes (30 commuters, 17.5%) for males and 20 to 24 minutes (52 commuters, 42.6%) for females.
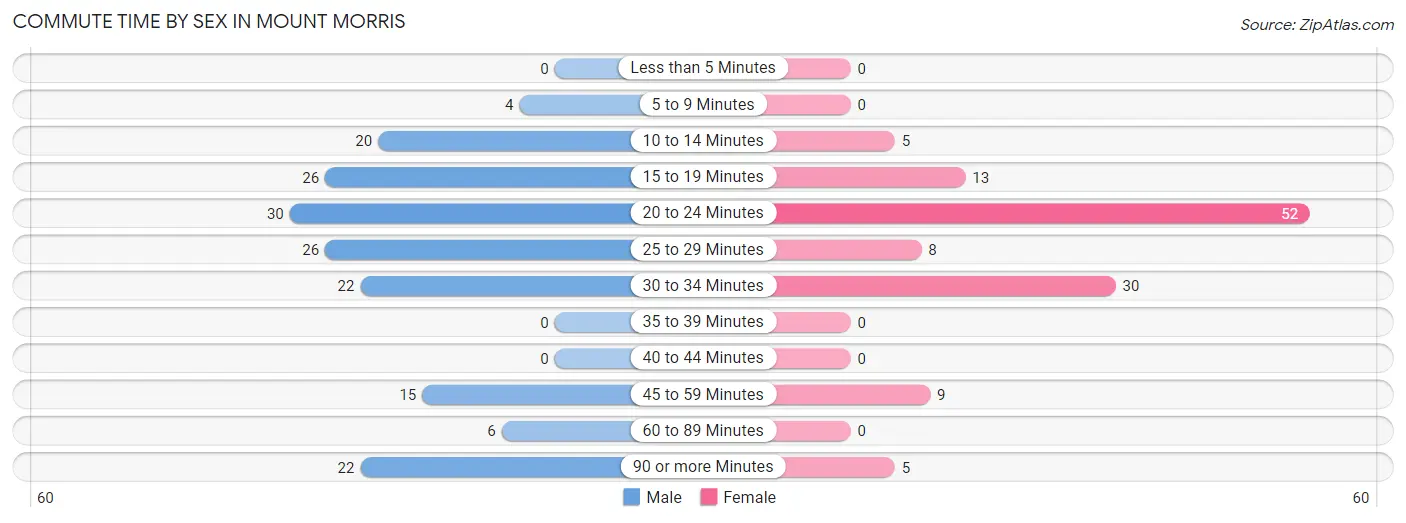
| Commute Time | Male | Female |
| Less than 5 Minutes | 0 (0.0%) | 0 (0.0%) |
| 5 to 9 Minutes | 4 (2.3%) | 0 (0.0%) |
| 10 to 14 Minutes | 20 (11.7%) | 5 (4.1%) |
| 15 to 19 Minutes | 26 (15.2%) | 13 (10.7%) |
| 20 to 24 Minutes | 30 (17.5%) | 52 (42.6%) |
| 25 to 29 Minutes | 26 (15.2%) | 8 (6.6%) |
| 30 to 34 Minutes | 22 (12.9%) | 30 (24.6%) |
| 35 to 39 Minutes | 0 (0.0%) | 0 (0.0%) |
| 40 to 44 Minutes | 0 (0.0%) | 0 (0.0%) |
| 45 to 59 Minutes | 15 (8.8%) | 9 (7.4%) |
| 60 to 89 Minutes | 6 (3.5%) | 0 (0.0%) |
| 90 or more Minutes | 22 (12.9%) | 5 (4.1%) |
Time of Departure to Work by Sex in Mount Morris
The most frequent times of departure to work in Mount Morris are 6:00 AM to 6:29 AM (58, 33.9%) for males and 7:30 AM to 7:59 AM (23, 18.9%) for females.
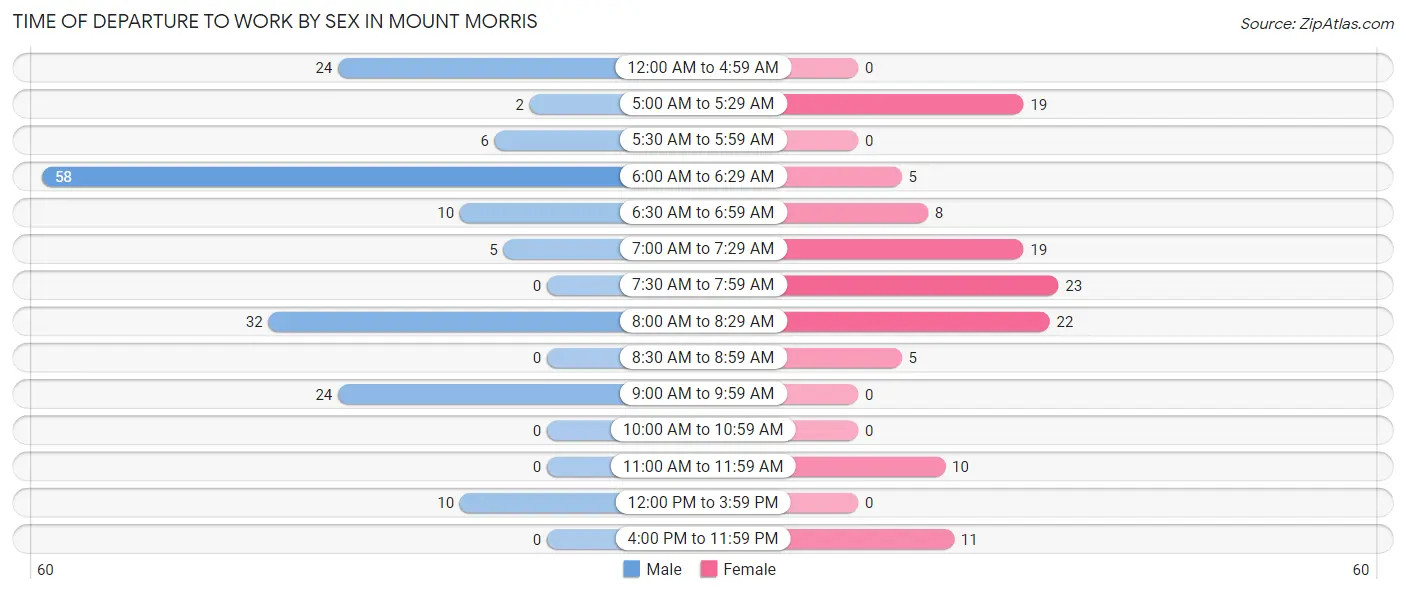
| Time of Departure | Male | Female |
| 12:00 AM to 4:59 AM | 24 (14.0%) | 0 (0.0%) |
| 5:00 AM to 5:29 AM | 2 (1.2%) | 19 (15.6%) |
| 5:30 AM to 5:59 AM | 6 (3.5%) | 0 (0.0%) |
| 6:00 AM to 6:29 AM | 58 (33.9%) | 5 (4.1%) |
| 6:30 AM to 6:59 AM | 10 (5.9%) | 8 (6.6%) |
| 7:00 AM to 7:29 AM | 5 (2.9%) | 19 (15.6%) |
| 7:30 AM to 7:59 AM | 0 (0.0%) | 23 (18.9%) |
| 8:00 AM to 8:29 AM | 32 (18.7%) | 22 (18.0%) |
| 8:30 AM to 8:59 AM | 0 (0.0%) | 5 (4.1%) |
| 9:00 AM to 9:59 AM | 24 (14.0%) | 0 (0.0%) |
| 10:00 AM to 10:59 AM | 0 (0.0%) | 0 (0.0%) |
| 11:00 AM to 11:59 AM | 0 (0.0%) | 10 (8.2%) |
| 12:00 PM to 3:59 PM | 10 (5.9%) | 0 (0.0%) |
| 4:00 PM to 11:59 PM | 0 (0.0%) | 11 (9.0%) |
| Total | 171 (100.0%) | 122 (100.0%) |
Housing Occupancy in Mount Morris
Occupancy by Ownership in Mount Morris
Of the total 314 dwellings in Mount Morris, owner-occupied units account for 215 (68.5%), while renter-occupied units make up 99 (31.5%).
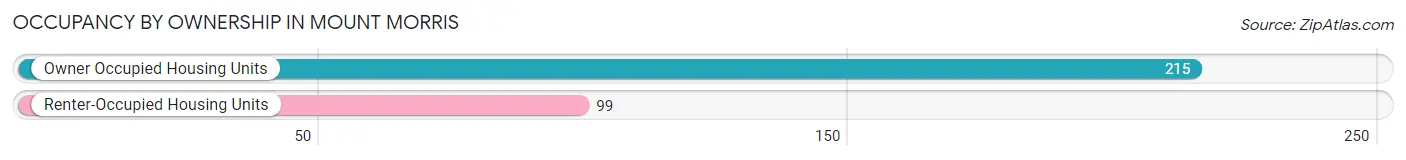
| Occupancy | # Housing Units | % Housing Units |
| Owner Occupied Housing Units | 215 | 68.5% |
| Renter-Occupied Housing Units | 99 | 31.5% |
| Total Occupied Housing Units | 314 | 100.0% |
Occupancy by Household Size in Mount Morris
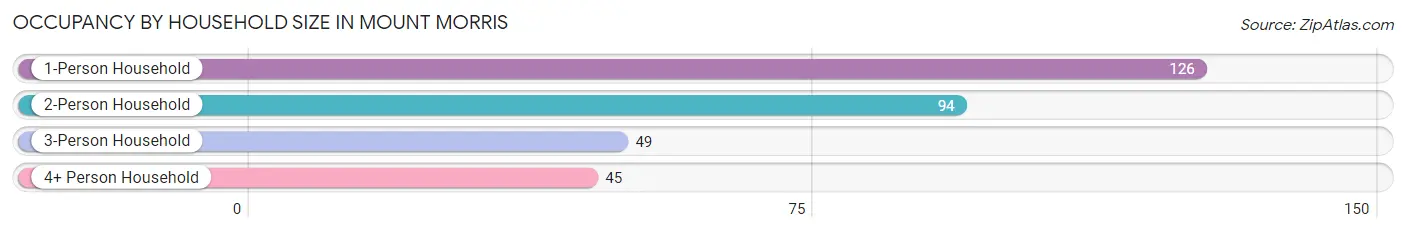
| Household Size | # Housing Units | % Housing Units |
| 1-Person Household | 126 | 40.1% |
| 2-Person Household | 94 | 29.9% |
| 3-Person Household | 49 | 15.6% |
| 4+ Person Household | 45 | 14.3% |
| Total Housing Units | 314 | 100.0% |
Occupancy by Ownership by Household Size in Mount Morris
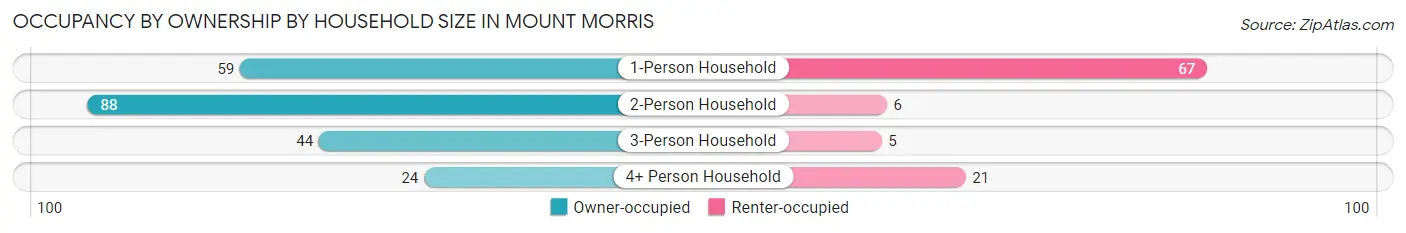
| Household Size | Owner-occupied | Renter-occupied |
| 1-Person Household | 59 (46.8%) | 67 (53.2%) |
| 2-Person Household | 88 (93.6%) | 6 (6.4%) |
| 3-Person Household | 44 (89.8%) | 5 (10.2%) |
| 4+ Person Household | 24 (53.3%) | 21 (46.7%) |
| Total Housing Units | 215 (68.5%) | 99 (31.5%) |
Occupancy by Educational Attainment in Mount Morris
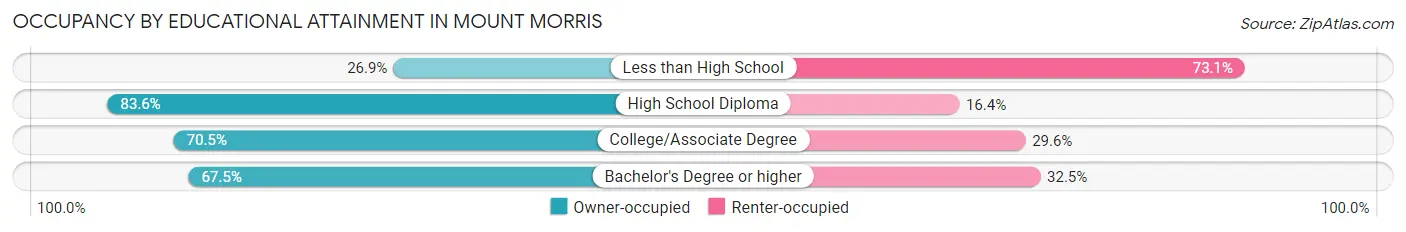
| Household Size | Owner-occupied | Renter-occupied |
| Less than High School | 14 (26.9%) | 38 (73.1%) |
| High School Diploma | 112 (83.6%) | 22 (16.4%) |
| College/Associate Degree | 62 (70.5%) | 26 (29.5%) |
| Bachelor's Degree or higher | 27 (67.5%) | 13 (32.5%) |
Occupancy by Age of Householder in Mount Morris
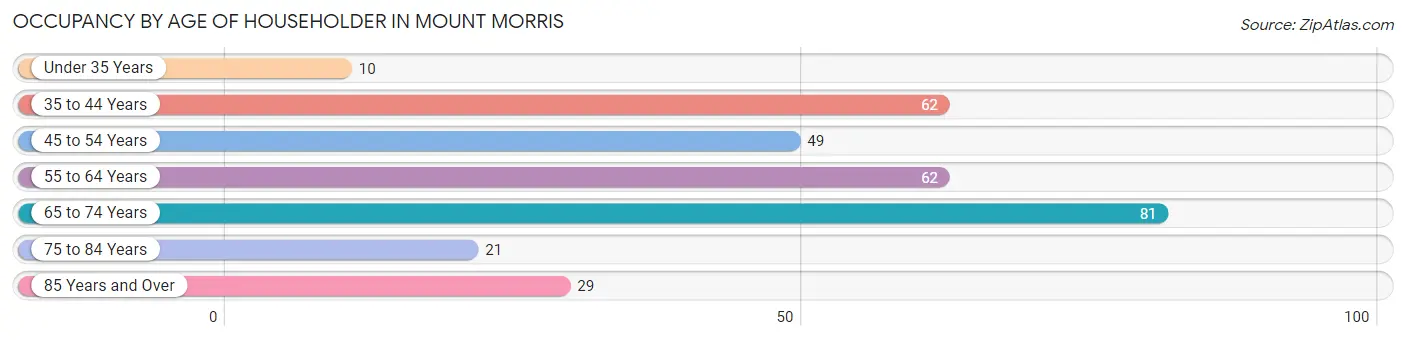
| Age Bracket | # Households | % Households |
| Under 35 Years | 10 | 3.2% |
| 35 to 44 Years | 62 | 19.8% |
| 45 to 54 Years | 49 | 15.6% |
| 55 to 64 Years | 62 | 19.8% |
| 65 to 74 Years | 81 | 25.8% |
| 75 to 84 Years | 21 | 6.7% |
| 85 Years and Over | 29 | 9.2% |
| Total | 314 | 100.0% |
Housing Finances in Mount Morris
Median Income by Occupancy in Mount Morris
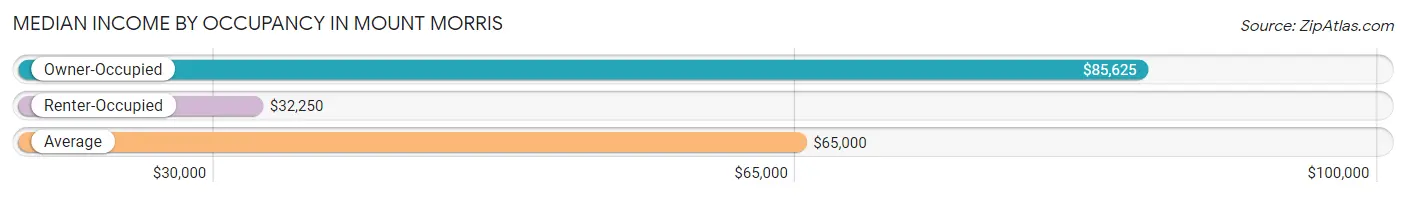
| Occupancy Type | # Households | Median Income |
| Owner-Occupied | 215 (68.5%) | $85,625 |
| Renter-Occupied | 99 (31.5%) | $32,250 |
| Average | 314 (100.0%) | $65,000 |
Occupancy by Householder Income Bracket in Mount Morris
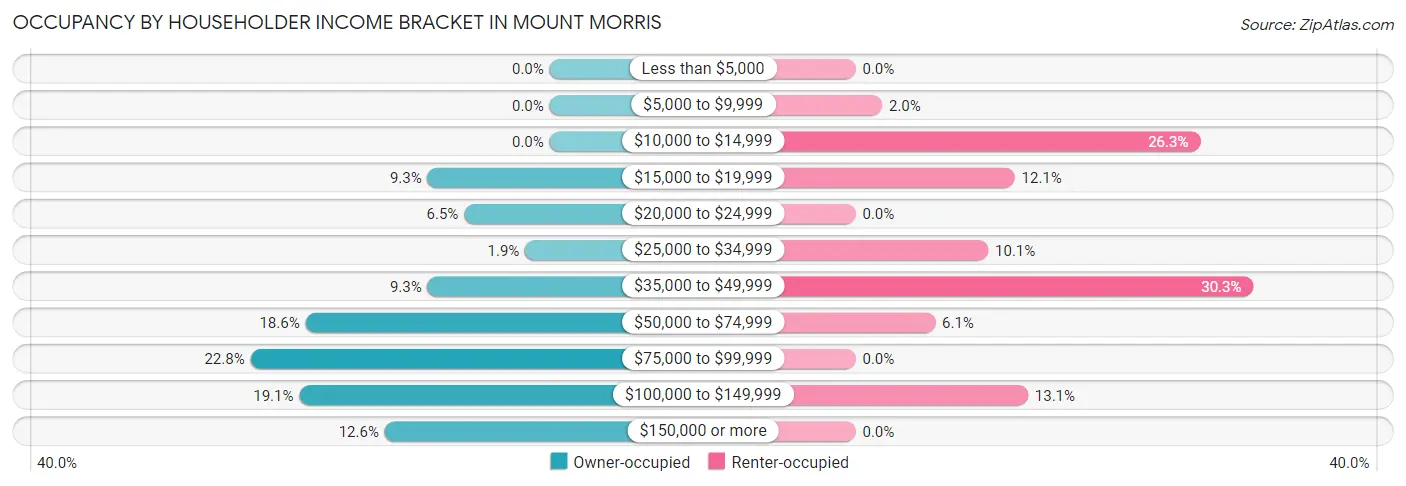
| Income Bracket | Owner-occupied | Renter-occupied |
| Less than $5,000 | 0 (0.0%) | 0 (0.0%) |
| $5,000 to $9,999 | 0 (0.0%) | 2 (2.0%) |
| $10,000 to $14,999 | 0 (0.0%) | 26 (26.3%) |
| $15,000 to $19,999 | 20 (9.3%) | 12 (12.1%) |
| $20,000 to $24,999 | 14 (6.5%) | 0 (0.0%) |
| $25,000 to $34,999 | 4 (1.9%) | 10 (10.1%) |
| $35,000 to $49,999 | 20 (9.3%) | 30 (30.3%) |
| $50,000 to $74,999 | 40 (18.6%) | 6 (6.1%) |
| $75,000 to $99,999 | 49 (22.8%) | 0 (0.0%) |
| $100,000 to $149,999 | 41 (19.1%) | 13 (13.1%) |
| $150,000 or more | 27 (12.6%) | 0 (0.0%) |
| Total | 215 (100.0%) | 99 (100.0%) |
Monthly Housing Cost Tiers in Mount Morris
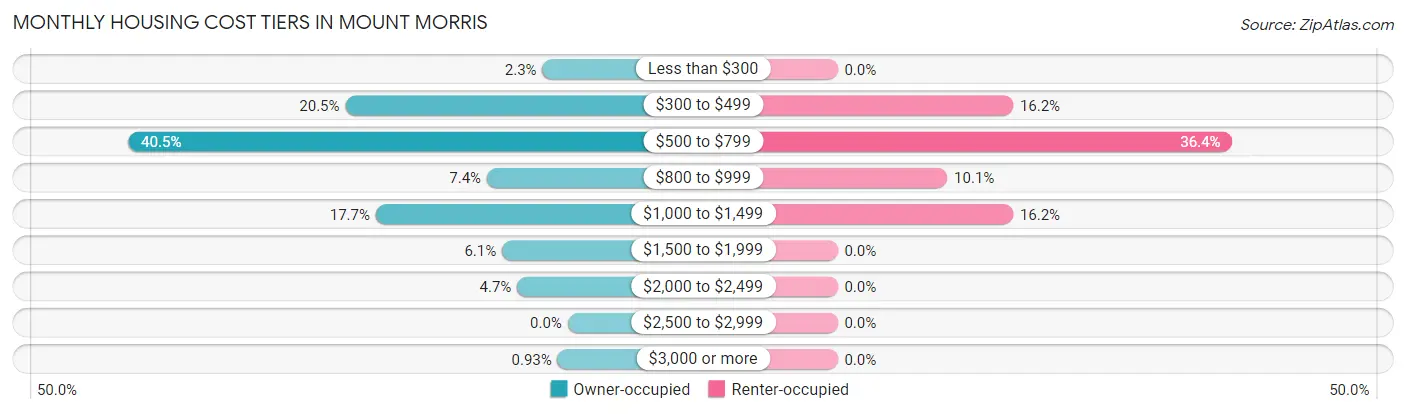
| Monthly Cost | Owner-occupied | Renter-occupied |
| Less than $300 | 5 (2.3%) | 0 (0.0%) |
| $300 to $499 | 44 (20.5%) | 16 (16.2%) |
| $500 to $799 | 87 (40.5%) | 36 (36.4%) |
| $800 to $999 | 16 (7.4%) | 10 (10.1%) |
| $1,000 to $1,499 | 38 (17.7%) | 16 (16.2%) |
| $1,500 to $1,999 | 13 (6.0%) | 0 (0.0%) |
| $2,000 to $2,499 | 10 (4.6%) | 0 (0.0%) |
| $2,500 to $2,999 | 0 (0.0%) | 0 (0.0%) |
| $3,000 or more | 2 (0.9%) | 0 (0.0%) |
| Total | 215 (100.0%) | 99 (100.0%) |
Physical Housing Characteristics in Mount Morris
Housing Structures in Mount Morris
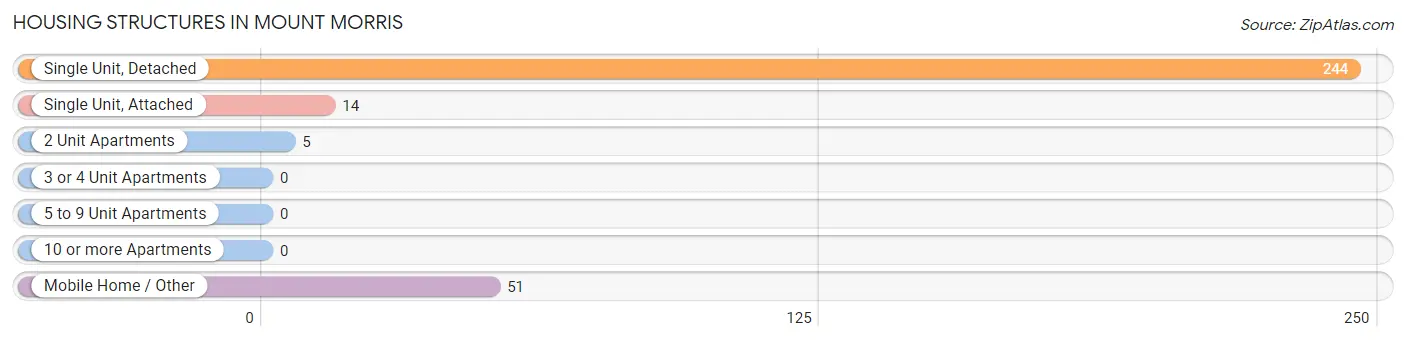
| Structure Type | # Housing Units | % Housing Units |
| Single Unit, Detached | 244 | 77.7% |
| Single Unit, Attached | 14 | 4.5% |
| 2 Unit Apartments | 5 | 1.6% |
| 3 or 4 Unit Apartments | 0 | 0.0% |
| 5 to 9 Unit Apartments | 0 | 0.0% |
| 10 or more Apartments | 0 | 0.0% |
| Mobile Home / Other | 51 | 16.2% |
| Total | 314 | 100.0% |
Housing Structures by Occupancy in Mount Morris
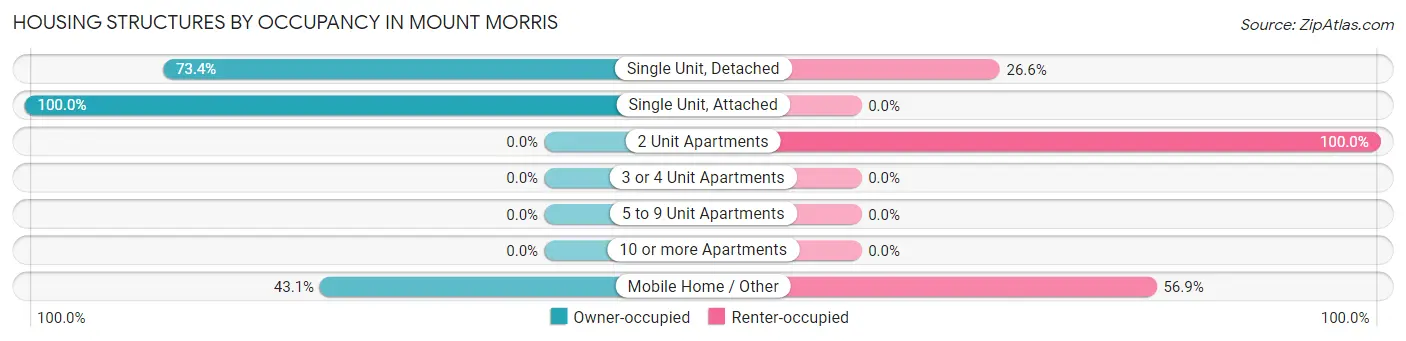
| Structure Type | Owner-occupied | Renter-occupied |
| Single Unit, Detached | 179 (73.4%) | 65 (26.6%) |
| Single Unit, Attached | 14 (100.0%) | 0 (0.0%) |
| 2 Unit Apartments | 0 (0.0%) | 5 (100.0%) |
| 3 or 4 Unit Apartments | 0 (0.0%) | 0 (0.0%) |
| 5 to 9 Unit Apartments | 0 (0.0%) | 0 (0.0%) |
| 10 or more Apartments | 0 (0.0%) | 0 (0.0%) |
| Mobile Home / Other | 22 (43.1%) | 29 (56.9%) |
| Total | 215 (68.5%) | 99 (31.5%) |
Housing Structures by Number of Rooms in Mount Morris
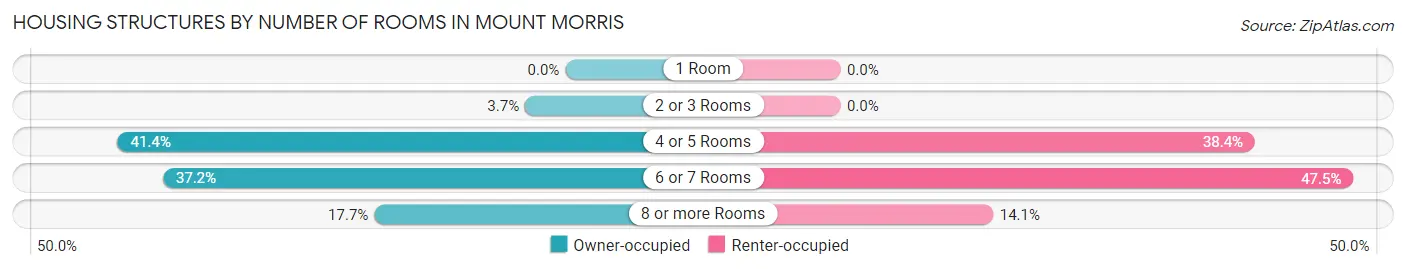
| Number of Rooms | Owner-occupied | Renter-occupied |
| 1 Room | 0 (0.0%) | 0 (0.0%) |
| 2 or 3 Rooms | 8 (3.7%) | 0 (0.0%) |
| 4 or 5 Rooms | 89 (41.4%) | 38 (38.4%) |
| 6 or 7 Rooms | 80 (37.2%) | 47 (47.5%) |
| 8 or more Rooms | 38 (17.7%) | 14 (14.1%) |
| Total | 215 (100.0%) | 99 (100.0%) |
Housing Structure by Heating Type in Mount Morris
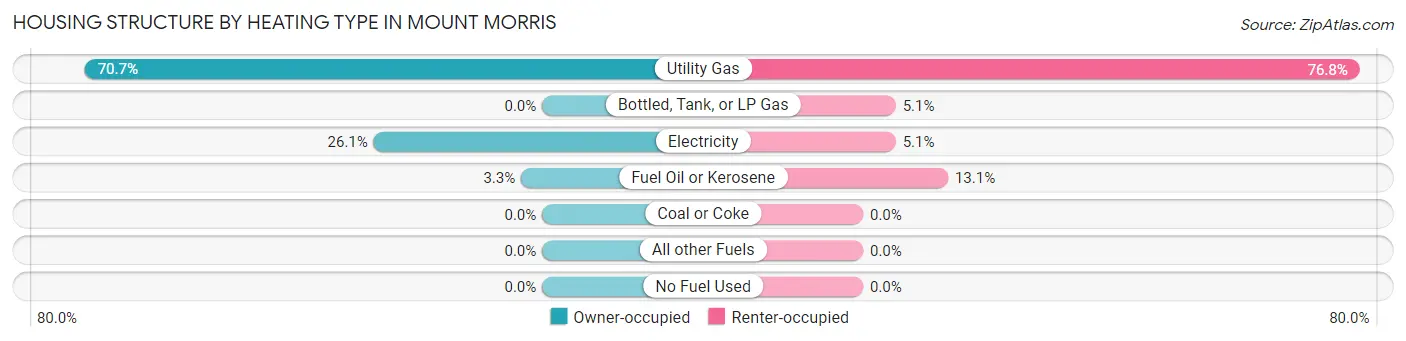
| Heating Type | Owner-occupied | Renter-occupied |
| Utility Gas | 152 (70.7%) | 76 (76.8%) |
| Bottled, Tank, or LP Gas | 0 (0.0%) | 5 (5.1%) |
| Electricity | 56 (26.1%) | 5 (5.1%) |
| Fuel Oil or Kerosene | 7 (3.3%) | 13 (13.1%) |
| Coal or Coke | 0 (0.0%) | 0 (0.0%) |
| All other Fuels | 0 (0.0%) | 0 (0.0%) |
| No Fuel Used | 0 (0.0%) | 0 (0.0%) |
| Total | 215 (100.0%) | 99 (100.0%) |
Household Vehicle Usage in Mount Morris
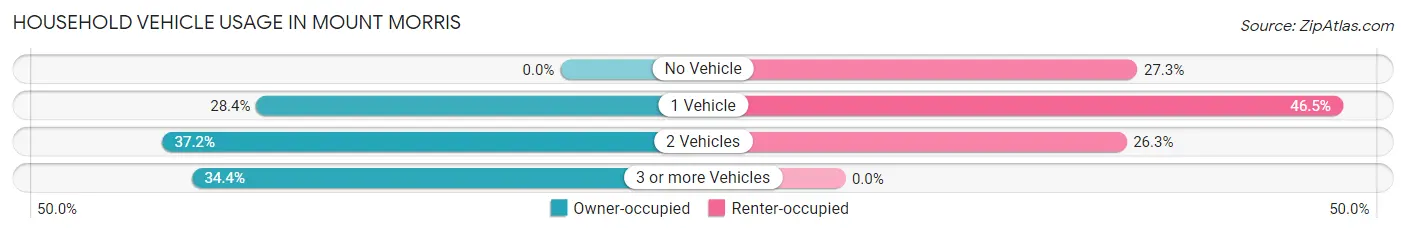
| Vehicles per Household | Owner-occupied | Renter-occupied |
| No Vehicle | 0 (0.0%) | 27 (27.3%) |
| 1 Vehicle | 61 (28.4%) | 46 (46.5%) |
| 2 Vehicles | 80 (37.2%) | 26 (26.3%) |
| 3 or more Vehicles | 74 (34.4%) | 0 (0.0%) |
| Total | 215 (100.0%) | 99 (100.0%) |
Real Estate & Mortgages in Mount Morris
Real Estate and Mortgage Overview in Mount Morris
| Characteristic | Without Mortgage | With Mortgage |
| Housing Units | 121 | 94 |
| Median Property Value | $190,500 | $176,500 |
| Median Household Income | $85,089 | $24 |
| Monthly Housing Costs | $529 | $2 |
| Real Estate Taxes | $1,950 | $0 |
Property Value by Mortgage Status in Mount Morris
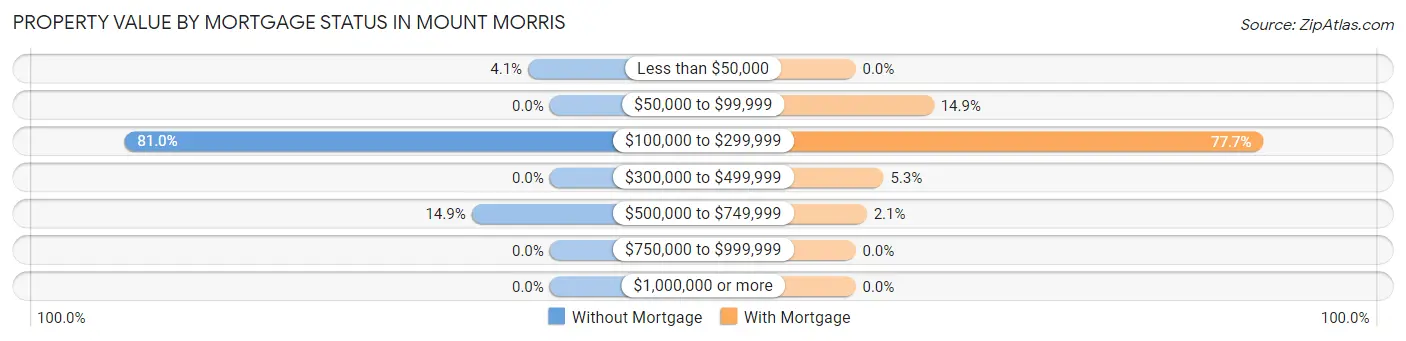
| Property Value | Without Mortgage | With Mortgage |
| Less than $50,000 | 5 (4.1%) | 0 (0.0%) |
| $50,000 to $99,999 | 0 (0.0%) | 14 (14.9%) |
| $100,000 to $299,999 | 98 (81.0%) | 73 (77.7%) |
| $300,000 to $499,999 | 0 (0.0%) | 5 (5.3%) |
| $500,000 to $749,999 | 18 (14.9%) | 2 (2.1%) |
| $750,000 to $999,999 | 0 (0.0%) | 0 (0.0%) |
| $1,000,000 or more | 0 (0.0%) | 0 (0.0%) |
| Total | 121 (100.0%) | 94 (100.0%) |
Household Income by Mortgage Status in Mount Morris
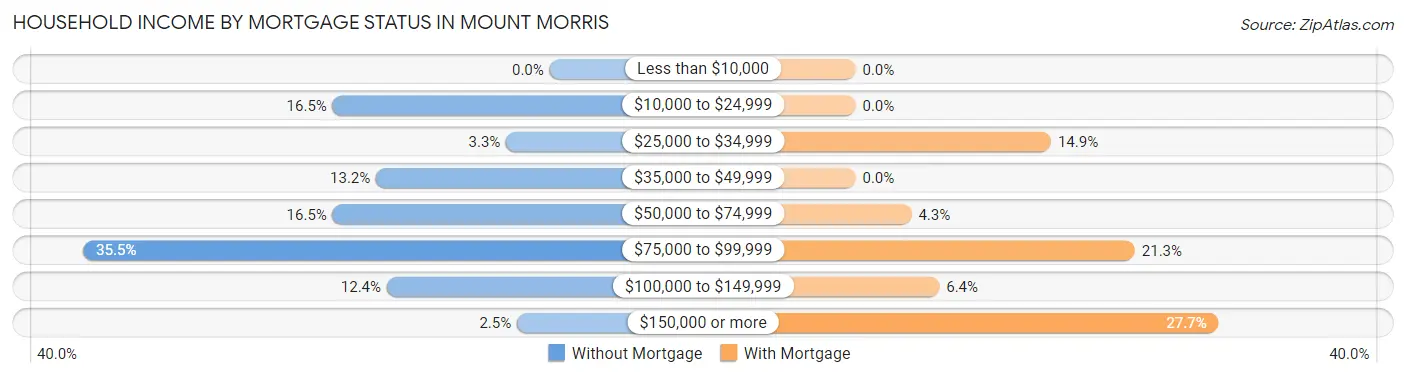
| Household Income | Without Mortgage | With Mortgage |
| Less than $10,000 | 0 (0.0%) | 0 (0.0%) |
| $10,000 to $24,999 | 20 (16.5%) | 0 (0.0%) |
| $25,000 to $34,999 | 4 (3.3%) | 14 (14.9%) |
| $35,000 to $49,999 | 16 (13.2%) | 0 (0.0%) |
| $50,000 to $74,999 | 20 (16.5%) | 4 (4.3%) |
| $75,000 to $99,999 | 43 (35.5%) | 20 (21.3%) |
| $100,000 to $149,999 | 15 (12.4%) | 6 (6.4%) |
| $150,000 or more | 3 (2.5%) | 26 (27.7%) |
| Total | 121 (100.0%) | 94 (100.0%) |
Property Value to Household Income Ratio in Mount Morris
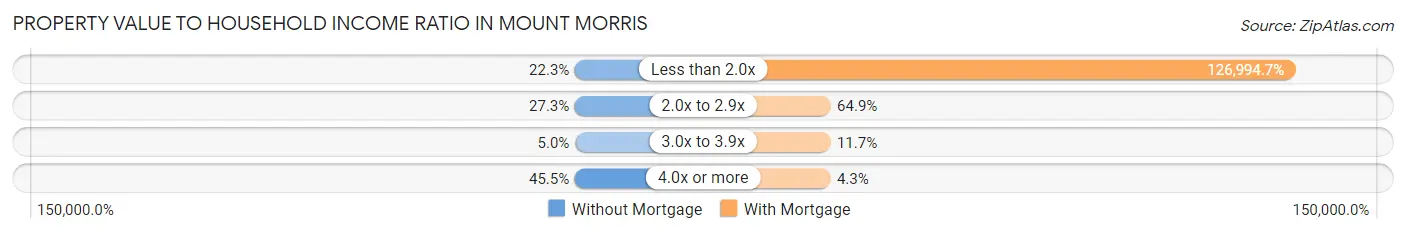
| Value-to-Income Ratio | Without Mortgage | With Mortgage |
| Less than 2.0x | 27 (22.3%) | 119,375 (126,994.7%) |
| 2.0x to 2.9x | 33 (27.3%) | 61 (64.9%) |
| 3.0x to 3.9x | 6 (5.0%) | 11 (11.7%) |
| 4.0x or more | 55 (45.5%) | 4 (4.3%) |
| Total | 121 (100.0%) | 94 (100.0%) |
Real Estate Taxes by Mortgage Status in Mount Morris
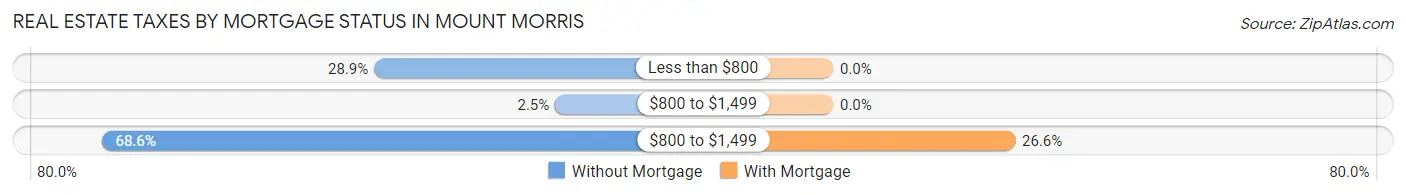
| Property Taxes | Without Mortgage | With Mortgage |
| Less than $800 | 35 (28.9%) | 0 (0.0%) |
| $800 to $1,499 | 3 (2.5%) | 0 (0.0%) |
| $800 to $1,499 | 83 (68.6%) | 25 (26.6%) |
| Total | 121 (100.0%) | 94 (100.0%) |
Health & Disability in Mount Morris
Health Insurance Coverage by Age in Mount Morris
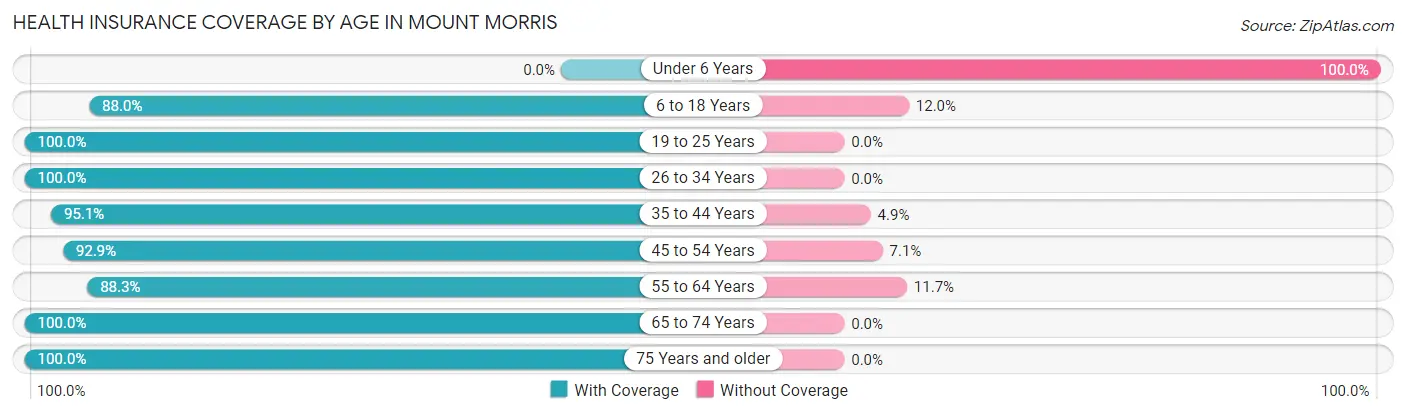
| Age Bracket | With Coverage | Without Coverage |
| Under 6 Years | 0 (0.0%) | 7 (100.0%) |
| 6 to 18 Years | 95 (88.0%) | 13 (12.0%) |
| 19 to 25 Years | 41 (100.0%) | 0 (0.0%) |
| 26 to 34 Years | 55 (100.0%) | 0 (0.0%) |
| 35 to 44 Years | 116 (95.1%) | 6 (4.9%) |
| 45 to 54 Years | 65 (92.9%) | 5 (7.1%) |
| 55 to 64 Years | 121 (88.3%) | 16 (11.7%) |
| 65 to 74 Years | 98 (100.0%) | 0 (0.0%) |
| 75 Years and older | 50 (100.0%) | 0 (0.0%) |
| Total | 641 (93.2%) | 47 (6.8%) |
Health Insurance Coverage by Citizenship Status in Mount Morris
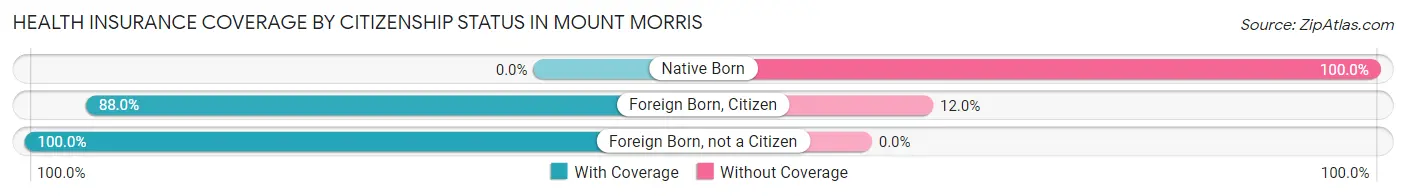
| Citizenship Status | With Coverage | Without Coverage |
| Native Born | 0 (0.0%) | 7 (100.0%) |
| Foreign Born, Citizen | 95 (88.0%) | 13 (12.0%) |
| Foreign Born, not a Citizen | 41 (100.0%) | 0 (0.0%) |
Health Insurance Coverage by Household Income in Mount Morris
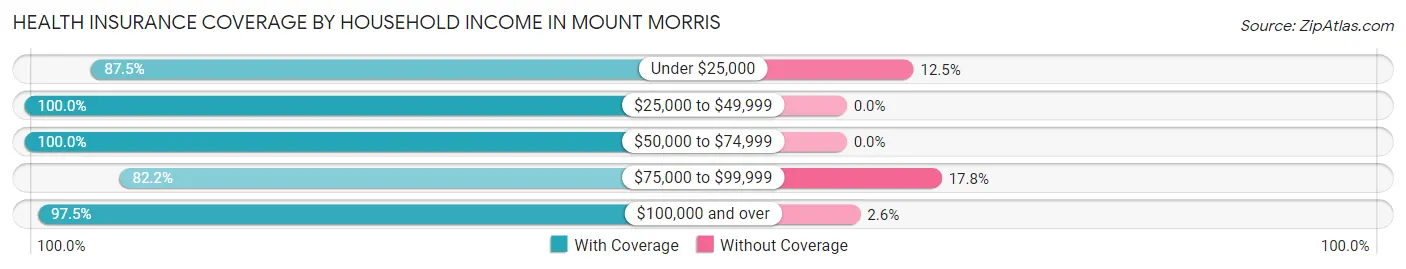
| Household Income | With Coverage | Without Coverage |
| Under $25,000 | 91 (87.5%) | 13 (12.5%) |
| $25,000 to $49,999 | 152 (100.0%) | 0 (0.0%) |
| $50,000 to $74,999 | 73 (100.0%) | 0 (0.0%) |
| $75,000 to $99,999 | 134 (82.2%) | 29 (17.8%) |
| $100,000 and over | 191 (97.5%) | 5 (2.5%) |
Public vs Private Health Insurance Coverage by Age in Mount Morris
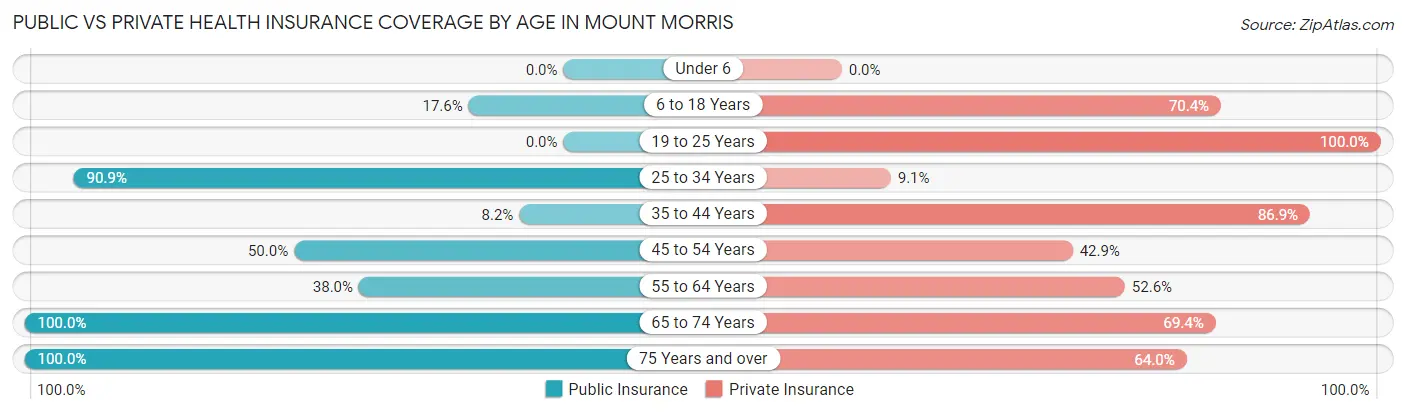
| Age Bracket | Public Insurance | Private Insurance |
| Under 6 | 0 (0.0%) | 0 (0.0%) |
| 6 to 18 Years | 19 (17.6%) | 76 (70.4%) |
| 19 to 25 Years | 0 (0.0%) | 41 (100.0%) |
| 25 to 34 Years | 50 (90.9%) | 5 (9.1%) |
| 35 to 44 Years | 10 (8.2%) | 106 (86.9%) |
| 45 to 54 Years | 35 (50.0%) | 30 (42.9%) |
| 55 to 64 Years | 52 (38.0%) | 72 (52.5%) |
| 65 to 74 Years | 98 (100.0%) | 68 (69.4%) |
| 75 Years and over | 50 (100.0%) | 32 (64.0%) |
| Total | 314 (45.6%) | 430 (62.5%) |
Disability Status by Sex by Age in Mount Morris
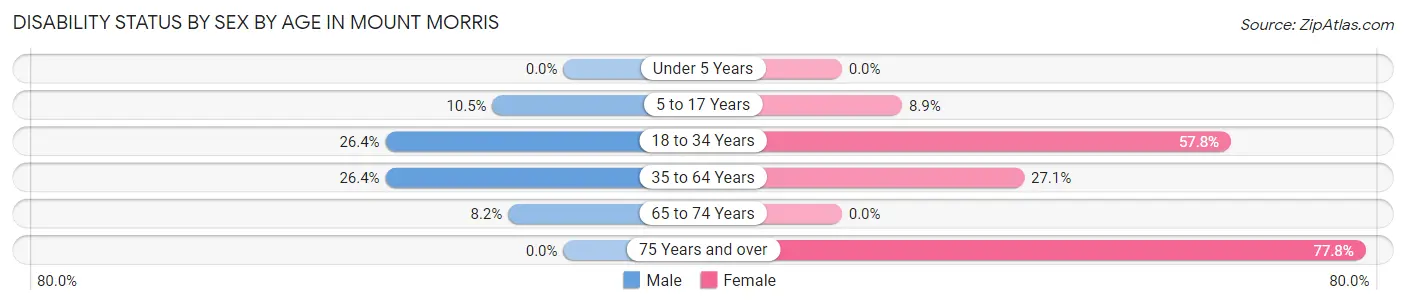
| Age Bracket | Male | Female |
| Under 5 Years | 0 (0.0%) | 0 (0.0%) |
| 5 to 17 Years | 6 (10.5%) | 5 (8.9%) |
| 18 to 34 Years | 14 (26.4%) | 26 (57.8%) |
| 35 to 64 Years | 42 (26.4%) | 46 (27.1%) |
| 65 to 74 Years | 5 (8.2%) | 0 (0.0%) |
| 75 Years and over | 0 (0.0%) | 28 (77.8%) |
Disability Class by Sex by Age in Mount Morris
Disability Class: Hearing Difficulty
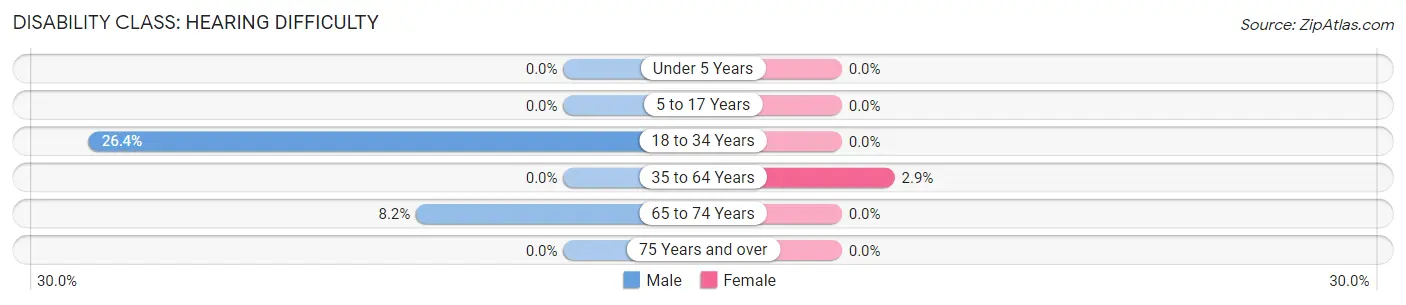
| Age Bracket | Male | Female |
| Under 5 Years | 0 (0.0%) | 0 (0.0%) |
| 5 to 17 Years | 0 (0.0%) | 0 (0.0%) |
| 18 to 34 Years | 14 (26.4%) | 0 (0.0%) |
| 35 to 64 Years | 0 (0.0%) | 5 (2.9%) |
| 65 to 74 Years | 5 (8.2%) | 0 (0.0%) |
| 75 Years and over | 0 (0.0%) | 0 (0.0%) |
Disability Class: Vision Difficulty
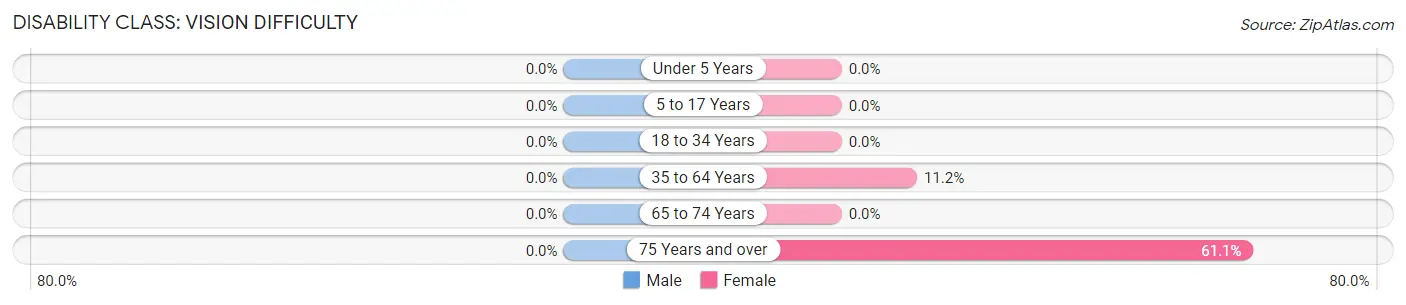
| Age Bracket | Male | Female |
| Under 5 Years | 0 (0.0%) | 0 (0.0%) |
| 5 to 17 Years | 0 (0.0%) | 0 (0.0%) |
| 18 to 34 Years | 0 (0.0%) | 0 (0.0%) |
| 35 to 64 Years | 0 (0.0%) | 19 (11.2%) |
| 65 to 74 Years | 0 (0.0%) | 0 (0.0%) |
| 75 Years and over | 0 (0.0%) | 22 (61.1%) |
Disability Class: Cognitive Difficulty
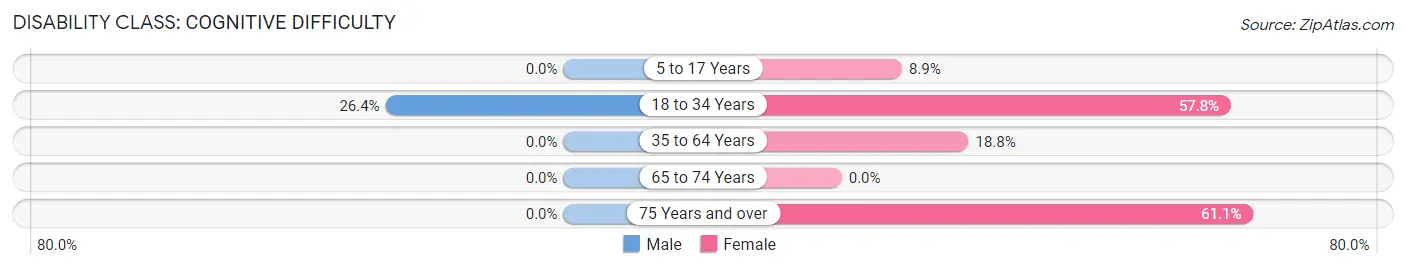
| Age Bracket | Male | Female |
| 5 to 17 Years | 0 (0.0%) | 5 (8.9%) |
| 18 to 34 Years | 14 (26.4%) | 26 (57.8%) |
| 35 to 64 Years | 0 (0.0%) | 32 (18.8%) |
| 65 to 74 Years | 0 (0.0%) | 0 (0.0%) |
| 75 Years and over | 0 (0.0%) | 22 (61.1%) |
Disability Class: Ambulatory Difficulty
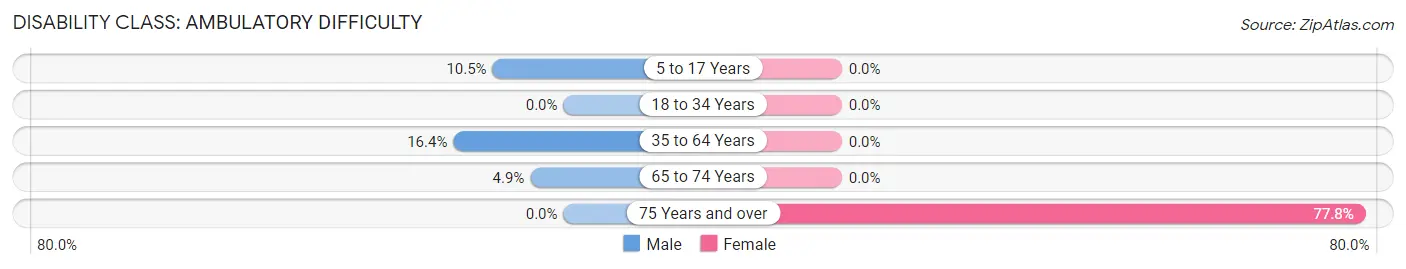
| Age Bracket | Male | Female |
| 5 to 17 Years | 6 (10.5%) | 0 (0.0%) |
| 18 to 34 Years | 0 (0.0%) | 0 (0.0%) |
| 35 to 64 Years | 26 (16.4%) | 0 (0.0%) |
| 65 to 74 Years | 3 (4.9%) | 0 (0.0%) |
| 75 Years and over | 0 (0.0%) | 28 (77.8%) |
Disability Class: Self-Care Difficulty
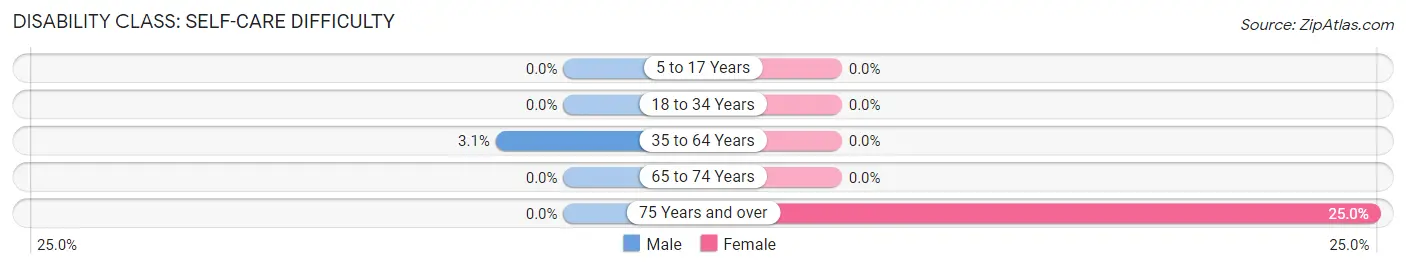
| Age Bracket | Male | Female |
| 5 to 17 Years | 0 (0.0%) | 0 (0.0%) |
| 18 to 34 Years | 0 (0.0%) | 0 (0.0%) |
| 35 to 64 Years | 5 (3.1%) | 0 (0.0%) |
| 65 to 74 Years | 0 (0.0%) | 0 (0.0%) |
| 75 Years and over | 0 (0.0%) | 9 (25.0%) |
Technology Access in Mount Morris
Computing Device Access in Mount Morris
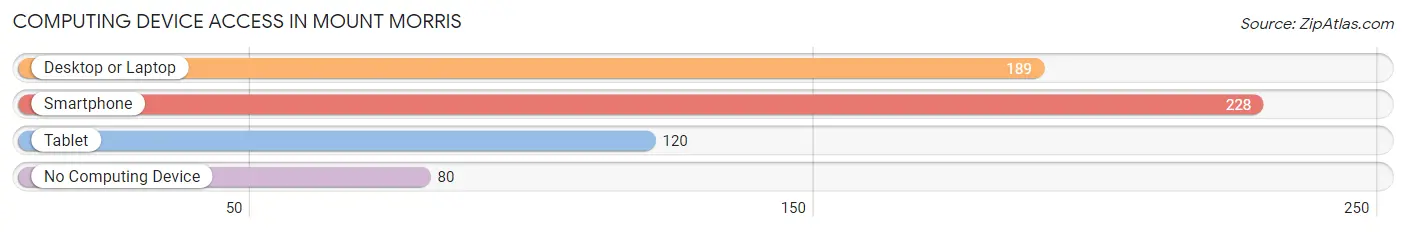
| Device Type | # Households | % Households |
| Desktop or Laptop | 189 | 60.2% |
| Smartphone | 228 | 72.6% |
| Tablet | 120 | 38.2% |
| No Computing Device | 80 | 25.5% |
| Total | 314 | 100.0% |
Internet Access in Mount Morris
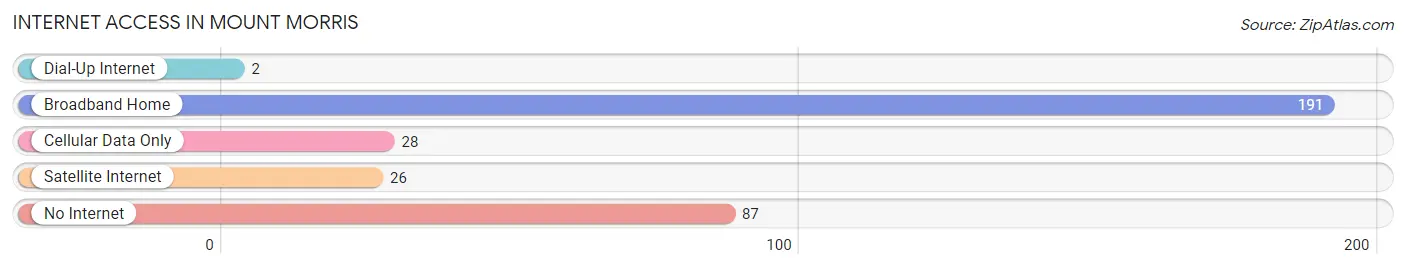
| Internet Type | # Households | % Households |
| Dial-Up Internet | 2 | 0.6% |
| Broadband Home | 191 | 60.8% |
| Cellular Data Only | 28 | 8.9% |
| Satellite Internet | 26 | 8.3% |
| No Internet | 87 | 27.7% |
| Total | 314 | 100.0% |
Mount Morris Summary
History
Mount Morris is a small borough located in Greene County, Pennsylvania. It is situated in the southwestern corner of the state, approximately 40 miles south of Pittsburgh. The borough was founded in 1845 and was named after the nearby mountain, Mount Morris. The area was originally inhabited by the Monongahela Indians, who were later displaced by European settlers.
The first settlers in the area were mostly of German and Scotch-Irish descent. They were attracted to the area due to its abundance of natural resources, such as timber and coal. The first coal mine in the area was opened in 1845, and the first post office was established in 1848.
The borough was officially incorporated in 1872. During this time, the population of the borough grew rapidly, reaching a peak of 1,500 in the early 1900s. The economy of the borough was largely based on coal mining and timber harvesting.
In the early 1900s, the borough began to experience a decline in population due to the decline of the coal industry. This decline continued until the 1950s, when the population of the borough began to slowly increase again.
Geography
Mount Morris is located in southwestern Pennsylvania, approximately 40 miles south of Pittsburgh. The borough is situated in the foothills of the Allegheny Mountains, and is surrounded by rolling hills and forests. The borough is located in the Monongahela River Valley, and is bordered by the towns of Waynesburg, Carmichaels, and Jefferson.
The borough has a total area of 0.7 square miles, all of which is land. The borough is located at an elevation of 1,400 feet above sea level. The climate of the borough is classified as humid continental, with cold winters and hot, humid summers.
Economy
The economy of Mount Morris is largely based on agriculture and tourism. The borough is home to several small farms, which produce a variety of crops, including corn, soybeans, and hay. The borough is also home to several small businesses, including restaurants, retail stores, and service providers.
The borough is also a popular tourist destination, due to its proximity to the Allegheny Mountains and its abundance of outdoor recreational activities. The borough is home to several parks, including the Mount Morris Dam and Recreation Area, which offers camping, fishing, and boating opportunities.
Demographics
As of the 2010 census, the population of Mount Morris was 1,093. The racial makeup of the borough was 97.3% White, 0.9% African American, 0.2% Native American, 0.2% Asian, and 1.4% from other races. The median household income in the borough was $37,917, and the median family income was $45,313.
The population of the borough is largely Christian, with the majority of residents belonging to the Roman Catholic Church. The borough is also home to a small Jewish community. The borough is served by the Mount Morris Area School District, which consists of one elementary school, one middle school, and one high school.
Common Questions
What is the Total Population of Mount Morris?
Total Population of Mount Morris is 688.
What is the Total Male Population of Mount Morris?
Total Male Population of Mount Morris is 344.
What is the Total Female Population of Mount Morris?
Total Female Population of Mount Morris is 344.
What is the Ratio of Males per 100 Females in Mount Morris?
There are 100.00 Males per 100 Females in Mount Morris.
What is the Ratio of Females per 100 Males in Mount Morris?
There are 100.00 Females per 100 Males in Mount Morris.
What is the Median Population Age in Mount Morris?
Median Population Age in Mount Morris is 46.5 Years.
What is the Average Family Size in Mount Morris
Average Family Size in Mount Morris is 3.0 People.
What is the Average Household Size in Mount Morris
Average Household Size in Mount Morris is 2.2 People.
What is Per Capita Income in Mount Morris?
Per Capita income in Mount Morris is $33,342.
What is the Median Family Income in Mount Morris?
Median Family Income in Mount Morris is $69,231.
What is the Median Household income in Mount Morris?
Median Household Income in Mount Morris is $65,000.
What is Income or Wage Gap in Mount Morris?
Income or Wage Gap in Mount Morris is 12.4%.
Women in Mount Morris earn 87.6 cents for every dollar earned by a man.
What is Inequality or Gini Index in Mount Morris?
Inequality or Gini Index in Mount Morris is 0.39.
How Large is the Labor Force in Mount Morris?
There are 306 People in the Labor Forcein in Mount Morris.
What is the Percentage of People in the Labor Force in Mount Morris?
51.8% of People are in the Labor Force in Mount Morris.
What is the Unemployment Rate in Mount Morris?
Unemployment Rate in Mount Morris is 2.0%.