Roscoe borough, PA
Roscoe borough Overview
617
TOTAL POPULATION
284
MALE POPULATION
333
FEMALE POPULATION
85.29
MALES / 100 FEMALES
117.25
FEMALES / 100 MALES
39.3
MEDIAN AGE
3.3
AVG FAMILY SIZE
2.2
AVG HOUSEHOLD SIZE
$30,984
PER CAPITA INCOME
$66,875
AVG FAMILY INCOME
$57,455
AVG HOUSEHOLD INCOME
47.0%
WAGE / INCOME GAP [ % ]
53.0¢/ $1
WAGE / INCOME GAP [ $ ]
0.36
INEQUALITY / GINI INDEX
316
LABOR FORCE [ PEOPLE ]
63.2%
PERCENT IN LABOR FORCE
3.8%
UNEMPLOYMENT RATE
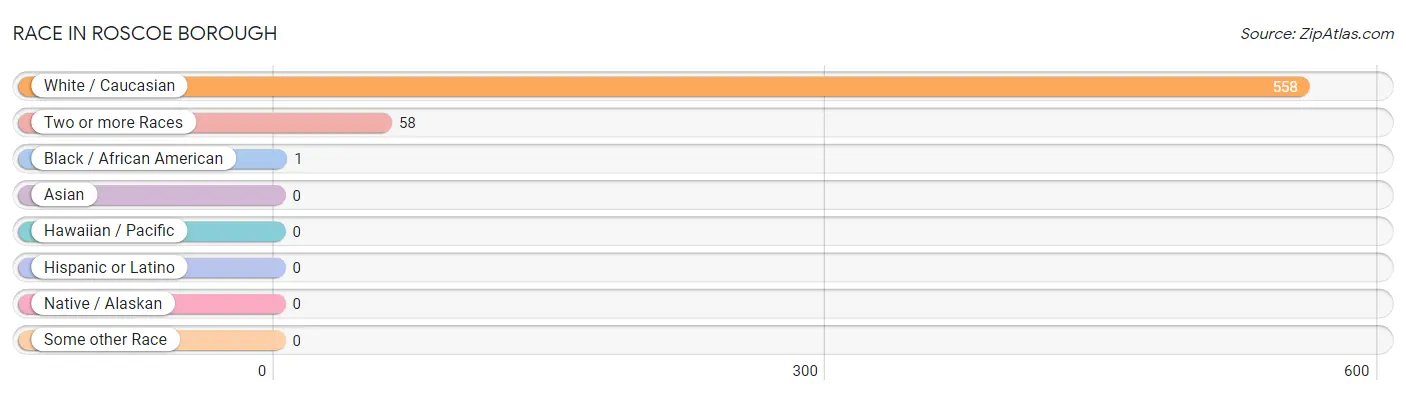
Race in Roscoe borough
The most populous races in Roscoe borough are White / Caucasian (558 | 90.4%), Two or more Races (58 | 9.4%), and Black / African American (1 | 0.2%).
| Race | # Population | % Population |
| Asian | 0 | 0.0% |
| Black / African American | 1 | 0.2% |
| Hawaiian / Pacific | 0 | 0.0% |
| Hispanic or Latino | 0 | 0.0% |
| Native / Alaskan | 0 | 0.0% |
| White / Caucasian | 558 | 90.4% |
| Two or more Races | 58 | 9.4% |
| Some other Race | 0 | 0.0% |
| Total | 617 | 100.0% |
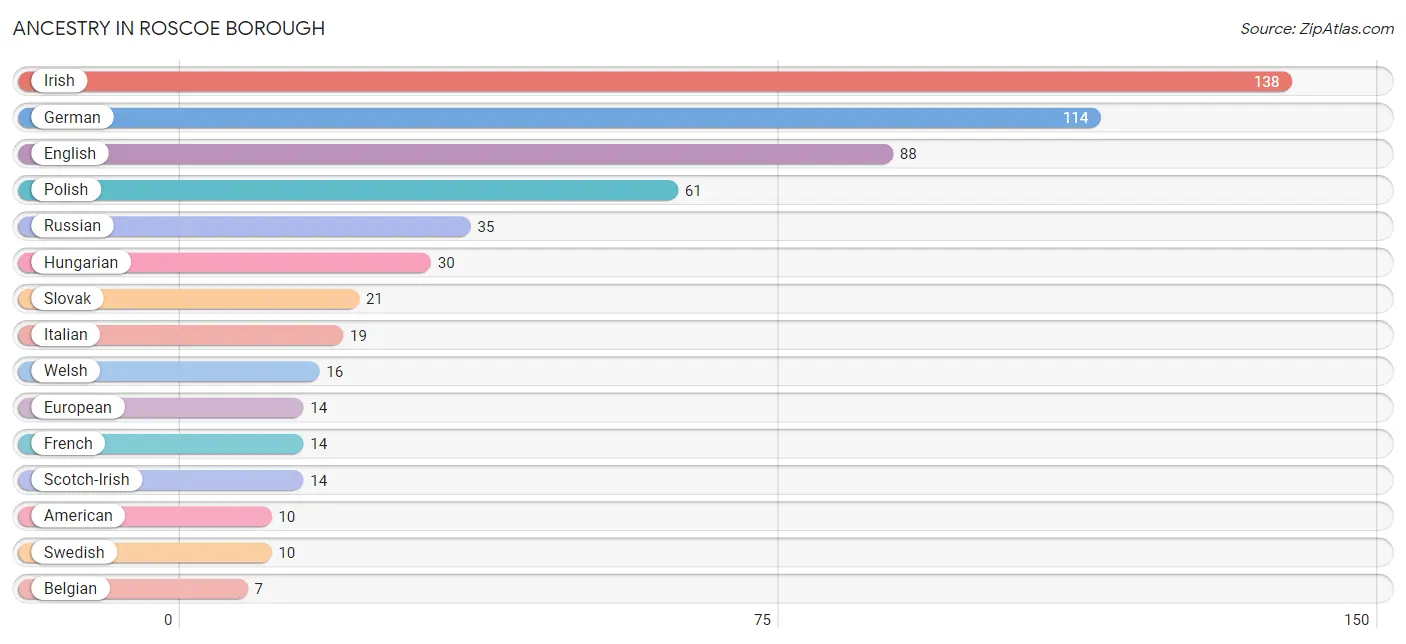
Ancestry in Roscoe borough
The most populous ancestries reported in Roscoe borough are Irish (138 | 22.4%), German (114 | 18.5%), English (88 | 14.3%), Polish (61 | 9.9%), and Russian (35 | 5.7%), together accounting for 70.7% of all Roscoe borough residents.
| Ancestry | # Population | % Population |
| American | 10 | 1.6% |
| Austrian | 6 | 1.0% |
| Belgian | 7 | 1.1% |
| Carpatho Rusyn | 6 | 1.0% |
| Czech | 5 | 0.8% |
| Dutch | 6 | 1.0% |
| English | 88 | 14.3% |
| European | 14 | 2.3% |
| French | 14 | 2.3% |
| German | 114 | 18.5% |
| Hungarian | 30 | 4.9% |
| Irish | 138 | 22.4% |
| Italian | 19 | 3.1% |
| Polish | 61 | 9.9% |
| Russian | 35 | 5.7% |
| Scotch-Irish | 14 | 2.3% |
| Scottish | 5 | 0.8% |
| Serbian | 2 | 0.3% |
| Slovak | 21 | 3.4% |
| Swedish | 10 | 1.6% |
| Welsh | 16 | 2.6% | View All 21 Rows |
Immigrants in Roscoe borough

| Immigration Origin | # Population | % Population | View All 0 Rows |
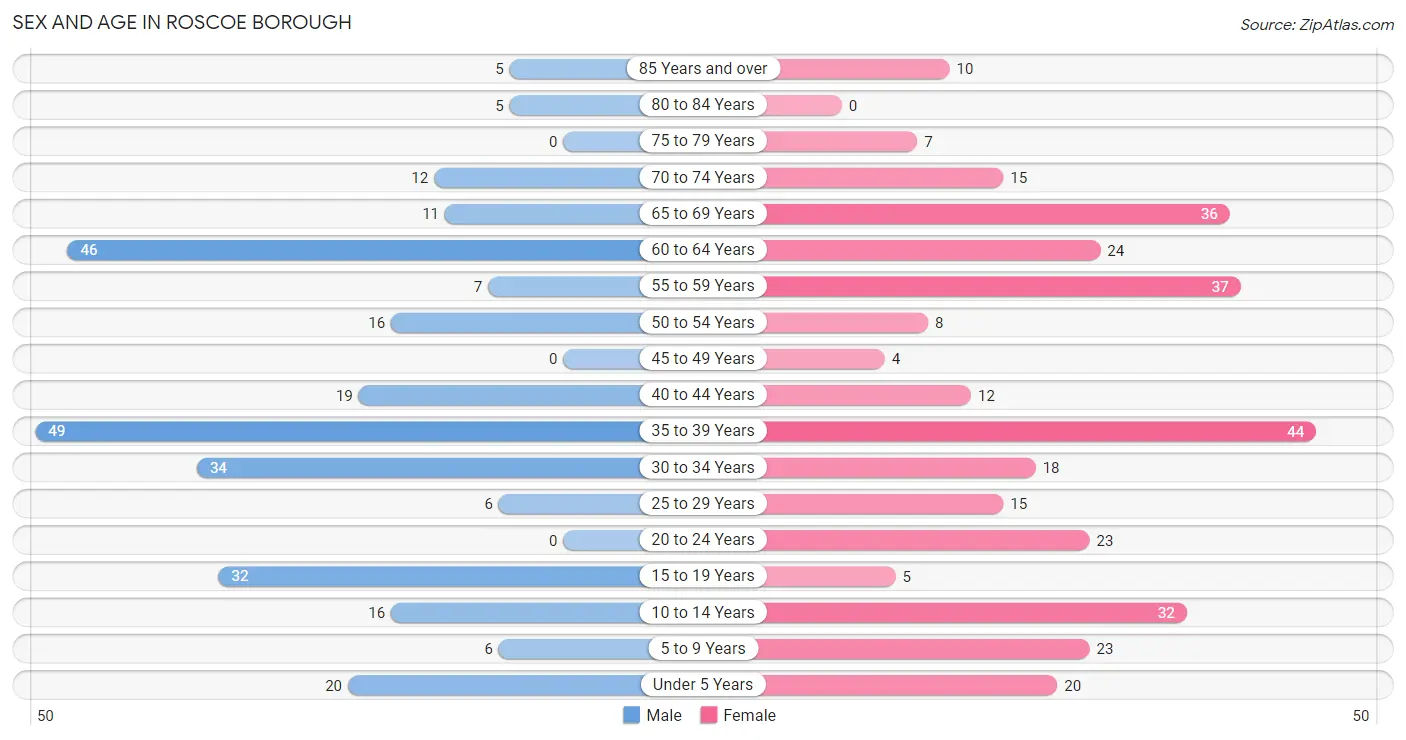
Sex and Age in Roscoe borough
Sex and Age in Roscoe borough
The most populous age groups in Roscoe borough are 35 to 39 Years (49 | 17.2%) for men and 35 to 39 Years (44 | 13.2%) for women.
| Age Bracket | Male | Female |
| Under 5 Years | 20 (7.0%) | 20 (6.0%) |
| 5 to 9 Years | 6 (2.1%) | 23 (6.9%) |
| 10 to 14 Years | 16 (5.6%) | 32 (9.6%) |
| 15 to 19 Years | 32 (11.3%) | 5 (1.5%) |
| 20 to 24 Years | 0 (0.0%) | 23 (6.9%) |
| 25 to 29 Years | 6 (2.1%) | 15 (4.5%) |
| 30 to 34 Years | 34 (12.0%) | 18 (5.4%) |
| 35 to 39 Years | 49 (17.2%) | 44 (13.2%) |
| 40 to 44 Years | 19 (6.7%) | 12 (3.6%) |
| 45 to 49 Years | 0 (0.0%) | 4 (1.2%) |
| 50 to 54 Years | 16 (5.6%) | 8 (2.4%) |
| 55 to 59 Years | 7 (2.5%) | 37 (11.1%) |
| 60 to 64 Years | 46 (16.2%) | 24 (7.2%) |
| 65 to 69 Years | 11 (3.9%) | 36 (10.8%) |
| 70 to 74 Years | 12 (4.2%) | 15 (4.5%) |
| 75 to 79 Years | 0 (0.0%) | 7 (2.1%) |
| 80 to 84 Years | 5 (1.8%) | 0 (0.0%) |
| 85 Years and over | 5 (1.8%) | 10 (3.0%) |
| Total | 284 (100.0%) | 333 (100.0%) |
Families and Households in Roscoe borough
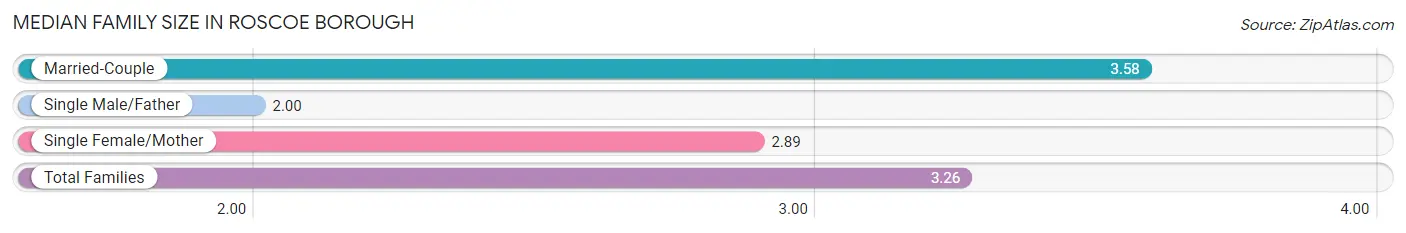
Median Family Size in Roscoe borough
The median family size in Roscoe borough is 3.26 persons per family, with married-couple families (83 | 61.0%) accounting for the largest median family size of 3.58 persons per family. On the other hand, single male/father families (7 | 5.1%) represent the smallest median family size with 2.00 persons per family.
| Family Type | # Families | Family Size |
| Married-Couple | 83 (61.0%) | 3.58 |
| Single Male/Father | 7 (5.1%) | 2.00 |
| Single Female/Mother | 46 (33.8%) | 2.89 |
| Total Families | 136 (100.0%) | 3.26 |
Median Household Size in Roscoe borough
The median household size in Roscoe borough is 2.25 persons per household, with married-couple households (83 | 30.4%) accounting for the largest median household size of 3.58 persons per household. non-family households (137 | 50.2%) represent the smallest median household size with 1.06 persons per household.
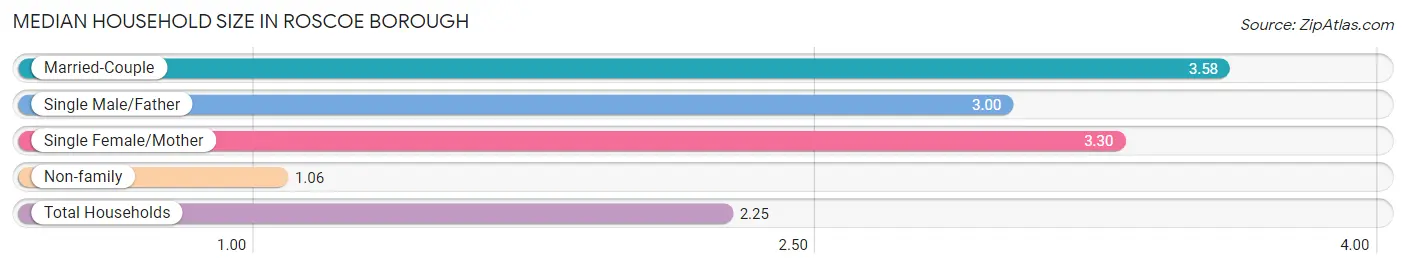
| Household Type | # Households | Household Size |
| Married-Couple | 83 (30.4%) | 3.58 |
| Single Male/Father | 7 (2.6%) | 3.00 |
| Single Female/Mother | 46 (16.9%) | 3.30 |
| Non-family | 137 (50.2%) | 1.06 |
| Total Households | 273 (100.0%) | 2.25 |
Household Size by Marriage Status in Roscoe borough
Out of a total of 273 households in Roscoe borough, 136 (49.8%) are family households, while 137 (50.2%) are nonfamily households. The most numerous type of family households are 3-person households, comprising 51, and the most common type of nonfamily households are 1-person households, comprising 130.
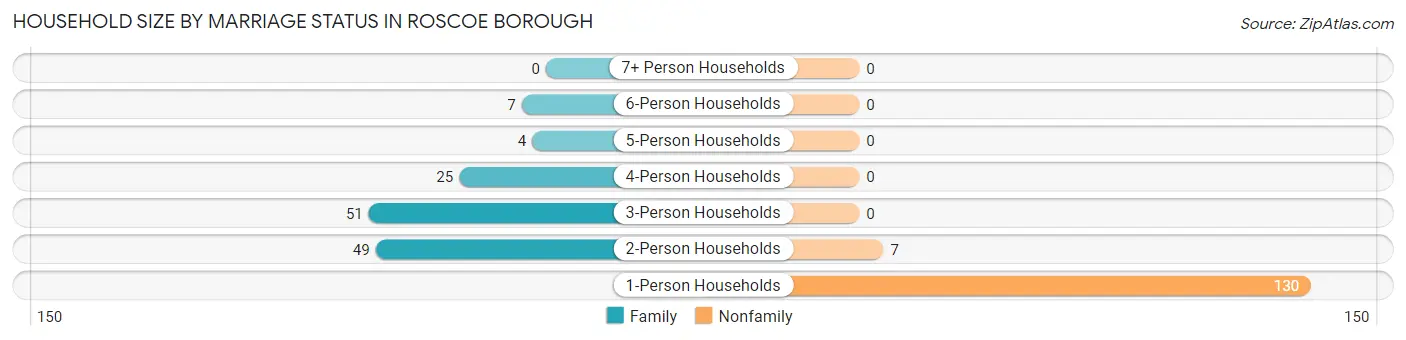
| Household Size | Family Households | Nonfamily Households |
| 1-Person Households | - | 130 (47.6%) |
| 2-Person Households | 49 (17.9%) | 7 (2.6%) |
| 3-Person Households | 51 (18.7%) | 0 (0.0%) |
| 4-Person Households | 25 (9.2%) | 0 (0.0%) |
| 5-Person Households | 4 (1.5%) | 0 (0.0%) |
| 6-Person Households | 7 (2.6%) | 0 (0.0%) |
| 7+ Person Households | 0 (0.0%) | 0 (0.0%) |
| Total | 136 (49.8%) | 137 (50.2%) |
Female Fertility in Roscoe borough
Fertility by Age in Roscoe borough
Average fertility rate in Roscoe borough is 157.0 births per 1,000 women. Women in the age bracket of 20 to 34 years have the highest fertility rate with 214.0 births per 1,000 women. Women in the age bracket of 20 to 34 years acount for 63.2% of all women with births.
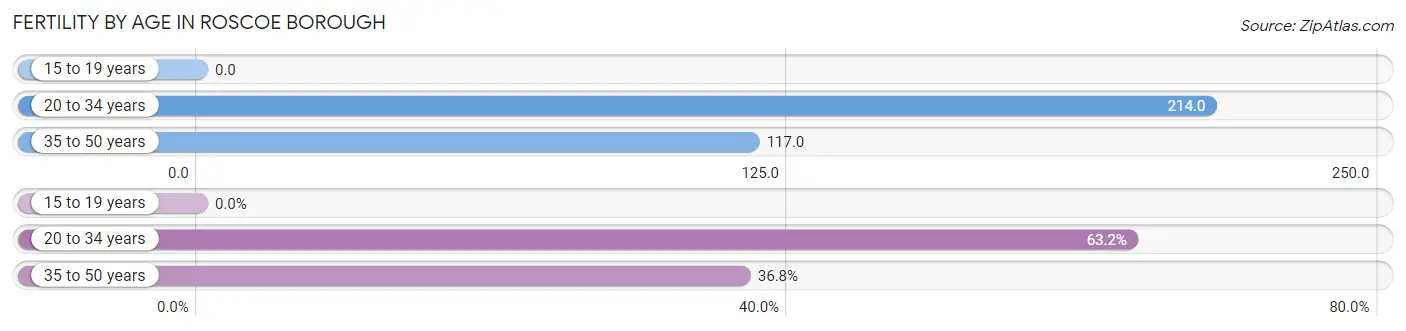
| Age Bracket | Women with Births | Births / 1,000 Women |
| 15 to 19 years | 0 (0.0%) | 0.0 |
| 20 to 34 years | 12 (63.2%) | 214.0 |
| 35 to 50 years | 7 (36.8%) | 117.0 |
| Total | 19 (100.0%) | 157.0 |
Fertility by Age by Marriage Status in Roscoe borough
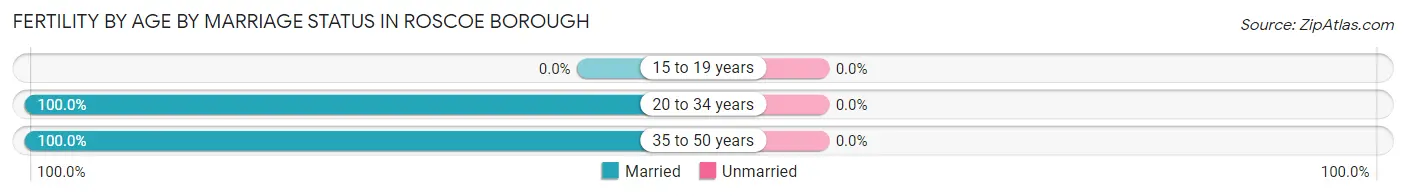
| Age Bracket | Married | Unmarried |
| 15 to 19 years | 0 (0.0%) | 0 (0.0%) |
| 20 to 34 years | 12 (100.0%) | 0 (0.0%) |
| 35 to 50 years | 7 (100.0%) | 0 (0.0%) |
| Total | 19 (100.0%) | 0 (0.0%) |
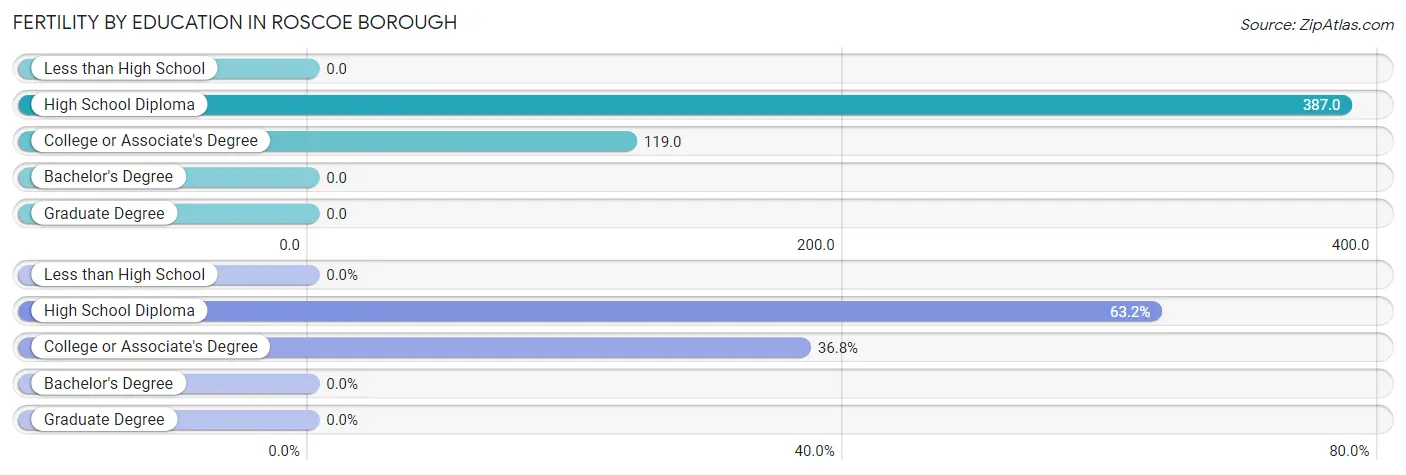
Fertility by Education in Roscoe borough
| Educational Attainment | Women with Births | Births / 1,000 Women |
| Less than High School | 0 (0.0%) | 0.0 |
| High School Diploma | 12 (63.2%) | 387.0 |
| College or Associate's Degree | 7 (36.8%) | 119.0 |
| Bachelor's Degree | 0 (0.0%) | 0.0 |
| Graduate Degree | 0 (0.0%) | 0.0 |
| Total | 19 (100.0%) | 157.0 |
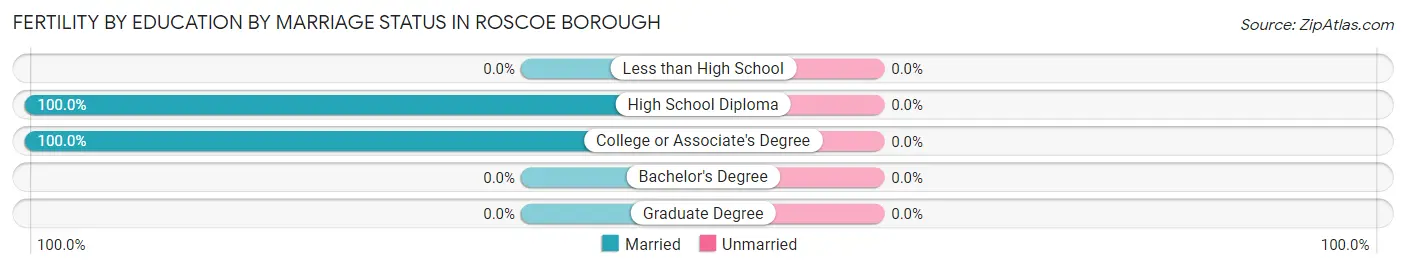
Fertility by Education by Marriage Status in Roscoe borough
| Educational Attainment | Married | Unmarried |
| Less than High School | 0 (0.0%) | 0 (0.0%) |
| High School Diploma | 12 (100.0%) | 0 (0.0%) |
| College or Associate's Degree | 7 (100.0%) | 0 (0.0%) |
| Bachelor's Degree | 0 (0.0%) | 0 (0.0%) |
| Graduate Degree | 0 (0.0%) | 0 (0.0%) |
| Total | 19 (100.0%) | 0 (0.0%) |
Income in Roscoe borough
Income Overview in Roscoe borough
Per Capita Income in Roscoe borough is $30,984, while median incomes of families and households are $66,875 and $57,455 respectively.
| Characteristic | Number | Measure |
| Per Capita Income | 617 | $30,984 |
| Median Family Income | 136 | $66,875 |
| Mean Family Income | 136 | $83,605 |
| Median Household Income | 273 | $57,455 |
| Mean Household Income | 273 | $65,553 |
| Income Deficit | 136 | $0 |
| Wage / Income Gap (%) | 617 | 46.95% |
| Wage / Income Gap ($) | 617 | 53.05¢ per $1 |
| Gini / Inequality Index | 617 | 0.36 |
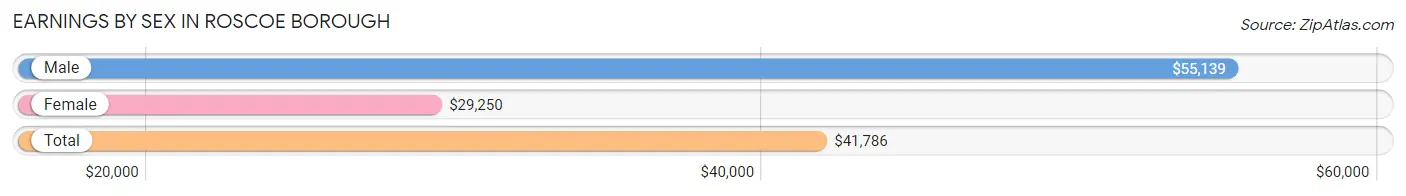
Earnings by Sex in Roscoe borough
Average Earnings in Roscoe borough are $41,786, $55,139 for men and $29,250 for women, a difference of 46.9%.
| Sex | Number | Average Earnings |
| Male | 152 (48.1%) | $55,139 |
| Female | 164 (51.9%) | $29,250 |
| Total | 316 (100.0%) | $41,786 |
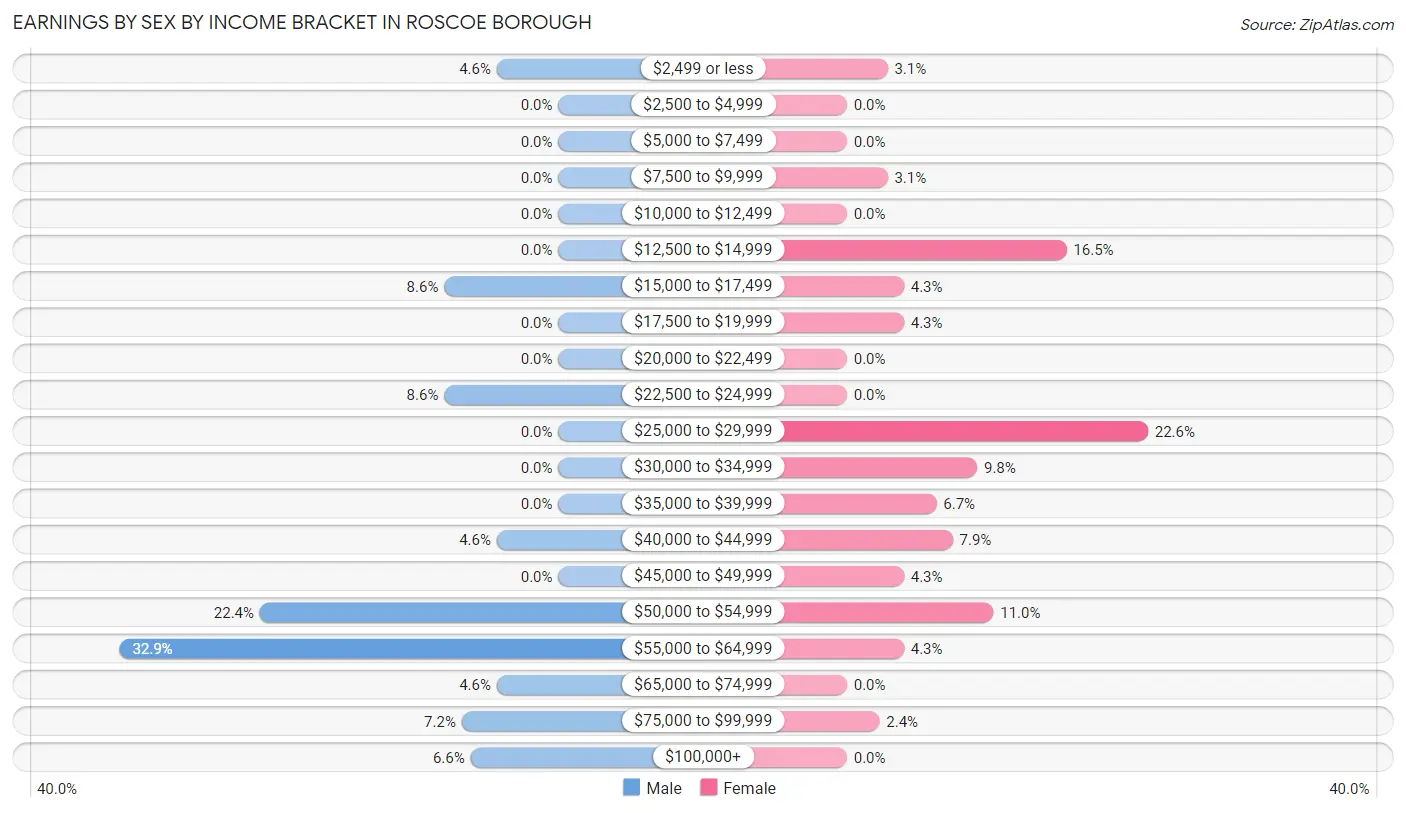
Earnings by Sex by Income Bracket in Roscoe borough
The most common earnings brackets in Roscoe borough are $55,000 to $64,999 for men (50 | 32.9%) and $25,000 to $29,999 for women (37 | 22.6%).
| Income | Male | Female |
| $2,499 or less | 7 (4.6%) | 5 (3.0%) |
| $2,500 to $4,999 | 0 (0.0%) | 0 (0.0%) |
| $5,000 to $7,499 | 0 (0.0%) | 0 (0.0%) |
| $7,500 to $9,999 | 0 (0.0%) | 5 (3.0%) |
| $10,000 to $12,499 | 0 (0.0%) | 0 (0.0%) |
| $12,500 to $14,999 | 0 (0.0%) | 27 (16.5%) |
| $15,000 to $17,499 | 13 (8.6%) | 7 (4.3%) |
| $17,500 to $19,999 | 0 (0.0%) | 7 (4.3%) |
| $20,000 to $22,499 | 0 (0.0%) | 0 (0.0%) |
| $22,500 to $24,999 | 13 (8.6%) | 0 (0.0%) |
| $25,000 to $29,999 | 0 (0.0%) | 37 (22.6%) |
| $30,000 to $34,999 | 0 (0.0%) | 16 (9.8%) |
| $35,000 to $39,999 | 0 (0.0%) | 11 (6.7%) |
| $40,000 to $44,999 | 7 (4.6%) | 13 (7.9%) |
| $45,000 to $49,999 | 0 (0.0%) | 7 (4.3%) |
| $50,000 to $54,999 | 34 (22.4%) | 18 (11.0%) |
| $55,000 to $64,999 | 50 (32.9%) | 7 (4.3%) |
| $65,000 to $74,999 | 7 (4.6%) | 0 (0.0%) |
| $75,000 to $99,999 | 11 (7.2%) | 4 (2.4%) |
| $100,000+ | 10 (6.6%) | 0 (0.0%) |
| Total | 152 (100.0%) | 164 (100.0%) |
Earnings by Sex by Educational Attainment in Roscoe borough
Average earnings in Roscoe borough are $55,347 for men and $29,125 for women, a difference of 47.4%. Men with an educational attainment of bachelor's degree enjoy the highest average annual earnings of $80,833, while those with high school diploma education earn the least with $51,827. Women with an educational attainment of college or associate's degree earn the most with the average annual earnings of $28,750, while those with high school diploma education have the smallest earnings of $18,750.
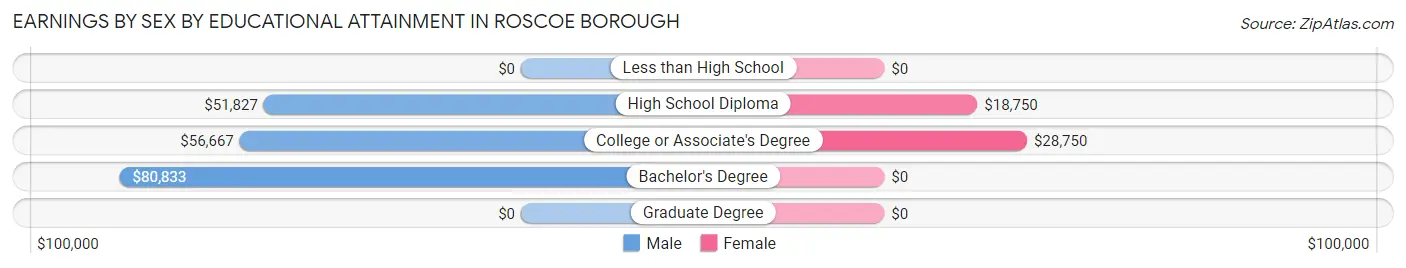
| Educational Attainment | Male Income | Female Income |
| Less than High School | - | - |
| High School Diploma | $51,827 | $18,750 |
| College or Associate's Degree | $56,667 | $28,750 |
| Bachelor's Degree | $80,833 | $0 |
| Graduate Degree | - | - |
| Total | $55,347 | $29,125 |
Family Income in Roscoe borough
Family Income Brackets in Roscoe borough
According to the Roscoe borough family income data, there are 44 families falling into the $50,000 to $74,999 income range, which is the most common income bracket and makes up 32.4% of all families.
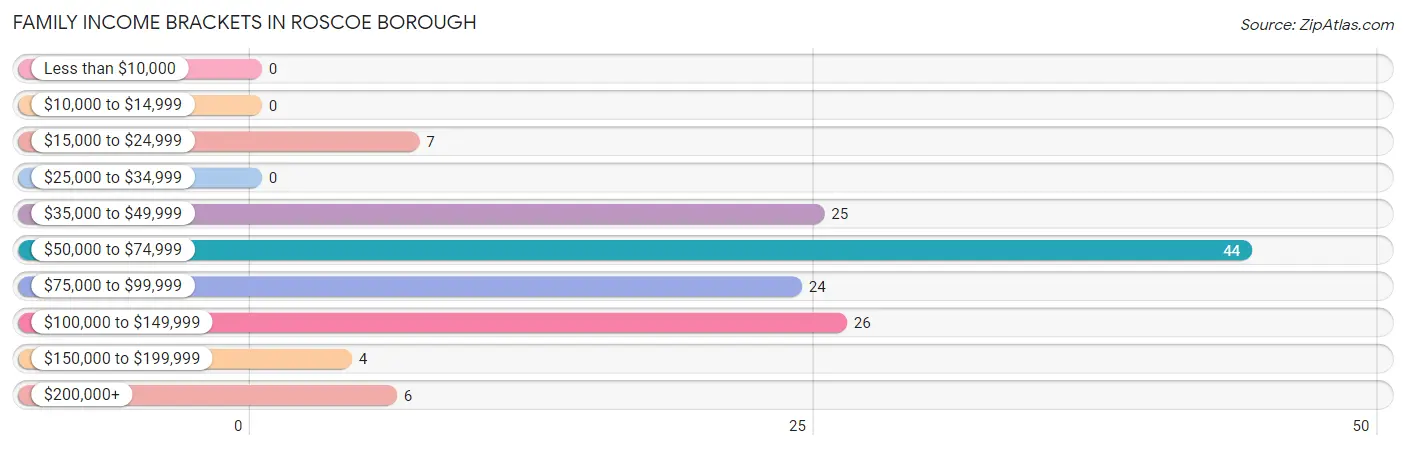
| Income Bracket | # Families | % Families |
| Less than $10,000 | 0 | 0.0% |
| $10,000 to $14,999 | 0 | 0.0% |
| $15,000 to $24,999 | 7 | 5.1% |
| $25,000 to $34,999 | 0 | 0.0% |
| $35,000 to $49,999 | 25 | 18.4% |
| $50,000 to $74,999 | 44 | 32.4% |
| $75,000 to $99,999 | 24 | 17.6% |
| $100,000 to $149,999 | 26 | 19.1% |
| $150,000 to $199,999 | 4 | 2.9% |
| $200,000+ | 6 | 4.4% |
Family Income by Famaliy Size in Roscoe borough
2-person families (70 | 51.5%) account for the highest median family income in Roscoe borough with $71,000 per family, while 2-person families (70 | 51.5%) have the highest median income of $35,500 per family member.
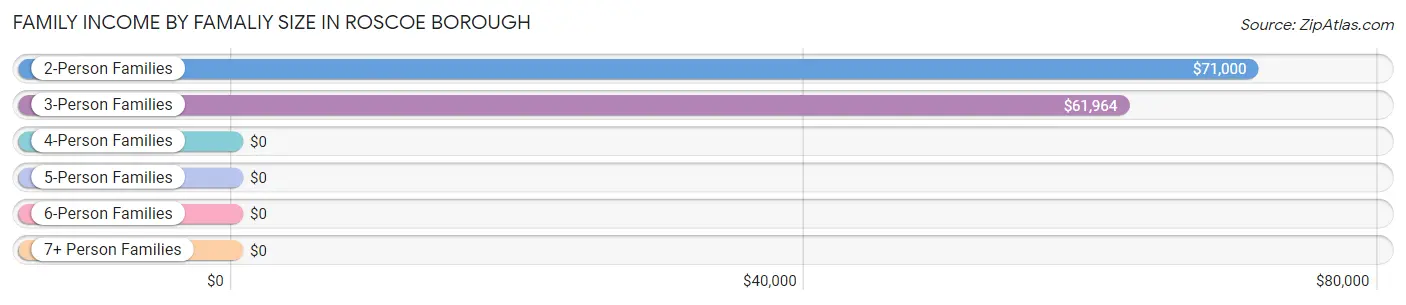
| Income Bracket | # Families | Median Income |
| 2-Person Families | 70 (51.5%) | $71,000 |
| 3-Person Families | 37 (27.2%) | $61,964 |
| 4-Person Families | 18 (13.2%) | $0 |
| 5-Person Families | 4 (2.9%) | $0 |
| 6-Person Families | 7 (5.1%) | $0 |
| 7+ Person Families | 0 (0.0%) | $0 |
| Total | 136 (100.0%) | $66,875 |
Family Income by Number of Earners in Roscoe borough
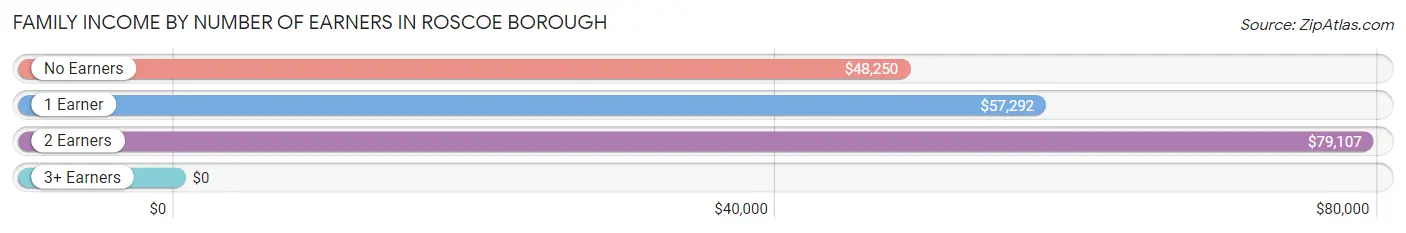
| Number of Earners | # Families | Median Income |
| No Earners | 17 (12.5%) | $48,250 |
| 1 Earner | 53 (39.0%) | $57,292 |
| 2 Earners | 59 (43.4%) | $79,107 |
| 3+ Earners | 7 (5.1%) | $0 |
| Total | 136 (100.0%) | $66,875 |
Household Income in Roscoe borough
Household Income Brackets in Roscoe borough
With 84 households falling in the category, the $50,000 to $74,999 income range is the most frequent in Roscoe borough, accounting for 30.8% of all households. In contrast, only 4 households (1.5%) fall into the $150,000 to $199,999 income bracket, making it the least populous group.
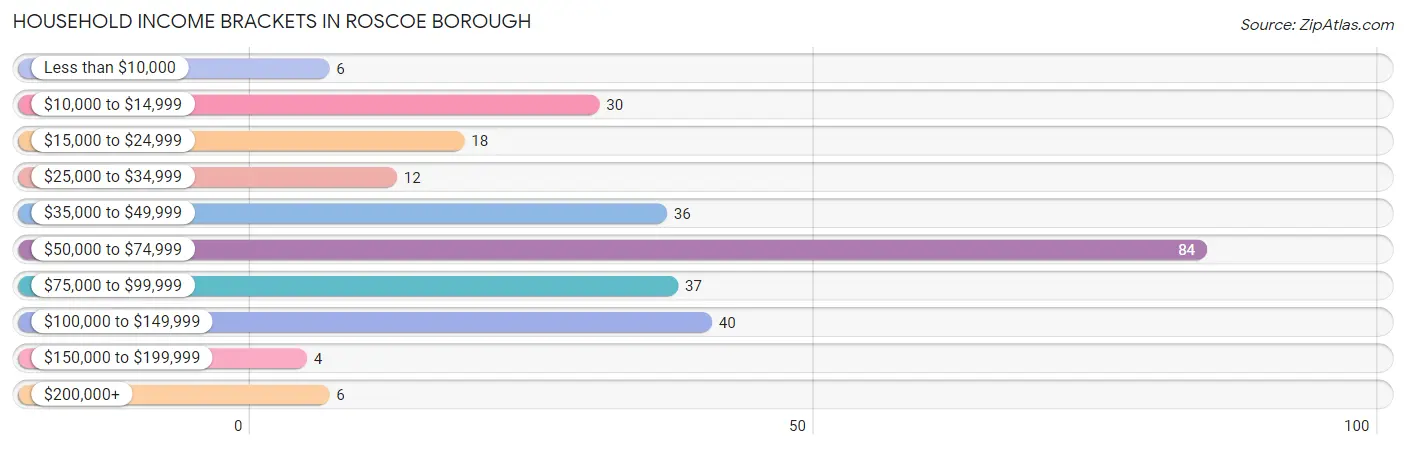
| Income Bracket | # Households | % Households |
| Less than $10,000 | 6 | 2.2% |
| $10,000 to $14,999 | 30 | 11.0% |
| $15,000 to $24,999 | 18 | 6.6% |
| $25,000 to $34,999 | 12 | 4.4% |
| $35,000 to $49,999 | 36 | 13.2% |
| $50,000 to $74,999 | 84 | 30.8% |
| $75,000 to $99,999 | 37 | 13.6% |
| $100,000 to $149,999 | 40 | 14.7% |
| $150,000 to $199,999 | 4 | 1.5% |
| $200,000+ | 6 | 2.2% |
Household Income by Householder Age in Roscoe borough
The median household income in Roscoe borough is $57,455, with the highest median household income of $61,071 found in the 65+ years age bracket for the primary householder. A total of 62 households (22.7%) fall into this category. Meanwhile, the 15 to 24 years age bracket for the primary householder has the lowest median household income of $0, with 7 households (2.6%) in this group.
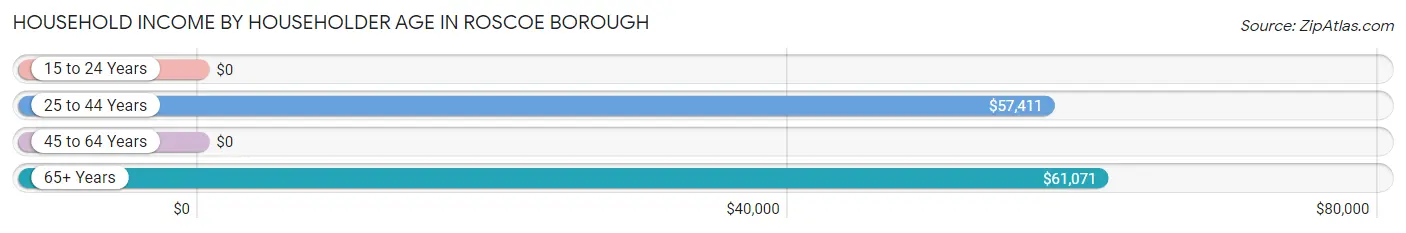
| Income Bracket | # Households | Median Income |
| 15 to 24 Years | 7 (2.6%) | $0 |
| 25 to 44 Years | 106 (38.8%) | $57,411 |
| 45 to 64 Years | 98 (35.9%) | $0 |
| 65+ Years | 62 (22.7%) | $61,071 |
| Total | 273 (100.0%) | $57,455 |
Poverty in Roscoe borough
Income Below Poverty by Sex and Age in Roscoe borough
With 6.7% poverty level for males and 9.9% for females among the residents of Roscoe borough, 45 to 54 year old males and 55 to 64 year old females are the most vulnerable to poverty, with 6 males (37.5%) and 17 females (27.9%) in their respective age groups living below the poverty level.
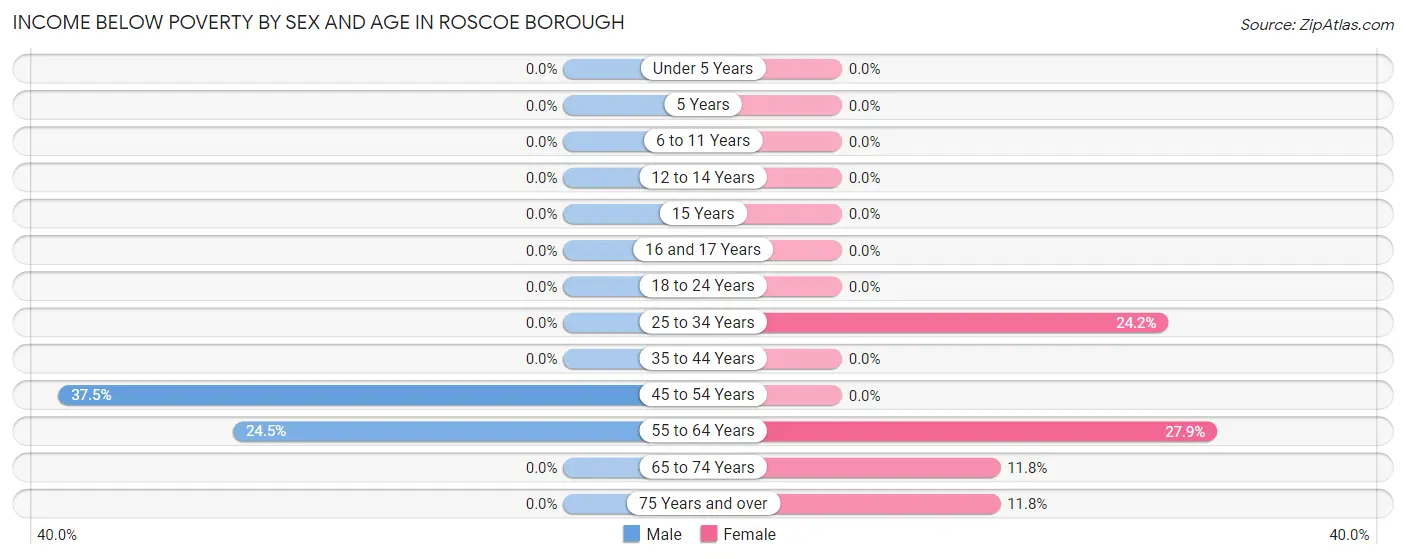
| Age Bracket | Male | Female |
| Under 5 Years | 0 (0.0%) | 0 (0.0%) |
| 5 Years | 0 (0.0%) | 0 (0.0%) |
| 6 to 11 Years | 0 (0.0%) | 0 (0.0%) |
| 12 to 14 Years | 0 (0.0%) | 0 (0.0%) |
| 15 Years | 0 (0.0%) | 0 (0.0%) |
| 16 and 17 Years | 0 (0.0%) | 0 (0.0%) |
| 18 to 24 Years | 0 (0.0%) | 0 (0.0%) |
| 25 to 34 Years | 0 (0.0%) | 8 (24.2%) |
| 35 to 44 Years | 0 (0.0%) | 0 (0.0%) |
| 45 to 54 Years | 6 (37.5%) | 0 (0.0%) |
| 55 to 64 Years | 13 (24.5%) | 17 (27.9%) |
| 65 to 74 Years | 0 (0.0%) | 6 (11.8%) |
| 75 Years and over | 0 (0.0%) | 2 (11.8%) |
| Total | 19 (6.7%) | 33 (9.9%) |
Income Above Poverty by Sex and Age in Roscoe borough
According to the poverty statistics in Roscoe borough, males aged under 5 years and females aged under 5 years are the age groups that are most secure financially, with 100.0% of males and 100.0% of females in these age groups living above the poverty line.
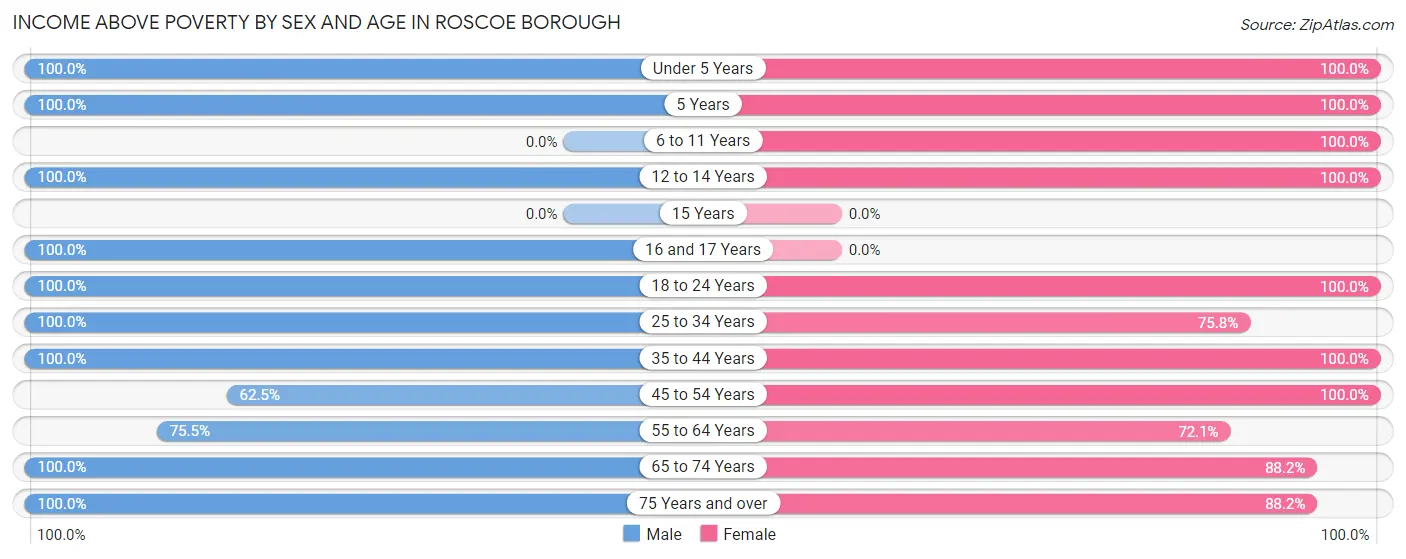
| Age Bracket | Male | Female |
| Under 5 Years | 20 (100.0%) | 20 (100.0%) |
| 5 Years | 6 (100.0%) | 8 (100.0%) |
| 6 to 11 Years | 0 (0.0%) | 20 (100.0%) |
| 12 to 14 Years | 16 (100.0%) | 27 (100.0%) |
| 15 Years | 0 (0.0%) | 0 (0.0%) |
| 16 and 17 Years | 6 (100.0%) | 0 (0.0%) |
| 18 to 24 Years | 26 (100.0%) | 28 (100.0%) |
| 25 to 34 Years | 40 (100.0%) | 25 (75.8%) |
| 35 to 44 Years | 68 (100.0%) | 56 (100.0%) |
| 45 to 54 Years | 10 (62.5%) | 12 (100.0%) |
| 55 to 64 Years | 40 (75.5%) | 44 (72.1%) |
| 65 to 74 Years | 23 (100.0%) | 45 (88.2%) |
| 75 Years and over | 10 (100.0%) | 15 (88.2%) |
| Total | 265 (93.3%) | 300 (90.1%) |
Income Below Poverty Among Married-Couple Families in Roscoe borough
| Children | Above Poverty | Below Poverty |
| No Children | 60 (100.0%) | 0 (0.0%) |
| 1 or 2 Children | 16 (100.0%) | 0 (0.0%) |
| 3 or 4 Children | 7 (100.0%) | 0 (0.0%) |
| 5 or more Children | 0 (0.0%) | 0 (0.0%) |
| Total | 83 (100.0%) | 0 (0.0%) |
Income Below Poverty Among Single-Parent Households in Roscoe borough
| Children | Single Father | Single Mother |
| No Children | 0 (0.0%) | 2 (100.0%) |
| 1 or 2 Children | 0 (0.0%) | 0 (0.0%) |
| 3 or 4 Children | 0 (0.0%) | 0 (0.0%) |
| 5 or more Children | 0 (0.0%) | 0 (0.0%) |
| Total | 0 (0.0%) | 2 (4.3%) |
Income Below Poverty Among Married-Couple vs Single-Parent Households in Roscoe borough
| Children | Married-Couple Families | Single-Parent Households |
| No Children | 0 (0.0%) | 2 (100.0%) |
| 1 or 2 Children | 0 (0.0%) | 0 (0.0%) |
| 3 or 4 Children | 0 (0.0%) | 0 (0.0%) |
| 5 or more Children | 0 (0.0%) | 0 (0.0%) |
| Total | 0 (0.0%) | 2 (3.8%) |
Employment Characteristics in Roscoe borough
Employment by Class of Employer in Roscoe borough
Among the 297 employed individuals in Roscoe borough, private company employees (257 | 86.5%), not-for-profit organizations (34 | 11.5%), and self-employed (not incorporated) (6 | 2.0%) make up the most common classes of employment.
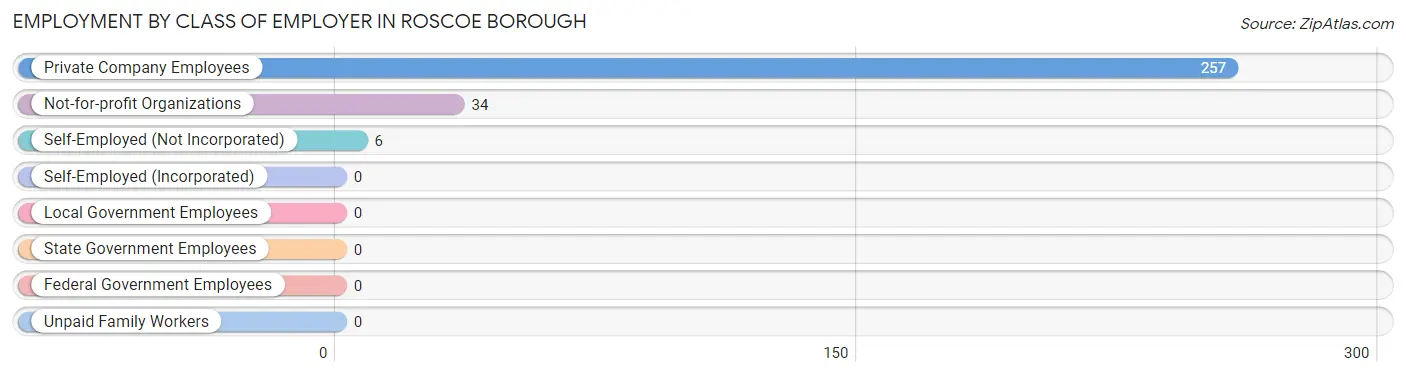
| Employer Class | # Employees | % Employees |
| Private Company Employees | 257 | 86.5% |
| Self-Employed (Incorporated) | 0 | 0.0% |
| Self-Employed (Not Incorporated) | 6 | 2.0% |
| Not-for-profit Organizations | 34 | 11.5% |
| Local Government Employees | 0 | 0.0% |
| State Government Employees | 0 | 0.0% |
| Federal Government Employees | 0 | 0.0% |
| Unpaid Family Workers | 0 | 0.0% |
| Total | 297 | 100.0% |
Employment Status by Age in Roscoe borough
According to the labor force statistics for Roscoe borough, out of the total population over 16 years of age (500), 63.2% or 316 individuals are in the labor force, with 3.8% or 12 of them unemployed. The age group with the highest labor force participation rate is 25 to 29 years, with 100.0% or 21 individuals in the labor force. Within the labor force, the 35 to 44 years age range has the highest percentage of unemployed individuals, with 10.2% or 12 of them being unemployed.
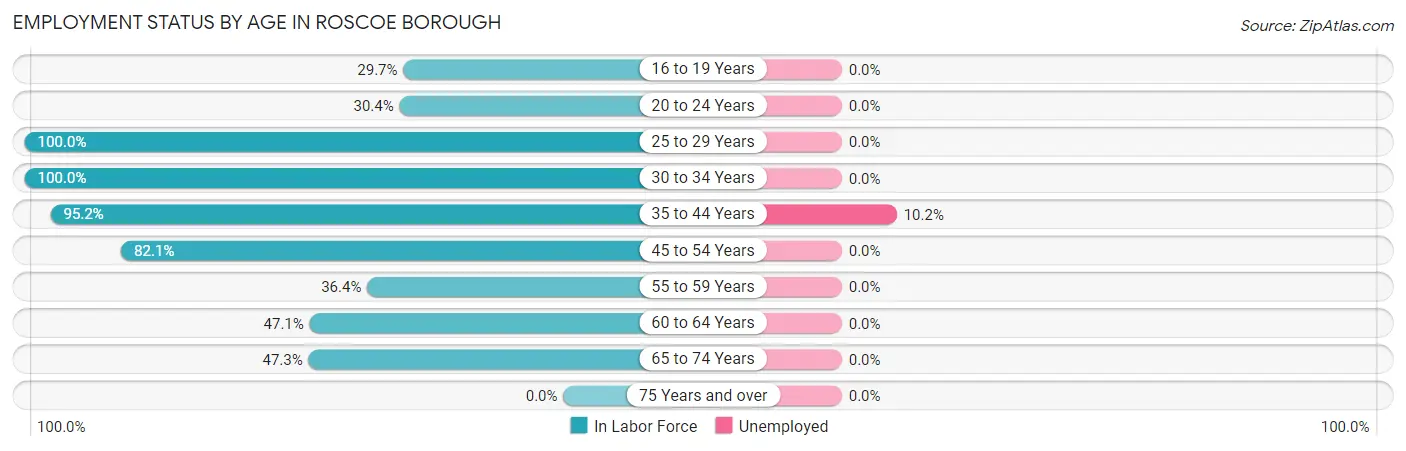
| Age Bracket | In Labor Force | Unemployed |
| 16 to 19 Years | 11 (29.7%) | 0 (0.0%) |
| 20 to 24 Years | 7 (30.4%) | 0 (0.0%) |
| 25 to 29 Years | 21 (100.0%) | 0 (0.0%) |
| 30 to 34 Years | 52 (100.0%) | 0 (0.0%) |
| 35 to 44 Years | 118 (95.2%) | 12 (10.2%) |
| 45 to 54 Years | 23 (82.1%) | 0 (0.0%) |
| 55 to 59 Years | 16 (36.4%) | 0 (0.0%) |
| 60 to 64 Years | 33 (47.1%) | 0 (0.0%) |
| 65 to 74 Years | 35 (47.3%) | 0 (0.0%) |
| 75 Years and over | 0 (0.0%) | 0 (0.0%) |
| Total | 316 (63.2%) | 12 (3.8%) |
Employment Status by Educational Attainment in Roscoe borough
According to labor force statistics for Roscoe borough, 77.6% of individuals (263) out of the total population between 25 and 64 years of age (339) are in the labor force, with 4.6% or 12 of them being unemployed. The group with the highest labor force participation rate are those with the educational attainment of college / associate degree, with 95.2% or 120 individuals in the labor force. Within the labor force, individuals with college / associate degree education have the highest percentage of unemployment, with 10.0% or 12 of them being unemployed.
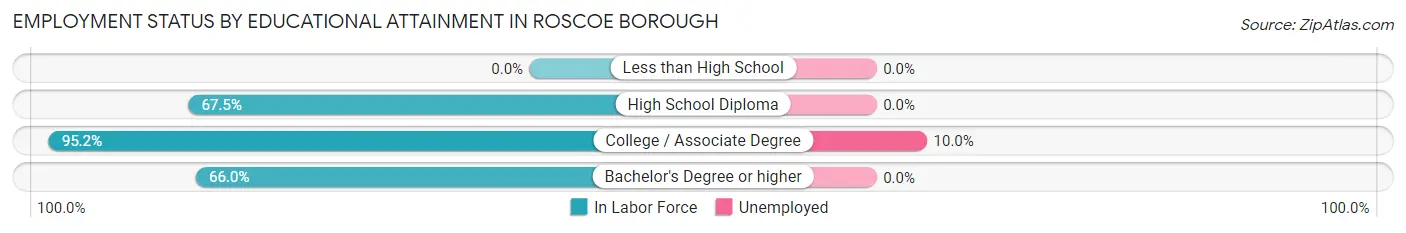
| Educational Attainment | In Labor Force | Unemployed |
| Less than High School | 0 (0.0%) | 0 (0.0%) |
| High School Diploma | 108 (67.5%) | 0 (0.0%) |
| College / Associate Degree | 120 (95.2%) | 13 (10.0%) |
| Bachelor's Degree or higher | 35 (66.0%) | 0 (0.0%) |
| Total | 263 (77.6%) | 16 (4.6%) |
Employment Occupations by Sex in Roscoe borough
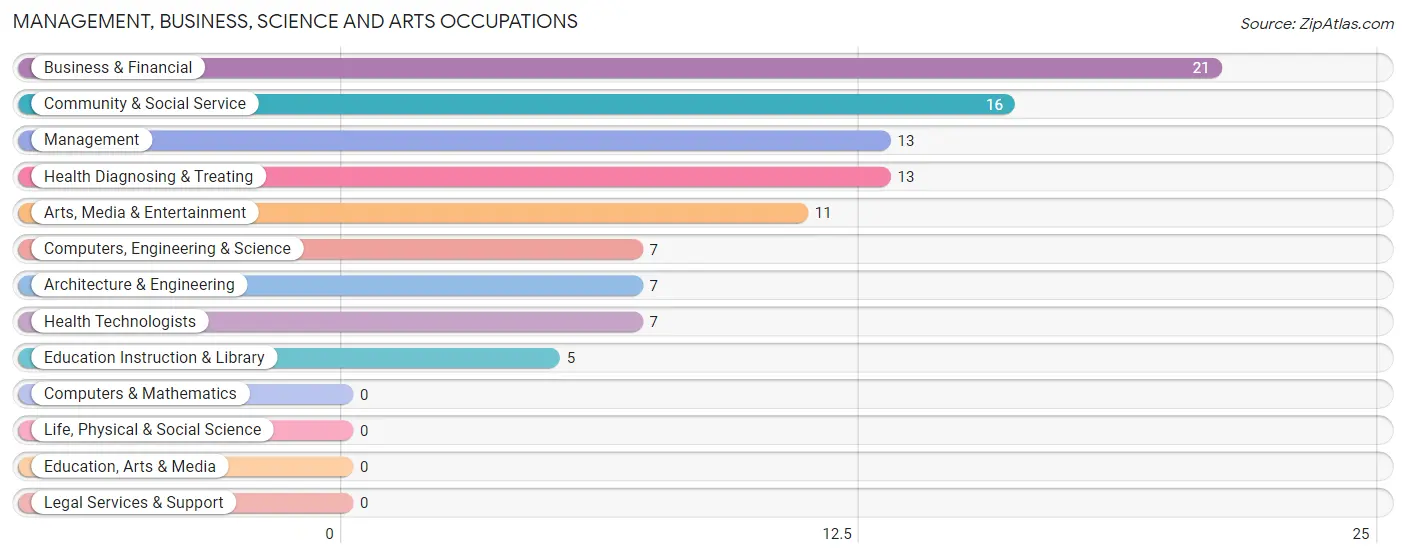
Management, Business, Science and Arts Occupations
The most common Management, Business, Science and Arts occupations in Roscoe borough are Business & Financial (21 | 6.9%), Community & Social Service (16 | 5.3%), Management (13 | 4.3%), Health Diagnosing & Treating (13 | 4.3%), and Arts, Media & Entertainment (11 | 3.6%).
Management, Business, Science and Arts Occupations by Sex
Within the Management, Business, Science and Arts occupations in Roscoe borough, the most male-oriented occupations are Arts, Media & Entertainment (100.0%), Community & Social Service (68.8%), and Management (46.2%), while the most female-oriented occupations are Business & Financial (100.0%), Computers, Engineering & Science (100.0%), and Architecture & Engineering (100.0%).
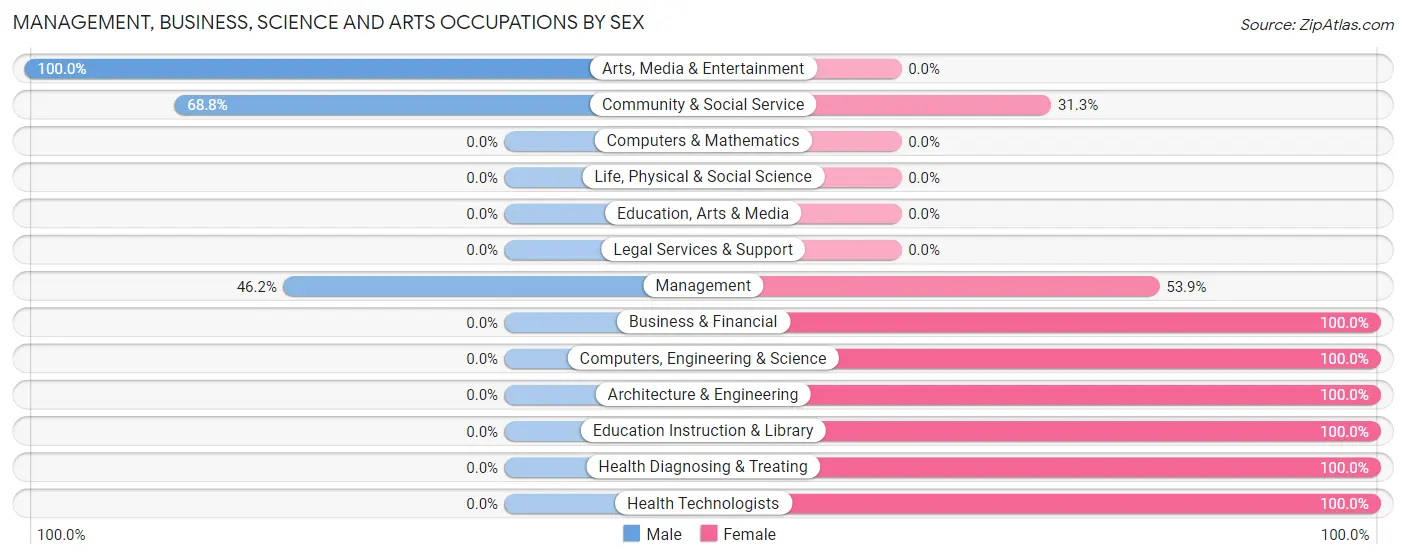
| Occupation | Male | Female |
| Management | 6 (46.2%) | 7 (53.8%) |
| Business & Financial | 0 (0.0%) | 21 (100.0%) |
| Computers, Engineering & Science | 0 (0.0%) | 7 (100.0%) |
| Computers & Mathematics | 0 (0.0%) | 0 (0.0%) |
| Architecture & Engineering | 0 (0.0%) | 7 (100.0%) |
| Life, Physical & Social Science | 0 (0.0%) | 0 (0.0%) |
| Community & Social Service | 11 (68.8%) | 5 (31.2%) |
| Education, Arts & Media | 0 (0.0%) | 0 (0.0%) |
| Legal Services & Support | 0 (0.0%) | 0 (0.0%) |
| Education Instruction & Library | 0 (0.0%) | 5 (100.0%) |
| Arts, Media & Entertainment | 11 (100.0%) | 0 (0.0%) |
| Health Diagnosing & Treating | 0 (0.0%) | 13 (100.0%) |
| Health Technologists | 0 (0.0%) | 7 (100.0%) |
| Total (Category) | 17 (24.3%) | 53 (75.7%) |
| Total (Overall) | 152 (50.0%) | 152 (50.0%) |
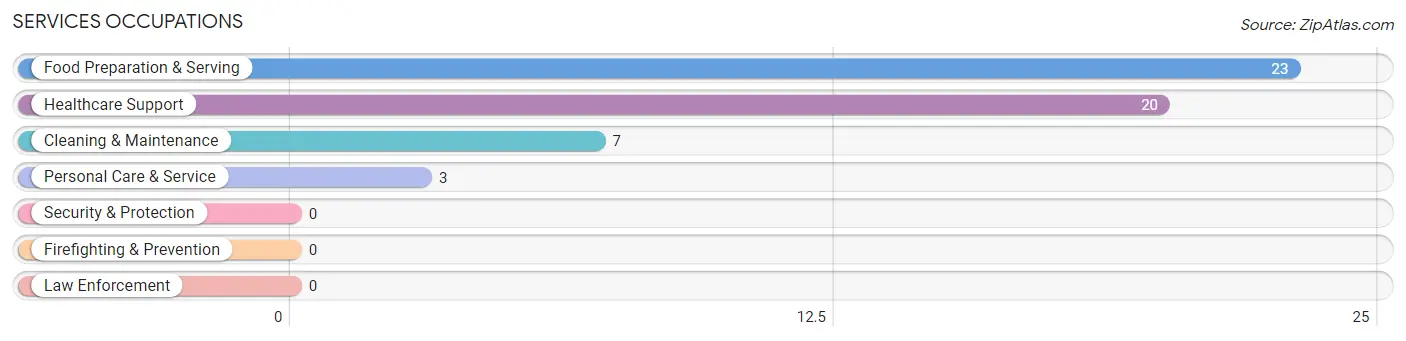
Services Occupations
The most common Services occupations in Roscoe borough are Food Preparation & Serving (23 | 7.6%), Healthcare Support (20 | 6.6%), Cleaning & Maintenance (7 | 2.3%), and Personal Care & Service (3 | 1.0%).
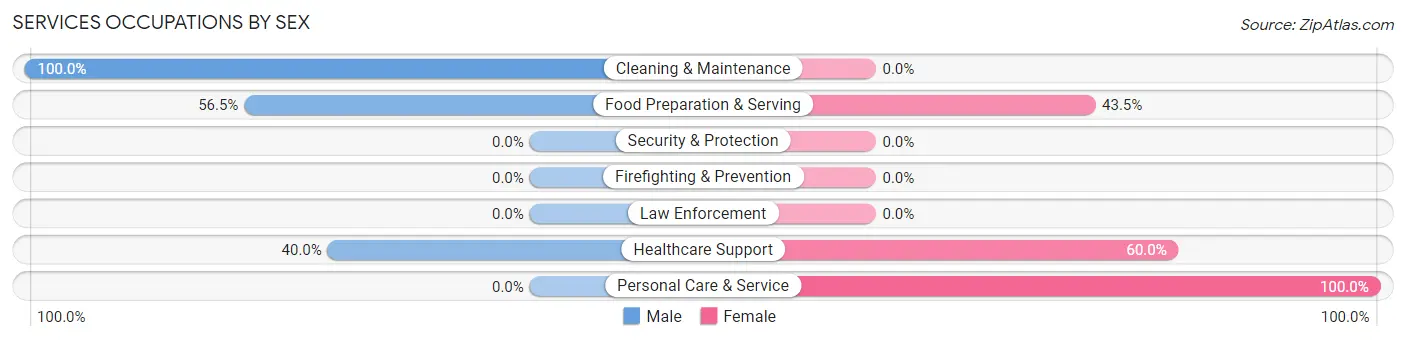
Services Occupations by Sex
Within the Services occupations in Roscoe borough, the most male-oriented occupations are Cleaning & Maintenance (100.0%), Food Preparation & Serving (56.5%), and Healthcare Support (40.0%), while the most female-oriented occupations are Personal Care & Service (100.0%), Healthcare Support (60.0%), and Food Preparation & Serving (43.5%).
| Occupation | Male | Female |
| Healthcare Support | 8 (40.0%) | 12 (60.0%) |
| Security & Protection | 0 (0.0%) | 0 (0.0%) |
| Firefighting & Prevention | 0 (0.0%) | 0 (0.0%) |
| Law Enforcement | 0 (0.0%) | 0 (0.0%) |
| Food Preparation & Serving | 13 (56.5%) | 10 (43.5%) |
| Cleaning & Maintenance | 7 (100.0%) | 0 (0.0%) |
| Personal Care & Service | 0 (0.0%) | 3 (100.0%) |
| Total (Category) | 28 (52.8%) | 25 (47.2%) |
| Total (Overall) | 152 (50.0%) | 152 (50.0%) |
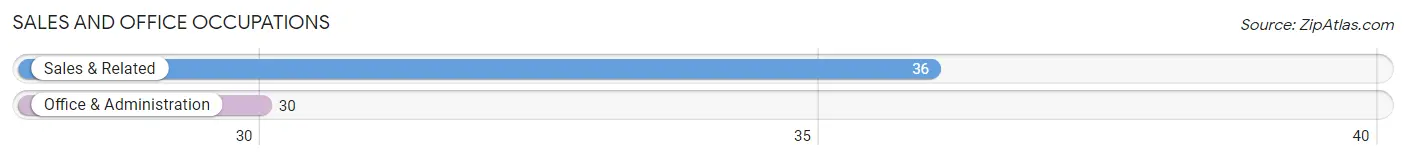
Sales and Office Occupations
The most common Sales and Office occupations in Roscoe borough are Sales & Related (36 | 11.8%), and Office & Administration (30 | 9.9%).
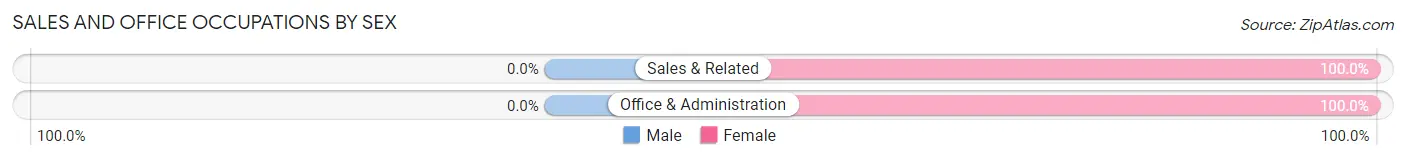
Sales and Office Occupations by Sex
| Occupation | Male | Female |
| Sales & Related | 0 (0.0%) | 36 (100.0%) |
| Office & Administration | 0 (0.0%) | 30 (100.0%) |
| Total (Category) | 0 (0.0%) | 66 (100.0%) |
| Total (Overall) | 152 (50.0%) | 152 (50.0%) |
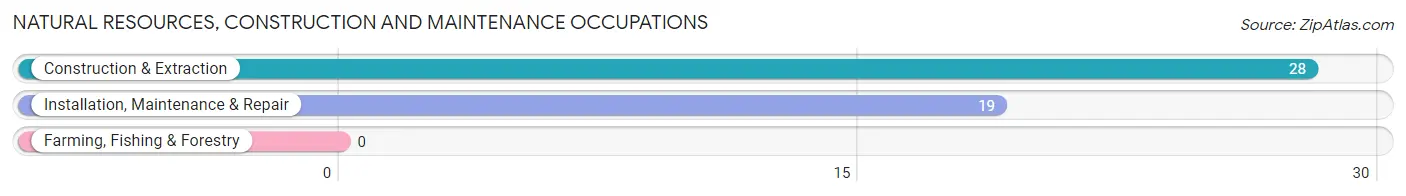
Natural Resources, Construction and Maintenance Occupations
The most common Natural Resources, Construction and Maintenance occupations in Roscoe borough are Construction & Extraction (28 | 9.2%), and Installation, Maintenance & Repair (19 | 6.2%).
Natural Resources, Construction and Maintenance Occupations by Sex
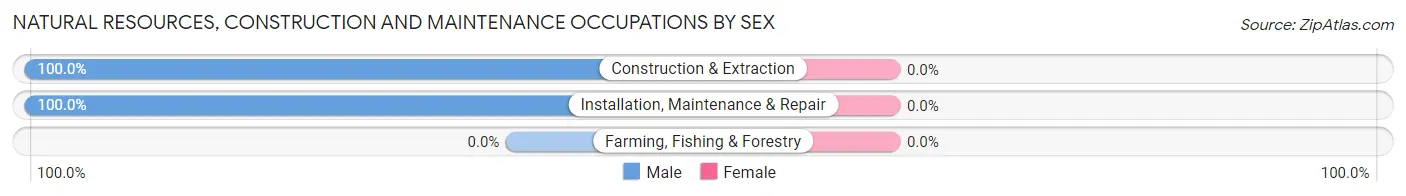
| Occupation | Male | Female |
| Farming, Fishing & Forestry | 0 (0.0%) | 0 (0.0%) |
| Construction & Extraction | 28 (100.0%) | 0 (0.0%) |
| Installation, Maintenance & Repair | 19 (100.0%) | 0 (0.0%) |
| Total (Category) | 47 (100.0%) | 0 (0.0%) |
| Total (Overall) | 152 (50.0%) | 152 (50.0%) |
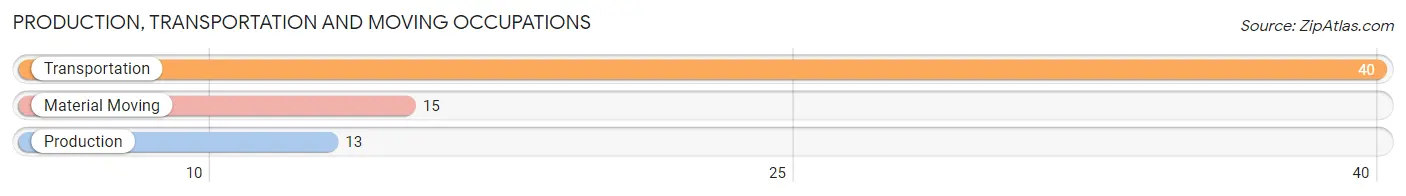
Production, Transportation and Moving Occupations
The most common Production, Transportation and Moving occupations in Roscoe borough are Transportation (40 | 13.2%), Material Moving (15 | 4.9%), and Production (13 | 4.3%).
Production, Transportation and Moving Occupations by Sex
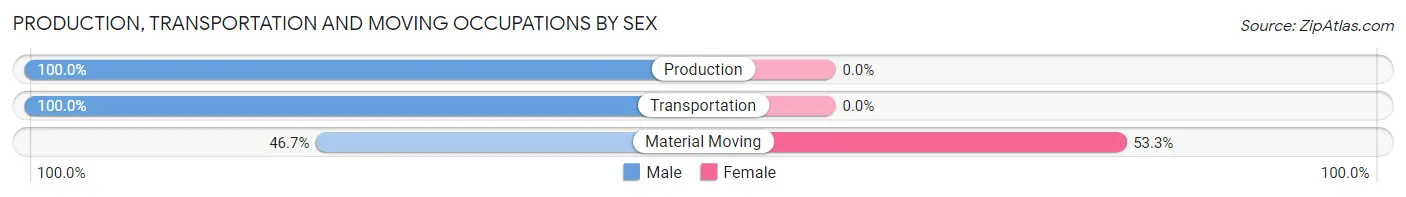
| Occupation | Male | Female |
| Production | 13 (100.0%) | 0 (0.0%) |
| Transportation | 40 (100.0%) | 0 (0.0%) |
| Material Moving | 7 (46.7%) | 8 (53.3%) |
| Total (Category) | 60 (88.2%) | 8 (11.8%) |
| Total (Overall) | 152 (50.0%) | 152 (50.0%) |
Employment Industries by Sex in Roscoe borough
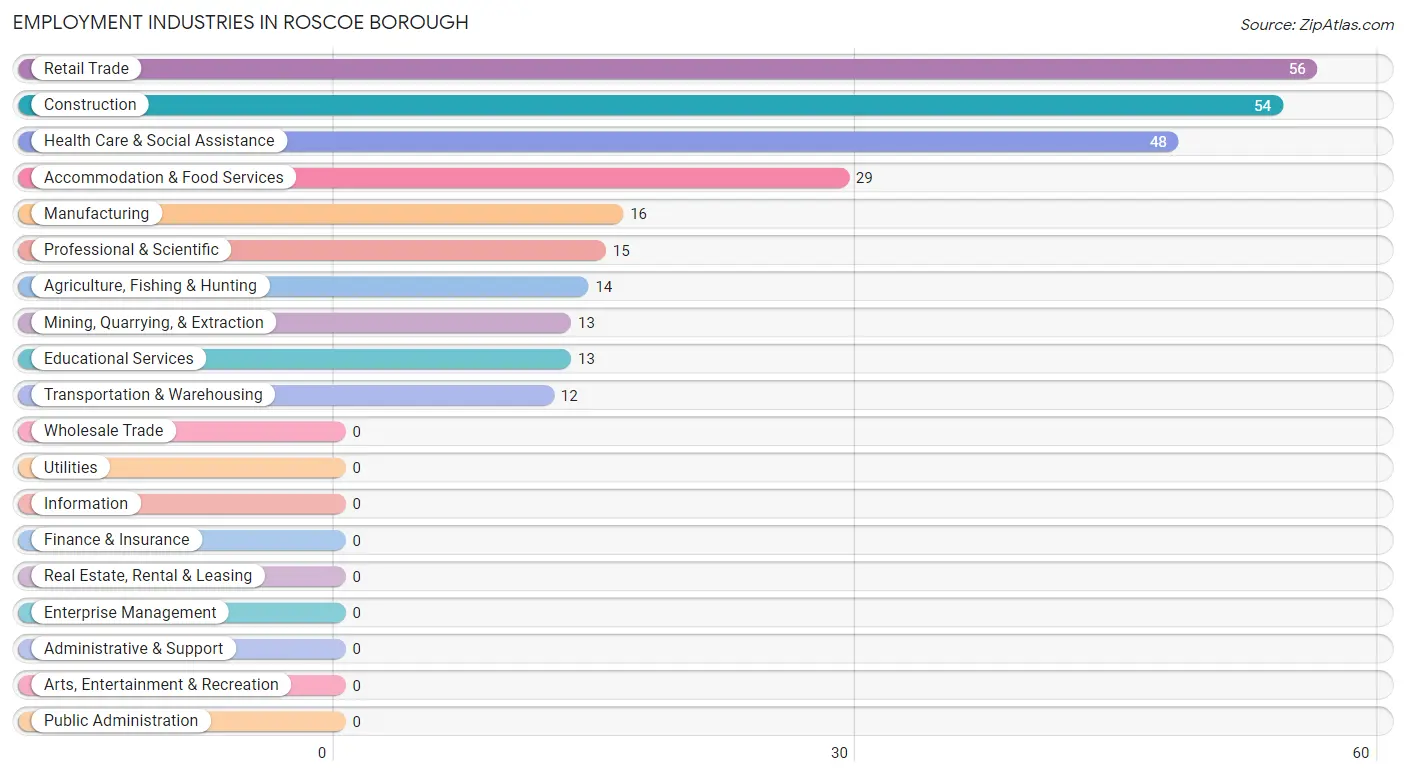
Employment Industries in Roscoe borough
The major employment industries in Roscoe borough include Retail Trade (56 | 18.4%), Construction (54 | 17.8%), Health Care & Social Assistance (48 | 15.8%), Accommodation & Food Services (29 | 9.5%), and Manufacturing (16 | 5.3%).
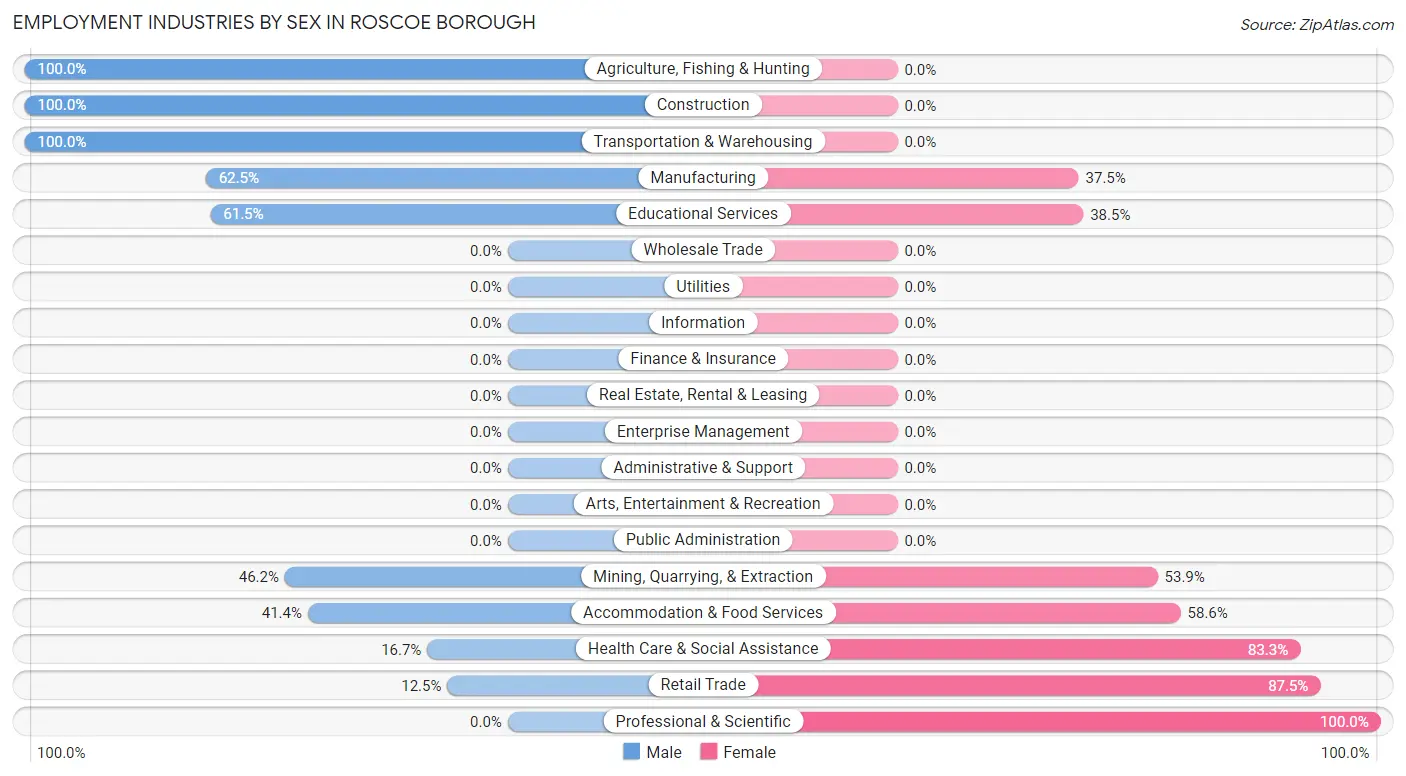
Employment Industries by Sex in Roscoe borough
The Roscoe borough industries that see more men than women are Agriculture, Fishing & Hunting (100.0%), Construction (100.0%), and Transportation & Warehousing (100.0%), whereas the industries that tend to have a higher number of women are Professional & Scientific (100.0%), Retail Trade (87.5%), and Health Care & Social Assistance (83.3%).
| Industry | Male | Female |
| Agriculture, Fishing & Hunting | 14 (100.0%) | 0 (0.0%) |
| Mining, Quarrying, & Extraction | 6 (46.2%) | 7 (53.8%) |
| Construction | 54 (100.0%) | 0 (0.0%) |
| Manufacturing | 10 (62.5%) | 6 (37.5%) |
| Wholesale Trade | 0 (0.0%) | 0 (0.0%) |
| Retail Trade | 7 (12.5%) | 49 (87.5%) |
| Transportation & Warehousing | 12 (100.0%) | 0 (0.0%) |
| Utilities | 0 (0.0%) | 0 (0.0%) |
| Information | 0 (0.0%) | 0 (0.0%) |
| Finance & Insurance | 0 (0.0%) | 0 (0.0%) |
| Real Estate, Rental & Leasing | 0 (0.0%) | 0 (0.0%) |
| Professional & Scientific | 0 (0.0%) | 15 (100.0%) |
| Enterprise Management | 0 (0.0%) | 0 (0.0%) |
| Administrative & Support | 0 (0.0%) | 0 (0.0%) |
| Educational Services | 8 (61.5%) | 5 (38.5%) |
| Health Care & Social Assistance | 8 (16.7%) | 40 (83.3%) |
| Arts, Entertainment & Recreation | 0 (0.0%) | 0 (0.0%) |
| Accommodation & Food Services | 12 (41.4%) | 17 (58.6%) |
| Public Administration | 0 (0.0%) | 0 (0.0%) |
| Total | 152 (50.0%) | 152 (50.0%) |
Education in Roscoe borough
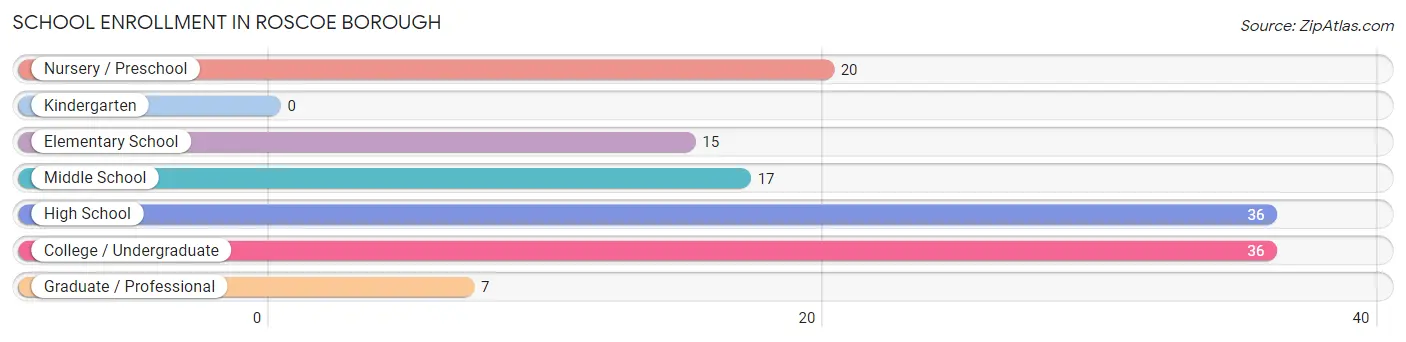
School Enrollment in Roscoe borough
The most common levels of schooling among the 131 students in Roscoe borough are high school (36 | 27.5%), college / undergraduate (36 | 27.5%), and nursery / preschool (20 | 15.3%).
| School Level | # Students | % Students |
| Nursery / Preschool | 20 | 15.3% |
| Kindergarten | 0 | 0.0% |
| Elementary School | 15 | 11.5% |
| Middle School | 17 | 13.0% |
| High School | 36 | 27.5% |
| College / Undergraduate | 36 | 27.5% |
| Graduate / Professional | 7 | 5.3% |
| Total | 131 | 100.0% |
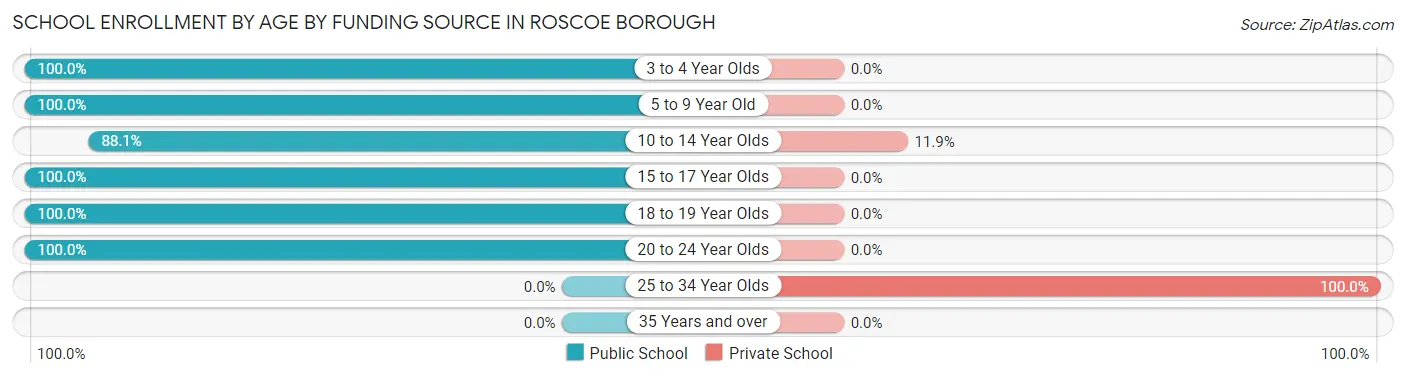
School Enrollment by Age by Funding Source in Roscoe borough
Out of a total of 131 students who are enrolled in schools in Roscoe borough, 12 (9.2%) attend a private institution, while the remaining 119 (90.8%) are enrolled in public schools. The age group of 25 to 34 year olds has the highest likelihood of being enrolled in private schools, with 7 (100.0% in the age bracket) enrolled. Conversely, the age group of 3 to 4 year olds has the lowest likelihood of being enrolled in a private school, with 12 (100.0% in the age bracket) attending a public institution.
| Age Bracket | Public School | Private School |
| 3 to 4 Year Olds | 12 (100.0%) | 0 (0.0%) |
| 5 to 9 Year Old | 23 (100.0%) | 0 (0.0%) |
| 10 to 14 Year Olds | 37 (88.1%) | 5 (11.9%) |
| 15 to 17 Year Olds | 6 (100.0%) | 0 (0.0%) |
| 18 to 19 Year Olds | 25 (100.0%) | 0 (0.0%) |
| 20 to 24 Year Olds | 16 (100.0%) | 0 (0.0%) |
| 25 to 34 Year Olds | 0 (0.0%) | 7 (100.0%) |
| 35 Years and over | 0 (0.0%) | 0 (0.0%) |
| Total | 119 (90.8%) | 12 (9.2%) |
Educational Attainment by Field of Study in Roscoe borough
Business (27 | 37.5%), science & technology (15 | 20.8%), education (12 | 16.7%), physical & health sciences (6 | 8.3%), and psychology (6 | 8.3%) are the most common fields of study among 72 individuals in Roscoe borough who have obtained a bachelor's degree or higher.
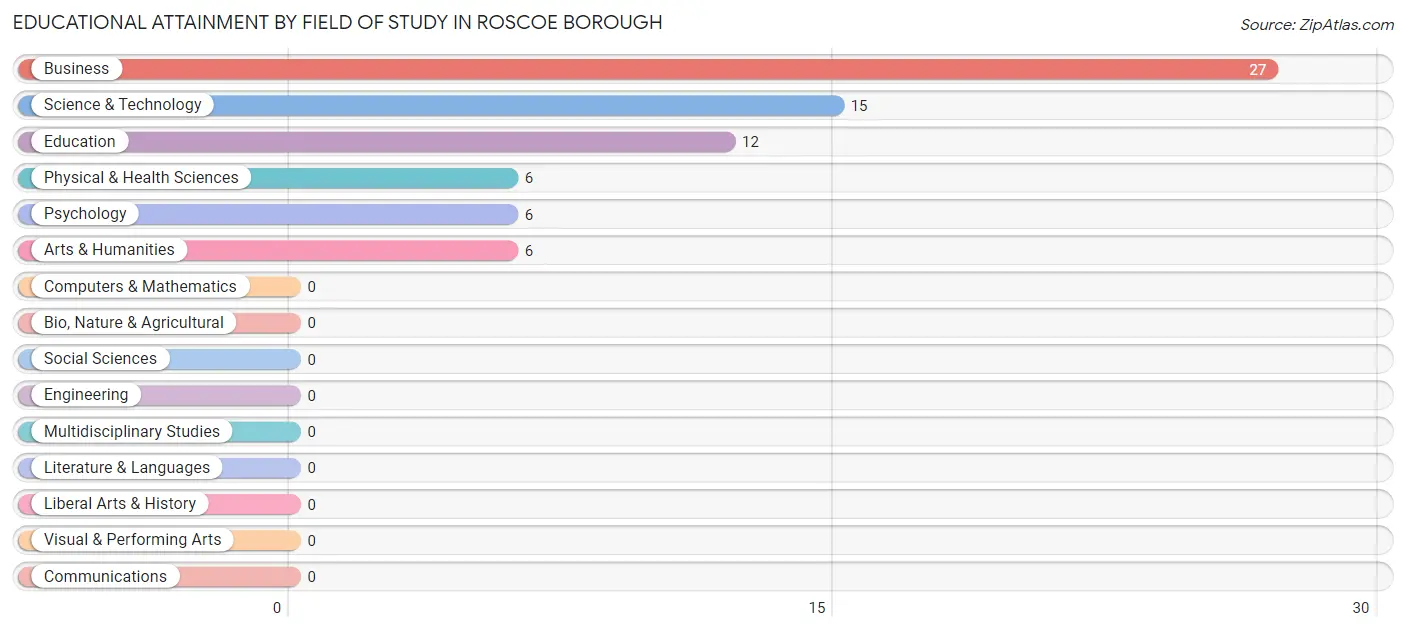
| Field of Study | # Graduates | % Graduates |
| Computers & Mathematics | 0 | 0.0% |
| Bio, Nature & Agricultural | 0 | 0.0% |
| Physical & Health Sciences | 6 | 8.3% |
| Psychology | 6 | 8.3% |
| Social Sciences | 0 | 0.0% |
| Engineering | 0 | 0.0% |
| Multidisciplinary Studies | 0 | 0.0% |
| Science & Technology | 15 | 20.8% |
| Business | 27 | 37.5% |
| Education | 12 | 16.7% |
| Literature & Languages | 0 | 0.0% |
| Liberal Arts & History | 0 | 0.0% |
| Visual & Performing Arts | 0 | 0.0% |
| Communications | 0 | 0.0% |
| Arts & Humanities | 6 | 8.3% |
| Total | 72 | 100.0% |
Transportation & Commute in Roscoe borough
Vehicle Availability by Sex in Roscoe borough
The most prevalent vehicle ownership categories in Roscoe borough are males with 2 vehicles (76, accounting for 52.8%) and females with 2 vehicles (69, making up 50.3%).
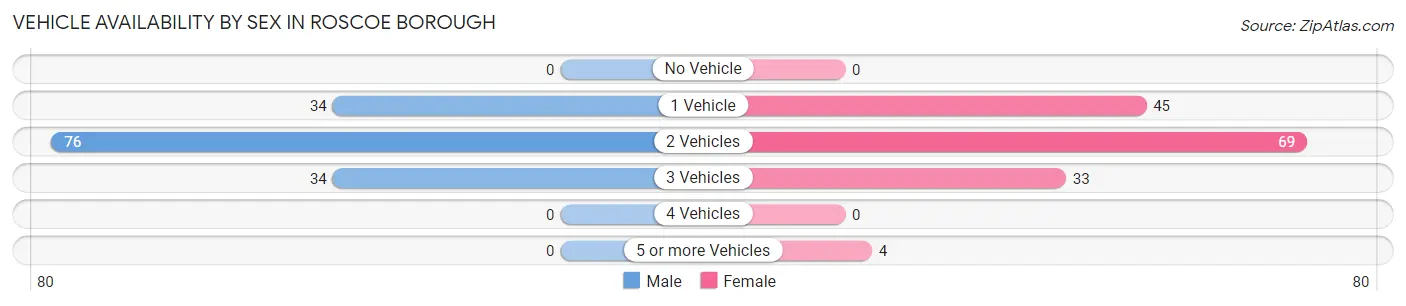
| Vehicles Available | Male | Female |
| No Vehicle | 0 (0.0%) | 0 (0.0%) |
| 1 Vehicle | 34 (23.6%) | 45 (29.8%) |
| 2 Vehicles | 76 (52.8%) | 69 (45.7%) |
| 3 Vehicles | 34 (23.6%) | 33 (21.8%) |
| 4 Vehicles | 0 (0.0%) | 0 (0.0%) |
| 5 or more Vehicles | 0 (0.0%) | 4 (2.6%) |
| Total | 144 (100.0%) | 151 (100.0%) |
Commute Time in Roscoe borough
The most frequently occuring commute durations in Roscoe borough are 15 to 19 minutes (67 commuters, 26.8%), 30 to 34 minutes (44 commuters, 17.6%), and 5 to 9 minutes (38 commuters, 15.2%).
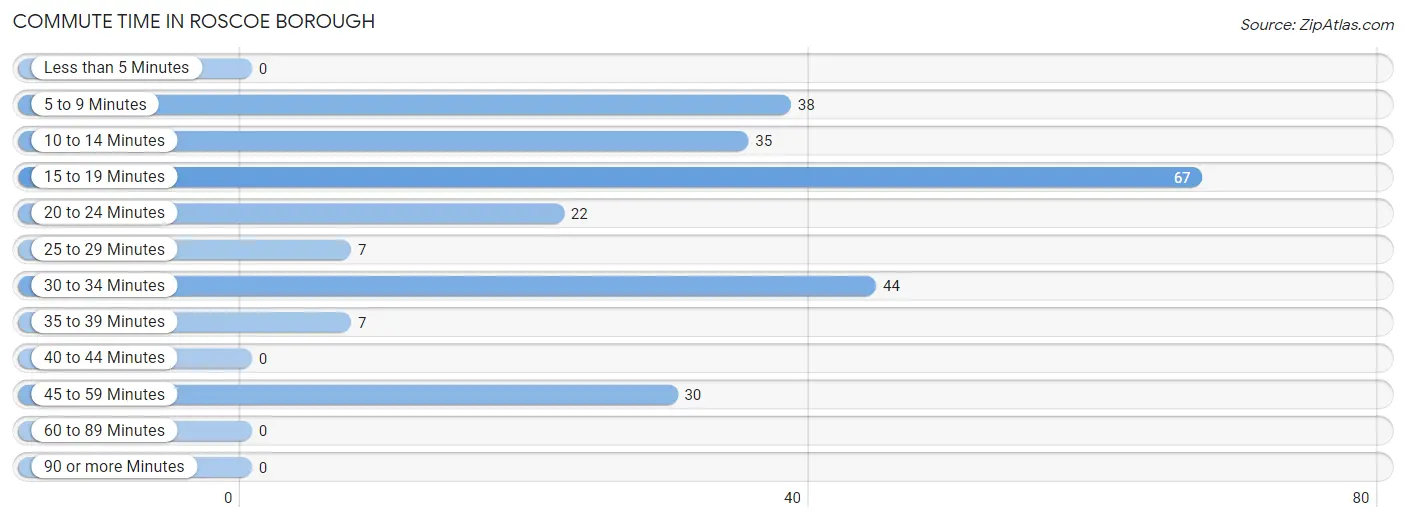
| Commute Time | # Commuters | % Commuters |
| Less than 5 Minutes | 0 | 0.0% |
| 5 to 9 Minutes | 38 | 15.2% |
| 10 to 14 Minutes | 35 | 14.0% |
| 15 to 19 Minutes | 67 | 26.8% |
| 20 to 24 Minutes | 22 | 8.8% |
| 25 to 29 Minutes | 7 | 2.8% |
| 30 to 34 Minutes | 44 | 17.6% |
| 35 to 39 Minutes | 7 | 2.8% |
| 40 to 44 Minutes | 0 | 0.0% |
| 45 to 59 Minutes | 30 | 12.0% |
| 60 to 89 Minutes | 0 | 0.0% |
| 90 or more Minutes | 0 | 0.0% |
Commute Time by Sex in Roscoe borough
The most common commute times in Roscoe borough are 15 to 19 minutes (40 commuters, 36.0%) for males and 30 to 34 minutes (31 commuters, 22.3%) for females.
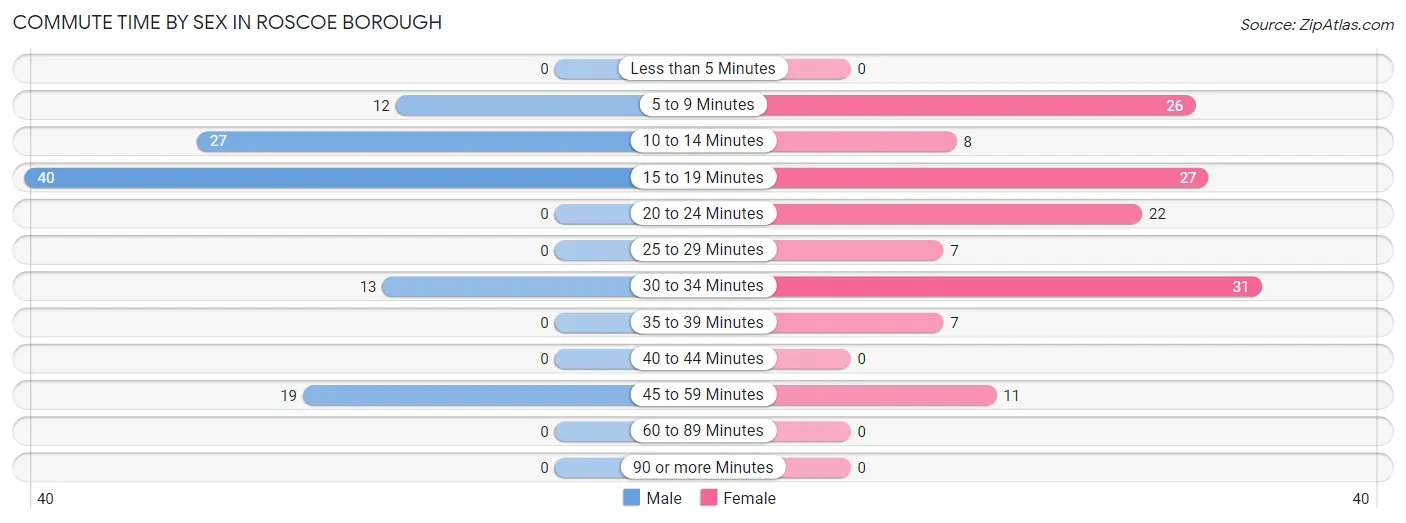
| Commute Time | Male | Female |
| Less than 5 Minutes | 0 (0.0%) | 0 (0.0%) |
| 5 to 9 Minutes | 12 (10.8%) | 26 (18.7%) |
| 10 to 14 Minutes | 27 (24.3%) | 8 (5.8%) |
| 15 to 19 Minutes | 40 (36.0%) | 27 (19.4%) |
| 20 to 24 Minutes | 0 (0.0%) | 22 (15.8%) |
| 25 to 29 Minutes | 0 (0.0%) | 7 (5.0%) |
| 30 to 34 Minutes | 13 (11.7%) | 31 (22.3%) |
| 35 to 39 Minutes | 0 (0.0%) | 7 (5.0%) |
| 40 to 44 Minutes | 0 (0.0%) | 0 (0.0%) |
| 45 to 59 Minutes | 19 (17.1%) | 11 (7.9%) |
| 60 to 89 Minutes | 0 (0.0%) | 0 (0.0%) |
| 90 or more Minutes | 0 (0.0%) | 0 (0.0%) |
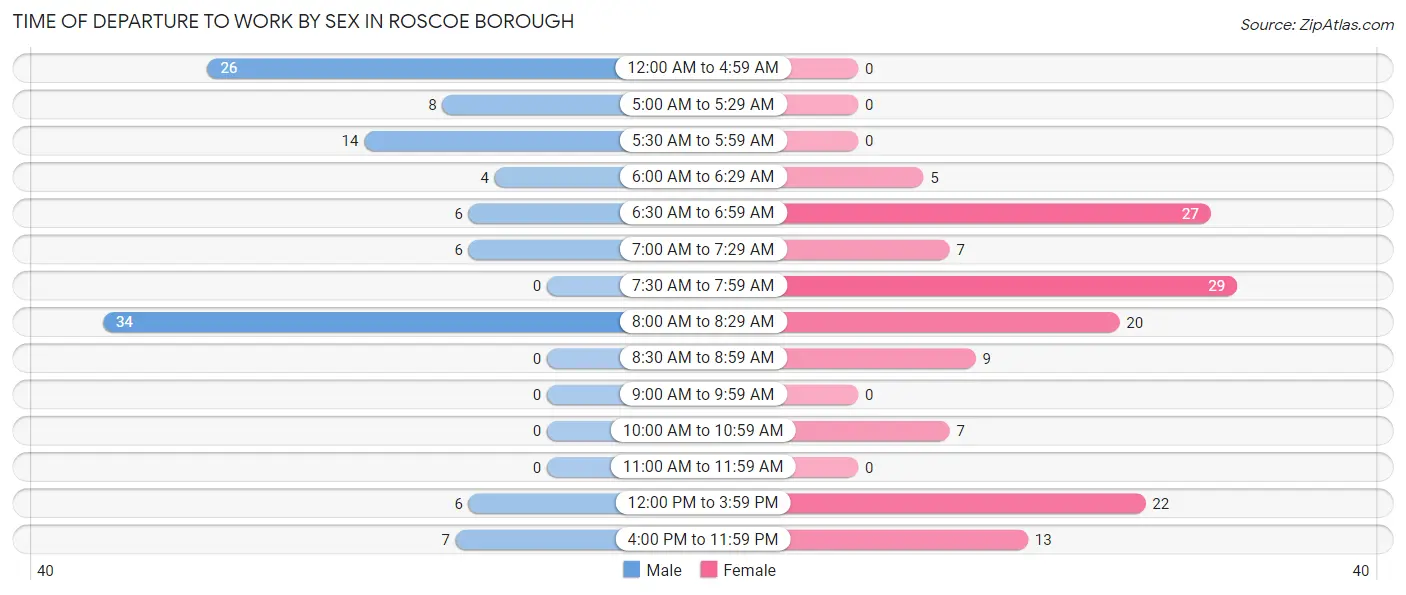
Time of Departure to Work by Sex in Roscoe borough
The most frequent times of departure to work in Roscoe borough are 8:00 AM to 8:29 AM (34, 30.6%) for males and 7:30 AM to 7:59 AM (29, 20.9%) for females.
| Time of Departure | Male | Female |
| 12:00 AM to 4:59 AM | 26 (23.4%) | 0 (0.0%) |
| 5:00 AM to 5:29 AM | 8 (7.2%) | 0 (0.0%) |
| 5:30 AM to 5:59 AM | 14 (12.6%) | 0 (0.0%) |
| 6:00 AM to 6:29 AM | 4 (3.6%) | 5 (3.6%) |
| 6:30 AM to 6:59 AM | 6 (5.4%) | 27 (19.4%) |
| 7:00 AM to 7:29 AM | 6 (5.4%) | 7 (5.0%) |
| 7:30 AM to 7:59 AM | 0 (0.0%) | 29 (20.9%) |
| 8:00 AM to 8:29 AM | 34 (30.6%) | 20 (14.4%) |
| 8:30 AM to 8:59 AM | 0 (0.0%) | 9 (6.5%) |
| 9:00 AM to 9:59 AM | 0 (0.0%) | 0 (0.0%) |
| 10:00 AM to 10:59 AM | 0 (0.0%) | 7 (5.0%) |
| 11:00 AM to 11:59 AM | 0 (0.0%) | 0 (0.0%) |
| 12:00 PM to 3:59 PM | 6 (5.4%) | 22 (15.8%) |
| 4:00 PM to 11:59 PM | 7 (6.3%) | 13 (9.3%) |
| Total | 111 (100.0%) | 139 (100.0%) |
Housing Occupancy in Roscoe borough
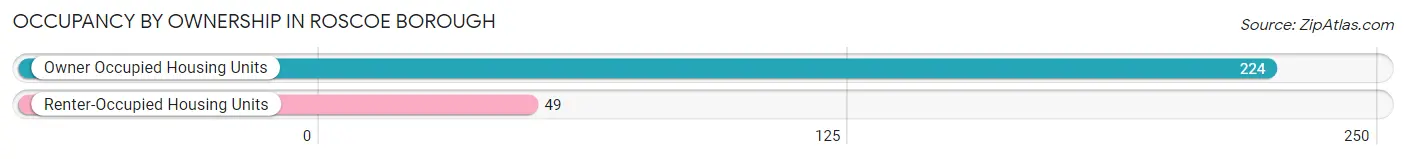
Occupancy by Ownership in Roscoe borough
Of the total 273 dwellings in Roscoe borough, owner-occupied units account for 224 (82.1%), while renter-occupied units make up 49 (17.9%).
| Occupancy | # Housing Units | % Housing Units |
| Owner Occupied Housing Units | 224 | 82.1% |
| Renter-Occupied Housing Units | 49 | 17.9% |
| Total Occupied Housing Units | 273 | 100.0% |
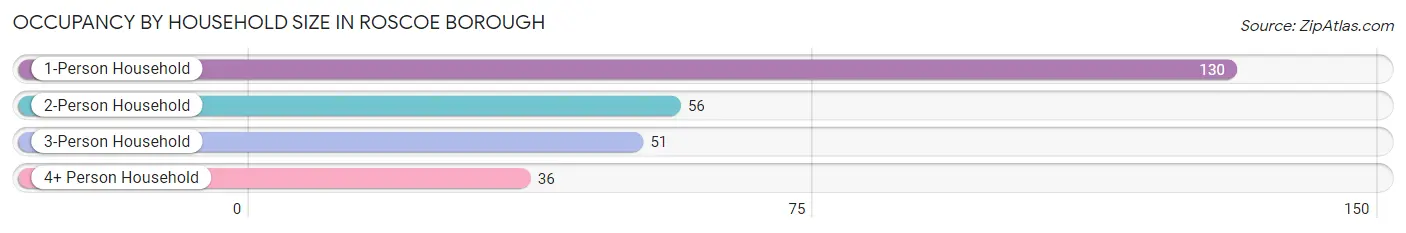
Occupancy by Household Size in Roscoe borough
| Household Size | # Housing Units | % Housing Units |
| 1-Person Household | 130 | 47.6% |
| 2-Person Household | 56 | 20.5% |
| 3-Person Household | 51 | 18.7% |
| 4+ Person Household | 36 | 13.2% |
| Total Housing Units | 273 | 100.0% |
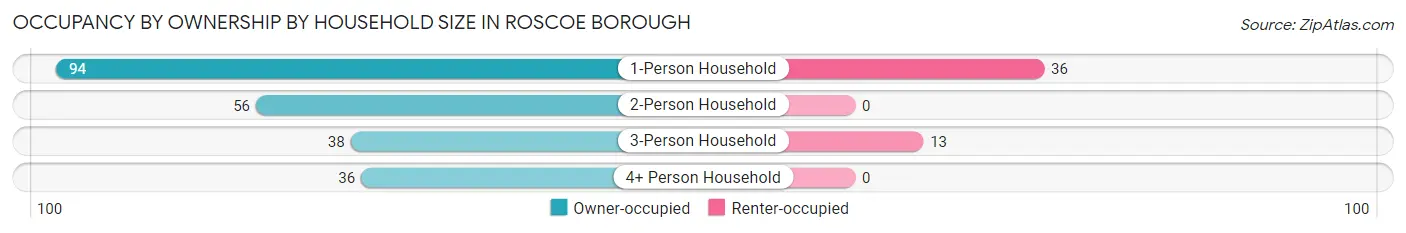
Occupancy by Ownership by Household Size in Roscoe borough
| Household Size | Owner-occupied | Renter-occupied |
| 1-Person Household | 94 (72.3%) | 36 (27.7%) |
| 2-Person Household | 56 (100.0%) | 0 (0.0%) |
| 3-Person Household | 38 (74.5%) | 13 (25.5%) |
| 4+ Person Household | 36 (100.0%) | 0 (0.0%) |
| Total Housing Units | 224 (82.1%) | 49 (17.9%) |
Occupancy by Educational Attainment in Roscoe borough
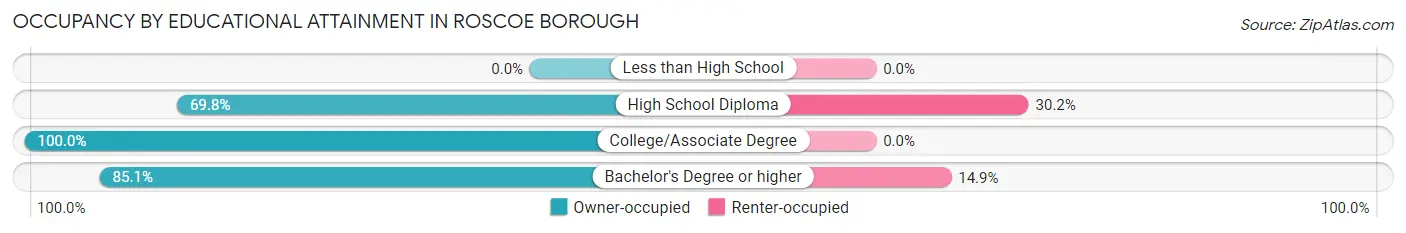
| Household Size | Owner-occupied | Renter-occupied |
| Less than High School | 0 (0.0%) | 0 (0.0%) |
| High School Diploma | 97 (69.8%) | 42 (30.2%) |
| College/Associate Degree | 87 (100.0%) | 0 (0.0%) |
| Bachelor's Degree or higher | 40 (85.1%) | 7 (14.9%) |
Occupancy by Age of Householder in Roscoe borough
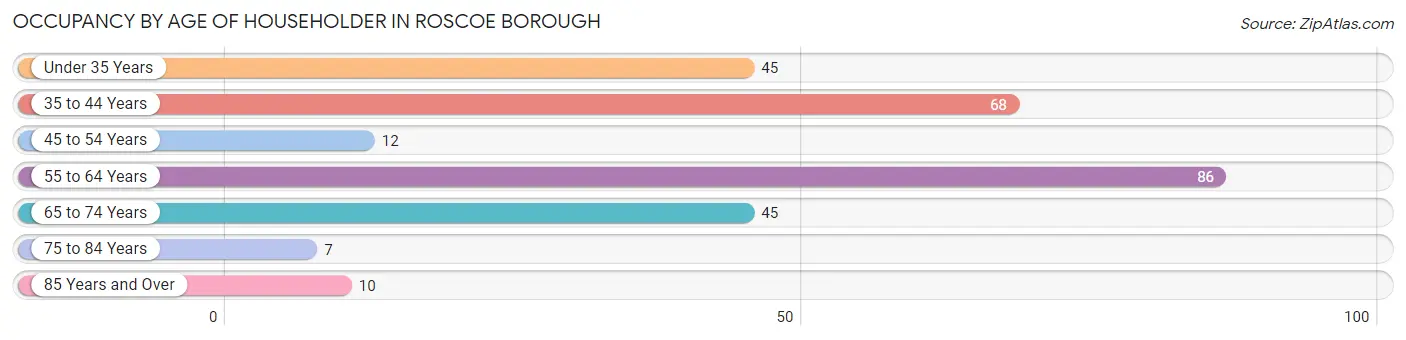
| Age Bracket | # Households | % Households |
| Under 35 Years | 45 | 16.5% |
| 35 to 44 Years | 68 | 24.9% |
| 45 to 54 Years | 12 | 4.4% |
| 55 to 64 Years | 86 | 31.5% |
| 65 to 74 Years | 45 | 16.5% |
| 75 to 84 Years | 7 | 2.6% |
| 85 Years and Over | 10 | 3.7% |
| Total | 273 | 100.0% |
Housing Finances in Roscoe borough
Median Income by Occupancy in Roscoe borough
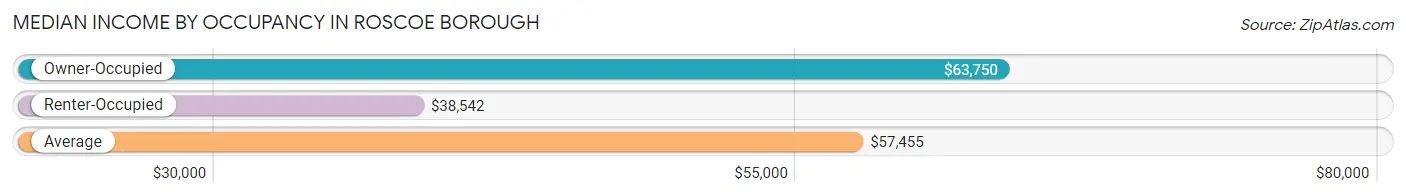
| Occupancy Type | # Households | Median Income |
| Owner-Occupied | 224 (82.1%) | $63,750 |
| Renter-Occupied | 49 (17.9%) | $38,542 |
| Average | 273 (100.0%) | $57,455 |
Occupancy by Householder Income Bracket in Roscoe borough
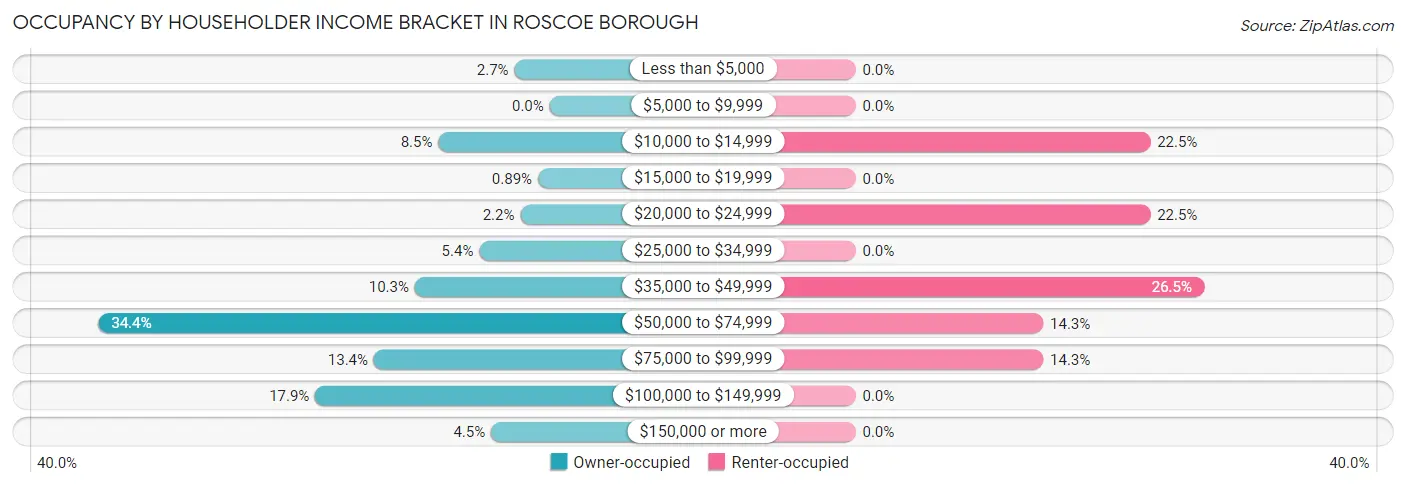
| Income Bracket | Owner-occupied | Renter-occupied |
| Less than $5,000 | 6 (2.7%) | 0 (0.0%) |
| $5,000 to $9,999 | 0 (0.0%) | 0 (0.0%) |
| $10,000 to $14,999 | 19 (8.5%) | 11 (22.5%) |
| $15,000 to $19,999 | 2 (0.9%) | 0 (0.0%) |
| $20,000 to $24,999 | 5 (2.2%) | 11 (22.5%) |
| $25,000 to $34,999 | 12 (5.4%) | 0 (0.0%) |
| $35,000 to $49,999 | 23 (10.3%) | 13 (26.5%) |
| $50,000 to $74,999 | 77 (34.4%) | 7 (14.3%) |
| $75,000 to $99,999 | 30 (13.4%) | 7 (14.3%) |
| $100,000 to $149,999 | 40 (17.9%) | 0 (0.0%) |
| $150,000 or more | 10 (4.5%) | 0 (0.0%) |
| Total | 224 (100.0%) | 49 (100.0%) |
Monthly Housing Cost Tiers in Roscoe borough
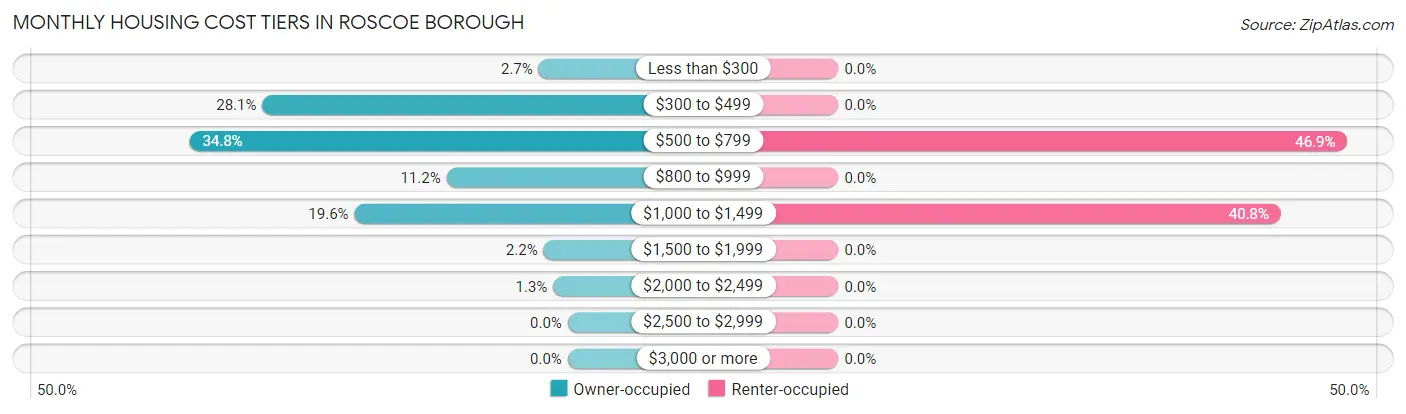
| Monthly Cost | Owner-occupied | Renter-occupied |
| Less than $300 | 6 (2.7%) | 0 (0.0%) |
| $300 to $499 | 63 (28.1%) | 0 (0.0%) |
| $500 to $799 | 78 (34.8%) | 23 (46.9%) |
| $800 to $999 | 25 (11.2%) | 0 (0.0%) |
| $1,000 to $1,499 | 44 (19.6%) | 20 (40.8%) |
| $1,500 to $1,999 | 5 (2.2%) | 0 (0.0%) |
| $2,000 to $2,499 | 3 (1.3%) | 0 (0.0%) |
| $2,500 to $2,999 | 0 (0.0%) | 0 (0.0%) |
| $3,000 or more | 0 (0.0%) | 0 (0.0%) |
| Total | 224 (100.0%) | 49 (100.0%) |
Physical Housing Characteristics in Roscoe borough
Housing Structures in Roscoe borough
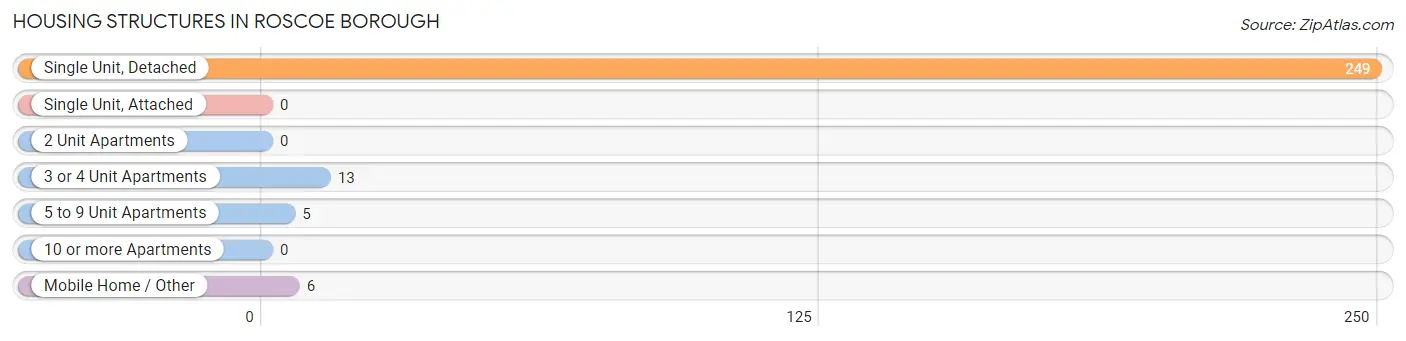
| Structure Type | # Housing Units | % Housing Units |
| Single Unit, Detached | 249 | 91.2% |
| Single Unit, Attached | 0 | 0.0% |
| 2 Unit Apartments | 0 | 0.0% |
| 3 or 4 Unit Apartments | 13 | 4.8% |
| 5 to 9 Unit Apartments | 5 | 1.8% |
| 10 or more Apartments | 0 | 0.0% |
| Mobile Home / Other | 6 | 2.2% |
| Total | 273 | 100.0% |
Housing Structures by Occupancy in Roscoe borough
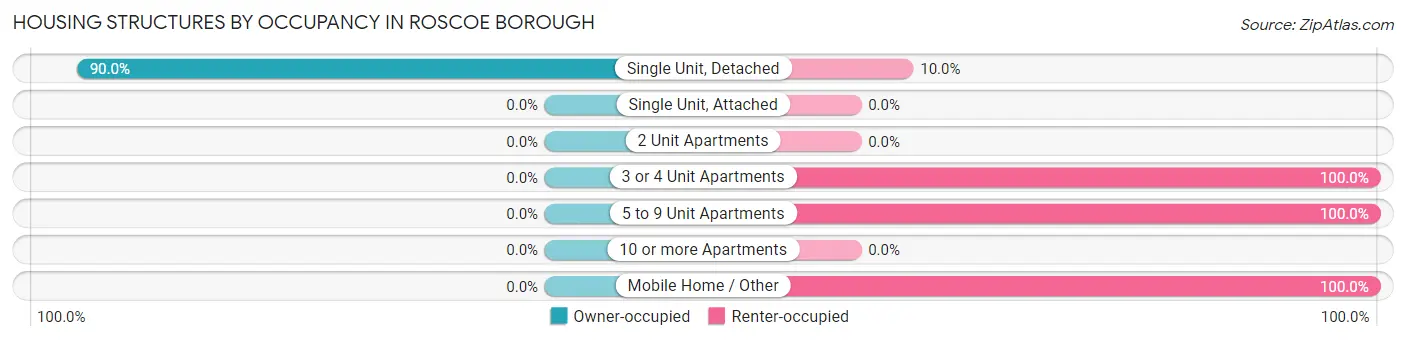
| Structure Type | Owner-occupied | Renter-occupied |
| Single Unit, Detached | 224 (90.0%) | 25 (10.0%) |
| Single Unit, Attached | 0 (0.0%) | 0 (0.0%) |
| 2 Unit Apartments | 0 (0.0%) | 0 (0.0%) |
| 3 or 4 Unit Apartments | 0 (0.0%) | 13 (100.0%) |
| 5 to 9 Unit Apartments | 0 (0.0%) | 5 (100.0%) |
| 10 or more Apartments | 0 (0.0%) | 0 (0.0%) |
| Mobile Home / Other | 0 (0.0%) | 6 (100.0%) |
| Total | 224 (82.1%) | 49 (17.9%) |
Housing Structures by Number of Rooms in Roscoe borough
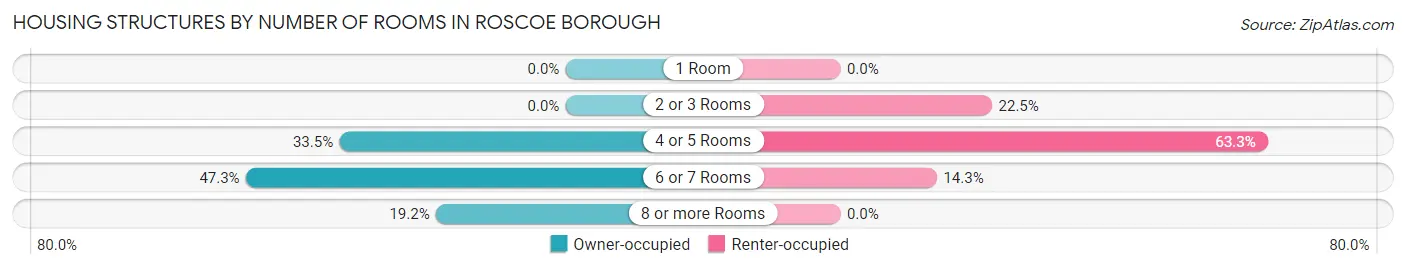
| Number of Rooms | Owner-occupied | Renter-occupied |
| 1 Room | 0 (0.0%) | 0 (0.0%) |
| 2 or 3 Rooms | 0 (0.0%) | 11 (22.5%) |
| 4 or 5 Rooms | 75 (33.5%) | 31 (63.3%) |
| 6 or 7 Rooms | 106 (47.3%) | 7 (14.3%) |
| 8 or more Rooms | 43 (19.2%) | 0 (0.0%) |
| Total | 224 (100.0%) | 49 (100.0%) |
Housing Structure by Heating Type in Roscoe borough
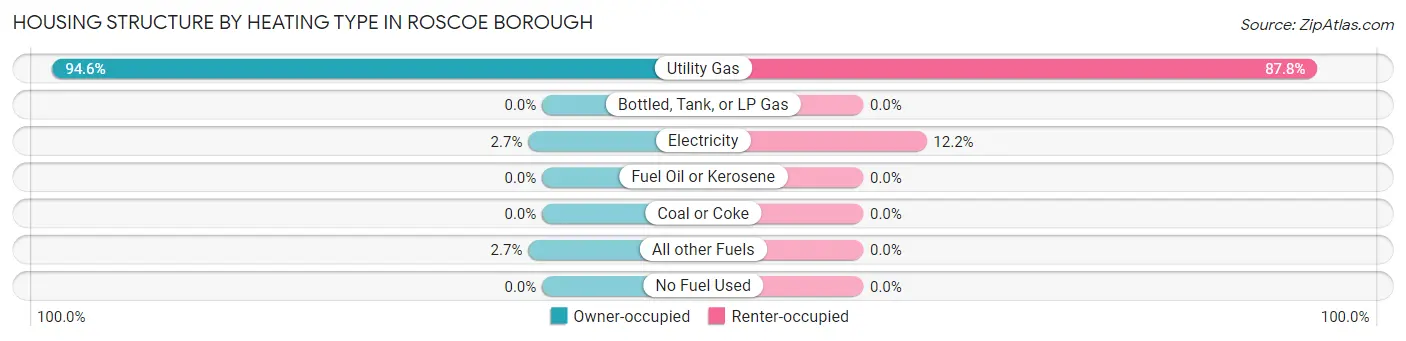
| Heating Type | Owner-occupied | Renter-occupied |
| Utility Gas | 212 (94.6%) | 43 (87.8%) |
| Bottled, Tank, or LP Gas | 0 (0.0%) | 0 (0.0%) |
| Electricity | 6 (2.7%) | 6 (12.2%) |
| Fuel Oil or Kerosene | 0 (0.0%) | 0 (0.0%) |
| Coal or Coke | 0 (0.0%) | 0 (0.0%) |
| All other Fuels | 6 (2.7%) | 0 (0.0%) |
| No Fuel Used | 0 (0.0%) | 0 (0.0%) |
| Total | 224 (100.0%) | 49 (100.0%) |
Household Vehicle Usage in Roscoe borough
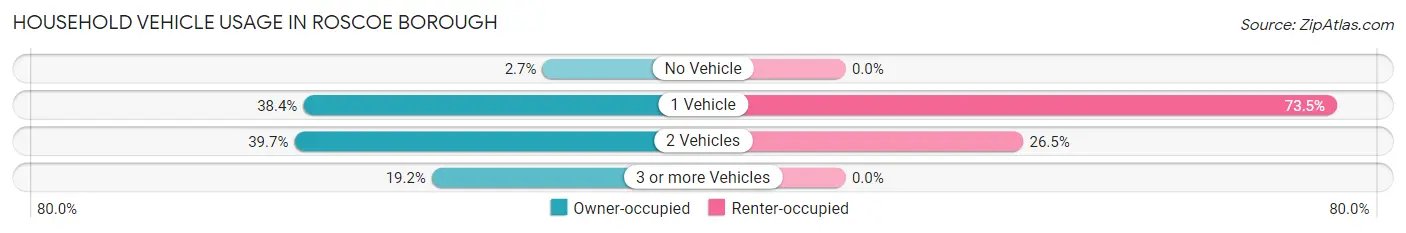
| Vehicles per Household | Owner-occupied | Renter-occupied |
| No Vehicle | 6 (2.7%) | 0 (0.0%) |
| 1 Vehicle | 86 (38.4%) | 36 (73.5%) |
| 2 Vehicles | 89 (39.7%) | 13 (26.5%) |
| 3 or more Vehicles | 43 (19.2%) | 0 (0.0%) |
| Total | 224 (100.0%) | 49 (100.0%) |
Real Estate & Mortgages in Roscoe borough
Real Estate and Mortgage Overview in Roscoe borough
| Characteristic | Without Mortgage | With Mortgage |
| Housing Units | 112 | 112 |
| Median Property Value | $113,600 | $98,600 |
| Median Household Income | $57,857 | $0 |
| Monthly Housing Costs | $450 | $0 |
| Real Estate Taxes | $1,196 | $0 |
Property Value by Mortgage Status in Roscoe borough
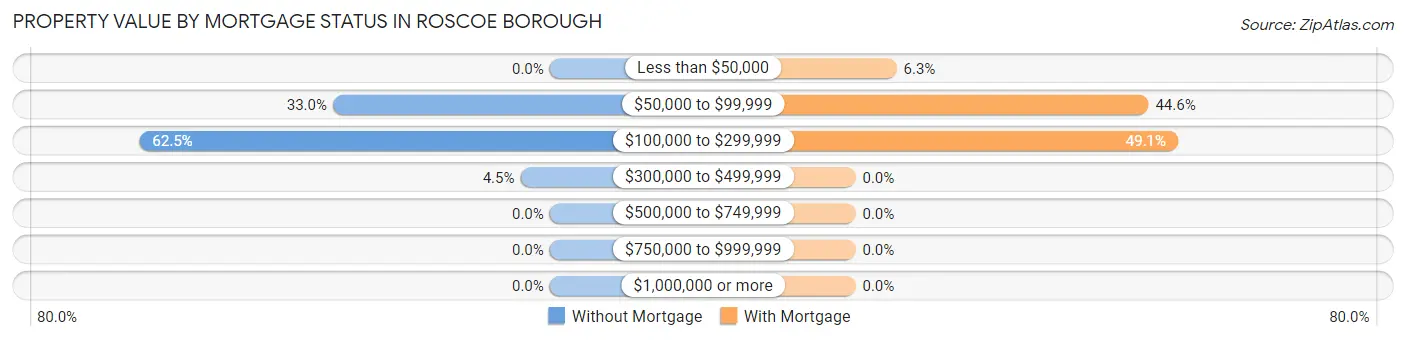
| Property Value | Without Mortgage | With Mortgage |
| Less than $50,000 | 0 (0.0%) | 7 (6.2%) |
| $50,000 to $99,999 | 37 (33.0%) | 50 (44.6%) |
| $100,000 to $299,999 | 70 (62.5%) | 55 (49.1%) |
| $300,000 to $499,999 | 5 (4.5%) | 0 (0.0%) |
| $500,000 to $749,999 | 0 (0.0%) | 0 (0.0%) |
| $750,000 to $999,999 | 0 (0.0%) | 0 (0.0%) |
| $1,000,000 or more | 0 (0.0%) | 0 (0.0%) |
| Total | 112 (100.0%) | 112 (100.0%) |
Household Income by Mortgage Status in Roscoe borough
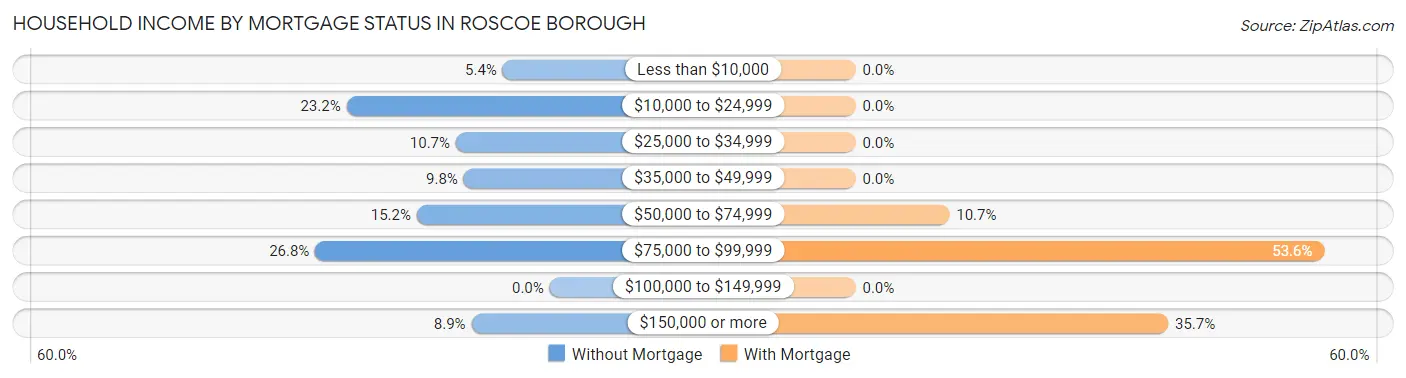
| Household Income | Without Mortgage | With Mortgage |
| Less than $10,000 | 6 (5.4%) | 0 (0.0%) |
| $10,000 to $24,999 | 26 (23.2%) | 0 (0.0%) |
| $25,000 to $34,999 | 12 (10.7%) | 0 (0.0%) |
| $35,000 to $49,999 | 11 (9.8%) | 0 (0.0%) |
| $50,000 to $74,999 | 17 (15.2%) | 12 (10.7%) |
| $75,000 to $99,999 | 30 (26.8%) | 60 (53.6%) |
| $100,000 to $149,999 | 0 (0.0%) | 0 (0.0%) |
| $150,000 or more | 10 (8.9%) | 40 (35.7%) |
| Total | 112 (100.0%) | 112 (100.0%) |
Property Value to Household Income Ratio in Roscoe borough
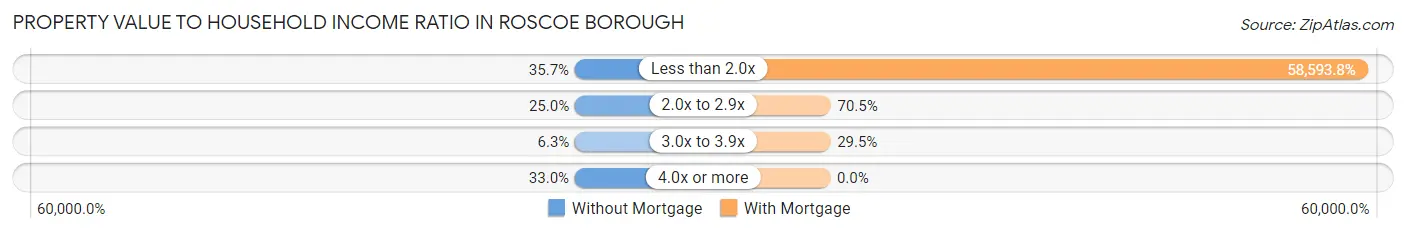
| Value-to-Income Ratio | Without Mortgage | With Mortgage |
| Less than 2.0x | 40 (35.7%) | 65,625 (58,593.8%) |
| 2.0x to 2.9x | 28 (25.0%) | 79 (70.5%) |
| 3.0x to 3.9x | 7 (6.2%) | 33 (29.5%) |
| 4.0x or more | 37 (33.0%) | 0 (0.0%) |
| Total | 112 (100.0%) | 112 (100.0%) |
Real Estate Taxes by Mortgage Status in Roscoe borough
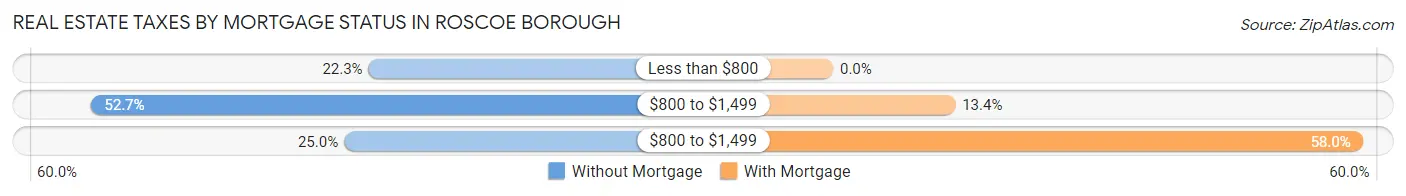
| Property Taxes | Without Mortgage | With Mortgage |
| Less than $800 | 25 (22.3%) | 0 (0.0%) |
| $800 to $1,499 | 59 (52.7%) | 15 (13.4%) |
| $800 to $1,499 | 28 (25.0%) | 65 (58.0%) |
| Total | 112 (100.0%) | 112 (100.0%) |
Health & Disability in Roscoe borough
Health Insurance Coverage by Age in Roscoe borough
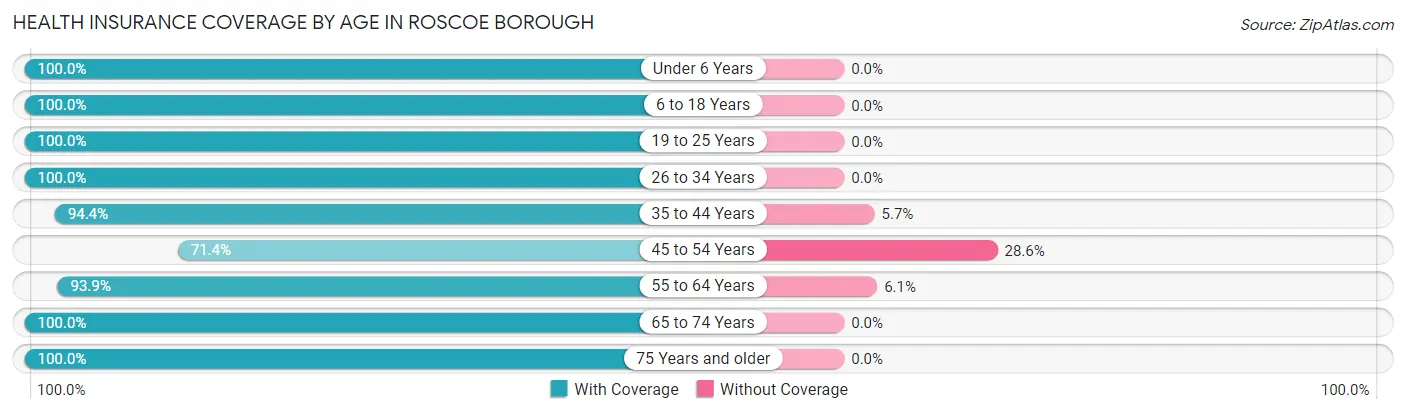
| Age Bracket | With Coverage | Without Coverage |
| Under 6 Years | 54 (100.0%) | 0 (0.0%) |
| 6 to 18 Years | 100 (100.0%) | 0 (0.0%) |
| 19 to 25 Years | 36 (100.0%) | 0 (0.0%) |
| 26 to 34 Years | 60 (100.0%) | 0 (0.0%) |
| 35 to 44 Years | 117 (94.4%) | 7 (5.7%) |
| 45 to 54 Years | 20 (71.4%) | 8 (28.6%) |
| 55 to 64 Years | 107 (93.9%) | 7 (6.1%) |
| 65 to 74 Years | 74 (100.0%) | 0 (0.0%) |
| 75 Years and older | 27 (100.0%) | 0 (0.0%) |
| Total | 595 (96.4%) | 22 (3.6%) |
Health Insurance Coverage by Citizenship Status in Roscoe borough
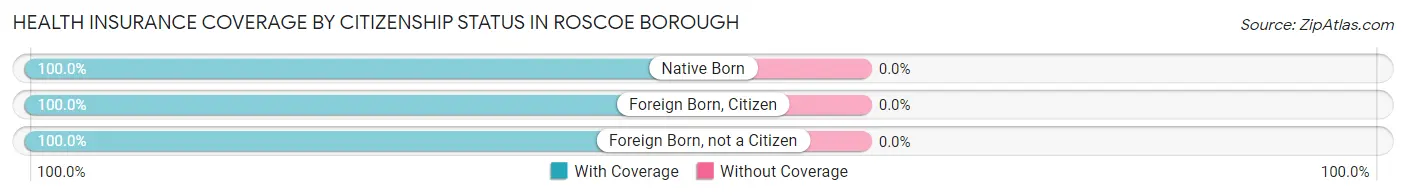
| Citizenship Status | With Coverage | Without Coverage |
| Native Born | 54 (100.0%) | 0 (0.0%) |
| Foreign Born, Citizen | 100 (100.0%) | 0 (0.0%) |
| Foreign Born, not a Citizen | 36 (100.0%) | 0 (0.0%) |
Health Insurance Coverage by Household Income in Roscoe borough
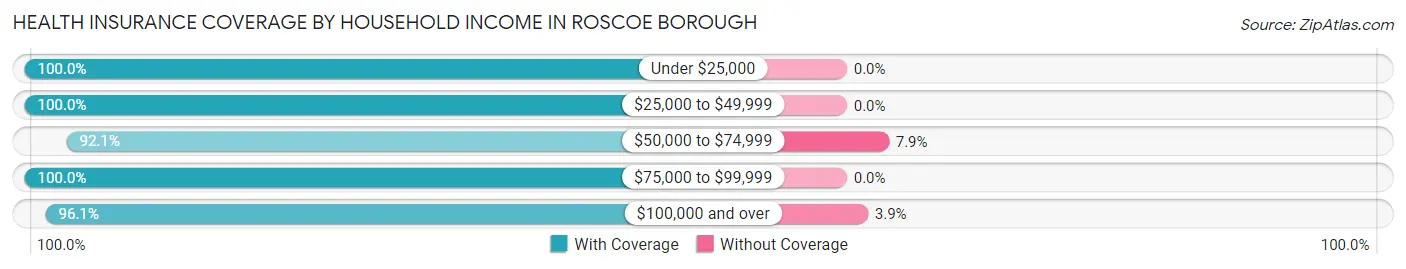
| Household Income | With Coverage | Without Coverage |
| Under $25,000 | 64 (100.0%) | 0 (0.0%) |
| $25,000 to $49,999 | 73 (100.0%) | 0 (0.0%) |
| $50,000 to $74,999 | 164 (92.1%) | 14 (7.9%) |
| $75,000 to $99,999 | 97 (100.0%) | 0 (0.0%) |
| $100,000 and over | 195 (96.1%) | 8 (3.9%) |
Public vs Private Health Insurance Coverage by Age in Roscoe borough
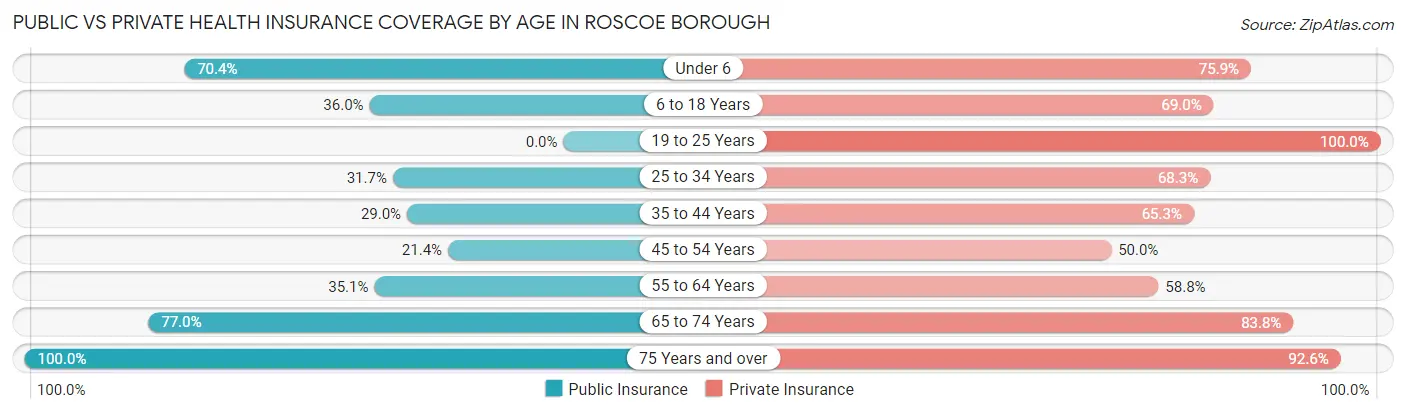
| Age Bracket | Public Insurance | Private Insurance |
| Under 6 | 38 (70.4%) | 41 (75.9%) |
| 6 to 18 Years | 36 (36.0%) | 69 (69.0%) |
| 19 to 25 Years | 0 (0.0%) | 36 (100.0%) |
| 25 to 34 Years | 19 (31.7%) | 41 (68.3%) |
| 35 to 44 Years | 36 (29.0%) | 81 (65.3%) |
| 45 to 54 Years | 6 (21.4%) | 14 (50.0%) |
| 55 to 64 Years | 40 (35.1%) | 67 (58.8%) |
| 65 to 74 Years | 57 (77.0%) | 62 (83.8%) |
| 75 Years and over | 27 (100.0%) | 25 (92.6%) |
| Total | 259 (42.0%) | 436 (70.7%) |
Disability Status by Sex by Age in Roscoe borough
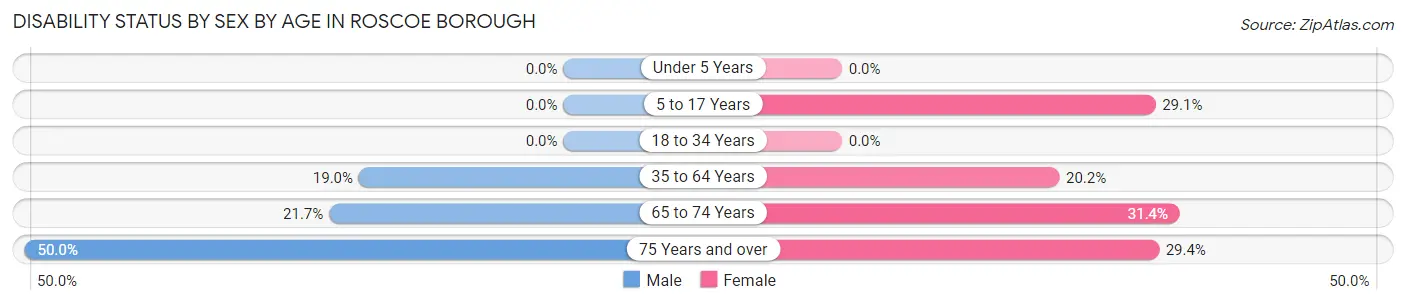
| Age Bracket | Male | Female |
| Under 5 Years | 0 (0.0%) | 0 (0.0%) |
| 5 to 17 Years | 0 (0.0%) | 16 (29.1%) |
| 18 to 34 Years | 0 (0.0%) | 0 (0.0%) |
| 35 to 64 Years | 26 (19.0%) | 26 (20.2%) |
| 65 to 74 Years | 5 (21.7%) | 16 (31.4%) |
| 75 Years and over | 5 (50.0%) | 5 (29.4%) |
Disability Class by Sex by Age in Roscoe borough
Disability Class: Hearing Difficulty
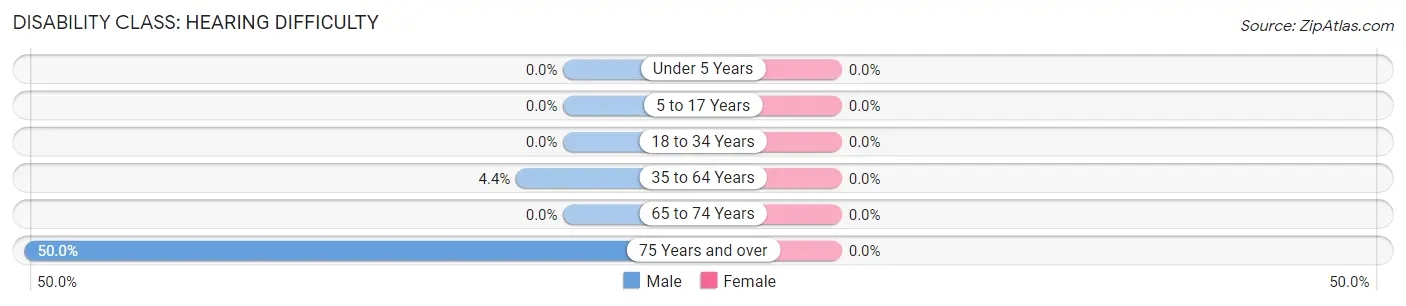
| Age Bracket | Male | Female |
| Under 5 Years | 0 (0.0%) | 0 (0.0%) |
| 5 to 17 Years | 0 (0.0%) | 0 (0.0%) |
| 18 to 34 Years | 0 (0.0%) | 0 (0.0%) |
| 35 to 64 Years | 6 (4.4%) | 0 (0.0%) |
| 65 to 74 Years | 0 (0.0%) | 0 (0.0%) |
| 75 Years and over | 5 (50.0%) | 0 (0.0%) |
Disability Class: Vision Difficulty
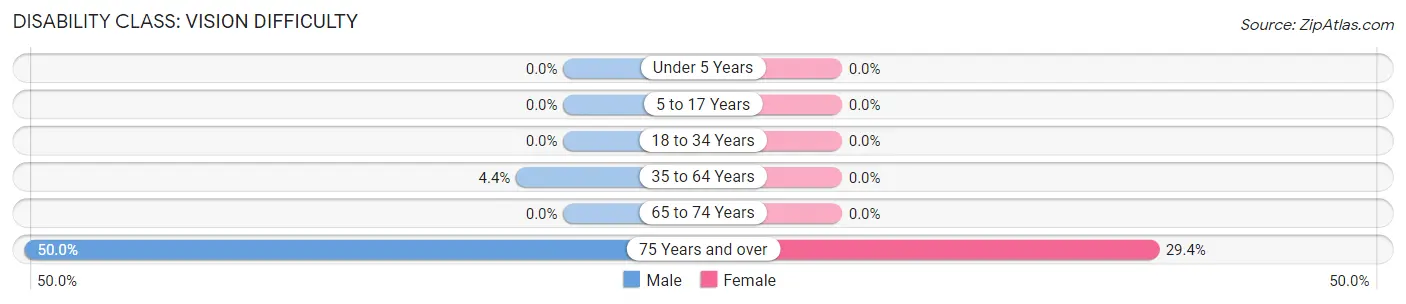
| Age Bracket | Male | Female |
| Under 5 Years | 0 (0.0%) | 0 (0.0%) |
| 5 to 17 Years | 0 (0.0%) | 0 (0.0%) |
| 18 to 34 Years | 0 (0.0%) | 0 (0.0%) |
| 35 to 64 Years | 6 (4.4%) | 0 (0.0%) |
| 65 to 74 Years | 0 (0.0%) | 0 (0.0%) |
| 75 Years and over | 5 (50.0%) | 5 (29.4%) |
Disability Class: Cognitive Difficulty
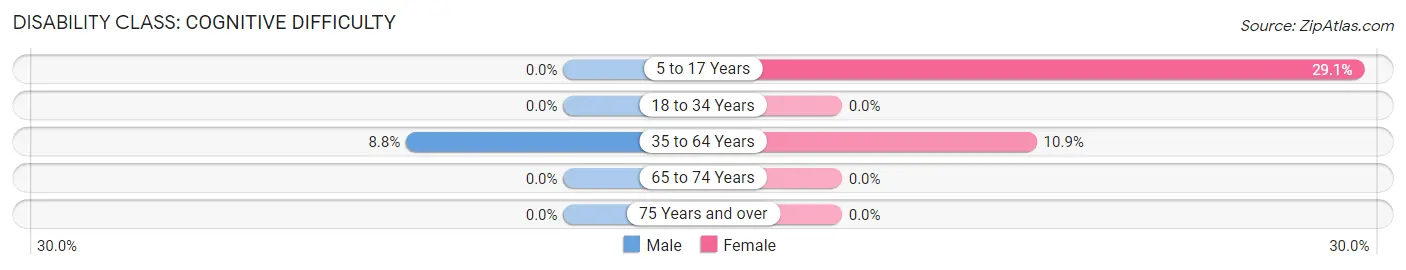
| Age Bracket | Male | Female |
| 5 to 17 Years | 0 (0.0%) | 16 (29.1%) |
| 18 to 34 Years | 0 (0.0%) | 0 (0.0%) |
| 35 to 64 Years | 12 (8.8%) | 14 (10.8%) |
| 65 to 74 Years | 0 (0.0%) | 0 (0.0%) |
| 75 Years and over | 0 (0.0%) | 0 (0.0%) |
Disability Class: Ambulatory Difficulty
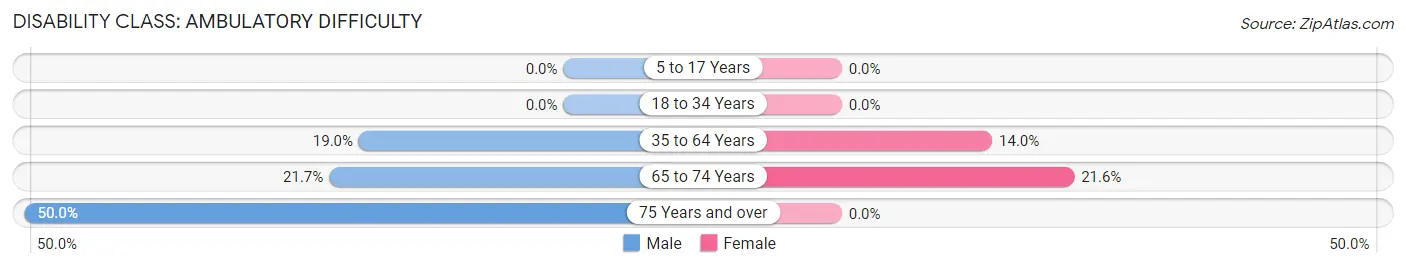
| Age Bracket | Male | Female |
| 5 to 17 Years | 0 (0.0%) | 0 (0.0%) |
| 18 to 34 Years | 0 (0.0%) | 0 (0.0%) |
| 35 to 64 Years | 26 (19.0%) | 18 (14.0%) |
| 65 to 74 Years | 5 (21.7%) | 11 (21.6%) |
| 75 Years and over | 5 (50.0%) | 0 (0.0%) |
Disability Class: Self-Care Difficulty
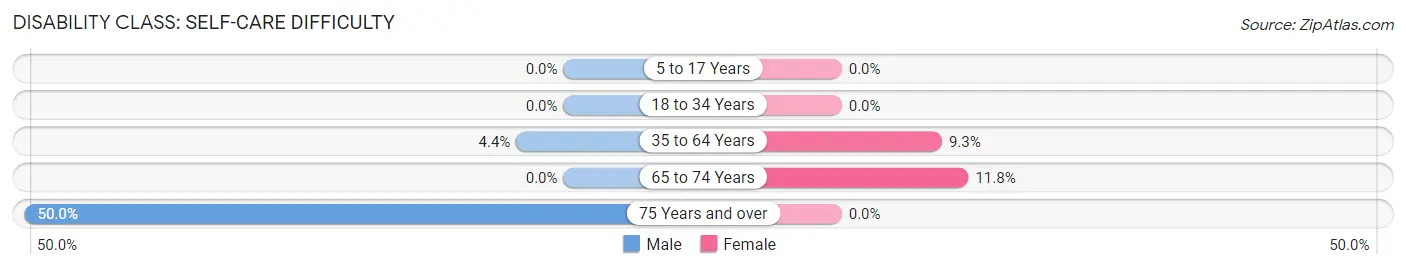
| Age Bracket | Male | Female |
| 5 to 17 Years | 0 (0.0%) | 0 (0.0%) |
| 18 to 34 Years | 0 (0.0%) | 0 (0.0%) |
| 35 to 64 Years | 6 (4.4%) | 12 (9.3%) |
| 65 to 74 Years | 0 (0.0%) | 6 (11.8%) |
| 75 Years and over | 5 (50.0%) | 0 (0.0%) |
Technology Access in Roscoe borough
Computing Device Access in Roscoe borough
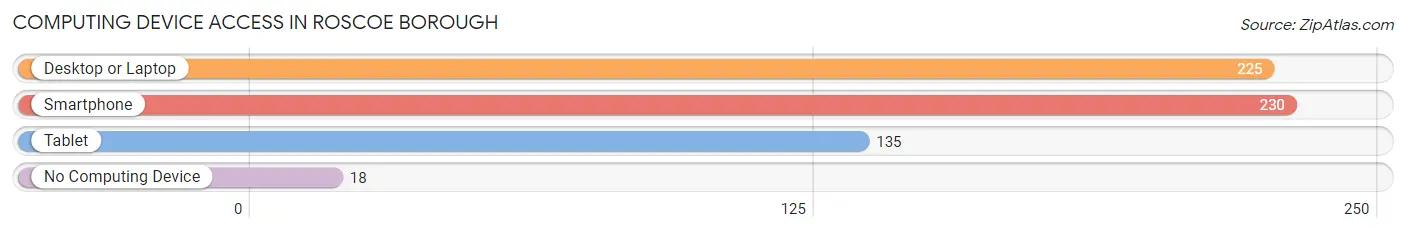
| Device Type | # Households | % Households |
| Desktop or Laptop | 225 | 82.4% |
| Smartphone | 230 | 84.3% |
| Tablet | 135 | 49.4% |
| No Computing Device | 18 | 6.6% |
| Total | 273 | 100.0% |
Internet Access in Roscoe borough
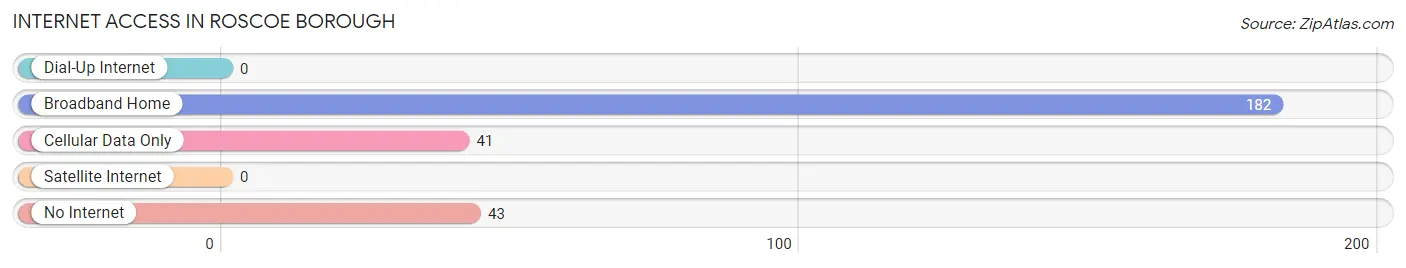
| Internet Type | # Households | % Households |
| Dial-Up Internet | 0 | 0.0% |
| Broadband Home | 182 | 66.7% |
| Cellular Data Only | 41 | 15.0% |
| Satellite Internet | 0 | 0.0% |
| No Internet | 43 | 15.8% |
| Total | 273 | 100.0% |
Roscoe borough Summary
Roscoe Borough is a small borough located in the state of Pennsylvania. It is situated in the northern part of the state, in the county of Susquehanna. The borough is located in the Endless Mountains region of the state, and is surrounded by the Susquehanna River. The population of Roscoe Borough was 1,845 as of the 2010 census.
History
Roscoe Borough was first settled in the late 1700s by a group of settlers from Connecticut. The area was originally known as “The Forks” due to its location at the confluence of the Susquehanna and Lackawanna Rivers. The first settler in the area was John Roscoe, who established a sawmill and gristmill in the area. The area was officially incorporated as a borough in 1845.
In the late 1800s, the borough experienced a period of growth and development. The Lackawanna and Wyoming Valley Railroad was built through the area, connecting it to other parts of the state. This allowed for the development of the coal and lumber industries in the area. The borough also became a popular tourist destination, with many visitors coming to enjoy the natural beauty of the area.
Geography
Roscoe Borough is located in the northern part of Pennsylvania, in the Endless Mountains region. It is situated in the county of Susquehanna, and is surrounded by the Susquehanna River. The borough covers an area of 1.2 square miles, and has a population of 1,845 as of the 2010 census.
The borough is located in a rural area, and is surrounded by forests and rolling hills. The terrain is mostly flat, with some areas of rolling hills. The climate in the area is humid continental, with cold winters and warm summers.
Economy
The economy of Roscoe Borough is largely based on agriculture and tourism. The area is home to several farms, which produce a variety of crops, including corn, soybeans, and hay. The borough is also home to several tourist attractions, including the Lackawanna and Wyoming Valley Railroad, which offers scenic train rides through the area.
The borough is also home to several small businesses, including restaurants, shops, and other services. The borough is also home to several manufacturing companies, which produce a variety of products, including furniture, clothing, and electronics.
Demographics
As of the 2010 census, the population of Roscoe Borough was 1,845. The racial makeup of the borough was 97.3% White, 0.7% African American, 0.2% Native American, 0.2% Asian, 0.2% from other races, and 1.6% from two or more races. Hispanic or Latino of any race were 0.9% of the population.
The median income for a household in the borough was $41,250, and the median income for a family was $50,000. The per capita income for the borough was $20,845. About 8.3% of families and 10.2% of the population were below the poverty line, including 14.3% of those under age 18 and 6.2% of those age 65 or over.
Common Questions
What is the Total Population of Roscoe borough?
Total Population of Roscoe borough is 617.
What is the Total Male Population of Roscoe borough?
Total Male Population of Roscoe borough is 284.
What is the Total Female Population of Roscoe borough?
Total Female Population of Roscoe borough is 333.
What is the Ratio of Males per 100 Females in Roscoe borough?
There are 85.29 Males per 100 Females in Roscoe borough.
What is the Ratio of Females per 100 Males in Roscoe borough?
There are 117.25 Females per 100 Males in Roscoe borough.
What is the Median Population Age in Roscoe borough?
Median Population Age in Roscoe borough is 39.3 Years.
What is the Average Family Size in Roscoe borough
Average Family Size in Roscoe borough is 3.3 People.
What is the Average Household Size in Roscoe borough
Average Household Size in Roscoe borough is 2.2 People.
What is Per Capita Income in Roscoe borough?
Per Capita income in Roscoe borough is $30,984.
What is the Median Family Income in Roscoe borough?
Median Family Income in Roscoe borough is $66,875.
What is the Median Household income in Roscoe borough?
Median Household Income in Roscoe borough is $57,455.
What is Income or Wage Gap in Roscoe borough?
Income or Wage Gap in Roscoe borough is 47.0%.
Women in Roscoe borough earn 53.0 cents for every dollar earned by a man.
What is Inequality or Gini Index in Roscoe borough?
Inequality or Gini Index in Roscoe borough is 0.36.
How Large is the Labor Force in Roscoe borough?
There are 316 People in the Labor Forcein in Roscoe borough.
What is the Percentage of People in the Labor Force in Roscoe borough?
63.2% of People are in the Labor Force in Roscoe borough.
What is the Unemployment Rate in Roscoe borough?
Unemployment Rate in Roscoe borough is 3.8%.