Lewis Run borough, PA
Lewis Run borough Overview
690
TOTAL POPULATION
383
MALE POPULATION
307
FEMALE POPULATION
124.76
MALES / 100 FEMALES
80.16
FEMALES / 100 MALES
33.7
MEDIAN AGE
3.2
AVG FAMILY SIZE
2.7
AVG HOUSEHOLD SIZE
$30,112
PER CAPITA INCOME
$84,167
AVG FAMILY INCOME
$75,750
AVG HOUSEHOLD INCOME
23.5%
WAGE / INCOME GAP [ % ]
76.5¢/ $1
WAGE / INCOME GAP [ $ ]
0.37
INEQUALITY / GINI INDEX
346
LABOR FORCE [ PEOPLE ]
65.0%
PERCENT IN LABOR FORCE
3.2%
UNEMPLOYMENT RATE
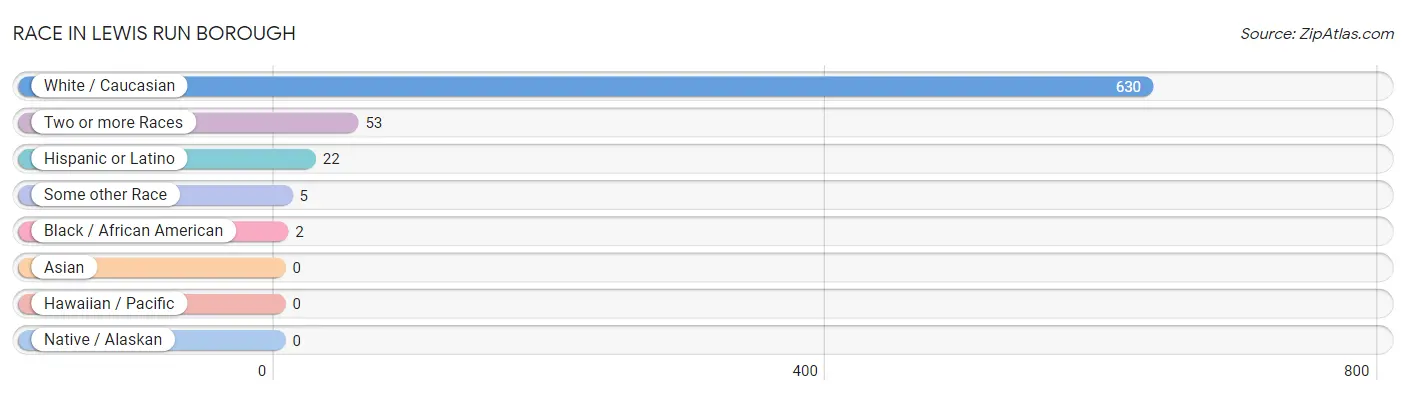
Race in Lewis Run borough
The most populous races in Lewis Run borough are White / Caucasian (630 | 91.3%), Two or more Races (53 | 7.7%), and Hispanic or Latino (22 | 3.2%).
| Race | # Population | % Population |
| Asian | 0 | 0.0% |
| Black / African American | 2 | 0.3% |
| Hawaiian / Pacific | 0 | 0.0% |
| Hispanic or Latino | 22 | 3.2% |
| Native / Alaskan | 0 | 0.0% |
| White / Caucasian | 630 | 91.3% |
| Two or more Races | 53 | 7.7% |
| Some other Race | 5 | 0.7% |
| Total | 690 | 100.0% |
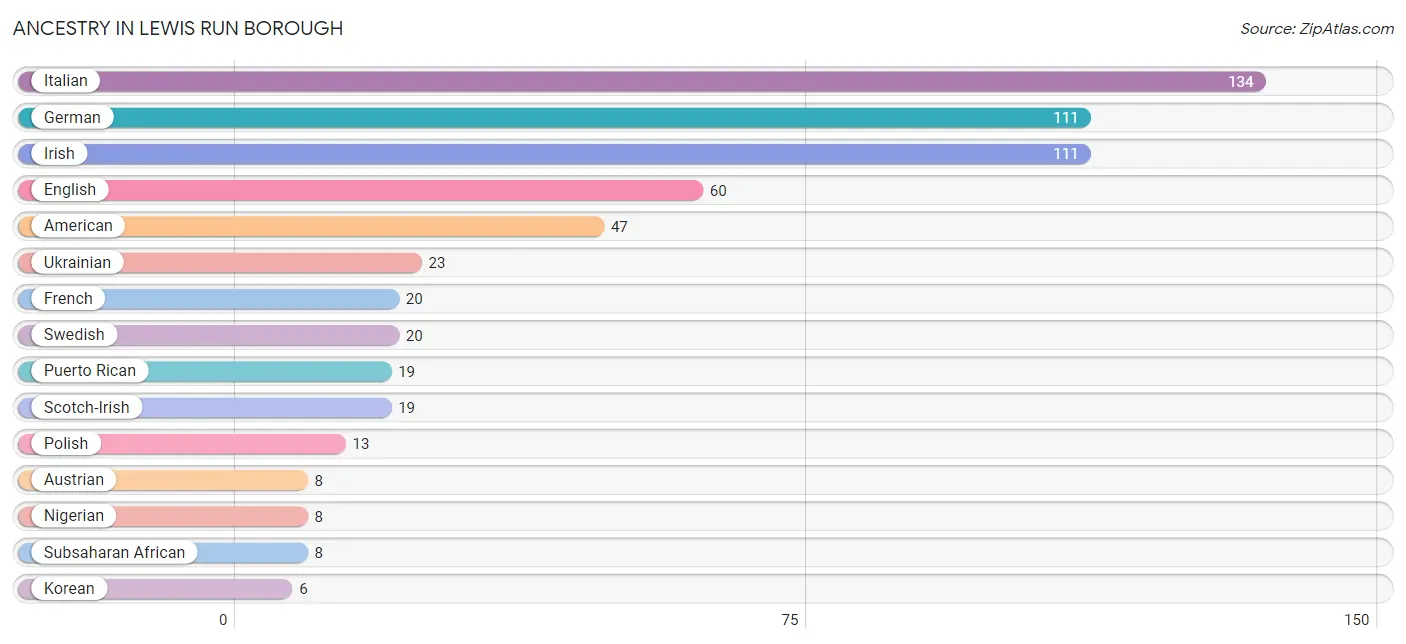
Ancestry in Lewis Run borough
The most populous ancestries reported in Lewis Run borough are Italian (134 | 19.4%), German (111 | 16.1%), Irish (111 | 16.1%), English (60 | 8.7%), and American (47 | 6.8%), together accounting for 67.1% of all Lewis Run borough residents.
| Ancestry | # Population | % Population |
| American | 47 | 6.8% |
| Austrian | 8 | 1.2% |
| Belgian | 4 | 0.6% |
| Dutch | 5 | 0.7% |
| English | 60 | 8.7% |
| French | 20 | 2.9% |
| German | 111 | 16.1% |
| Greek | 2 | 0.3% |
| Irish | 111 | 16.1% |
| Italian | 134 | 19.4% |
| Korean | 6 | 0.9% |
| Lithuanian | 2 | 0.3% |
| Mexican | 3 | 0.4% |
| Nigerian | 8 | 1.2% |
| Polish | 13 | 1.9% |
| Puerto Rican | 19 | 2.8% |
| Romanian | 2 | 0.3% |
| Scotch-Irish | 19 | 2.8% |
| Scottish | 3 | 0.4% |
| Subsaharan African | 8 | 1.2% |
| Swedish | 20 | 2.9% |
| Swiss | 3 | 0.4% |
| Ukrainian | 23 | 3.3% |
| Welsh | 3 | 0.4% | View All 24 Rows |
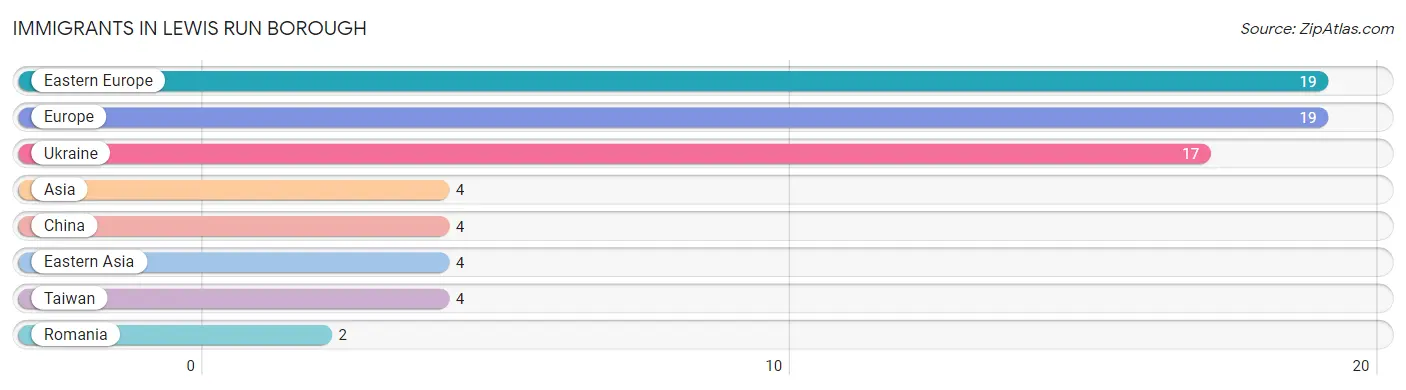
Immigrants in Lewis Run borough
The most numerous immigrant groups reported in Lewis Run borough came from Eastern Europe (19 | 2.8%), Europe (19 | 2.8%), Ukraine (17 | 2.5%), Asia (4 | 0.6%), and China (4 | 0.6%), together accounting for 9.1% of all Lewis Run borough residents.
| Immigration Origin | # Population | % Population |
| Asia | 4 | 0.6% |
| China | 4 | 0.6% |
| Eastern Asia | 4 | 0.6% |
| Eastern Europe | 19 | 2.8% |
| Europe | 19 | 2.8% |
| Romania | 2 | 0.3% |
| Taiwan | 4 | 0.6% |
| Ukraine | 17 | 2.5% | View All 8 Rows |
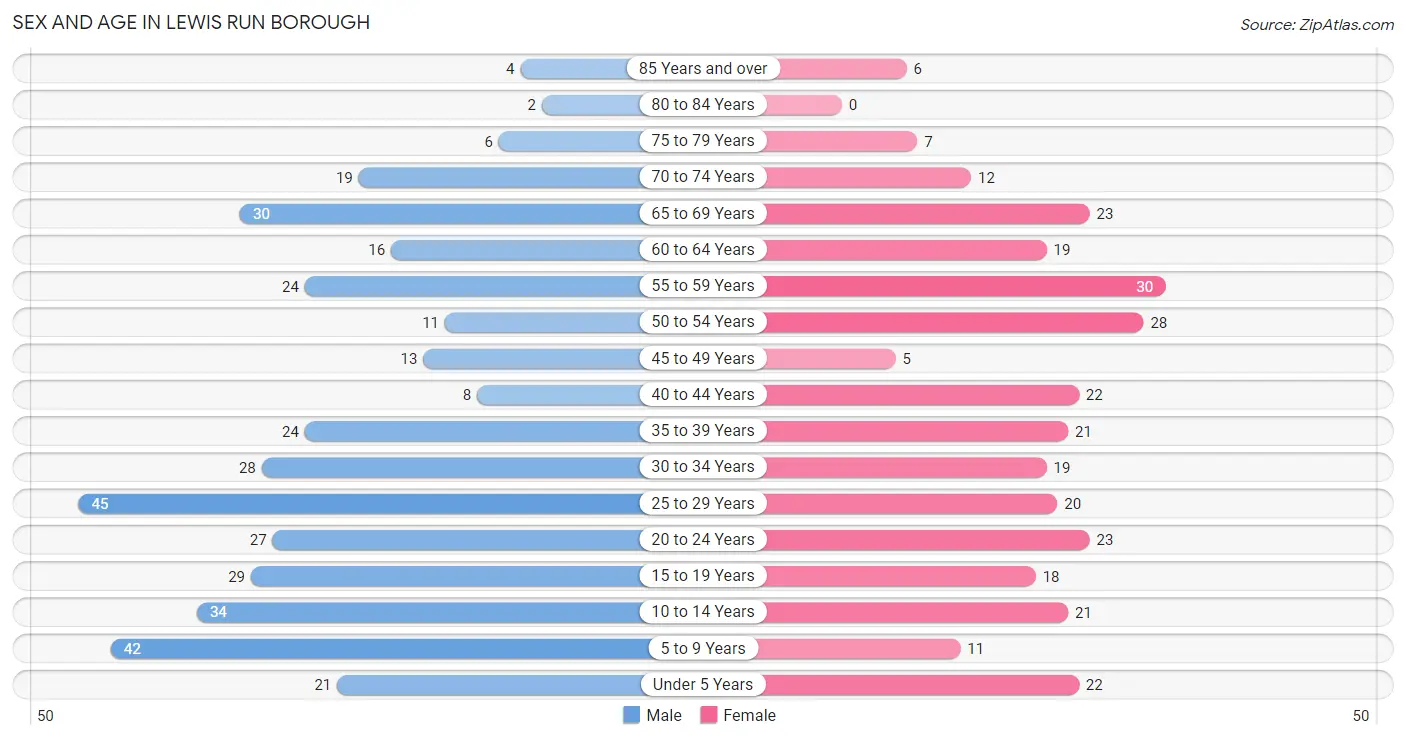
Sex and Age in Lewis Run borough
Sex and Age in Lewis Run borough
The most populous age groups in Lewis Run borough are 25 to 29 Years (45 | 11.7%) for men and 55 to 59 Years (30 | 9.8%) for women.
| Age Bracket | Male | Female |
| Under 5 Years | 21 (5.5%) | 22 (7.2%) |
| 5 to 9 Years | 42 (11.0%) | 11 (3.6%) |
| 10 to 14 Years | 34 (8.9%) | 21 (6.8%) |
| 15 to 19 Years | 29 (7.6%) | 18 (5.9%) |
| 20 to 24 Years | 27 (7.0%) | 23 (7.5%) |
| 25 to 29 Years | 45 (11.7%) | 20 (6.5%) |
| 30 to 34 Years | 28 (7.3%) | 19 (6.2%) |
| 35 to 39 Years | 24 (6.3%) | 21 (6.8%) |
| 40 to 44 Years | 8 (2.1%) | 22 (7.2%) |
| 45 to 49 Years | 13 (3.4%) | 5 (1.6%) |
| 50 to 54 Years | 11 (2.9%) | 28 (9.1%) |
| 55 to 59 Years | 24 (6.3%) | 30 (9.8%) |
| 60 to 64 Years | 16 (4.2%) | 19 (6.2%) |
| 65 to 69 Years | 30 (7.8%) | 23 (7.5%) |
| 70 to 74 Years | 19 (5.0%) | 12 (3.9%) |
| 75 to 79 Years | 6 (1.6%) | 7 (2.3%) |
| 80 to 84 Years | 2 (0.5%) | 0 (0.0%) |
| 85 Years and over | 4 (1.0%) | 6 (1.9%) |
| Total | 383 (100.0%) | 307 (100.0%) |
Families and Households in Lewis Run borough
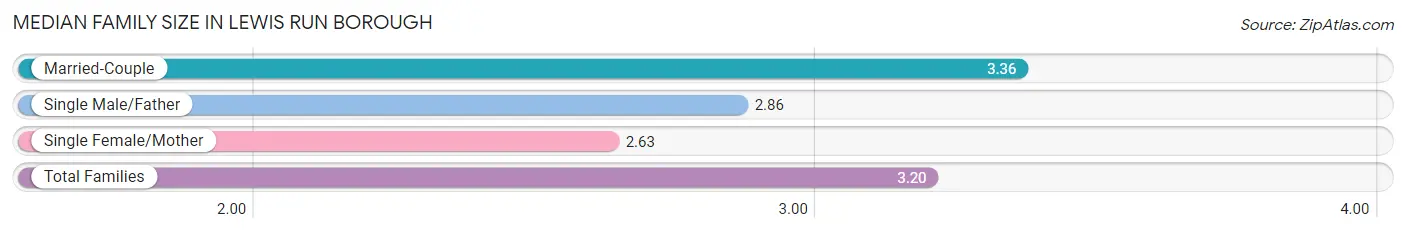
Median Family Size in Lewis Run borough
The median family size in Lewis Run borough is 3.20 persons per family, with married-couple families (131 | 73.6%) accounting for the largest median family size of 3.36 persons per family. On the other hand, single female/mother families (19 | 10.7%) represent the smallest median family size with 2.63 persons per family.
| Family Type | # Families | Family Size |
| Married-Couple | 131 (73.6%) | 3.36 |
| Single Male/Father | 28 (15.7%) | 2.86 |
| Single Female/Mother | 19 (10.7%) | 2.63 |
| Total Families | 178 (100.0%) | 3.20 |
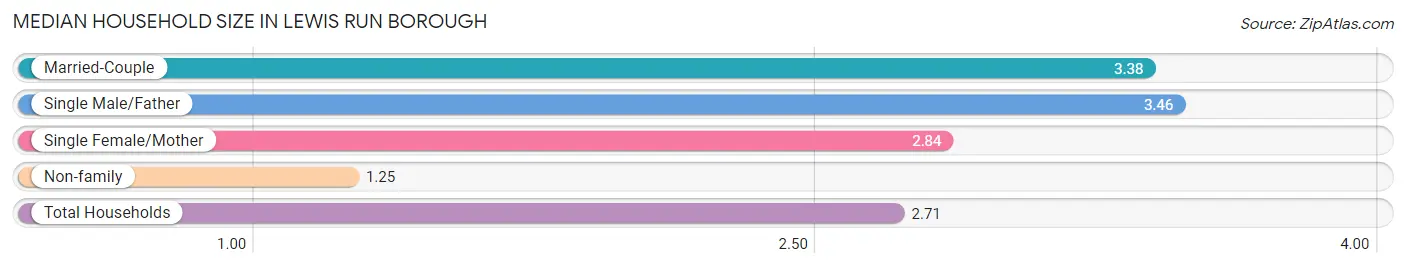
Median Household Size in Lewis Run borough
The median household size in Lewis Run borough is 2.71 persons per household, with single male/father households (28 | 11.0%) accounting for the largest median household size of 3.46 persons per household. non-family households (77 | 30.2%) represent the smallest median household size with 1.25 persons per household.
| Household Type | # Households | Household Size |
| Married-Couple | 131 (51.4%) | 3.38 |
| Single Male/Father | 28 (11.0%) | 3.46 |
| Single Female/Mother | 19 (7.4%) | 2.84 |
| Non-family | 77 (30.2%) | 1.25 |
| Total Households | 255 (100.0%) | 2.71 |
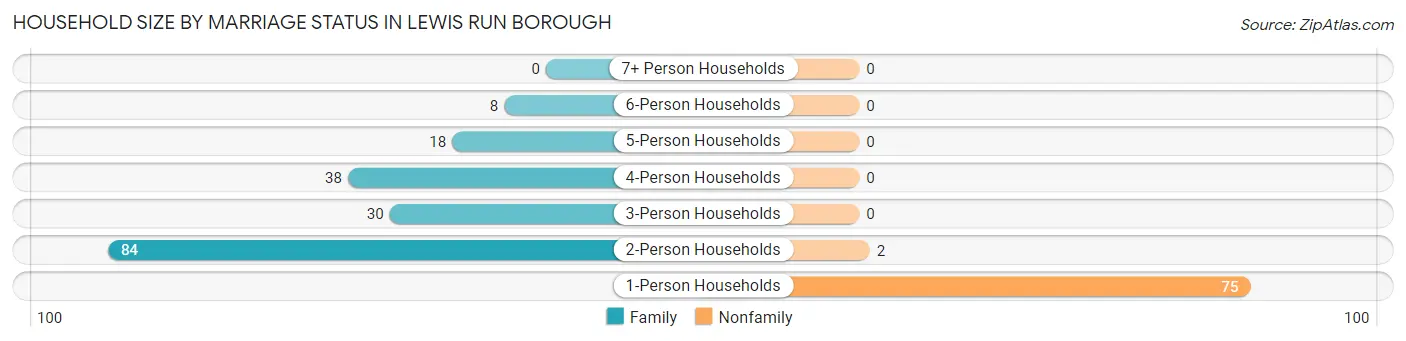
Household Size by Marriage Status in Lewis Run borough
Out of a total of 255 households in Lewis Run borough, 178 (69.8%) are family households, while 77 (30.2%) are nonfamily households. The most numerous type of family households are 2-person households, comprising 84, and the most common type of nonfamily households are 1-person households, comprising 75.
| Household Size | Family Households | Nonfamily Households |
| 1-Person Households | - | 75 (29.4%) |
| 2-Person Households | 84 (32.9%) | 2 (0.8%) |
| 3-Person Households | 30 (11.8%) | 0 (0.0%) |
| 4-Person Households | 38 (14.9%) | 0 (0.0%) |
| 5-Person Households | 18 (7.1%) | 0 (0.0%) |
| 6-Person Households | 8 (3.1%) | 0 (0.0%) |
| 7+ Person Households | 0 (0.0%) | 0 (0.0%) |
| Total | 178 (69.8%) | 77 (30.2%) |
Female Fertility in Lewis Run borough
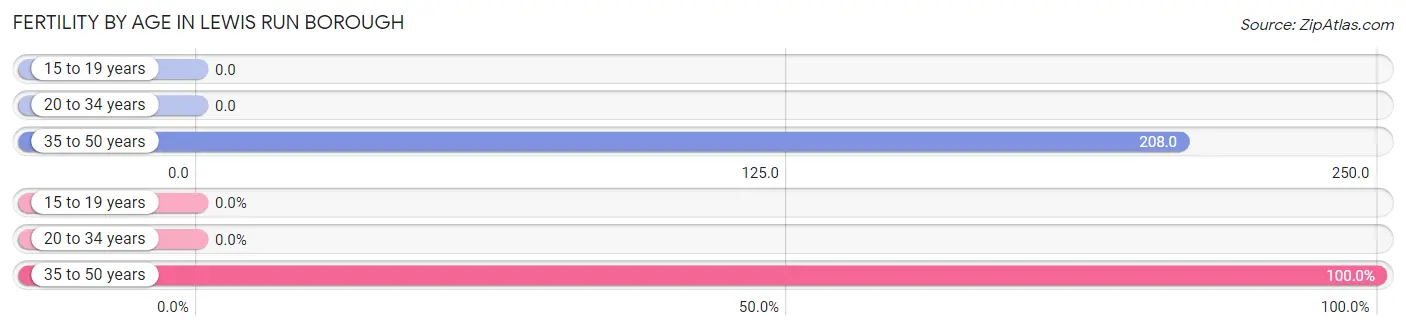
Fertility by Age in Lewis Run borough
Average fertility rate in Lewis Run borough is 78.0 births per 1,000 women. Women in the age bracket of 35 to 50 years have the highest fertility rate with 208.0 births per 1,000 women. Women in the age bracket of 35 to 50 years acount for 100.0% of all women with births.
| Age Bracket | Women with Births | Births / 1,000 Women |
| 15 to 19 years | 0 (0.0%) | 0.0 |
| 20 to 34 years | 0 (0.0%) | 0.0 |
| 35 to 50 years | 10 (100.0%) | 208.0 |
| Total | 10 (100.0%) | 78.0 |
Fertility by Age by Marriage Status in Lewis Run borough
40.0% of women with births (10) in Lewis Run borough are married. The highest percentage of unmarried women with births falls into 35 to 50 years age bracket with 60.0% of them unmarried at the time of birth, while the lowest percentage of unmarried women with births belong to 35 to 50 years age bracket with 60.0% of them unmarried.
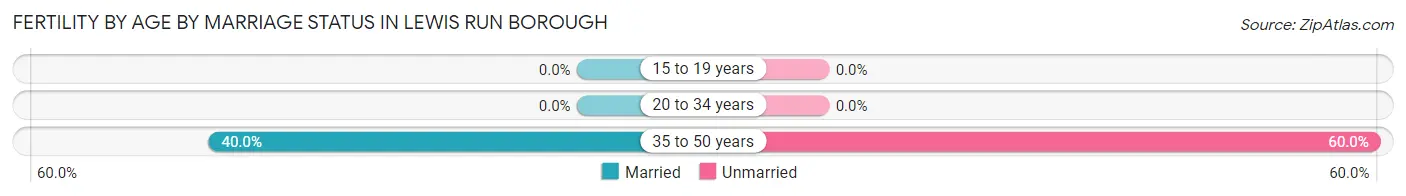
| Age Bracket | Married | Unmarried |
| 15 to 19 years | 0 (0.0%) | 0 (0.0%) |
| 20 to 34 years | 0 (0.0%) | 0 (0.0%) |
| 35 to 50 years | 4 (40.0%) | 6 (60.0%) |
| Total | 4 (40.0%) | 6 (60.0%) |
Fertility by Education in Lewis Run borough
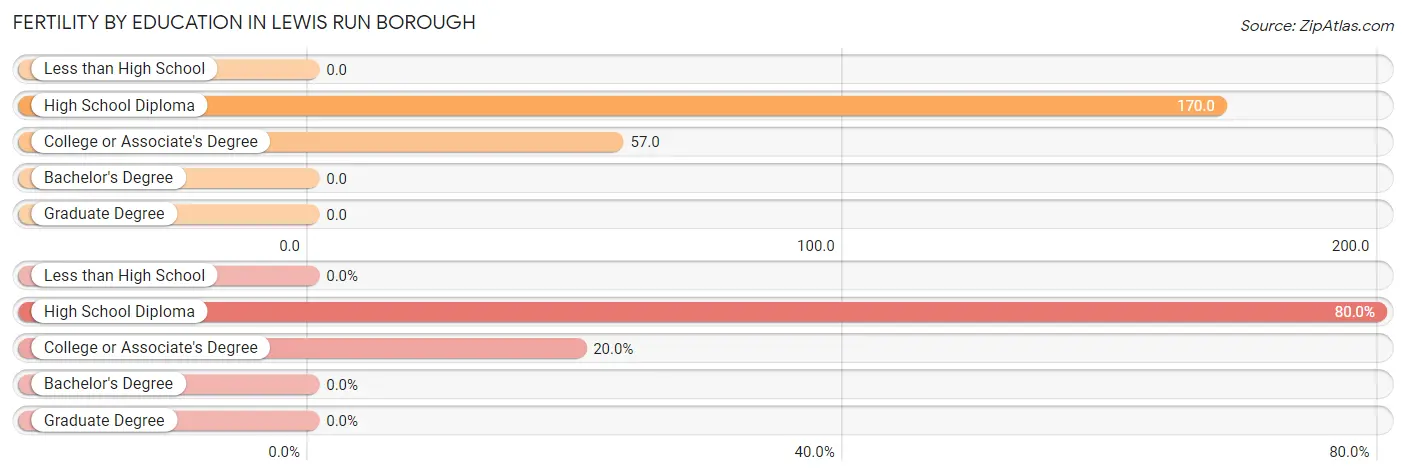
| Educational Attainment | Women with Births | Births / 1,000 Women |
| Less than High School | 0 (0.0%) | 0.0 |
| High School Diploma | 8 (80.0%) | 170.0 |
| College or Associate's Degree | 2 (20.0%) | 57.0 |
| Bachelor's Degree | 0 (0.0%) | 0.0 |
| Graduate Degree | 0 (0.0%) | 0.0 |
| Total | 10 (100.0%) | 78.0 |
Fertility by Education by Marriage Status in Lewis Run borough
60.0% of women with births in Lewis Run borough are unmarried. Women with the educational attainment of high school diploma are most likely to be married with 50.0% of them married at childbirth, while women with the educational attainment of college or associate's degree are least likely to be married with 100.0% of them unmarried at childbirth.
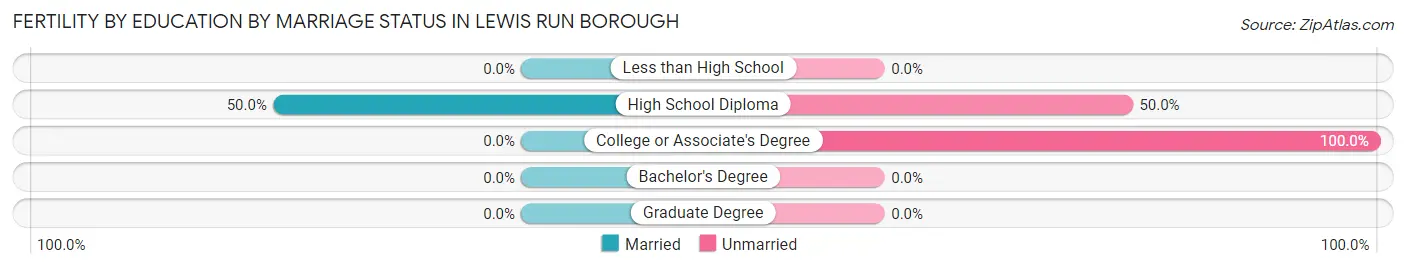
| Educational Attainment | Married | Unmarried |
| Less than High School | 0 (0.0%) | 0 (0.0%) |
| High School Diploma | 4 (50.0%) | 4 (50.0%) |
| College or Associate's Degree | 0 (0.0%) | 2 (100.0%) |
| Bachelor's Degree | 0 (0.0%) | 0 (0.0%) |
| Graduate Degree | 0 (0.0%) | 0 (0.0%) |
| Total | 4 (40.0%) | 6 (60.0%) |
Income in Lewis Run borough
Income Overview in Lewis Run borough
Per Capita Income in Lewis Run borough is $30,112, while median incomes of families and households are $84,167 and $75,750 respectively.
| Characteristic | Number | Measure |
| Per Capita Income | 690 | $30,112 |
| Median Family Income | 178 | $84,167 |
| Mean Family Income | 178 | $90,798 |
| Median Household Income | 255 | $75,750 |
| Mean Household Income | 255 | $77,475 |
| Income Deficit | 178 | $0 |
| Wage / Income Gap (%) | 690 | 23.47% |
| Wage / Income Gap ($) | 690 | 76.53¢ per $1 |
| Gini / Inequality Index | 690 | 0.37 |
Earnings by Sex in Lewis Run borough
Average Earnings in Lewis Run borough are $40,714, $45,500 for men and $34,821 for women, a difference of 23.5%.
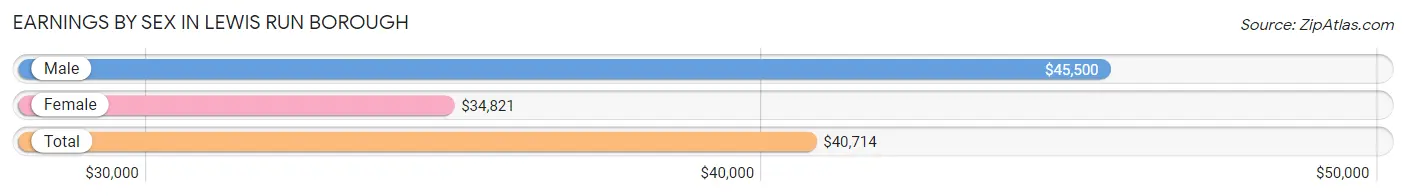
| Sex | Number | Average Earnings |
| Male | 188 (51.4%) | $45,500 |
| Female | 178 (48.6%) | $34,821 |
| Total | 366 (100.0%) | $40,714 |
Earnings by Sex by Income Bracket in Lewis Run borough
The most common earnings brackets in Lewis Run borough are $35,000 to $39,999 for men (30 | 16.0%) and $45,000 to $49,999 for women (28 | 15.7%).
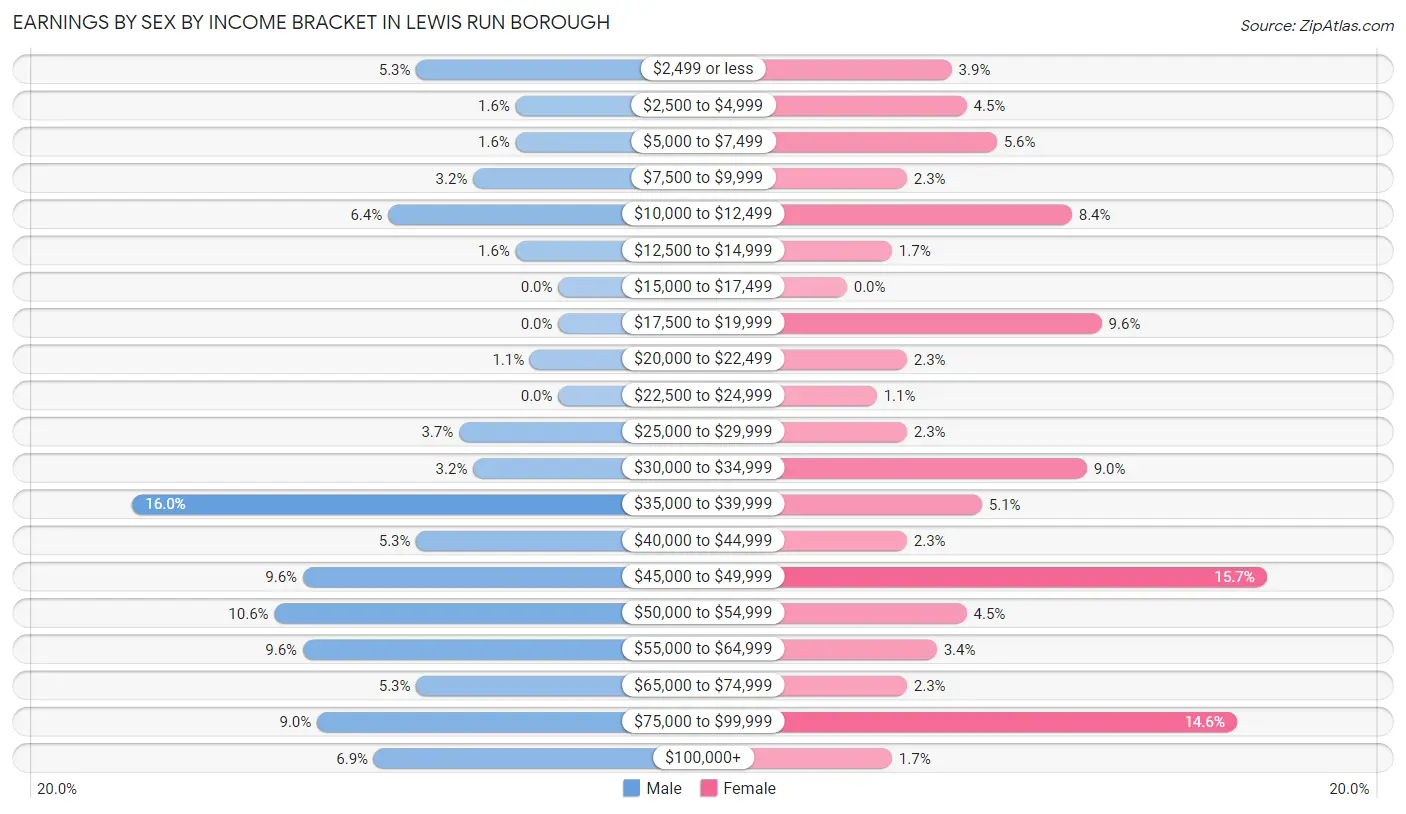
| Income | Male | Female |
| $2,499 or less | 10 (5.3%) | 7 (3.9%) |
| $2,500 to $4,999 | 3 (1.6%) | 8 (4.5%) |
| $5,000 to $7,499 | 3 (1.6%) | 10 (5.6%) |
| $7,500 to $9,999 | 6 (3.2%) | 4 (2.2%) |
| $10,000 to $12,499 | 12 (6.4%) | 15 (8.4%) |
| $12,500 to $14,999 | 3 (1.6%) | 3 (1.7%) |
| $15,000 to $17,499 | 0 (0.0%) | 0 (0.0%) |
| $17,500 to $19,999 | 0 (0.0%) | 17 (9.6%) |
| $20,000 to $22,499 | 2 (1.1%) | 4 (2.2%) |
| $22,500 to $24,999 | 0 (0.0%) | 2 (1.1%) |
| $25,000 to $29,999 | 7 (3.7%) | 4 (2.2%) |
| $30,000 to $34,999 | 6 (3.2%) | 16 (9.0%) |
| $35,000 to $39,999 | 30 (16.0%) | 9 (5.1%) |
| $40,000 to $44,999 | 10 (5.3%) | 4 (2.2%) |
| $45,000 to $49,999 | 18 (9.6%) | 28 (15.7%) |
| $50,000 to $54,999 | 20 (10.6%) | 8 (4.5%) |
| $55,000 to $64,999 | 18 (9.6%) | 6 (3.4%) |
| $65,000 to $74,999 | 10 (5.3%) | 4 (2.2%) |
| $75,000 to $99,999 | 17 (9.0%) | 26 (14.6%) |
| $100,000+ | 13 (6.9%) | 3 (1.7%) |
| Total | 188 (100.0%) | 178 (100.0%) |
Earnings by Sex by Educational Attainment in Lewis Run borough
Average earnings in Lewis Run borough are $50,096 for men and $41,563 for women, a difference of 17.0%. Men with an educational attainment of bachelor's degree enjoy the highest average annual earnings of $70,833, while those with high school diploma education earn the least with $39,800. Women with an educational attainment of bachelor's degree earn the most with the average annual earnings of $65,938, while those with high school diploma education have the smallest earnings of $33,393.
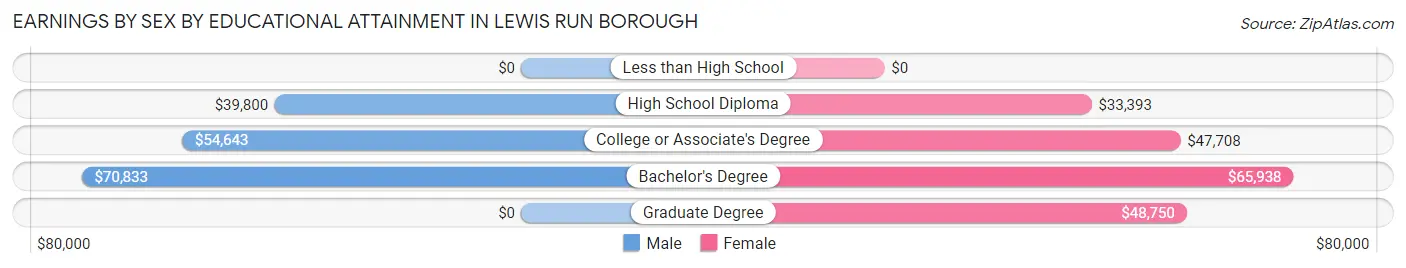
| Educational Attainment | Male Income | Female Income |
| Less than High School | - | - |
| High School Diploma | $39,800 | $33,393 |
| College or Associate's Degree | $54,643 | $47,708 |
| Bachelor's Degree | $70,833 | $65,938 |
| Graduate Degree | - | - |
| Total | $50,096 | $41,563 |
Family Income in Lewis Run borough
Family Income Brackets in Lewis Run borough
According to the Lewis Run borough family income data, there are 49 families falling into the $50,000 to $74,999 income range, which is the most common income bracket and makes up 27.5% of all families.
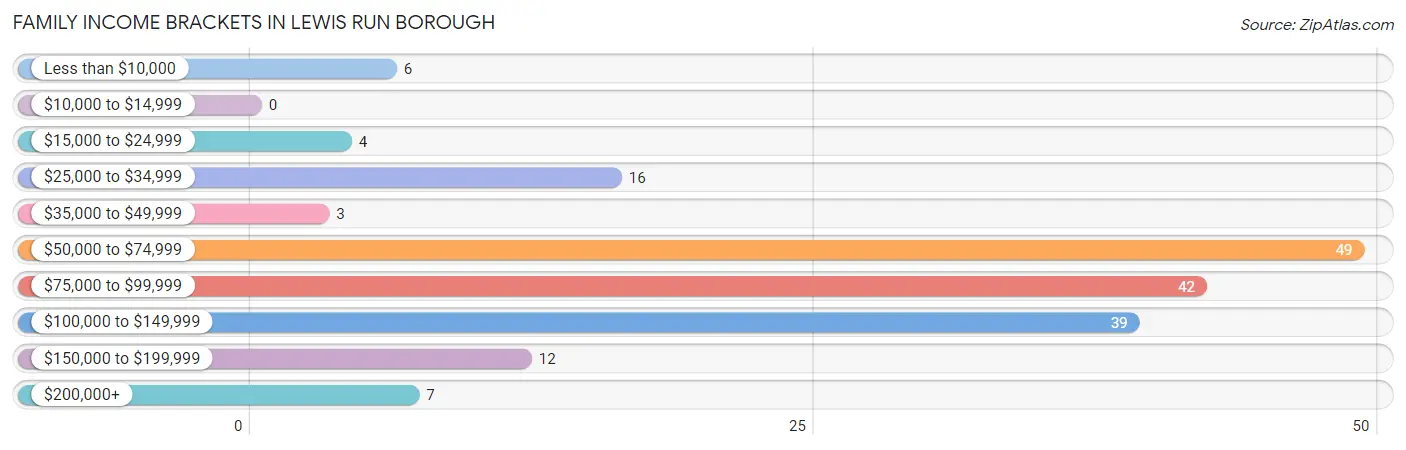
| Income Bracket | # Families | % Families |
| Less than $10,000 | 6 | 3.4% |
| $10,000 to $14,999 | 0 | 0.0% |
| $15,000 to $24,999 | 4 | 2.2% |
| $25,000 to $34,999 | 16 | 9.0% |
| $35,000 to $49,999 | 3 | 1.7% |
| $50,000 to $74,999 | 49 | 27.5% |
| $75,000 to $99,999 | 42 | 23.6% |
| $100,000 to $149,999 | 39 | 21.9% |
| $150,000 to $199,999 | 12 | 6.7% |
| $200,000+ | 7 | 3.9% |
Family Income by Famaliy Size in Lewis Run borough
5-person families (15 | 8.4%) account for the highest median family income in Lewis Run borough with $115,313 per family, while 2-person families (90 | 50.6%) have the highest median income of $38,000 per family member.
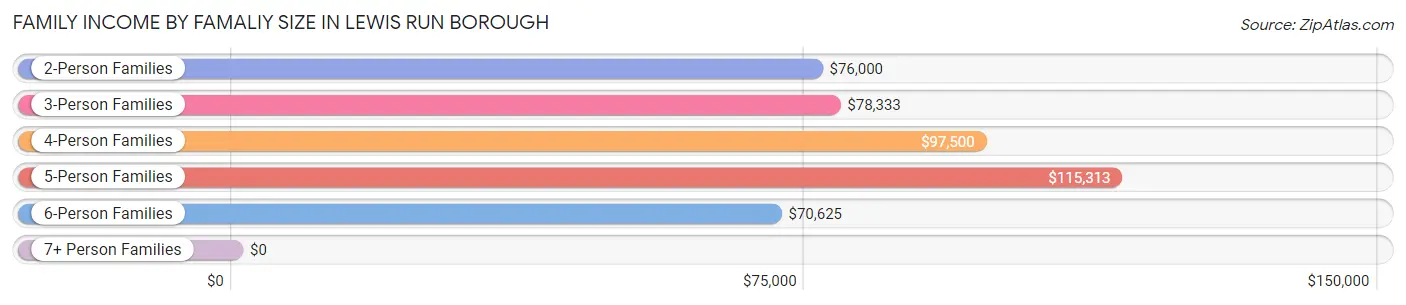
| Income Bracket | # Families | Median Income |
| 2-Person Families | 90 (50.6%) | $76,000 |
| 3-Person Families | 34 (19.1%) | $78,333 |
| 4-Person Families | 32 (18.0%) | $97,500 |
| 5-Person Families | 15 (8.4%) | $115,313 |
| 6-Person Families | 7 (3.9%) | $70,625 |
| 7+ Person Families | 0 (0.0%) | $0 |
| Total | 178 (100.0%) | $84,167 |
Family Income by Number of Earners in Lewis Run borough
The median family income in Lewis Run borough is $84,167, with families comprising 3+ earners (26) having the highest median family income of $116,250, while families with no earners (34) have the lowest median family income of $61,250, accounting for 14.6% and 19.1% of families, respectively.
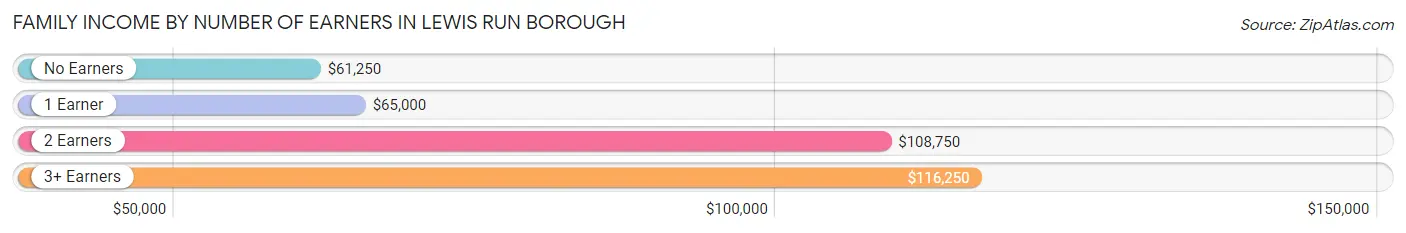
| Number of Earners | # Families | Median Income |
| No Earners | 34 (19.1%) | $61,250 |
| 1 Earner | 58 (32.6%) | $65,000 |
| 2 Earners | 60 (33.7%) | $108,750 |
| 3+ Earners | 26 (14.6%) | $116,250 |
| Total | 178 (100.0%) | $84,167 |
Household Income in Lewis Run borough
Household Income Brackets in Lewis Run borough
With 68 households falling in the category, the $75,000 to $99,999 income range is the most frequent in Lewis Run borough, accounting for 26.7% of all households. In contrast, only 6 households (2.4%) fall into the $35,000 to $49,999 income bracket, making it the least populous group.
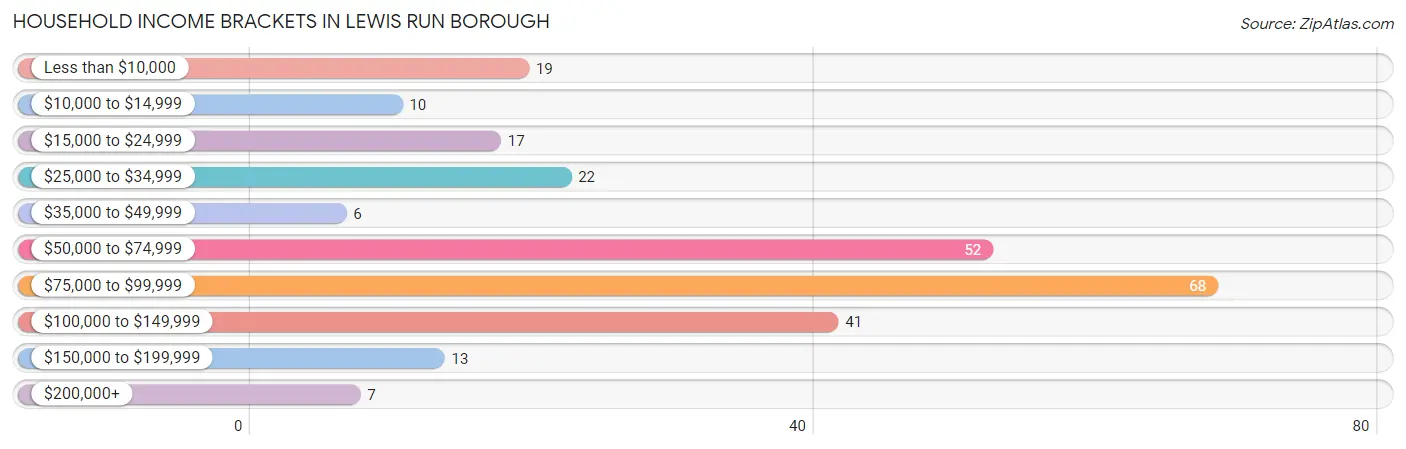
| Income Bracket | # Households | % Households |
| Less than $10,000 | 19 | 7.5% |
| $10,000 to $14,999 | 10 | 3.9% |
| $15,000 to $24,999 | 17 | 6.7% |
| $25,000 to $34,999 | 22 | 8.6% |
| $35,000 to $49,999 | 6 | 2.4% |
| $50,000 to $74,999 | 52 | 20.4% |
| $75,000 to $99,999 | 68 | 26.7% |
| $100,000 to $149,999 | 41 | 16.1% |
| $150,000 to $199,999 | 13 | 5.1% |
| $200,000+ | 7 | 2.7% |
Household Income by Householder Age in Lewis Run borough
The median household income in Lewis Run borough is $75,750, with the highest median household income of $86,667 found in the 45 to 64 years age bracket for the primary householder. A total of 80 households (31.4%) fall into this category.
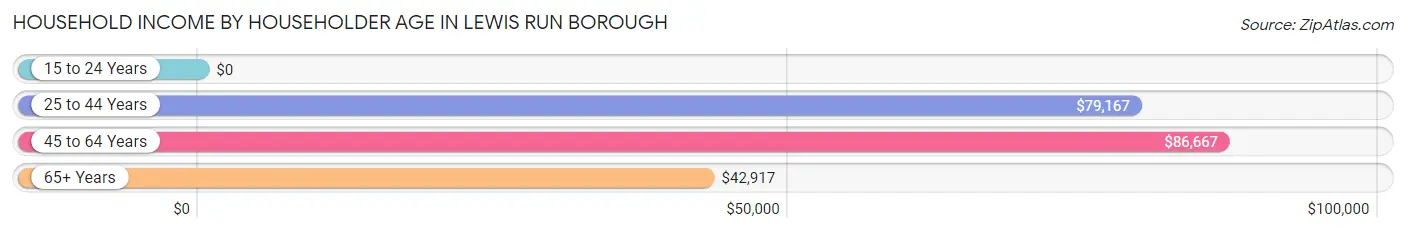
| Income Bracket | # Households | Median Income |
| 15 to 24 Years | 0 (0.0%) | $0 |
| 25 to 44 Years | 98 (38.4%) | $79,167 |
| 45 to 64 Years | 80 (31.4%) | $86,667 |
| 65+ Years | 77 (30.2%) | $42,917 |
| Total | 255 (100.0%) | $75,750 |
Poverty in Lewis Run borough
Income Below Poverty by Sex and Age in Lewis Run borough
With 5.0% poverty level for males and 8.8% for females among the residents of Lewis Run borough, 75 year old and over males and 25 to 34 year old females are the most vulnerable to poverty, with 4 males (33.3%) and 9 females (23.1%) in their respective age groups living below the poverty level.
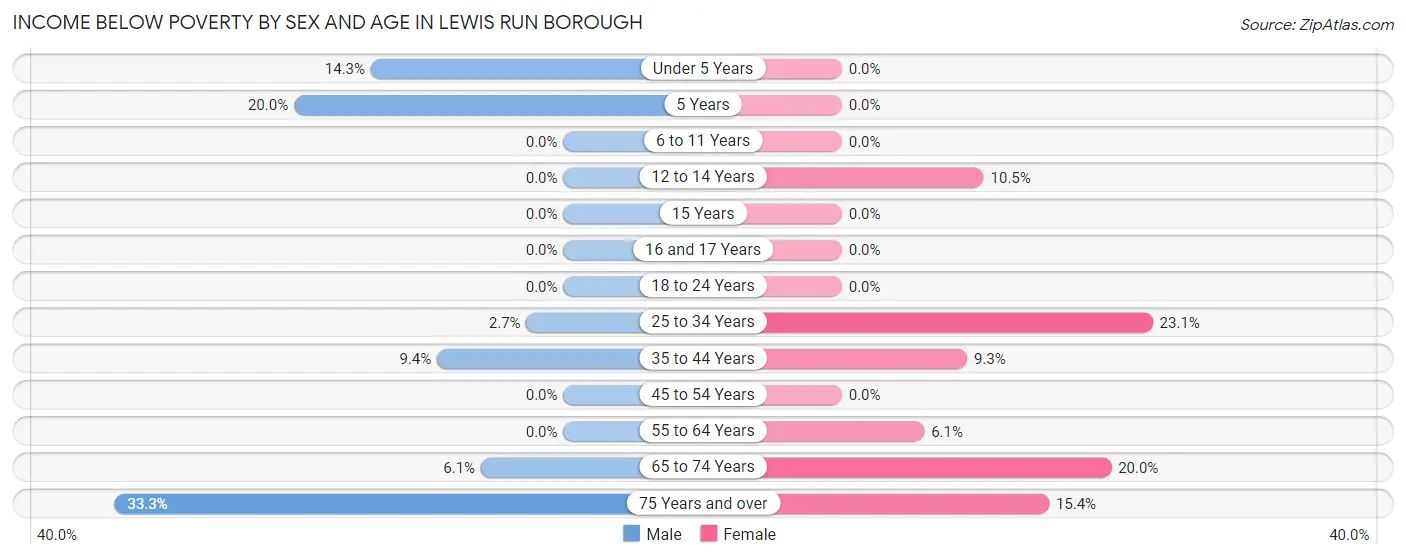
| Age Bracket | Male | Female |
| Under 5 Years | 3 (14.3%) | 0 (0.0%) |
| 5 Years | 4 (20.0%) | 0 (0.0%) |
| 6 to 11 Years | 0 (0.0%) | 0 (0.0%) |
| 12 to 14 Years | 0 (0.0%) | 2 (10.5%) |
| 15 Years | 0 (0.0%) | 0 (0.0%) |
| 16 and 17 Years | 0 (0.0%) | 0 (0.0%) |
| 18 to 24 Years | 0 (0.0%) | 0 (0.0%) |
| 25 to 34 Years | 2 (2.7%) | 9 (23.1%) |
| 35 to 44 Years | 3 (9.4%) | 4 (9.3%) |
| 45 to 54 Years | 0 (0.0%) | 0 (0.0%) |
| 55 to 64 Years | 0 (0.0%) | 3 (6.1%) |
| 65 to 74 Years | 3 (6.1%) | 7 (20.0%) |
| 75 Years and over | 4 (33.3%) | 2 (15.4%) |
| Total | 19 (5.0%) | 27 (8.8%) |
Income Above Poverty by Sex and Age in Lewis Run borough
According to the poverty statistics in Lewis Run borough, males aged 6 to 11 years and females aged under 5 years are the age groups that are most secure financially, with 100.0% of males and 100.0% of females in these age groups living above the poverty line.
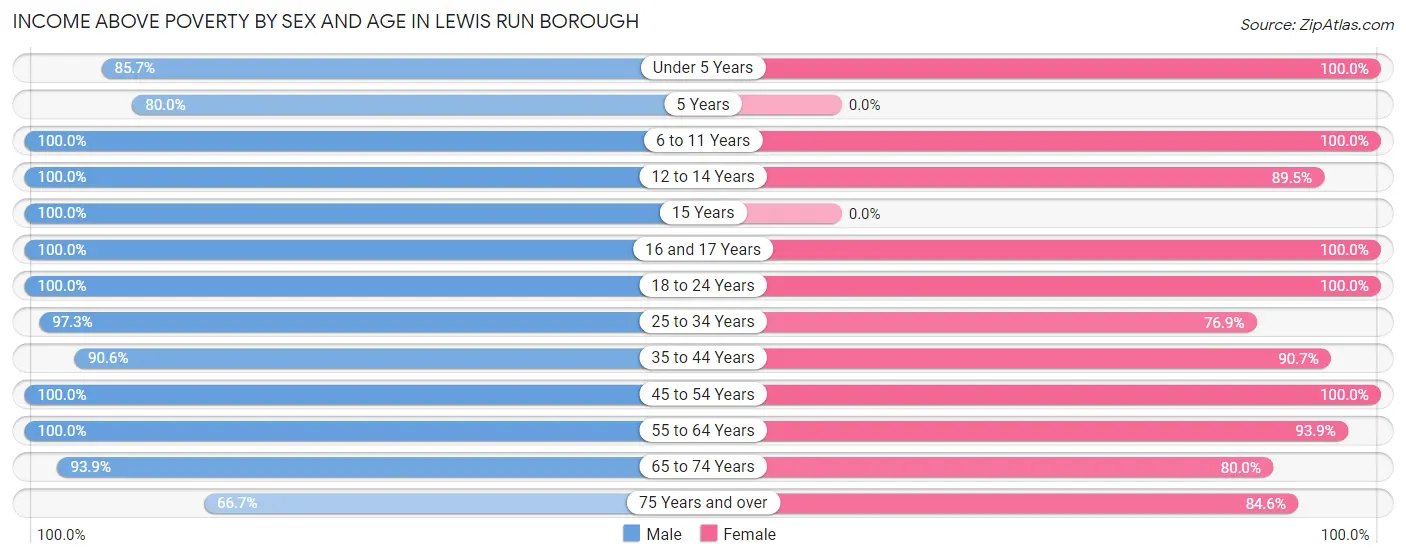
| Age Bracket | Male | Female |
| Under 5 Years | 18 (85.7%) | 22 (100.0%) |
| 5 Years | 16 (80.0%) | 0 (0.0%) |
| 6 to 11 Years | 46 (100.0%) | 13 (100.0%) |
| 12 to 14 Years | 9 (100.0%) | 17 (89.5%) |
| 15 Years | 7 (100.0%) | 0 (0.0%) |
| 16 and 17 Years | 10 (100.0%) | 5 (100.0%) |
| 18 to 24 Years | 39 (100.0%) | 36 (100.0%) |
| 25 to 34 Years | 71 (97.3%) | 30 (76.9%) |
| 35 to 44 Years | 29 (90.6%) | 39 (90.7%) |
| 45 to 54 Years | 24 (100.0%) | 33 (100.0%) |
| 55 to 64 Years | 40 (100.0%) | 46 (93.9%) |
| 65 to 74 Years | 46 (93.9%) | 28 (80.0%) |
| 75 Years and over | 8 (66.7%) | 11 (84.6%) |
| Total | 363 (95.0%) | 280 (91.2%) |
Income Below Poverty Among Married-Couple Families in Lewis Run borough
The poverty statistics for married-couple families in Lewis Run borough show that 1.5% or 2 of the total 131 families live below the poverty line. Families with no children have the highest poverty rate of 2.6%, comprising of 2 families. On the other hand, families with 1 or 2 children have the lowest poverty rate of 0.0%, which includes 0 families.
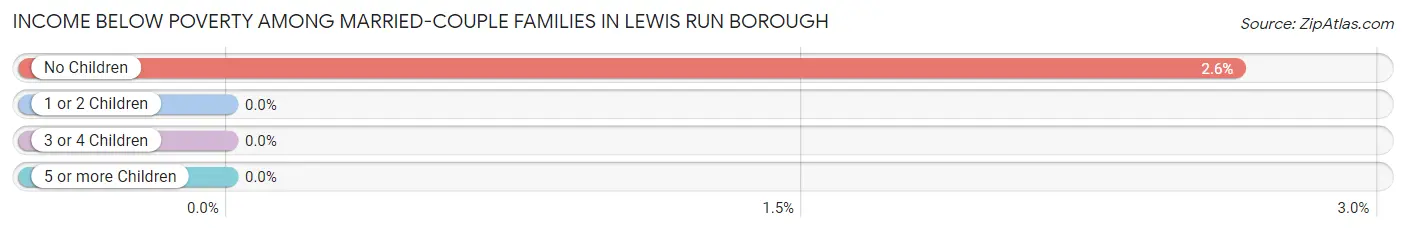
| Children | Above Poverty | Below Poverty |
| No Children | 74 (97.4%) | 2 (2.6%) |
| 1 or 2 Children | 44 (100.0%) | 0 (0.0%) |
| 3 or 4 Children | 11 (100.0%) | 0 (0.0%) |
| 5 or more Children | 0 (0.0%) | 0 (0.0%) |
| Total | 129 (98.5%) | 2 (1.5%) |
Income Below Poverty Among Single-Parent Households in Lewis Run borough
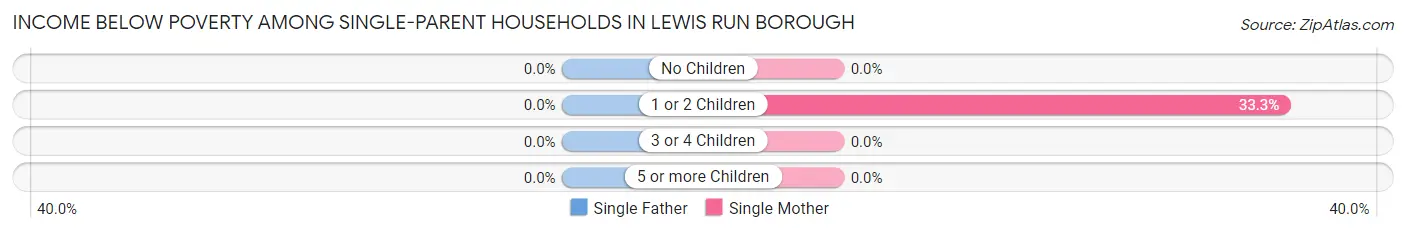
| Children | Single Father | Single Mother |
| No Children | 0 (0.0%) | 0 (0.0%) |
| 1 or 2 Children | 0 (0.0%) | 4 (33.3%) |
| 3 or 4 Children | 0 (0.0%) | 0 (0.0%) |
| 5 or more Children | 0 (0.0%) | 0 (0.0%) |
| Total | 0 (0.0%) | 4 (21.0%) |
Income Below Poverty Among Married-Couple vs Single-Parent Households in Lewis Run borough
The poverty data for Lewis Run borough shows that 2 of the married-couple family households (1.5%) and 4 of the single-parent households (8.5%) are living below the poverty level. Within the married-couple family households, those with no children have the highest poverty rate, with 2 households (2.6%) falling below the poverty line. Among the single-parent households, those with 1 or 2 children have the highest poverty rate, with 4 household (13.8%) living below poverty.
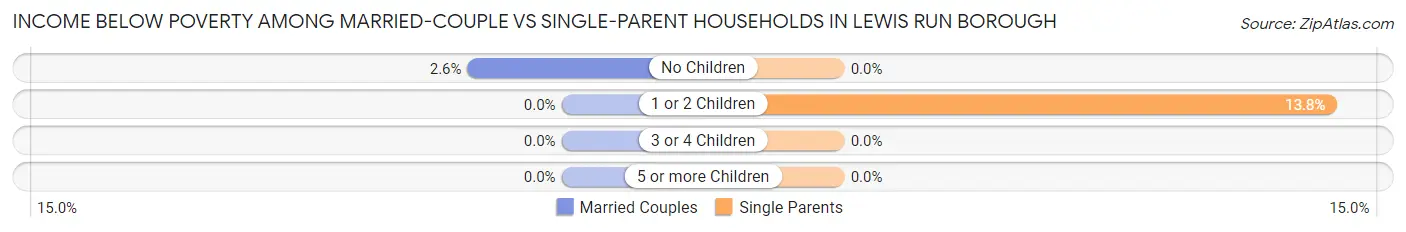
| Children | Married-Couple Families | Single-Parent Households |
| No Children | 2 (2.6%) | 0 (0.0%) |
| 1 or 2 Children | 0 (0.0%) | 4 (13.8%) |
| 3 or 4 Children | 0 (0.0%) | 0 (0.0%) |
| 5 or more Children | 0 (0.0%) | 0 (0.0%) |
| Total | 2 (1.5%) | 4 (8.5%) |
Employment Characteristics in Lewis Run borough
Employment by Class of Employer in Lewis Run borough
Among the 335 employed individuals in Lewis Run borough, private company employees (247 | 73.7%), not-for-profit organizations (37 | 11.0%), and local government employees (15 | 4.5%) make up the most common classes of employment.
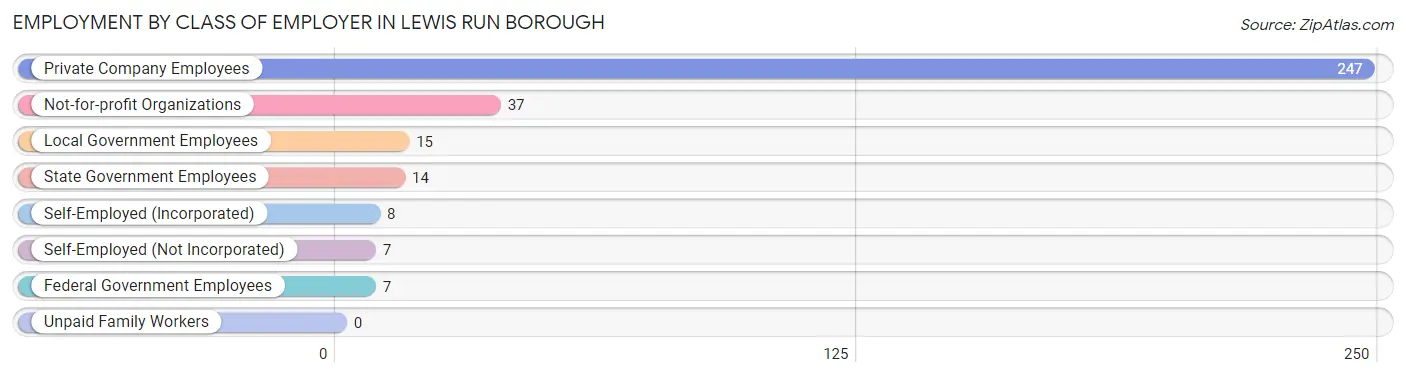
| Employer Class | # Employees | % Employees |
| Private Company Employees | 247 | 73.7% |
| Self-Employed (Incorporated) | 8 | 2.4% |
| Self-Employed (Not Incorporated) | 7 | 2.1% |
| Not-for-profit Organizations | 37 | 11.0% |
| Local Government Employees | 15 | 4.5% |
| State Government Employees | 14 | 4.2% |
| Federal Government Employees | 7 | 2.1% |
| Unpaid Family Workers | 0 | 0.0% |
| Total | 335 | 100.0% |
Employment Status by Age in Lewis Run borough
According to the labor force statistics for Lewis Run borough, out of the total population over 16 years of age (532), 65.0% or 346 individuals are in the labor force, with 3.2% or 11 of them unemployed. The age group with the highest labor force participation rate is 55 to 59 years, with 94.4% or 51 individuals in the labor force. Within the labor force, the 30 to 34 years age range has the highest percentage of unemployed individuals, with 17.1% or 7 of them being unemployed.
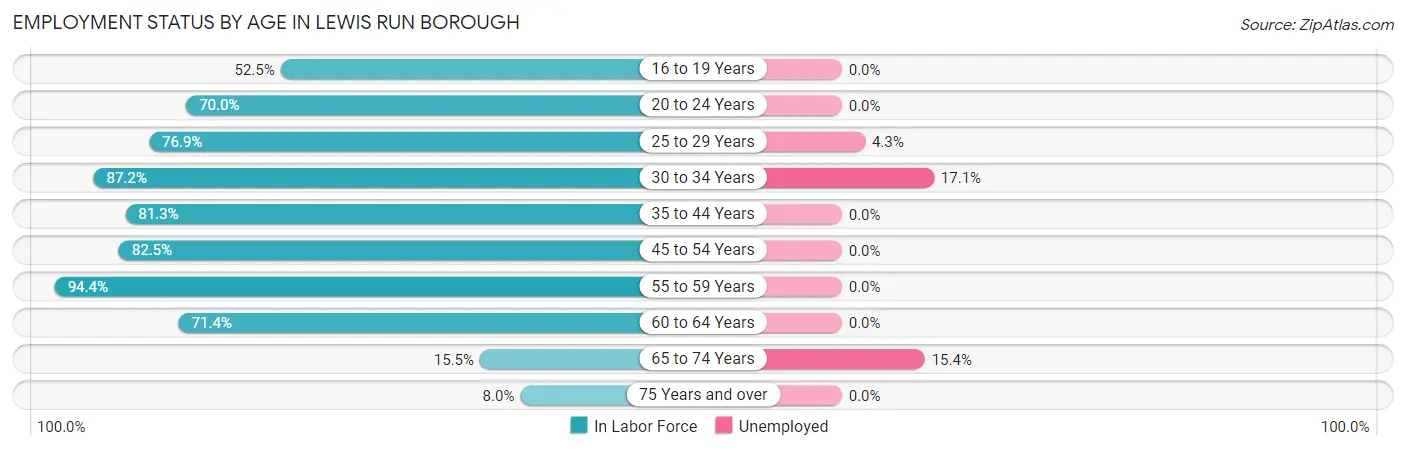
| Age Bracket | In Labor Force | Unemployed |
| 16 to 19 Years | 21 (52.5%) | 0 (0.0%) |
| 20 to 24 Years | 35 (70.0%) | 0 (0.0%) |
| 25 to 29 Years | 50 (76.9%) | 2 (4.3%) |
| 30 to 34 Years | 41 (87.2%) | 7 (17.1%) |
| 35 to 44 Years | 61 (81.3%) | 0 (0.0%) |
| 45 to 54 Years | 47 (82.5%) | 0 (0.0%) |
| 55 to 59 Years | 51 (94.4%) | 0 (0.0%) |
| 60 to 64 Years | 25 (71.4%) | 0 (0.0%) |
| 65 to 74 Years | 13 (15.5%) | 2 (15.4%) |
| 75 Years and over | 2 (8.0%) | 0 (0.0%) |
| Total | 346 (65.0%) | 11 (3.2%) |
Employment Status by Educational Attainment in Lewis Run borough
According to labor force statistics for Lewis Run borough, 82.6% of individuals (275) out of the total population between 25 and 64 years of age (333) are in the labor force, with 3.3% or 9 of them being unemployed. The group with the highest labor force participation rate are those with the educational attainment of bachelor's degree or higher, with 89.5% or 77 individuals in the labor force. Within the labor force, individuals with high school diploma education have the highest percentage of unemployment, with 4.6% or 6 of them being unemployed.
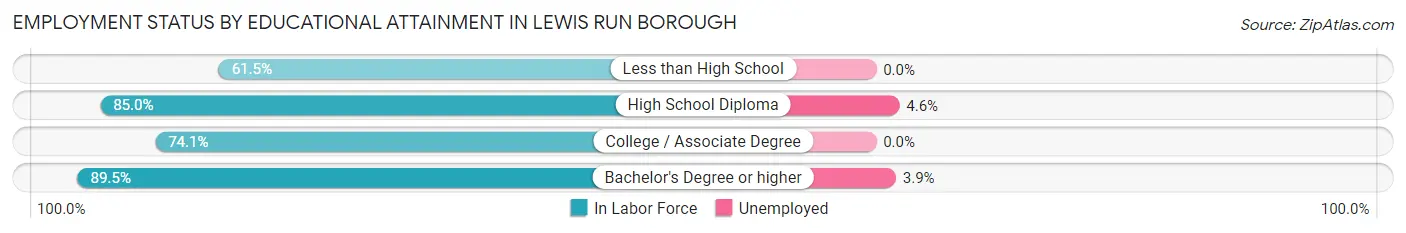
| Educational Attainment | In Labor Force | Unemployed |
| Less than High School | 8 (61.5%) | 0 (0.0%) |
| High School Diploma | 130 (85.0%) | 7 (4.6%) |
| College / Associate Degree | 60 (74.1%) | 0 (0.0%) |
| Bachelor's Degree or higher | 77 (89.5%) | 3 (3.9%) |
| Total | 275 (82.6%) | 11 (3.3%) |
Employment Occupations by Sex in Lewis Run borough
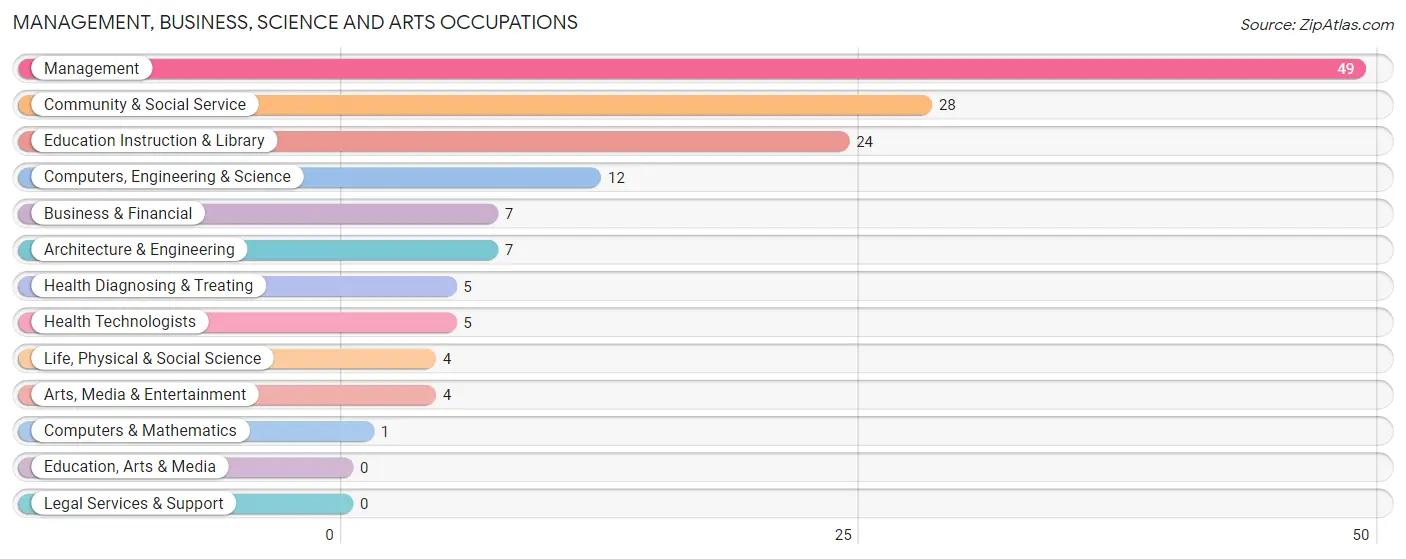
Management, Business, Science and Arts Occupations
The most common Management, Business, Science and Arts occupations in Lewis Run borough are Management (49 | 14.8%), Community & Social Service (28 | 8.4%), Education Instruction & Library (24 | 7.2%), Computers, Engineering & Science (12 | 3.6%), and Business & Financial (7 | 2.1%).
Management, Business, Science and Arts Occupations by Sex
Within the Management, Business, Science and Arts occupations in Lewis Run borough, the most male-oriented occupations are Computers & Mathematics (100.0%), Architecture & Engineering (100.0%), and Computers, Engineering & Science (83.3%), while the most female-oriented occupations are Business & Financial (100.0%), Arts, Media & Entertainment (100.0%), and Health Diagnosing & Treating (100.0%).
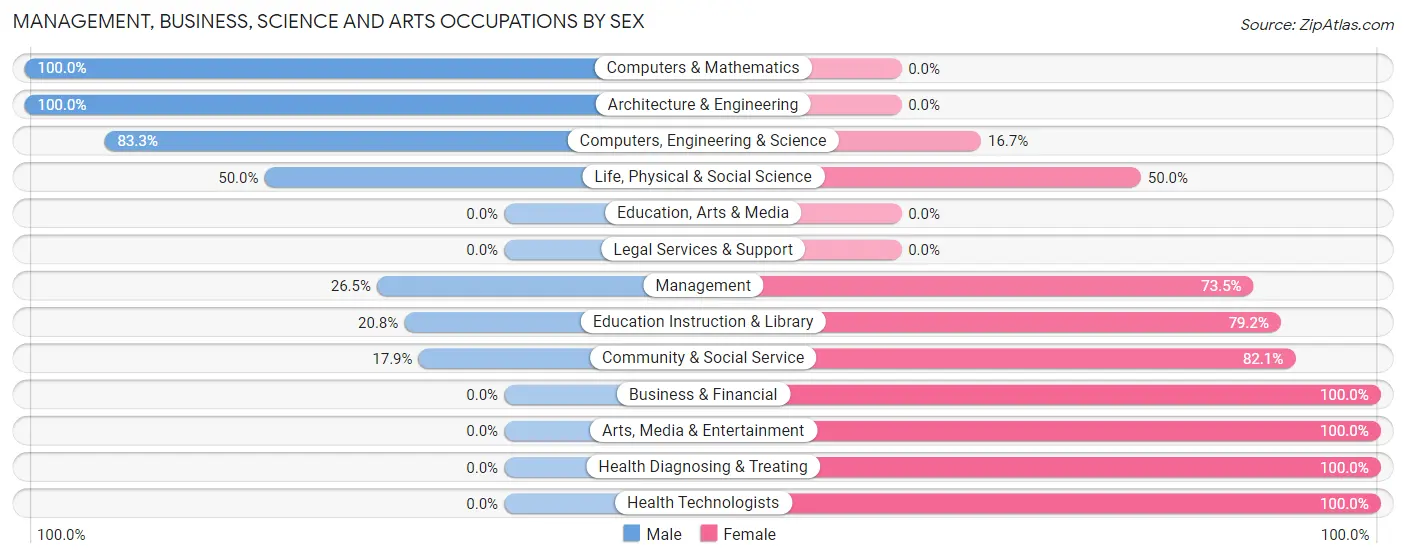
| Occupation | Male | Female |
| Management | 13 (26.5%) | 36 (73.5%) |
| Business & Financial | 0 (0.0%) | 7 (100.0%) |
| Computers, Engineering & Science | 10 (83.3%) | 2 (16.7%) |
| Computers & Mathematics | 1 (100.0%) | 0 (0.0%) |
| Architecture & Engineering | 7 (100.0%) | 0 (0.0%) |
| Life, Physical & Social Science | 2 (50.0%) | 2 (50.0%) |
| Community & Social Service | 5 (17.9%) | 23 (82.1%) |
| Education, Arts & Media | 0 (0.0%) | 0 (0.0%) |
| Legal Services & Support | 0 (0.0%) | 0 (0.0%) |
| Education Instruction & Library | 5 (20.8%) | 19 (79.2%) |
| Arts, Media & Entertainment | 0 (0.0%) | 4 (100.0%) |
| Health Diagnosing & Treating | 0 (0.0%) | 5 (100.0%) |
| Health Technologists | 0 (0.0%) | 5 (100.0%) |
| Total (Category) | 28 (27.7%) | 73 (72.3%) |
| Total (Overall) | 163 (49.1%) | 169 (50.9%) |
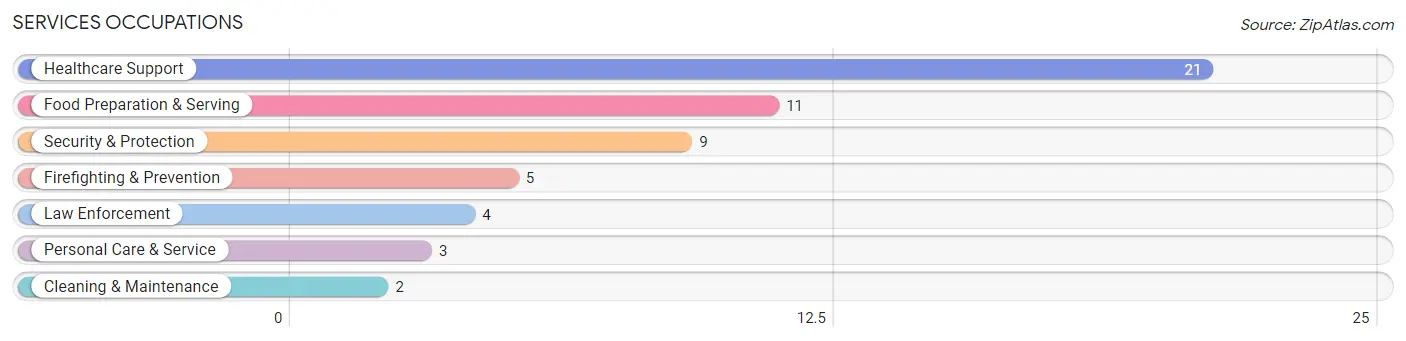
Services Occupations
The most common Services occupations in Lewis Run borough are Healthcare Support (21 | 6.3%), Food Preparation & Serving (11 | 3.3%), Security & Protection (9 | 2.7%), Firefighting & Prevention (5 | 1.5%), and Law Enforcement (4 | 1.2%).
Services Occupations by Sex
Within the Services occupations in Lewis Run borough, the most male-oriented occupations are Law Enforcement (100.0%), Cleaning & Maintenance (100.0%), and Security & Protection (44.4%), while the most female-oriented occupations are Firefighting & Prevention (100.0%), Personal Care & Service (100.0%), and Healthcare Support (95.2%).
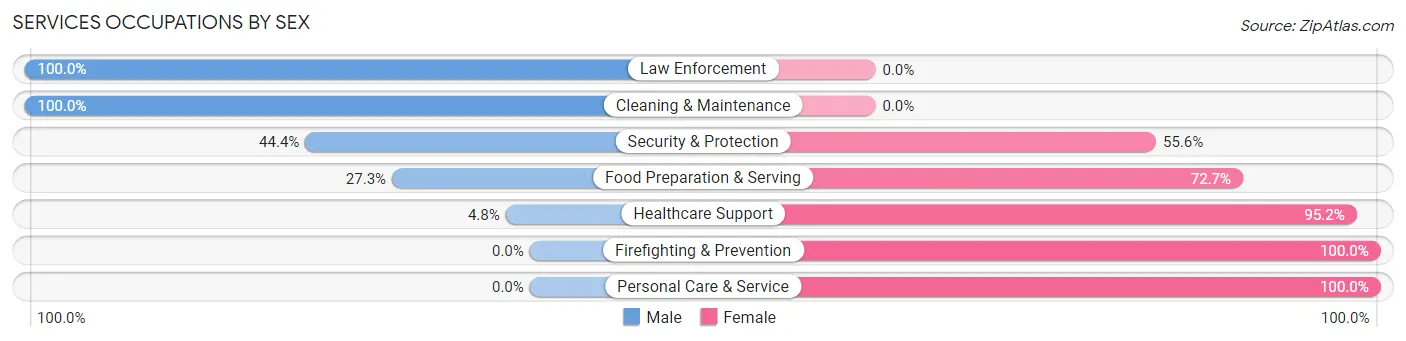
| Occupation | Male | Female |
| Healthcare Support | 1 (4.8%) | 20 (95.2%) |
| Security & Protection | 4 (44.4%) | 5 (55.6%) |
| Firefighting & Prevention | 0 (0.0%) | 5 (100.0%) |
| Law Enforcement | 4 (100.0%) | 0 (0.0%) |
| Food Preparation & Serving | 3 (27.3%) | 8 (72.7%) |
| Cleaning & Maintenance | 2 (100.0%) | 0 (0.0%) |
| Personal Care & Service | 0 (0.0%) | 3 (100.0%) |
| Total (Category) | 10 (21.7%) | 36 (78.3%) |
| Total (Overall) | 163 (49.1%) | 169 (50.9%) |
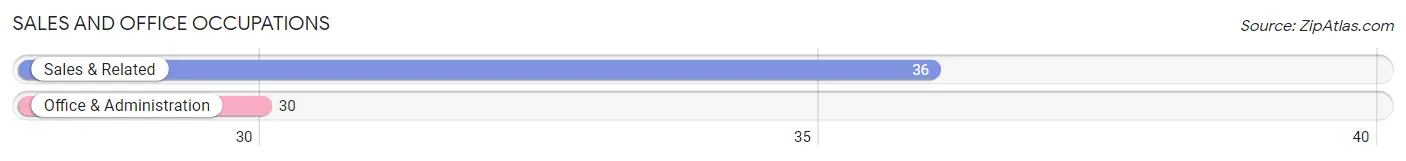
Sales and Office Occupations
The most common Sales and Office occupations in Lewis Run borough are Sales & Related (36 | 10.8%), and Office & Administration (30 | 9.0%).
Sales and Office Occupations by Sex
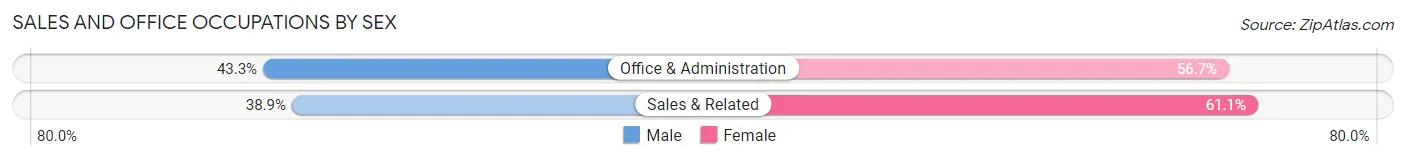
| Occupation | Male | Female |
| Sales & Related | 14 (38.9%) | 22 (61.1%) |
| Office & Administration | 13 (43.3%) | 17 (56.7%) |
| Total (Category) | 27 (40.9%) | 39 (59.1%) |
| Total (Overall) | 163 (49.1%) | 169 (50.9%) |
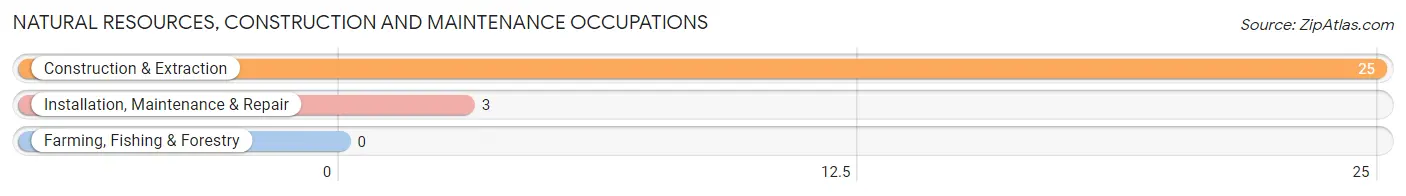
Natural Resources, Construction and Maintenance Occupations
The most common Natural Resources, Construction and Maintenance occupations in Lewis Run borough are Construction & Extraction (25 | 7.5%), and Installation, Maintenance & Repair (3 | 0.9%).
Natural Resources, Construction and Maintenance Occupations by Sex
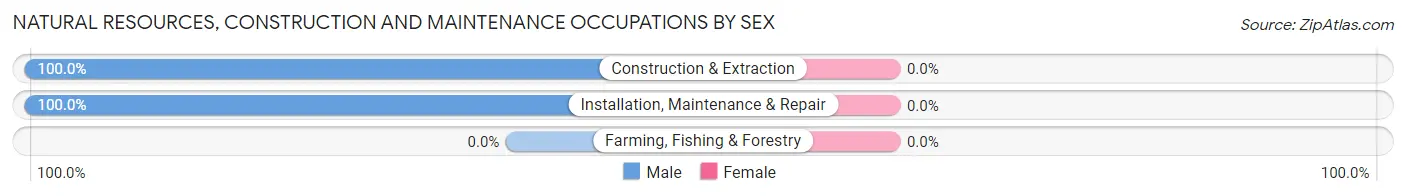
| Occupation | Male | Female |
| Farming, Fishing & Forestry | 0 (0.0%) | 0 (0.0%) |
| Construction & Extraction | 25 (100.0%) | 0 (0.0%) |
| Installation, Maintenance & Repair | 3 (100.0%) | 0 (0.0%) |
| Total (Category) | 28 (100.0%) | 0 (0.0%) |
| Total (Overall) | 163 (49.1%) | 169 (50.9%) |
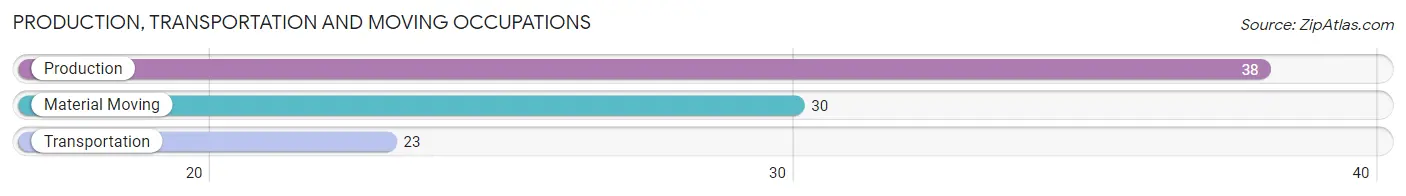
Production, Transportation and Moving Occupations
The most common Production, Transportation and Moving occupations in Lewis Run borough are Production (38 | 11.5%), Material Moving (30 | 9.0%), and Transportation (23 | 6.9%).
Production, Transportation and Moving Occupations by Sex
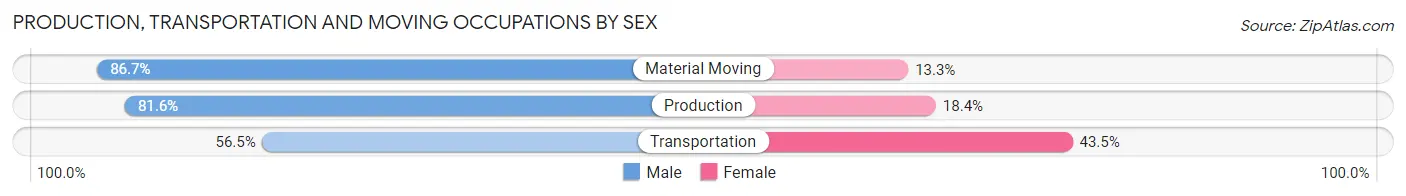
| Occupation | Male | Female |
| Production | 31 (81.6%) | 7 (18.4%) |
| Transportation | 13 (56.5%) | 10 (43.5%) |
| Material Moving | 26 (86.7%) | 4 (13.3%) |
| Total (Category) | 70 (76.9%) | 21 (23.1%) |
| Total (Overall) | 163 (49.1%) | 169 (50.9%) |
Employment Industries by Sex in Lewis Run borough
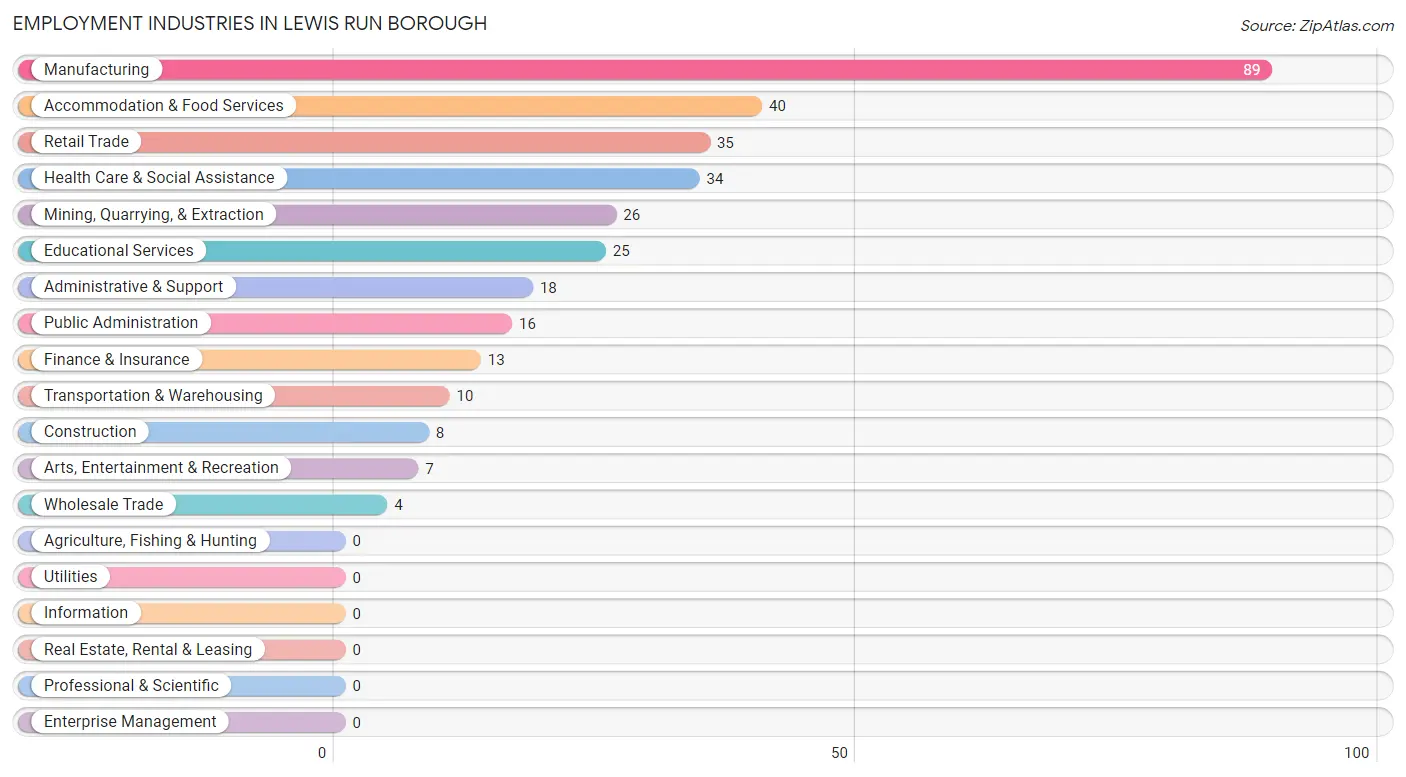
Employment Industries in Lewis Run borough
The major employment industries in Lewis Run borough include Manufacturing (89 | 26.8%), Accommodation & Food Services (40 | 12.0%), Retail Trade (35 | 10.5%), Health Care & Social Assistance (34 | 10.2%), and Mining, Quarrying, & Extraction (26 | 7.8%).
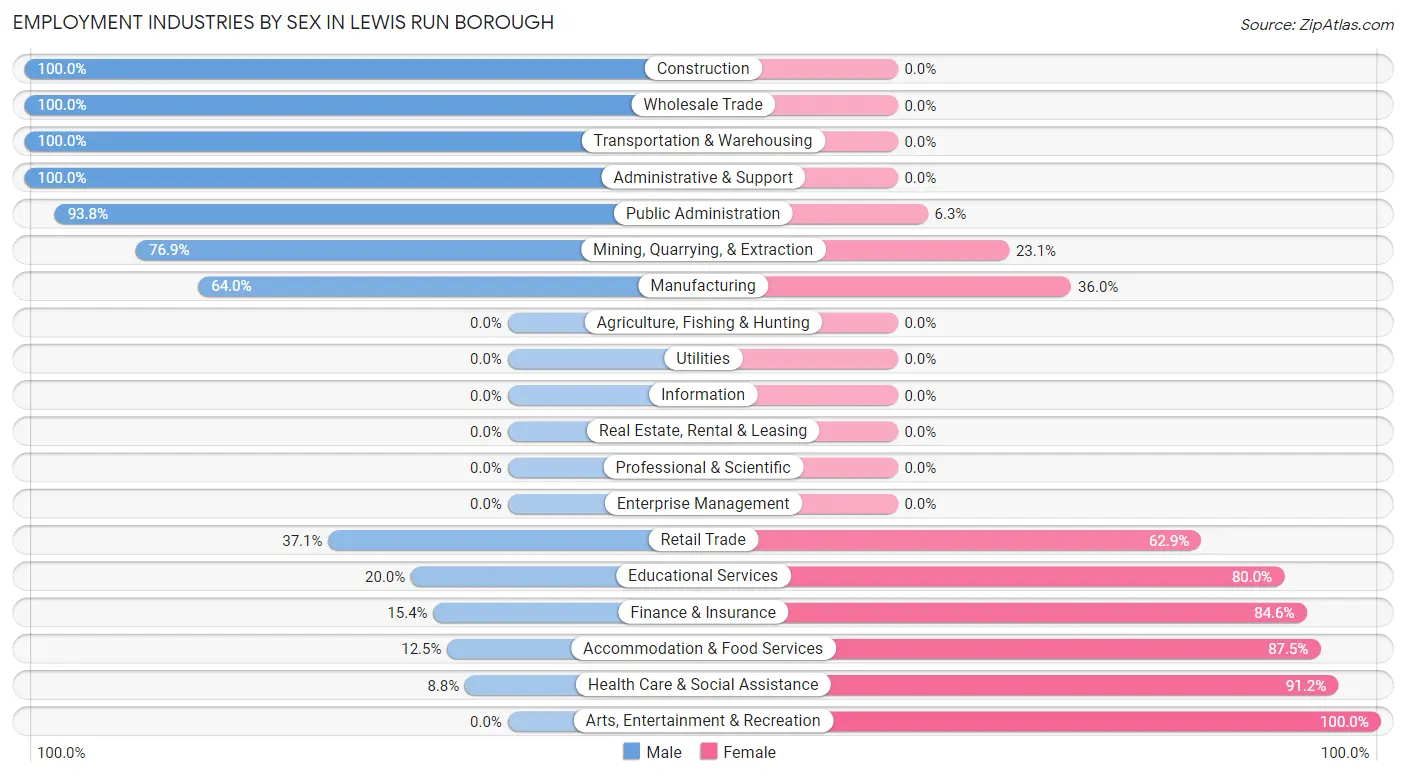
Employment Industries by Sex in Lewis Run borough
The Lewis Run borough industries that see more men than women are Construction (100.0%), Wholesale Trade (100.0%), and Transportation & Warehousing (100.0%), whereas the industries that tend to have a higher number of women are Arts, Entertainment & Recreation (100.0%), Health Care & Social Assistance (91.2%), and Accommodation & Food Services (87.5%).
| Industry | Male | Female |
| Agriculture, Fishing & Hunting | 0 (0.0%) | 0 (0.0%) |
| Mining, Quarrying, & Extraction | 20 (76.9%) | 6 (23.1%) |
| Construction | 8 (100.0%) | 0 (0.0%) |
| Manufacturing | 57 (64.0%) | 32 (36.0%) |
| Wholesale Trade | 4 (100.0%) | 0 (0.0%) |
| Retail Trade | 13 (37.1%) | 22 (62.9%) |
| Transportation & Warehousing | 10 (100.0%) | 0 (0.0%) |
| Utilities | 0 (0.0%) | 0 (0.0%) |
| Information | 0 (0.0%) | 0 (0.0%) |
| Finance & Insurance | 2 (15.4%) | 11 (84.6%) |
| Real Estate, Rental & Leasing | 0 (0.0%) | 0 (0.0%) |
| Professional & Scientific | 0 (0.0%) | 0 (0.0%) |
| Enterprise Management | 0 (0.0%) | 0 (0.0%) |
| Administrative & Support | 18 (100.0%) | 0 (0.0%) |
| Educational Services | 5 (20.0%) | 20 (80.0%) |
| Health Care & Social Assistance | 3 (8.8%) | 31 (91.2%) |
| Arts, Entertainment & Recreation | 0 (0.0%) | 7 (100.0%) |
| Accommodation & Food Services | 5 (12.5%) | 35 (87.5%) |
| Public Administration | 15 (93.8%) | 1 (6.2%) |
| Total | 163 (49.1%) | 169 (50.9%) |
Education in Lewis Run borough
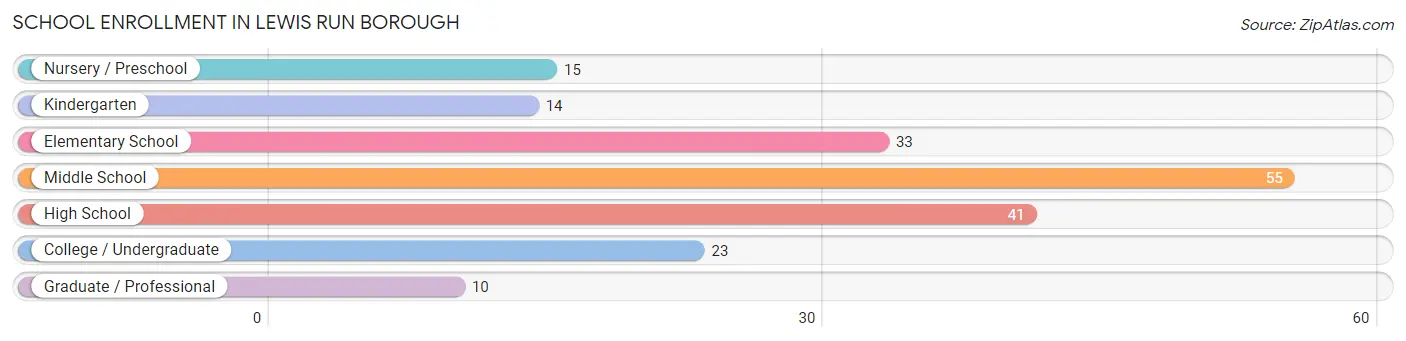
School Enrollment in Lewis Run borough
The most common levels of schooling among the 191 students in Lewis Run borough are middle school (55 | 28.8%), high school (41 | 21.5%), and elementary school (33 | 17.3%).
| School Level | # Students | % Students |
| Nursery / Preschool | 15 | 7.9% |
| Kindergarten | 14 | 7.3% |
| Elementary School | 33 | 17.3% |
| Middle School | 55 | 28.8% |
| High School | 41 | 21.5% |
| College / Undergraduate | 23 | 12.0% |
| Graduate / Professional | 10 | 5.2% |
| Total | 191 | 100.0% |
School Enrollment by Age by Funding Source in Lewis Run borough
Out of a total of 191 students who are enrolled in schools in Lewis Run borough, 36 (18.8%) attend a private institution, while the remaining 155 (81.2%) are enrolled in public schools. The age group of 25 to 34 year olds has the highest likelihood of being enrolled in private schools, with 6 (100.0% in the age bracket) enrolled. Conversely, the age group of 3 to 4 year olds has the lowest likelihood of being enrolled in a private school, with 9 (100.0% in the age bracket) attending a public institution.
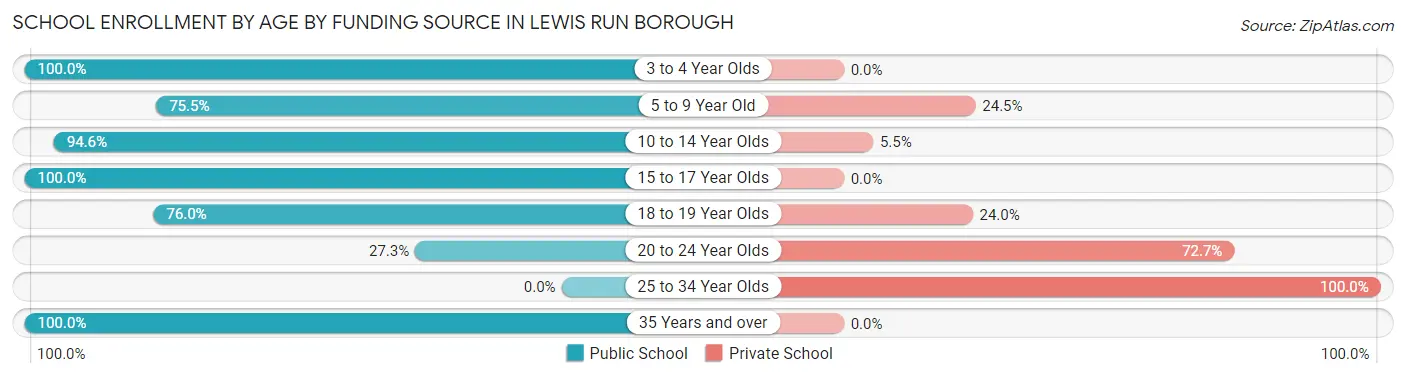
| Age Bracket | Public School | Private School |
| 3 to 4 Year Olds | 9 (100.0%) | 0 (0.0%) |
| 5 to 9 Year Old | 40 (75.5%) | 13 (24.5%) |
| 10 to 14 Year Olds | 52 (94.6%) | 3 (5.4%) |
| 15 to 17 Year Olds | 22 (100.0%) | 0 (0.0%) |
| 18 to 19 Year Olds | 19 (76.0%) | 6 (24.0%) |
| 20 to 24 Year Olds | 3 (27.3%) | 8 (72.7%) |
| 25 to 34 Year Olds | 0 (0.0%) | 6 (100.0%) |
| 35 Years and over | 10 (100.0%) | 0 (0.0%) |
| Total | 155 (81.2%) | 36 (18.8%) |
Educational Attainment by Field of Study in Lewis Run borough
Business (20 | 18.0%), social sciences (17 | 15.3%), science & technology (16 | 14.4%), physical & health sciences (14 | 12.6%), and engineering (11 | 9.9%) are the most common fields of study among 111 individuals in Lewis Run borough who have obtained a bachelor's degree or higher.
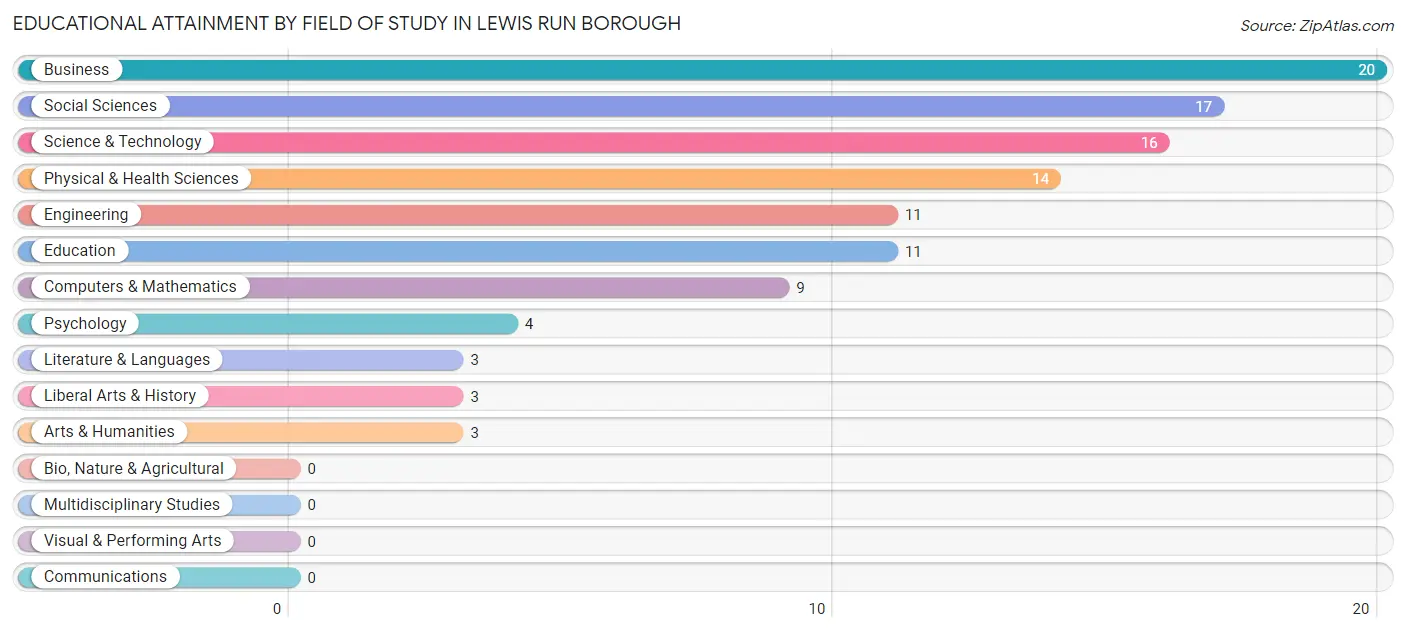
| Field of Study | # Graduates | % Graduates |
| Computers & Mathematics | 9 | 8.1% |
| Bio, Nature & Agricultural | 0 | 0.0% |
| Physical & Health Sciences | 14 | 12.6% |
| Psychology | 4 | 3.6% |
| Social Sciences | 17 | 15.3% |
| Engineering | 11 | 9.9% |
| Multidisciplinary Studies | 0 | 0.0% |
| Science & Technology | 16 | 14.4% |
| Business | 20 | 18.0% |
| Education | 11 | 9.9% |
| Literature & Languages | 3 | 2.7% |
| Liberal Arts & History | 3 | 2.7% |
| Visual & Performing Arts | 0 | 0.0% |
| Communications | 0 | 0.0% |
| Arts & Humanities | 3 | 2.7% |
| Total | 111 | 100.0% |
Transportation & Commute in Lewis Run borough
Vehicle Availability by Sex in Lewis Run borough
The most prevalent vehicle ownership categories in Lewis Run borough are males with 2 vehicles (86, accounting for 51.8%) and females with 2 vehicles (69, making up 50.9%).
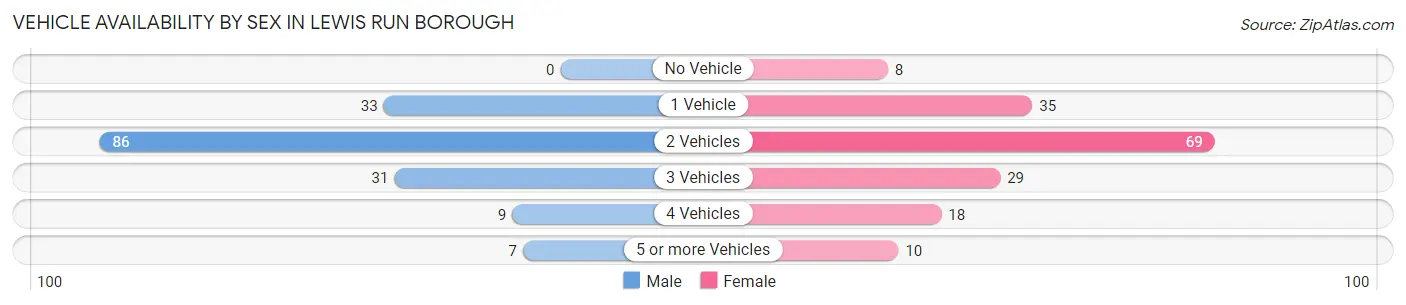
| Vehicles Available | Male | Female |
| No Vehicle | 0 (0.0%) | 8 (4.7%) |
| 1 Vehicle | 33 (19.9%) | 35 (20.7%) |
| 2 Vehicles | 86 (51.8%) | 69 (40.8%) |
| 3 Vehicles | 31 (18.7%) | 29 (17.2%) |
| 4 Vehicles | 9 (5.4%) | 18 (10.6%) |
| 5 or more Vehicles | 7 (4.2%) | 10 (5.9%) |
| Total | 166 (100.0%) | 169 (100.0%) |
Commute Time in Lewis Run borough
The most frequently occuring commute durations in Lewis Run borough are 10 to 14 minutes (124 commuters, 37.7%), 15 to 19 minutes (42 commuters, 12.8%), and 20 to 24 minutes (33 commuters, 10.0%).
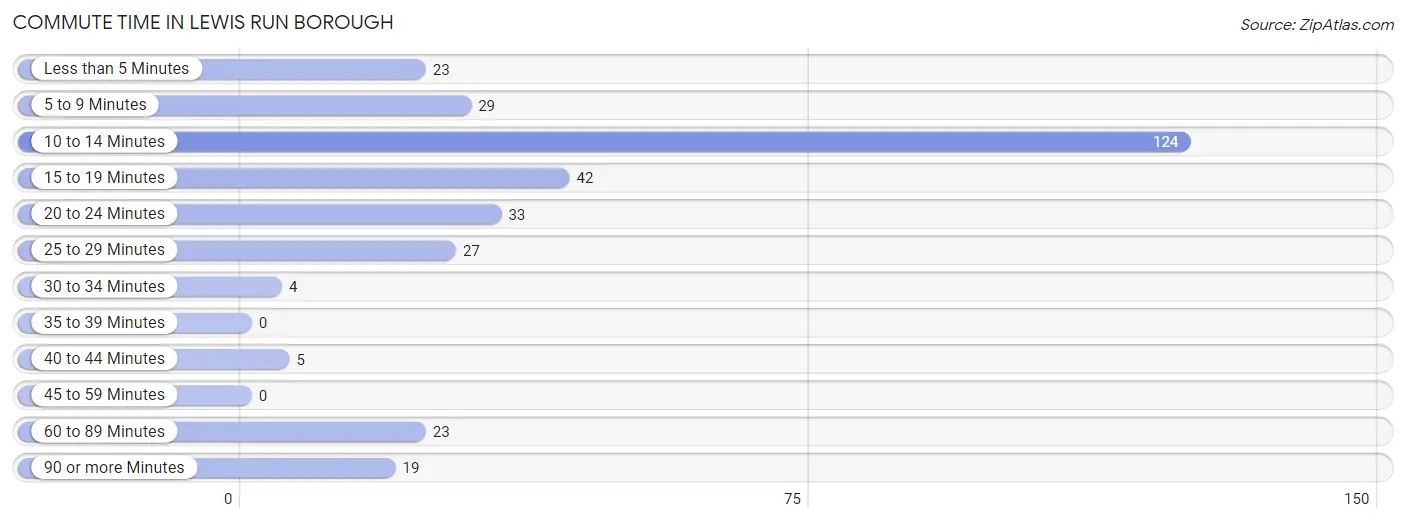
| Commute Time | # Commuters | % Commuters |
| Less than 5 Minutes | 23 | 7.0% |
| 5 to 9 Minutes | 29 | 8.8% |
| 10 to 14 Minutes | 124 | 37.7% |
| 15 to 19 Minutes | 42 | 12.8% |
| 20 to 24 Minutes | 33 | 10.0% |
| 25 to 29 Minutes | 27 | 8.2% |
| 30 to 34 Minutes | 4 | 1.2% |
| 35 to 39 Minutes | 0 | 0.0% |
| 40 to 44 Minutes | 5 | 1.5% |
| 45 to 59 Minutes | 0 | 0.0% |
| 60 to 89 Minutes | 23 | 7.0% |
| 90 or more Minutes | 19 | 5.8% |
Commute Time by Sex in Lewis Run borough
The most common commute times in Lewis Run borough are 10 to 14 minutes (67 commuters, 41.1%) for males and 10 to 14 minutes (57 commuters, 34.3%) for females.
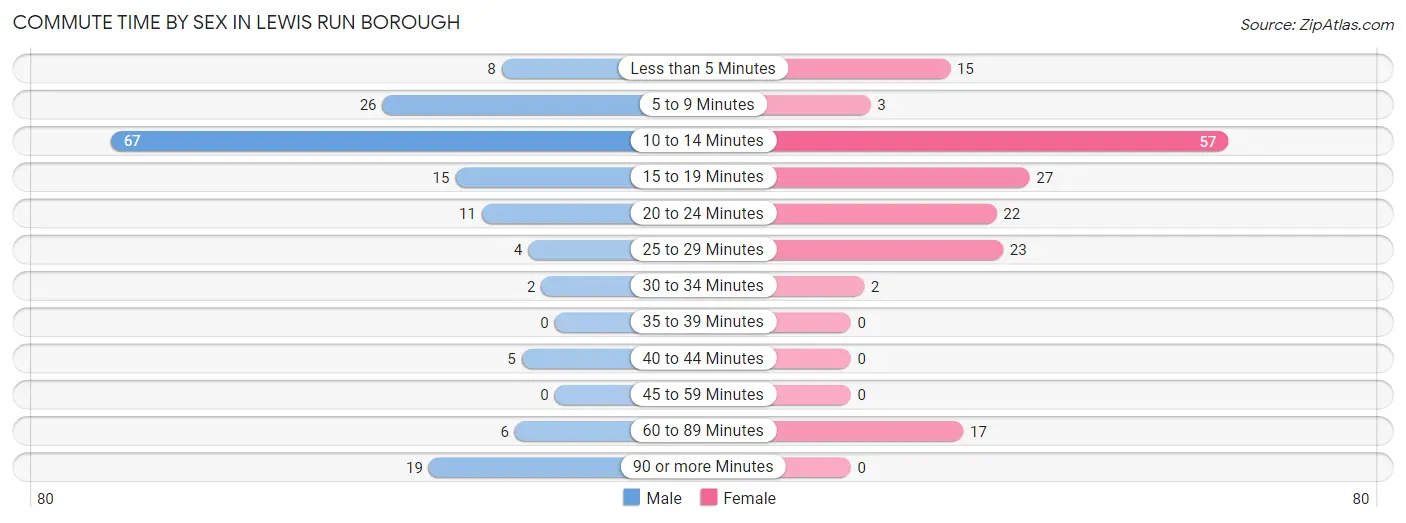
| Commute Time | Male | Female |
| Less than 5 Minutes | 8 (4.9%) | 15 (9.0%) |
| 5 to 9 Minutes | 26 (16.0%) | 3 (1.8%) |
| 10 to 14 Minutes | 67 (41.1%) | 57 (34.3%) |
| 15 to 19 Minutes | 15 (9.2%) | 27 (16.3%) |
| 20 to 24 Minutes | 11 (6.8%) | 22 (13.3%) |
| 25 to 29 Minutes | 4 (2.5%) | 23 (13.9%) |
| 30 to 34 Minutes | 2 (1.2%) | 2 (1.2%) |
| 35 to 39 Minutes | 0 (0.0%) | 0 (0.0%) |
| 40 to 44 Minutes | 5 (3.1%) | 0 (0.0%) |
| 45 to 59 Minutes | 0 (0.0%) | 0 (0.0%) |
| 60 to 89 Minutes | 6 (3.7%) | 17 (10.2%) |
| 90 or more Minutes | 19 (11.7%) | 0 (0.0%) |
Time of Departure to Work by Sex in Lewis Run borough
The most frequent times of departure to work in Lewis Run borough are 6:00 AM to 6:29 AM (33, 20.3%) for males and 7:30 AM to 7:59 AM (40, 24.1%) for females.
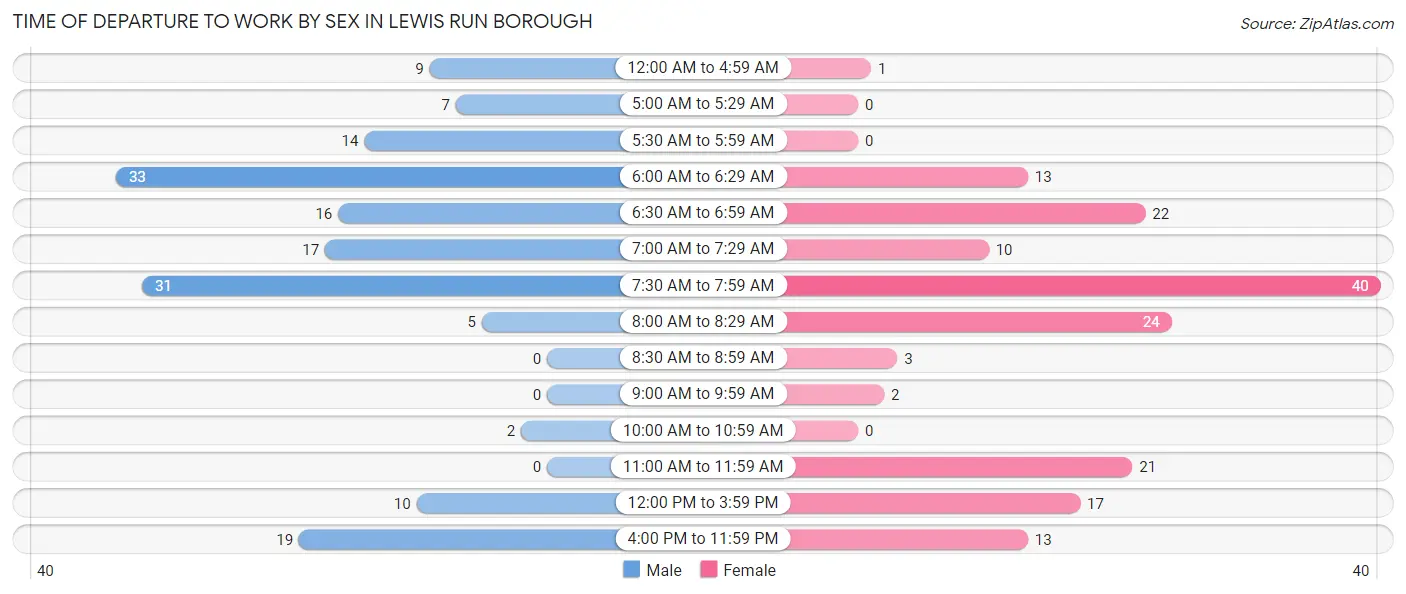
| Time of Departure | Male | Female |
| 12:00 AM to 4:59 AM | 9 (5.5%) | 1 (0.6%) |
| 5:00 AM to 5:29 AM | 7 (4.3%) | 0 (0.0%) |
| 5:30 AM to 5:59 AM | 14 (8.6%) | 0 (0.0%) |
| 6:00 AM to 6:29 AM | 33 (20.3%) | 13 (7.8%) |
| 6:30 AM to 6:59 AM | 16 (9.8%) | 22 (13.3%) |
| 7:00 AM to 7:29 AM | 17 (10.4%) | 10 (6.0%) |
| 7:30 AM to 7:59 AM | 31 (19.0%) | 40 (24.1%) |
| 8:00 AM to 8:29 AM | 5 (3.1%) | 24 (14.5%) |
| 8:30 AM to 8:59 AM | 0 (0.0%) | 3 (1.8%) |
| 9:00 AM to 9:59 AM | 0 (0.0%) | 2 (1.2%) |
| 10:00 AM to 10:59 AM | 2 (1.2%) | 0 (0.0%) |
| 11:00 AM to 11:59 AM | 0 (0.0%) | 21 (12.7%) |
| 12:00 PM to 3:59 PM | 10 (6.1%) | 17 (10.2%) |
| 4:00 PM to 11:59 PM | 19 (11.7%) | 13 (7.8%) |
| Total | 163 (100.0%) | 166 (100.0%) |
Housing Occupancy in Lewis Run borough
Occupancy by Ownership in Lewis Run borough
Of the total 255 dwellings in Lewis Run borough, owner-occupied units account for 209 (82.0%), while renter-occupied units make up 46 (18.0%).
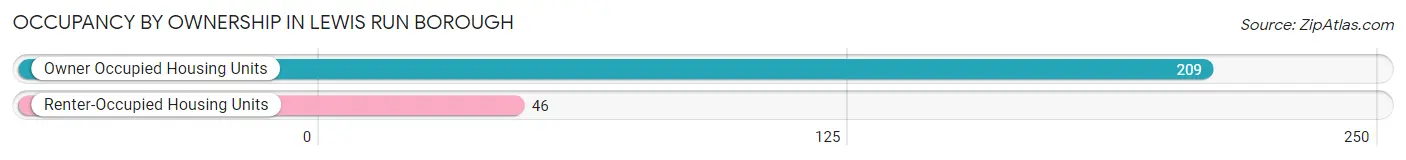
| Occupancy | # Housing Units | % Housing Units |
| Owner Occupied Housing Units | 209 | 82.0% |
| Renter-Occupied Housing Units | 46 | 18.0% |
| Total Occupied Housing Units | 255 | 100.0% |
Occupancy by Household Size in Lewis Run borough
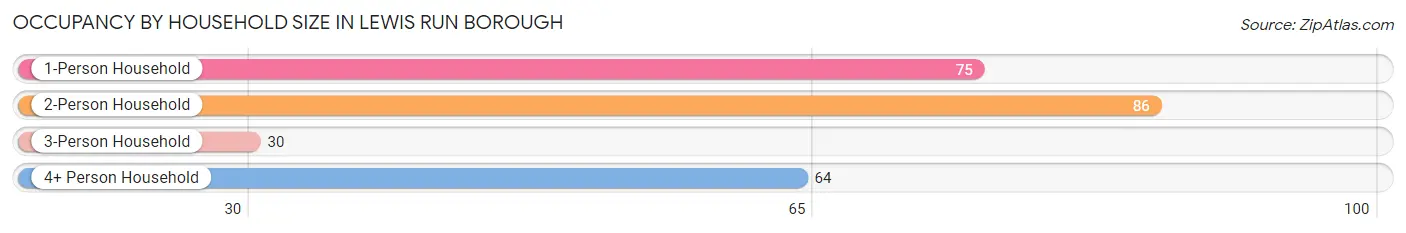
| Household Size | # Housing Units | % Housing Units |
| 1-Person Household | 75 | 29.4% |
| 2-Person Household | 86 | 33.7% |
| 3-Person Household | 30 | 11.8% |
| 4+ Person Household | 64 | 25.1% |
| Total Housing Units | 255 | 100.0% |
Occupancy by Ownership by Household Size in Lewis Run borough
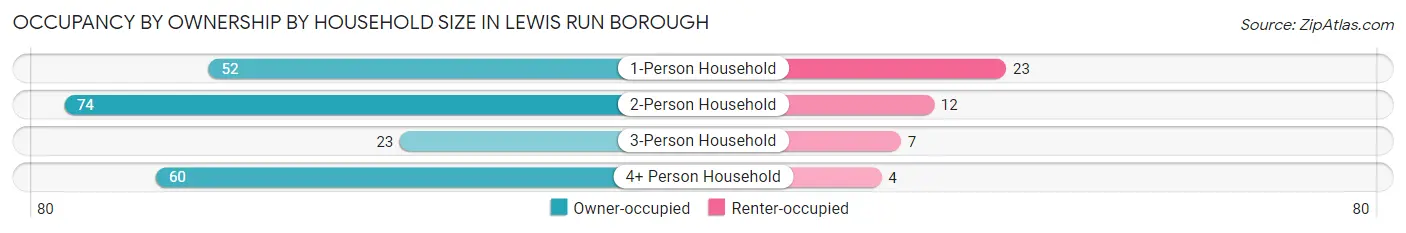
| Household Size | Owner-occupied | Renter-occupied |
| 1-Person Household | 52 (69.3%) | 23 (30.7%) |
| 2-Person Household | 74 (86.1%) | 12 (14.0%) |
| 3-Person Household | 23 (76.7%) | 7 (23.3%) |
| 4+ Person Household | 60 (93.8%) | 4 (6.2%) |
| Total Housing Units | 209 (82.0%) | 46 (18.0%) |
Occupancy by Educational Attainment in Lewis Run borough
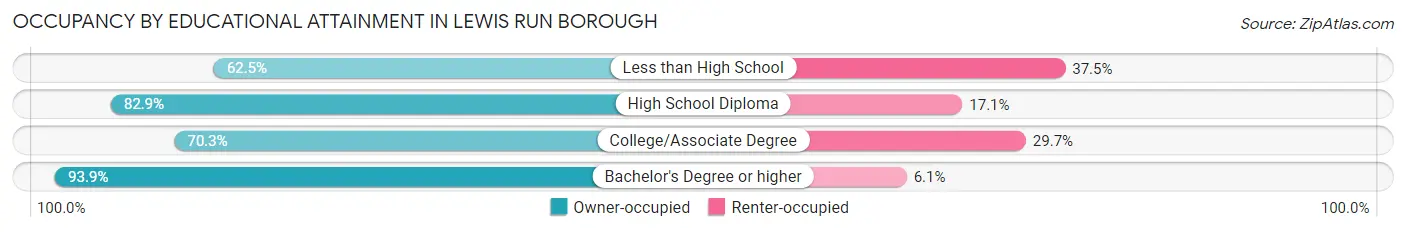
| Household Size | Owner-occupied | Renter-occupied |
| Less than High School | 5 (62.5%) | 3 (37.5%) |
| High School Diploma | 97 (82.9%) | 20 (17.1%) |
| College/Associate Degree | 45 (70.3%) | 19 (29.7%) |
| Bachelor's Degree or higher | 62 (93.9%) | 4 (6.1%) |
Occupancy by Age of Householder in Lewis Run borough
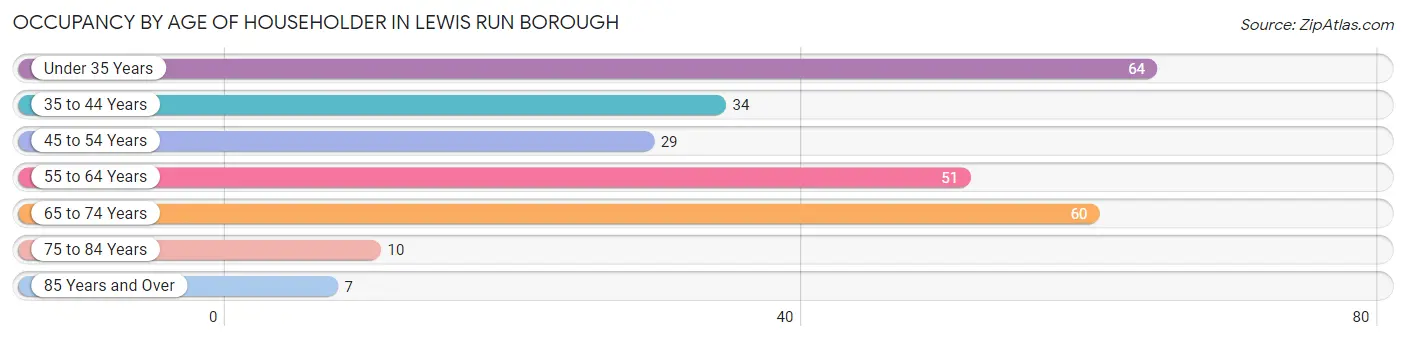
| Age Bracket | # Households | % Households |
| Under 35 Years | 64 | 25.1% |
| 35 to 44 Years | 34 | 13.3% |
| 45 to 54 Years | 29 | 11.4% |
| 55 to 64 Years | 51 | 20.0% |
| 65 to 74 Years | 60 | 23.5% |
| 75 to 84 Years | 10 | 3.9% |
| 85 Years and Over | 7 | 2.8% |
| Total | 255 | 100.0% |
Housing Finances in Lewis Run borough
Median Income by Occupancy in Lewis Run borough
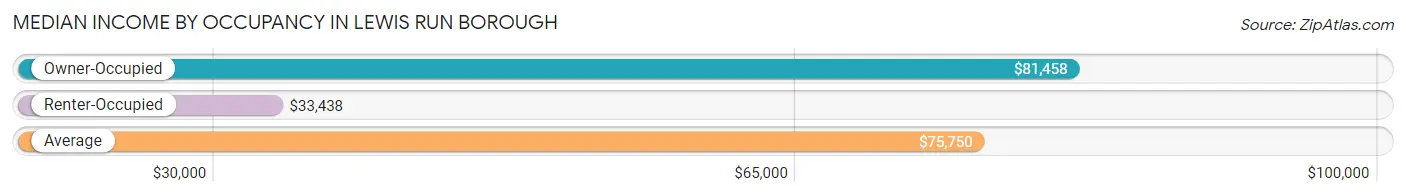
| Occupancy Type | # Households | Median Income |
| Owner-Occupied | 209 (82.0%) | $81,458 |
| Renter-Occupied | 46 (18.0%) | $33,438 |
| Average | 255 (100.0%) | $75,750 |
Occupancy by Householder Income Bracket in Lewis Run borough
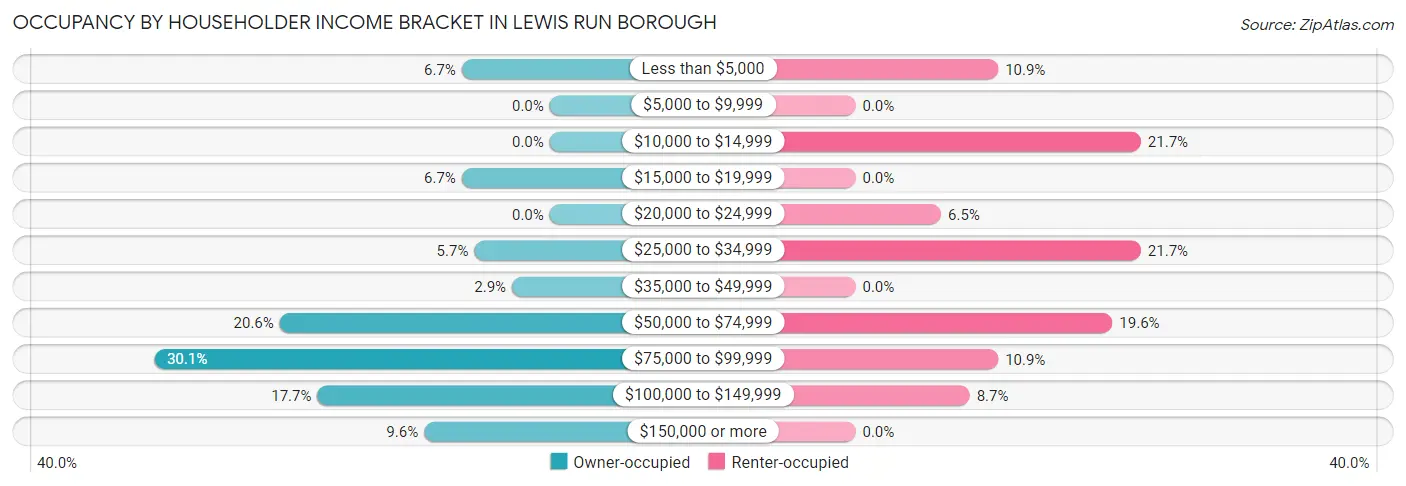
| Income Bracket | Owner-occupied | Renter-occupied |
| Less than $5,000 | 14 (6.7%) | 5 (10.9%) |
| $5,000 to $9,999 | 0 (0.0%) | 0 (0.0%) |
| $10,000 to $14,999 | 0 (0.0%) | 10 (21.7%) |
| $15,000 to $19,999 | 14 (6.7%) | 0 (0.0%) |
| $20,000 to $24,999 | 0 (0.0%) | 3 (6.5%) |
| $25,000 to $34,999 | 12 (5.7%) | 10 (21.7%) |
| $35,000 to $49,999 | 6 (2.9%) | 0 (0.0%) |
| $50,000 to $74,999 | 43 (20.6%) | 9 (19.6%) |
| $75,000 to $99,999 | 63 (30.1%) | 5 (10.9%) |
| $100,000 to $149,999 | 37 (17.7%) | 4 (8.7%) |
| $150,000 or more | 20 (9.6%) | 0 (0.0%) |
| Total | 209 (100.0%) | 46 (100.0%) |
Monthly Housing Cost Tiers in Lewis Run borough
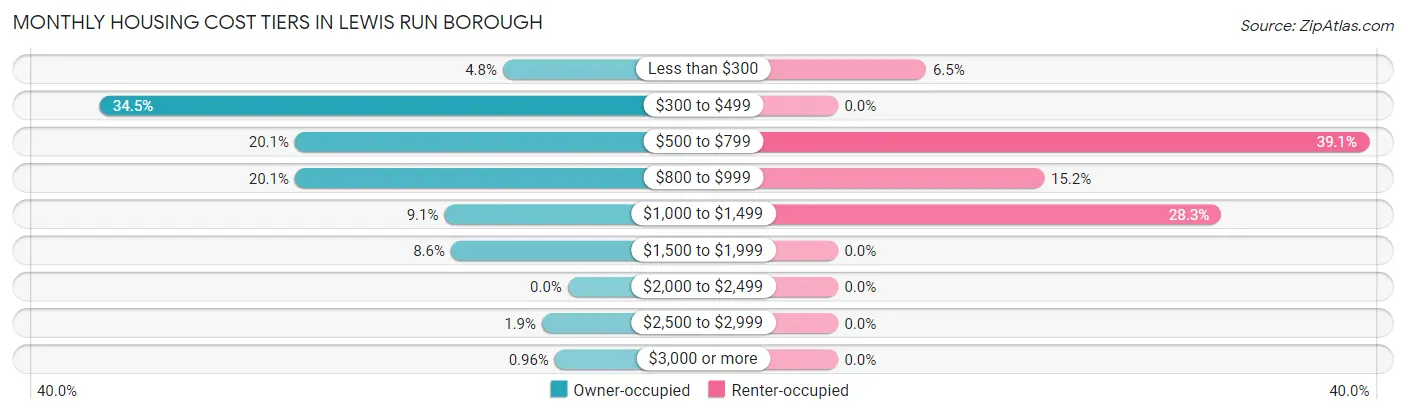
| Monthly Cost | Owner-occupied | Renter-occupied |
| Less than $300 | 10 (4.8%) | 3 (6.5%) |
| $300 to $499 | 72 (34.4%) | 0 (0.0%) |
| $500 to $799 | 42 (20.1%) | 18 (39.1%) |
| $800 to $999 | 42 (20.1%) | 7 (15.2%) |
| $1,000 to $1,499 | 19 (9.1%) | 13 (28.3%) |
| $1,500 to $1,999 | 18 (8.6%) | 0 (0.0%) |
| $2,000 to $2,499 | 0 (0.0%) | 0 (0.0%) |
| $2,500 to $2,999 | 4 (1.9%) | 0 (0.0%) |
| $3,000 or more | 2 (1.0%) | 0 (0.0%) |
| Total | 209 (100.0%) | 46 (100.0%) |
Physical Housing Characteristics in Lewis Run borough
Housing Structures in Lewis Run borough
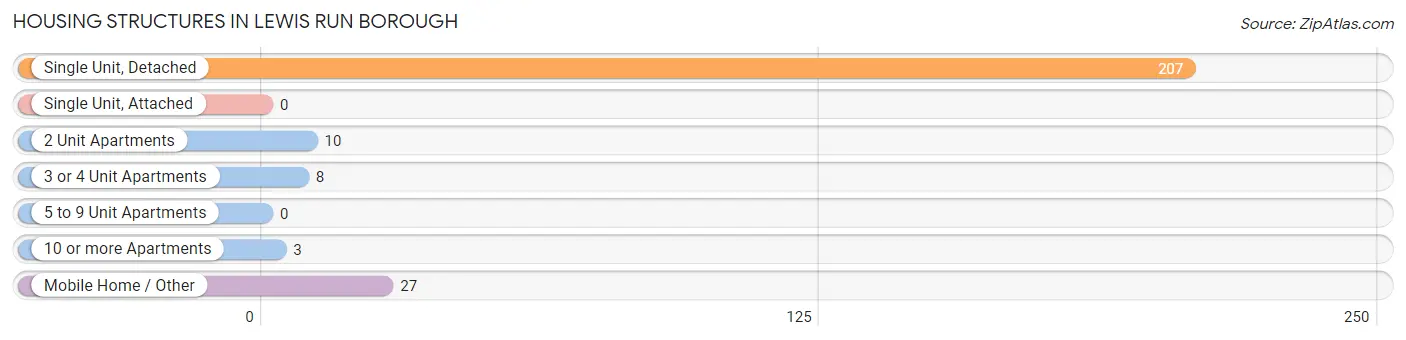
| Structure Type | # Housing Units | % Housing Units |
| Single Unit, Detached | 207 | 81.2% |
| Single Unit, Attached | 0 | 0.0% |
| 2 Unit Apartments | 10 | 3.9% |
| 3 or 4 Unit Apartments | 8 | 3.1% |
| 5 to 9 Unit Apartments | 0 | 0.0% |
| 10 or more Apartments | 3 | 1.2% |
| Mobile Home / Other | 27 | 10.6% |
| Total | 255 | 100.0% |
Housing Structures by Occupancy in Lewis Run borough
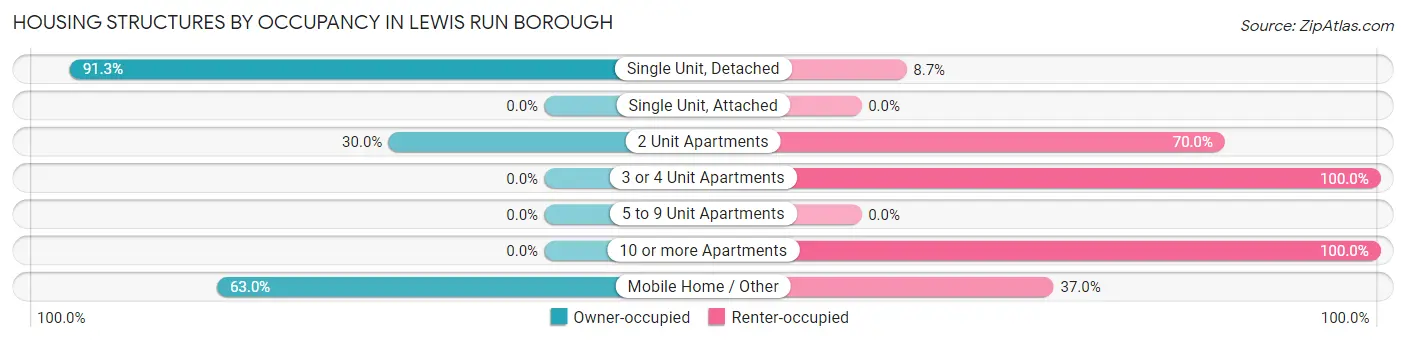
| Structure Type | Owner-occupied | Renter-occupied |
| Single Unit, Detached | 189 (91.3%) | 18 (8.7%) |
| Single Unit, Attached | 0 (0.0%) | 0 (0.0%) |
| 2 Unit Apartments | 3 (30.0%) | 7 (70.0%) |
| 3 or 4 Unit Apartments | 0 (0.0%) | 8 (100.0%) |
| 5 to 9 Unit Apartments | 0 (0.0%) | 0 (0.0%) |
| 10 or more Apartments | 0 (0.0%) | 3 (100.0%) |
| Mobile Home / Other | 17 (63.0%) | 10 (37.0%) |
| Total | 209 (82.0%) | 46 (18.0%) |
Housing Structures by Number of Rooms in Lewis Run borough
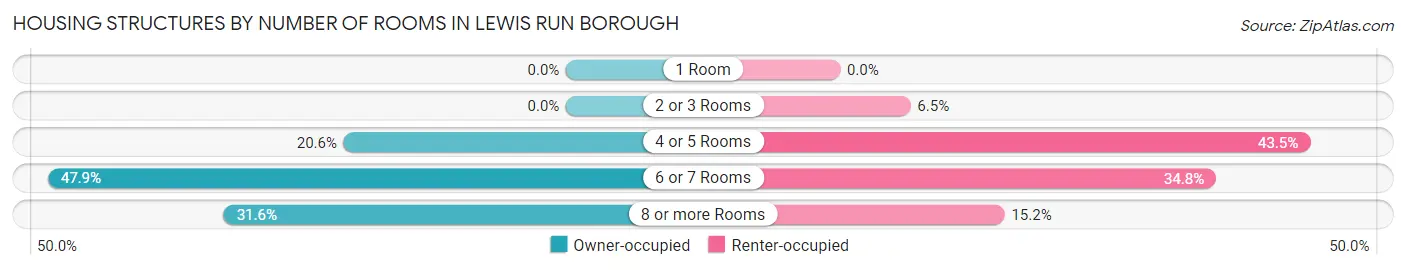
| Number of Rooms | Owner-occupied | Renter-occupied |
| 1 Room | 0 (0.0%) | 0 (0.0%) |
| 2 or 3 Rooms | 0 (0.0%) | 3 (6.5%) |
| 4 or 5 Rooms | 43 (20.6%) | 20 (43.5%) |
| 6 or 7 Rooms | 100 (47.8%) | 16 (34.8%) |
| 8 or more Rooms | 66 (31.6%) | 7 (15.2%) |
| Total | 209 (100.0%) | 46 (100.0%) |
Housing Structure by Heating Type in Lewis Run borough
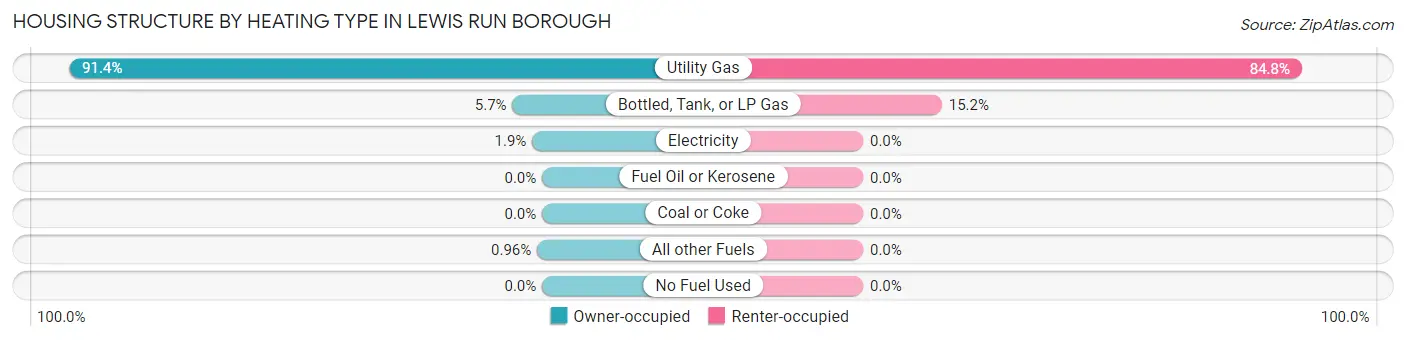
| Heating Type | Owner-occupied | Renter-occupied |
| Utility Gas | 191 (91.4%) | 39 (84.8%) |
| Bottled, Tank, or LP Gas | 12 (5.7%) | 7 (15.2%) |
| Electricity | 4 (1.9%) | 0 (0.0%) |
| Fuel Oil or Kerosene | 0 (0.0%) | 0 (0.0%) |
| Coal or Coke | 0 (0.0%) | 0 (0.0%) |
| All other Fuels | 2 (1.0%) | 0 (0.0%) |
| No Fuel Used | 0 (0.0%) | 0 (0.0%) |
| Total | 209 (100.0%) | 46 (100.0%) |
Household Vehicle Usage in Lewis Run borough
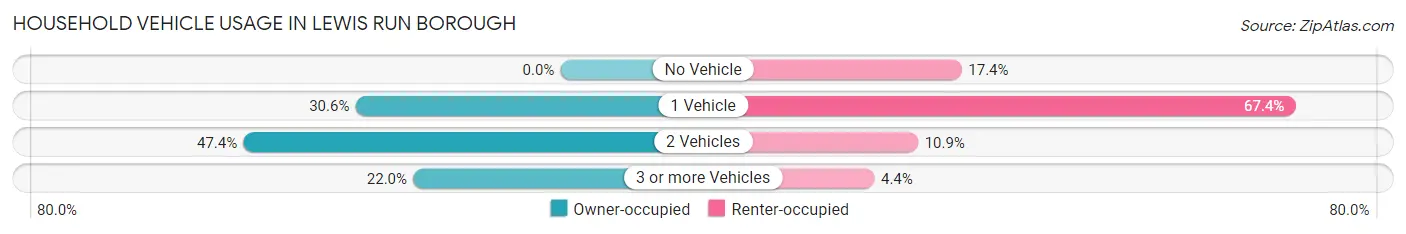
| Vehicles per Household | Owner-occupied | Renter-occupied |
| No Vehicle | 0 (0.0%) | 8 (17.4%) |
| 1 Vehicle | 64 (30.6%) | 31 (67.4%) |
| 2 Vehicles | 99 (47.4%) | 5 (10.9%) |
| 3 or more Vehicles | 46 (22.0%) | 2 (4.3%) |
| Total | 209 (100.0%) | 46 (100.0%) |
Real Estate & Mortgages in Lewis Run borough
Real Estate and Mortgage Overview in Lewis Run borough
| Characteristic | Without Mortgage | With Mortgage |
| Housing Units | 113 | 96 |
| Median Property Value | $106,900 | $112,500 |
| Median Household Income | $70,781 | $15 |
| Monthly Housing Costs | $438 | $2 |
| Real Estate Taxes | $1,705 | $10 |
Property Value by Mortgage Status in Lewis Run borough
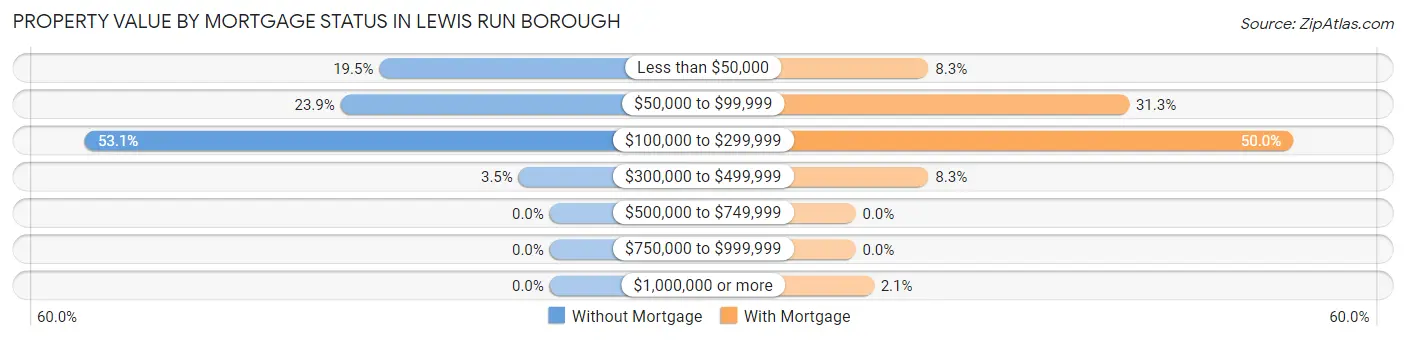
| Property Value | Without Mortgage | With Mortgage |
| Less than $50,000 | 22 (19.5%) | 8 (8.3%) |
| $50,000 to $99,999 | 27 (23.9%) | 30 (31.2%) |
| $100,000 to $299,999 | 60 (53.1%) | 48 (50.0%) |
| $300,000 to $499,999 | 4 (3.5%) | 8 (8.3%) |
| $500,000 to $749,999 | 0 (0.0%) | 0 (0.0%) |
| $750,000 to $999,999 | 0 (0.0%) | 0 (0.0%) |
| $1,000,000 or more | 0 (0.0%) | 2 (2.1%) |
| Total | 113 (100.0%) | 96 (100.0%) |
Household Income by Mortgage Status in Lewis Run borough
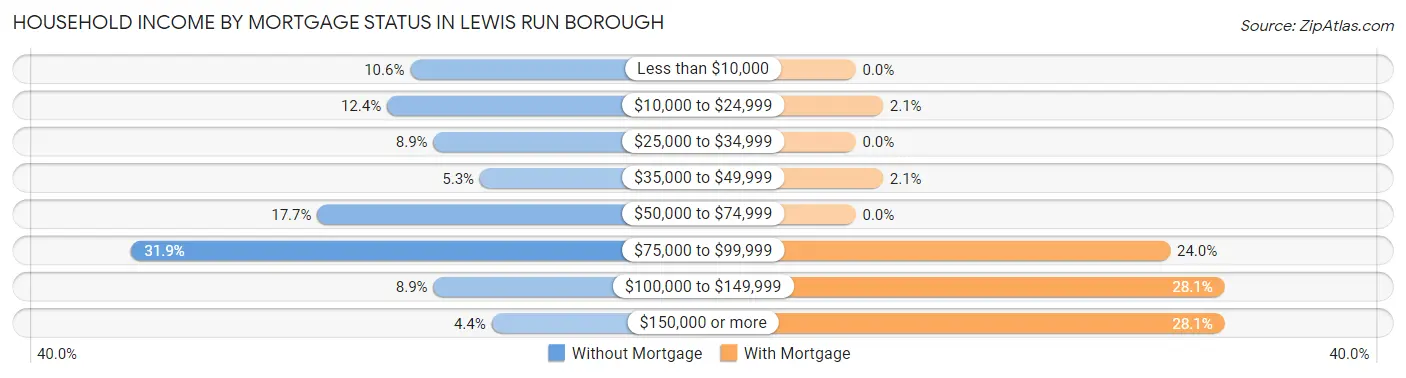
| Household Income | Without Mortgage | With Mortgage |
| Less than $10,000 | 12 (10.6%) | 0 (0.0%) |
| $10,000 to $24,999 | 14 (12.4%) | 2 (2.1%) |
| $25,000 to $34,999 | 10 (8.8%) | 0 (0.0%) |
| $35,000 to $49,999 | 6 (5.3%) | 2 (2.1%) |
| $50,000 to $74,999 | 20 (17.7%) | 0 (0.0%) |
| $75,000 to $99,999 | 36 (31.9%) | 23 (24.0%) |
| $100,000 to $149,999 | 10 (8.8%) | 27 (28.1%) |
| $150,000 or more | 5 (4.4%) | 27 (28.1%) |
| Total | 113 (100.0%) | 96 (100.0%) |
Property Value to Household Income Ratio in Lewis Run borough
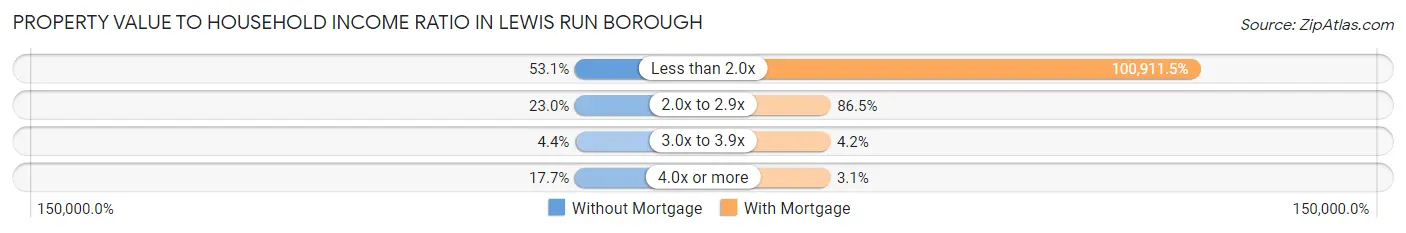
| Value-to-Income Ratio | Without Mortgage | With Mortgage |
| Less than 2.0x | 60 (53.1%) | 96,875 (100,911.5%) |
| 2.0x to 2.9x | 26 (23.0%) | 83 (86.5%) |
| 3.0x to 3.9x | 5 (4.4%) | 4 (4.2%) |
| 4.0x or more | 20 (17.7%) | 3 (3.1%) |
| Total | 113 (100.0%) | 96 (100.0%) |
Real Estate Taxes by Mortgage Status in Lewis Run borough
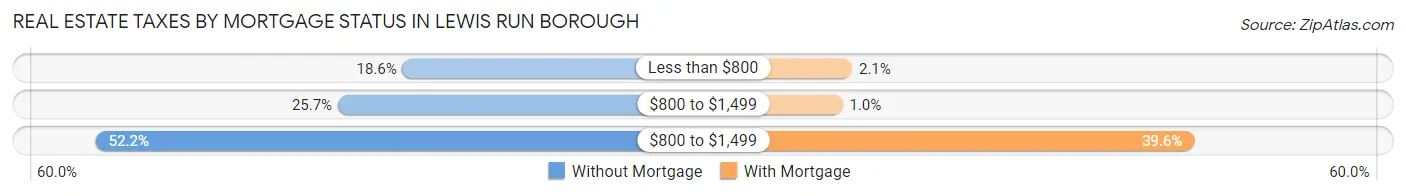
| Property Taxes | Without Mortgage | With Mortgage |
| Less than $800 | 21 (18.6%) | 2 (2.1%) |
| $800 to $1,499 | 29 (25.7%) | 1 (1.0%) |
| $800 to $1,499 | 59 (52.2%) | 38 (39.6%) |
| Total | 113 (100.0%) | 96 (100.0%) |
Health & Disability in Lewis Run borough
Health Insurance Coverage by Age in Lewis Run borough
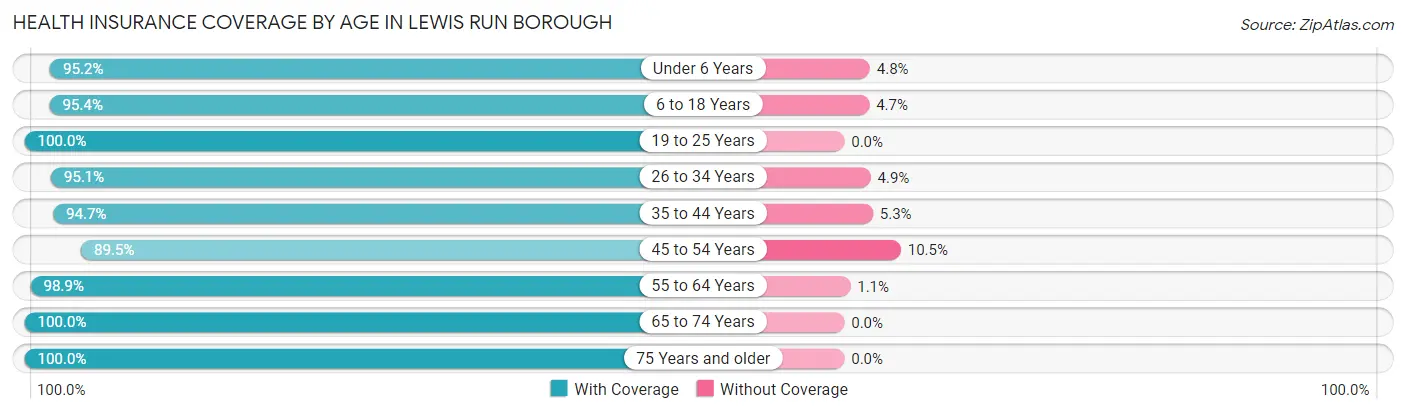
| Age Bracket | With Coverage | Without Coverage |
| Under 6 Years | 60 (95.2%) | 3 (4.8%) |
| 6 to 18 Years | 123 (95.4%) | 6 (4.6%) |
| 19 to 25 Years | 63 (100.0%) | 0 (0.0%) |
| 26 to 34 Years | 97 (95.1%) | 5 (4.9%) |
| 35 to 44 Years | 71 (94.7%) | 4 (5.3%) |
| 45 to 54 Years | 51 (89.5%) | 6 (10.5%) |
| 55 to 64 Years | 88 (98.9%) | 1 (1.1%) |
| 65 to 74 Years | 84 (100.0%) | 0 (0.0%) |
| 75 Years and older | 25 (100.0%) | 0 (0.0%) |
| Total | 662 (96.4%) | 25 (3.6%) |
Health Insurance Coverage by Citizenship Status in Lewis Run borough
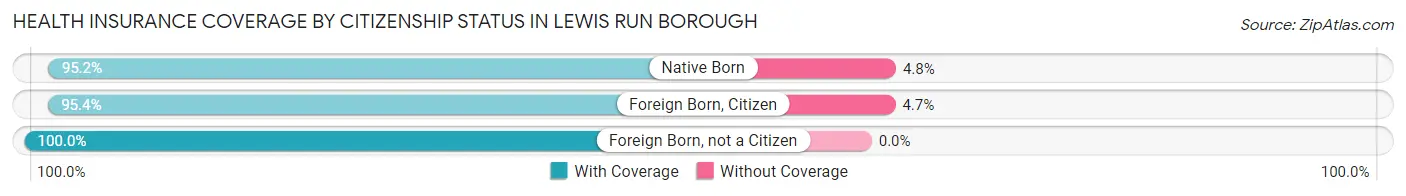
| Citizenship Status | With Coverage | Without Coverage |
| Native Born | 60 (95.2%) | 3 (4.8%) |
| Foreign Born, Citizen | 123 (95.4%) | 6 (4.6%) |
| Foreign Born, not a Citizen | 63 (100.0%) | 0 (0.0%) |
Health Insurance Coverage by Household Income in Lewis Run borough
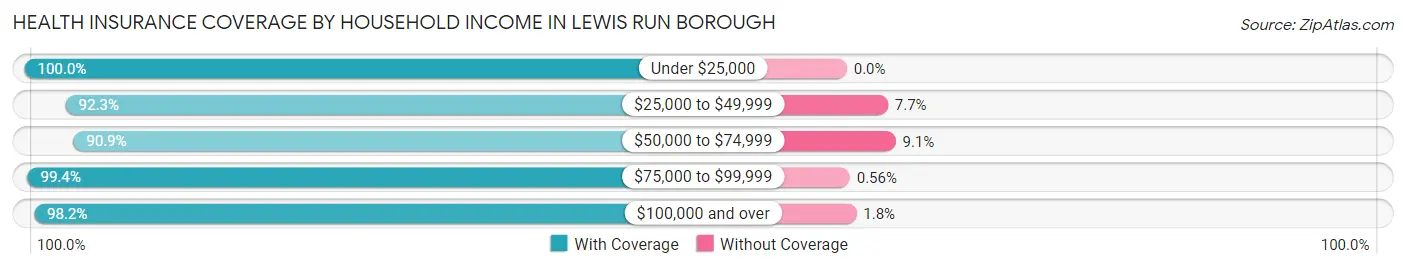
| Household Income | With Coverage | Without Coverage |
| Under $25,000 | 58 (100.0%) | 0 (0.0%) |
| $25,000 to $49,999 | 48 (92.3%) | 4 (7.7%) |
| $50,000 to $74,999 | 159 (90.9%) | 16 (9.1%) |
| $75,000 to $99,999 | 177 (99.4%) | 1 (0.6%) |
| $100,000 and over | 220 (98.2%) | 4 (1.8%) |
Public vs Private Health Insurance Coverage by Age in Lewis Run borough
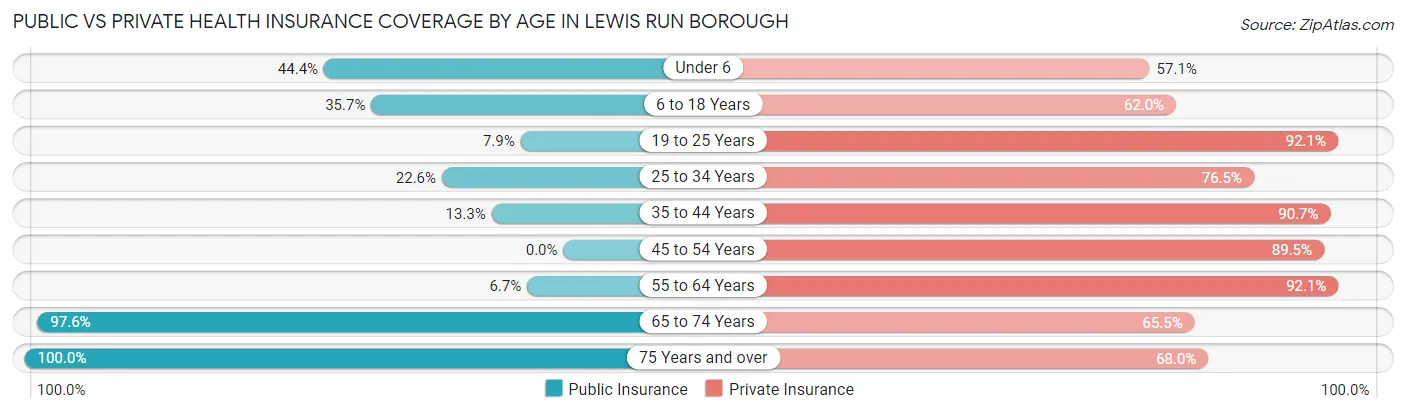
| Age Bracket | Public Insurance | Private Insurance |
| Under 6 | 28 (44.4%) | 36 (57.1%) |
| 6 to 18 Years | 46 (35.7%) | 80 (62.0%) |
| 19 to 25 Years | 5 (7.9%) | 58 (92.1%) |
| 25 to 34 Years | 23 (22.6%) | 78 (76.5%) |
| 35 to 44 Years | 10 (13.3%) | 68 (90.7%) |
| 45 to 54 Years | 0 (0.0%) | 51 (89.5%) |
| 55 to 64 Years | 6 (6.7%) | 82 (92.1%) |
| 65 to 74 Years | 82 (97.6%) | 55 (65.5%) |
| 75 Years and over | 25 (100.0%) | 17 (68.0%) |
| Total | 225 (32.8%) | 525 (76.4%) |
Disability Status by Sex by Age in Lewis Run borough
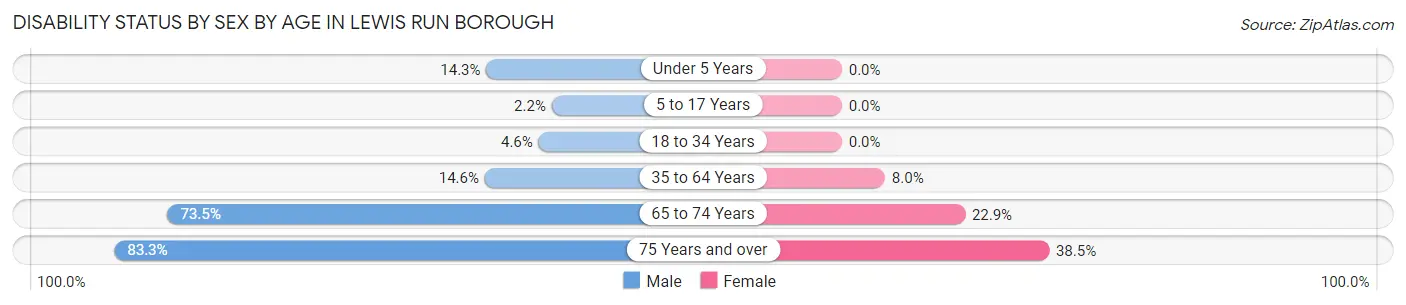
| Age Bracket | Male | Female |
| Under 5 Years | 3 (14.3%) | 0 (0.0%) |
| 5 to 17 Years | 2 (2.1%) | 0 (0.0%) |
| 18 to 34 Years | 5 (4.6%) | 0 (0.0%) |
| 35 to 64 Years | 14 (14.6%) | 10 (8.0%) |
| 65 to 74 Years | 36 (73.5%) | 8 (22.9%) |
| 75 Years and over | 10 (83.3%) | 5 (38.5%) |
Disability Class by Sex by Age in Lewis Run borough
Disability Class: Hearing Difficulty
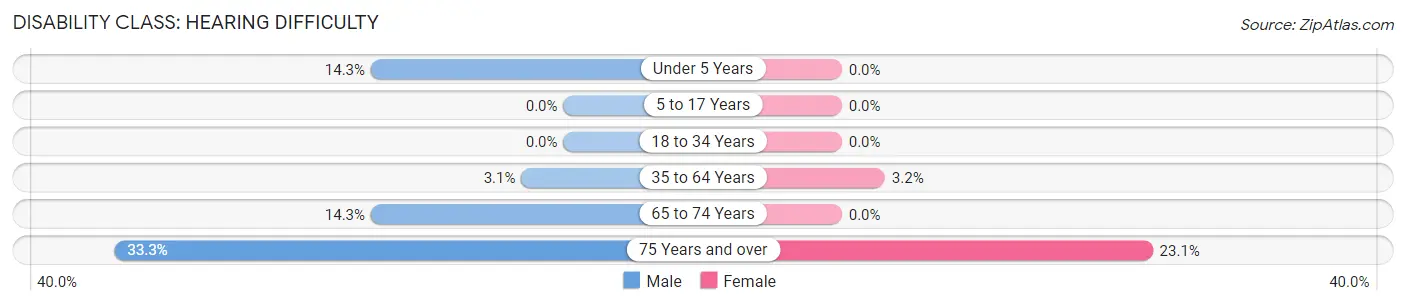
| Age Bracket | Male | Female |
| Under 5 Years | 3 (14.3%) | 0 (0.0%) |
| 5 to 17 Years | 0 (0.0%) | 0 (0.0%) |
| 18 to 34 Years | 0 (0.0%) | 0 (0.0%) |
| 35 to 64 Years | 3 (3.1%) | 4 (3.2%) |
| 65 to 74 Years | 7 (14.3%) | 0 (0.0%) |
| 75 Years and over | 4 (33.3%) | 3 (23.1%) |
Disability Class: Vision Difficulty
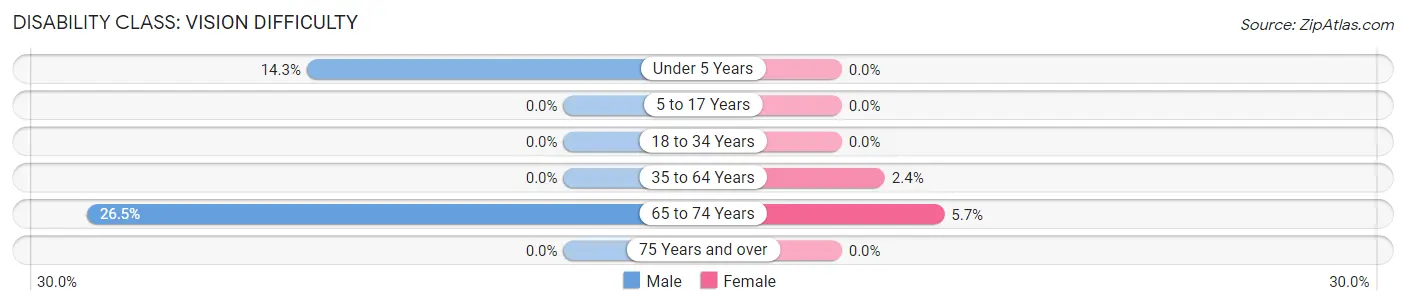
| Age Bracket | Male | Female |
| Under 5 Years | 3 (14.3%) | 0 (0.0%) |
| 5 to 17 Years | 0 (0.0%) | 0 (0.0%) |
| 18 to 34 Years | 0 (0.0%) | 0 (0.0%) |
| 35 to 64 Years | 0 (0.0%) | 3 (2.4%) |
| 65 to 74 Years | 13 (26.5%) | 2 (5.7%) |
| 75 Years and over | 0 (0.0%) | 0 (0.0%) |
Disability Class: Cognitive Difficulty
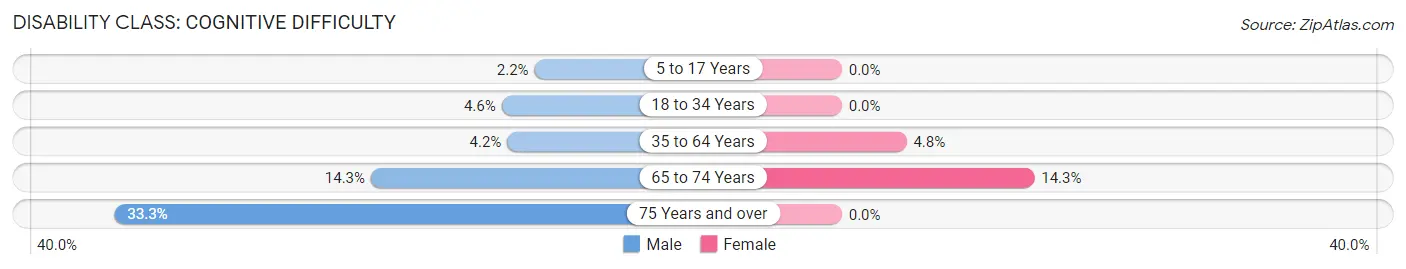
| Age Bracket | Male | Female |
| 5 to 17 Years | 2 (2.1%) | 0 (0.0%) |
| 18 to 34 Years | 5 (4.6%) | 0 (0.0%) |
| 35 to 64 Years | 4 (4.2%) | 6 (4.8%) |
| 65 to 74 Years | 7 (14.3%) | 5 (14.3%) |
| 75 Years and over | 4 (33.3%) | 0 (0.0%) |
Disability Class: Ambulatory Difficulty
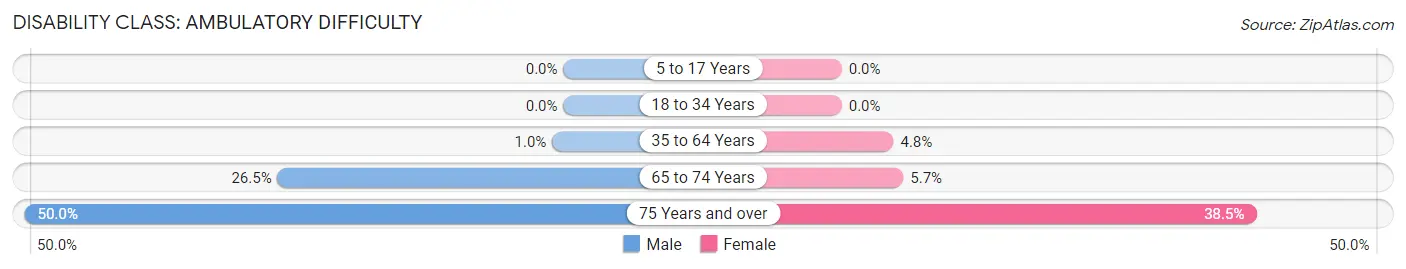
| Age Bracket | Male | Female |
| 5 to 17 Years | 0 (0.0%) | 0 (0.0%) |
| 18 to 34 Years | 0 (0.0%) | 0 (0.0%) |
| 35 to 64 Years | 1 (1.0%) | 6 (4.8%) |
| 65 to 74 Years | 13 (26.5%) | 2 (5.7%) |
| 75 Years and over | 6 (50.0%) | 5 (38.5%) |
Disability Class: Self-Care Difficulty
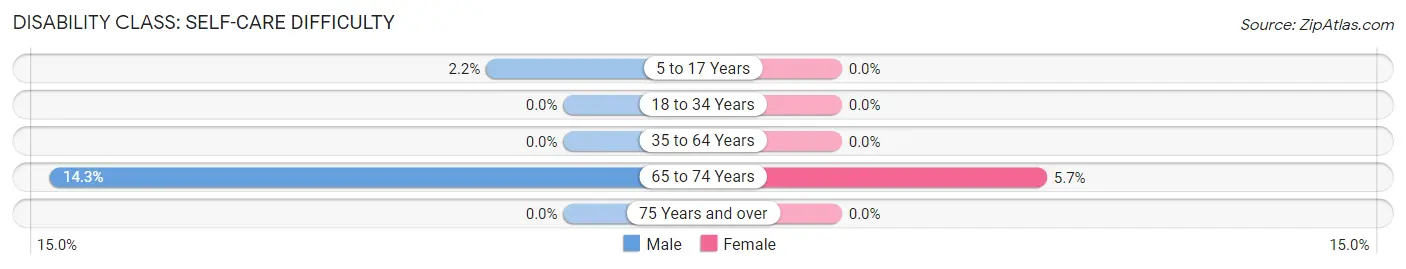
| Age Bracket | Male | Female |
| 5 to 17 Years | 2 (2.1%) | 0 (0.0%) |
| 18 to 34 Years | 0 (0.0%) | 0 (0.0%) |
| 35 to 64 Years | 0 (0.0%) | 0 (0.0%) |
| 65 to 74 Years | 7 (14.3%) | 2 (5.7%) |
| 75 Years and over | 0 (0.0%) | 0 (0.0%) |
Technology Access in Lewis Run borough
Computing Device Access in Lewis Run borough
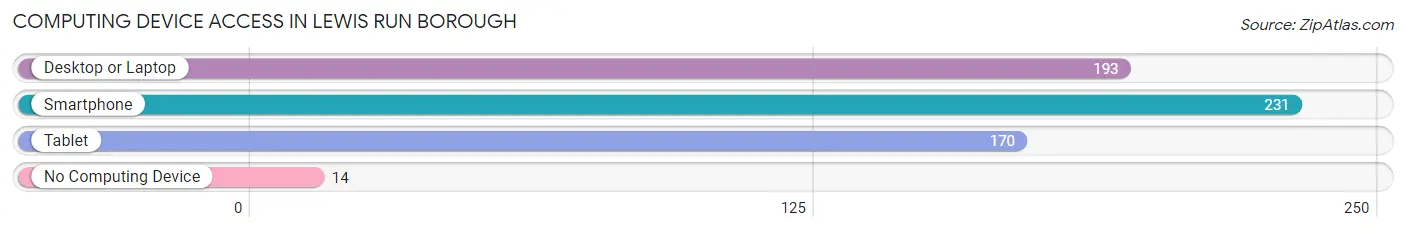
| Device Type | # Households | % Households |
| Desktop or Laptop | 193 | 75.7% |
| Smartphone | 231 | 90.6% |
| Tablet | 170 | 66.7% |
| No Computing Device | 14 | 5.5% |
| Total | 255 | 100.0% |
Internet Access in Lewis Run borough
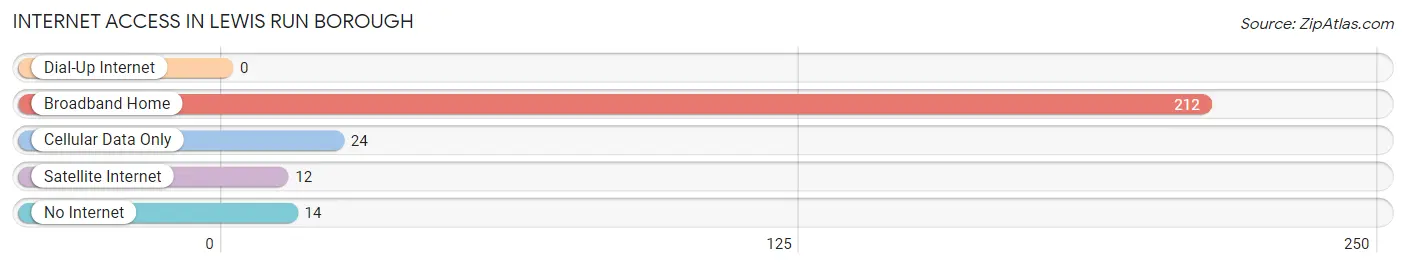
| Internet Type | # Households | % Households |
| Dial-Up Internet | 0 | 0.0% |
| Broadband Home | 212 | 83.1% |
| Cellular Data Only | 24 | 9.4% |
| Satellite Internet | 12 | 4.7% |
| No Internet | 14 | 5.5% |
| Total | 255 | 100.0% |
Lewis Run borough Summary
Run Borough is a small borough located in McKean County, Pennsylvania. It is situated in the Allegheny Plateau region of the state and is bordered by the townships of Liberty, Lafayette, and Bradford. The population of Run Borough was 1,093 at the 2010 census.
History
Run Borough was founded in 1876 and was named after the Lewis Run Creek, which runs through the borough. The creek was named after the Lewis family, who were early settlers in the area. The borough was incorporated in 1877 and was the first borough in McKean County.
The first settlers in the area were the Seneca Indians, who lived in the area until the late 1700s. The first white settlers arrived in the area in the early 1800s. The first industry in the area was lumbering, which was followed by coal mining. The coal industry was the main industry in the area until the 1950s.
Geography
Run Borough is located at 41°45'N, 78°45'W (41.75, -78.75). It has a total area of 0.7 square miles, all of which is land. The borough is located in the Allegheny Plateau region of Pennsylvania and is bordered by the townships of Liberty, Lafayette, and Bradford.
The borough is located in the Allegheny River watershed and is home to several creeks, including Lewis Run Creek, which runs through the borough. The borough is also home to several small lakes, including Lake Lewis Run and Lake Lafayette.
Economy
The economy of Run Borough is largely based on tourism and recreation. The borough is home to several recreational areas, including Lewis Run State Park, which is a popular destination for camping, fishing, and hiking. The borough is also home to several small businesses, including restaurants, shops, and a golf course.
Demographics
As of the 2010 census, the population of Run Borough was 1,093. The racial makeup of the borough was 97.2% White, 0.7% African American, 0.2% Native American, 0.2% Asian, 0.2% from other races, and 1.7% from two or more races. Hispanic or Latino of any race were 0.7% of the population.
The median income for a household in the borough was $37,500, and the median income for a family was $41,250. The per capita income for the borough was $17,845. About 11.2% of families and 13.2% of the population were below the poverty line, including 17.2% of those under age 18 and 8.3% of those age 65 or over.
Common Questions
What is the Total Population of Lewis Run borough?
Total Population of Lewis Run borough is 690.
What is the Total Male Population of Lewis Run borough?
Total Male Population of Lewis Run borough is 383.
What is the Total Female Population of Lewis Run borough?
Total Female Population of Lewis Run borough is 307.
What is the Ratio of Males per 100 Females in Lewis Run borough?
There are 124.76 Males per 100 Females in Lewis Run borough.
What is the Ratio of Females per 100 Males in Lewis Run borough?
There are 80.16 Females per 100 Males in Lewis Run borough.
What is the Median Population Age in Lewis Run borough?
Median Population Age in Lewis Run borough is 33.7 Years.
What is the Average Family Size in Lewis Run borough
Average Family Size in Lewis Run borough is 3.2 People.
What is the Average Household Size in Lewis Run borough
Average Household Size in Lewis Run borough is 2.7 People.
What is Per Capita Income in Lewis Run borough?
Per Capita income in Lewis Run borough is $30,112.
What is the Median Family Income in Lewis Run borough?
Median Family Income in Lewis Run borough is $84,167.
What is the Median Household income in Lewis Run borough?
Median Household Income in Lewis Run borough is $75,750.
What is Income or Wage Gap in Lewis Run borough?
Income or Wage Gap in Lewis Run borough is 23.5%.
Women in Lewis Run borough earn 76.5 cents for every dollar earned by a man.
What is Inequality or Gini Index in Lewis Run borough?
Inequality or Gini Index in Lewis Run borough is 0.37.
How Large is the Labor Force in Lewis Run borough?
There are 346 People in the Labor Forcein in Lewis Run borough.
What is the Percentage of People in the Labor Force in Lewis Run borough?
65.0% of People are in the Labor Force in Lewis Run borough.
What is the Unemployment Rate in Lewis Run borough?
Unemployment Rate in Lewis Run borough is 3.2%.