Smithfield borough, PA
Smithfield borough Overview
1,128
TOTAL POPULATION
539
MALE POPULATION
589
FEMALE POPULATION
91.51
MALES / 100 FEMALES
109.28
FEMALES / 100 MALES
39.0
MEDIAN AGE
2.9
AVG FAMILY SIZE
2.5
AVG HOUSEHOLD SIZE
$32,451
PER CAPITA INCOME
$100,833
AVG FAMILY INCOME
$74,333
AVG HOUSEHOLD INCOME
27.9%
WAGE / INCOME GAP [ % ]
72.1¢/ $1
WAGE / INCOME GAP [ $ ]
$17,333
FAMILY INCOME DEFICIT
0.37
INEQUALITY / GINI INDEX
584
LABOR FORCE [ PEOPLE ]
68.2%
PERCENT IN LABOR FORCE
8.7%
UNEMPLOYMENT RATE
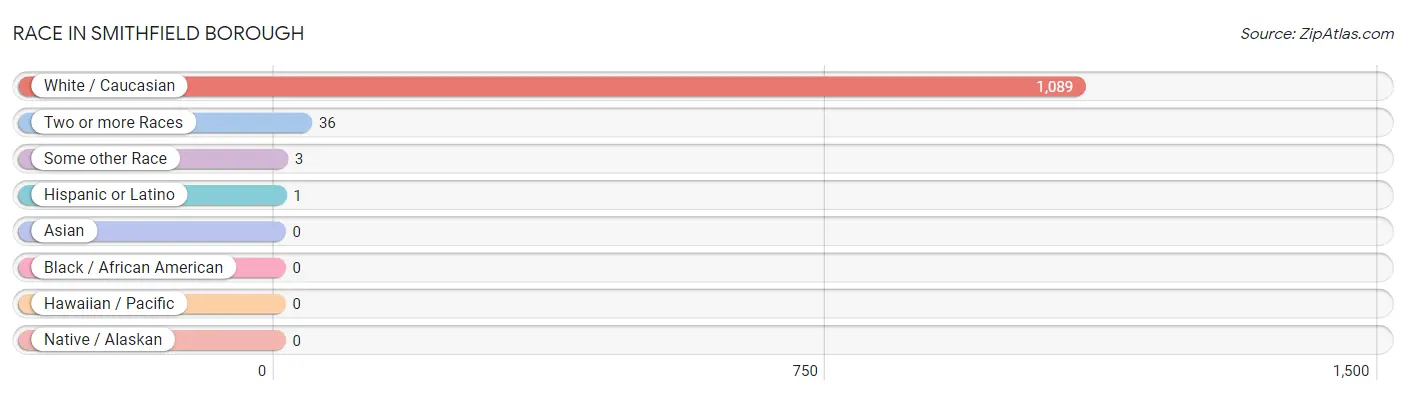
Race in Smithfield borough
The most populous races in Smithfield borough are White / Caucasian (1,089 | 96.5%), Two or more Races (36 | 3.2%), and Some other Race (3 | 0.3%).
| Race | # Population | % Population |
| Asian | 0 | 0.0% |
| Black / African American | 0 | 0.0% |
| Hawaiian / Pacific | 0 | 0.0% |
| Hispanic or Latino | 1 | 0.1% |
| Native / Alaskan | 0 | 0.0% |
| White / Caucasian | 1,089 | 96.5% |
| Two or more Races | 36 | 3.2% |
| Some other Race | 3 | 0.3% |
| Total | 1,128 | 100.0% |
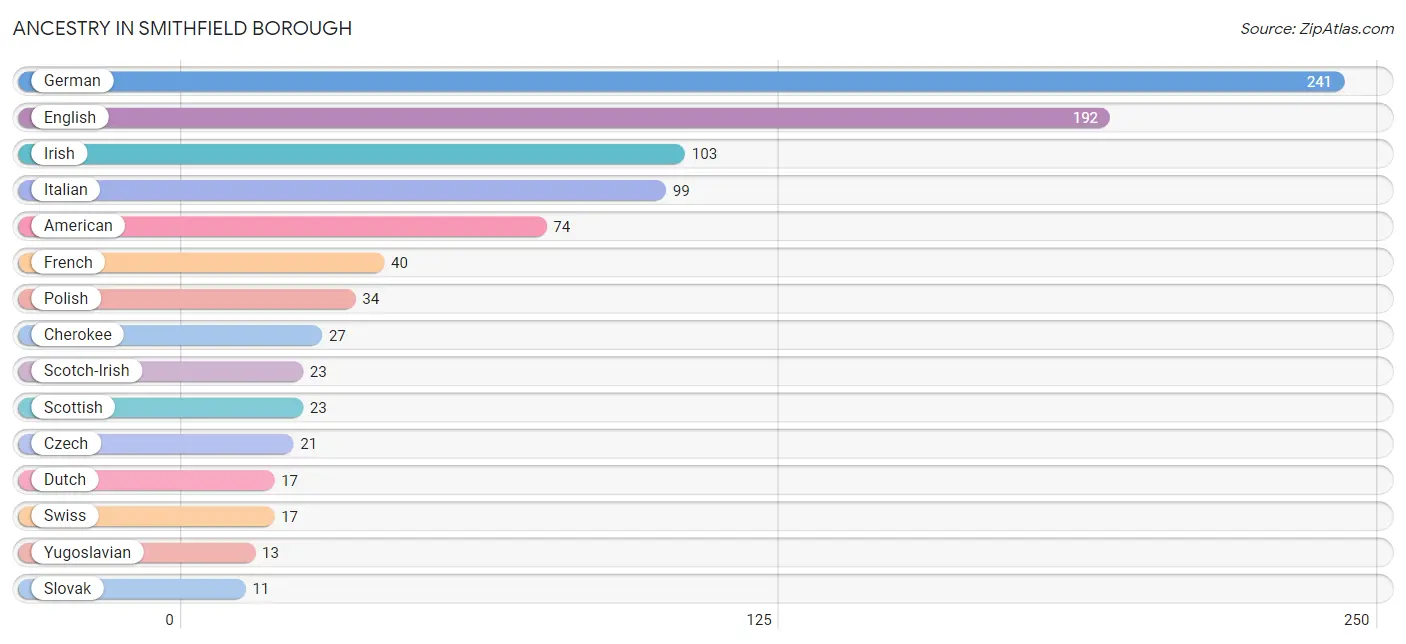
Ancestry in Smithfield borough
The most populous ancestries reported in Smithfield borough are German (241 | 21.4%), English (192 | 17.0%), Irish (103 | 9.1%), Italian (99 | 8.8%), and American (74 | 6.6%), together accounting for 62.9% of all Smithfield borough residents.
| Ancestry | # Population | % Population |
| American | 74 | 6.6% |
| Arab | 10 | 0.9% |
| Austrian | 8 | 0.7% |
| Bulgarian | 4 | 0.4% |
| Cherokee | 27 | 2.4% |
| Croatian | 2 | 0.2% |
| Cuban | 1 | 0.1% |
| Czech | 21 | 1.9% |
| Czechoslovakian | 10 | 0.9% |
| Dutch | 17 | 1.5% |
| English | 192 | 17.0% |
| European | 7 | 0.6% |
| French | 40 | 3.5% |
| German | 241 | 21.4% |
| Hungarian | 2 | 0.2% |
| Irish | 103 | 9.1% |
| Italian | 99 | 8.8% |
| Lebanese | 10 | 0.9% |
| Pennsylvania German | 3 | 0.3% |
| Polish | 34 | 3.0% |
| Russian | 3 | 0.3% |
| Scotch-Irish | 23 | 2.0% |
| Scottish | 23 | 2.0% |
| Slovak | 11 | 1.0% |
| Swiss | 17 | 1.5% |
| Yugoslavian | 13 | 1.1% | View All 26 Rows |
Immigrants in Smithfield borough

| Immigration Origin | # Population | % Population | View All 0 Rows |
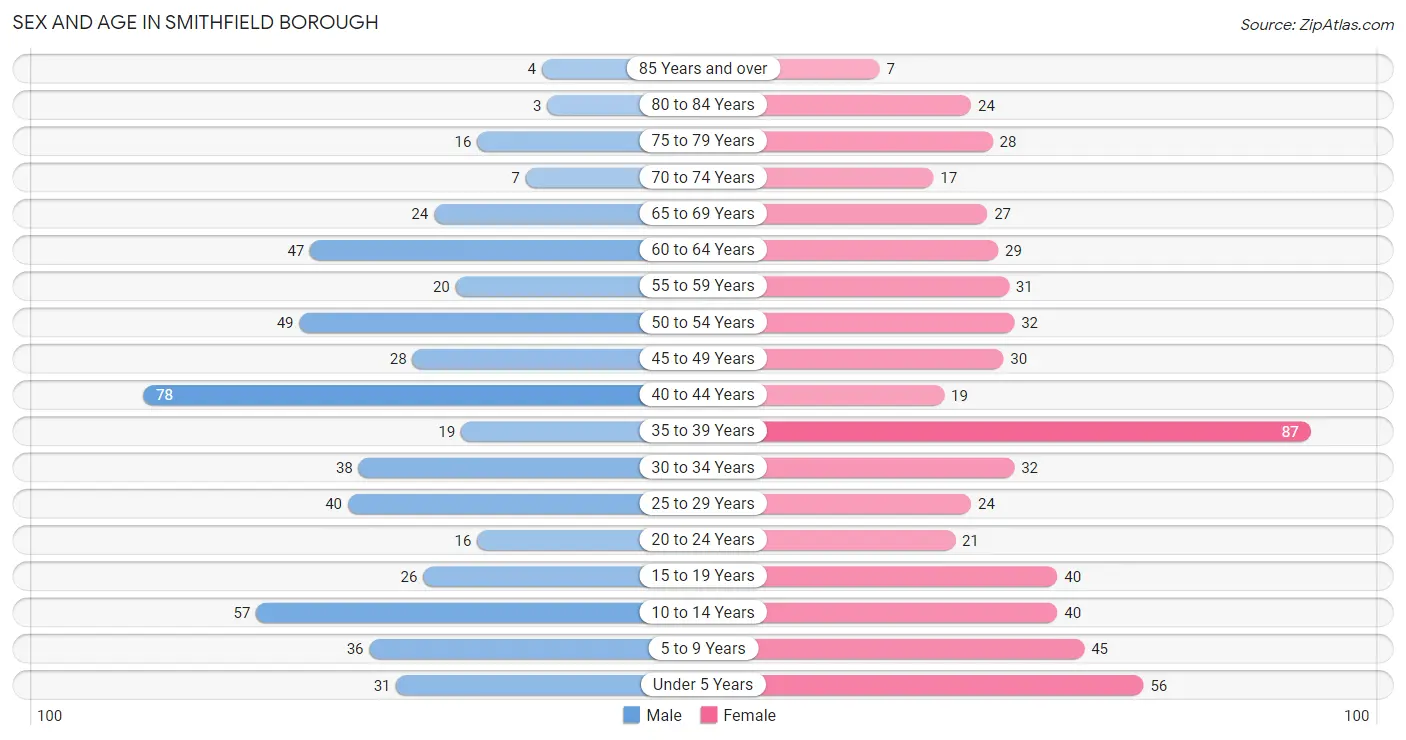
Sex and Age in Smithfield borough
Sex and Age in Smithfield borough
The most populous age groups in Smithfield borough are 40 to 44 Years (78 | 14.5%) for men and 35 to 39 Years (87 | 14.8%) for women.
| Age Bracket | Male | Female |
| Under 5 Years | 31 (5.8%) | 56 (9.5%) |
| 5 to 9 Years | 36 (6.7%) | 45 (7.6%) |
| 10 to 14 Years | 57 (10.6%) | 40 (6.8%) |
| 15 to 19 Years | 26 (4.8%) | 40 (6.8%) |
| 20 to 24 Years | 16 (3.0%) | 21 (3.6%) |
| 25 to 29 Years | 40 (7.4%) | 24 (4.1%) |
| 30 to 34 Years | 38 (7.0%) | 32 (5.4%) |
| 35 to 39 Years | 19 (3.5%) | 87 (14.8%) |
| 40 to 44 Years | 78 (14.5%) | 19 (3.2%) |
| 45 to 49 Years | 28 (5.2%) | 30 (5.1%) |
| 50 to 54 Years | 49 (9.1%) | 32 (5.4%) |
| 55 to 59 Years | 20 (3.7%) | 31 (5.3%) |
| 60 to 64 Years | 47 (8.7%) | 29 (4.9%) |
| 65 to 69 Years | 24 (4.4%) | 27 (4.6%) |
| 70 to 74 Years | 7 (1.3%) | 17 (2.9%) |
| 75 to 79 Years | 16 (3.0%) | 28 (4.8%) |
| 80 to 84 Years | 3 (0.6%) | 24 (4.1%) |
| 85 Years and over | 4 (0.7%) | 7 (1.2%) |
| Total | 539 (100.0%) | 589 (100.0%) |
Families and Households in Smithfield borough
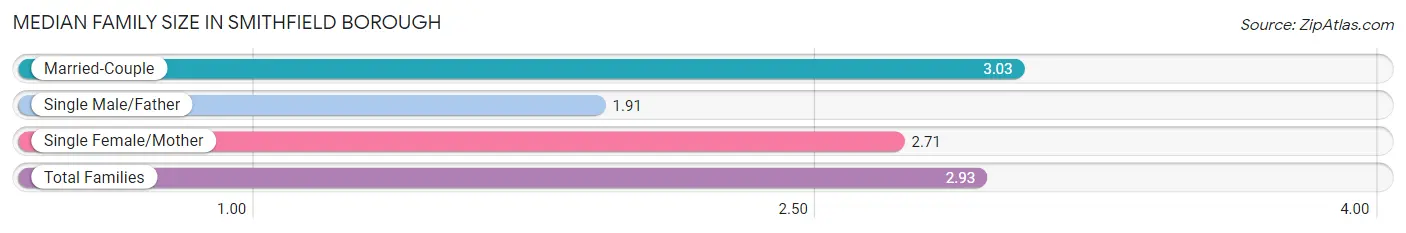
Median Family Size in Smithfield borough
The median family size in Smithfield borough is 2.93 persons per family, with married-couple families (240 | 77.4%) accounting for the largest median family size of 3.03 persons per family. On the other hand, single male/father families (11 | 3.5%) represent the smallest median family size with 1.91 persons per family.
| Family Type | # Families | Family Size |
| Married-Couple | 240 (77.4%) | 3.03 |
| Single Male/Father | 11 (3.5%) | 1.91 |
| Single Female/Mother | 59 (19.0%) | 2.71 |
| Total Families | 310 (100.0%) | 2.93 |
Median Household Size in Smithfield borough
The median household size in Smithfield borough is 2.52 persons per household, with single male/father households (11 | 2.5%) accounting for the largest median household size of 4.73 persons per household. non-family households (138 | 30.8%) represent the smallest median household size with 1.29 persons per household.
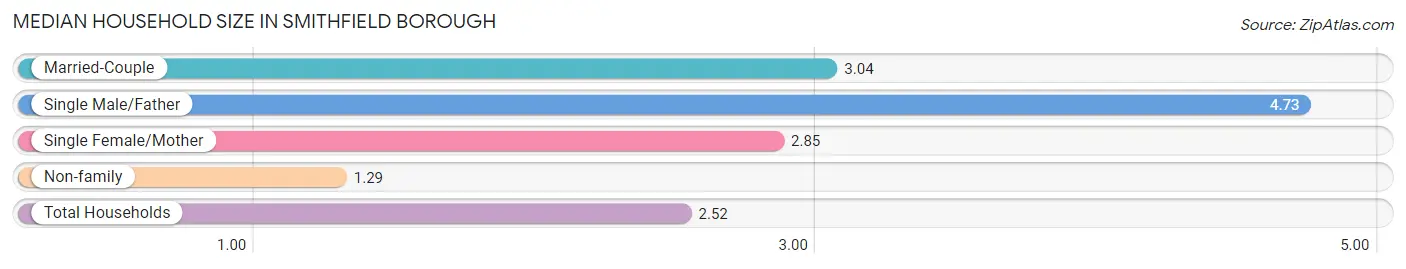
| Household Type | # Households | Household Size |
| Married-Couple | 240 (53.6%) | 3.04 |
| Single Male/Father | 11 (2.5%) | 4.73 |
| Single Female/Mother | 59 (13.2%) | 2.85 |
| Non-family | 138 (30.8%) | 1.29 |
| Total Households | 448 (100.0%) | 2.52 |
Household Size by Marriage Status in Smithfield borough
Out of a total of 448 households in Smithfield borough, 310 (69.2%) are family households, while 138 (30.8%) are nonfamily households. The most numerous type of family households are 2-person households, comprising 118, and the most common type of nonfamily households are 1-person households, comprising 92.
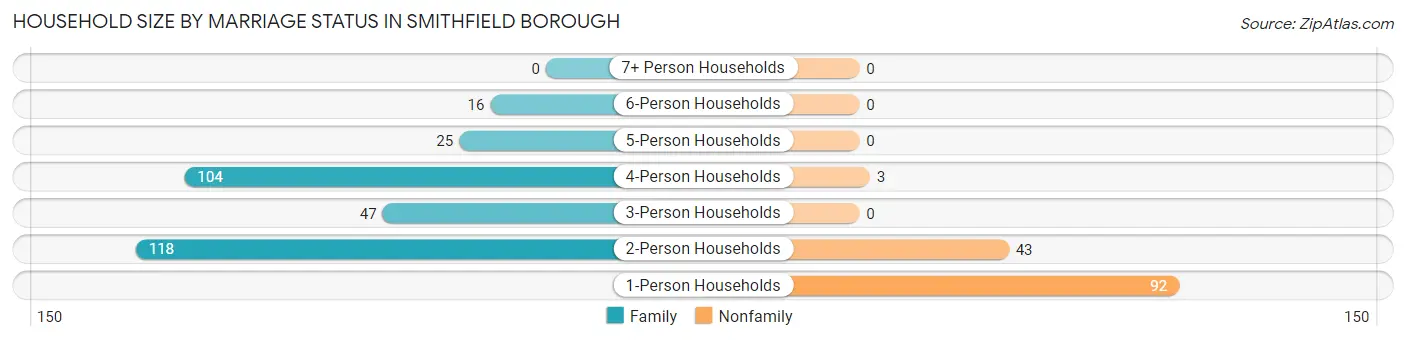
| Household Size | Family Households | Nonfamily Households |
| 1-Person Households | - | 92 (20.5%) |
| 2-Person Households | 118 (26.3%) | 43 (9.6%) |
| 3-Person Households | 47 (10.5%) | 0 (0.0%) |
| 4-Person Households | 104 (23.2%) | 3 (0.7%) |
| 5-Person Households | 25 (5.6%) | 0 (0.0%) |
| 6-Person Households | 16 (3.6%) | 0 (0.0%) |
| 7+ Person Households | 0 (0.0%) | 0 (0.0%) |
| Total | 310 (69.2%) | 138 (30.8%) |
Female Fertility in Smithfield borough
Fertility by Age in Smithfield borough
Average fertility rate in Smithfield borough is 43.0 births per 1,000 women. Women in the age bracket of 20 to 34 years have the highest fertility rate with 143.0 births per 1,000 women. Women in the age bracket of 20 to 34 years acount for 100.0% of all women with births.
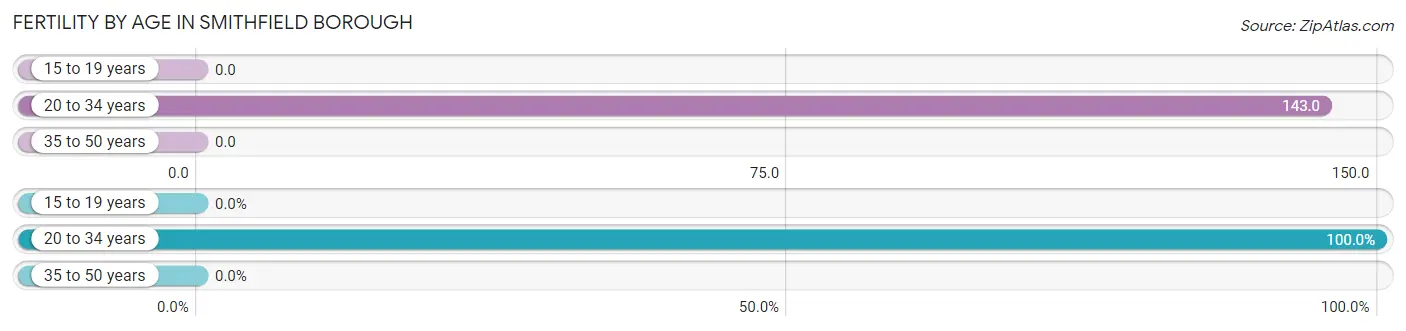
| Age Bracket | Women with Births | Births / 1,000 Women |
| 15 to 19 years | 0 (0.0%) | 0.0 |
| 20 to 34 years | 11 (100.0%) | 143.0 |
| 35 to 50 years | 0 (0.0%) | 0.0 |
| Total | 11 (100.0%) | 43.0 |
Fertility by Age by Marriage Status in Smithfield borough
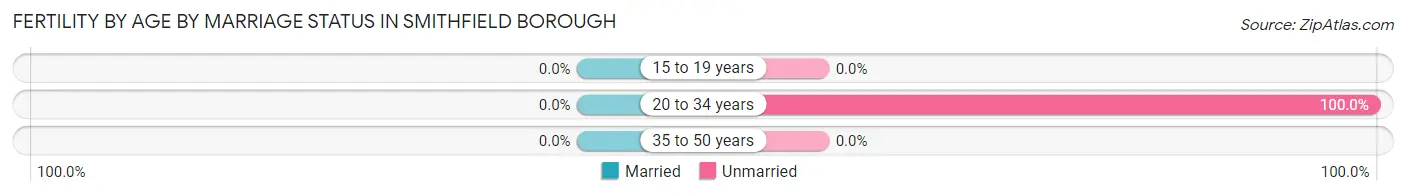
| Age Bracket | Married | Unmarried |
| 15 to 19 years | 0 (0.0%) | 0 (0.0%) |
| 20 to 34 years | 0 (0.0%) | 11 (100.0%) |
| 35 to 50 years | 0 (0.0%) | 0 (0.0%) |
| Total | 0 (0.0%) | 11 (100.0%) |
Fertility by Education in Smithfield borough
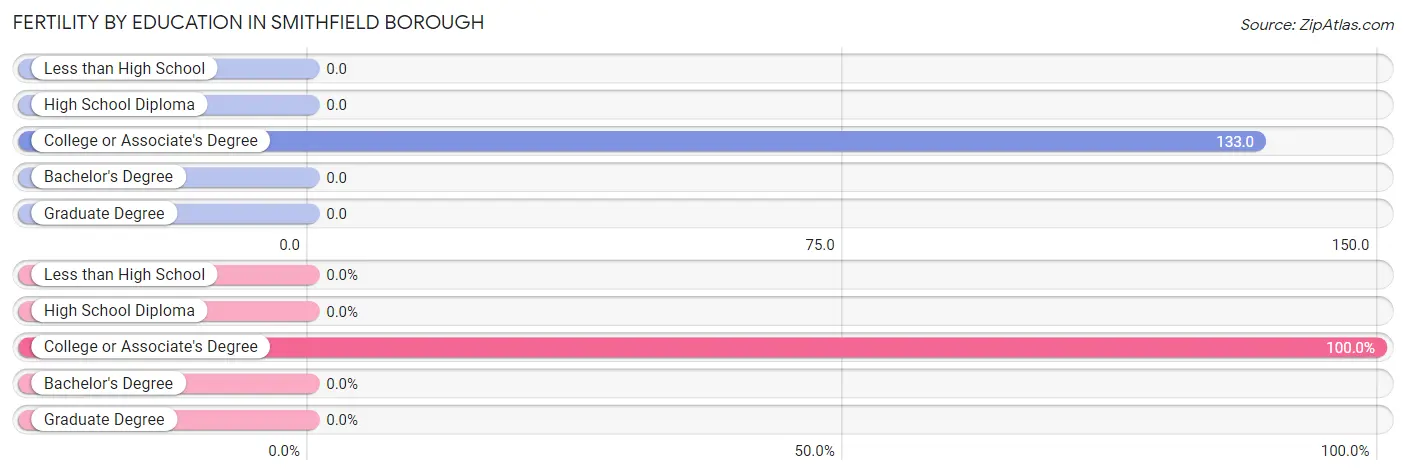
| Educational Attainment | Women with Births | Births / 1,000 Women |
| Less than High School | 0 (0.0%) | 0.0 |
| High School Diploma | 0 (0.0%) | 0.0 |
| College or Associate's Degree | 11 (100.0%) | 133.0 |
| Bachelor's Degree | 0 (0.0%) | 0.0 |
| Graduate Degree | 0 (0.0%) | 0.0 |
| Total | 11 (100.0%) | 43.0 |
Fertility by Education by Marriage Status in Smithfield borough
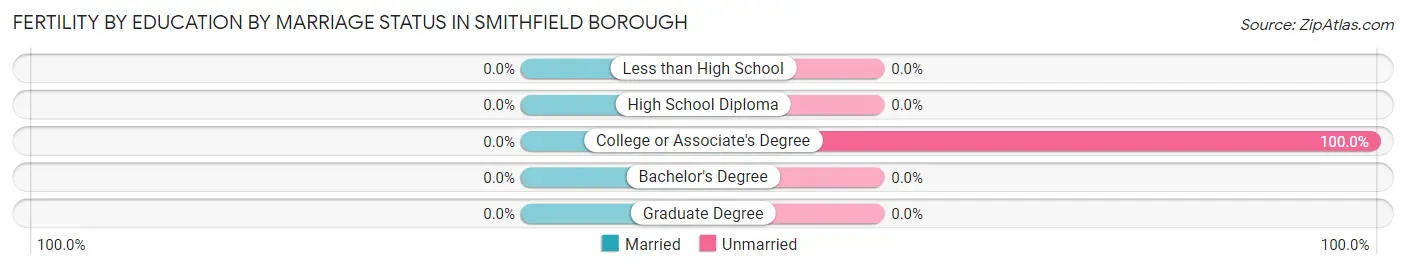
| Educational Attainment | Married | Unmarried |
| Less than High School | 0 (0.0%) | 0 (0.0%) |
| High School Diploma | 0 (0.0%) | 0 (0.0%) |
| College or Associate's Degree | 0 (0.0%) | 11 (100.0%) |
| Bachelor's Degree | 0 (0.0%) | 0 (0.0%) |
| Graduate Degree | 0 (0.0%) | 0 (0.0%) |
| Total | 0 (0.0%) | 11 (100.0%) |
Income in Smithfield borough
Income Overview in Smithfield borough
Per Capita Income in Smithfield borough is $32,451, while median incomes of families and households are $100,833 and $74,333 respectively.
| Characteristic | Number | Measure |
| Per Capita Income | 1,128 | $32,451 |
| Median Family Income | 310 | $100,833 |
| Mean Family Income | 310 | $98,671 |
| Median Household Income | 448 | $74,333 |
| Mean Household Income | 448 | $85,542 |
| Income Deficit | 310 | $17,333 |
| Wage / Income Gap (%) | 1,128 | 27.91% |
| Wage / Income Gap ($) | 1,128 | 72.09¢ per $1 |
| Gini / Inequality Index | 1,128 | 0.37 |
Earnings by Sex in Smithfield borough
Average Earnings in Smithfield borough are $43,281, $46,818 for men and $33,750 for women, a difference of 27.9%.
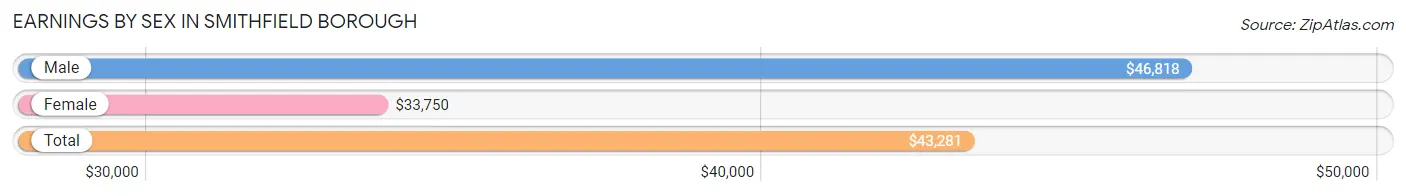
| Sex | Number | Average Earnings |
| Male | 336 (55.0%) | $46,818 |
| Female | 275 (45.0%) | $33,750 |
| Total | 611 (100.0%) | $43,281 |
Earnings by Sex by Income Bracket in Smithfield borough
The most common earnings brackets in Smithfield borough are $100,000+ for men (68 | 20.2%) and $55,000 to $64,999 for women (45 | 16.4%).
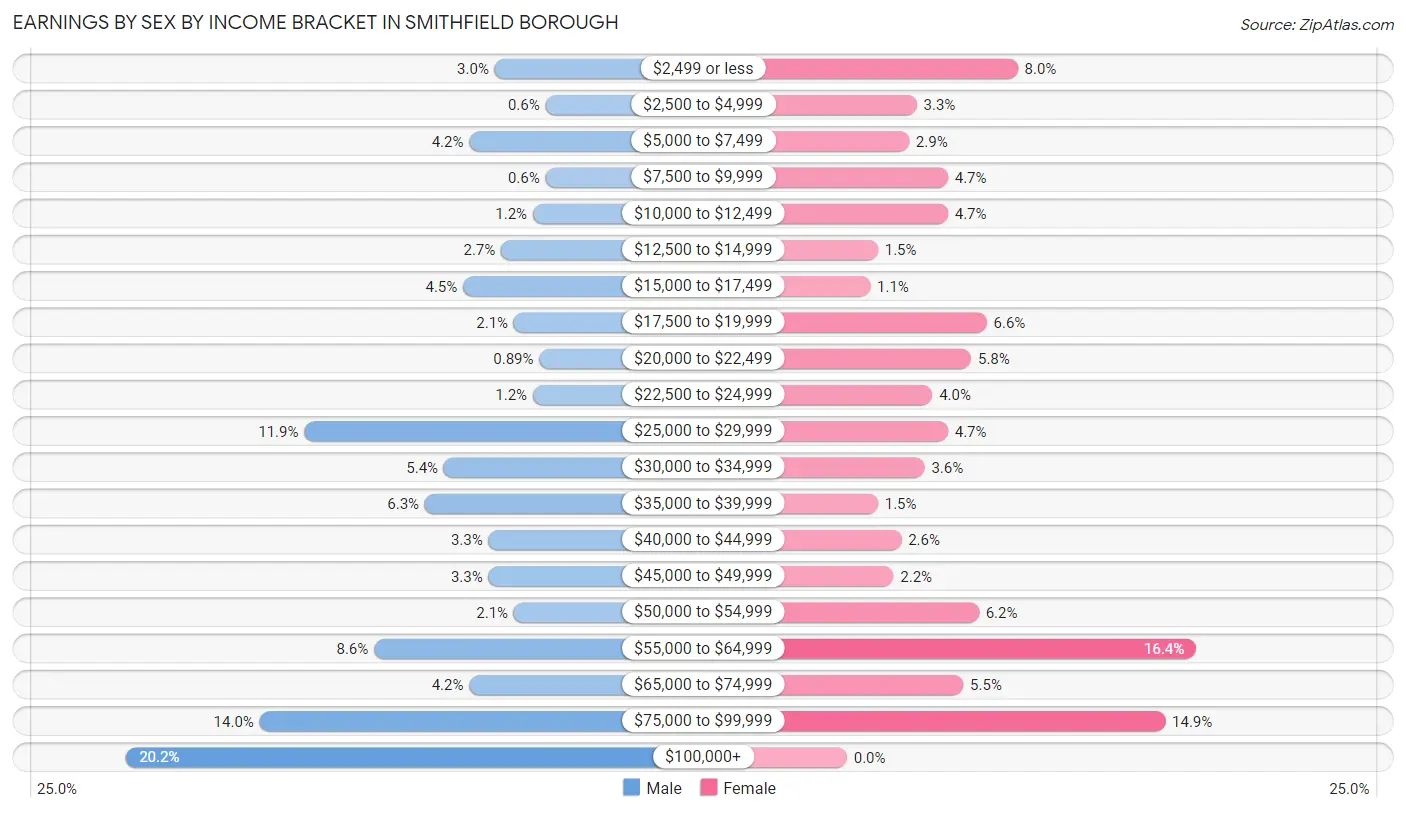
| Income | Male | Female |
| $2,499 or less | 10 (3.0%) | 22 (8.0%) |
| $2,500 to $4,999 | 2 (0.6%) | 9 (3.3%) |
| $5,000 to $7,499 | 14 (4.2%) | 8 (2.9%) |
| $7,500 to $9,999 | 2 (0.6%) | 13 (4.7%) |
| $10,000 to $12,499 | 4 (1.2%) | 13 (4.7%) |
| $12,500 to $14,999 | 9 (2.7%) | 4 (1.5%) |
| $15,000 to $17,499 | 15 (4.5%) | 3 (1.1%) |
| $17,500 to $19,999 | 7 (2.1%) | 18 (6.6%) |
| $20,000 to $22,499 | 3 (0.9%) | 16 (5.8%) |
| $22,500 to $24,999 | 4 (1.2%) | 11 (4.0%) |
| $25,000 to $29,999 | 40 (11.9%) | 13 (4.7%) |
| $30,000 to $34,999 | 18 (5.4%) | 10 (3.6%) |
| $35,000 to $39,999 | 21 (6.2%) | 4 (1.5%) |
| $40,000 to $44,999 | 11 (3.3%) | 7 (2.5%) |
| $45,000 to $49,999 | 11 (3.3%) | 6 (2.2%) |
| $50,000 to $54,999 | 7 (2.1%) | 17 (6.2%) |
| $55,000 to $64,999 | 29 (8.6%) | 45 (16.4%) |
| $65,000 to $74,999 | 14 (4.2%) | 15 (5.4%) |
| $75,000 to $99,999 | 47 (14.0%) | 41 (14.9%) |
| $100,000+ | 68 (20.2%) | 0 (0.0%) |
| Total | 336 (100.0%) | 275 (100.0%) |
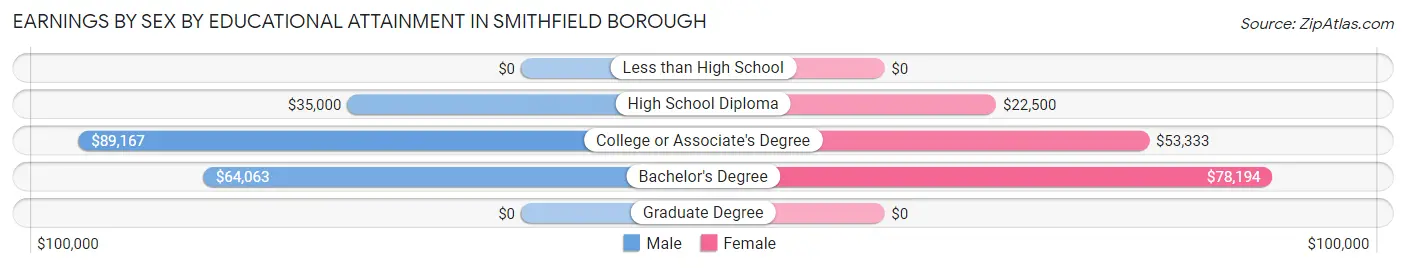
Earnings by Sex by Educational Attainment in Smithfield borough
Average earnings in Smithfield borough are $55,139 for men and $46,458 for women, a difference of 15.7%. Men with an educational attainment of college or associate's degree enjoy the highest average annual earnings of $89,167, while those with high school diploma education earn the least with $35,000. Women with an educational attainment of bachelor's degree earn the most with the average annual earnings of $78,194, while those with high school diploma education have the smallest earnings of $22,500.
| Educational Attainment | Male Income | Female Income |
| Less than High School | - | - |
| High School Diploma | $35,000 | $22,500 |
| College or Associate's Degree | $89,167 | $53,333 |
| Bachelor's Degree | $64,063 | $78,194 |
| Graduate Degree | - | - |
| Total | $55,139 | $46,458 |
Family Income in Smithfield borough
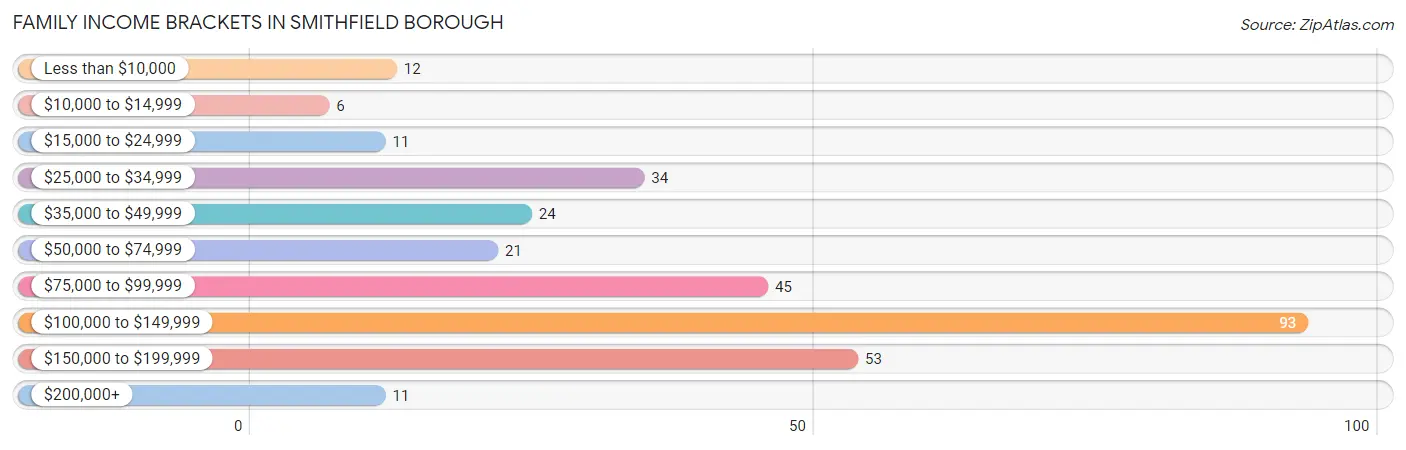
Family Income Brackets in Smithfield borough
According to the Smithfield borough family income data, there are 93 families falling into the $100,000 to $149,999 income range, which is the most common income bracket and makes up 30.0% of all families. Conversely, the $10,000 to $14,999 income bracket is the least frequent group with only 6 families (1.9%) belonging to this category.
| Income Bracket | # Families | % Families |
| Less than $10,000 | 12 | 3.9% |
| $10,000 to $14,999 | 6 | 1.9% |
| $15,000 to $24,999 | 11 | 3.5% |
| $25,000 to $34,999 | 34 | 11.0% |
| $35,000 to $49,999 | 24 | 7.7% |
| $50,000 to $74,999 | 21 | 6.8% |
| $75,000 to $99,999 | 45 | 14.5% |
| $100,000 to $149,999 | 93 | 30.0% |
| $150,000 to $199,999 | 53 | 17.1% |
| $200,000+ | 11 | 3.5% |
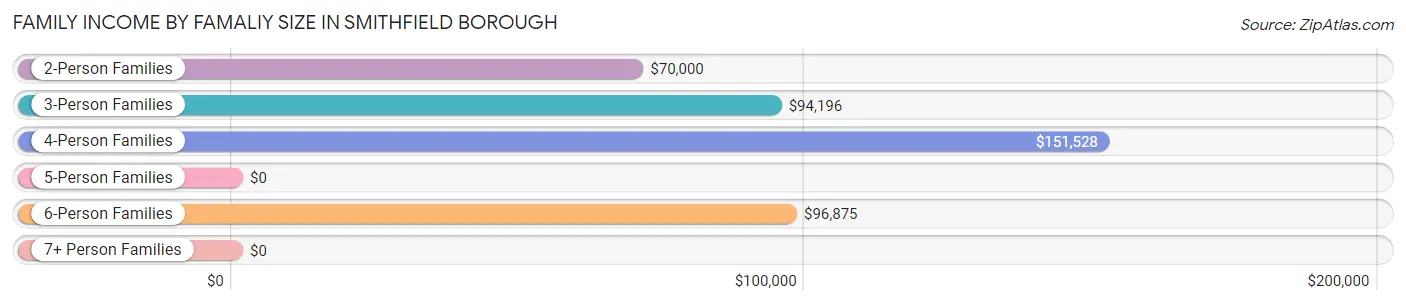
Family Income by Famaliy Size in Smithfield borough
4-person families (103 | 33.2%) account for the highest median family income in Smithfield borough with $151,528 per family, while 4-person families (103 | 33.2%) have the highest median income of $37,882 per family member.
| Income Bracket | # Families | Median Income |
| 2-Person Families | 130 (41.9%) | $70,000 |
| 3-Person Families | 47 (15.2%) | $94,196 |
| 4-Person Families | 103 (33.2%) | $151,528 |
| 5-Person Families | 23 (7.4%) | $0 |
| 6-Person Families | 7 (2.3%) | $96,875 |
| 7+ Person Families | 0 (0.0%) | $0 |
| Total | 310 (100.0%) | $100,833 |
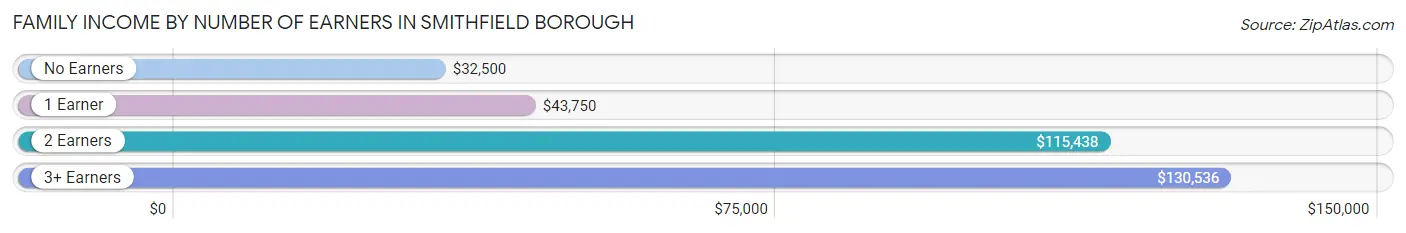
Family Income by Number of Earners in Smithfield borough
The median family income in Smithfield borough is $100,833, with families comprising 3+ earners (31) having the highest median family income of $130,536, while families with no earners (34) have the lowest median family income of $32,500, accounting for 10.0% and 11.0% of families, respectively.
| Number of Earners | # Families | Median Income |
| No Earners | 34 (11.0%) | $32,500 |
| 1 Earner | 84 (27.1%) | $43,750 |
| 2 Earners | 161 (51.9%) | $115,438 |
| 3+ Earners | 31 (10.0%) | $130,536 |
| Total | 310 (100.0%) | $100,833 |
Household Income in Smithfield borough
Household Income Brackets in Smithfield borough
With 101 households falling in the category, the $100,000 to $149,999 income range is the most frequent in Smithfield borough, accounting for 22.5% of all households. In contrast, only 9 households (2.0%) fall into the less than $10,000 income bracket, making it the least populous group.
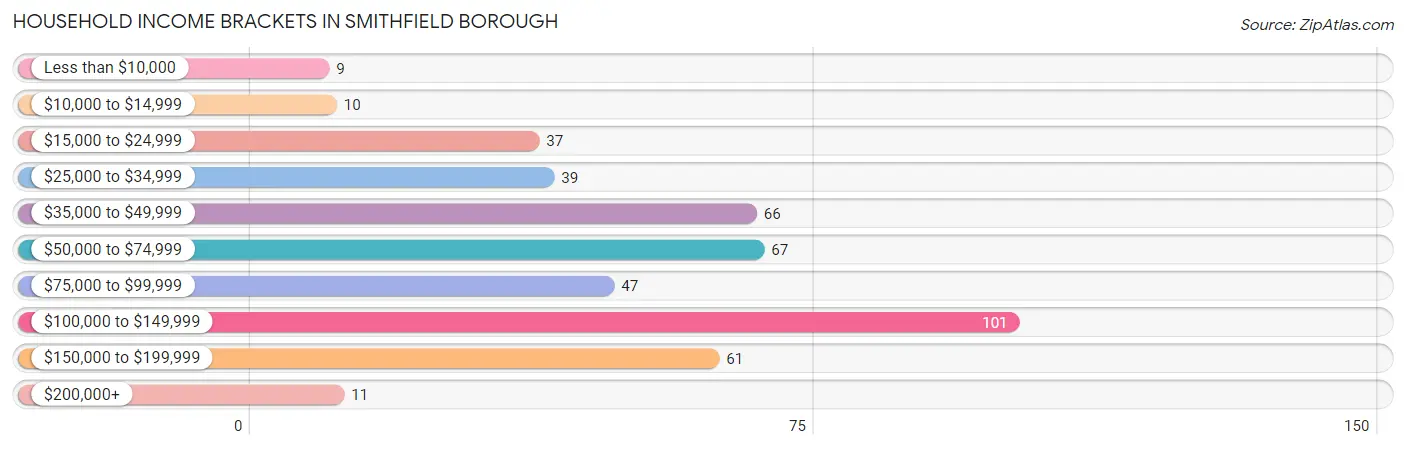
| Income Bracket | # Households | % Households |
| Less than $10,000 | 9 | 2.0% |
| $10,000 to $14,999 | 10 | 2.2% |
| $15,000 to $24,999 | 37 | 8.3% |
| $25,000 to $34,999 | 39 | 8.7% |
| $35,000 to $49,999 | 66 | 14.7% |
| $50,000 to $74,999 | 67 | 15.0% |
| $75,000 to $99,999 | 47 | 10.5% |
| $100,000 to $149,999 | 101 | 22.5% |
| $150,000 to $199,999 | 61 | 13.6% |
| $200,000+ | 11 | 2.5% |
Household Income by Householder Age in Smithfield borough
The median household income in Smithfield borough is $74,333, with the highest median household income of $100,000 found in the 25 to 44 years age bracket for the primary householder. A total of 184 households (41.1%) fall into this category. Meanwhile, the 15 to 24 years age bracket for the primary householder has the lowest median household income of $45,833, with 10 households (2.2%) in this group.
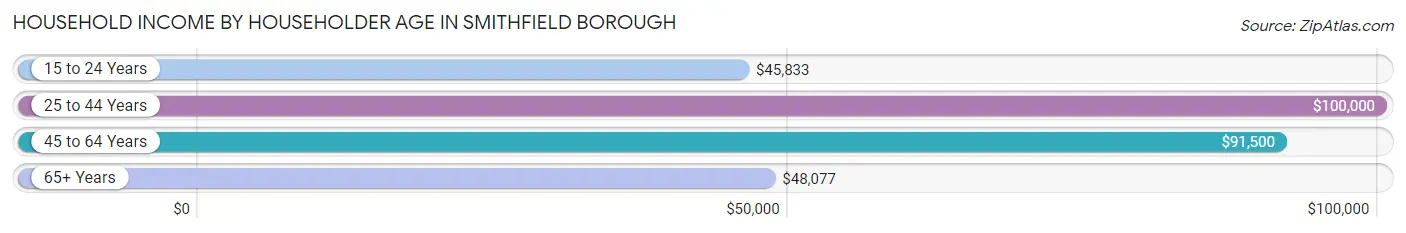
| Income Bracket | # Households | Median Income |
| 15 to 24 Years | 10 (2.2%) | $45,833 |
| 25 to 44 Years | 184 (41.1%) | $100,000 |
| 45 to 64 Years | 144 (32.1%) | $91,500 |
| 65+ Years | 110 (24.5%) | $48,077 |
| Total | 448 (100.0%) | $74,333 |
Poverty in Smithfield borough
Income Below Poverty by Sex and Age in Smithfield borough
With 9.8% poverty level for males and 10.7% for females among the residents of Smithfield borough, under 5 year old males and under 5 year old females are the most vulnerable to poverty, with 13 males (41.9%) and 16 females (35.6%) in their respective age groups living below the poverty level.
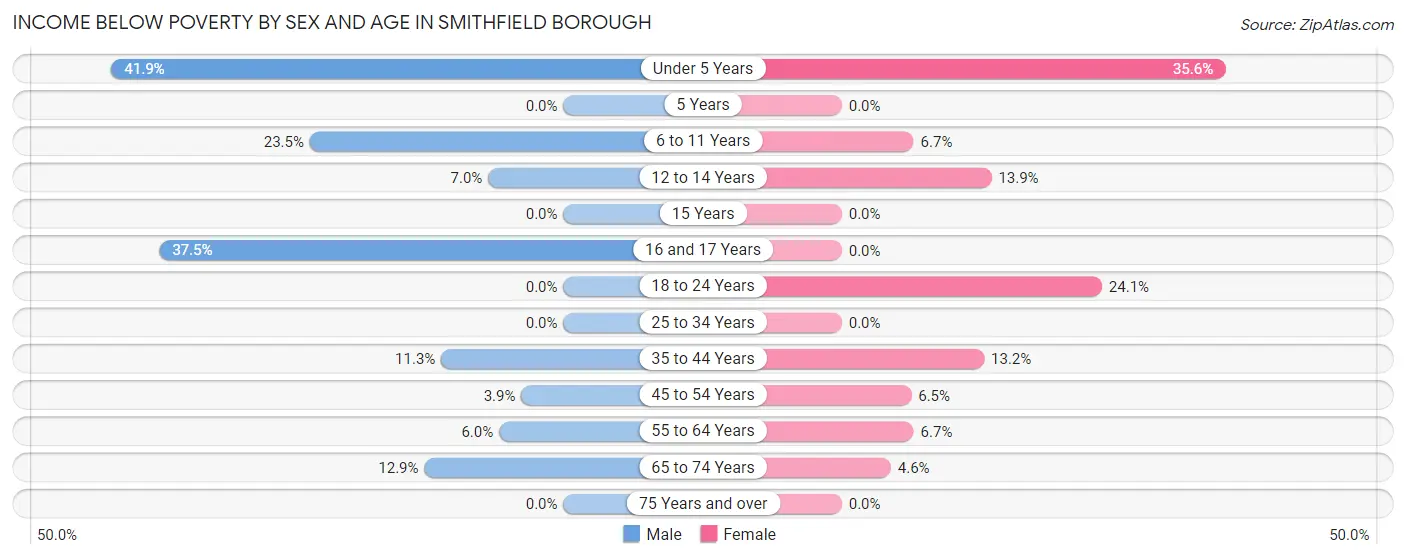
| Age Bracket | Male | Female |
| Under 5 Years | 13 (41.9%) | 16 (35.6%) |
| 5 Years | 0 (0.0%) | 0 (0.0%) |
| 6 to 11 Years | 8 (23.5%) | 3 (6.7%) |
| 12 to 14 Years | 3 (7.0%) | 5 (13.9%) |
| 15 Years | 0 (0.0%) | 0 (0.0%) |
| 16 and 17 Years | 6 (37.5%) | 0 (0.0%) |
| 18 to 24 Years | 0 (0.0%) | 14 (24.1%) |
| 25 to 34 Years | 0 (0.0%) | 0 (0.0%) |
| 35 to 44 Years | 11 (11.3%) | 14 (13.2%) |
| 45 to 54 Years | 3 (3.9%) | 4 (6.5%) |
| 55 to 64 Years | 4 (6.0%) | 4 (6.7%) |
| 65 to 74 Years | 4 (12.9%) | 2 (4.5%) |
| 75 Years and over | 0 (0.0%) | 0 (0.0%) |
| Total | 52 (9.8%) | 62 (10.7%) |
Income Above Poverty by Sex and Age in Smithfield borough
According to the poverty statistics in Smithfield borough, males aged 5 years and females aged 5 years are the age groups that are most secure financially, with 100.0% of males and 100.0% of females in these age groups living above the poverty line.
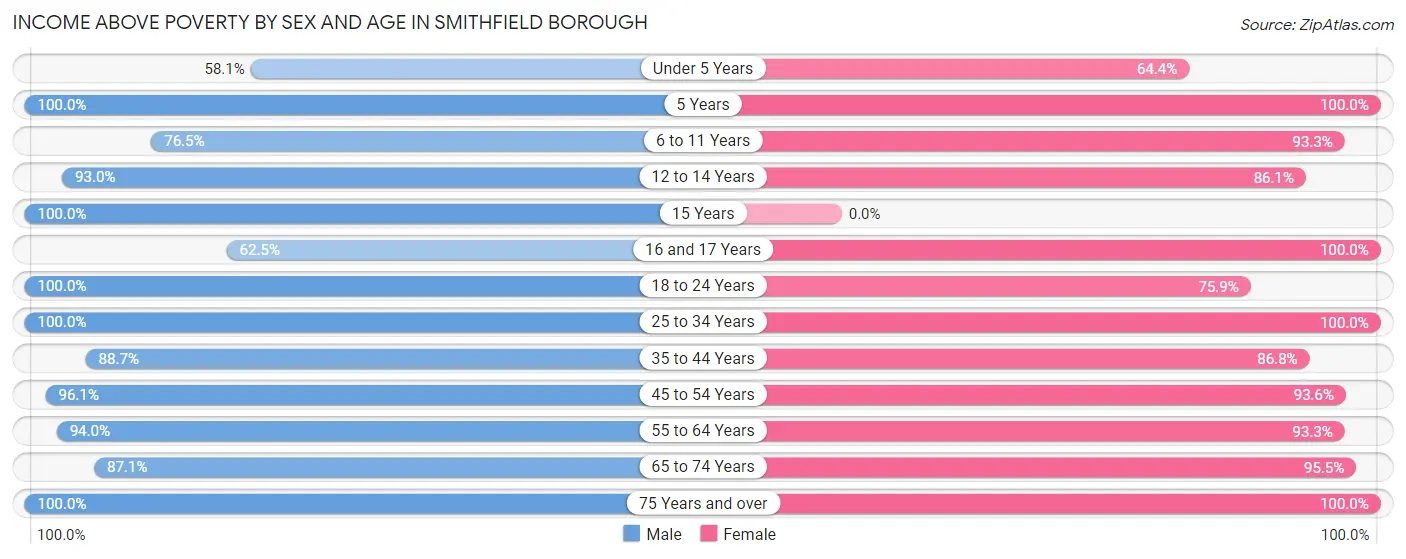
| Age Bracket | Male | Female |
| Under 5 Years | 18 (58.1%) | 29 (64.4%) |
| 5 Years | 8 (100.0%) | 4 (100.0%) |
| 6 to 11 Years | 26 (76.5%) | 42 (93.3%) |
| 12 to 14 Years | 40 (93.0%) | 31 (86.1%) |
| 15 Years | 7 (100.0%) | 0 (0.0%) |
| 16 and 17 Years | 10 (62.5%) | 3 (100.0%) |
| 18 to 24 Years | 19 (100.0%) | 44 (75.9%) |
| 25 to 34 Years | 78 (100.0%) | 56 (100.0%) |
| 35 to 44 Years | 86 (88.7%) | 92 (86.8%) |
| 45 to 54 Years | 74 (96.1%) | 58 (93.5%) |
| 55 to 64 Years | 63 (94.0%) | 56 (93.3%) |
| 65 to 74 Years | 27 (87.1%) | 42 (95.5%) |
| 75 Years and over | 23 (100.0%) | 59 (100.0%) |
| Total | 479 (90.2%) | 516 (89.3%) |
Income Below Poverty Among Married-Couple Families in Smithfield borough
The poverty statistics for married-couple families in Smithfield borough show that 5.8% or 14 of the total 240 families live below the poverty line. Families with 3 or 4 children have the highest poverty rate of 55.6%, comprising of 10 families. On the other hand, families with 1 or 2 children have the lowest poverty rate of 0.0%, which includes 0 families.
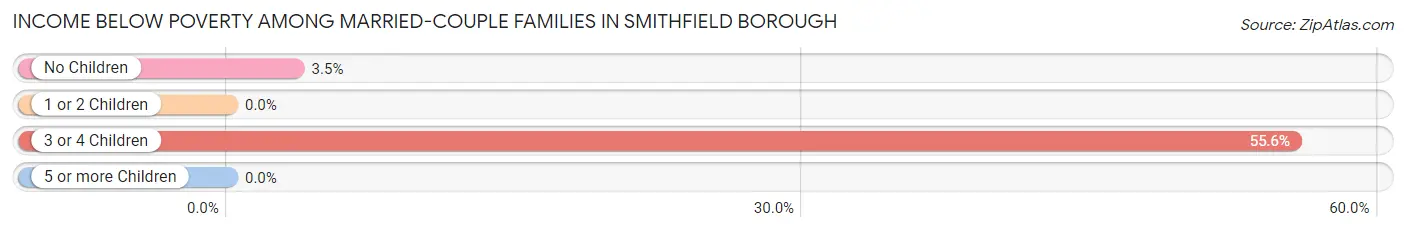
| Children | Above Poverty | Below Poverty |
| No Children | 111 (96.5%) | 4 (3.5%) |
| 1 or 2 Children | 107 (100.0%) | 0 (0.0%) |
| 3 or 4 Children | 8 (44.4%) | 10 (55.6%) |
| 5 or more Children | 0 (0.0%) | 0 (0.0%) |
| Total | 226 (94.2%) | 14 (5.8%) |
Income Below Poverty Among Single-Parent Households in Smithfield borough
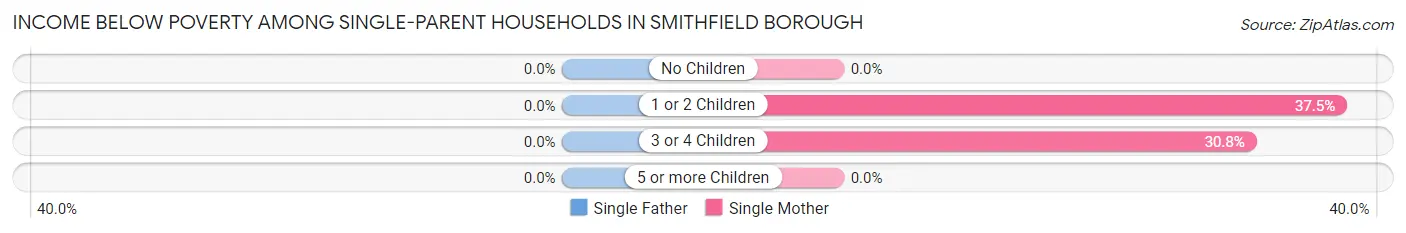
| Children | Single Father | Single Mother |
| No Children | 0 (0.0%) | 0 (0.0%) |
| 1 or 2 Children | 0 (0.0%) | 6 (37.5%) |
| 3 or 4 Children | 0 (0.0%) | 4 (30.8%) |
| 5 or more Children | 0 (0.0%) | 0 (0.0%) |
| Total | 0 (0.0%) | 10 (17.0%) |
Income Below Poverty Among Married-Couple vs Single-Parent Households in Smithfield borough
The poverty data for Smithfield borough shows that 14 of the married-couple family households (5.8%) and 10 of the single-parent households (14.3%) are living below the poverty level. Within the married-couple family households, those with 3 or 4 children have the highest poverty rate, with 10 households (55.6%) falling below the poverty line. Among the single-parent households, those with 3 or 4 children have the highest poverty rate, with 4 household (30.8%) living below poverty.
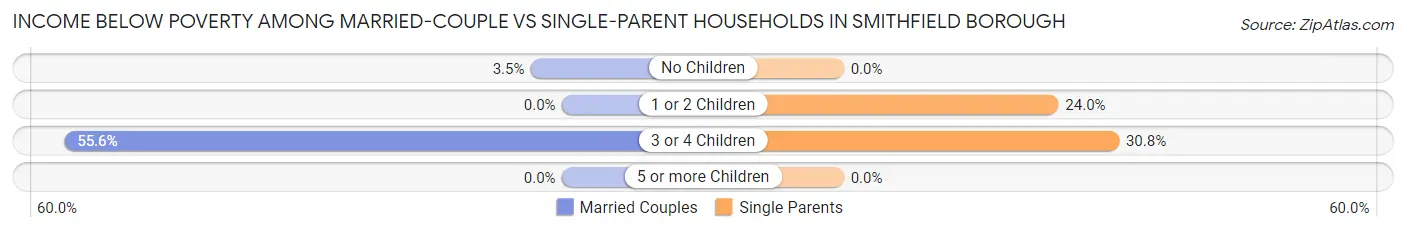
| Children | Married-Couple Families | Single-Parent Households |
| No Children | 4 (3.5%) | 0 (0.0%) |
| 1 or 2 Children | 0 (0.0%) | 6 (24.0%) |
| 3 or 4 Children | 10 (55.6%) | 4 (30.8%) |
| 5 or more Children | 0 (0.0%) | 0 (0.0%) |
| Total | 14 (5.8%) | 10 (14.3%) |
Employment Characteristics in Smithfield borough
Employment by Class of Employer in Smithfield borough
Among the 522 employed individuals in Smithfield borough, private company employees (335 | 64.2%), not-for-profit organizations (59 | 11.3%), and self-employed (incorporated) (55 | 10.5%) make up the most common classes of employment.
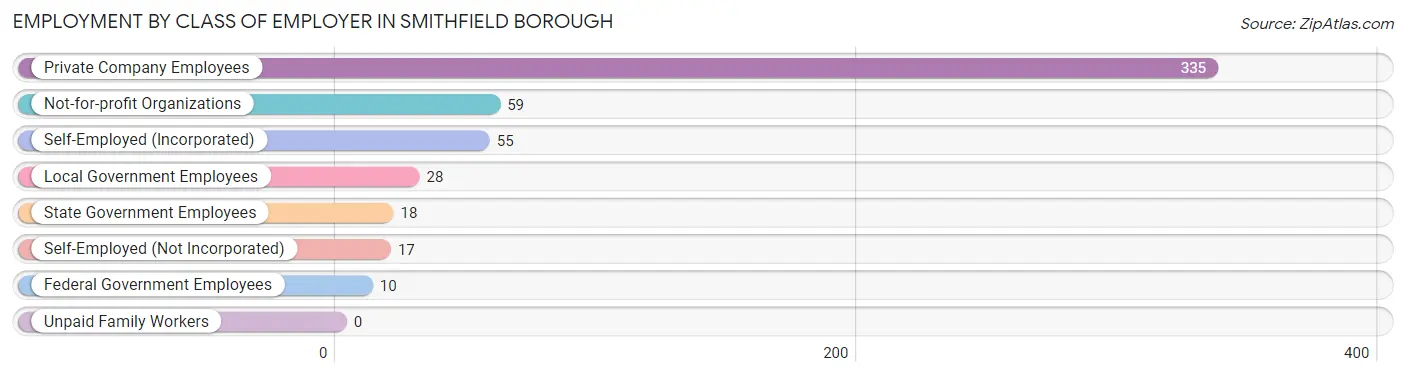
| Employer Class | # Employees | % Employees |
| Private Company Employees | 335 | 64.2% |
| Self-Employed (Incorporated) | 55 | 10.5% |
| Self-Employed (Not Incorporated) | 17 | 3.3% |
| Not-for-profit Organizations | 59 | 11.3% |
| Local Government Employees | 28 | 5.4% |
| State Government Employees | 18 | 3.5% |
| Federal Government Employees | 10 | 1.9% |
| Unpaid Family Workers | 0 | 0.0% |
| Total | 522 | 100.0% |
Employment Status by Age in Smithfield borough
According to the labor force statistics for Smithfield borough, out of the total population over 16 years of age (856), 68.2% or 584 individuals are in the labor force, with 8.7% or 51 of them unemployed. The age group with the highest labor force participation rate is 20 to 24 years, with 100.0% or 37 individuals in the labor force. Within the labor force, the 20 to 24 years age range has the highest percentage of unemployed individuals, with 27.0% or 10 of them being unemployed.
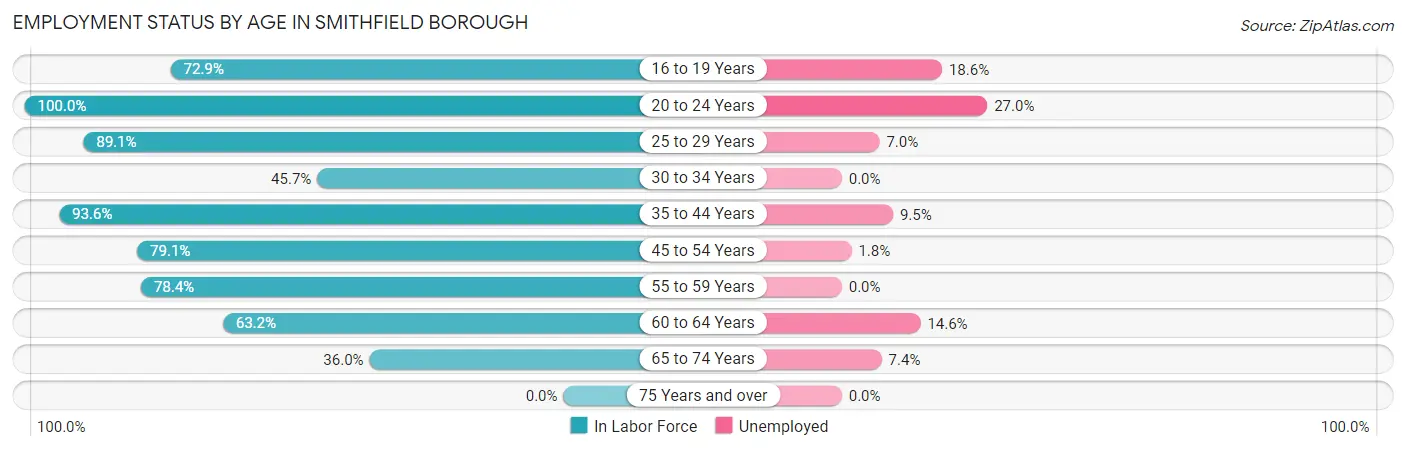
| Age Bracket | In Labor Force | Unemployed |
| 16 to 19 Years | 43 (72.9%) | 8 (18.6%) |
| 20 to 24 Years | 37 (100.0%) | 10 (27.0%) |
| 25 to 29 Years | 57 (89.1%) | 4 (7.0%) |
| 30 to 34 Years | 32 (45.7%) | 0 (0.0%) |
| 35 to 44 Years | 190 (93.6%) | 18 (9.5%) |
| 45 to 54 Years | 110 (79.1%) | 2 (1.8%) |
| 55 to 59 Years | 40 (78.4%) | 0 (0.0%) |
| 60 to 64 Years | 48 (63.2%) | 7 (14.6%) |
| 65 to 74 Years | 27 (36.0%) | 2 (7.4%) |
| 75 Years and over | 0 (0.0%) | 0 (0.0%) |
| Total | 584 (68.2%) | 51 (8.7%) |
Employment Status by Educational Attainment in Smithfield borough
According to labor force statistics for Smithfield borough, 79.1% of individuals (477) out of the total population between 25 and 64 years of age (603) are in the labor force, with 6.5% or 31 of them being unemployed. The group with the highest labor force participation rate are those with the educational attainment of college / associate degree, with 86.1% or 173 individuals in the labor force. Within the labor force, individuals with high school diploma education have the highest percentage of unemployment, with 7.9% or 13 of them being unemployed.
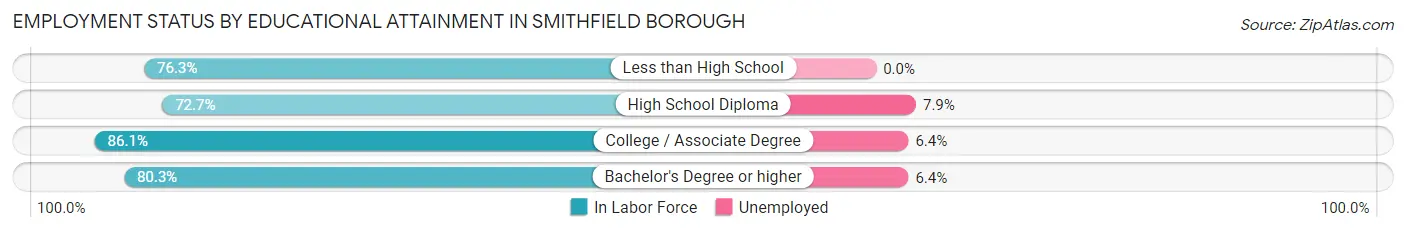
| Educational Attainment | In Labor Force | Unemployed |
| Less than High School | 29 (76.3%) | 0 (0.0%) |
| High School Diploma | 165 (72.7%) | 18 (7.9%) |
| College / Associate Degree | 173 (86.1%) | 13 (6.4%) |
| Bachelor's Degree or higher | 110 (80.3%) | 9 (6.4%) |
| Total | 477 (79.1%) | 39 (6.5%) |
Employment Occupations by Sex in Smithfield borough
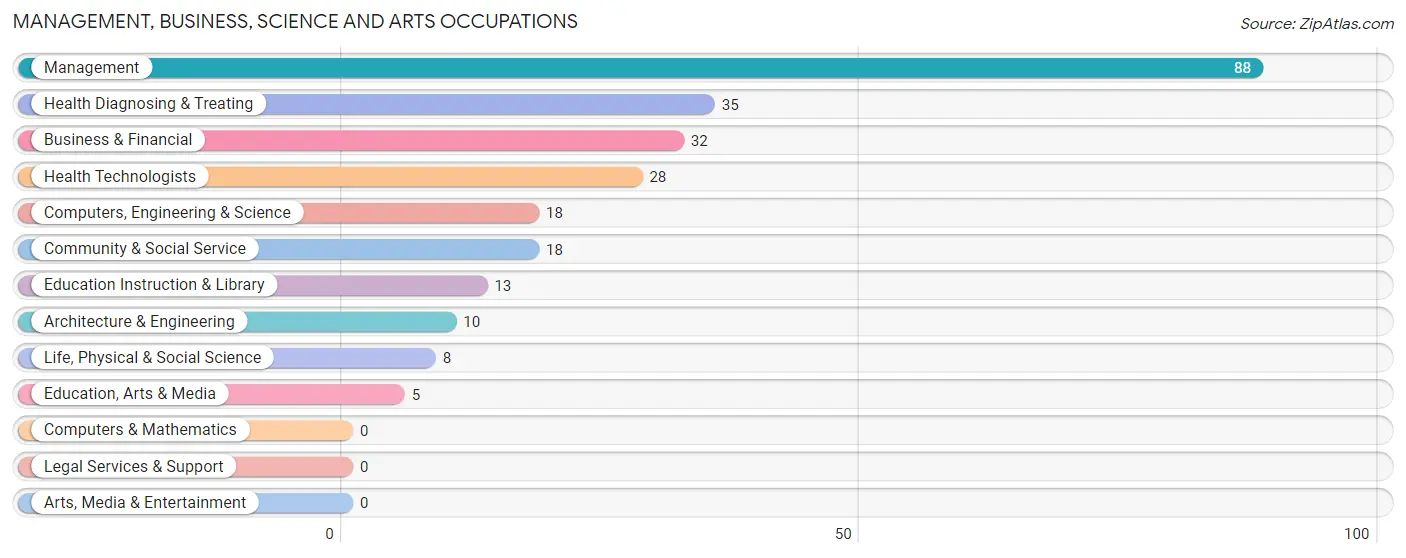
Management, Business, Science and Arts Occupations
The most common Management, Business, Science and Arts occupations in Smithfield borough are Management (88 | 16.5%), Health Diagnosing & Treating (35 | 6.6%), Business & Financial (32 | 6.0%), Health Technologists (28 | 5.2%), and Computers, Engineering & Science (18 | 3.4%).
Management, Business, Science and Arts Occupations by Sex
Within the Management, Business, Science and Arts occupations in Smithfield borough, the most male-oriented occupations are Management (77.3%), Life, Physical & Social Science (75.0%), and Computers, Engineering & Science (72.2%), while the most female-oriented occupations are Education, Arts & Media (100.0%), Health Diagnosing & Treating (94.3%), and Health Technologists (92.9%).
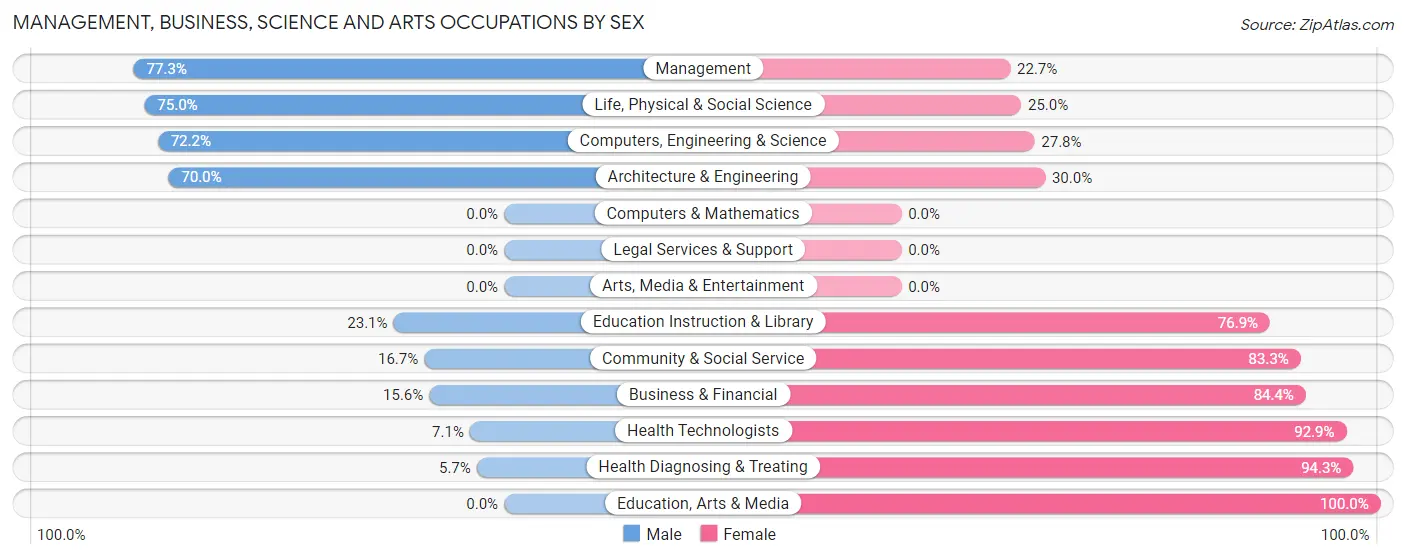
| Occupation | Male | Female |
| Management | 68 (77.3%) | 20 (22.7%) |
| Business & Financial | 5 (15.6%) | 27 (84.4%) |
| Computers, Engineering & Science | 13 (72.2%) | 5 (27.8%) |
| Computers & Mathematics | 0 (0.0%) | 0 (0.0%) |
| Architecture & Engineering | 7 (70.0%) | 3 (30.0%) |
| Life, Physical & Social Science | 6 (75.0%) | 2 (25.0%) |
| Community & Social Service | 3 (16.7%) | 15 (83.3%) |
| Education, Arts & Media | 0 (0.0%) | 5 (100.0%) |
| Legal Services & Support | 0 (0.0%) | 0 (0.0%) |
| Education Instruction & Library | 3 (23.1%) | 10 (76.9%) |
| Arts, Media & Entertainment | 0 (0.0%) | 0 (0.0%) |
| Health Diagnosing & Treating | 2 (5.7%) | 33 (94.3%) |
| Health Technologists | 2 (7.1%) | 26 (92.9%) |
| Total (Category) | 91 (47.6%) | 100 (52.4%) |
| Total (Overall) | 279 (52.3%) | 254 (47.6%) |
Services Occupations
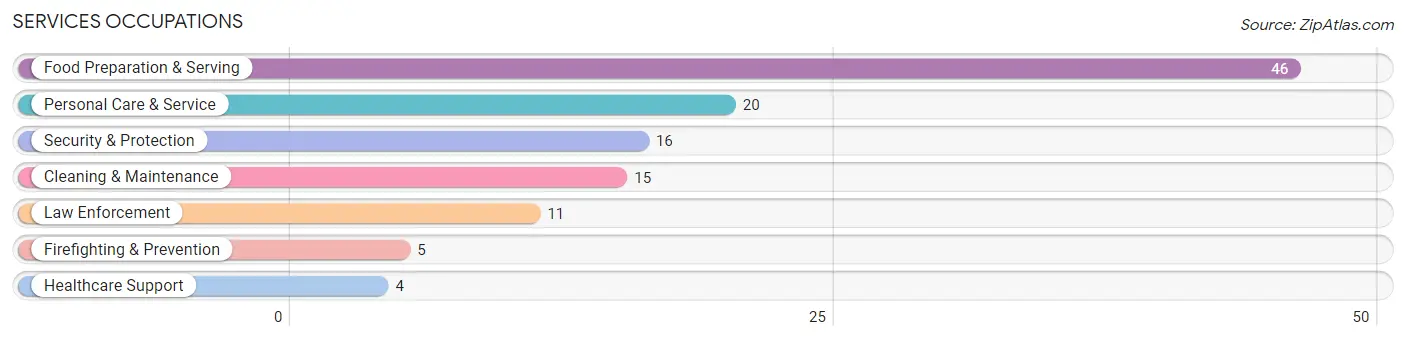
The most common Services occupations in Smithfield borough are Food Preparation & Serving (46 | 8.6%), Personal Care & Service (20 | 3.7%), Security & Protection (16 | 3.0%), Cleaning & Maintenance (15 | 2.8%), and Law Enforcement (11 | 2.1%).
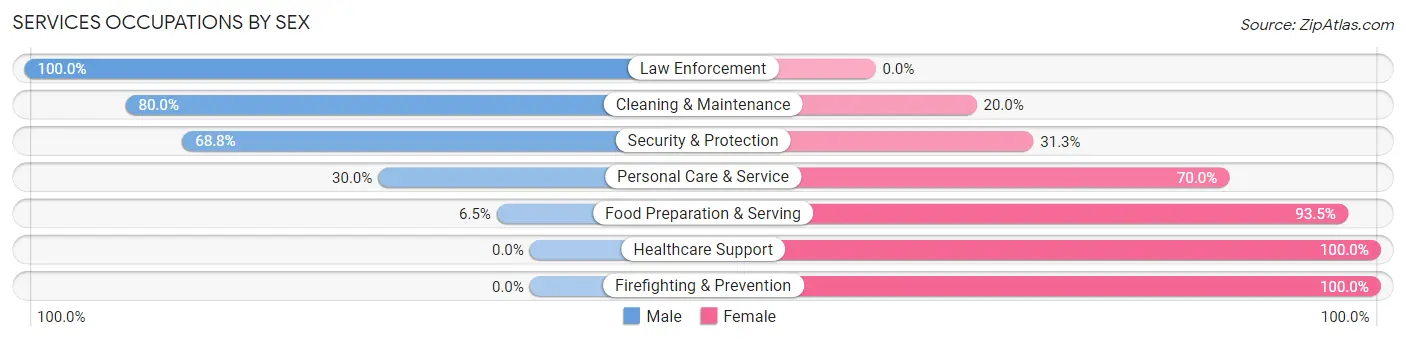
Services Occupations by Sex
Within the Services occupations in Smithfield borough, the most male-oriented occupations are Law Enforcement (100.0%), Cleaning & Maintenance (80.0%), and Security & Protection (68.8%), while the most female-oriented occupations are Healthcare Support (100.0%), Firefighting & Prevention (100.0%), and Food Preparation & Serving (93.5%).
| Occupation | Male | Female |
| Healthcare Support | 0 (0.0%) | 4 (100.0%) |
| Security & Protection | 11 (68.8%) | 5 (31.2%) |
| Firefighting & Prevention | 0 (0.0%) | 5 (100.0%) |
| Law Enforcement | 11 (100.0%) | 0 (0.0%) |
| Food Preparation & Serving | 3 (6.5%) | 43 (93.5%) |
| Cleaning & Maintenance | 12 (80.0%) | 3 (20.0%) |
| Personal Care & Service | 6 (30.0%) | 14 (70.0%) |
| Total (Category) | 32 (31.7%) | 69 (68.3%) |
| Total (Overall) | 279 (52.3%) | 254 (47.6%) |
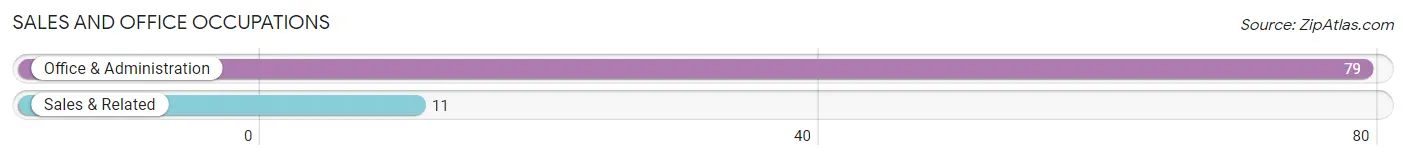
Sales and Office Occupations
The most common Sales and Office occupations in Smithfield borough are Office & Administration (79 | 14.8%), and Sales & Related (11 | 2.1%).
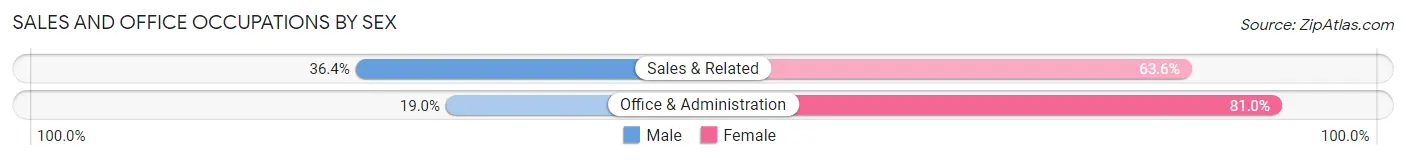
Sales and Office Occupations by Sex
| Occupation | Male | Female |
| Sales & Related | 4 (36.4%) | 7 (63.6%) |
| Office & Administration | 15 (19.0%) | 64 (81.0%) |
| Total (Category) | 19 (21.1%) | 71 (78.9%) |
| Total (Overall) | 279 (52.3%) | 254 (47.6%) |
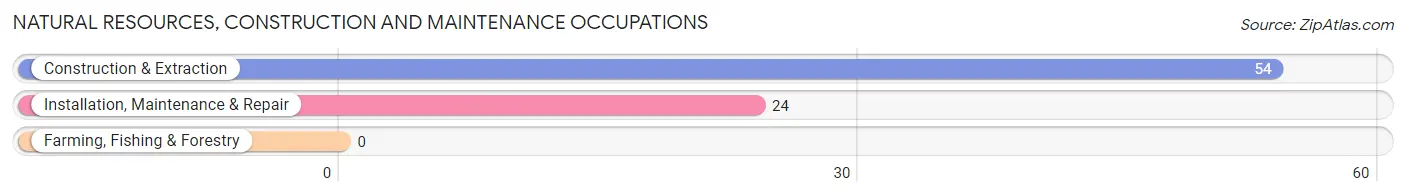
Natural Resources, Construction and Maintenance Occupations
The most common Natural Resources, Construction and Maintenance occupations in Smithfield borough are Construction & Extraction (54 | 10.1%), and Installation, Maintenance & Repair (24 | 4.5%).
Natural Resources, Construction and Maintenance Occupations by Sex
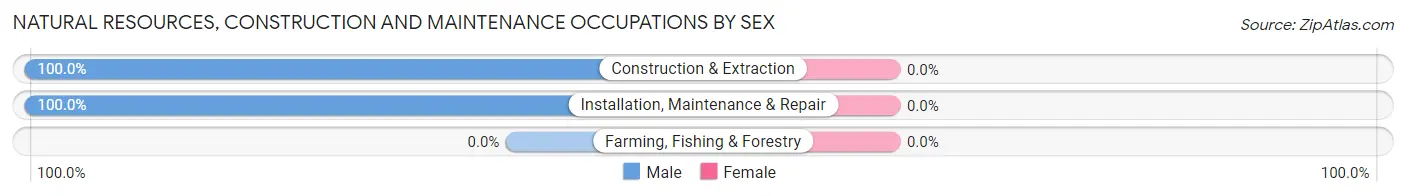
| Occupation | Male | Female |
| Farming, Fishing & Forestry | 0 (0.0%) | 0 (0.0%) |
| Construction & Extraction | 54 (100.0%) | 0 (0.0%) |
| Installation, Maintenance & Repair | 24 (100.0%) | 0 (0.0%) |
| Total (Category) | 78 (100.0%) | 0 (0.0%) |
| Total (Overall) | 279 (52.3%) | 254 (47.6%) |
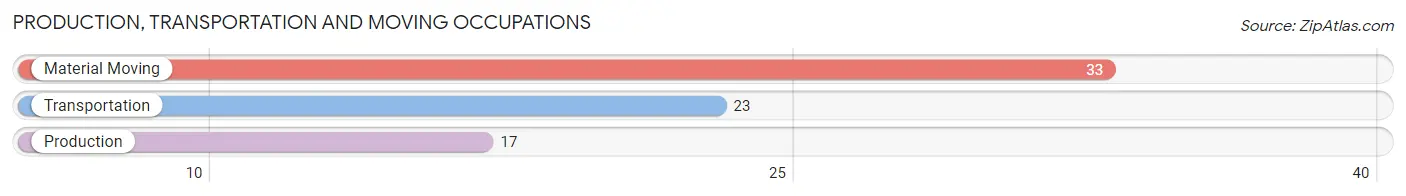
Production, Transportation and Moving Occupations
The most common Production, Transportation and Moving occupations in Smithfield borough are Material Moving (33 | 6.2%), Transportation (23 | 4.3%), and Production (17 | 3.2%).
Production, Transportation and Moving Occupations by Sex
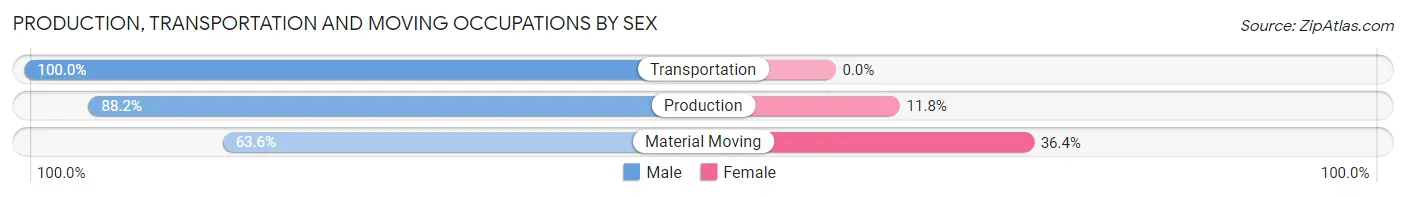
| Occupation | Male | Female |
| Production | 15 (88.2%) | 2 (11.8%) |
| Transportation | 23 (100.0%) | 0 (0.0%) |
| Material Moving | 21 (63.6%) | 12 (36.4%) |
| Total (Category) | 59 (80.8%) | 14 (19.2%) |
| Total (Overall) | 279 (52.3%) | 254 (47.6%) |
Employment Industries by Sex in Smithfield borough
Employment Industries in Smithfield borough
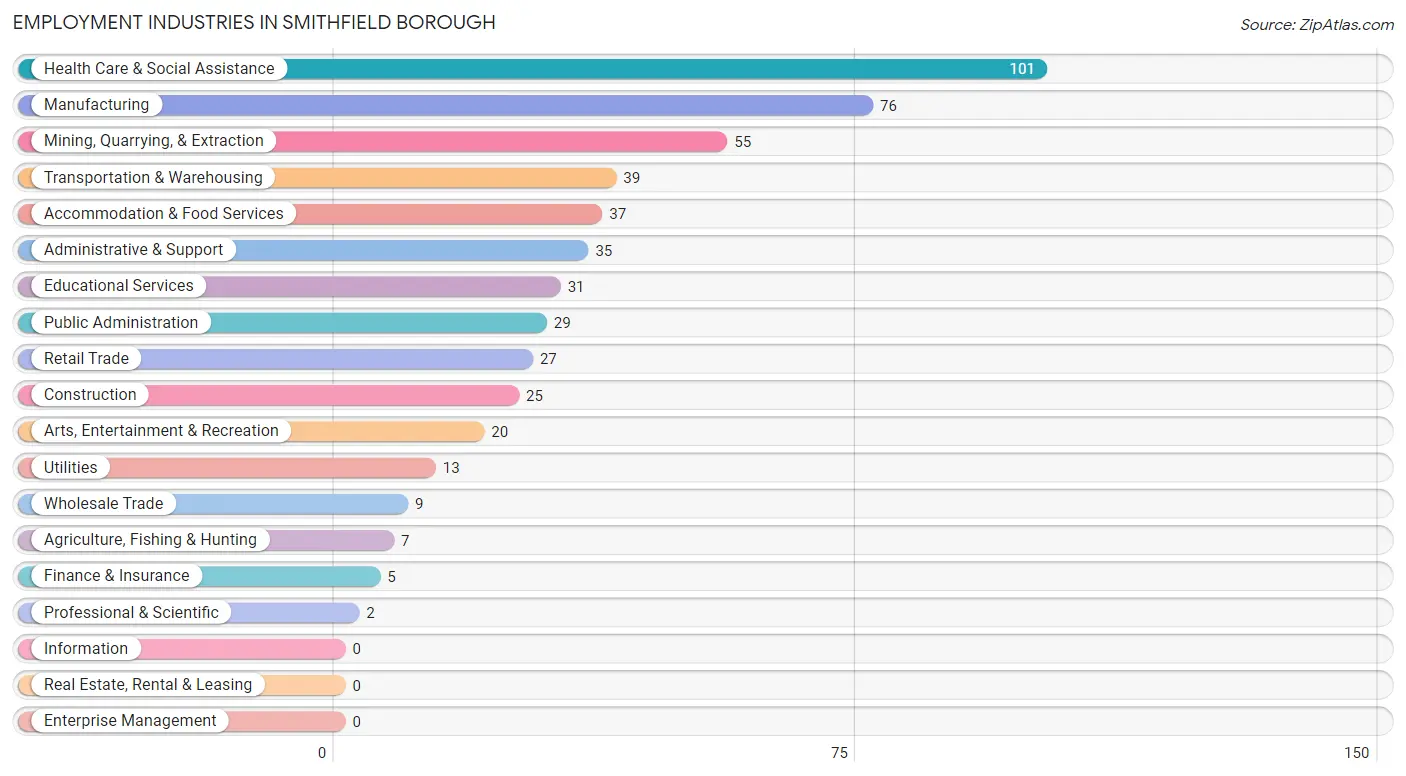
The major employment industries in Smithfield borough include Health Care & Social Assistance (101 | 19.0%), Manufacturing (76 | 14.3%), Mining, Quarrying, & Extraction (55 | 10.3%), Transportation & Warehousing (39 | 7.3%), and Accommodation & Food Services (37 | 6.9%).
Employment Industries by Sex in Smithfield borough
The Smithfield borough industries that see more men than women are Agriculture, Fishing & Hunting (100.0%), Mining, Quarrying, & Extraction (100.0%), and Construction (100.0%), whereas the industries that tend to have a higher number of women are Professional & Scientific (100.0%), Arts, Entertainment & Recreation (100.0%), and Health Care & Social Assistance (93.1%).
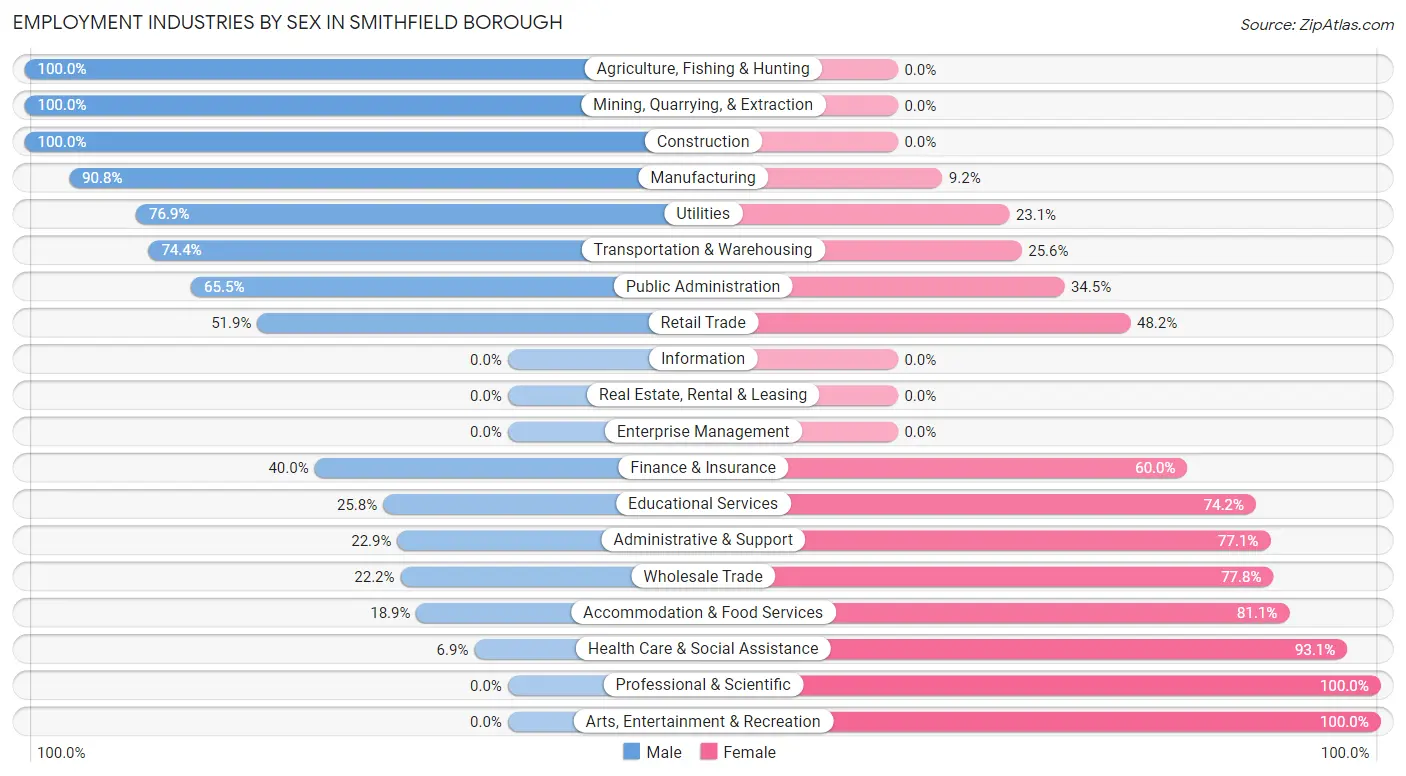
| Industry | Male | Female |
| Agriculture, Fishing & Hunting | 7 (100.0%) | 0 (0.0%) |
| Mining, Quarrying, & Extraction | 55 (100.0%) | 0 (0.0%) |
| Construction | 25 (100.0%) | 0 (0.0%) |
| Manufacturing | 69 (90.8%) | 7 (9.2%) |
| Wholesale Trade | 2 (22.2%) | 7 (77.8%) |
| Retail Trade | 14 (51.8%) | 13 (48.1%) |
| Transportation & Warehousing | 29 (74.4%) | 10 (25.6%) |
| Utilities | 10 (76.9%) | 3 (23.1%) |
| Information | 0 (0.0%) | 0 (0.0%) |
| Finance & Insurance | 2 (40.0%) | 3 (60.0%) |
| Real Estate, Rental & Leasing | 0 (0.0%) | 0 (0.0%) |
| Professional & Scientific | 0 (0.0%) | 2 (100.0%) |
| Enterprise Management | 0 (0.0%) | 0 (0.0%) |
| Administrative & Support | 8 (22.9%) | 27 (77.1%) |
| Educational Services | 8 (25.8%) | 23 (74.2%) |
| Health Care & Social Assistance | 7 (6.9%) | 94 (93.1%) |
| Arts, Entertainment & Recreation | 0 (0.0%) | 20 (100.0%) |
| Accommodation & Food Services | 7 (18.9%) | 30 (81.1%) |
| Public Administration | 19 (65.5%) | 10 (34.5%) |
| Total | 279 (52.3%) | 254 (47.6%) |
Education in Smithfield borough
School Enrollment in Smithfield borough
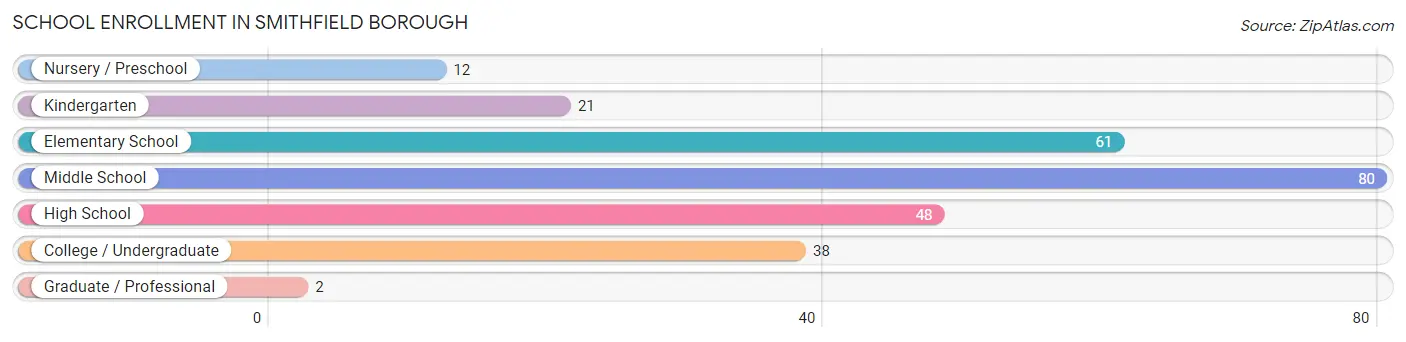
The most common levels of schooling among the 262 students in Smithfield borough are middle school (80 | 30.5%), elementary school (61 | 23.3%), and high school (48 | 18.3%).
| School Level | # Students | % Students |
| Nursery / Preschool | 12 | 4.6% |
| Kindergarten | 21 | 8.0% |
| Elementary School | 61 | 23.3% |
| Middle School | 80 | 30.5% |
| High School | 48 | 18.3% |
| College / Undergraduate | 38 | 14.5% |
| Graduate / Professional | 2 | 0.8% |
| Total | 262 | 100.0% |
School Enrollment by Age by Funding Source in Smithfield borough
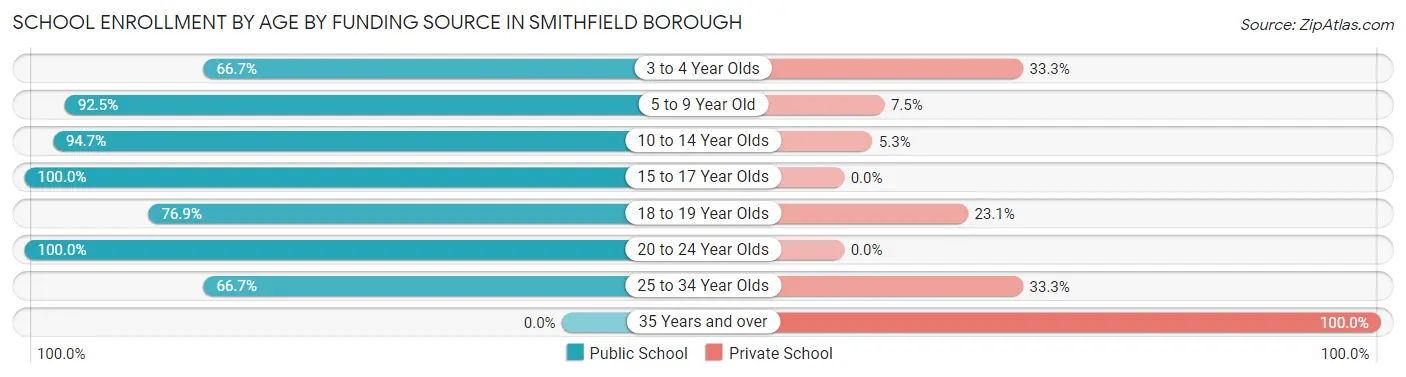
Out of a total of 262 students who are enrolled in schools in Smithfield borough, 26 (9.9%) attend a private institution, while the remaining 236 (90.1%) are enrolled in public schools. The age group of 35 years and over has the highest likelihood of being enrolled in private schools, with 3 (100.0% in the age bracket) enrolled. Conversely, the age group of 15 to 17 year olds has the lowest likelihood of being enrolled in a private school, with 26 (100.0% in the age bracket) attending a public institution.
| Age Bracket | Public School | Private School |
| 3 to 4 Year Olds | 8 (66.7%) | 4 (33.3%) |
| 5 to 9 Year Old | 74 (92.5%) | 6 (7.5%) |
| 10 to 14 Year Olds | 90 (94.7%) | 5 (5.3%) |
| 15 to 17 Year Olds | 26 (100.0%) | 0 (0.0%) |
| 18 to 19 Year Olds | 20 (76.9%) | 6 (23.1%) |
| 20 to 24 Year Olds | 14 (100.0%) | 0 (0.0%) |
| 25 to 34 Year Olds | 4 (66.7%) | 2 (33.3%) |
| 35 Years and over | 0 (0.0%) | 3 (100.0%) |
| Total | 236 (90.1%) | 26 (9.9%) |
Educational Attainment by Field of Study in Smithfield borough
Business (40 | 26.7%), psychology (37 | 24.7%), science & technology (27 | 18.0%), arts & humanities (14 | 9.3%), and education (13 | 8.7%) are the most common fields of study among 150 individuals in Smithfield borough who have obtained a bachelor's degree or higher.
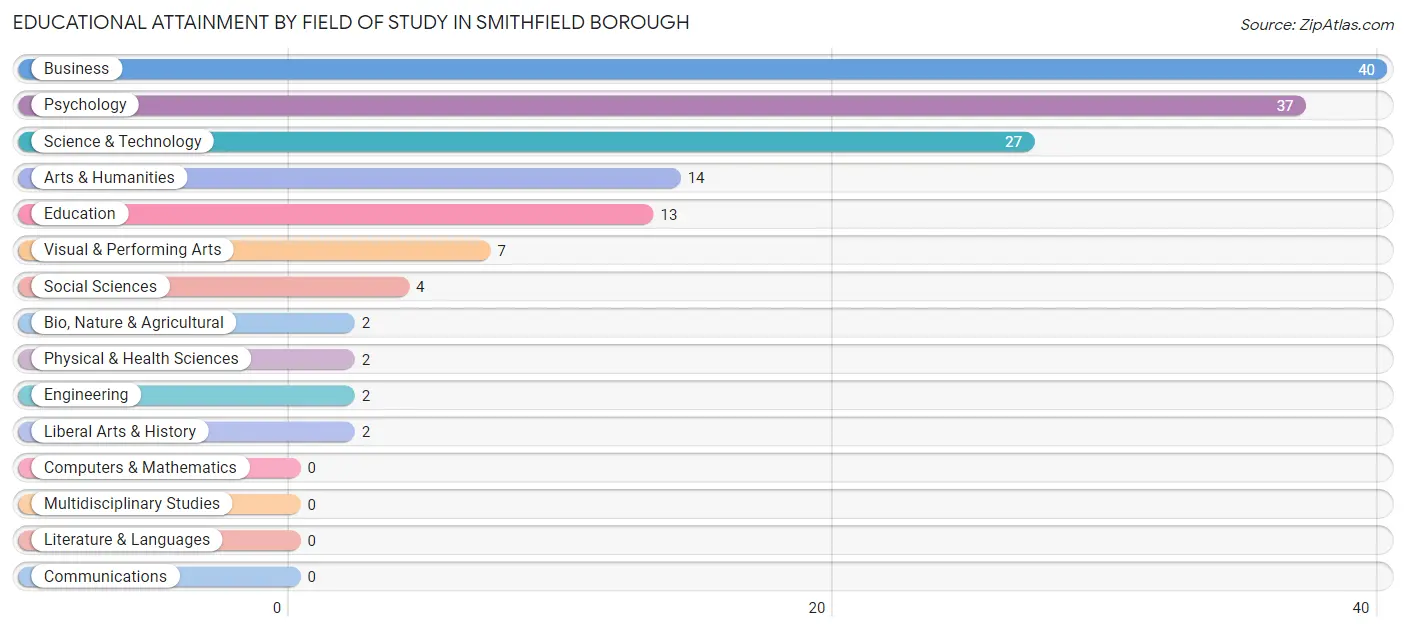
| Field of Study | # Graduates | % Graduates |
| Computers & Mathematics | 0 | 0.0% |
| Bio, Nature & Agricultural | 2 | 1.3% |
| Physical & Health Sciences | 2 | 1.3% |
| Psychology | 37 | 24.7% |
| Social Sciences | 4 | 2.7% |
| Engineering | 2 | 1.3% |
| Multidisciplinary Studies | 0 | 0.0% |
| Science & Technology | 27 | 18.0% |
| Business | 40 | 26.7% |
| Education | 13 | 8.7% |
| Literature & Languages | 0 | 0.0% |
| Liberal Arts & History | 2 | 1.3% |
| Visual & Performing Arts | 7 | 4.7% |
| Communications | 0 | 0.0% |
| Arts & Humanities | 14 | 9.3% |
| Total | 150 | 100.0% |
Transportation & Commute in Smithfield borough
Vehicle Availability by Sex in Smithfield borough
The most prevalent vehicle ownership categories in Smithfield borough are males with 2 vehicles (124, accounting for 44.8%) and females with 2 vehicles (108, making up 50.6%).
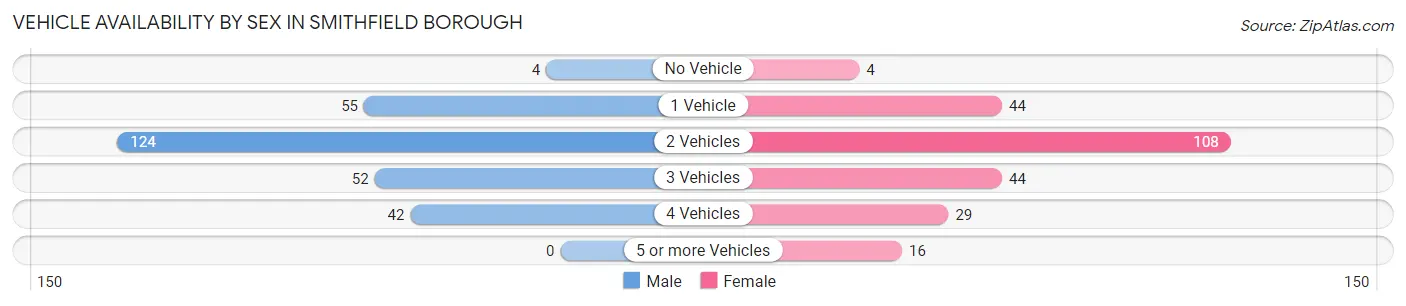
| Vehicles Available | Male | Female |
| No Vehicle | 4 (1.4%) | 4 (1.6%) |
| 1 Vehicle | 55 (19.9%) | 44 (18.0%) |
| 2 Vehicles | 124 (44.8%) | 108 (44.1%) |
| 3 Vehicles | 52 (18.8%) | 44 (18.0%) |
| 4 Vehicles | 42 (15.2%) | 29 (11.8%) |
| 5 or more Vehicles | 0 (0.0%) | 16 (6.5%) |
| Total | 277 (100.0%) | 245 (100.0%) |
Commute Time in Smithfield borough
The most frequently occuring commute durations in Smithfield borough are 15 to 19 minutes (87 commuters, 18.1%), 25 to 29 minutes (78 commuters, 16.3%), and 20 to 24 minutes (57 commuters, 11.9%).
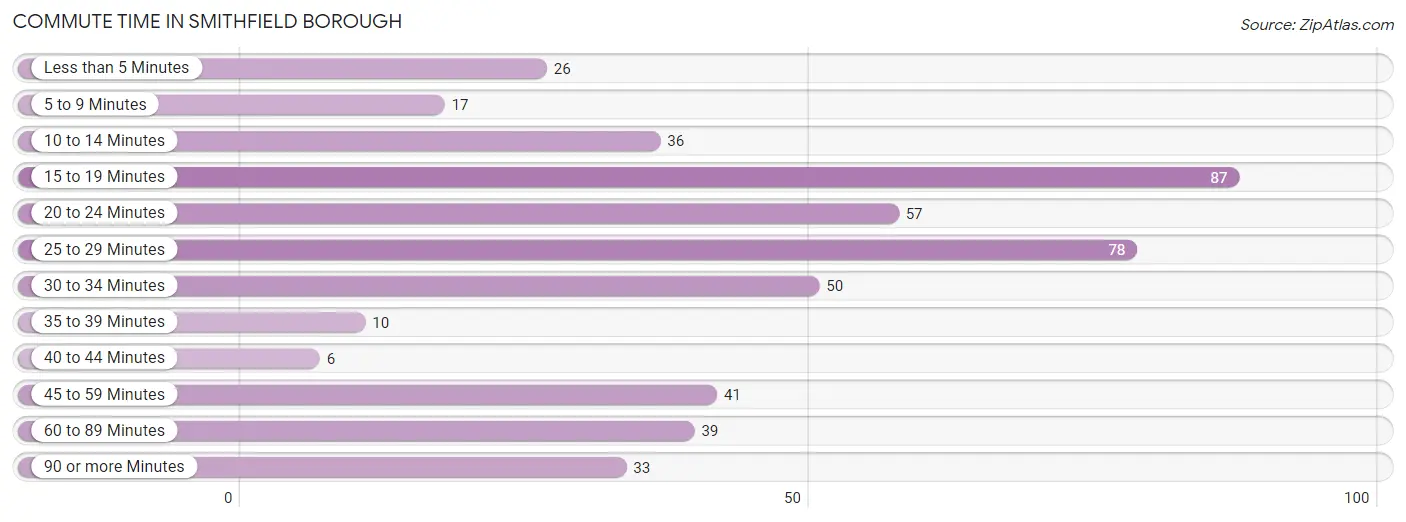
| Commute Time | # Commuters | % Commuters |
| Less than 5 Minutes | 26 | 5.4% |
| 5 to 9 Minutes | 17 | 3.5% |
| 10 to 14 Minutes | 36 | 7.5% |
| 15 to 19 Minutes | 87 | 18.1% |
| 20 to 24 Minutes | 57 | 11.9% |
| 25 to 29 Minutes | 78 | 16.3% |
| 30 to 34 Minutes | 50 | 10.4% |
| 35 to 39 Minutes | 10 | 2.1% |
| 40 to 44 Minutes | 6 | 1.3% |
| 45 to 59 Minutes | 41 | 8.5% |
| 60 to 89 Minutes | 39 | 8.1% |
| 90 or more Minutes | 33 | 6.9% |
Commute Time by Sex in Smithfield borough
The most common commute times in Smithfield borough are 25 to 29 minutes (48 commuters, 18.0%) for males and 15 to 19 minutes (65 commuters, 30.5%) for females.
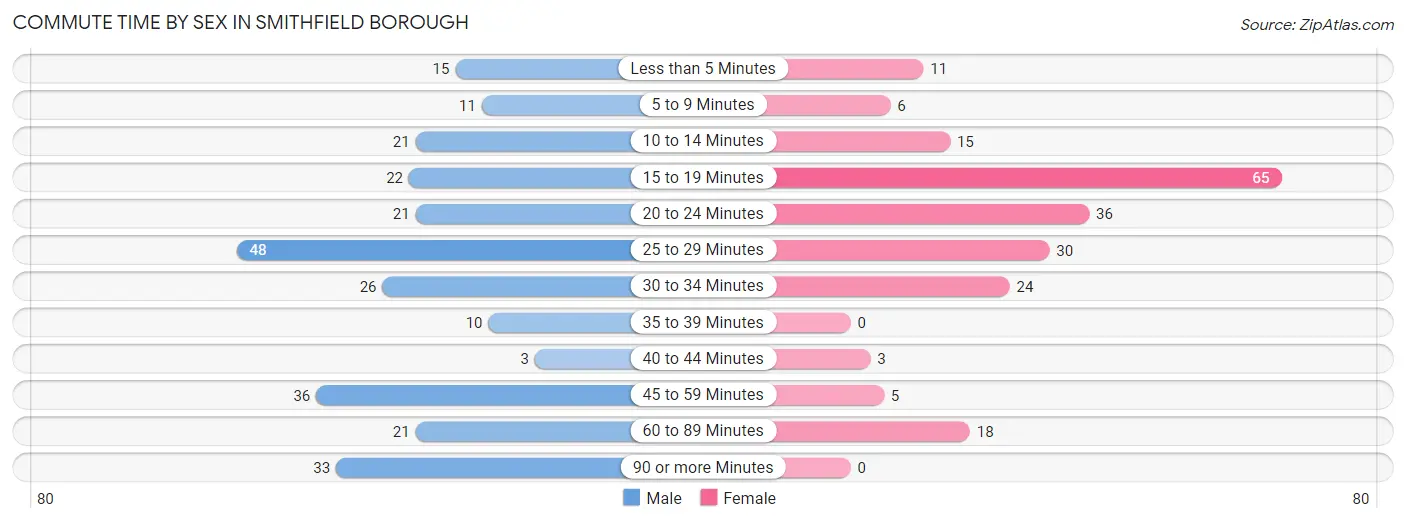
| Commute Time | Male | Female |
| Less than 5 Minutes | 15 (5.6%) | 11 (5.2%) |
| 5 to 9 Minutes | 11 (4.1%) | 6 (2.8%) |
| 10 to 14 Minutes | 21 (7.9%) | 15 (7.0%) |
| 15 to 19 Minutes | 22 (8.2%) | 65 (30.5%) |
| 20 to 24 Minutes | 21 (7.9%) | 36 (16.9%) |
| 25 to 29 Minutes | 48 (18.0%) | 30 (14.1%) |
| 30 to 34 Minutes | 26 (9.7%) | 24 (11.3%) |
| 35 to 39 Minutes | 10 (3.7%) | 0 (0.0%) |
| 40 to 44 Minutes | 3 (1.1%) | 3 (1.4%) |
| 45 to 59 Minutes | 36 (13.5%) | 5 (2.4%) |
| 60 to 89 Minutes | 21 (7.9%) | 18 (8.5%) |
| 90 or more Minutes | 33 (12.4%) | 0 (0.0%) |
Time of Departure to Work by Sex in Smithfield borough
The most frequent times of departure to work in Smithfield borough are 7:00 AM to 7:29 AM (56, 21.0%) for males and 6:00 AM to 6:29 AM (44, 20.7%) for females.
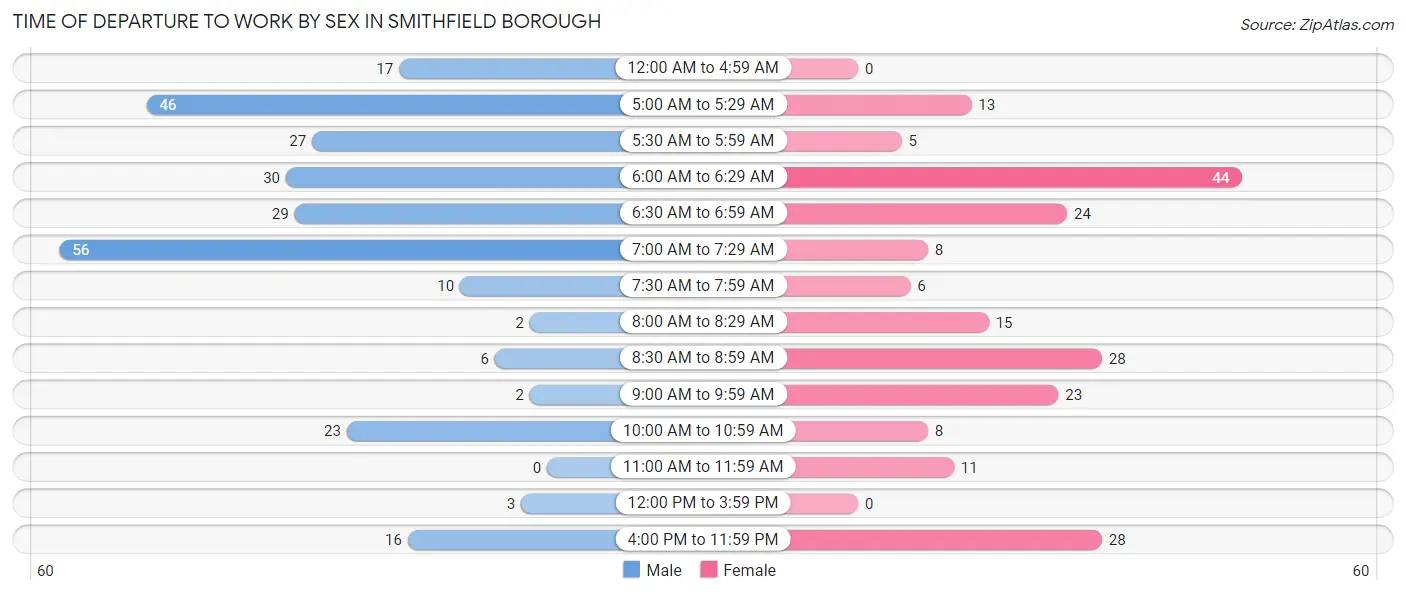
| Time of Departure | Male | Female |
| 12:00 AM to 4:59 AM | 17 (6.4%) | 0 (0.0%) |
| 5:00 AM to 5:29 AM | 46 (17.2%) | 13 (6.1%) |
| 5:30 AM to 5:59 AM | 27 (10.1%) | 5 (2.4%) |
| 6:00 AM to 6:29 AM | 30 (11.2%) | 44 (20.7%) |
| 6:30 AM to 6:59 AM | 29 (10.9%) | 24 (11.3%) |
| 7:00 AM to 7:29 AM | 56 (21.0%) | 8 (3.8%) |
| 7:30 AM to 7:59 AM | 10 (3.7%) | 6 (2.8%) |
| 8:00 AM to 8:29 AM | 2 (0.7%) | 15 (7.0%) |
| 8:30 AM to 8:59 AM | 6 (2.2%) | 28 (13.2%) |
| 9:00 AM to 9:59 AM | 2 (0.7%) | 23 (10.8%) |
| 10:00 AM to 10:59 AM | 23 (8.6%) | 8 (3.8%) |
| 11:00 AM to 11:59 AM | 0 (0.0%) | 11 (5.2%) |
| 12:00 PM to 3:59 PM | 3 (1.1%) | 0 (0.0%) |
| 4:00 PM to 11:59 PM | 16 (6.0%) | 28 (13.2%) |
| Total | 267 (100.0%) | 213 (100.0%) |
Housing Occupancy in Smithfield borough
Occupancy by Ownership in Smithfield borough
Of the total 448 dwellings in Smithfield borough, owner-occupied units account for 302 (67.4%), while renter-occupied units make up 146 (32.6%).
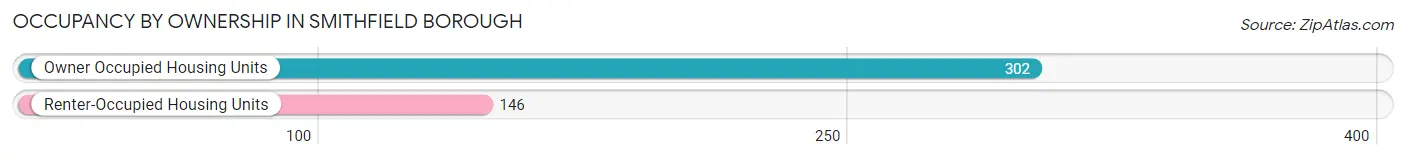
| Occupancy | # Housing Units | % Housing Units |
| Owner Occupied Housing Units | 302 | 67.4% |
| Renter-Occupied Housing Units | 146 | 32.6% |
| Total Occupied Housing Units | 448 | 100.0% |
Occupancy by Household Size in Smithfield borough
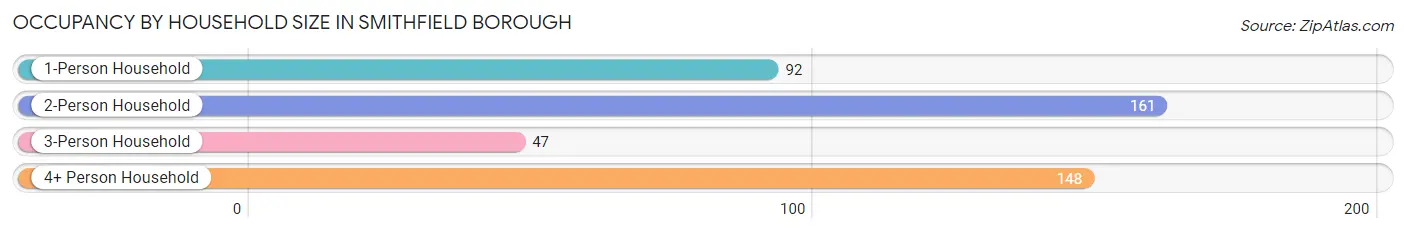
| Household Size | # Housing Units | % Housing Units |
| 1-Person Household | 92 | 20.5% |
| 2-Person Household | 161 | 35.9% |
| 3-Person Household | 47 | 10.5% |
| 4+ Person Household | 148 | 33.0% |
| Total Housing Units | 448 | 100.0% |
Occupancy by Ownership by Household Size in Smithfield borough
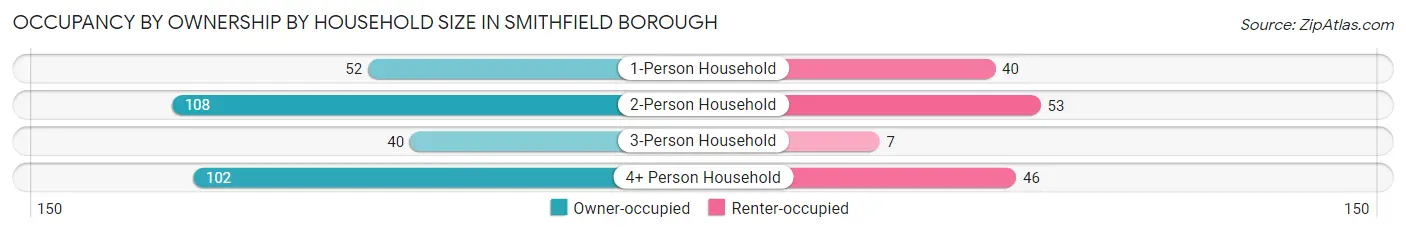
| Household Size | Owner-occupied | Renter-occupied |
| 1-Person Household | 52 (56.5%) | 40 (43.5%) |
| 2-Person Household | 108 (67.1%) | 53 (32.9%) |
| 3-Person Household | 40 (85.1%) | 7 (14.9%) |
| 4+ Person Household | 102 (68.9%) | 46 (31.1%) |
| Total Housing Units | 302 (67.4%) | 146 (32.6%) |
Occupancy by Educational Attainment in Smithfield borough
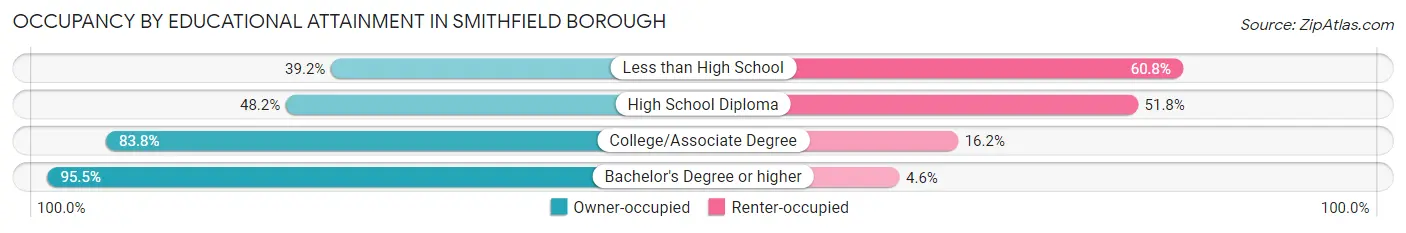
| Household Size | Owner-occupied | Renter-occupied |
| Less than High School | 20 (39.2%) | 31 (60.8%) |
| High School Diploma | 79 (48.2%) | 85 (51.8%) |
| College/Associate Degree | 140 (83.8%) | 27 (16.2%) |
| Bachelor's Degree or higher | 63 (95.5%) | 3 (4.5%) |
Occupancy by Age of Householder in Smithfield borough
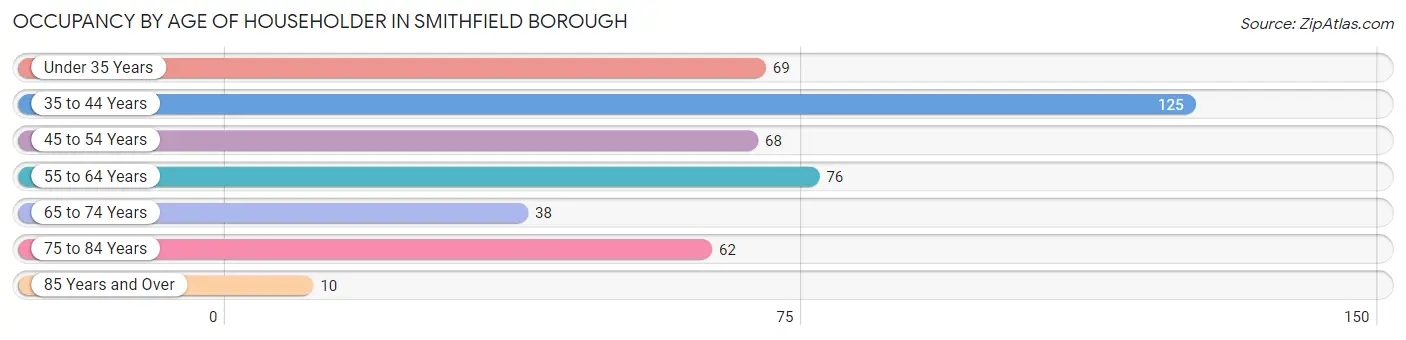
| Age Bracket | # Households | % Households |
| Under 35 Years | 69 | 15.4% |
| 35 to 44 Years | 125 | 27.9% |
| 45 to 54 Years | 68 | 15.2% |
| 55 to 64 Years | 76 | 17.0% |
| 65 to 74 Years | 38 | 8.5% |
| 75 to 84 Years | 62 | 13.8% |
| 85 Years and Over | 10 | 2.2% |
| Total | 448 | 100.0% |
Housing Finances in Smithfield borough
Median Income by Occupancy in Smithfield borough
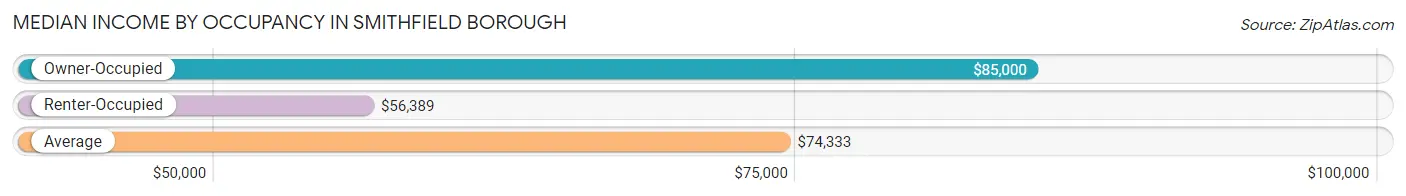
| Occupancy Type | # Households | Median Income |
| Owner-Occupied | 302 (67.4%) | $85,000 |
| Renter-Occupied | 146 (32.6%) | $56,389 |
| Average | 448 (100.0%) | $74,333 |
Occupancy by Householder Income Bracket in Smithfield borough
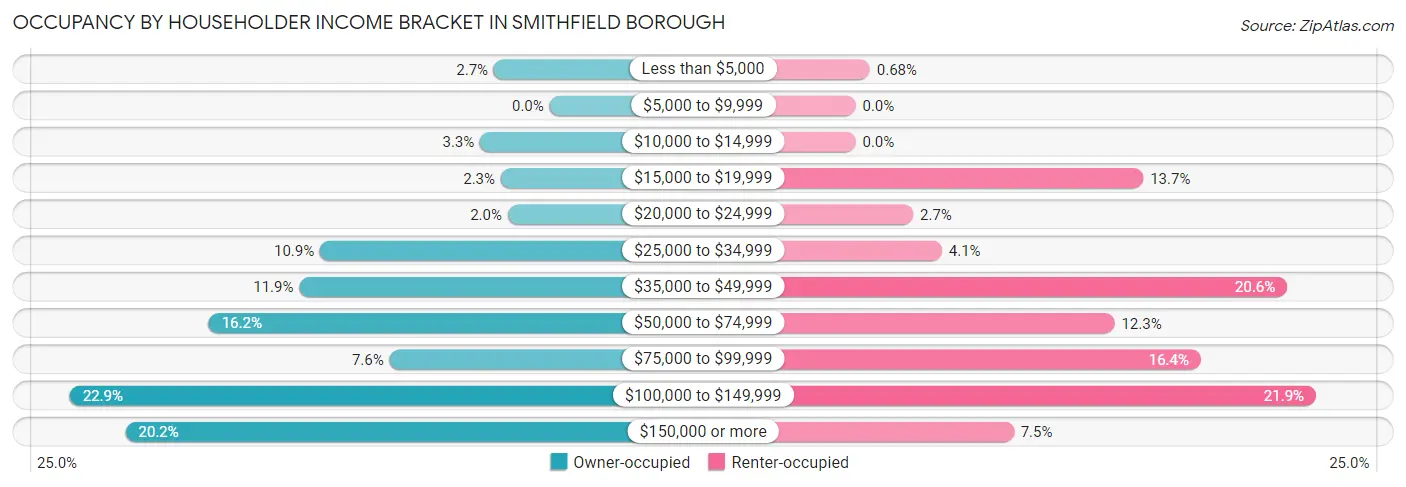
| Income Bracket | Owner-occupied | Renter-occupied |
| Less than $5,000 | 8 (2.6%) | 1 (0.7%) |
| $5,000 to $9,999 | 0 (0.0%) | 0 (0.0%) |
| $10,000 to $14,999 | 10 (3.3%) | 0 (0.0%) |
| $15,000 to $19,999 | 7 (2.3%) | 20 (13.7%) |
| $20,000 to $24,999 | 6 (2.0%) | 4 (2.7%) |
| $25,000 to $34,999 | 33 (10.9%) | 6 (4.1%) |
| $35,000 to $49,999 | 36 (11.9%) | 30 (20.5%) |
| $50,000 to $74,999 | 49 (16.2%) | 18 (12.3%) |
| $75,000 to $99,999 | 23 (7.6%) | 24 (16.4%) |
| $100,000 to $149,999 | 69 (22.9%) | 32 (21.9%) |
| $150,000 or more | 61 (20.2%) | 11 (7.5%) |
| Total | 302 (100.0%) | 146 (100.0%) |
Monthly Housing Cost Tiers in Smithfield borough
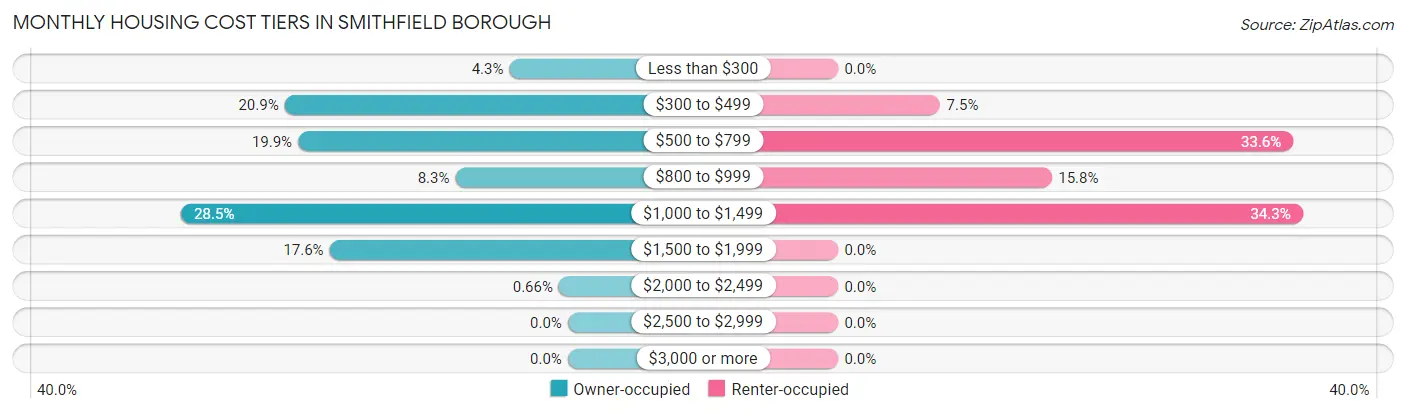
| Monthly Cost | Owner-occupied | Renter-occupied |
| Less than $300 | 13 (4.3%) | 0 (0.0%) |
| $300 to $499 | 63 (20.9%) | 11 (7.5%) |
| $500 to $799 | 60 (19.9%) | 49 (33.6%) |
| $800 to $999 | 25 (8.3%) | 23 (15.8%) |
| $1,000 to $1,499 | 86 (28.5%) | 50 (34.3%) |
| $1,500 to $1,999 | 53 (17.5%) | 0 (0.0%) |
| $2,000 to $2,499 | 2 (0.7%) | 0 (0.0%) |
| $2,500 to $2,999 | 0 (0.0%) | 0 (0.0%) |
| $3,000 or more | 0 (0.0%) | 0 (0.0%) |
| Total | 302 (100.0%) | 146 (100.0%) |
Physical Housing Characteristics in Smithfield borough
Housing Structures in Smithfield borough
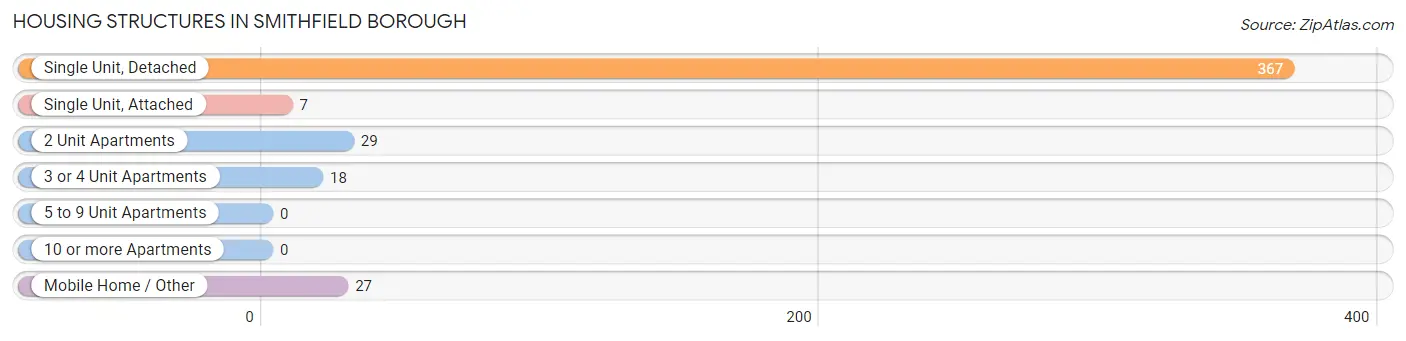
| Structure Type | # Housing Units | % Housing Units |
| Single Unit, Detached | 367 | 81.9% |
| Single Unit, Attached | 7 | 1.6% |
| 2 Unit Apartments | 29 | 6.5% |
| 3 or 4 Unit Apartments | 18 | 4.0% |
| 5 to 9 Unit Apartments | 0 | 0.0% |
| 10 or more Apartments | 0 | 0.0% |
| Mobile Home / Other | 27 | 6.0% |
| Total | 448 | 100.0% |
Housing Structures by Occupancy in Smithfield borough
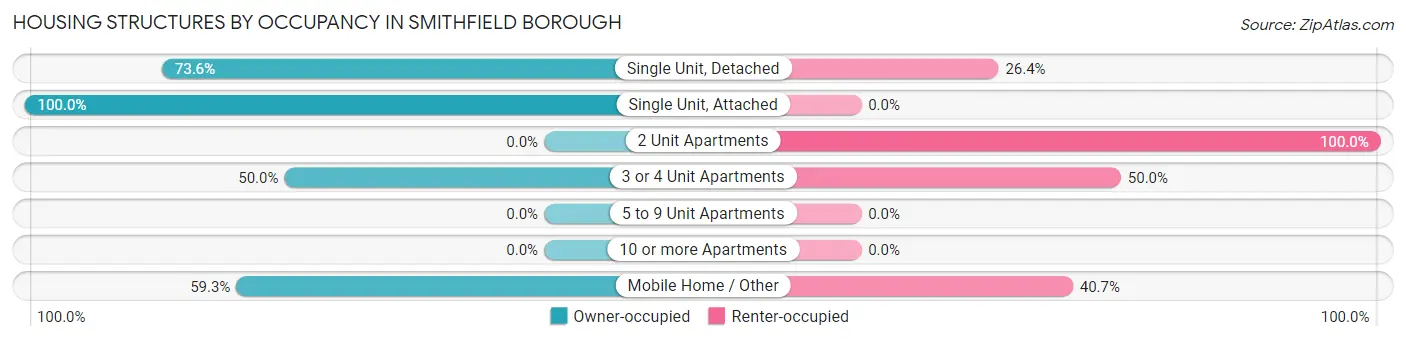
| Structure Type | Owner-occupied | Renter-occupied |
| Single Unit, Detached | 270 (73.6%) | 97 (26.4%) |
| Single Unit, Attached | 7 (100.0%) | 0 (0.0%) |
| 2 Unit Apartments | 0 (0.0%) | 29 (100.0%) |
| 3 or 4 Unit Apartments | 9 (50.0%) | 9 (50.0%) |
| 5 to 9 Unit Apartments | 0 (0.0%) | 0 (0.0%) |
| 10 or more Apartments | 0 (0.0%) | 0 (0.0%) |
| Mobile Home / Other | 16 (59.3%) | 11 (40.7%) |
| Total | 302 (67.4%) | 146 (32.6%) |
Housing Structures by Number of Rooms in Smithfield borough
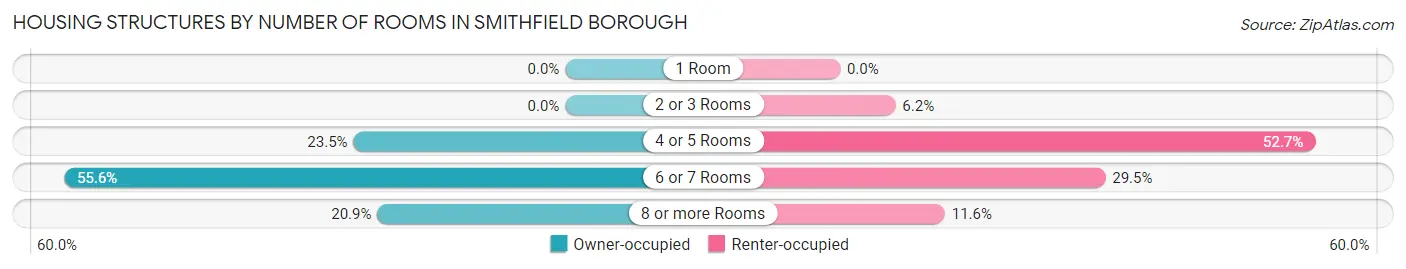
| Number of Rooms | Owner-occupied | Renter-occupied |
| 1 Room | 0 (0.0%) | 0 (0.0%) |
| 2 or 3 Rooms | 0 (0.0%) | 9 (6.2%) |
| 4 or 5 Rooms | 71 (23.5%) | 77 (52.7%) |
| 6 or 7 Rooms | 168 (55.6%) | 43 (29.4%) |
| 8 or more Rooms | 63 (20.9%) | 17 (11.6%) |
| Total | 302 (100.0%) | 146 (100.0%) |
Housing Structure by Heating Type in Smithfield borough
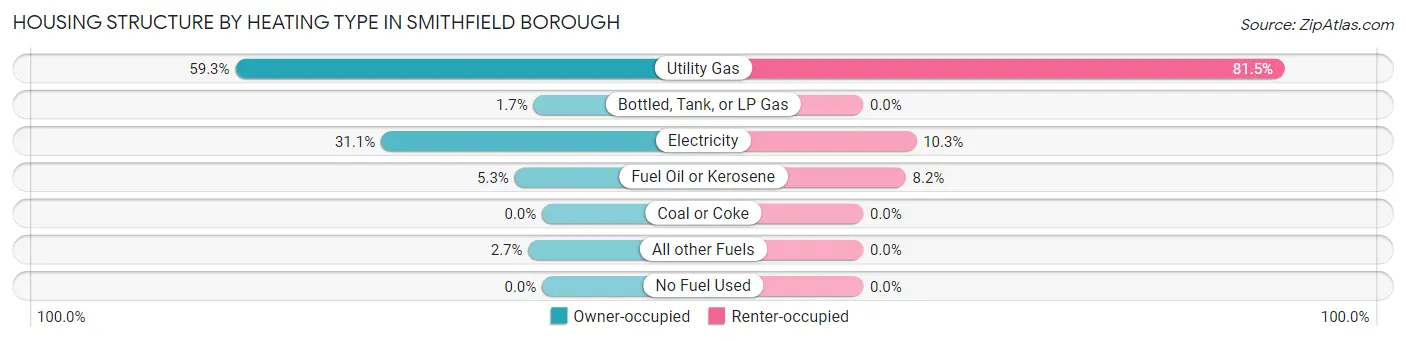
| Heating Type | Owner-occupied | Renter-occupied |
| Utility Gas | 179 (59.3%) | 119 (81.5%) |
| Bottled, Tank, or LP Gas | 5 (1.7%) | 0 (0.0%) |
| Electricity | 94 (31.1%) | 15 (10.3%) |
| Fuel Oil or Kerosene | 16 (5.3%) | 12 (8.2%) |
| Coal or Coke | 0 (0.0%) | 0 (0.0%) |
| All other Fuels | 8 (2.6%) | 0 (0.0%) |
| No Fuel Used | 0 (0.0%) | 0 (0.0%) |
| Total | 302 (100.0%) | 146 (100.0%) |
Household Vehicle Usage in Smithfield borough
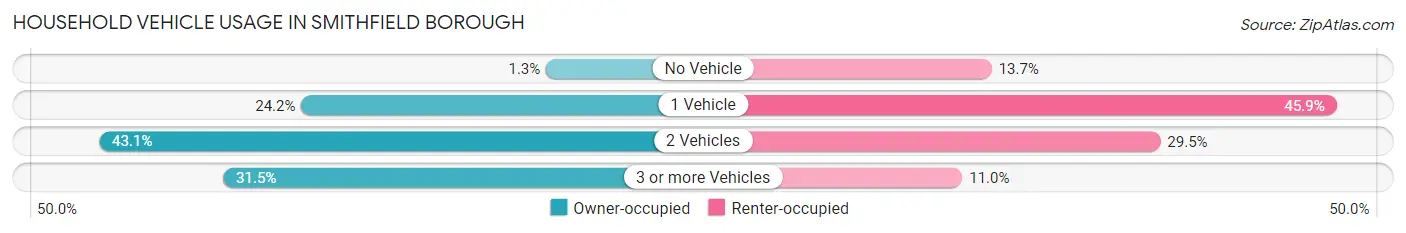
| Vehicles per Household | Owner-occupied | Renter-occupied |
| No Vehicle | 4 (1.3%) | 20 (13.7%) |
| 1 Vehicle | 73 (24.2%) | 67 (45.9%) |
| 2 Vehicles | 130 (43.0%) | 43 (29.4%) |
| 3 or more Vehicles | 95 (31.5%) | 16 (11.0%) |
| Total | 302 (100.0%) | 146 (100.0%) |
Real Estate & Mortgages in Smithfield borough
Real Estate and Mortgage Overview in Smithfield borough
| Characteristic | Without Mortgage | With Mortgage |
| Housing Units | 126 | 176 |
| Median Property Value | $95,800 | $176,700 |
| Median Household Income | $56,429 | $56 |
| Monthly Housing Costs | $476 | $0 |
| Real Estate Taxes | $1,175 | $0 |
Property Value by Mortgage Status in Smithfield borough
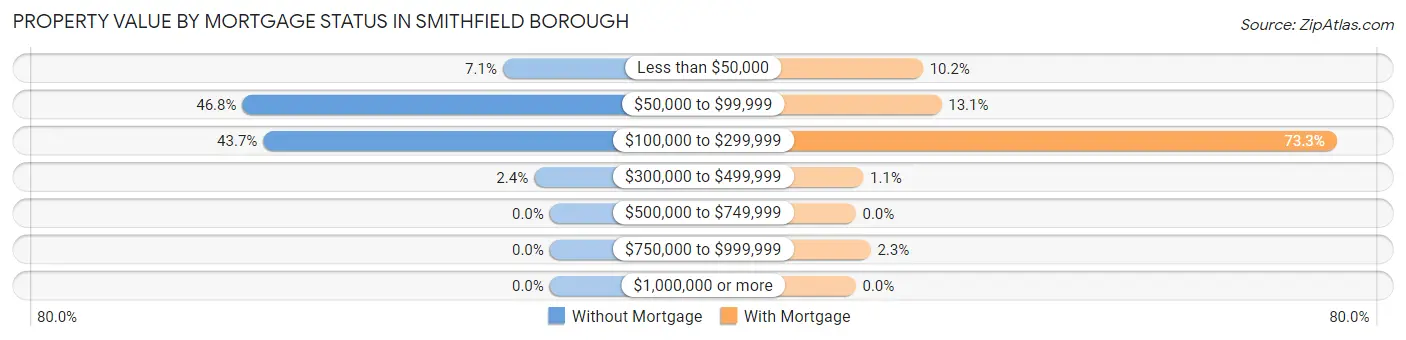
| Property Value | Without Mortgage | With Mortgage |
| Less than $50,000 | 9 (7.1%) | 18 (10.2%) |
| $50,000 to $99,999 | 59 (46.8%) | 23 (13.1%) |
| $100,000 to $299,999 | 55 (43.6%) | 129 (73.3%) |
| $300,000 to $499,999 | 3 (2.4%) | 2 (1.1%) |
| $500,000 to $749,999 | 0 (0.0%) | 0 (0.0%) |
| $750,000 to $999,999 | 0 (0.0%) | 4 (2.3%) |
| $1,000,000 or more | 0 (0.0%) | 0 (0.0%) |
| Total | 126 (100.0%) | 176 (100.0%) |
Household Income by Mortgage Status in Smithfield borough
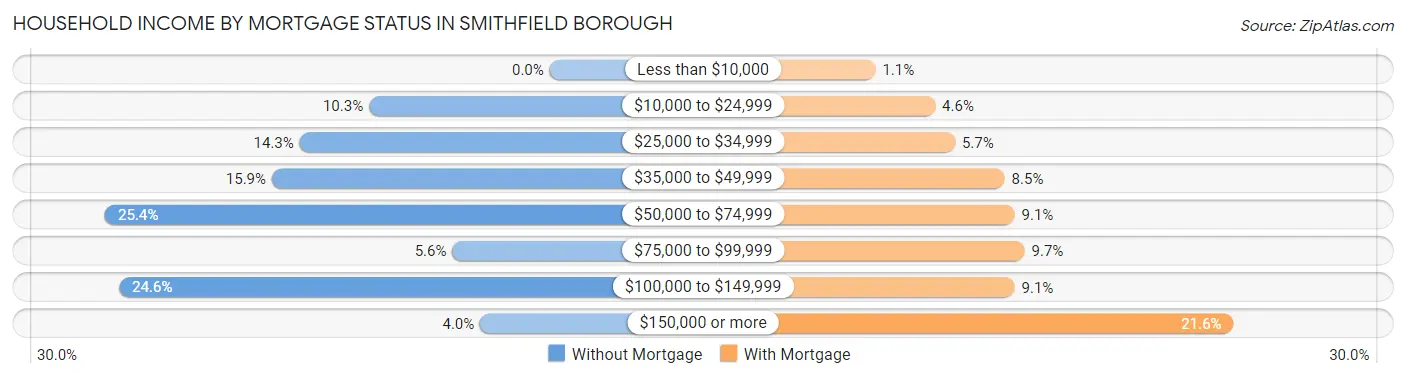
| Household Income | Without Mortgage | With Mortgage |
| Less than $10,000 | 0 (0.0%) | 2 (1.1%) |
| $10,000 to $24,999 | 13 (10.3%) | 8 (4.5%) |
| $25,000 to $34,999 | 18 (14.3%) | 10 (5.7%) |
| $35,000 to $49,999 | 20 (15.9%) | 15 (8.5%) |
| $50,000 to $74,999 | 32 (25.4%) | 16 (9.1%) |
| $75,000 to $99,999 | 7 (5.6%) | 17 (9.7%) |
| $100,000 to $149,999 | 31 (24.6%) | 16 (9.1%) |
| $150,000 or more | 5 (4.0%) | 38 (21.6%) |
| Total | 126 (100.0%) | 176 (100.0%) |
Property Value to Household Income Ratio in Smithfield borough
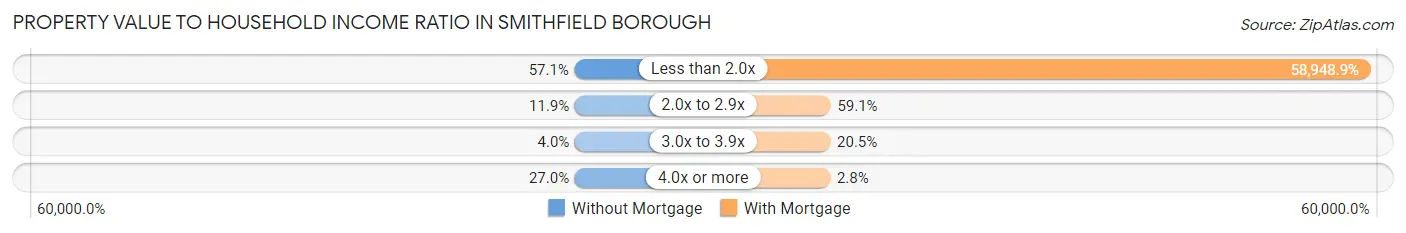
| Value-to-Income Ratio | Without Mortgage | With Mortgage |
| Less than 2.0x | 72 (57.1%) | 103,750 (58,948.9%) |
| 2.0x to 2.9x | 15 (11.9%) | 104 (59.1%) |
| 3.0x to 3.9x | 5 (4.0%) | 36 (20.4%) |
| 4.0x or more | 34 (27.0%) | 5 (2.8%) |
| Total | 126 (100.0%) | 176 (100.0%) |
Real Estate Taxes by Mortgage Status in Smithfield borough
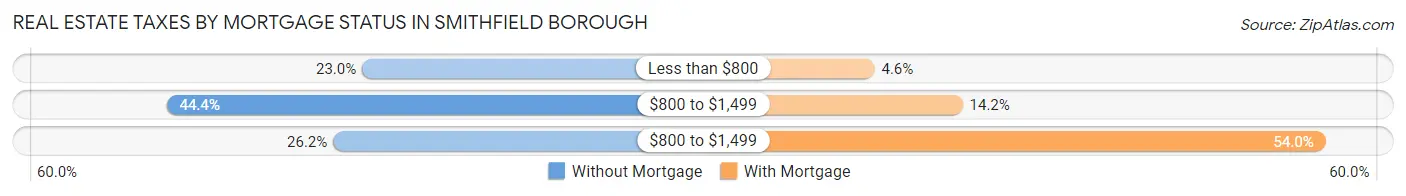
| Property Taxes | Without Mortgage | With Mortgage |
| Less than $800 | 29 (23.0%) | 8 (4.5%) |
| $800 to $1,499 | 56 (44.4%) | 25 (14.2%) |
| $800 to $1,499 | 33 (26.2%) | 95 (54.0%) |
| Total | 126 (100.0%) | 176 (100.0%) |
Health & Disability in Smithfield borough
Health Insurance Coverage by Age in Smithfield borough
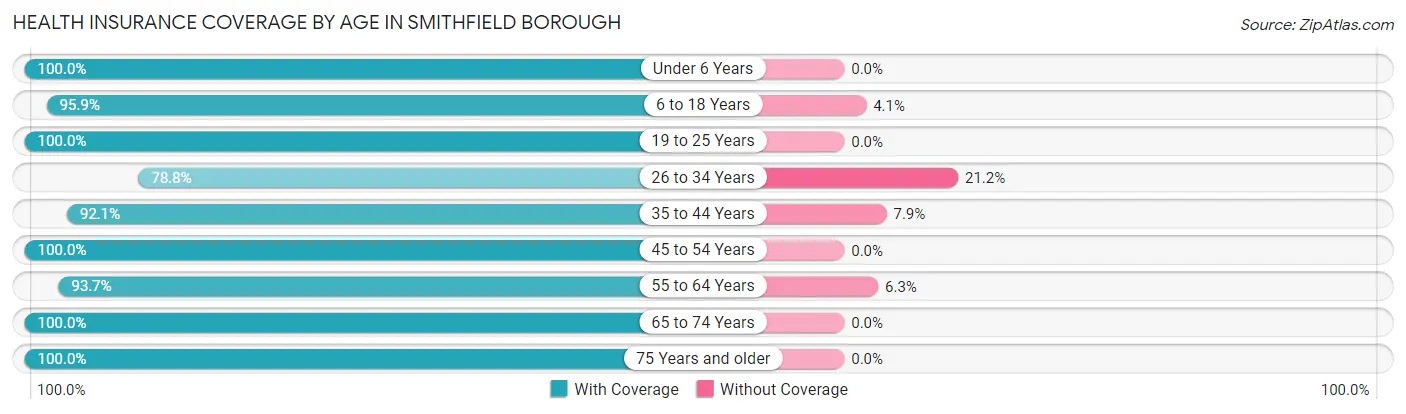
| Age Bracket | With Coverage | Without Coverage |
| Under 6 Years | 99 (100.0%) | 0 (0.0%) |
| 6 to 18 Years | 211 (95.9%) | 9 (4.1%) |
| 19 to 25 Years | 51 (100.0%) | 0 (0.0%) |
| 26 to 34 Years | 104 (78.8%) | 28 (21.2%) |
| 35 to 44 Years | 187 (92.1%) | 16 (7.9%) |
| 45 to 54 Years | 139 (100.0%) | 0 (0.0%) |
| 55 to 64 Years | 119 (93.7%) | 8 (6.3%) |
| 65 to 74 Years | 75 (100.0%) | 0 (0.0%) |
| 75 Years and older | 82 (100.0%) | 0 (0.0%) |
| Total | 1,067 (94.6%) | 61 (5.4%) |
Health Insurance Coverage by Citizenship Status in Smithfield borough
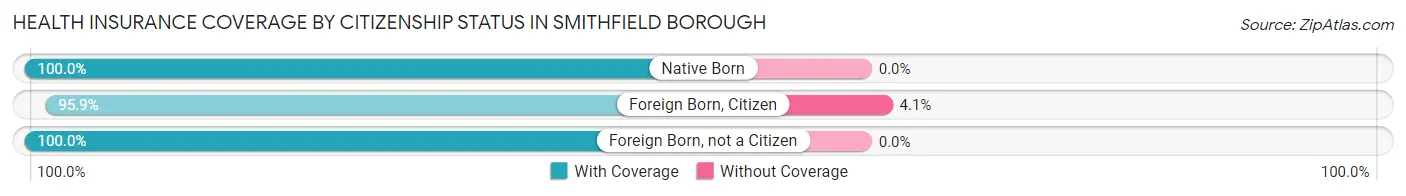
| Citizenship Status | With Coverage | Without Coverage |
| Native Born | 99 (100.0%) | 0 (0.0%) |
| Foreign Born, Citizen | 211 (95.9%) | 9 (4.1%) |
| Foreign Born, not a Citizen | 51 (100.0%) | 0 (0.0%) |
Health Insurance Coverage by Household Income in Smithfield borough
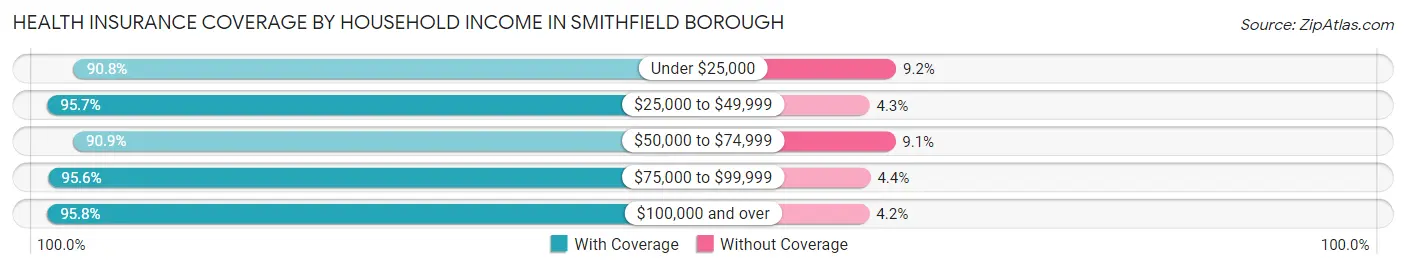
| Household Income | With Coverage | Without Coverage |
| Under $25,000 | 108 (90.8%) | 11 (9.2%) |
| $25,000 to $49,999 | 225 (95.7%) | 10 (4.3%) |
| $50,000 to $74,999 | 130 (90.9%) | 13 (9.1%) |
| $75,000 to $99,999 | 129 (95.6%) | 6 (4.4%) |
| $100,000 and over | 474 (95.8%) | 21 (4.2%) |
Public vs Private Health Insurance Coverage by Age in Smithfield borough
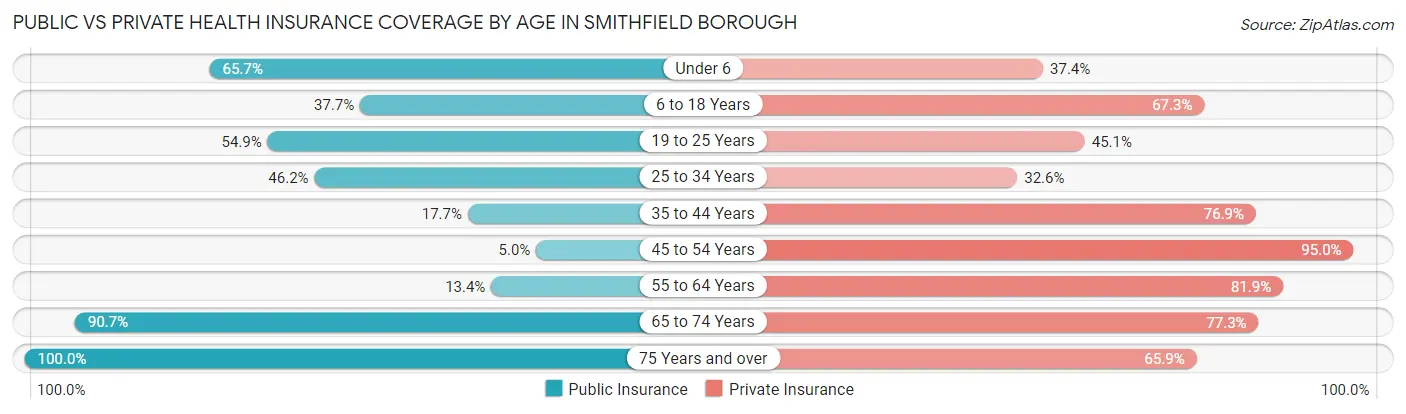
| Age Bracket | Public Insurance | Private Insurance |
| Under 6 | 65 (65.7%) | 37 (37.4%) |
| 6 to 18 Years | 83 (37.7%) | 148 (67.3%) |
| 19 to 25 Years | 28 (54.9%) | 23 (45.1%) |
| 25 to 34 Years | 61 (46.2%) | 43 (32.6%) |
| 35 to 44 Years | 36 (17.7%) | 156 (76.8%) |
| 45 to 54 Years | 7 (5.0%) | 132 (95.0%) |
| 55 to 64 Years | 17 (13.4%) | 104 (81.9%) |
| 65 to 74 Years | 68 (90.7%) | 58 (77.3%) |
| 75 Years and over | 82 (100.0%) | 54 (65.8%) |
| Total | 447 (39.6%) | 755 (66.9%) |
Disability Status by Sex by Age in Smithfield borough
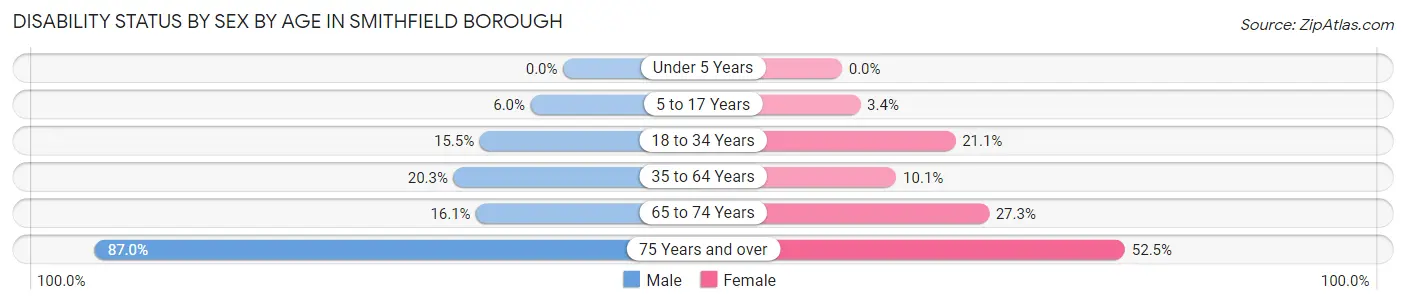
| Age Bracket | Male | Female |
| Under 5 Years | 0 (0.0%) | 0 (0.0%) |
| 5 to 17 Years | 7 (6.0%) | 3 (3.4%) |
| 18 to 34 Years | 15 (15.5%) | 24 (21.0%) |
| 35 to 64 Years | 49 (20.3%) | 23 (10.1%) |
| 65 to 74 Years | 5 (16.1%) | 12 (27.3%) |
| 75 Years and over | 20 (87.0%) | 31 (52.5%) |
Disability Class by Sex by Age in Smithfield borough
Disability Class: Hearing Difficulty
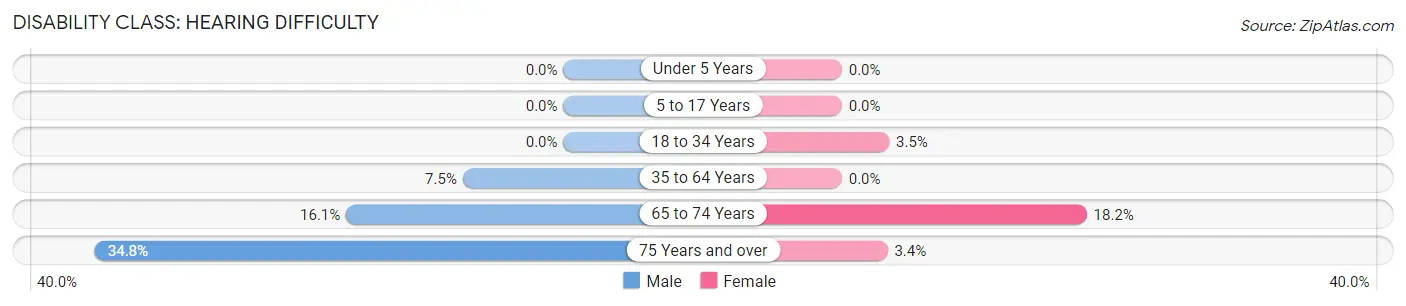
| Age Bracket | Male | Female |
| Under 5 Years | 0 (0.0%) | 0 (0.0%) |
| 5 to 17 Years | 0 (0.0%) | 0 (0.0%) |
| 18 to 34 Years | 0 (0.0%) | 4 (3.5%) |
| 35 to 64 Years | 18 (7.5%) | 0 (0.0%) |
| 65 to 74 Years | 5 (16.1%) | 8 (18.2%) |
| 75 Years and over | 8 (34.8%) | 2 (3.4%) |
Disability Class: Vision Difficulty
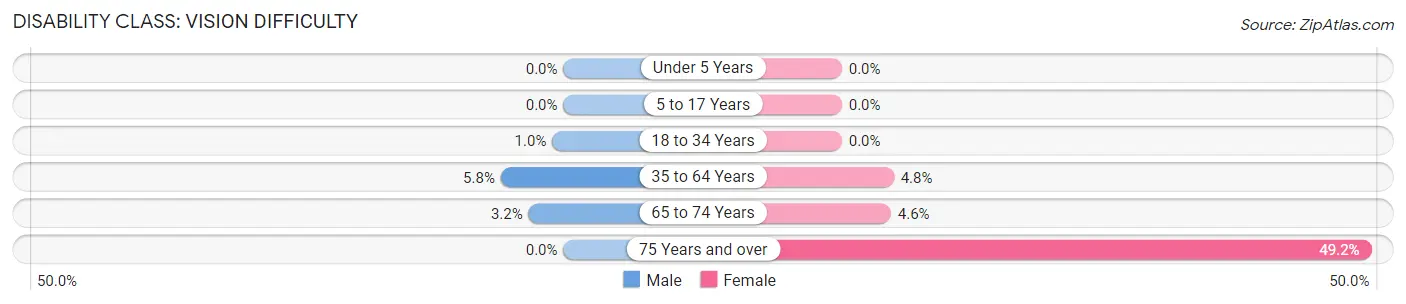
| Age Bracket | Male | Female |
| Under 5 Years | 0 (0.0%) | 0 (0.0%) |
| 5 to 17 Years | 0 (0.0%) | 0 (0.0%) |
| 18 to 34 Years | 1 (1.0%) | 0 (0.0%) |
| 35 to 64 Years | 14 (5.8%) | 11 (4.8%) |
| 65 to 74 Years | 1 (3.2%) | 2 (4.5%) |
| 75 Years and over | 0 (0.0%) | 29 (49.1%) |
Disability Class: Cognitive Difficulty
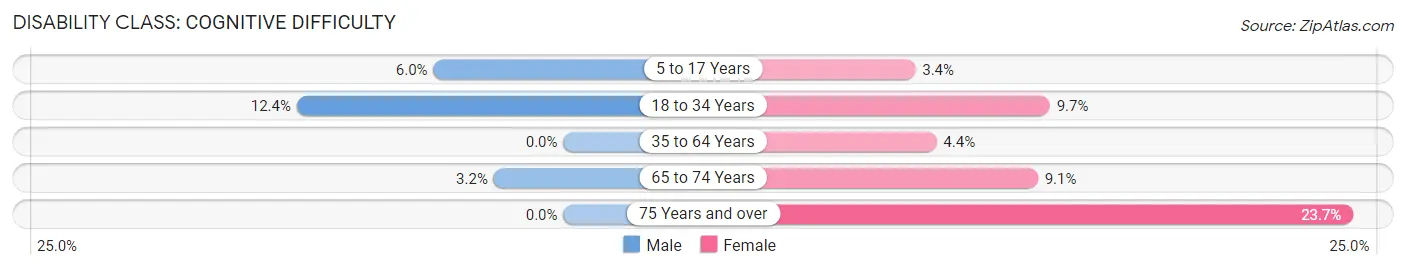
| Age Bracket | Male | Female |
| 5 to 17 Years | 7 (6.0%) | 3 (3.4%) |
| 18 to 34 Years | 12 (12.4%) | 11 (9.7%) |
| 35 to 64 Years | 0 (0.0%) | 10 (4.4%) |
| 65 to 74 Years | 1 (3.2%) | 4 (9.1%) |
| 75 Years and over | 0 (0.0%) | 14 (23.7%) |
Disability Class: Ambulatory Difficulty
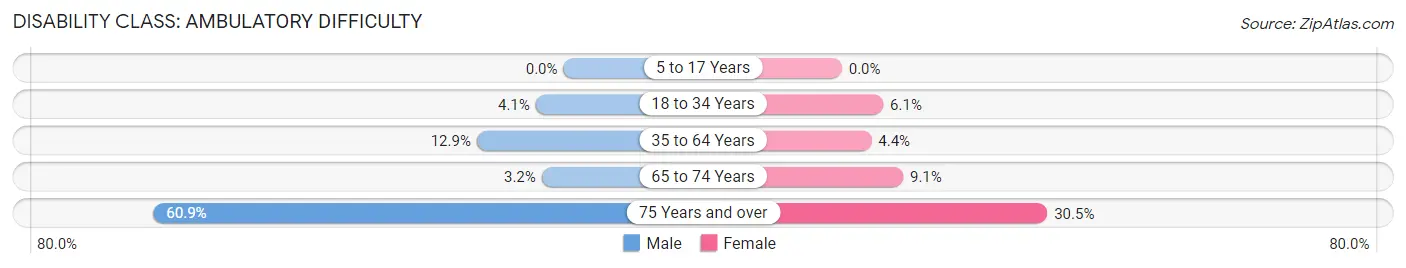
| Age Bracket | Male | Female |
| 5 to 17 Years | 0 (0.0%) | 0 (0.0%) |
| 18 to 34 Years | 4 (4.1%) | 7 (6.1%) |
| 35 to 64 Years | 31 (12.9%) | 10 (4.4%) |
| 65 to 74 Years | 1 (3.2%) | 4 (9.1%) |
| 75 Years and over | 14 (60.9%) | 18 (30.5%) |
Disability Class: Self-Care Difficulty
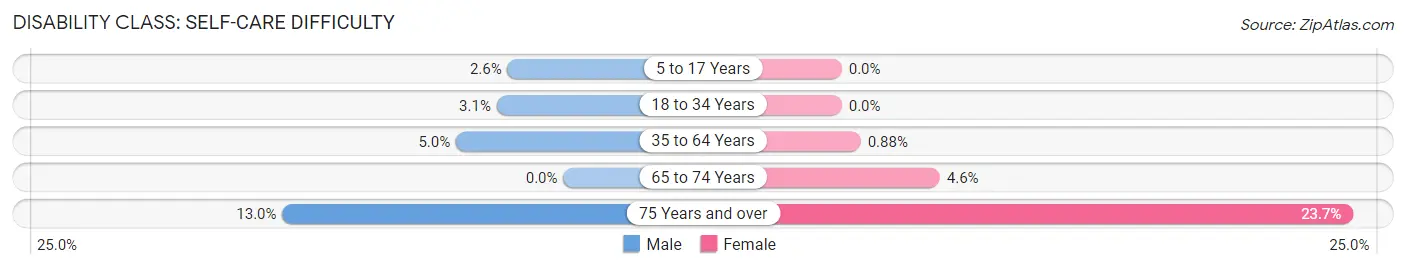
| Age Bracket | Male | Female |
| 5 to 17 Years | 3 (2.6%) | 0 (0.0%) |
| 18 to 34 Years | 3 (3.1%) | 0 (0.0%) |
| 35 to 64 Years | 12 (5.0%) | 2 (0.9%) |
| 65 to 74 Years | 0 (0.0%) | 2 (4.5%) |
| 75 Years and over | 3 (13.0%) | 14 (23.7%) |
Technology Access in Smithfield borough
Computing Device Access in Smithfield borough
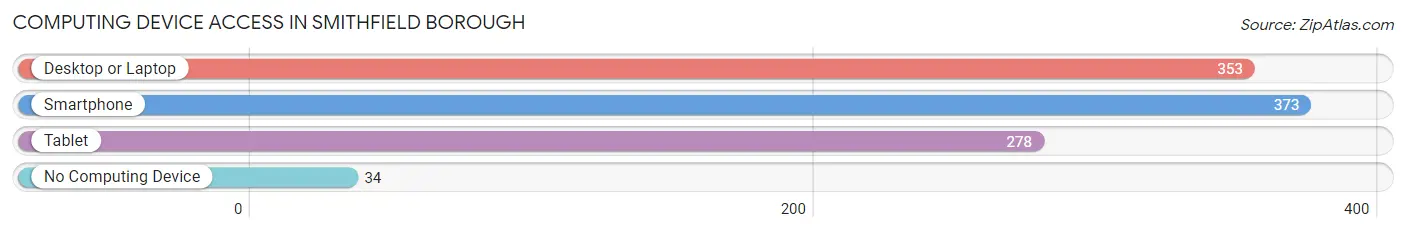
| Device Type | # Households | % Households |
| Desktop or Laptop | 353 | 78.8% |
| Smartphone | 373 | 83.3% |
| Tablet | 278 | 62.1% |
| No Computing Device | 34 | 7.6% |
| Total | 448 | 100.0% |
Internet Access in Smithfield borough
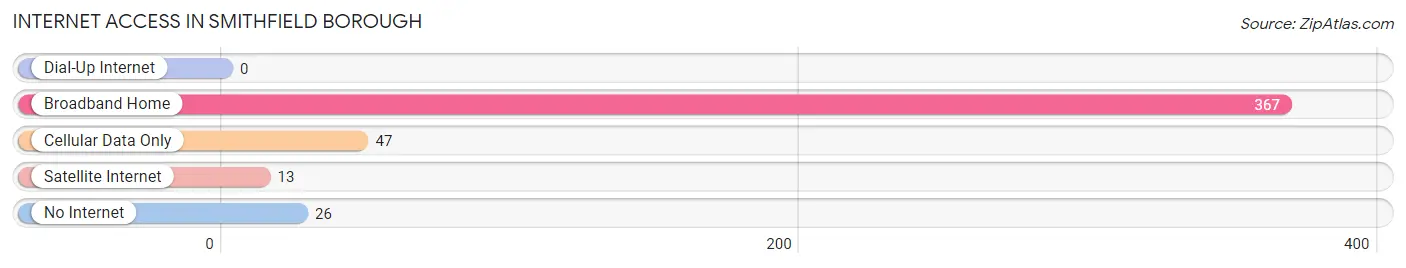
| Internet Type | # Households | % Households |
| Dial-Up Internet | 0 | 0.0% |
| Broadband Home | 367 | 81.9% |
| Cellular Data Only | 47 | 10.5% |
| Satellite Internet | 13 | 2.9% |
| No Internet | 26 | 5.8% |
| Total | 448 | 100.0% |
Smithfield borough Summary
Smithfield Borough is a small borough located in Fayette County, Pennsylvania. It is situated in the southwestern corner of the county, and is bordered by the townships of Georges, Bullskin, and Menallen. The borough is home to a population of approximately 1,000 people, and is part of the Uniontown Metropolitan Statistical Area.
History
Smithfield Borough was founded in 1836, and was named after the Smith family, who were among the first settlers in the area. The borough was originally part of Georges Township, but was incorporated as a separate borough in 1872. The borough was home to a number of small businesses, including a sawmill, a gristmill, and a tannery. The borough also had a number of churches, including the Smithfield Methodist Episcopal Church, which was founded in 1837.
Geography
Smithfield Borough is located in the southwestern corner of Fayette County, and is bordered by the townships of Georges, Bullskin, and Menallen. The borough is situated in the Appalachian Mountains, and is surrounded by rolling hills and forests. The borough is located approximately 25 miles south of Pittsburgh, and is accessible via Interstate 70 and U.S. Route 40.
Economy
Smithfield Borough is a small, rural community, and the economy is largely based on agriculture and tourism. The borough is home to a number of small businesses, including a grocery store, a hardware store, and a few restaurants. The borough also has a number of bed and breakfasts, which attract visitors from all over the region.
Demographics
As of the 2010 census, Smithfield Borough had a population of 1,000 people. The racial makeup of the borough was 97.2% White, 0.7% African American, 0.2% Native American, 0.2% Asian, and 1.7% from two or more races. The median household income was $37,500, and the median family income was $45,000. The per capita income was $18,000.
Conclusion
Smithfield Borough is a small borough located in Fayette County, Pennsylvania. It is situated in the southwestern corner of the county, and is bordered by the townships of Georges, Bullskin, and Menallen. The borough is home to a population of approximately 1,000 people, and is part of the Uniontown Metropolitan Statistical Area. The economy of Smithfield Borough is largely based on agriculture and tourism, and the borough is home to a number of small businesses. The racial makeup of the borough is predominantly White, and the median household income is $37,500. Smithfield Borough is a small, rural community that offers its residents a peaceful and tranquil lifestyle.
Common Questions
What is the Total Population of Smithfield borough?
Total Population of Smithfield borough is 1,128.
What is the Total Male Population of Smithfield borough?
Total Male Population of Smithfield borough is 539.
What is the Total Female Population of Smithfield borough?
Total Female Population of Smithfield borough is 589.
What is the Ratio of Males per 100 Females in Smithfield borough?
There are 91.51 Males per 100 Females in Smithfield borough.
What is the Ratio of Females per 100 Males in Smithfield borough?
There are 109.28 Females per 100 Males in Smithfield borough.
What is the Median Population Age in Smithfield borough?
Median Population Age in Smithfield borough is 39.0 Years.
What is the Average Family Size in Smithfield borough
Average Family Size in Smithfield borough is 2.9 People.
What is the Average Household Size in Smithfield borough
Average Household Size in Smithfield borough is 2.5 People.
What is Per Capita Income in Smithfield borough?
Per Capita income in Smithfield borough is $32,451.
What is the Median Family Income in Smithfield borough?
Median Family Income in Smithfield borough is $100,833.
What is the Median Household income in Smithfield borough?
Median Household Income in Smithfield borough is $74,333.
What is Income or Wage Gap in Smithfield borough?
Income or Wage Gap in Smithfield borough is 27.9%.
Women in Smithfield borough earn 72.1 cents for every dollar earned by a man.
What is Family Income Deficit in Smithfield borough?
Family Income Deficit in Smithfield borough is $17,333.
Families that are below poverty line in Smithfield borough earn $17,333 less on average than the poverty threshold level.
What is Inequality or Gini Index in Smithfield borough?
Inequality or Gini Index in Smithfield borough is 0.37.
How Large is the Labor Force in Smithfield borough?
There are 584 People in the Labor Forcein in Smithfield borough.
What is the Percentage of People in the Labor Force in Smithfield borough?
68.2% of People are in the Labor Force in Smithfield borough.
What is the Unemployment Rate in Smithfield borough?
Unemployment Rate in Smithfield borough is 8.7%.