Redwood, OR
Redwood Map
Redwood Overview
3,275
TOTAL POPULATION
1,650
MALE POPULATION
1,625
FEMALE POPULATION
101.54
MALES / 100 FEMALES
98.48
FEMALES / 100 MALES
49.1
MEDIAN AGE
3.1
AVG FAMILY SIZE
3.1
AVG HOUSEHOLD SIZE
$33,323
PER CAPITA INCOME
$81,250
AVG FAMILY INCOME
$69,393
AVG HOUSEHOLD INCOME
42.7%
WAGE / INCOME GAP [ % ]
57.3¢/ $1
WAGE / INCOME GAP [ $ ]
$10,213
FAMILY INCOME DEFICIT
0.47
INEQUALITY / GINI INDEX
1,481
LABOR FORCE [ PEOPLE ]
57.1%
PERCENT IN LABOR FORCE
9.2%
UNEMPLOYMENT RATE
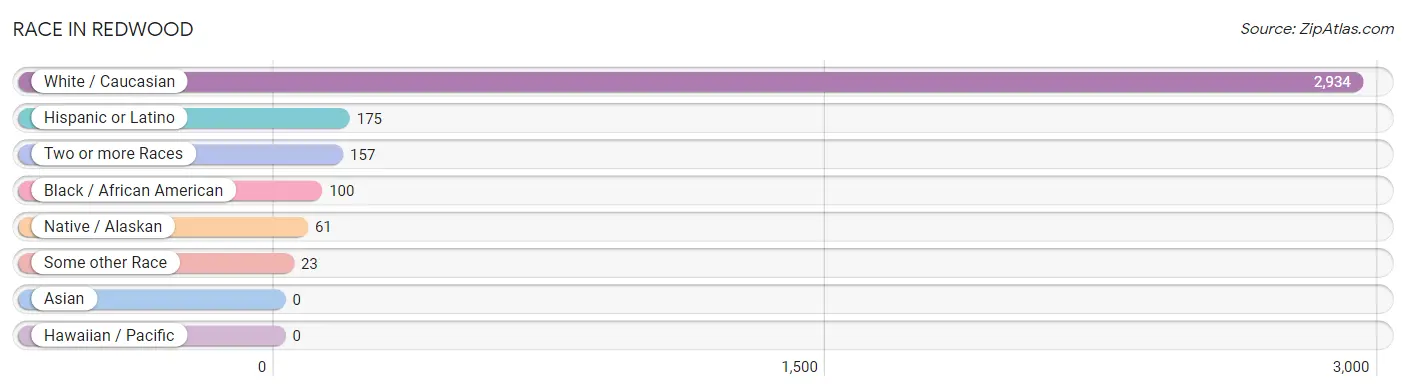
Race in Redwood
The most populous races in Redwood are White / Caucasian (2,934 | 89.6%), Hispanic or Latino (175 | 5.3%), and Two or more Races (157 | 4.8%).
| Race | # Population | % Population |
| Asian | 0 | 0.0% |
| Black / African American | 100 | 3.0% |
| Hawaiian / Pacific | 0 | 0.0% |
| Hispanic or Latino | 175 | 5.3% |
| Native / Alaskan | 61 | 1.9% |
| White / Caucasian | 2,934 | 89.6% |
| Two or more Races | 157 | 4.8% |
| Some other Race | 23 | 0.7% |
| Total | 3,275 | 100.0% |
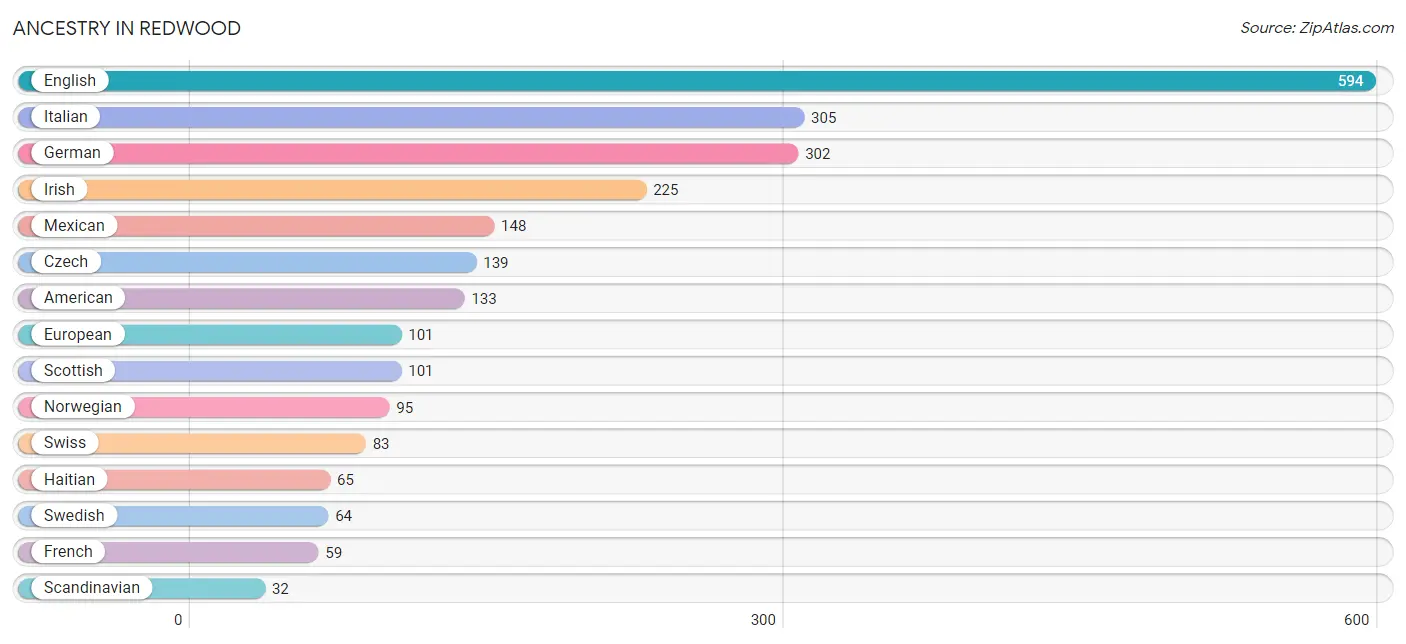
Ancestry in Redwood
The most populous ancestries reported in Redwood are English (594 | 18.1%), Italian (305 | 9.3%), German (302 | 9.2%), Irish (225 | 6.9%), and Mexican (148 | 4.5%), together accounting for 48.1% of all Redwood residents.
| Ancestry | # Population | % Population |
| American | 133 | 4.1% |
| Austrian | 20 | 0.6% |
| British | 29 | 0.9% |
| Czech | 139 | 4.2% |
| Danish | 30 | 0.9% |
| Dutch | 26 | 0.8% |
| Ecuadorian | 27 | 0.8% |
| English | 594 | 18.1% |
| European | 101 | 3.1% |
| French | 59 | 1.8% |
| French Canadian | 21 | 0.6% |
| German | 302 | 9.2% |
| Haitian | 65 | 2.0% |
| Irish | 225 | 6.9% |
| Italian | 305 | 9.3% |
| Latvian | 26 | 0.8% |
| Mexican | 148 | 4.5% |
| Norwegian | 95 | 2.9% |
| Polish | 13 | 0.4% |
| Scandinavian | 32 | 1.0% |
| Scotch-Irish | 14 | 0.4% |
| Scottish | 101 | 3.1% |
| South American | 27 | 0.8% |
| Swedish | 64 | 1.9% |
| Swiss | 83 | 2.5% |
| Ukrainian | 26 | 0.8% | View All 26 Rows |
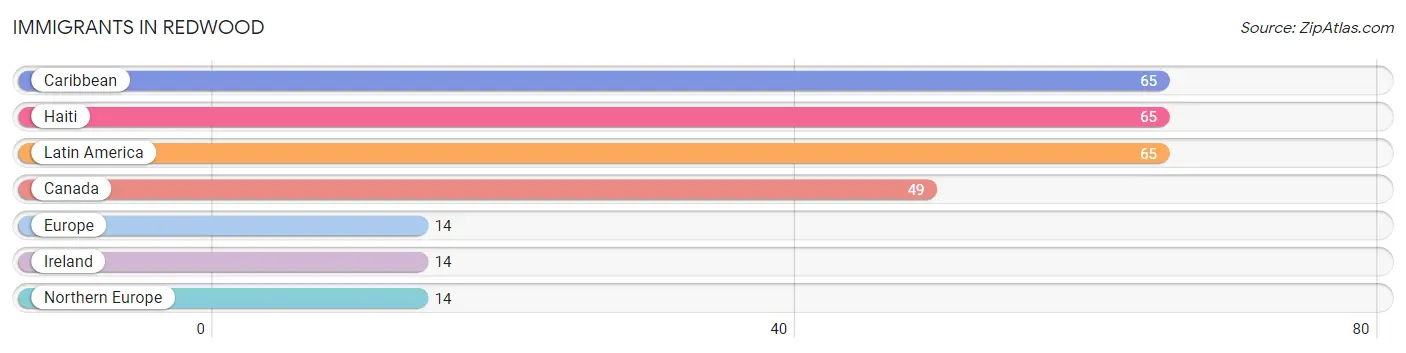
Immigrants in Redwood
The most numerous immigrant groups reported in Redwood came from Caribbean (65 | 2.0%), Haiti (65 | 2.0%), Latin America (65 | 2.0%), Canada (49 | 1.5%), and Europe (14 | 0.4%), together accounting for 7.9% of all Redwood residents.
| Immigration Origin | # Population | % Population |
| Canada | 49 | 1.5% |
| Caribbean | 65 | 2.0% |
| Europe | 14 | 0.4% |
| Haiti | 65 | 2.0% |
| Ireland | 14 | 0.4% |
| Latin America | 65 | 2.0% |
| Northern Europe | 14 | 0.4% | View All 7 Rows |
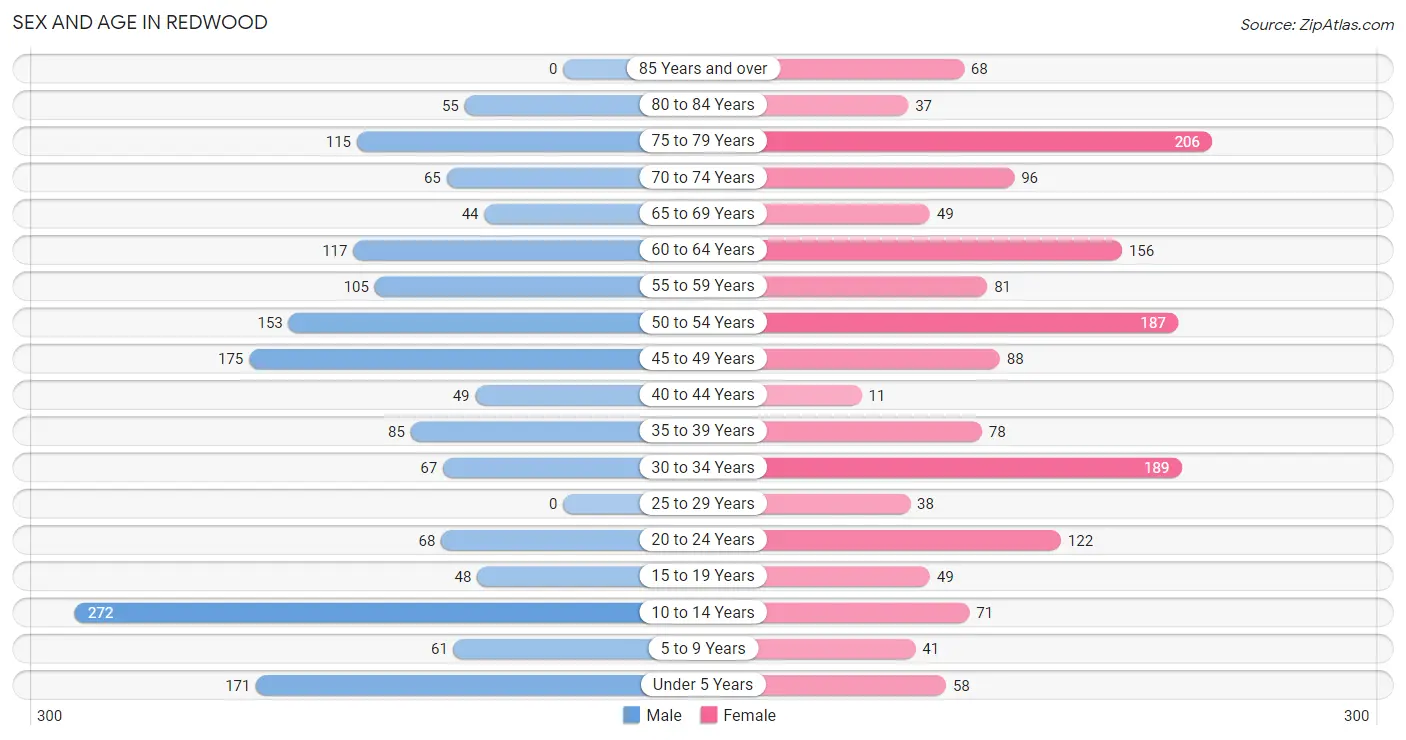
Sex and Age in Redwood
Sex and Age in Redwood
The most populous age groups in Redwood are 10 to 14 Years (272 | 16.5%) for men and 75 to 79 Years (206 | 12.7%) for women.
| Age Bracket | Male | Female |
| Under 5 Years | 171 (10.4%) | 58 (3.6%) |
| 5 to 9 Years | 61 (3.7%) | 41 (2.5%) |
| 10 to 14 Years | 272 (16.5%) | 71 (4.4%) |
| 15 to 19 Years | 48 (2.9%) | 49 (3.0%) |
| 20 to 24 Years | 68 (4.1%) | 122 (7.5%) |
| 25 to 29 Years | 0 (0.0%) | 38 (2.3%) |
| 30 to 34 Years | 67 (4.1%) | 189 (11.6%) |
| 35 to 39 Years | 85 (5.1%) | 78 (4.8%) |
| 40 to 44 Years | 49 (3.0%) | 11 (0.7%) |
| 45 to 49 Years | 175 (10.6%) | 88 (5.4%) |
| 50 to 54 Years | 153 (9.3%) | 187 (11.5%) |
| 55 to 59 Years | 105 (6.4%) | 81 (5.0%) |
| 60 to 64 Years | 117 (7.1%) | 156 (9.6%) |
| 65 to 69 Years | 44 (2.7%) | 49 (3.0%) |
| 70 to 74 Years | 65 (3.9%) | 96 (5.9%) |
| 75 to 79 Years | 115 (7.0%) | 206 (12.7%) |
| 80 to 84 Years | 55 (3.3%) | 37 (2.3%) |
| 85 Years and over | 0 (0.0%) | 68 (4.2%) |
| Total | 1,650 (100.0%) | 1,625 (100.0%) |
Families and Households in Redwood
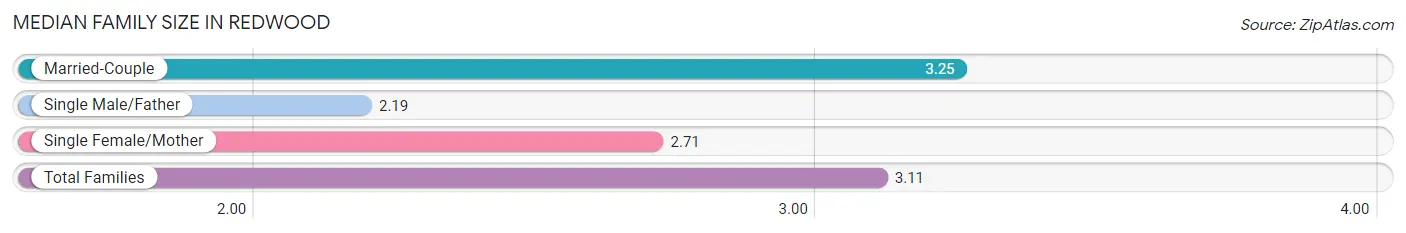
Median Family Size in Redwood
The median family size in Redwood is 3.11 persons per family, with married-couple families (699 | 79.3%) accounting for the largest median family size of 3.25 persons per family. On the other hand, single male/father families (42 | 4.8%) represent the smallest median family size with 2.19 persons per family.
| Family Type | # Families | Family Size |
| Married-Couple | 699 (79.3%) | 3.25 |
| Single Male/Father | 42 (4.8%) | 2.19 |
| Single Female/Mother | 140 (15.9%) | 2.71 |
| Total Families | 881 (100.0%) | 3.11 |
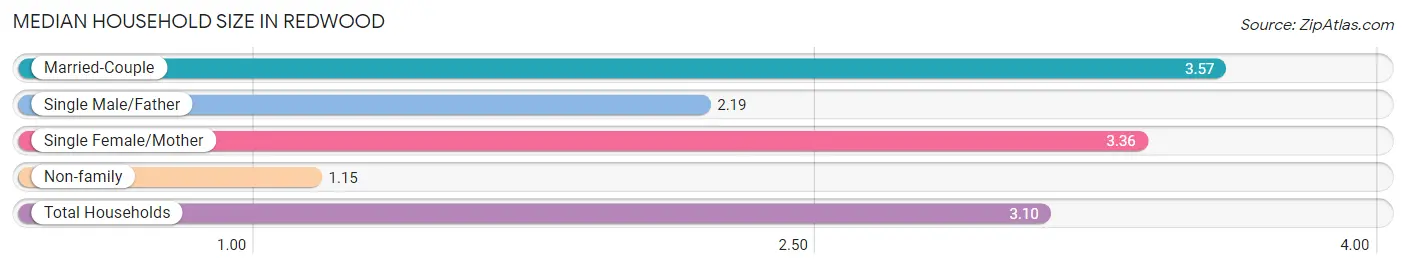
Median Household Size in Redwood
The median household size in Redwood is 3.10 persons per household, with married-couple households (699 | 66.9%) accounting for the largest median household size of 3.57 persons per household. non-family households (164 | 15.7%) represent the smallest median household size with 1.15 persons per household.
| Household Type | # Households | Household Size |
| Married-Couple | 699 (66.9%) | 3.57 |
| Single Male/Father | 42 (4.0%) | 2.19 |
| Single Female/Mother | 140 (13.4%) | 3.36 |
| Non-family | 164 (15.7%) | 1.15 |
| Total Households | 1,045 (100.0%) | 3.10 |
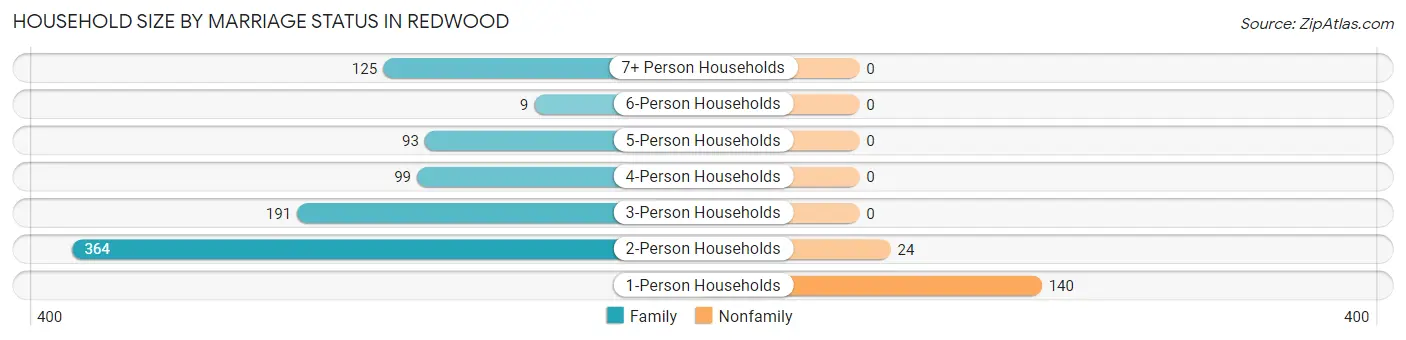
Household Size by Marriage Status in Redwood
Out of a total of 1,045 households in Redwood, 881 (84.3%) are family households, while 164 (15.7%) are nonfamily households. The most numerous type of family households are 2-person households, comprising 364, and the most common type of nonfamily households are 1-person households, comprising 140.
| Household Size | Family Households | Nonfamily Households |
| 1-Person Households | - | 140 (13.4%) |
| 2-Person Households | 364 (34.8%) | 24 (2.3%) |
| 3-Person Households | 191 (18.3%) | 0 (0.0%) |
| 4-Person Households | 99 (9.5%) | 0 (0.0%) |
| 5-Person Households | 93 (8.9%) | 0 (0.0%) |
| 6-Person Households | 9 (0.9%) | 0 (0.0%) |
| 7+ Person Households | 125 (12.0%) | 0 (0.0%) |
| Total | 881 (84.3%) | 164 (15.7%) |
Female Fertility in Redwood
Fertility by Age in Redwood
Average fertility rate in Redwood is 169.0 births per 1,000 women. Women in the age bracket of 20 to 34 years have the highest fertility rate with 304.0 births per 1,000 women. Women in the age bracket of 20 to 34 years acount for 100.0% of all women with births.
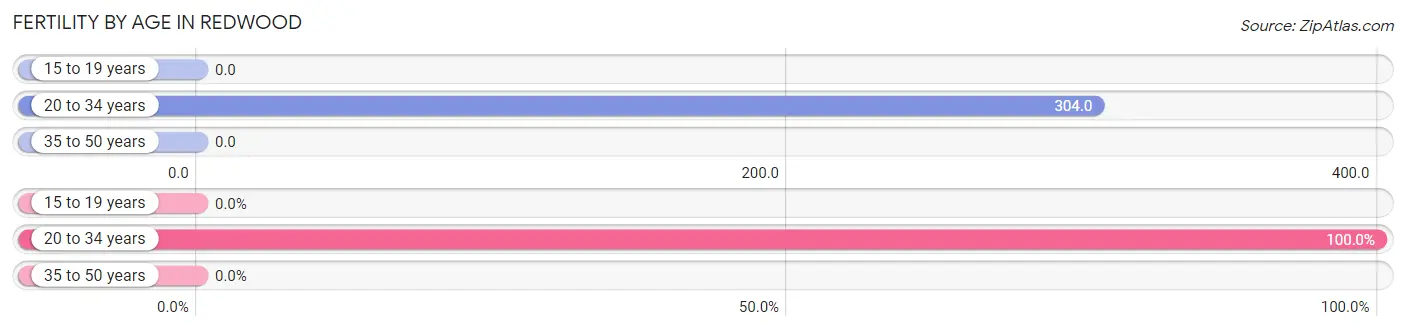
| Age Bracket | Women with Births | Births / 1,000 Women |
| 15 to 19 years | 0 (0.0%) | 0.0 |
| 20 to 34 years | 106 (100.0%) | 304.0 |
| 35 to 50 years | 0 (0.0%) | 0.0 |
| Total | 106 (100.0%) | 169.0 |
Fertility by Age by Marriage Status in Redwood
46.2% of women with births (106) in Redwood are married. The highest percentage of unmarried women with births falls into 20 to 34 years age bracket with 53.8% of them unmarried at the time of birth, while the lowest percentage of unmarried women with births belong to 20 to 34 years age bracket with 53.8% of them unmarried.
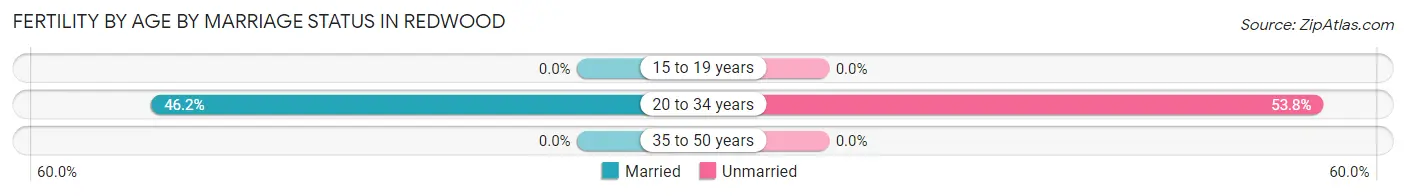
| Age Bracket | Married | Unmarried |
| 15 to 19 years | 0 (0.0%) | 0 (0.0%) |
| 20 to 34 years | 49 (46.2%) | 57 (53.8%) |
| 35 to 50 years | 0 (0.0%) | 0 (0.0%) |
| Total | 49 (46.2%) | 57 (53.8%) |
Fertility by Education in Redwood
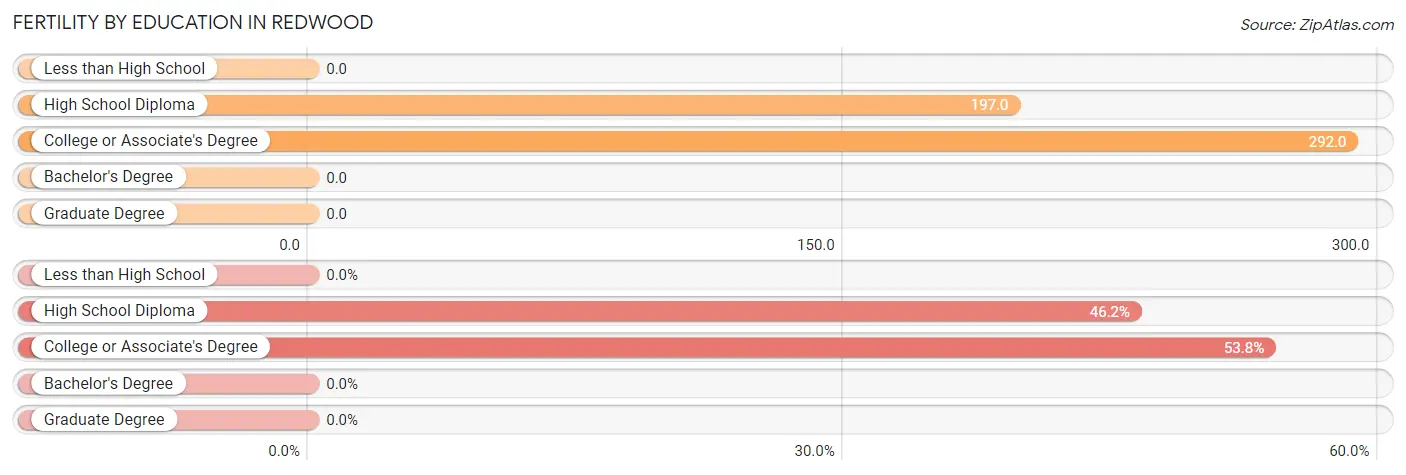
| Educational Attainment | Women with Births | Births / 1,000 Women |
| Less than High School | 0 (0.0%) | 0.0 |
| High School Diploma | 49 (46.2%) | 197.0 |
| College or Associate's Degree | 57 (53.8%) | 292.0 |
| Bachelor's Degree | 0 (0.0%) | 0.0 |
| Graduate Degree | 0 (0.0%) | 0.0 |
| Total | 106 (100.0%) | 169.0 |
Fertility by Education by Marriage Status in Redwood
53.8% of women with births in Redwood are unmarried. Women with the educational attainment of high school diploma are most likely to be married with 100.0% of them married at childbirth, while women with the educational attainment of college or associate's degree are least likely to be married with 100.0% of them unmarried at childbirth.
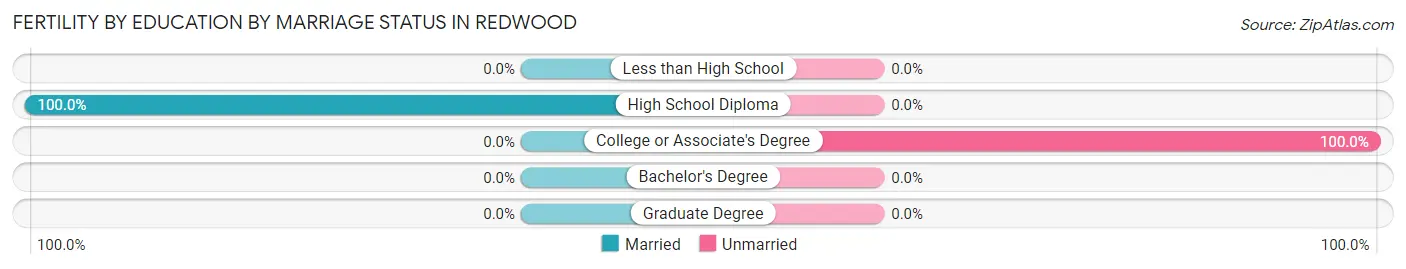
| Educational Attainment | Married | Unmarried |
| Less than High School | 0 (0.0%) | 0 (0.0%) |
| High School Diploma | 49 (100.0%) | 0 (0.0%) |
| College or Associate's Degree | 0 (0.0%) | 57 (100.0%) |
| Bachelor's Degree | 0 (0.0%) | 0 (0.0%) |
| Graduate Degree | 0 (0.0%) | 0 (0.0%) |
| Total | 49 (46.2%) | 57 (53.8%) |
Income in Redwood
Income Overview in Redwood
Per Capita Income in Redwood is $33,323, while median incomes of families and households are $81,250 and $69,393 respectively.
| Characteristic | Number | Measure |
| Per Capita Income | 3,275 | $33,323 |
| Median Family Income | 881 | $81,250 |
| Mean Family Income | 881 | $116,100 |
| Median Household Income | 1,045 | $69,393 |
| Mean Household Income | 1,045 | $109,671 |
| Income Deficit | 881 | $10,213 |
| Wage / Income Gap (%) | 3,275 | 42.72% |
| Wage / Income Gap ($) | 3,275 | 57.28¢ per $1 |
| Gini / Inequality Index | 3,275 | 0.47 |
Earnings by Sex in Redwood
Average Earnings in Redwood are $41,354, $61,875 for men and $35,441 for women, a difference of 42.7%.
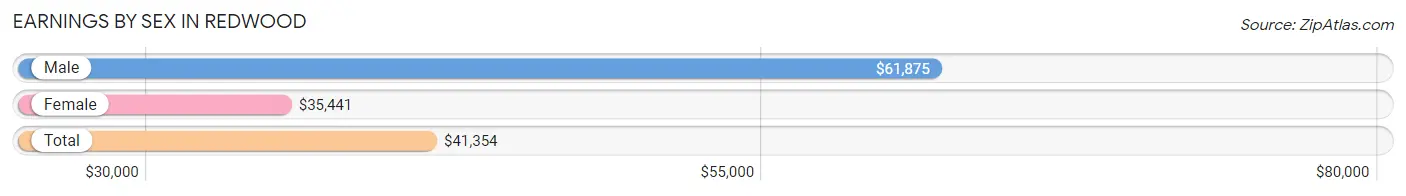
| Sex | Number | Average Earnings |
| Male | 689 (48.6%) | $61,875 |
| Female | 730 (51.4%) | $35,441 |
| Total | 1,419 (100.0%) | $41,354 |
Earnings by Sex by Income Bracket in Redwood
The most common earnings brackets in Redwood are $100,000+ for men (210 | 30.5%) and $17,500 to $19,999 for women (102 | 14.0%).
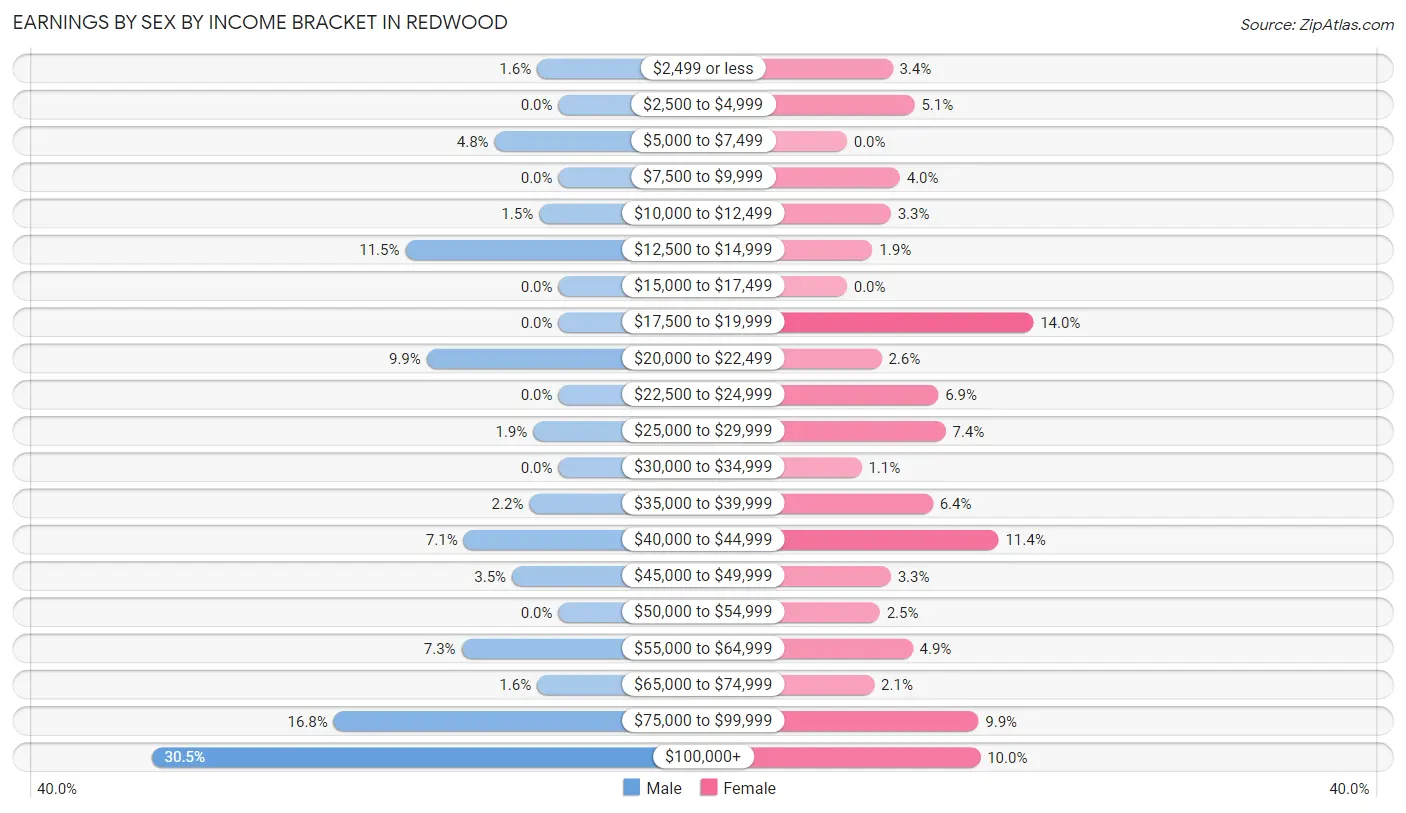
| Income | Male | Female |
| $2,499 or less | 11 (1.6%) | 25 (3.4%) |
| $2,500 to $4,999 | 0 (0.0%) | 37 (5.1%) |
| $5,000 to $7,499 | 33 (4.8%) | 0 (0.0%) |
| $7,500 to $9,999 | 0 (0.0%) | 29 (4.0%) |
| $10,000 to $12,499 | 10 (1.5%) | 24 (3.3%) |
| $12,500 to $14,999 | 79 (11.5%) | 14 (1.9%) |
| $15,000 to $17,499 | 0 (0.0%) | 0 (0.0%) |
| $17,500 to $19,999 | 0 (0.0%) | 102 (14.0%) |
| $20,000 to $22,499 | 68 (9.9%) | 19 (2.6%) |
| $22,500 to $24,999 | 0 (0.0%) | 50 (6.9%) |
| $25,000 to $29,999 | 13 (1.9%) | 54 (7.4%) |
| $30,000 to $34,999 | 0 (0.0%) | 8 (1.1%) |
| $35,000 to $39,999 | 15 (2.2%) | 47 (6.4%) |
| $40,000 to $44,999 | 49 (7.1%) | 83 (11.4%) |
| $45,000 to $49,999 | 24 (3.5%) | 24 (3.3%) |
| $50,000 to $54,999 | 0 (0.0%) | 18 (2.5%) |
| $55,000 to $64,999 | 50 (7.3%) | 36 (4.9%) |
| $65,000 to $74,999 | 11 (1.6%) | 15 (2.1%) |
| $75,000 to $99,999 | 116 (16.8%) | 72 (9.9%) |
| $100,000+ | 210 (30.5%) | 73 (10.0%) |
| Total | 689 (100.0%) | 730 (100.0%) |
Earnings by Sex by Educational Attainment in Redwood
Average earnings in Redwood are $76,500 for men and $40,166 for women, a difference of 47.5%. Men with an educational attainment of college or associate's degree enjoy the highest average annual earnings of $45,260, while those with college or associate's degree education earn the least with $45,260. Women with an educational attainment of college or associate's degree earn the most with the average annual earnings of $40,392, while those with less than high school education have the smallest earnings of $21,607.
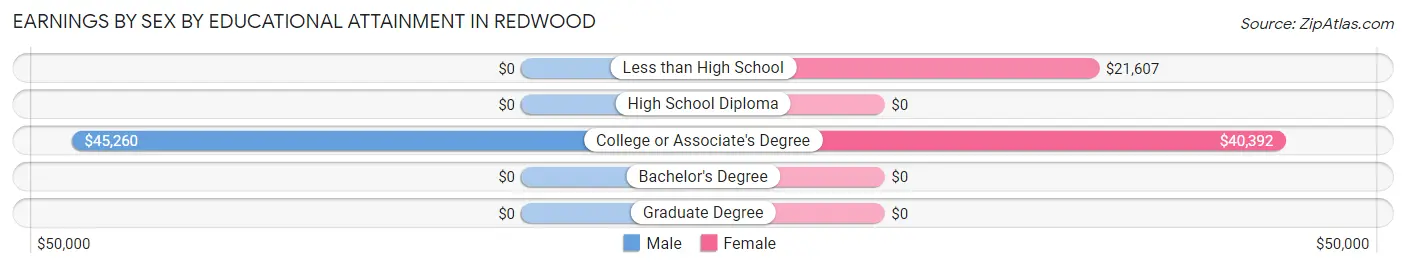
| Educational Attainment | Male Income | Female Income |
| Less than High School | - | - |
| High School Diploma | - | - |
| College or Associate's Degree | $45,260 | $40,392 |
| Bachelor's Degree | - | - |
| Graduate Degree | - | - |
| Total | $76,500 | $40,166 |
Family Income in Redwood
Family Income Brackets in Redwood
According to the Redwood family income data, there are 198 families falling into the $50,000 to $74,999 income range, which is the most common income bracket and makes up 22.5% of all families.
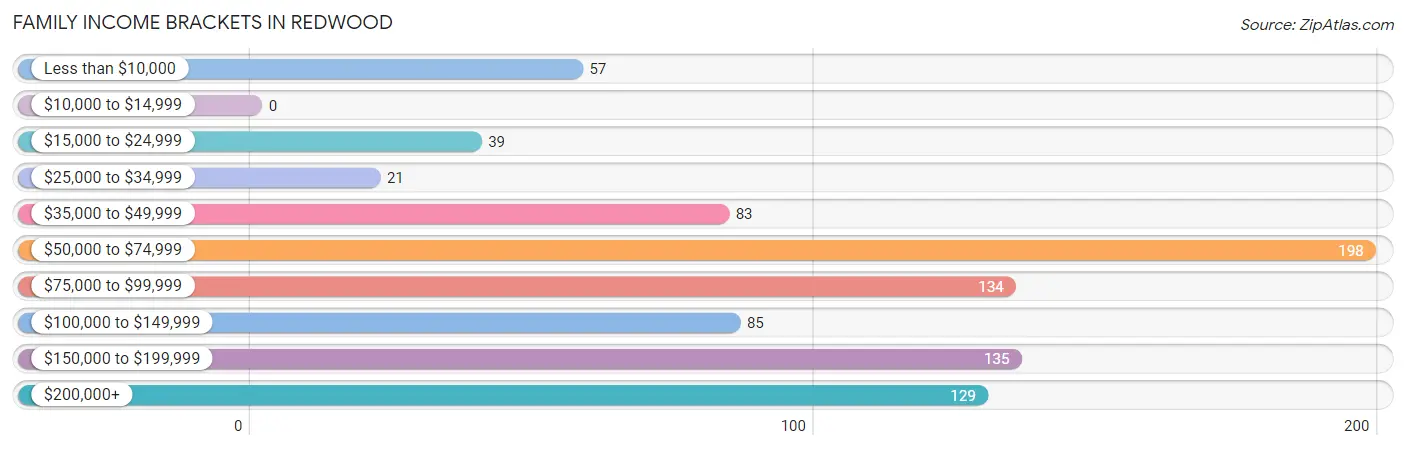
| Income Bracket | # Families | % Families |
| Less than $10,000 | 57 | 6.5% |
| $10,000 to $14,999 | 0 | 0.0% |
| $15,000 to $24,999 | 39 | 4.4% |
| $25,000 to $34,999 | 21 | 2.4% |
| $35,000 to $49,999 | 83 | 9.4% |
| $50,000 to $74,999 | 198 | 22.5% |
| $75,000 to $99,999 | 134 | 15.2% |
| $100,000 to $149,999 | 85 | 9.6% |
| $150,000 to $199,999 | 135 | 15.3% |
| $200,000+ | 129 | 14.6% |
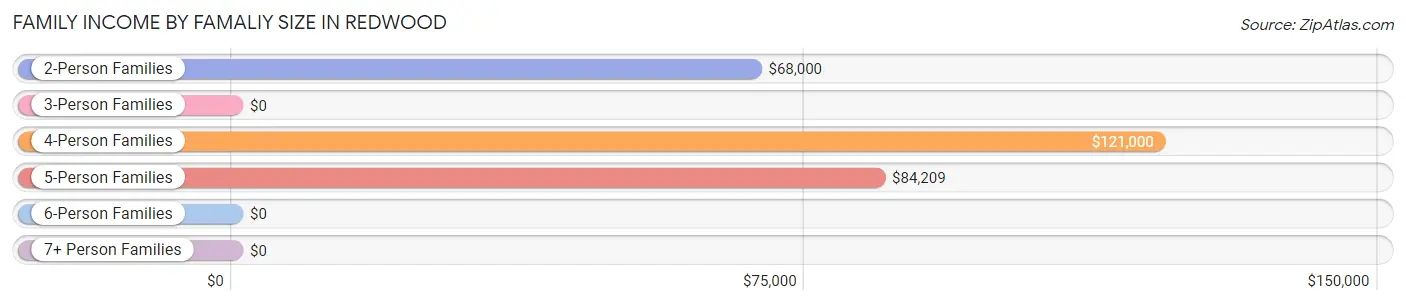
Family Income by Famaliy Size in Redwood
4-person families (42 | 4.8%) account for the highest median family income in Redwood with $121,000 per family, while 2-person families (404 | 45.9%) have the highest median income of $34,000 per family member.
| Income Bracket | # Families | Median Income |
| 2-Person Families | 404 (45.9%) | $68,000 |
| 3-Person Families | 208 (23.6%) | $0 |
| 4-Person Families | 42 (4.8%) | $121,000 |
| 5-Person Families | 155 (17.6%) | $84,209 |
| 6-Person Families | 0 (0.0%) | $0 |
| 7+ Person Families | 72 (8.2%) | $0 |
| Total | 881 (100.0%) | $81,250 |
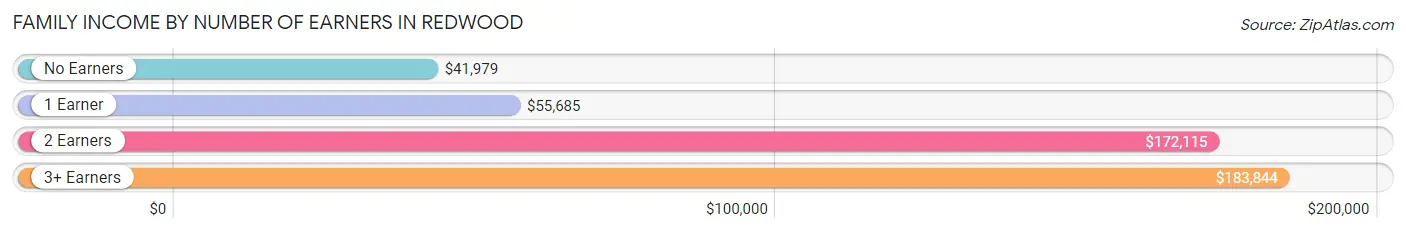
Family Income by Number of Earners in Redwood
The median family income in Redwood is $81,250, with families comprising 3+ earners (87) having the highest median family income of $183,844, while families with no earners (263) have the lowest median family income of $41,979, accounting for 9.9% and 29.8% of families, respectively.
| Number of Earners | # Families | Median Income |
| No Earners | 263 (29.8%) | $41,979 |
| 1 Earner | 169 (19.2%) | $55,685 |
| 2 Earners | 362 (41.1%) | $172,115 |
| 3+ Earners | 87 (9.9%) | $183,844 |
| Total | 881 (100.0%) | $81,250 |
Household Income in Redwood
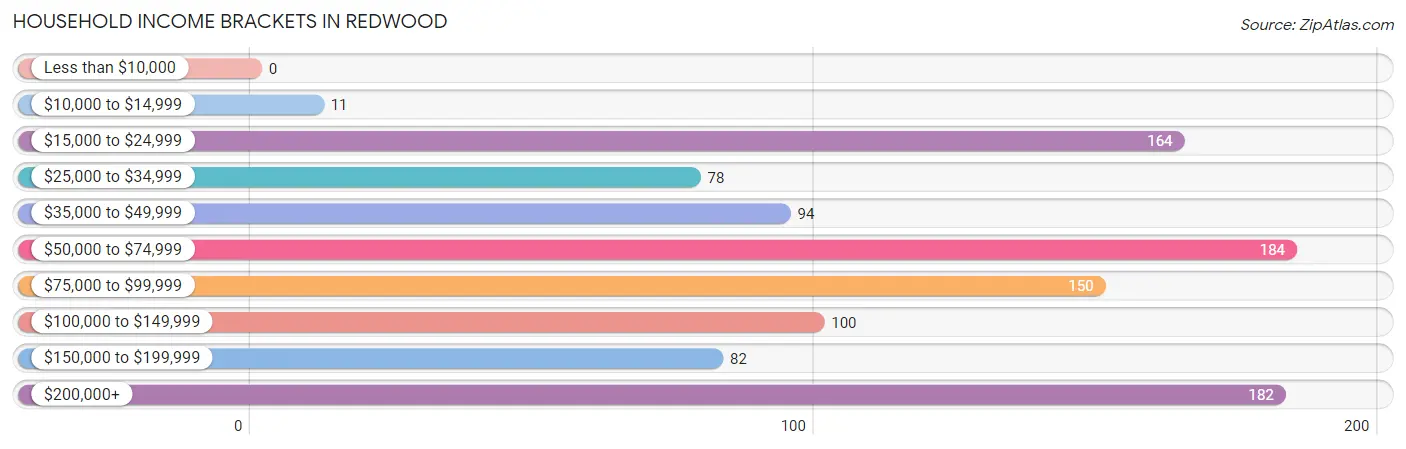
Household Income Brackets in Redwood
With 184 households falling in the category, the $50,000 to $74,999 income range is the most frequent in Redwood, accounting for 17.6% of all households.
| Income Bracket | # Households | % Households |
| Less than $10,000 | 0 | 0.0% |
| $10,000 to $14,999 | 11 | 1.1% |
| $15,000 to $24,999 | 164 | 15.7% |
| $25,000 to $34,999 | 78 | 7.5% |
| $35,000 to $49,999 | 94 | 9.0% |
| $50,000 to $74,999 | 184 | 17.6% |
| $75,000 to $99,999 | 150 | 14.4% |
| $100,000 to $149,999 | 100 | 9.6% |
| $150,000 to $199,999 | 82 | 7.8% |
| $200,000+ | 182 | 17.4% |
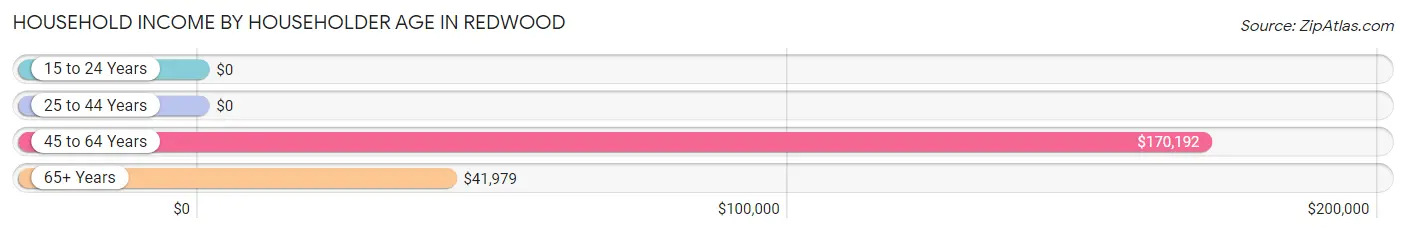
Household Income by Householder Age in Redwood
The median household income in Redwood is $69,393, with the highest median household income of $170,192 found in the 45 to 64 years age bracket for the primary householder. A total of 382 households (36.6%) fall into this category.
| Income Bracket | # Households | Median Income |
| 15 to 24 Years | 0 (0.0%) | $0 |
| 25 to 44 Years | 240 (23.0%) | $0 |
| 45 to 64 Years | 382 (36.6%) | $170,192 |
| 65+ Years | 423 (40.5%) | $41,979 |
| Total | 1,045 (100.0%) | $69,393 |
Poverty in Redwood
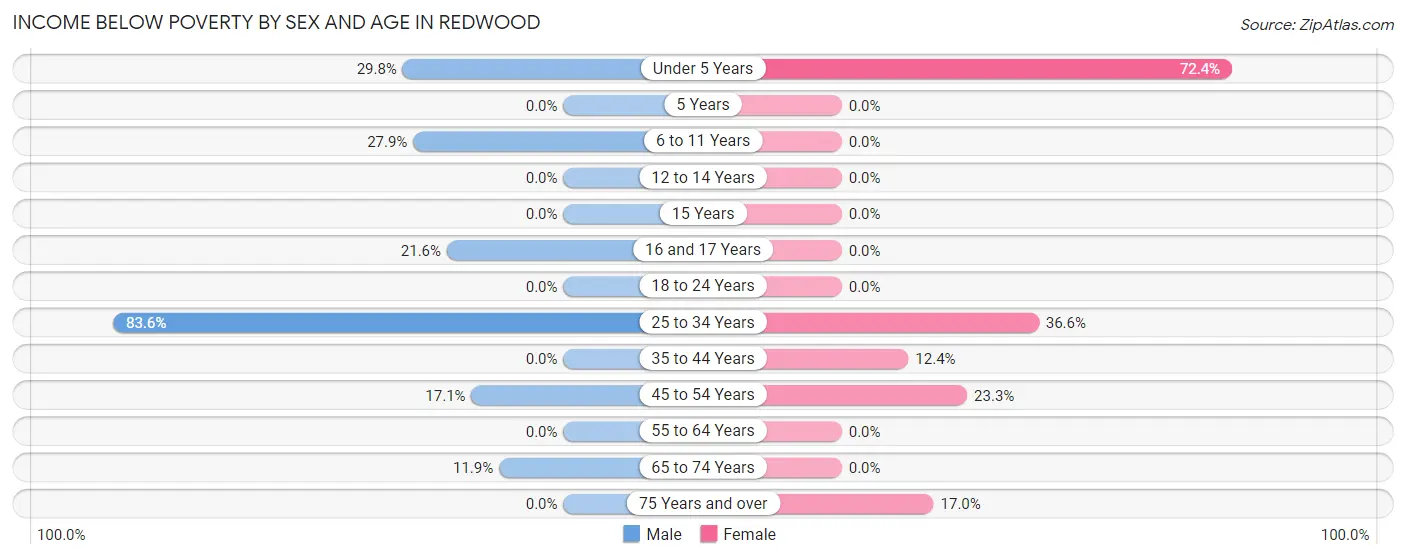
Income Below Poverty by Sex and Age in Redwood
With 12.9% poverty level for males and 15.7% for females among the residents of Redwood, 25 to 34 year old males and under 5 year old females are the most vulnerable to poverty, with 56 males (83.6%) and 42 females (72.4%) in their respective age groups living below the poverty level.
| Age Bracket | Male | Female |
| Under 5 Years | 51 (29.8%) | 42 (72.4%) |
| 5 Years | 0 (0.0%) | 0 (0.0%) |
| 6 to 11 Years | 17 (27.9%) | 0 (0.0%) |
| 12 to 14 Years | 0 (0.0%) | 0 (0.0%) |
| 15 Years | 0 (0.0%) | 0 (0.0%) |
| 16 and 17 Years | 8 (21.6%) | 0 (0.0%) |
| 18 to 24 Years | 0 (0.0%) | 0 (0.0%) |
| 25 to 34 Years | 56 (83.6%) | 83 (36.6%) |
| 35 to 44 Years | 0 (0.0%) | 11 (12.4%) |
| 45 to 54 Years | 56 (17.1%) | 64 (23.3%) |
| 55 to 64 Years | 0 (0.0%) | 0 (0.0%) |
| 65 to 74 Years | 13 (11.9%) | 0 (0.0%) |
| 75 Years and over | 0 (0.0%) | 53 (17.0%) |
| Total | 201 (12.9%) | 253 (15.7%) |
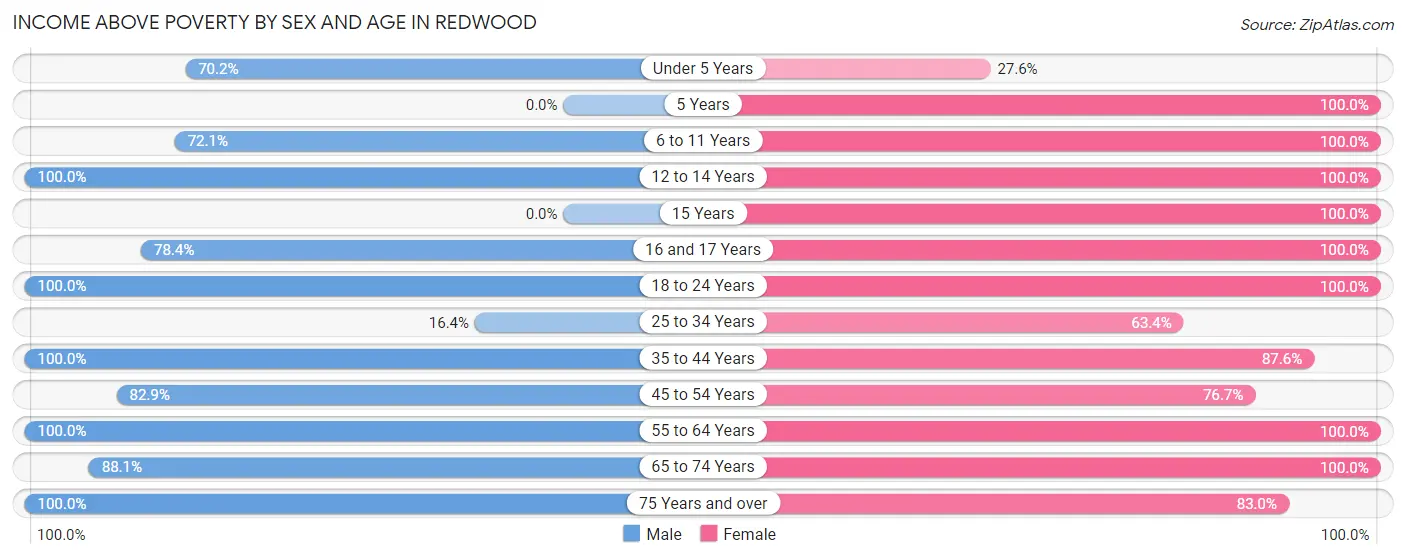
Income Above Poverty by Sex and Age in Redwood
According to the poverty statistics in Redwood, males aged 12 to 14 years and females aged 5 years are the age groups that are most secure financially, with 100.0% of males and 100.0% of females in these age groups living above the poverty line.
| Age Bracket | Male | Female |
| Under 5 Years | 120 (70.2%) | 16 (27.6%) |
| 5 Years | 0 (0.0%) | 10 (100.0%) |
| 6 to 11 Years | 44 (72.1%) | 32 (100.0%) |
| 12 to 14 Years | 183 (100.0%) | 54 (100.0%) |
| 15 Years | 0 (0.0%) | 8 (100.0%) |
| 16 and 17 Years | 29 (78.4%) | 41 (100.0%) |
| 18 to 24 Years | 79 (100.0%) | 122 (100.0%) |
| 25 to 34 Years | 11 (16.4%) | 144 (63.4%) |
| 35 to 44 Years | 134 (100.0%) | 78 (87.6%) |
| 45 to 54 Years | 272 (82.9%) | 211 (76.7%) |
| 55 to 64 Years | 222 (100.0%) | 237 (100.0%) |
| 65 to 74 Years | 96 (88.1%) | 145 (100.0%) |
| 75 Years and over | 170 (100.0%) | 258 (83.0%) |
| Total | 1,360 (87.1%) | 1,356 (84.3%) |
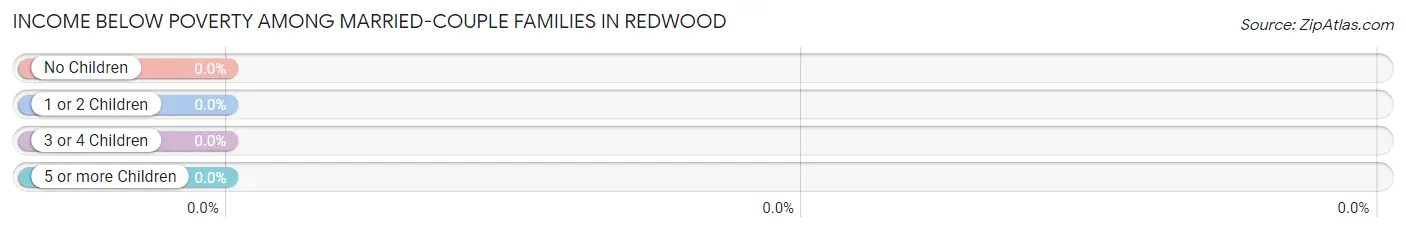
Income Below Poverty Among Married-Couple Families in Redwood
| Children | Above Poverty | Below Poverty |
| No Children | 501 (100.0%) | 0 (0.0%) |
| 1 or 2 Children | 66 (100.0%) | 0 (0.0%) |
| 3 or 4 Children | 60 (100.0%) | 0 (0.0%) |
| 5 or more Children | 72 (100.0%) | 0 (0.0%) |
| Total | 699 (100.0%) | 0 (0.0%) |
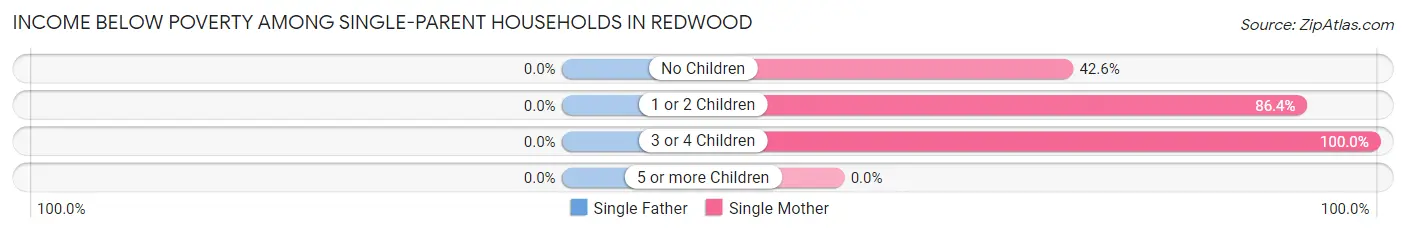
Income Below Poverty Among Single-Parent Households in Redwood
| Children | Single Father | Single Mother |
| No Children | 0 (0.0%) | 26 (42.6%) |
| 1 or 2 Children | 0 (0.0%) | 57 (86.4%) |
| 3 or 4 Children | 0 (0.0%) | 13 (100.0%) |
| 5 or more Children | 0 (0.0%) | 0 (0.0%) |
| Total | 0 (0.0%) | 96 (68.6%) |
Income Below Poverty Among Married-Couple vs Single-Parent Households in Redwood
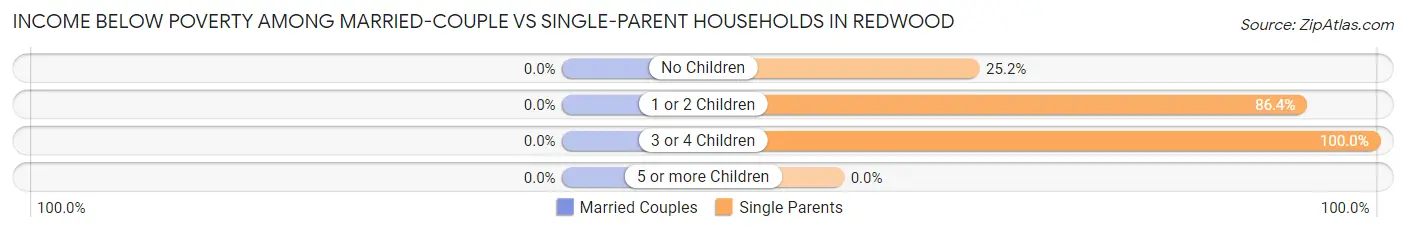
| Children | Married-Couple Families | Single-Parent Households |
| No Children | 0 (0.0%) | 26 (25.2%) |
| 1 or 2 Children | 0 (0.0%) | 57 (86.4%) |
| 3 or 4 Children | 0 (0.0%) | 13 (100.0%) |
| 5 or more Children | 0 (0.0%) | 0 (0.0%) |
| Total | 0 (0.0%) | 96 (52.7%) |
Employment Characteristics in Redwood
Employment by Class of Employer in Redwood
Among the 1,293 employed individuals in Redwood, private company employees (648 | 50.1%), self-employed (not incorporated) (261 | 20.2%), and not-for-profit organizations (132 | 10.2%) make up the most common classes of employment.
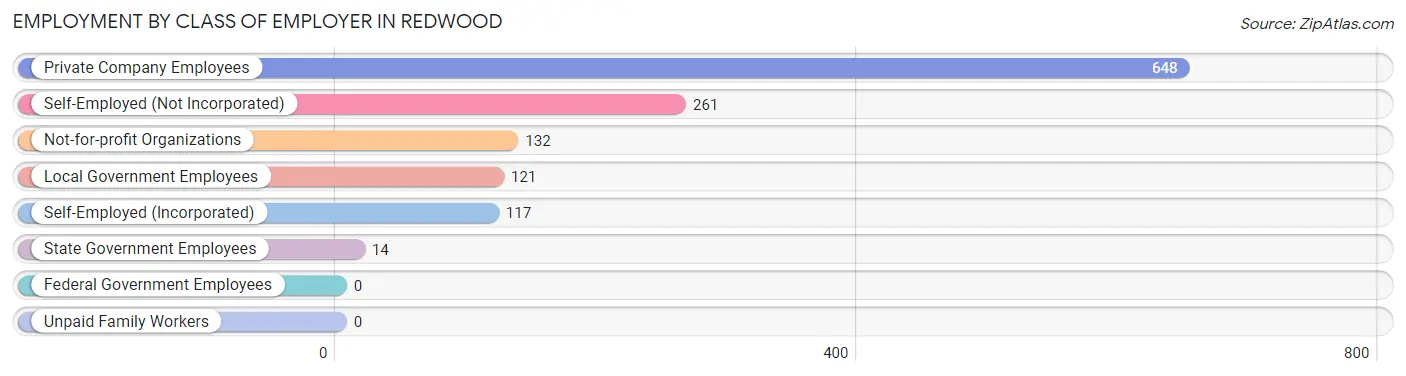
| Employer Class | # Employees | % Employees |
| Private Company Employees | 648 | 50.1% |
| Self-Employed (Incorporated) | 117 | 9.0% |
| Self-Employed (Not Incorporated) | 261 | 20.2% |
| Not-for-profit Organizations | 132 | 10.2% |
| Local Government Employees | 121 | 9.4% |
| State Government Employees | 14 | 1.1% |
| Federal Government Employees | 0 | 0.0% |
| Unpaid Family Workers | 0 | 0.0% |
| Total | 1,293 | 100.0% |
Employment Status by Age in Redwood
According to the labor force statistics for Redwood, out of the total population over 16 years of age (2,593), 57.1% or 1,481 individuals are in the labor force, with 9.2% or 136 of them unemployed. The age group with the highest labor force participation rate is 30 to 34 years, with 100.0% or 256 individuals in the labor force. Within the labor force, the 75 years and over age range has the highest percentage of unemployed individuals, with 40.0% or 26 of them being unemployed.
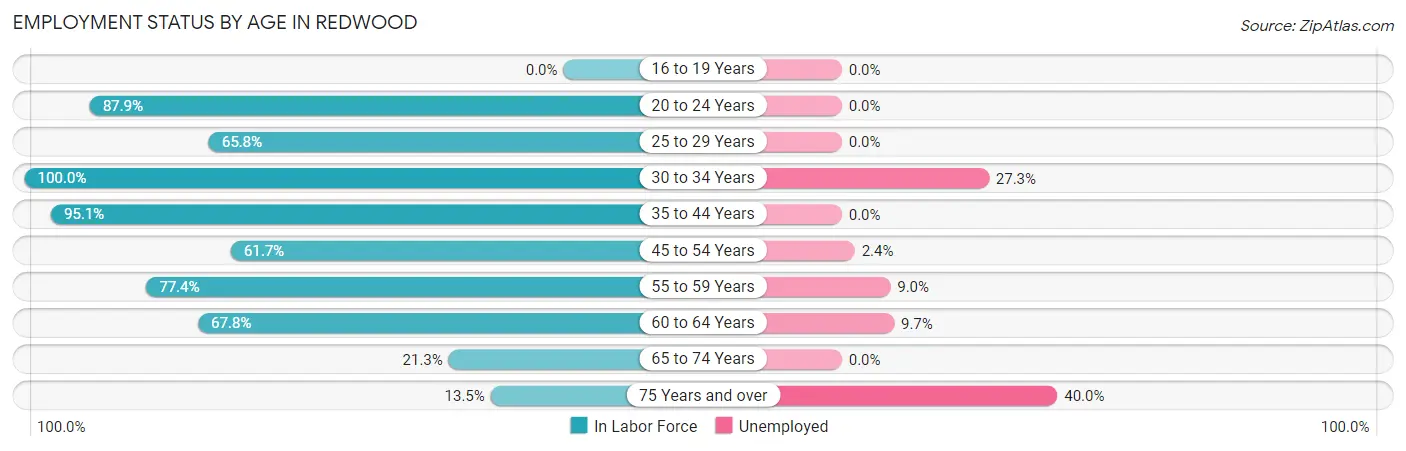
| Age Bracket | In Labor Force | Unemployed |
| 16 to 19 Years | 0 (0.0%) | 0 (0.0%) |
| 20 to 24 Years | 167 (87.9%) | 0 (0.0%) |
| 25 to 29 Years | 25 (65.8%) | 0 (0.0%) |
| 30 to 34 Years | 256 (100.0%) | 70 (27.3%) |
| 35 to 44 Years | 212 (95.1%) | 0 (0.0%) |
| 45 to 54 Years | 372 (61.7%) | 9 (2.4%) |
| 55 to 59 Years | 144 (77.4%) | 13 (9.0%) |
| 60 to 64 Years | 185 (67.8%) | 18 (9.7%) |
| 65 to 74 Years | 54 (21.3%) | 0 (0.0%) |
| 75 Years and over | 65 (13.5%) | 26 (40.0%) |
| Total | 1,481 (57.1%) | 136 (9.2%) |
Employment Status by Educational Attainment in Redwood
According to labor force statistics for Redwood, 75.6% of individuals (1,194) out of the total population between 25 and 64 years of age (1,579) are in the labor force, with 9.2% or 110 of them being unemployed. The group with the highest labor force participation rate are those with the educational attainment of bachelor's degree or higher, with 97.9% or 277 individuals in the labor force. Within the labor force, individuals with college / associate degree education have the highest percentage of unemployment, with 14.5% or 84 of them being unemployed.
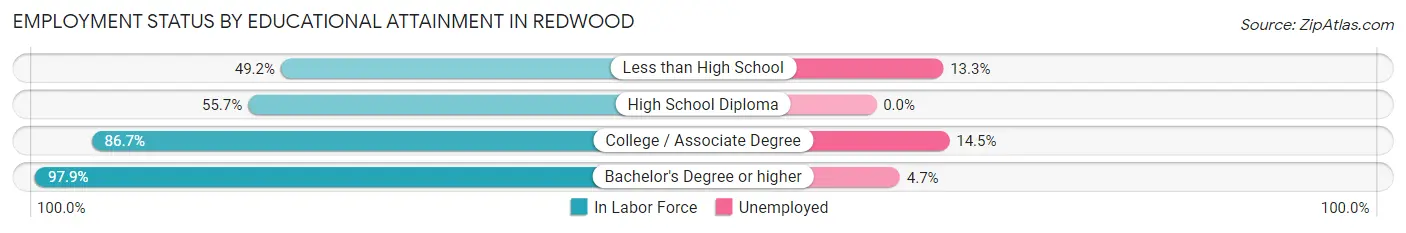
| Educational Attainment | In Labor Force | Unemployed |
| Less than High School | 98 (49.2%) | 26 (13.3%) |
| High School Diploma | 238 (55.7%) | 0 (0.0%) |
| College / Associate Degree | 581 (86.7%) | 97 (14.5%) |
| Bachelor's Degree or higher | 277 (97.9%) | 13 (4.7%) |
| Total | 1,194 (75.6%) | 145 (9.2%) |
Employment Occupations by Sex in Redwood
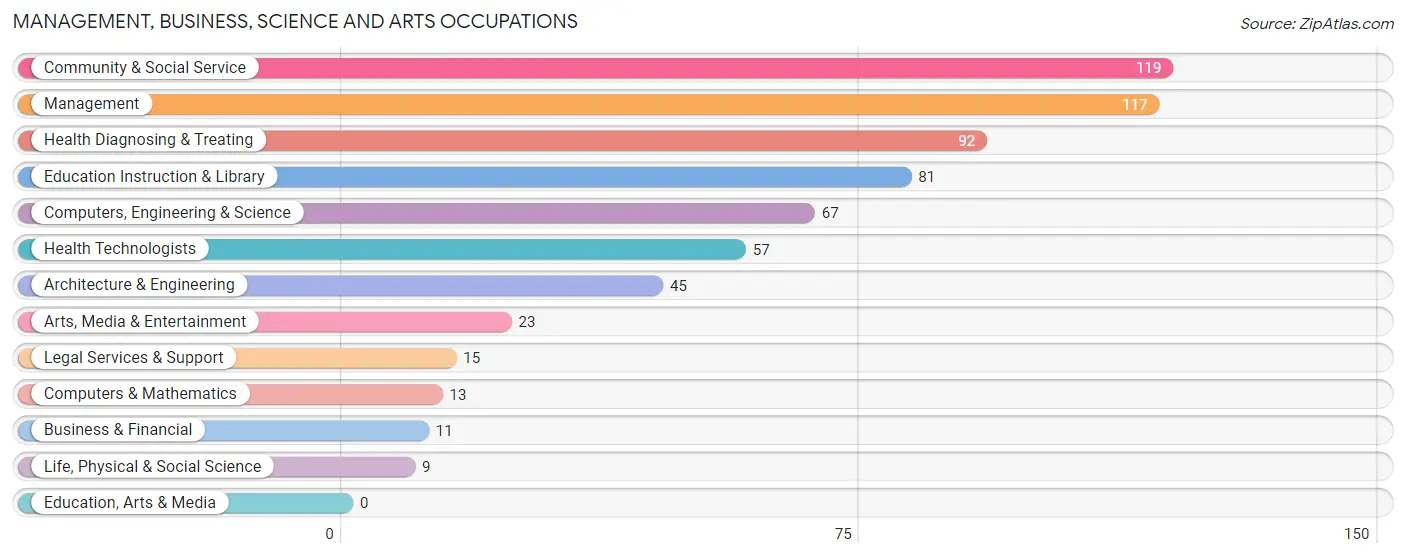
Management, Business, Science and Arts Occupations
The most common Management, Business, Science and Arts occupations in Redwood are Community & Social Service (119 | 8.8%), Management (117 | 8.7%), Health Diagnosing & Treating (92 | 6.9%), Education Instruction & Library (81 | 6.0%), and Computers, Engineering & Science (67 | 5.0%).
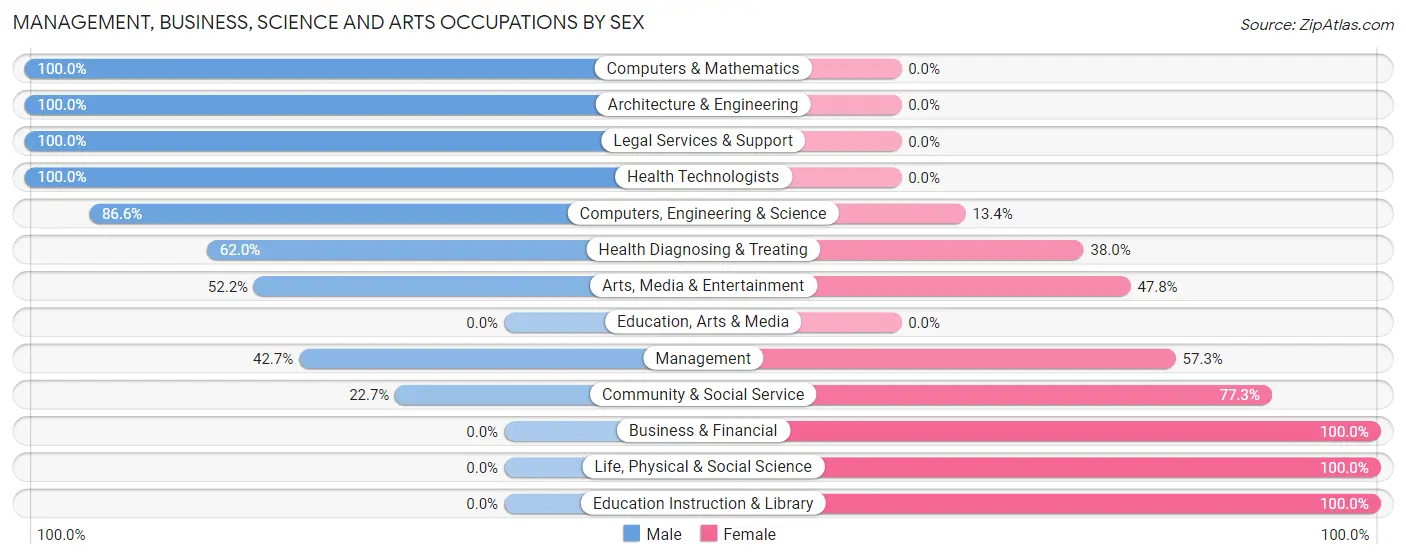
Management, Business, Science and Arts Occupations by Sex
Within the Management, Business, Science and Arts occupations in Redwood, the most male-oriented occupations are Computers & Mathematics (100.0%), Architecture & Engineering (100.0%), and Legal Services & Support (100.0%), while the most female-oriented occupations are Business & Financial (100.0%), Life, Physical & Social Science (100.0%), and Education Instruction & Library (100.0%).
| Occupation | Male | Female |
| Management | 50 (42.7%) | 67 (57.3%) |
| Business & Financial | 0 (0.0%) | 11 (100.0%) |
| Computers, Engineering & Science | 58 (86.6%) | 9 (13.4%) |
| Computers & Mathematics | 13 (100.0%) | 0 (0.0%) |
| Architecture & Engineering | 45 (100.0%) | 0 (0.0%) |
| Life, Physical & Social Science | 0 (0.0%) | 9 (100.0%) |
| Community & Social Service | 27 (22.7%) | 92 (77.3%) |
| Education, Arts & Media | 0 (0.0%) | 0 (0.0%) |
| Legal Services & Support | 15 (100.0%) | 0 (0.0%) |
| Education Instruction & Library | 0 (0.0%) | 81 (100.0%) |
| Arts, Media & Entertainment | 12 (52.2%) | 11 (47.8%) |
| Health Diagnosing & Treating | 57 (62.0%) | 35 (38.0%) |
| Health Technologists | 57 (100.0%) | 0 (0.0%) |
| Total (Category) | 192 (47.3%) | 214 (52.7%) |
| Total (Overall) | 627 (46.7%) | 717 (53.3%) |
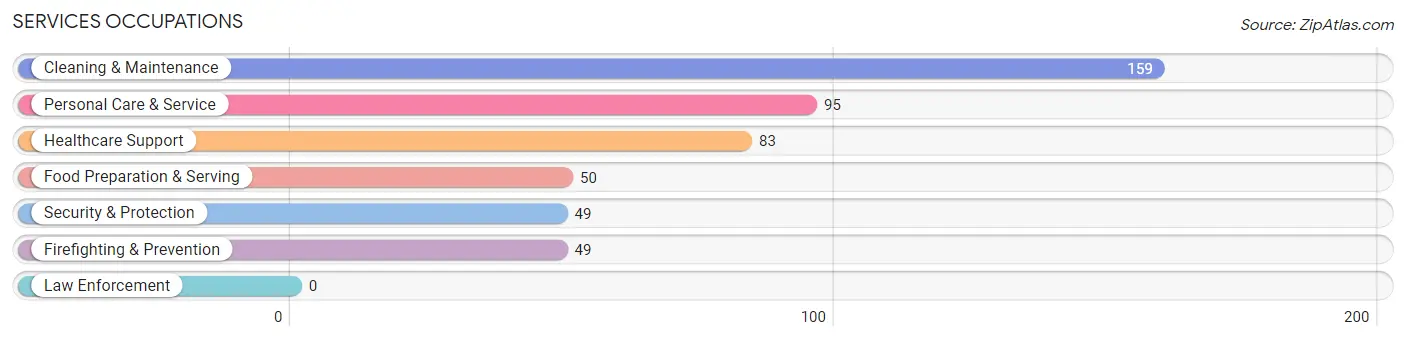
Services Occupations
The most common Services occupations in Redwood are Cleaning & Maintenance (159 | 11.8%), Personal Care & Service (95 | 7.1%), Healthcare Support (83 | 6.2%), Food Preparation & Serving (50 | 3.7%), and Security & Protection (49 | 3.6%).
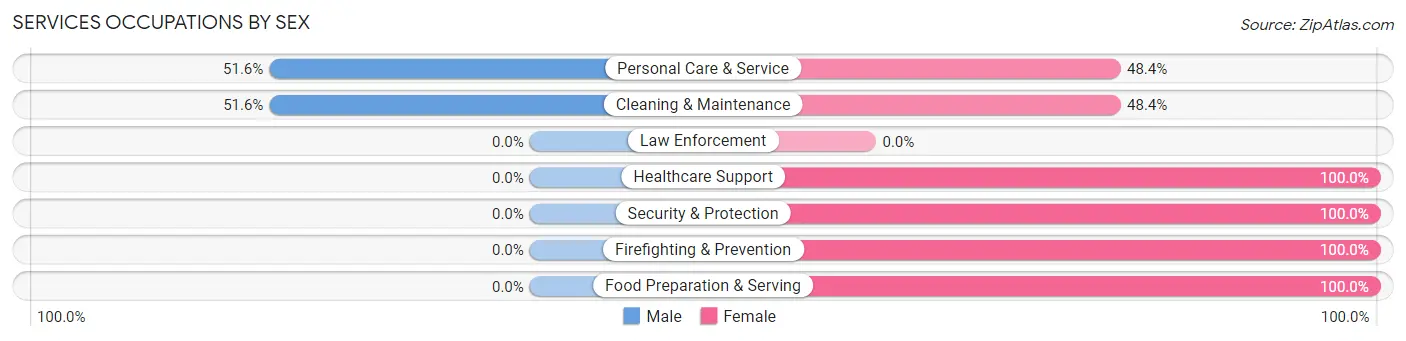
Services Occupations by Sex
Within the Services occupations in Redwood, the most male-oriented occupations are Personal Care & Service (51.6%), and Cleaning & Maintenance (51.6%), while the most female-oriented occupations are Healthcare Support (100.0%), Security & Protection (100.0%), and Firefighting & Prevention (100.0%).
| Occupation | Male | Female |
| Healthcare Support | 0 (0.0%) | 83 (100.0%) |
| Security & Protection | 0 (0.0%) | 49 (100.0%) |
| Firefighting & Prevention | 0 (0.0%) | 49 (100.0%) |
| Law Enforcement | 0 (0.0%) | 0 (0.0%) |
| Food Preparation & Serving | 0 (0.0%) | 50 (100.0%) |
| Cleaning & Maintenance | 82 (51.6%) | 77 (48.4%) |
| Personal Care & Service | 49 (51.6%) | 46 (48.4%) |
| Total (Category) | 131 (30.0%) | 305 (70.0%) |
| Total (Overall) | 627 (46.7%) | 717 (53.3%) |
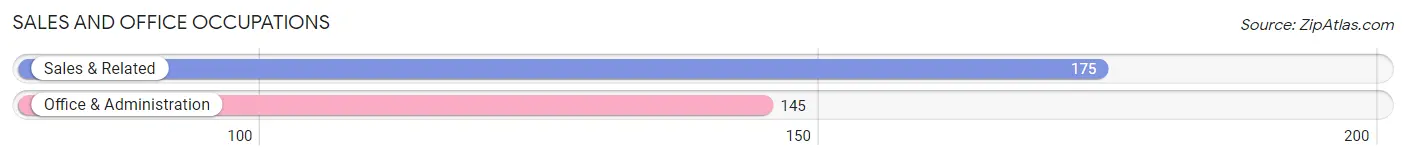
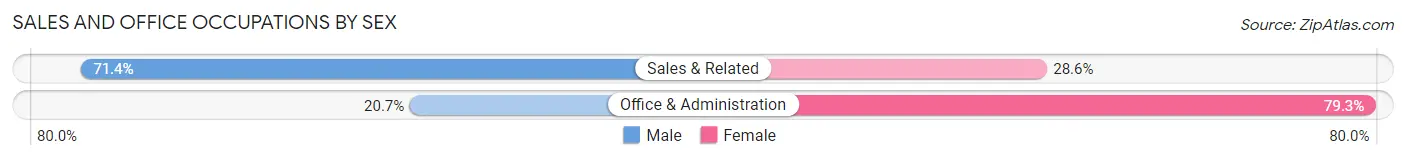
Sales and Office Occupations
The most common Sales and Office occupations in Redwood are Sales & Related (175 | 13.0%), and Office & Administration (145 | 10.8%).
Sales and Office Occupations by Sex
| Occupation | Male | Female |
| Sales & Related | 125 (71.4%) | 50 (28.6%) |
| Office & Administration | 30 (20.7%) | 115 (79.3%) |
| Total (Category) | 155 (48.4%) | 165 (51.6%) |
| Total (Overall) | 627 (46.7%) | 717 (53.3%) |
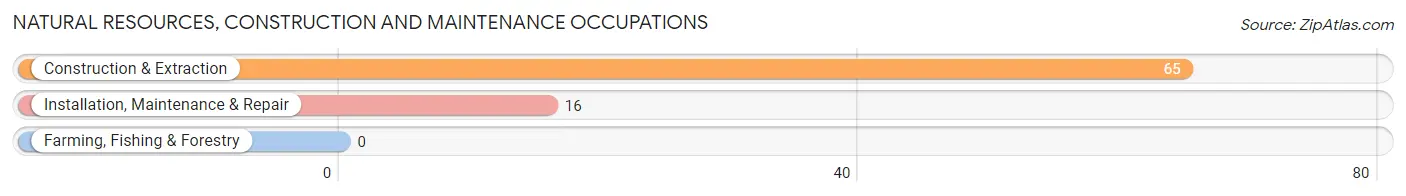
Natural Resources, Construction and Maintenance Occupations
The most common Natural Resources, Construction and Maintenance occupations in Redwood are Construction & Extraction (65 | 4.8%), and Installation, Maintenance & Repair (16 | 1.2%).
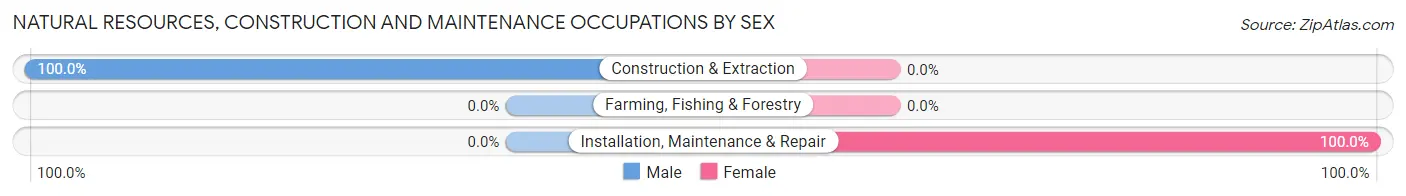
Natural Resources, Construction and Maintenance Occupations by Sex
| Occupation | Male | Female |
| Farming, Fishing & Forestry | 0 (0.0%) | 0 (0.0%) |
| Construction & Extraction | 65 (100.0%) | 0 (0.0%) |
| Installation, Maintenance & Repair | 0 (0.0%) | 16 (100.0%) |
| Total (Category) | 65 (80.2%) | 16 (19.8%) |
| Total (Overall) | 627 (46.7%) | 717 (53.3%) |
Production, Transportation and Moving Occupations
The most common Production, Transportation and Moving occupations in Redwood are Material Moving (49 | 3.6%), Production (30 | 2.2%), and Transportation (22 | 1.6%).
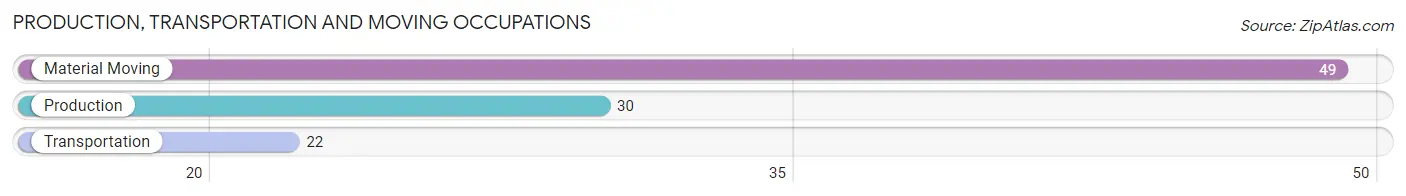
Production, Transportation and Moving Occupations by Sex
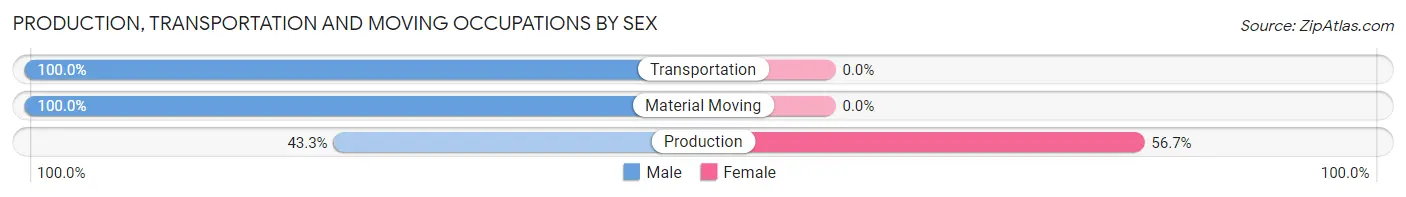
| Occupation | Male | Female |
| Production | 13 (43.3%) | 17 (56.7%) |
| Transportation | 22 (100.0%) | 0 (0.0%) |
| Material Moving | 49 (100.0%) | 0 (0.0%) |
| Total (Category) | 84 (83.2%) | 17 (16.8%) |
| Total (Overall) | 627 (46.7%) | 717 (53.3%) |
Employment Industries by Sex in Redwood
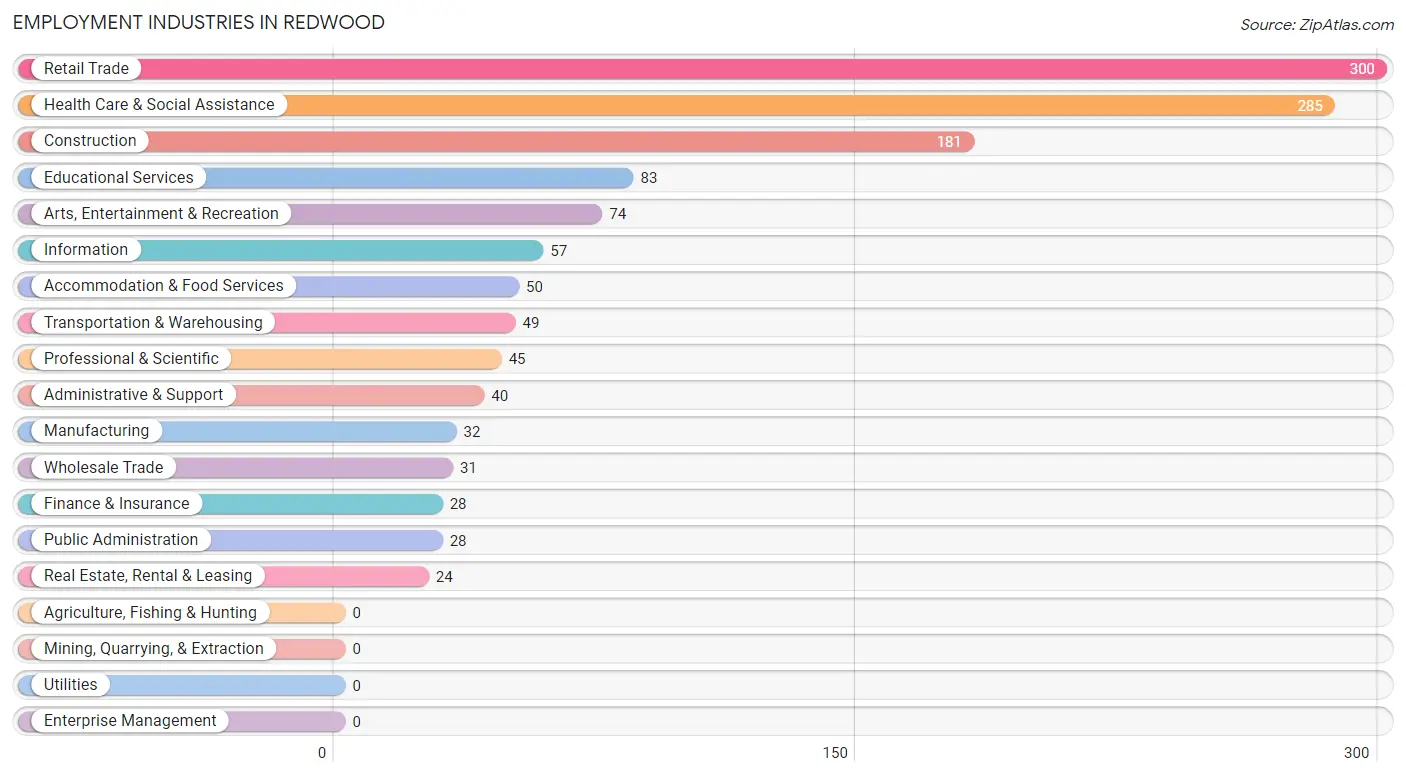
Employment Industries in Redwood
The major employment industries in Redwood include Retail Trade (300 | 22.3%), Health Care & Social Assistance (285 | 21.2%), Construction (181 | 13.5%), Educational Services (83 | 6.2%), and Arts, Entertainment & Recreation (74 | 5.5%).
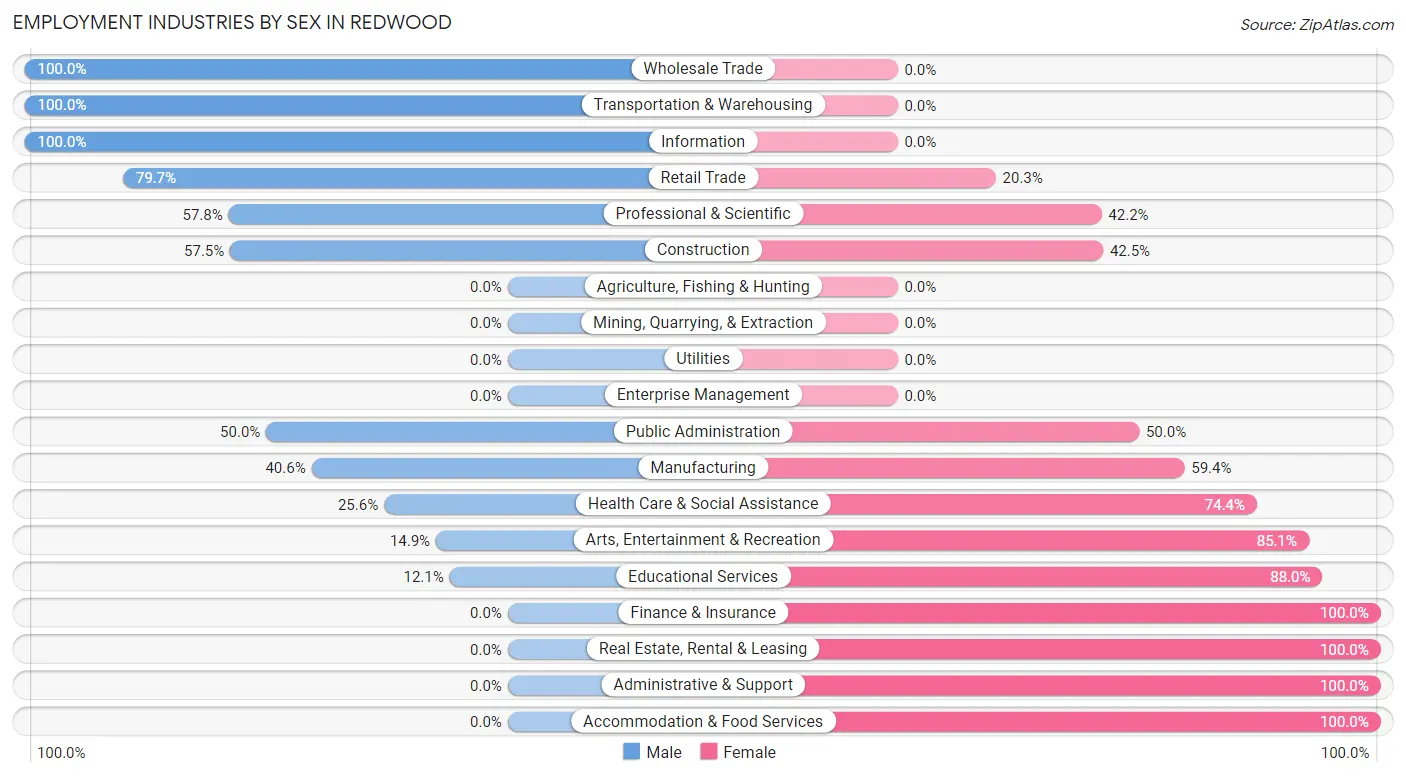
Employment Industries by Sex in Redwood
The Redwood industries that see more men than women are Wholesale Trade (100.0%), Transportation & Warehousing (100.0%), and Information (100.0%), whereas the industries that tend to have a higher number of women are Finance & Insurance (100.0%), Real Estate, Rental & Leasing (100.0%), and Administrative & Support (100.0%).
| Industry | Male | Female |
| Agriculture, Fishing & Hunting | 0 (0.0%) | 0 (0.0%) |
| Mining, Quarrying, & Extraction | 0 (0.0%) | 0 (0.0%) |
| Construction | 104 (57.5%) | 77 (42.5%) |
| Manufacturing | 13 (40.6%) | 19 (59.4%) |
| Wholesale Trade | 31 (100.0%) | 0 (0.0%) |
| Retail Trade | 239 (79.7%) | 61 (20.3%) |
| Transportation & Warehousing | 49 (100.0%) | 0 (0.0%) |
| Utilities | 0 (0.0%) | 0 (0.0%) |
| Information | 57 (100.0%) | 0 (0.0%) |
| Finance & Insurance | 0 (0.0%) | 28 (100.0%) |
| Real Estate, Rental & Leasing | 0 (0.0%) | 24 (100.0%) |
| Professional & Scientific | 26 (57.8%) | 19 (42.2%) |
| Enterprise Management | 0 (0.0%) | 0 (0.0%) |
| Administrative & Support | 0 (0.0%) | 40 (100.0%) |
| Educational Services | 10 (12.0%) | 73 (87.9%) |
| Health Care & Social Assistance | 73 (25.6%) | 212 (74.4%) |
| Arts, Entertainment & Recreation | 11 (14.9%) | 63 (85.1%) |
| Accommodation & Food Services | 0 (0.0%) | 50 (100.0%) |
| Public Administration | 14 (50.0%) | 14 (50.0%) |
| Total | 627 (46.7%) | 717 (53.3%) |
Education in Redwood
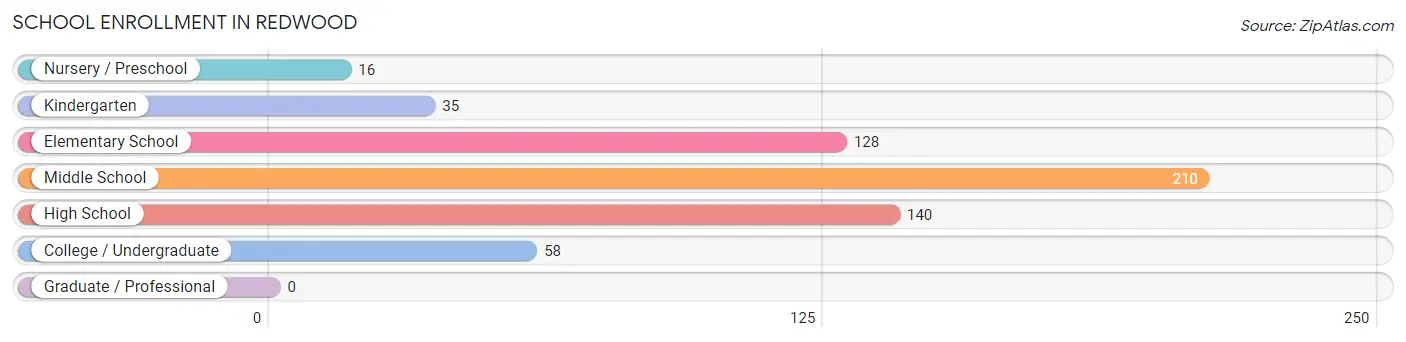
School Enrollment in Redwood
The most common levels of schooling among the 587 students in Redwood are middle school (210 | 35.8%), high school (140 | 23.8%), and elementary school (128 | 21.8%).
| School Level | # Students | % Students |
| Nursery / Preschool | 16 | 2.7% |
| Kindergarten | 35 | 6.0% |
| Elementary School | 128 | 21.8% |
| Middle School | 210 | 35.8% |
| High School | 140 | 23.8% |
| College / Undergraduate | 58 | 9.9% |
| Graduate / Professional | 0 | 0.0% |
| Total | 587 | 100.0% |
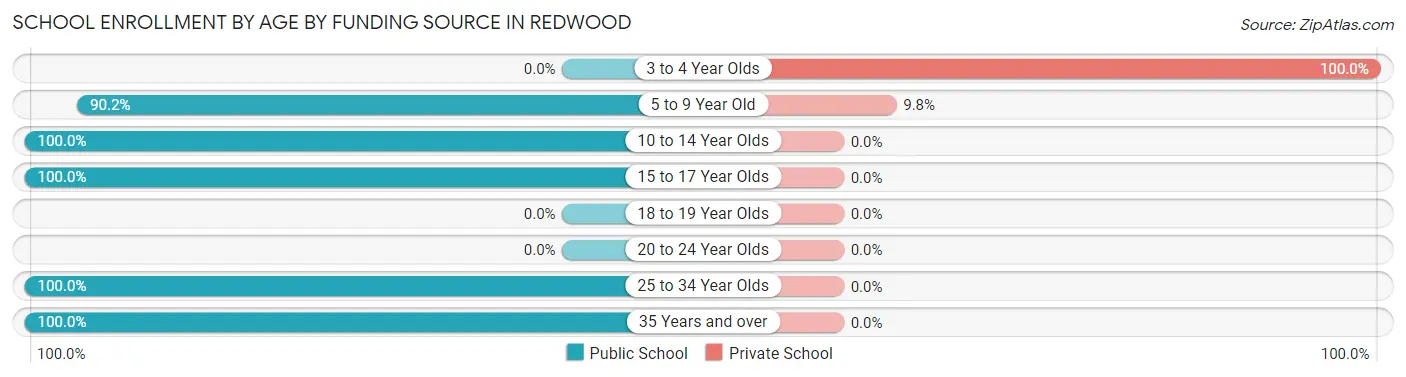
School Enrollment by Age by Funding Source in Redwood
Out of a total of 587 students who are enrolled in schools in Redwood, 26 (4.4%) attend a private institution, while the remaining 561 (95.6%) are enrolled in public schools. The age group of 3 to 4 year olds has the highest likelihood of being enrolled in private schools, with 16 (100.0% in the age bracket) enrolled. Conversely, the age group of 10 to 14 year olds has the lowest likelihood of being enrolled in a private school, with 343 (100.0% in the age bracket) attending a public institution.
| Age Bracket | Public School | Private School |
| 3 to 4 Year Olds | 0 (0.0%) | 16 (100.0%) |
| 5 to 9 Year Old | 92 (90.2%) | 10 (9.8%) |
| 10 to 14 Year Olds | 343 (100.0%) | 0 (0.0%) |
| 15 to 17 Year Olds | 57 (100.0%) | 0 (0.0%) |
| 18 to 19 Year Olds | 0 (0.0%) | 0 (0.0%) |
| 20 to 24 Year Olds | 0 (0.0%) | 0 (0.0%) |
| 25 to 34 Year Olds | 47 (100.0%) | 0 (0.0%) |
| 35 Years and over | 22 (100.0%) | 0 (0.0%) |
| Total | 561 (95.6%) | 26 (4.4%) |
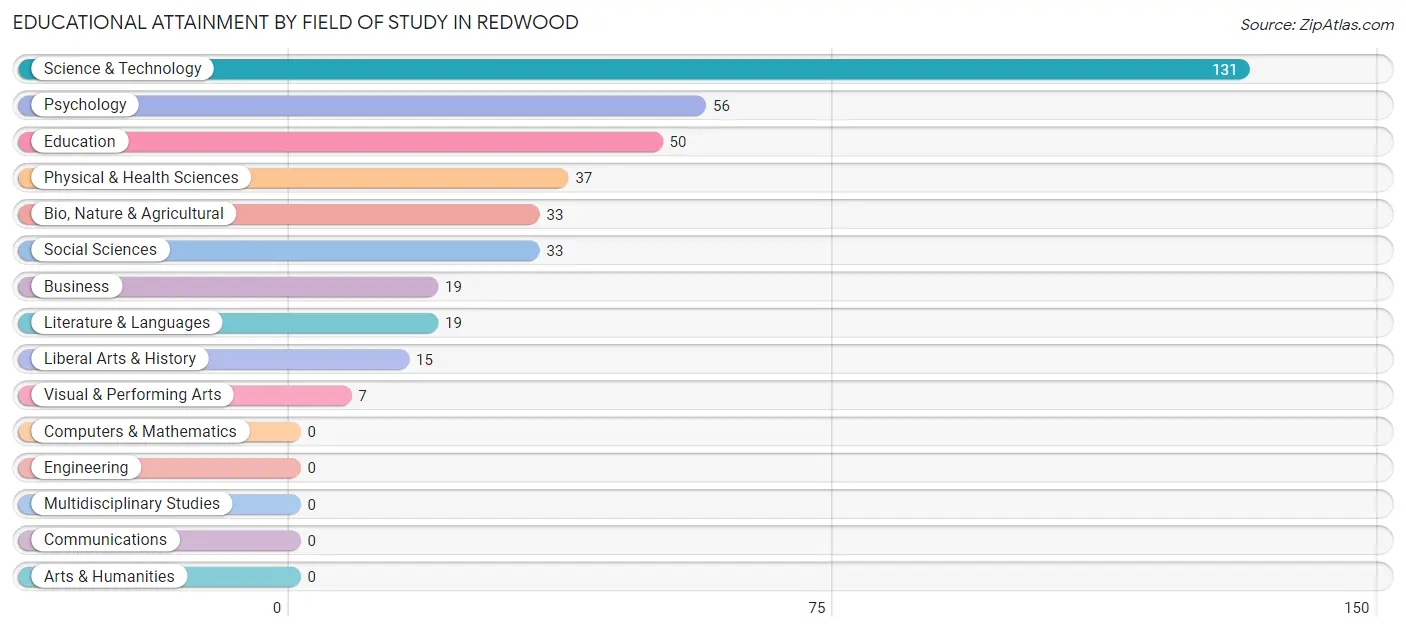
Educational Attainment by Field of Study in Redwood
Science & technology (131 | 32.8%), psychology (56 | 14.0%), education (50 | 12.5%), physical & health sciences (37 | 9.2%), and bio, nature & agricultural (33 | 8.3%) are the most common fields of study among 400 individuals in Redwood who have obtained a bachelor's degree or higher.
| Field of Study | # Graduates | % Graduates |
| Computers & Mathematics | 0 | 0.0% |
| Bio, Nature & Agricultural | 33 | 8.3% |
| Physical & Health Sciences | 37 | 9.2% |
| Psychology | 56 | 14.0% |
| Social Sciences | 33 | 8.3% |
| Engineering | 0 | 0.0% |
| Multidisciplinary Studies | 0 | 0.0% |
| Science & Technology | 131 | 32.8% |
| Business | 19 | 4.8% |
| Education | 50 | 12.5% |
| Literature & Languages | 19 | 4.8% |
| Liberal Arts & History | 15 | 3.7% |
| Visual & Performing Arts | 7 | 1.8% |
| Communications | 0 | 0.0% |
| Arts & Humanities | 0 | 0.0% |
| Total | 400 | 100.0% |
Transportation & Commute in Redwood
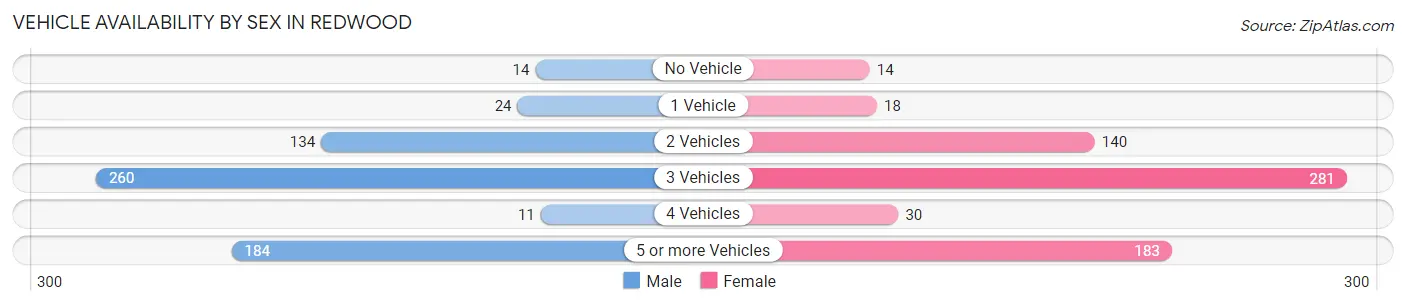
Vehicle Availability by Sex in Redwood
The most prevalent vehicle ownership categories in Redwood are males with 3 vehicles (260, accounting for 41.5%) and females with 3 vehicles (281, making up 39.0%).
| Vehicles Available | Male | Female |
| No Vehicle | 14 (2.2%) | 14 (2.1%) |
| 1 Vehicle | 24 (3.8%) | 18 (2.7%) |
| 2 Vehicles | 134 (21.4%) | 140 (21.0%) |
| 3 Vehicles | 260 (41.5%) | 281 (42.2%) |
| 4 Vehicles | 11 (1.8%) | 30 (4.5%) |
| 5 or more Vehicles | 184 (29.3%) | 183 (27.5%) |
| Total | 627 (100.0%) | 666 (100.0%) |
Commute Time in Redwood
The most frequently occuring commute durations in Redwood are 15 to 19 minutes (333 commuters, 31.0%), 5 to 9 minutes (236 commuters, 22.0%), and 20 to 24 minutes (177 commuters, 16.5%).
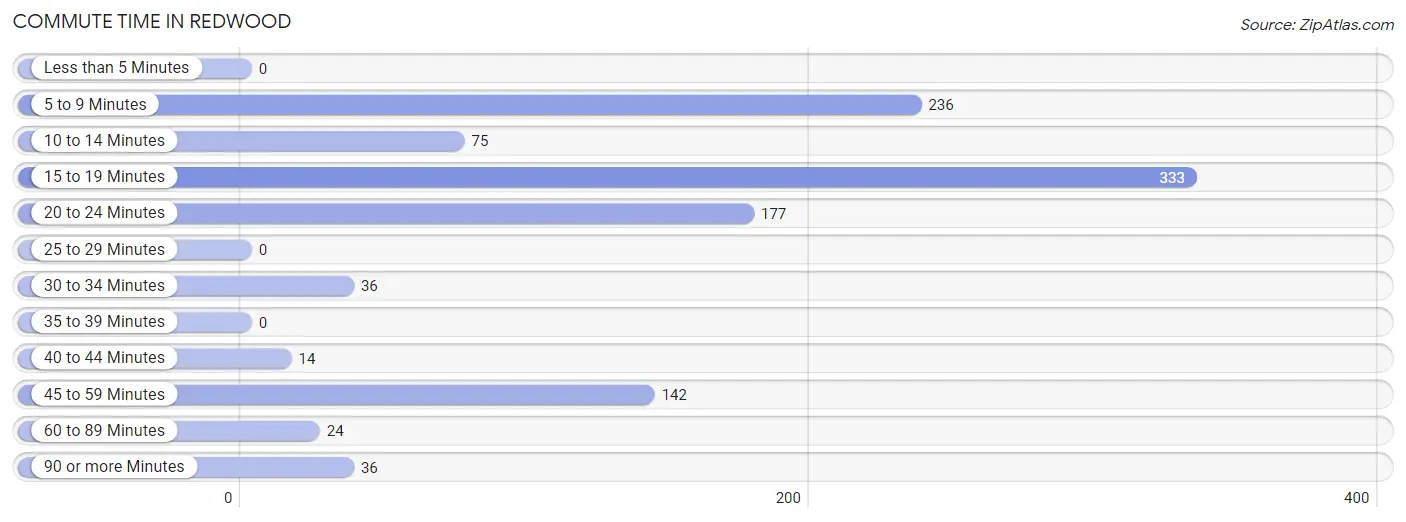
| Commute Time | # Commuters | % Commuters |
| Less than 5 Minutes | 0 | 0.0% |
| 5 to 9 Minutes | 236 | 22.0% |
| 10 to 14 Minutes | 75 | 7.0% |
| 15 to 19 Minutes | 333 | 31.0% |
| 20 to 24 Minutes | 177 | 16.5% |
| 25 to 29 Minutes | 0 | 0.0% |
| 30 to 34 Minutes | 36 | 3.4% |
| 35 to 39 Minutes | 0 | 0.0% |
| 40 to 44 Minutes | 14 | 1.3% |
| 45 to 59 Minutes | 142 | 13.2% |
| 60 to 89 Minutes | 24 | 2.2% |
| 90 or more Minutes | 36 | 3.4% |
Commute Time by Sex in Redwood
The most common commute times in Redwood are 5 to 9 minutes (165 commuters, 33.1%) for males and 15 to 19 minutes (242 commuters, 42.2%) for females.
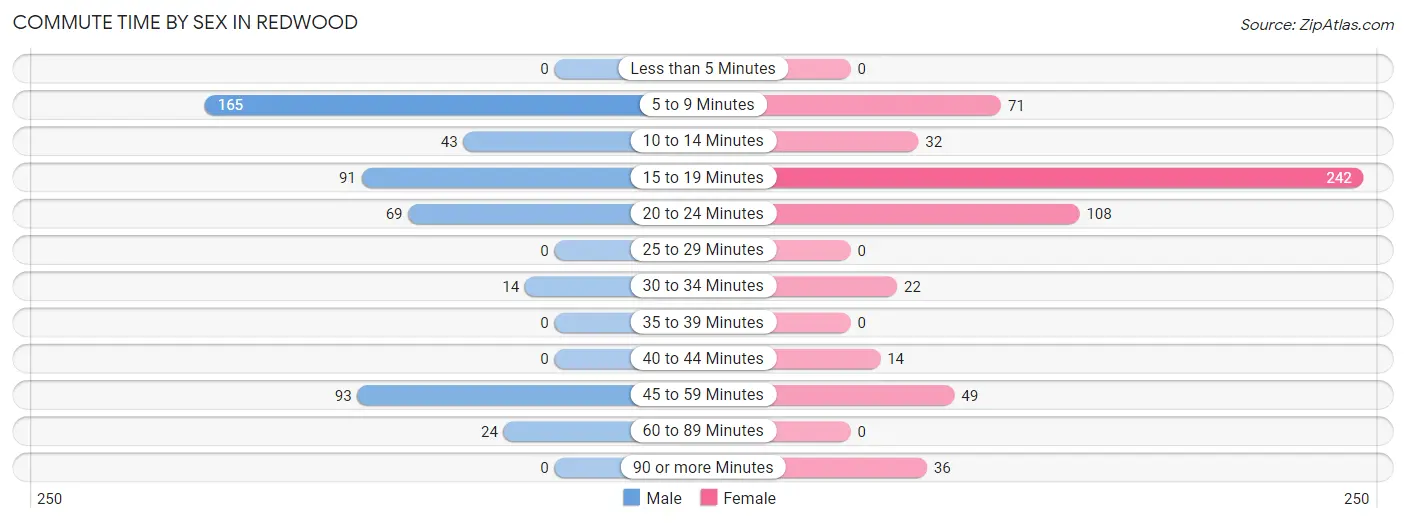
| Commute Time | Male | Female |
| Less than 5 Minutes | 0 (0.0%) | 0 (0.0%) |
| 5 to 9 Minutes | 165 (33.1%) | 71 (12.4%) |
| 10 to 14 Minutes | 43 (8.6%) | 32 (5.6%) |
| 15 to 19 Minutes | 91 (18.2%) | 242 (42.2%) |
| 20 to 24 Minutes | 69 (13.8%) | 108 (18.8%) |
| 25 to 29 Minutes | 0 (0.0%) | 0 (0.0%) |
| 30 to 34 Minutes | 14 (2.8%) | 22 (3.8%) |
| 35 to 39 Minutes | 0 (0.0%) | 0 (0.0%) |
| 40 to 44 Minutes | 0 (0.0%) | 14 (2.4%) |
| 45 to 59 Minutes | 93 (18.6%) | 49 (8.5%) |
| 60 to 89 Minutes | 24 (4.8%) | 0 (0.0%) |
| 90 or more Minutes | 0 (0.0%) | 36 (6.3%) |
Time of Departure to Work by Sex in Redwood
The most frequent times of departure to work in Redwood are 7:30 AM to 7:59 AM (174, 34.9%) for males and 6:30 AM to 6:59 AM (96, 16.7%) for females.
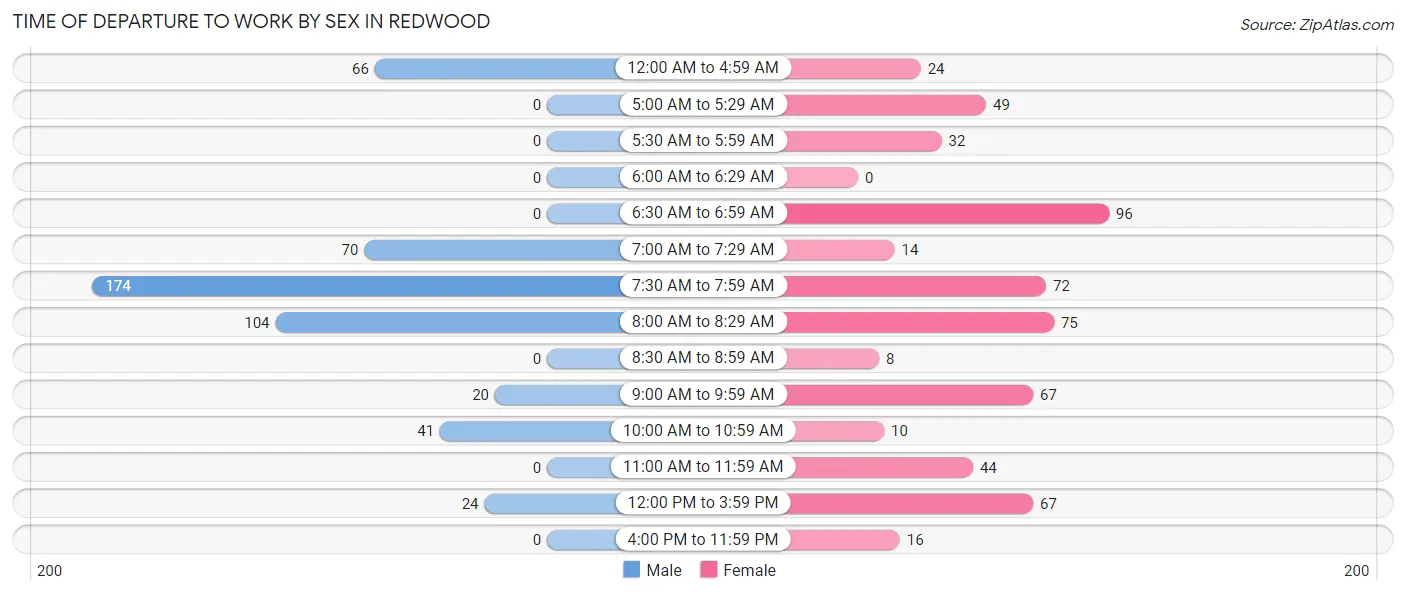
| Time of Departure | Male | Female |
| 12:00 AM to 4:59 AM | 66 (13.2%) | 24 (4.2%) |
| 5:00 AM to 5:29 AM | 0 (0.0%) | 49 (8.5%) |
| 5:30 AM to 5:59 AM | 0 (0.0%) | 32 (5.6%) |
| 6:00 AM to 6:29 AM | 0 (0.0%) | 0 (0.0%) |
| 6:30 AM to 6:59 AM | 0 (0.0%) | 96 (16.7%) |
| 7:00 AM to 7:29 AM | 70 (14.0%) | 14 (2.4%) |
| 7:30 AM to 7:59 AM | 174 (34.9%) | 72 (12.5%) |
| 8:00 AM to 8:29 AM | 104 (20.8%) | 75 (13.1%) |
| 8:30 AM to 8:59 AM | 0 (0.0%) | 8 (1.4%) |
| 9:00 AM to 9:59 AM | 20 (4.0%) | 67 (11.7%) |
| 10:00 AM to 10:59 AM | 41 (8.2%) | 10 (1.7%) |
| 11:00 AM to 11:59 AM | 0 (0.0%) | 44 (7.7%) |
| 12:00 PM to 3:59 PM | 24 (4.8%) | 67 (11.7%) |
| 4:00 PM to 11:59 PM | 0 (0.0%) | 16 (2.8%) |
| Total | 499 (100.0%) | 574 (100.0%) |
Housing Occupancy in Redwood
Occupancy by Ownership in Redwood
Of the total 1,045 dwellings in Redwood, owner-occupied units account for 822 (78.7%), while renter-occupied units make up 223 (21.3%).
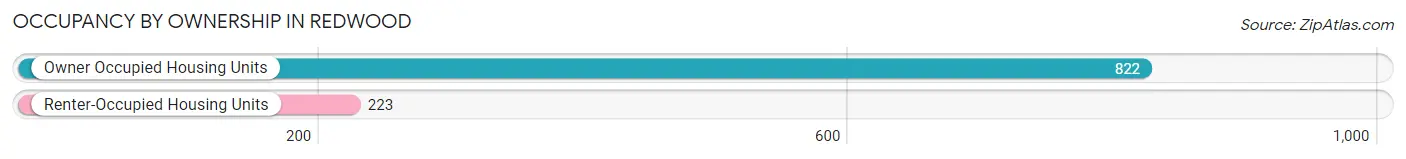
| Occupancy | # Housing Units | % Housing Units |
| Owner Occupied Housing Units | 822 | 78.7% |
| Renter-Occupied Housing Units | 223 | 21.3% |
| Total Occupied Housing Units | 1,045 | 100.0% |
Occupancy by Household Size in Redwood
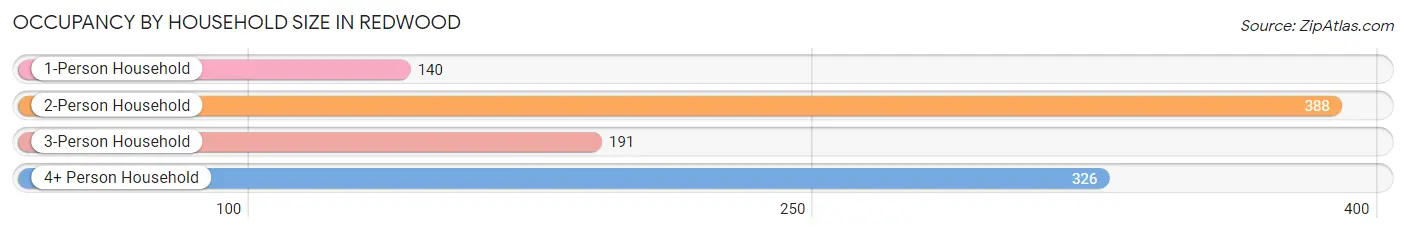
| Household Size | # Housing Units | % Housing Units |
| 1-Person Household | 140 | 13.4% |
| 2-Person Household | 388 | 37.1% |
| 3-Person Household | 191 | 18.3% |
| 4+ Person Household | 326 | 31.2% |
| Total Housing Units | 1,045 | 100.0% |
Occupancy by Ownership by Household Size in Redwood
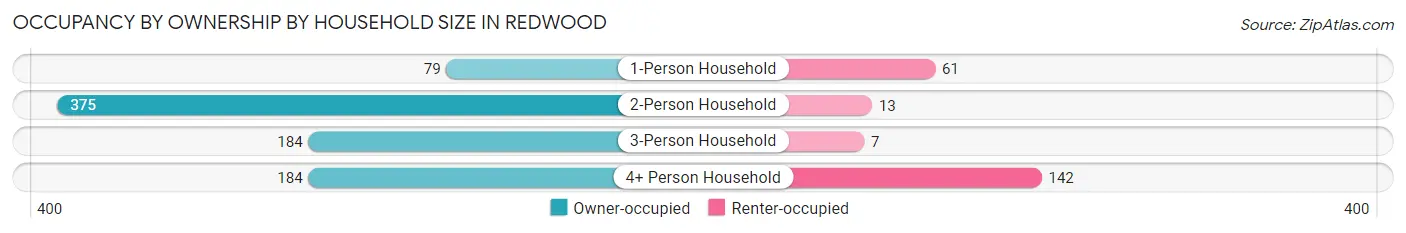
| Household Size | Owner-occupied | Renter-occupied |
| 1-Person Household | 79 (56.4%) | 61 (43.6%) |
| 2-Person Household | 375 (96.7%) | 13 (3.4%) |
| 3-Person Household | 184 (96.3%) | 7 (3.7%) |
| 4+ Person Household | 184 (56.4%) | 142 (43.6%) |
| Total Housing Units | 822 (78.7%) | 223 (21.3%) |
Occupancy by Educational Attainment in Redwood
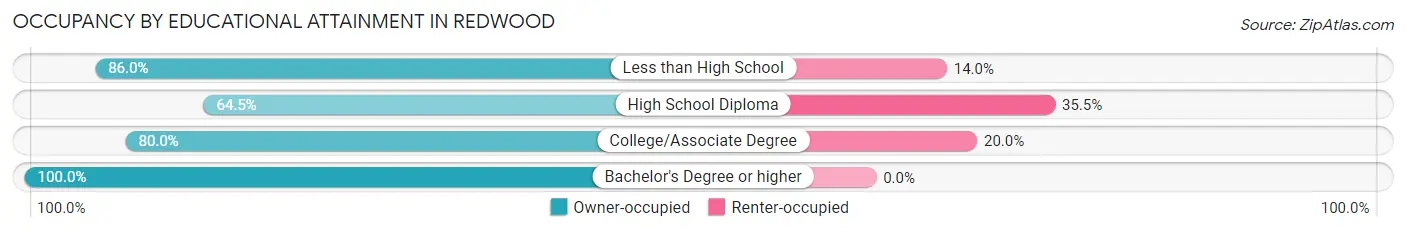
| Household Size | Owner-occupied | Renter-occupied |
| Less than High School | 43 (86.0%) | 7 (14.0%) |
| High School Diploma | 222 (64.5%) | 122 (35.5%) |
| College/Associate Degree | 376 (80.0%) | 94 (20.0%) |
| Bachelor's Degree or higher | 181 (100.0%) | 0 (0.0%) |
Occupancy by Age of Householder in Redwood
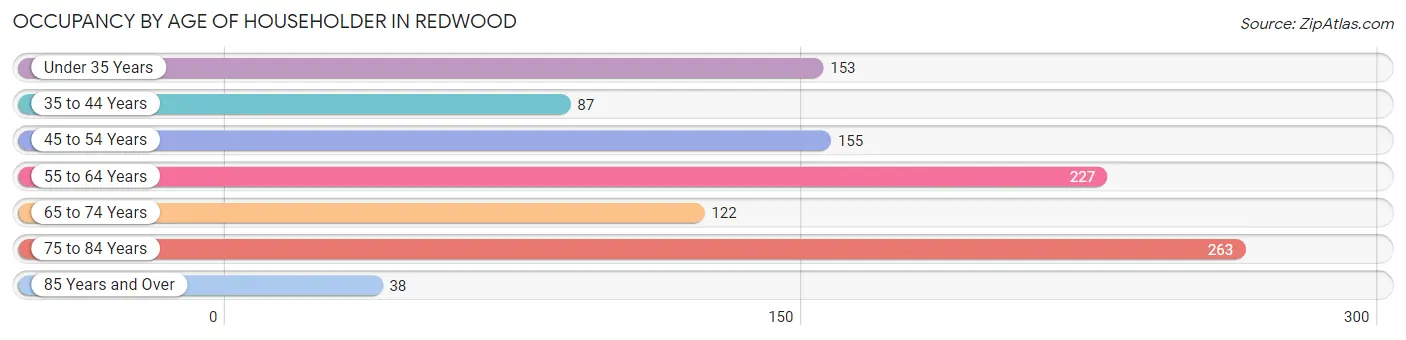
| Age Bracket | # Households | % Households |
| Under 35 Years | 153 | 14.6% |
| 35 to 44 Years | 87 | 8.3% |
| 45 to 54 Years | 155 | 14.8% |
| 55 to 64 Years | 227 | 21.7% |
| 65 to 74 Years | 122 | 11.7% |
| 75 to 84 Years | 263 | 25.2% |
| 85 Years and Over | 38 | 3.6% |
| Total | 1,045 | 100.0% |
Housing Finances in Redwood
Median Income by Occupancy in Redwood
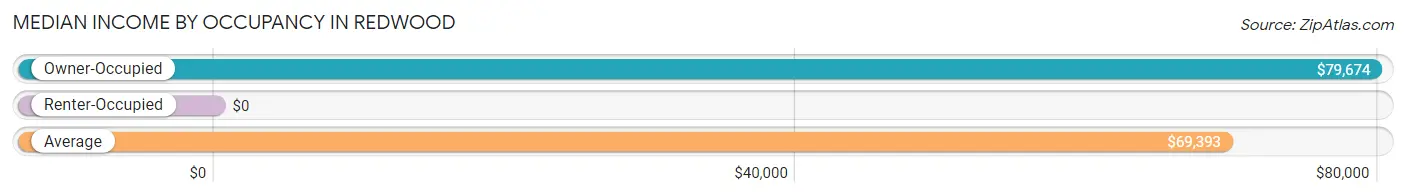
| Occupancy Type | # Households | Median Income |
| Owner-Occupied | 822 (78.7%) | $79,674 |
| Renter-Occupied | 223 (21.3%) | $0 |
| Average | 1,045 (100.0%) | $69,393 |
Occupancy by Householder Income Bracket in Redwood

| Income Bracket | Owner-occupied | Renter-occupied |
| Less than $5,000 | 0 (0.0%) | 0 (0.0%) |
| $5,000 to $9,999 | 0 (0.0%) | 0 (0.0%) |
| $10,000 to $14,999 | 0 (0.0%) | 11 (4.9%) |
| $15,000 to $19,999 | 75 (9.1%) | 32 (14.3%) |
| $20,000 to $24,999 | 0 (0.0%) | 57 (25.6%) |
| $25,000 to $34,999 | 27 (3.3%) | 51 (22.9%) |
| $35,000 to $49,999 | 94 (11.4%) | 0 (0.0%) |
| $50,000 to $74,999 | 184 (22.4%) | 0 (0.0%) |
| $75,000 to $99,999 | 150 (18.2%) | 0 (0.0%) |
| $100,000 to $149,999 | 100 (12.2%) | 0 (0.0%) |
| $150,000 or more | 192 (23.4%) | 72 (32.3%) |
| Total | 822 (100.0%) | 223 (100.0%) |
Monthly Housing Cost Tiers in Redwood
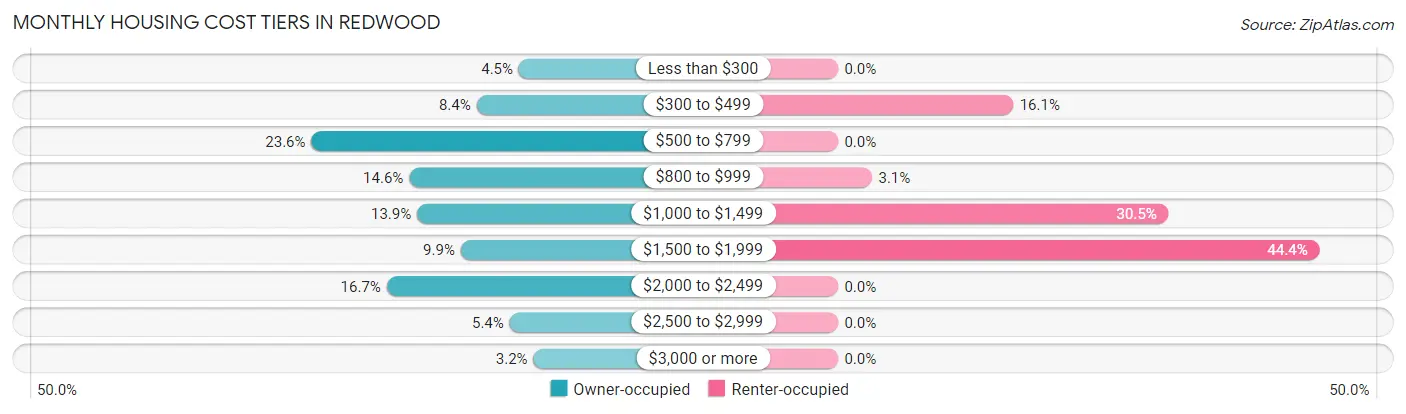
| Monthly Cost | Owner-occupied | Renter-occupied |
| Less than $300 | 37 (4.5%) | 0 (0.0%) |
| $300 to $499 | 69 (8.4%) | 36 (16.1%) |
| $500 to $799 | 194 (23.6%) | 0 (0.0%) |
| $800 to $999 | 120 (14.6%) | 7 (3.1%) |
| $1,000 to $1,499 | 114 (13.9%) | 68 (30.5%) |
| $1,500 to $1,999 | 81 (9.9%) | 99 (44.4%) |
| $2,000 to $2,499 | 137 (16.7%) | 0 (0.0%) |
| $2,500 to $2,999 | 44 (5.3%) | 0 (0.0%) |
| $3,000 or more | 26 (3.2%) | 0 (0.0%) |
| Total | 822 (100.0%) | 223 (100.0%) |
Physical Housing Characteristics in Redwood
Housing Structures in Redwood
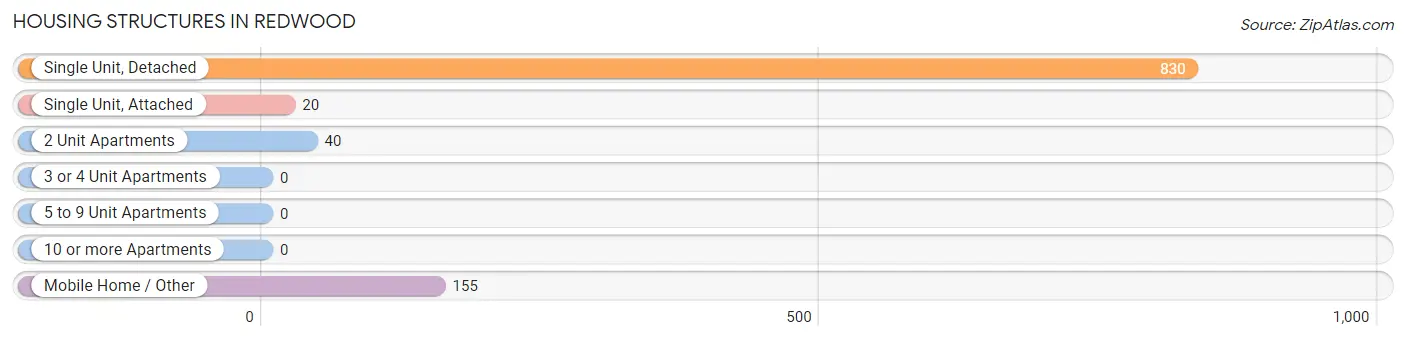
| Structure Type | # Housing Units | % Housing Units |
| Single Unit, Detached | 830 | 79.4% |
| Single Unit, Attached | 20 | 1.9% |
| 2 Unit Apartments | 40 | 3.8% |
| 3 or 4 Unit Apartments | 0 | 0.0% |
| 5 to 9 Unit Apartments | 0 | 0.0% |
| 10 or more Apartments | 0 | 0.0% |
| Mobile Home / Other | 155 | 14.8% |
| Total | 1,045 | 100.0% |
Housing Structures by Occupancy in Redwood
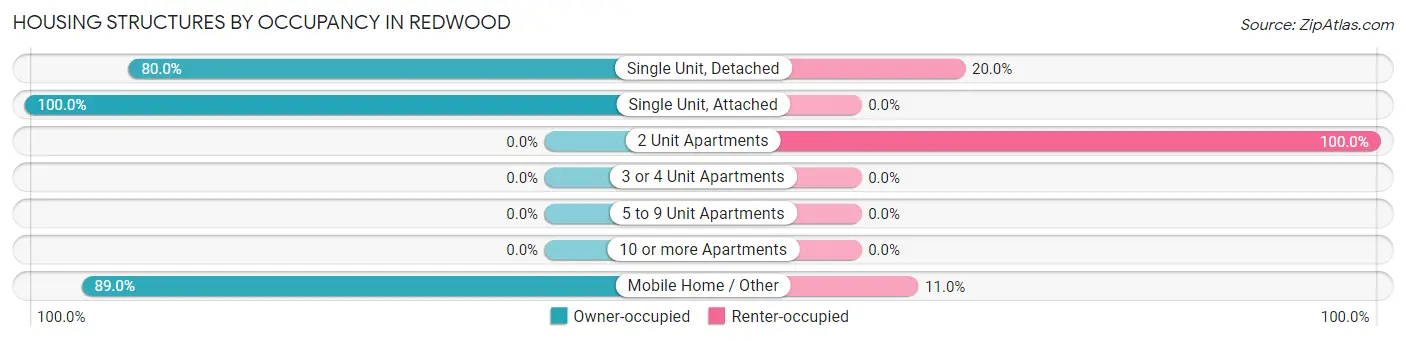
| Structure Type | Owner-occupied | Renter-occupied |
| Single Unit, Detached | 664 (80.0%) | 166 (20.0%) |
| Single Unit, Attached | 20 (100.0%) | 0 (0.0%) |
| 2 Unit Apartments | 0 (0.0%) | 40 (100.0%) |
| 3 or 4 Unit Apartments | 0 (0.0%) | 0 (0.0%) |
| 5 to 9 Unit Apartments | 0 (0.0%) | 0 (0.0%) |
| 10 or more Apartments | 0 (0.0%) | 0 (0.0%) |
| Mobile Home / Other | 138 (89.0%) | 17 (11.0%) |
| Total | 822 (78.7%) | 223 (21.3%) |
Housing Structures by Number of Rooms in Redwood
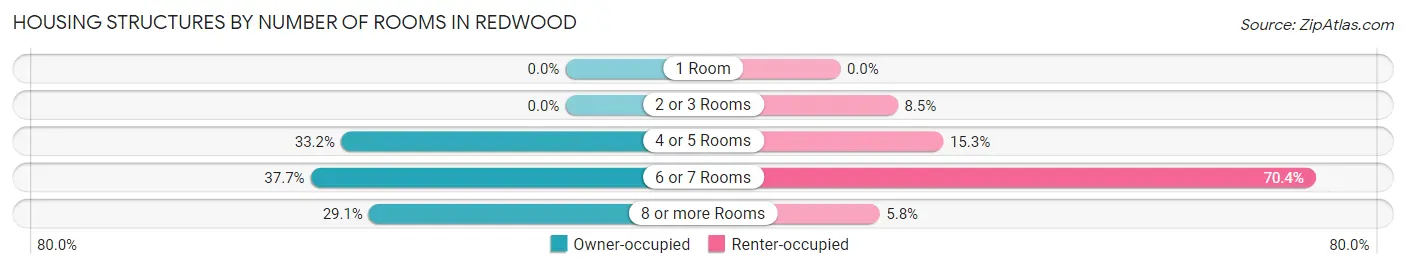
| Number of Rooms | Owner-occupied | Renter-occupied |
| 1 Room | 0 (0.0%) | 0 (0.0%) |
| 2 or 3 Rooms | 0 (0.0%) | 19 (8.5%) |
| 4 or 5 Rooms | 273 (33.2%) | 34 (15.2%) |
| 6 or 7 Rooms | 310 (37.7%) | 157 (70.4%) |
| 8 or more Rooms | 239 (29.1%) | 13 (5.8%) |
| Total | 822 (100.0%) | 223 (100.0%) |
Housing Structure by Heating Type in Redwood
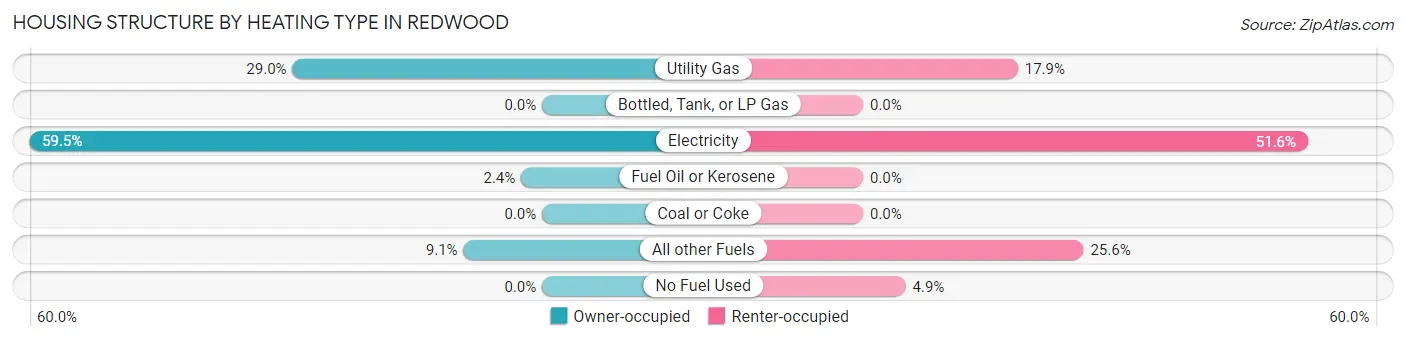
| Heating Type | Owner-occupied | Renter-occupied |
| Utility Gas | 238 (28.9%) | 40 (17.9%) |
| Bottled, Tank, or LP Gas | 0 (0.0%) | 0 (0.0%) |
| Electricity | 489 (59.5%) | 115 (51.6%) |
| Fuel Oil or Kerosene | 20 (2.4%) | 0 (0.0%) |
| Coal or Coke | 0 (0.0%) | 0 (0.0%) |
| All other Fuels | 75 (9.1%) | 57 (25.6%) |
| No Fuel Used | 0 (0.0%) | 11 (4.9%) |
| Total | 822 (100.0%) | 223 (100.0%) |
Household Vehicle Usage in Redwood
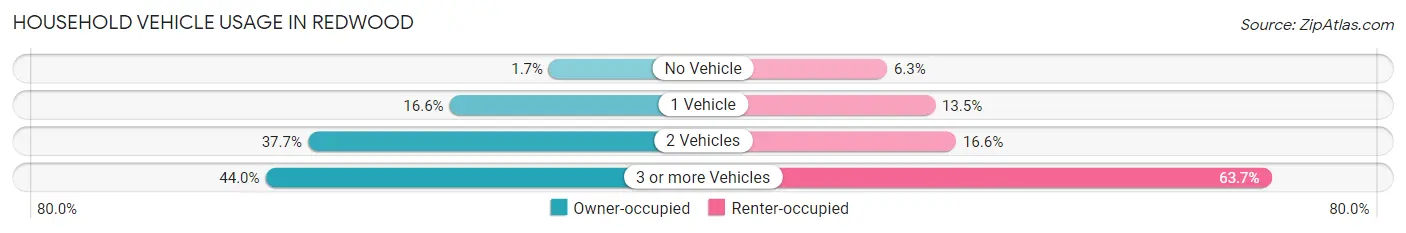
| Vehicles per Household | Owner-occupied | Renter-occupied |
| No Vehicle | 14 (1.7%) | 14 (6.3%) |
| 1 Vehicle | 136 (16.6%) | 30 (13.5%) |
| 2 Vehicles | 310 (37.7%) | 37 (16.6%) |
| 3 or more Vehicles | 362 (44.0%) | 142 (63.7%) |
| Total | 822 (100.0%) | 223 (100.0%) |
Real Estate & Mortgages in Redwood
Real Estate and Mortgage Overview in Redwood
| Characteristic | Without Mortgage | With Mortgage |
| Housing Units | 341 | 481 |
| Median Property Value | $263,700 | $393,800 |
| Median Household Income | $62,813 | $174 |
| Monthly Housing Costs | $599 | $26 |
| Real Estate Taxes | $1,542 | $53 |
Property Value by Mortgage Status in Redwood
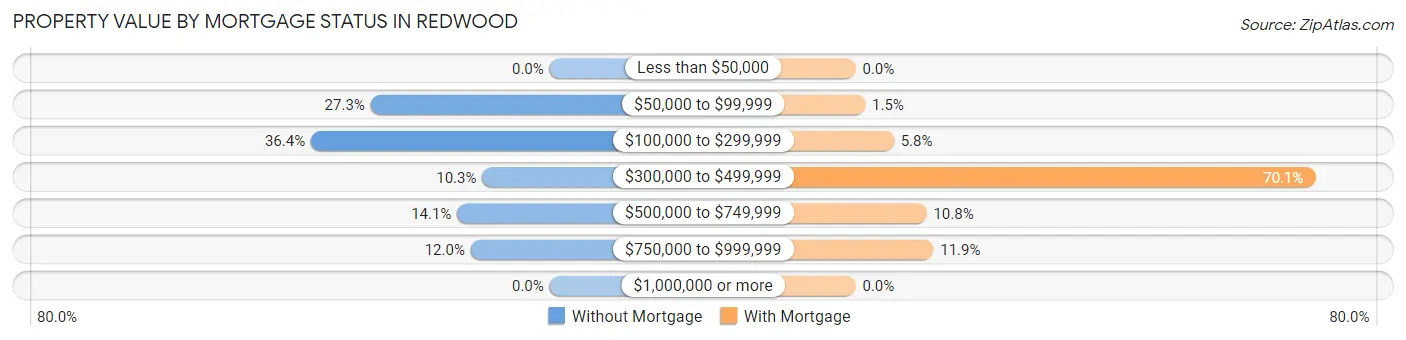
| Property Value | Without Mortgage | With Mortgage |
| Less than $50,000 | 0 (0.0%) | 0 (0.0%) |
| $50,000 to $99,999 | 93 (27.3%) | 7 (1.5%) |
| $100,000 to $299,999 | 124 (36.4%) | 28 (5.8%) |
| $300,000 to $499,999 | 35 (10.3%) | 337 (70.1%) |
| $500,000 to $749,999 | 48 (14.1%) | 52 (10.8%) |
| $750,000 to $999,999 | 41 (12.0%) | 57 (11.8%) |
| $1,000,000 or more | 0 (0.0%) | 0 (0.0%) |
| Total | 341 (100.0%) | 481 (100.0%) |
Household Income by Mortgage Status in Redwood
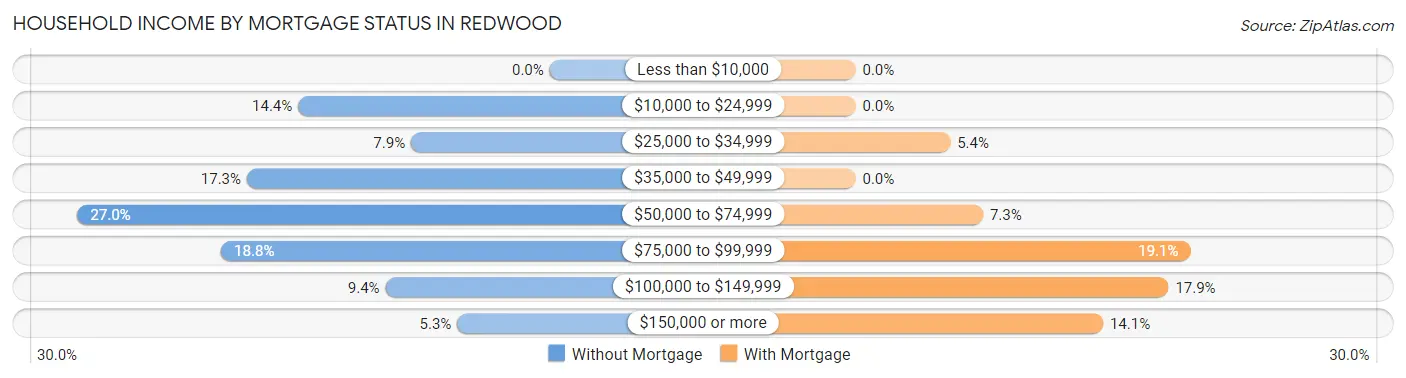
| Household Income | Without Mortgage | With Mortgage |
| Less than $10,000 | 0 (0.0%) | 0 (0.0%) |
| $10,000 to $24,999 | 49 (14.4%) | 0 (0.0%) |
| $25,000 to $34,999 | 27 (7.9%) | 26 (5.4%) |
| $35,000 to $49,999 | 59 (17.3%) | 0 (0.0%) |
| $50,000 to $74,999 | 92 (27.0%) | 35 (7.3%) |
| $75,000 to $99,999 | 64 (18.8%) | 92 (19.1%) |
| $100,000 to $149,999 | 32 (9.4%) | 86 (17.9%) |
| $150,000 or more | 18 (5.3%) | 68 (14.1%) |
| Total | 341 (100.0%) | 481 (100.0%) |
Property Value to Household Income Ratio in Redwood
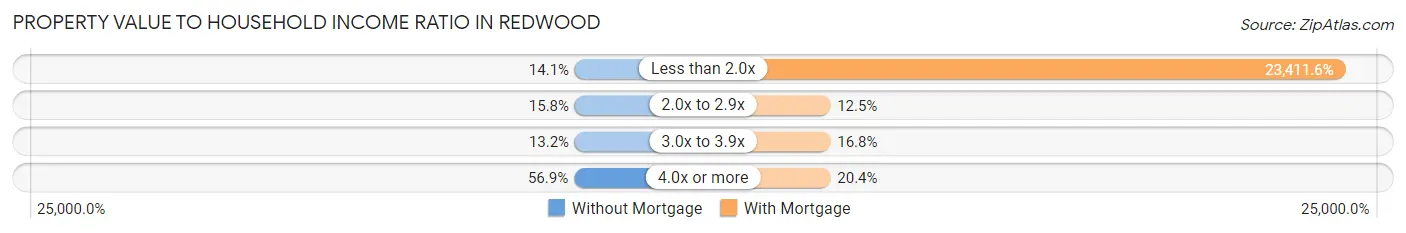
| Value-to-Income Ratio | Without Mortgage | With Mortgage |
| Less than 2.0x | 48 (14.1%) | 112,610 (23,411.6%) |
| 2.0x to 2.9x | 54 (15.8%) | 60 (12.5%) |
| 3.0x to 3.9x | 45 (13.2%) | 81 (16.8%) |
| 4.0x or more | 194 (56.9%) | 98 (20.4%) |
| Total | 341 (100.0%) | 481 (100.0%) |
Real Estate Taxes by Mortgage Status in Redwood
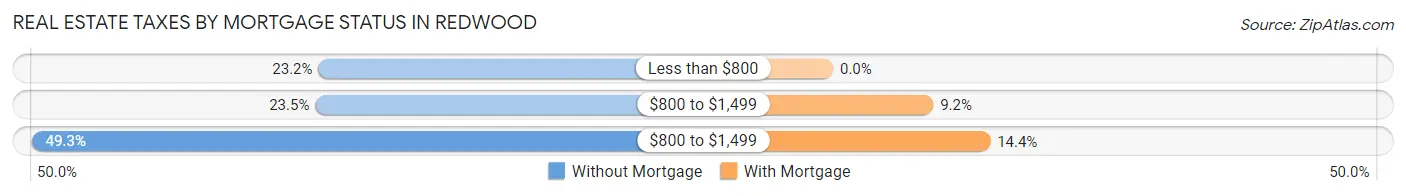
| Property Taxes | Without Mortgage | With Mortgage |
| Less than $800 | 79 (23.2%) | 0 (0.0%) |
| $800 to $1,499 | 80 (23.5%) | 44 (9.1%) |
| $800 to $1,499 | 168 (49.3%) | 69 (14.3%) |
| Total | 341 (100.0%) | 481 (100.0%) |
Health & Disability in Redwood
Health Insurance Coverage by Age in Redwood
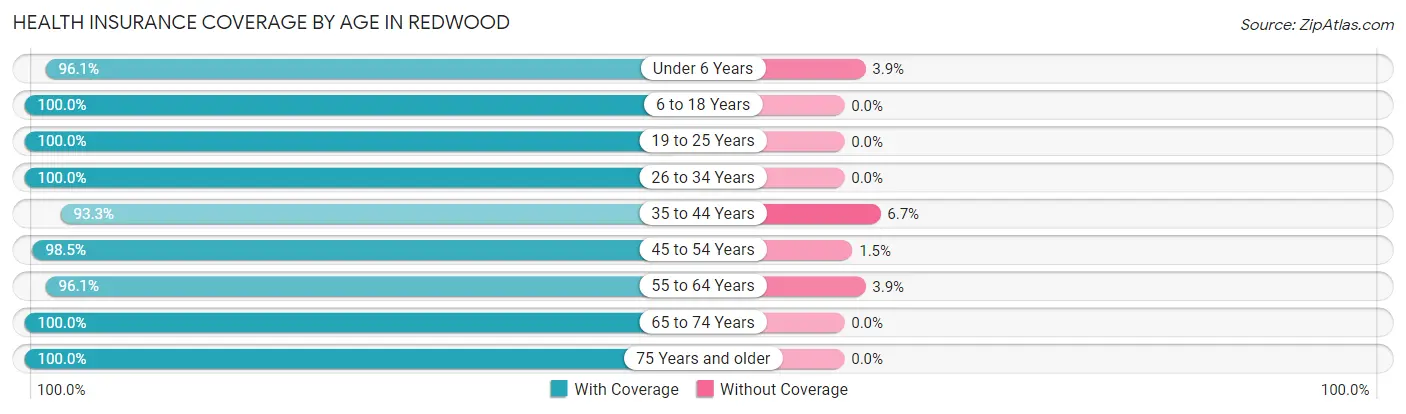
| Age Bracket | With Coverage | Without Coverage |
| Under 6 Years | 245 (96.1%) | 10 (3.9%) |
| 6 to 18 Years | 516 (100.0%) | 0 (0.0%) |
| 19 to 25 Years | 190 (100.0%) | 0 (0.0%) |
| 26 to 34 Years | 294 (100.0%) | 0 (0.0%) |
| 35 to 44 Years | 208 (93.3%) | 15 (6.7%) |
| 45 to 54 Years | 594 (98.5%) | 9 (1.5%) |
| 55 to 64 Years | 441 (96.1%) | 18 (3.9%) |
| 65 to 74 Years | 254 (100.0%) | 0 (0.0%) |
| 75 Years and older | 481 (100.0%) | 0 (0.0%) |
| Total | 3,223 (98.4%) | 52 (1.6%) |
Health Insurance Coverage by Citizenship Status in Redwood
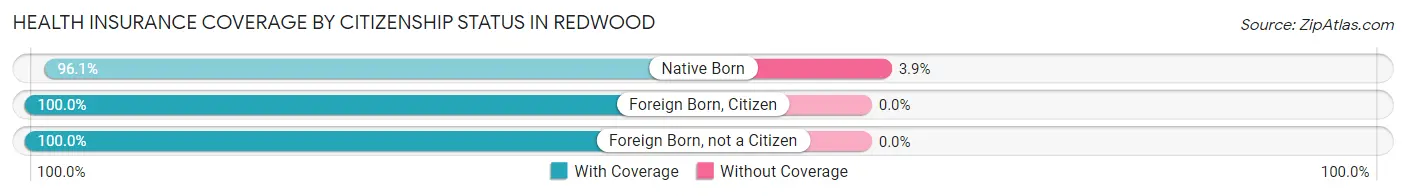
| Citizenship Status | With Coverage | Without Coverage |
| Native Born | 245 (96.1%) | 10 (3.9%) |
| Foreign Born, Citizen | 516 (100.0%) | 0 (0.0%) |
| Foreign Born, not a Citizen | 190 (100.0%) | 0 (0.0%) |
Health Insurance Coverage by Household Income in Redwood
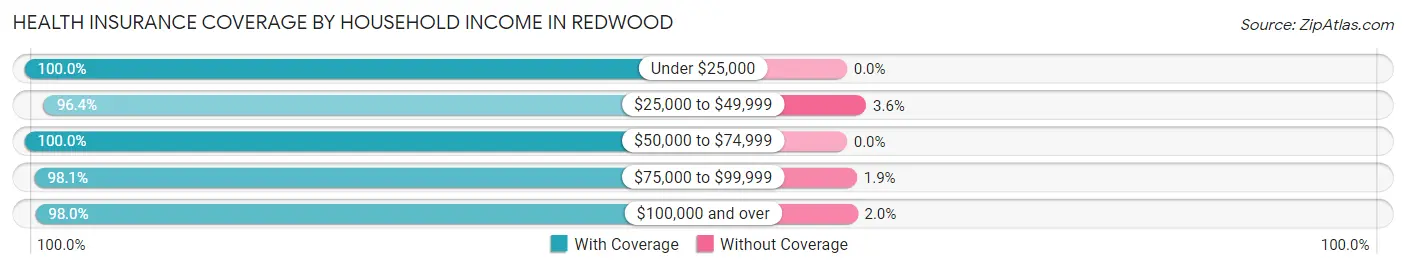
| Household Income | With Coverage | Without Coverage |
| Under $25,000 | 405 (100.0%) | 0 (0.0%) |
| $25,000 to $49,999 | 320 (96.4%) | 12 (3.6%) |
| $50,000 to $74,999 | 484 (100.0%) | 0 (0.0%) |
| $75,000 to $99,999 | 523 (98.1%) | 10 (1.9%) |
| $100,000 and over | 1,459 (98.0%) | 30 (2.0%) |
Public vs Private Health Insurance Coverage by Age in Redwood
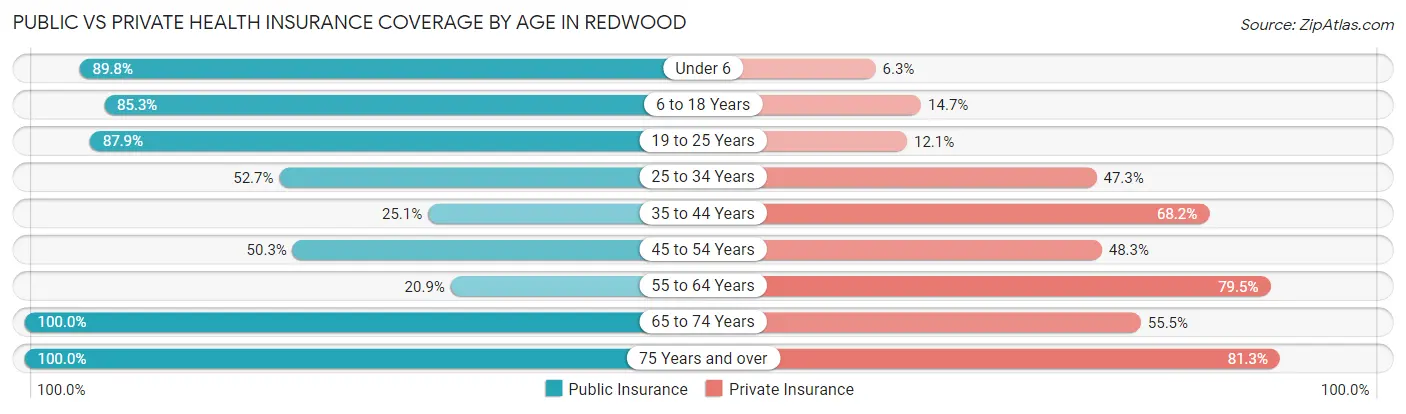
| Age Bracket | Public Insurance | Private Insurance |
| Under 6 | 229 (89.8%) | 16 (6.3%) |
| 6 to 18 Years | 440 (85.3%) | 76 (14.7%) |
| 19 to 25 Years | 167 (87.9%) | 23 (12.1%) |
| 25 to 34 Years | 155 (52.7%) | 139 (47.3%) |
| 35 to 44 Years | 56 (25.1%) | 152 (68.2%) |
| 45 to 54 Years | 303 (50.2%) | 291 (48.3%) |
| 55 to 64 Years | 96 (20.9%) | 365 (79.5%) |
| 65 to 74 Years | 254 (100.0%) | 141 (55.5%) |
| 75 Years and over | 481 (100.0%) | 391 (81.3%) |
| Total | 2,181 (66.6%) | 1,594 (48.7%) |
Disability Status by Sex by Age in Redwood
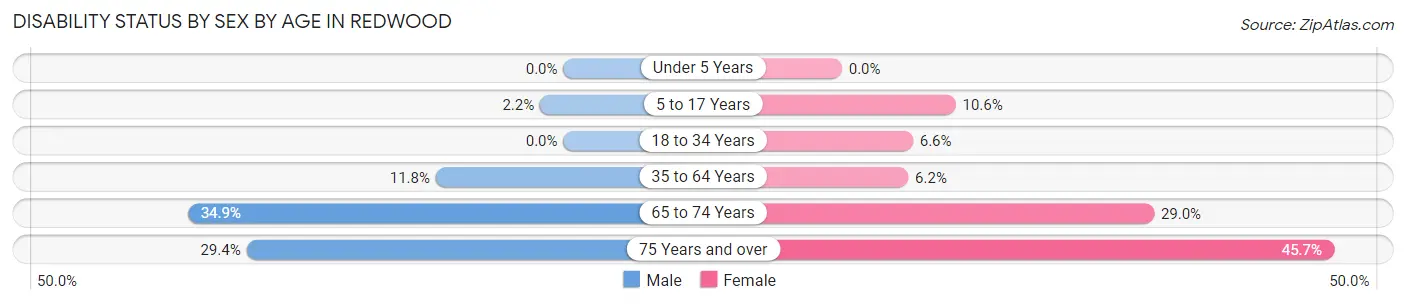
| Age Bracket | Male | Female |
| Under 5 Years | 0 (0.0%) | 0 (0.0%) |
| 5 to 17 Years | 8 (2.2%) | 17 (10.6%) |
| 18 to 34 Years | 0 (0.0%) | 23 (6.6%) |
| 35 to 64 Years | 81 (11.8%) | 37 (6.2%) |
| 65 to 74 Years | 38 (34.9%) | 42 (29.0%) |
| 75 Years and over | 50 (29.4%) | 142 (45.7%) |
Disability Class by Sex by Age in Redwood
Disability Class: Hearing Difficulty
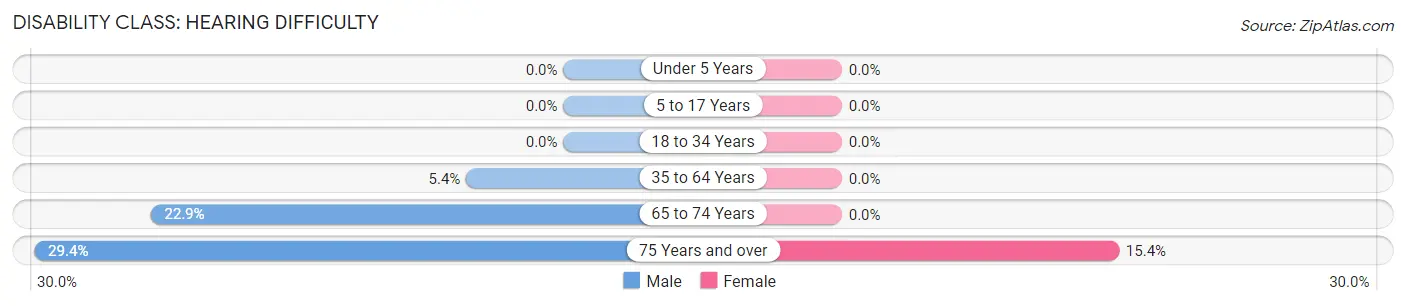
| Age Bracket | Male | Female |
| Under 5 Years | 0 (0.0%) | 0 (0.0%) |
| 5 to 17 Years | 0 (0.0%) | 0 (0.0%) |
| 18 to 34 Years | 0 (0.0%) | 0 (0.0%) |
| 35 to 64 Years | 37 (5.4%) | 0 (0.0%) |
| 65 to 74 Years | 25 (22.9%) | 0 (0.0%) |
| 75 Years and over | 50 (29.4%) | 48 (15.4%) |
Disability Class: Vision Difficulty
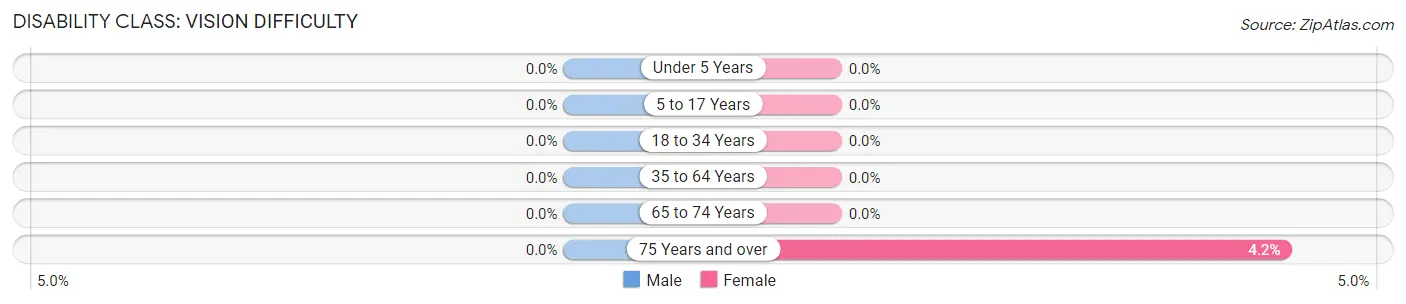
| Age Bracket | Male | Female |
| Under 5 Years | 0 (0.0%) | 0 (0.0%) |
| 5 to 17 Years | 0 (0.0%) | 0 (0.0%) |
| 18 to 34 Years | 0 (0.0%) | 0 (0.0%) |
| 35 to 64 Years | 0 (0.0%) | 0 (0.0%) |
| 65 to 74 Years | 0 (0.0%) | 0 (0.0%) |
| 75 Years and over | 0 (0.0%) | 13 (4.2%) |
Disability Class: Cognitive Difficulty
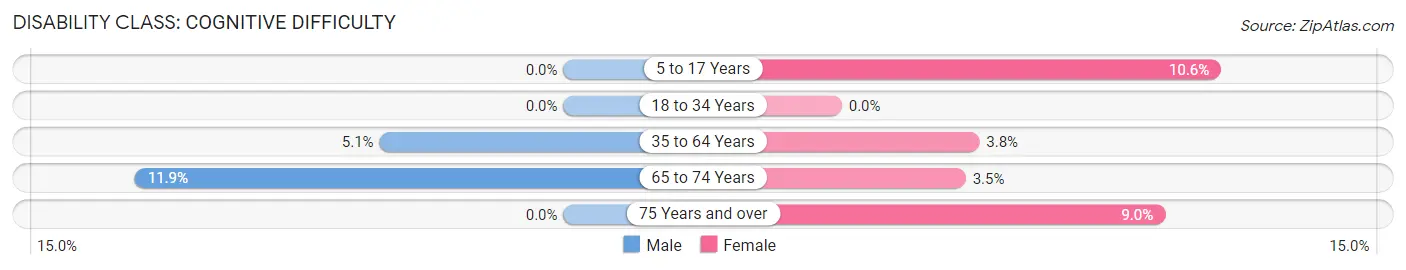
| Age Bracket | Male | Female |
| 5 to 17 Years | 0 (0.0%) | 17 (10.6%) |
| 18 to 34 Years | 0 (0.0%) | 0 (0.0%) |
| 35 to 64 Years | 35 (5.1%) | 23 (3.8%) |
| 65 to 74 Years | 13 (11.9%) | 5 (3.5%) |
| 75 Years and over | 0 (0.0%) | 28 (9.0%) |
Disability Class: Ambulatory Difficulty
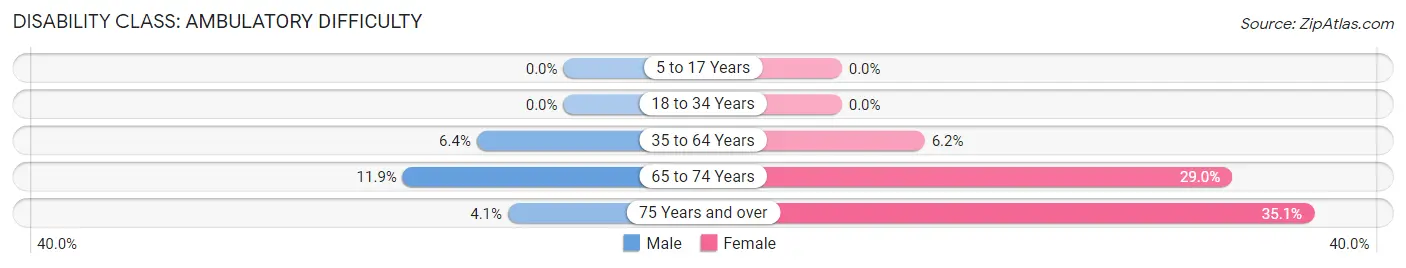
| Age Bracket | Male | Female |
| 5 to 17 Years | 0 (0.0%) | 0 (0.0%) |
| 18 to 34 Years | 0 (0.0%) | 0 (0.0%) |
| 35 to 64 Years | 44 (6.4%) | 37 (6.2%) |
| 65 to 74 Years | 13 (11.9%) | 42 (29.0%) |
| 75 Years and over | 7 (4.1%) | 109 (35.0%) |
Disability Class: Self-Care Difficulty
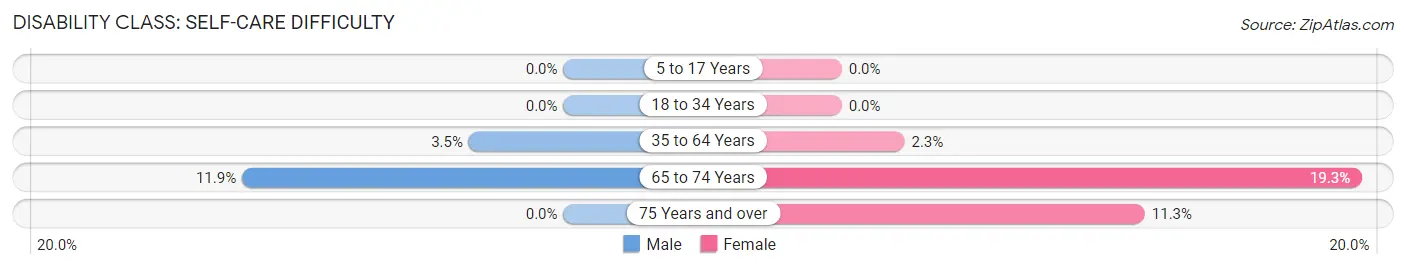
| Age Bracket | Male | Female |
| 5 to 17 Years | 0 (0.0%) | 0 (0.0%) |
| 18 to 34 Years | 0 (0.0%) | 0 (0.0%) |
| 35 to 64 Years | 24 (3.5%) | 14 (2.3%) |
| 65 to 74 Years | 13 (11.9%) | 28 (19.3%) |
| 75 Years and over | 0 (0.0%) | 35 (11.3%) |
Technology Access in Redwood
Computing Device Access in Redwood
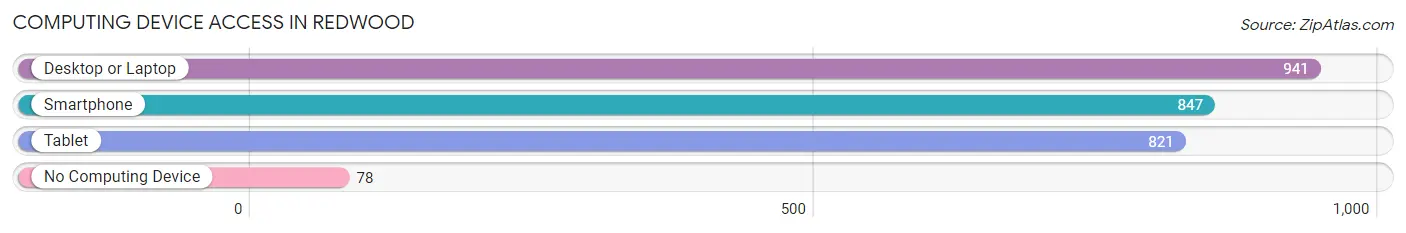
| Device Type | # Households | % Households |
| Desktop or Laptop | 941 | 90.0% |
| Smartphone | 847 | 81.0% |
| Tablet | 821 | 78.6% |
| No Computing Device | 78 | 7.5% |
| Total | 1,045 | 100.0% |
Internet Access in Redwood
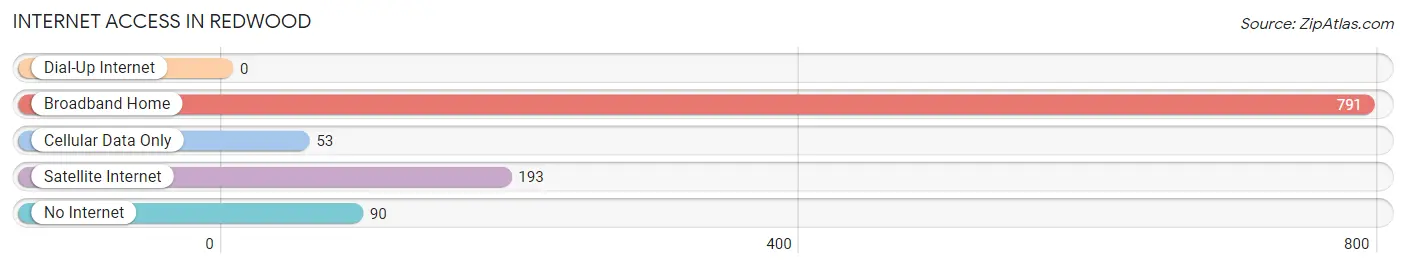
| Internet Type | # Households | % Households |
| Dial-Up Internet | 0 | 0.0% |
| Broadband Home | 791 | 75.7% |
| Cellular Data Only | 53 | 5.1% |
| Satellite Internet | 193 | 18.5% |
| No Internet | 90 | 8.6% |
| Total | 1,045 | 100.0% |
Redwood Summary
Redwood, Oregon is a small town located in the western part of the state, in the foothills of the Cascade Mountains. It is situated in the Willamette Valley, about 25 miles south of Portland. The town has a population of about 1,500 people and is known for its rural charm and small-town atmosphere.
History
The area that is now Redwood was first settled in the late 1800s by homesteaders. The town was originally called Redwood Station, after the nearby Redwood Creek. The name was changed to Redwood in the early 1900s. The town was incorporated in 1911 and has remained a small, rural community ever since.
The town was originally a logging and farming community, and the local economy was largely based on these industries. In the 1950s, the town began to diversify its economy, and today it is home to a variety of businesses, including a winery, a brewery, and a distillery.
Geography
Redwood is located in the western part of Oregon, in the foothills of the Cascade Mountains. The town is situated in the Willamette Valley, about 25 miles south of Portland. The town is surrounded by rolling hills and lush forests, and is known for its rural charm and small-town atmosphere.
The climate in Redwood is mild and temperate, with warm summers and cool winters. The average annual temperature is around 50 degrees Fahrenheit. The town receives an average of 40 inches of precipitation per year, with most of it falling in the winter months.
Economy
The economy of Redwood is largely based on agriculture and tourism. The town is home to a variety of businesses, including a winery, a brewery, and a distillery. The town also has a number of small shops and restaurants.
The town is also home to a number of small manufacturing businesses, including a furniture maker and a woodworking shop. The town is also home to a number of small farms, which produce a variety of fruits and vegetables.
Demographics
As of the 2010 census, the population of Redwood was 1,500 people. The town is predominantly white, with about 90% of the population identifying as Caucasian. The town also has a small Hispanic population, with about 5% of the population identifying as Hispanic or Latino.
The median household income in Redwood is around $50,000, and the median home value is around $200,000. The town has a low unemployment rate, and the cost of living is relatively low.
Redwood is a small, rural town with a strong sense of community. The town is known for its rural charm and small-town atmosphere, and is a popular destination for tourists and outdoor enthusiasts. The town is also home to a variety of businesses, and the local economy is largely based on agriculture and tourism.
Common Questions
What is the Total Population of Redwood?
Total Population of Redwood is 3,275.
What is the Total Male Population of Redwood?
Total Male Population of Redwood is 1,650.
What is the Total Female Population of Redwood?
Total Female Population of Redwood is 1,625.
What is the Ratio of Males per 100 Females in Redwood?
There are 101.54 Males per 100 Females in Redwood.
What is the Ratio of Females per 100 Males in Redwood?
There are 98.48 Females per 100 Males in Redwood.
What is the Median Population Age in Redwood?
Median Population Age in Redwood is 49.1 Years.
What is the Average Family Size in Redwood
Average Family Size in Redwood is 3.1 People.
What is the Average Household Size in Redwood
Average Household Size in Redwood is 3.1 People.
What is Per Capita Income in Redwood?
Per Capita income in Redwood is $33,323.
What is the Median Family Income in Redwood?
Median Family Income in Redwood is $81,250.
What is the Median Household income in Redwood?
Median Household Income in Redwood is $69,393.
What is Income or Wage Gap in Redwood?
Income or Wage Gap in Redwood is 42.7%.
Women in Redwood earn 57.3 cents for every dollar earned by a man.
What is Family Income Deficit in Redwood?
Family Income Deficit in Redwood is $10,213.
Families that are below poverty line in Redwood earn $10,213 less on average than the poverty threshold level.
What is Inequality or Gini Index in Redwood?
Inequality or Gini Index in Redwood is 0.47.
How Large is the Labor Force in Redwood?
There are 1,481 People in the Labor Forcein in Redwood.
What is the Percentage of People in the Labor Force in Redwood?
57.1% of People are in the Labor Force in Redwood.
What is the Unemployment Rate in Redwood?
Unemployment Rate in Redwood is 9.2%.