Candlewood Lake, OH
Candlewood Lake Map
Candlewood Lake Overview
1,181
TOTAL POPULATION
540
MALE POPULATION
641
FEMALE POPULATION
84.24
MALES / 100 FEMALES
118.70
FEMALES / 100 MALES
52.3
MEDIAN AGE
2.5
AVG FAMILY SIZE
2.5
AVG HOUSEHOLD SIZE
$41,514
PER CAPITA INCOME
$106,044
AVG FAMILY INCOME
$106,277
AVG HOUSEHOLD INCOME
0.3%
WAGE / INCOME GAP [ % ]
99.7¢/ $1
WAGE / INCOME GAP [ $ ]
0.25
INEQUALITY / GINI INDEX
650
LABOR FORCE [ PEOPLE ]
66.3%
PERCENT IN LABOR FORCE
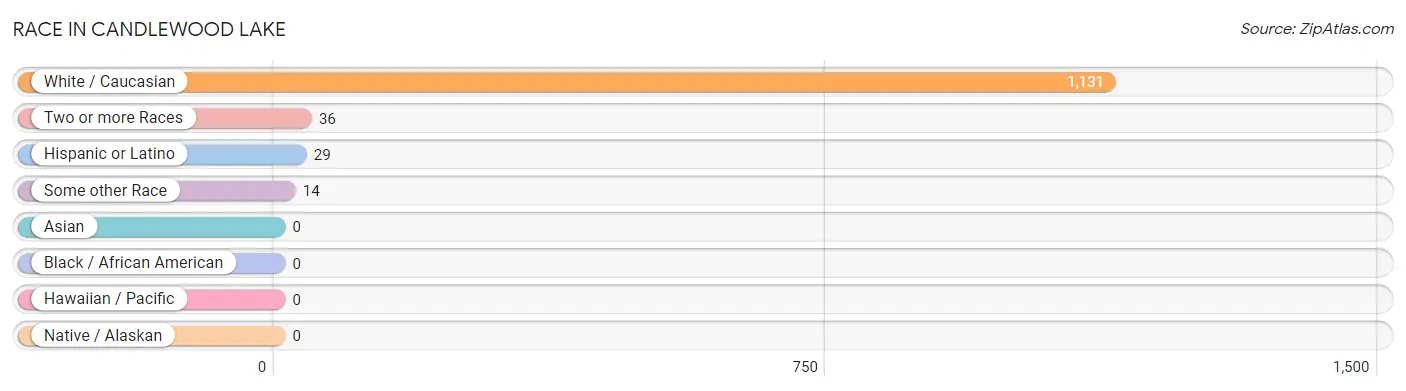
Race in Candlewood Lake
The most populous races in Candlewood Lake are White / Caucasian (1,131 | 95.8%), Two or more Races (36 | 3.0%), and Hispanic or Latino (29 | 2.5%).
| Race | # Population | % Population |
| Asian | 0 | 0.0% |
| Black / African American | 0 | 0.0% |
| Hawaiian / Pacific | 0 | 0.0% |
| Hispanic or Latino | 29 | 2.5% |
| Native / Alaskan | 0 | 0.0% |
| White / Caucasian | 1,131 | 95.8% |
| Two or more Races | 36 | 3.0% |
| Some other Race | 14 | 1.2% |
| Total | 1,181 | 100.0% |
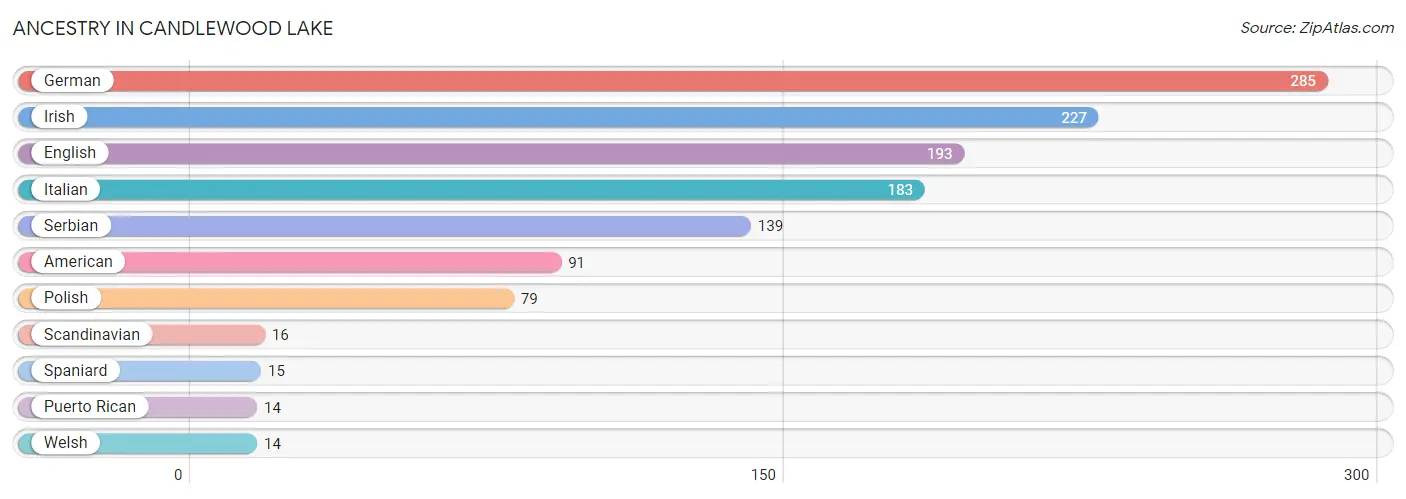
Ancestry in Candlewood Lake
The most populous ancestries reported in Candlewood Lake are German (285 | 24.1%), Irish (227 | 19.2%), English (193 | 16.3%), Italian (183 | 15.5%), and Serbian (139 | 11.8%), together accounting for 87.0% of all Candlewood Lake residents.
| Ancestry | # Population | % Population |
| American | 91 | 7.7% |
| English | 193 | 16.3% |
| German | 285 | 24.1% |
| Irish | 227 | 19.2% |
| Italian | 183 | 15.5% |
| Polish | 79 | 6.7% |
| Puerto Rican | 14 | 1.2% |
| Scandinavian | 16 | 1.3% |
| Serbian | 139 | 11.8% |
| Spaniard | 15 | 1.3% |
| Welsh | 14 | 1.2% | View All 11 Rows |
Immigrants in Candlewood Lake

| Immigration Origin | # Population | % Population | View All 0 Rows |
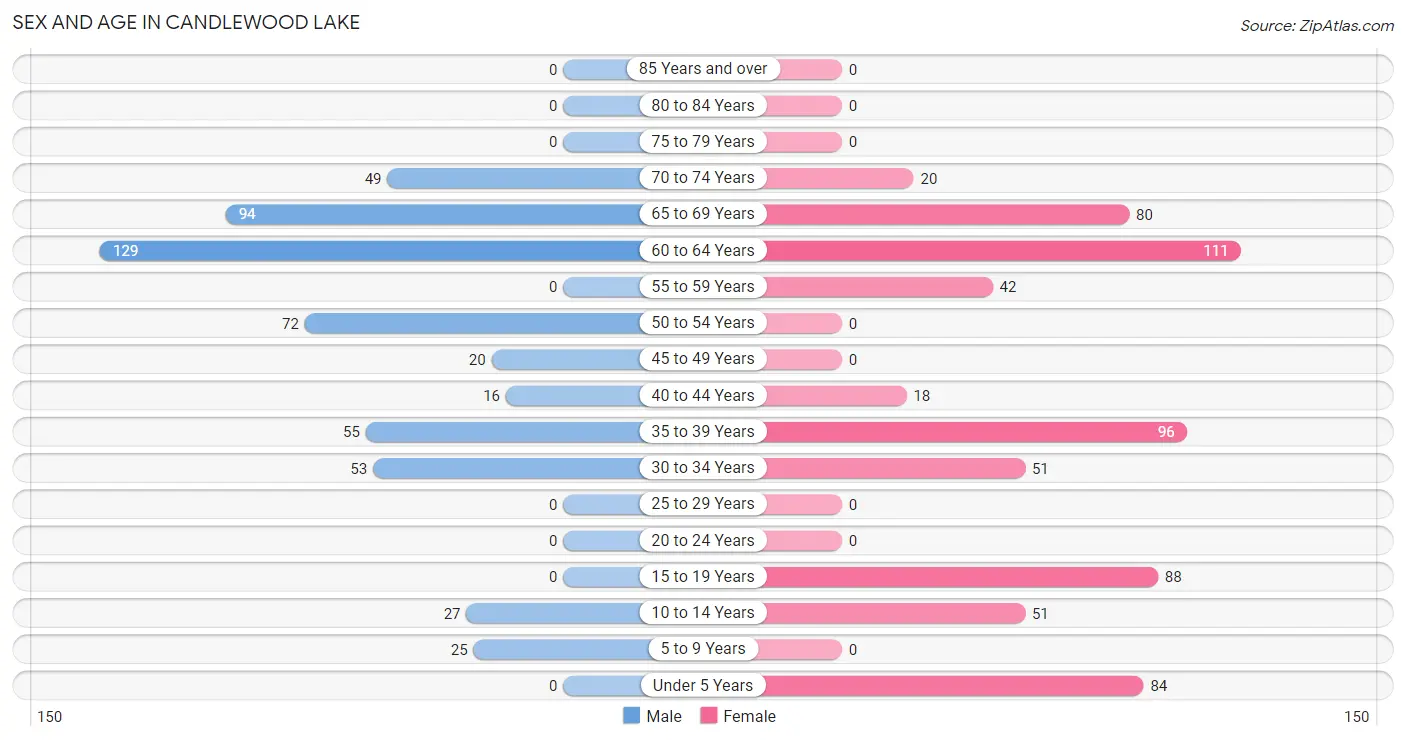
Sex and Age in Candlewood Lake
Sex and Age in Candlewood Lake
The most populous age groups in Candlewood Lake are 60 to 64 Years (129 | 23.9%) for men and 60 to 64 Years (111 | 17.3%) for women.
| Age Bracket | Male | Female |
| Under 5 Years | 0 (0.0%) | 84 (13.1%) |
| 5 to 9 Years | 25 (4.6%) | 0 (0.0%) |
| 10 to 14 Years | 27 (5.0%) | 51 (8.0%) |
| 15 to 19 Years | 0 (0.0%) | 88 (13.7%) |
| 20 to 24 Years | 0 (0.0%) | 0 (0.0%) |
| 25 to 29 Years | 0 (0.0%) | 0 (0.0%) |
| 30 to 34 Years | 53 (9.8%) | 51 (8.0%) |
| 35 to 39 Years | 55 (10.2%) | 96 (15.0%) |
| 40 to 44 Years | 16 (3.0%) | 18 (2.8%) |
| 45 to 49 Years | 20 (3.7%) | 0 (0.0%) |
| 50 to 54 Years | 72 (13.3%) | 0 (0.0%) |
| 55 to 59 Years | 0 (0.0%) | 42 (6.6%) |
| 60 to 64 Years | 129 (23.9%) | 111 (17.3%) |
| 65 to 69 Years | 94 (17.4%) | 80 (12.5%) |
| 70 to 74 Years | 49 (9.1%) | 20 (3.1%) |
| 75 to 79 Years | 0 (0.0%) | 0 (0.0%) |
| 80 to 84 Years | 0 (0.0%) | 0 (0.0%) |
| 85 Years and over | 0 (0.0%) | 0 (0.0%) |
| Total | 540 (100.0%) | 641 (100.0%) |
Families and Households in Candlewood Lake
Median Family Size in Candlewood Lake
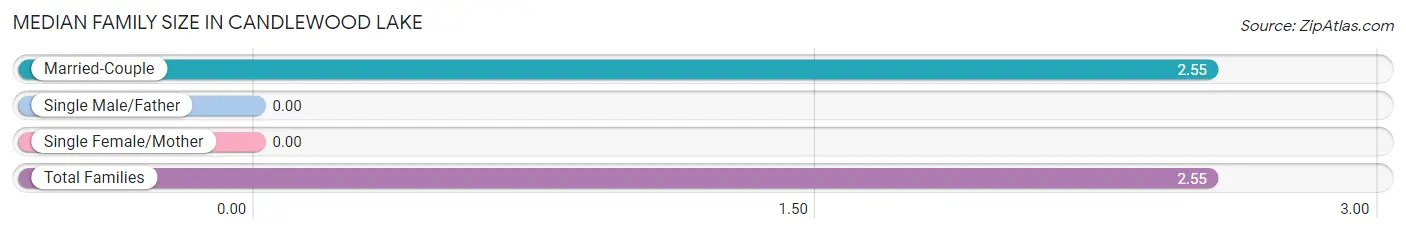
| Family Type | # Families | Family Size |
| Married-Couple | 396 (100.0%) | 2.55 |
| Single Male/Father | 0 (0.0%) | - |
| Single Female/Mother | 0 (0.0%) | - |
| Total Families | 396 (100.0%) | 2.55 |
Median Household Size in Candlewood Lake
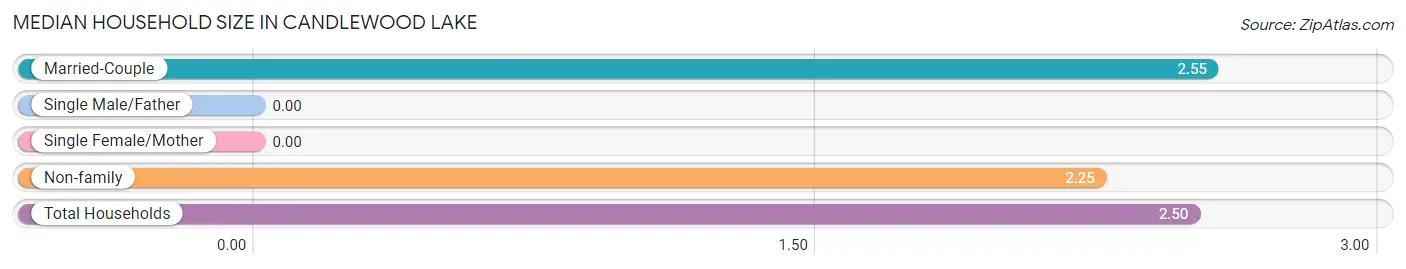
| Household Type | # Households | Household Size |
| Married-Couple | 396 (83.7%) | 2.55 |
| Single Male/Father | 0 (0.0%) | - |
| Single Female/Mother | 0 (0.0%) | - |
| Non-family | 77 (16.3%) | 2.25 |
| Total Households | 473 (100.0%) | 2.50 |
Household Size by Marriage Status in Candlewood Lake
Out of a total of 473 households in Candlewood Lake, 396 (83.7%) are family households, while 77 (16.3%) are nonfamily households. The most numerous type of family households are 2-person households, comprising 273, and the most common type of nonfamily households are 3-person households, comprising 47.
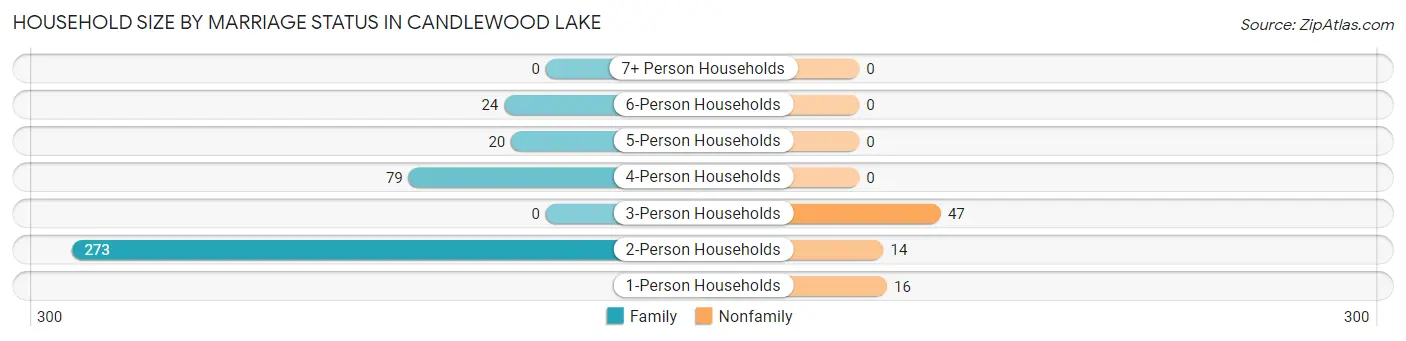
| Household Size | Family Households | Nonfamily Households |
| 1-Person Households | - | 16 (3.4%) |
| 2-Person Households | 273 (57.7%) | 14 (3.0%) |
| 3-Person Households | 0 (0.0%) | 47 (9.9%) |
| 4-Person Households | 79 (16.7%) | 0 (0.0%) |
| 5-Person Households | 20 (4.2%) | 0 (0.0%) |
| 6-Person Households | 24 (5.1%) | 0 (0.0%) |
| 7+ Person Households | 0 (0.0%) | 0 (0.0%) |
| Total | 396 (83.7%) | 77 (16.3%) |
Female Fertility in Candlewood Lake
Fertility by Age in Candlewood Lake
Average fertility rate in Candlewood Lake is 217.0 births per 1,000 women. Women in the age bracket of 35 to 50 years have the highest fertility rate with 482.0 births per 1,000 women. Women in the age bracket of 35 to 50 years acount for 100.0% of all women with births.
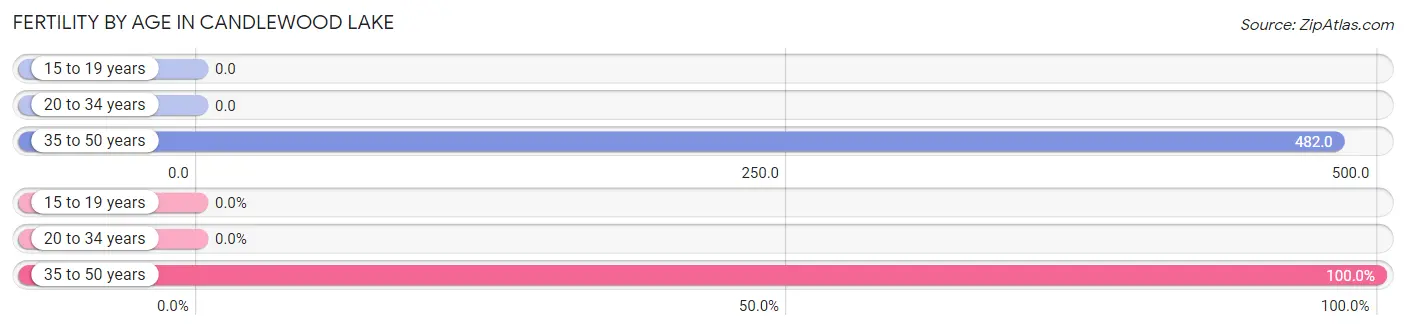
| Age Bracket | Women with Births | Births / 1,000 Women |
| 15 to 19 years | 0 (0.0%) | 0.0 |
| 20 to 34 years | 0 (0.0%) | 0.0 |
| 35 to 50 years | 55 (100.0%) | 482.0 |
| Total | 55 (100.0%) | 217.0 |
Fertility by Age by Marriage Status in Candlewood Lake
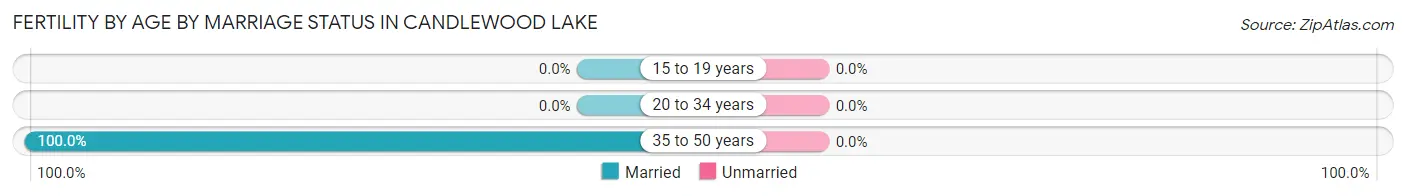
| Age Bracket | Married | Unmarried |
| 15 to 19 years | 0 (0.0%) | 0 (0.0%) |
| 20 to 34 years | 0 (0.0%) | 0 (0.0%) |
| 35 to 50 years | 55 (100.0%) | 0 (0.0%) |
| Total | 55 (100.0%) | 0 (0.0%) |
Fertility by Education in Candlewood Lake
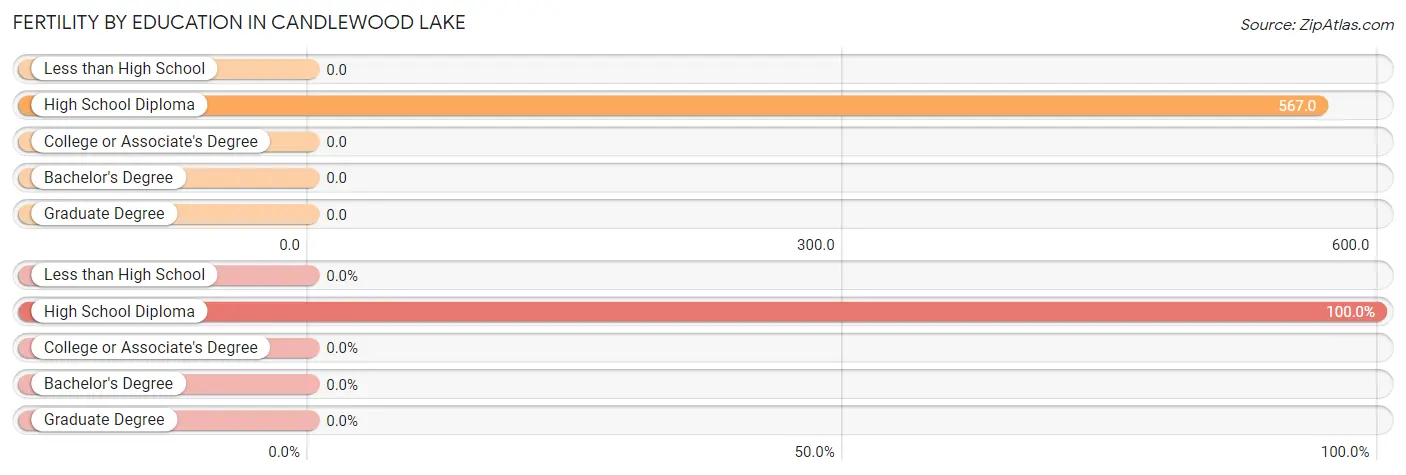
| Educational Attainment | Women with Births | Births / 1,000 Women |
| Less than High School | 0 (0.0%) | 0.0 |
| High School Diploma | 55 (100.0%) | 567.0 |
| College or Associate's Degree | 0 (0.0%) | 0.0 |
| Bachelor's Degree | 0 (0.0%) | 0.0 |
| Graduate Degree | 0 (0.0%) | 0.0 |
| Total | 55 (100.0%) | 217.0 |
Fertility by Education by Marriage Status in Candlewood Lake
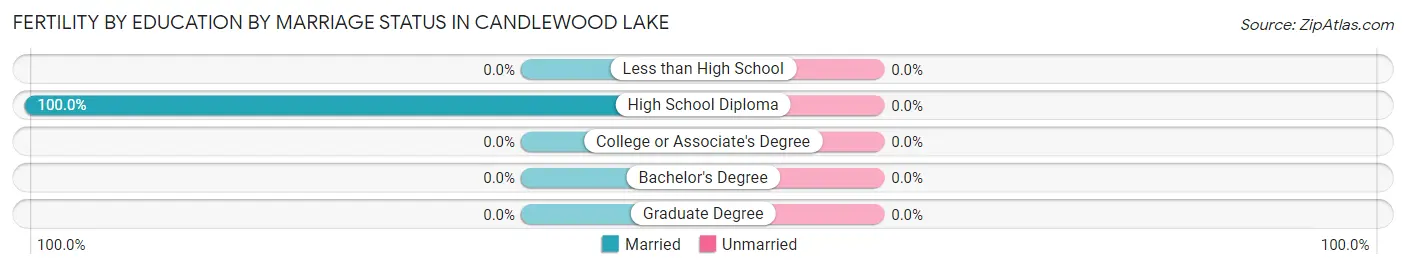
| Educational Attainment | Married | Unmarried |
| Less than High School | 0 (0.0%) | 0 (0.0%) |
| High School Diploma | 55 (100.0%) | 0 (0.0%) |
| College or Associate's Degree | 0 (0.0%) | 0 (0.0%) |
| Bachelor's Degree | 0 (0.0%) | 0 (0.0%) |
| Graduate Degree | 0 (0.0%) | 0 (0.0%) |
| Total | 55 (100.0%) | 0 (0.0%) |
Income in Candlewood Lake
Income Overview in Candlewood Lake
Per Capita Income in Candlewood Lake is $41,514, while median incomes of families and households are $106,044 and $106,277 respectively.
| Characteristic | Number | Measure |
| Per Capita Income | 1,181 | $41,514 |
| Median Family Income | 396 | $106,044 |
| Mean Family Income | 396 | $109,954 |
| Median Household Income | 473 | $106,277 |
| Mean Household Income | 473 | $106,840 |
| Income Deficit | 396 | $0 |
| Wage / Income Gap (%) | 1,181 | 0.33% |
| Wage / Income Gap ($) | 1,181 | 99.67¢ per $1 |
| Gini / Inequality Index | 1,181 | 0.25 |
Earnings by Sex in Candlewood Lake
Average Earnings in Candlewood Lake are $55,600, $55,532 for men and $55,714 for women, a difference of 0.3%.
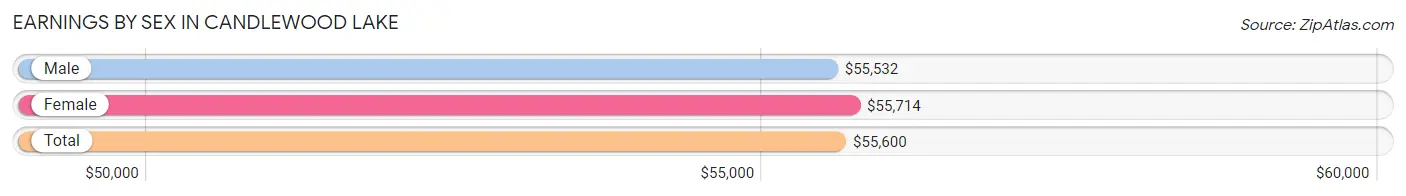
| Sex | Number | Average Earnings |
| Male | 380 (52.0%) | $55,532 |
| Female | 350 (47.9%) | $55,714 |
| Total | 730 (100.0%) | $55,600 |
Earnings by Sex by Income Bracket in Candlewood Lake
The most common earnings brackets in Candlewood Lake are $30,000 to $34,999 for men (90 | 23.7%) and $65,000 to $74,999 for women (91 | 26.0%).
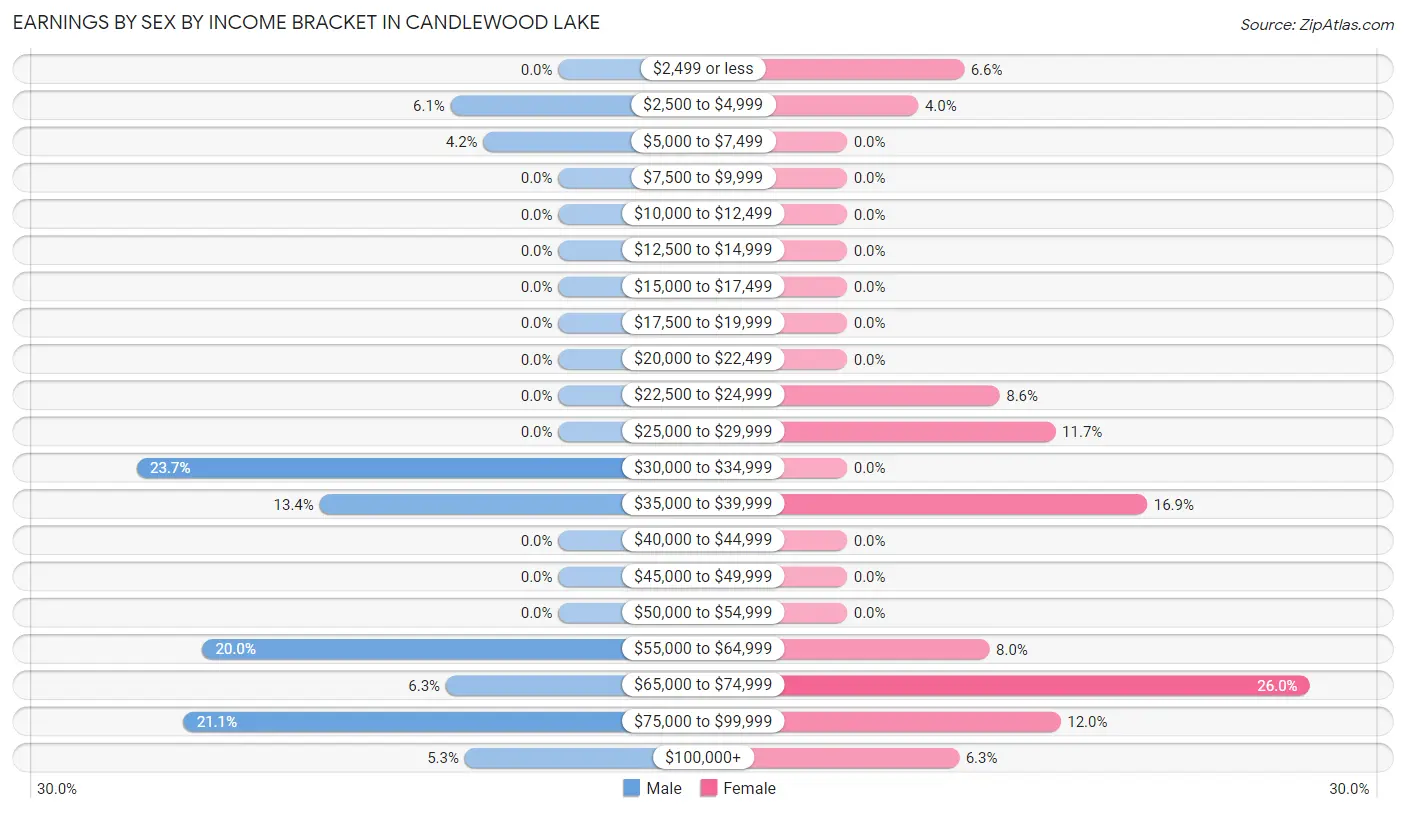
| Income | Male | Female |
| $2,499 or less | 0 (0.0%) | 23 (6.6%) |
| $2,500 to $4,999 | 23 (6.0%) | 14 (4.0%) |
| $5,000 to $7,499 | 16 (4.2%) | 0 (0.0%) |
| $7,500 to $9,999 | 0 (0.0%) | 0 (0.0%) |
| $10,000 to $12,499 | 0 (0.0%) | 0 (0.0%) |
| $12,500 to $14,999 | 0 (0.0%) | 0 (0.0%) |
| $15,000 to $17,499 | 0 (0.0%) | 0 (0.0%) |
| $17,500 to $19,999 | 0 (0.0%) | 0 (0.0%) |
| $20,000 to $22,499 | 0 (0.0%) | 0 (0.0%) |
| $22,500 to $24,999 | 0 (0.0%) | 30 (8.6%) |
| $25,000 to $29,999 | 0 (0.0%) | 41 (11.7%) |
| $30,000 to $34,999 | 90 (23.7%) | 0 (0.0%) |
| $35,000 to $39,999 | 51 (13.4%) | 59 (16.9%) |
| $40,000 to $44,999 | 0 (0.0%) | 0 (0.0%) |
| $45,000 to $49,999 | 0 (0.0%) | 0 (0.0%) |
| $50,000 to $54,999 | 0 (0.0%) | 0 (0.0%) |
| $55,000 to $64,999 | 76 (20.0%) | 28 (8.0%) |
| $65,000 to $74,999 | 24 (6.3%) | 91 (26.0%) |
| $75,000 to $99,999 | 80 (21.0%) | 42 (12.0%) |
| $100,000+ | 20 (5.3%) | 22 (6.3%) |
| Total | 380 (100.0%) | 350 (100.0%) |
Earnings by Sex by Educational Attainment in Candlewood Lake
Average earnings in Candlewood Lake are $55,532 for men and $67,816 for women, a difference of 18.1%. Men with an educational attainment of college or associate's degree enjoy the highest average annual earnings of $56,755, while those with high school diploma education earn the least with $34,833. Women with an educational attainment of high school diploma earn the most with the average annual earnings of $68,695, while those with college or associate's degree education have the smallest earnings of $38,232.
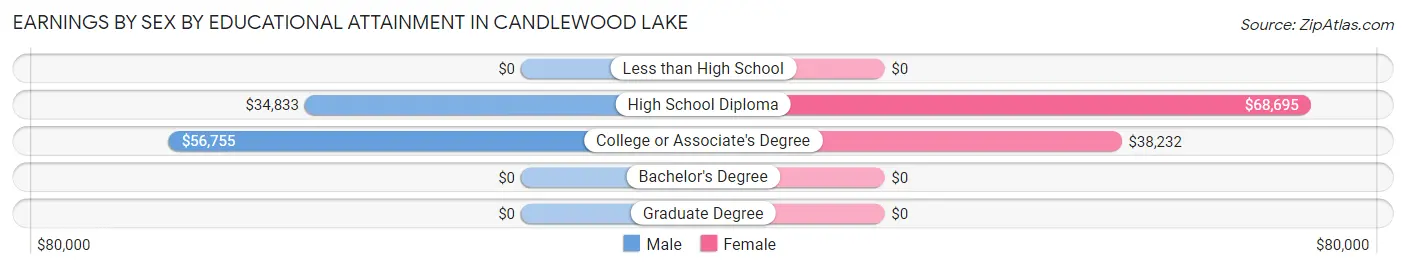
| Educational Attainment | Male Income | Female Income |
| Less than High School | - | - |
| High School Diploma | $34,833 | $68,695 |
| College or Associate's Degree | $56,755 | $38,232 |
| Bachelor's Degree | - | - |
| Graduate Degree | - | - |
| Total | $55,532 | $67,816 |
Family Income in Candlewood Lake
Family Income Brackets in Candlewood Lake
According to the Candlewood Lake family income data, there are 169 families falling into the $100,000 to $149,999 income range, which is the most common income bracket and makes up 42.7% of all families.
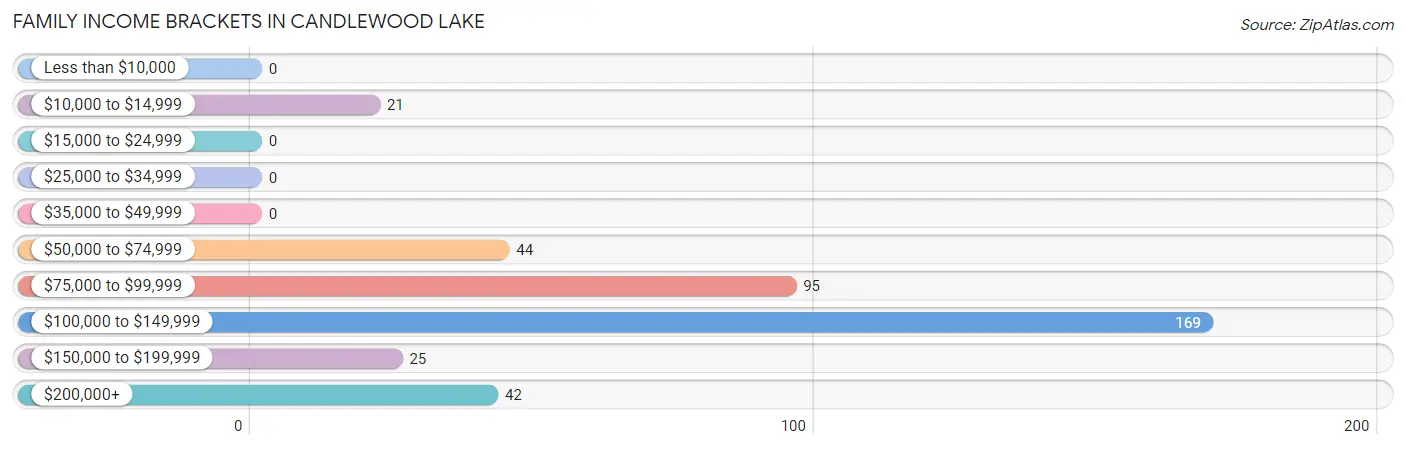
| Income Bracket | # Families | % Families |
| Less than $10,000 | 0 | 0.0% |
| $10,000 to $14,999 | 21 | 5.3% |
| $15,000 to $24,999 | 0 | 0.0% |
| $25,000 to $34,999 | 0 | 0.0% |
| $35,000 to $49,999 | 0 | 0.0% |
| $50,000 to $74,999 | 44 | 11.1% |
| $75,000 to $99,999 | 95 | 24.0% |
| $100,000 to $149,999 | 169 | 42.7% |
| $150,000 to $199,999 | 25 | 6.3% |
| $200,000+ | 42 | 10.6% |
Family Income by Famaliy Size in Candlewood Lake
2-person families (273 | 68.9%) account for the highest median family income in Candlewood Lake with $106,525 per family, while 2-person families (273 | 68.9%) have the highest median income of $53,262 per family member.
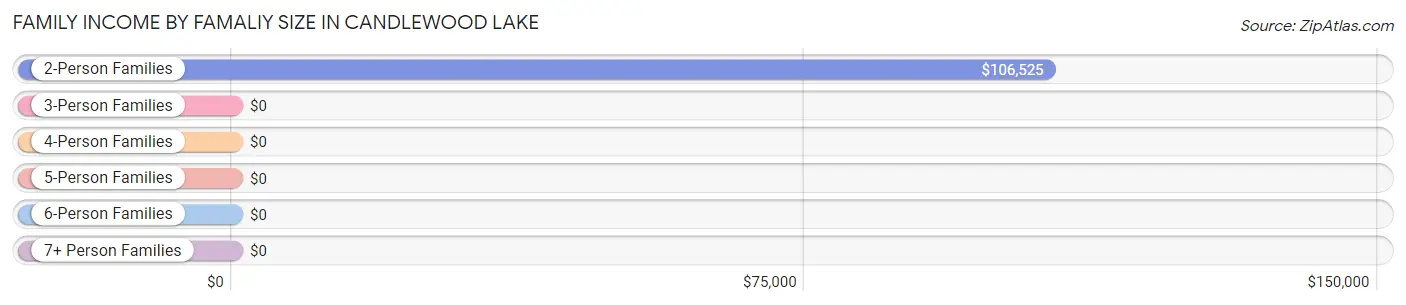
| Income Bracket | # Families | Median Income |
| 2-Person Families | 273 (68.9%) | $106,525 |
| 3-Person Families | 0 (0.0%) | $0 |
| 4-Person Families | 79 (20.0%) | $0 |
| 5-Person Families | 20 (5.1%) | $0 |
| 6-Person Families | 24 (6.1%) | $0 |
| 7+ Person Families | 0 (0.0%) | $0 |
| Total | 396 (100.0%) | $106,044 |
Family Income by Number of Earners in Candlewood Lake
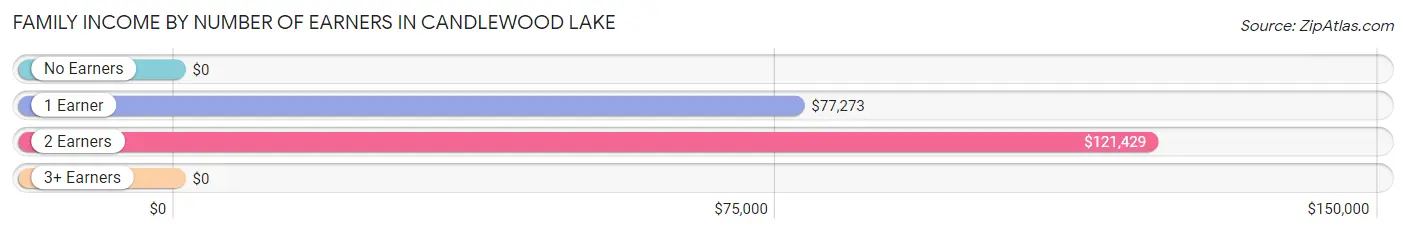
| Number of Earners | # Families | Median Income |
| No Earners | 58 (14.6%) | $0 |
| 1 Earner | 100 (25.3%) | $77,273 |
| 2 Earners | 214 (54.0%) | $121,429 |
| 3+ Earners | 24 (6.1%) | $0 |
| Total | 396 (100.0%) | $106,044 |
Household Income in Candlewood Lake
Household Income Brackets in Candlewood Lake
With 216 households falling in the category, the $100,000 to $149,999 income range is the most frequent in Candlewood Lake, accounting for 45.7% of all households.
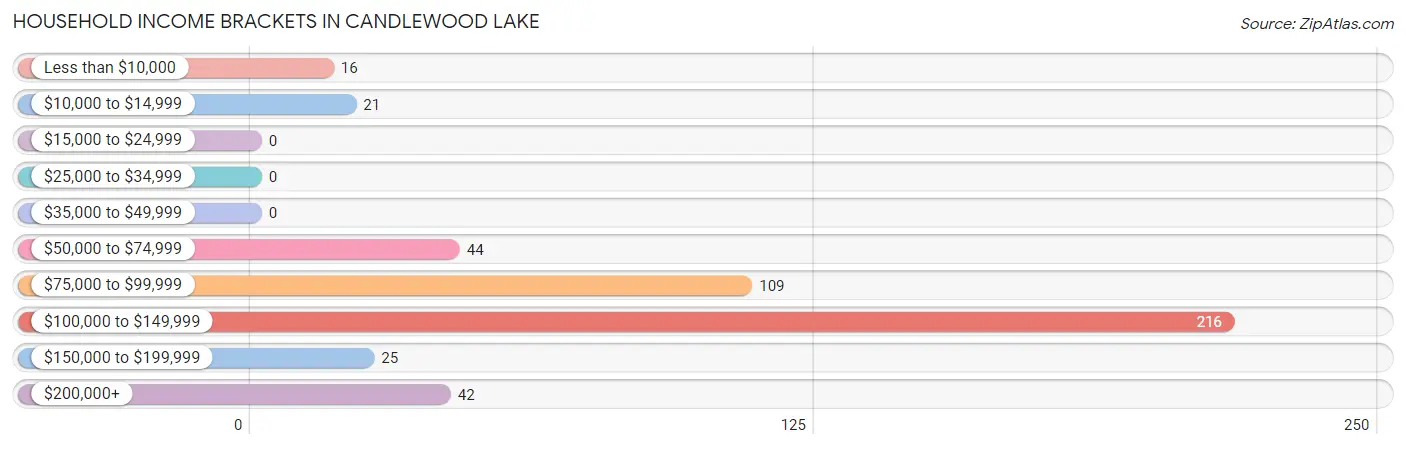
| Income Bracket | # Households | % Households |
| Less than $10,000 | 16 | 3.4% |
| $10,000 to $14,999 | 21 | 4.4% |
| $15,000 to $24,999 | 0 | 0.0% |
| $25,000 to $34,999 | 0 | 0.0% |
| $35,000 to $49,999 | 0 | 0.0% |
| $50,000 to $74,999 | 44 | 9.3% |
| $75,000 to $99,999 | 109 | 23.0% |
| $100,000 to $149,999 | 216 | 45.7% |
| $150,000 to $199,999 | 25 | 5.3% |
| $200,000+ | 42 | 8.9% |
Household Income by Householder Age in Candlewood Lake
The median household income in Candlewood Lake is $106,277, with the highest median household income of $123,029 found in the 65+ years age bracket for the primary householder. A total of 133 households (28.1%) fall into this category.
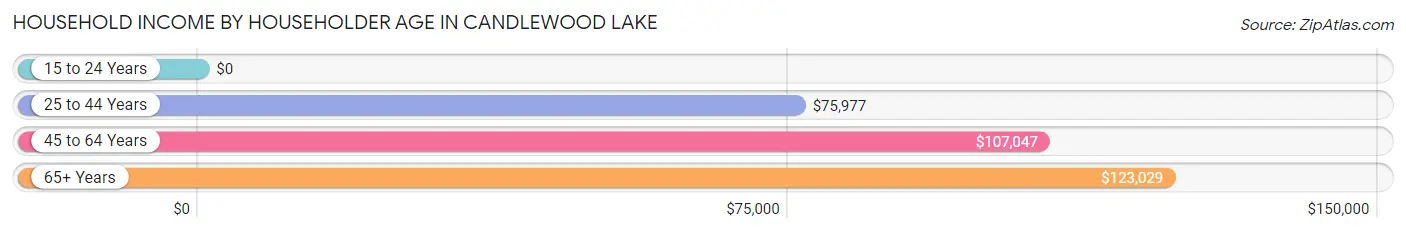
| Income Bracket | # Households | Median Income |
| 15 to 24 Years | 0 (0.0%) | $0 |
| 25 to 44 Years | 123 (26.0%) | $75,977 |
| 45 to 64 Years | 217 (45.9%) | $107,047 |
| 65+ Years | 133 (28.1%) | $123,029 |
| Total | 473 (100.0%) | $106,277 |
Poverty in Candlewood Lake
Income Below Poverty by Sex and Age in Candlewood Lake
With 5.6% poverty level for males and 3.3% for females among the residents of Candlewood Lake, 35 to 44 year old males and 65 to 74 year old females are the most vulnerable to poverty, with 16 males (22.5%) and 21 females (21.0%) in their respective age groups living below the poverty level.
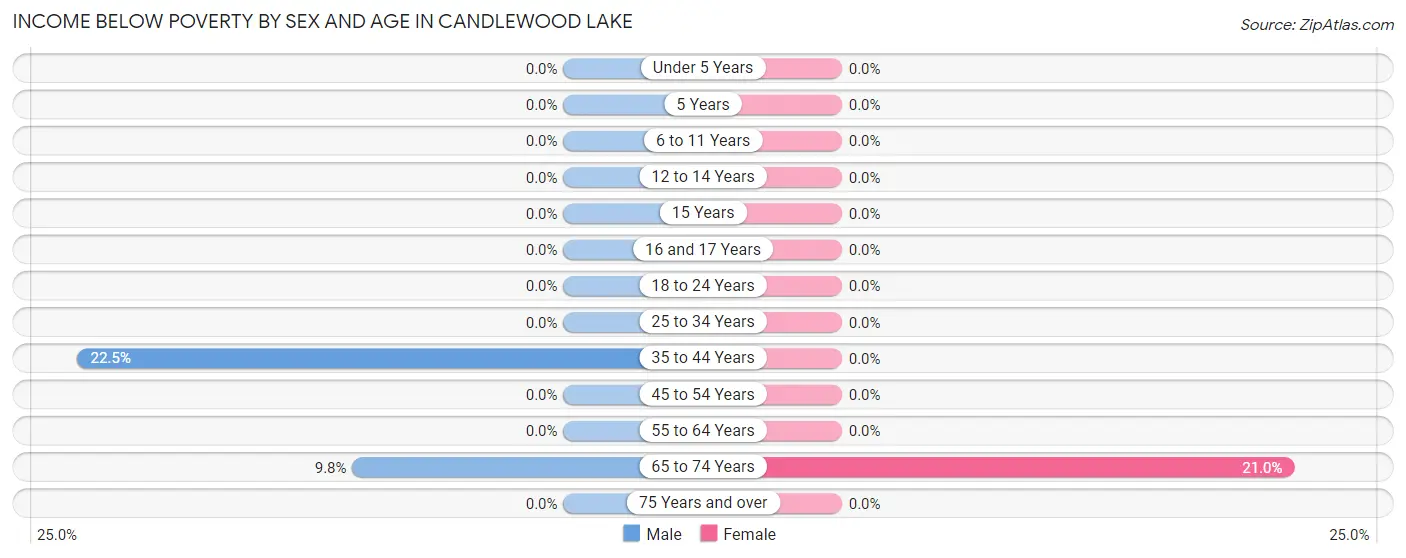
| Age Bracket | Male | Female |
| Under 5 Years | 0 (0.0%) | 0 (0.0%) |
| 5 Years | 0 (0.0%) | 0 (0.0%) |
| 6 to 11 Years | 0 (0.0%) | 0 (0.0%) |
| 12 to 14 Years | 0 (0.0%) | 0 (0.0%) |
| 15 Years | 0 (0.0%) | 0 (0.0%) |
| 16 and 17 Years | 0 (0.0%) | 0 (0.0%) |
| 18 to 24 Years | 0 (0.0%) | 0 (0.0%) |
| 25 to 34 Years | 0 (0.0%) | 0 (0.0%) |
| 35 to 44 Years | 16 (22.5%) | 0 (0.0%) |
| 45 to 54 Years | 0 (0.0%) | 0 (0.0%) |
| 55 to 64 Years | 0 (0.0%) | 0 (0.0%) |
| 65 to 74 Years | 14 (9.8%) | 21 (21.0%) |
| 75 Years and over | 0 (0.0%) | 0 (0.0%) |
| Total | 30 (5.6%) | 21 (3.3%) |
Income Above Poverty by Sex and Age in Candlewood Lake
According to the poverty statistics in Candlewood Lake, males aged 5 years and females aged under 5 years are the age groups that are most secure financially, with 100.0% of males and 100.0% of females in these age groups living above the poverty line.
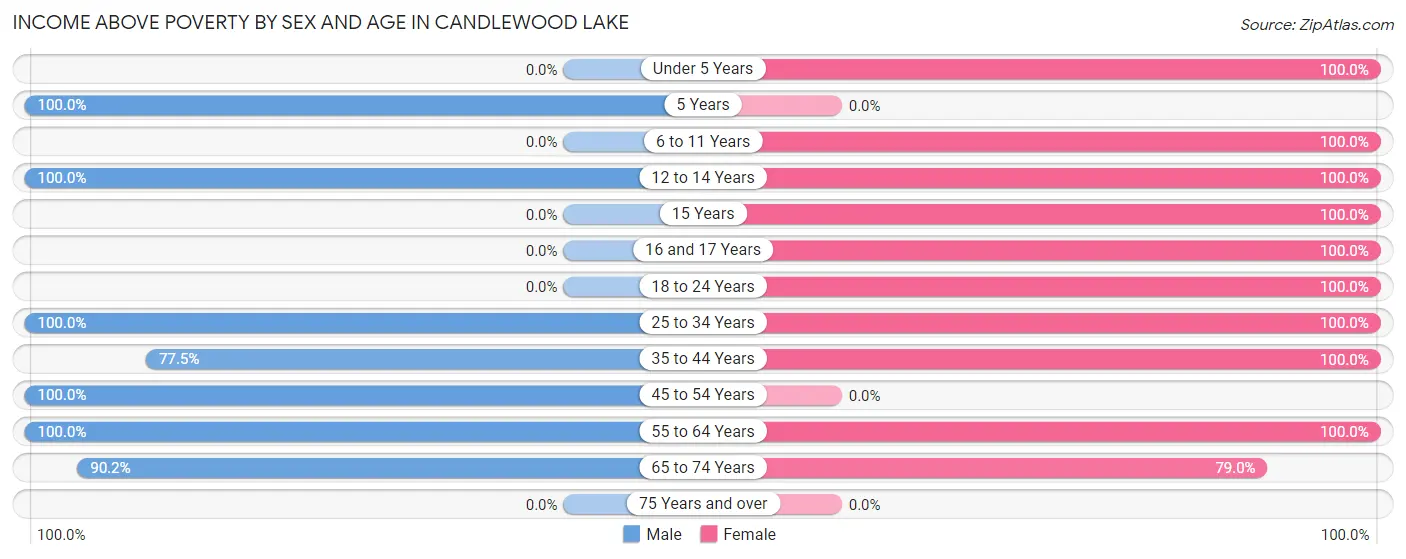
| Age Bracket | Male | Female |
| Under 5 Years | 0 (0.0%) | 84 (100.0%) |
| 5 Years | 25 (100.0%) | 0 (0.0%) |
| 6 to 11 Years | 0 (0.0%) | 20 (100.0%) |
| 12 to 14 Years | 27 (100.0%) | 31 (100.0%) |
| 15 Years | 0 (0.0%) | 14 (100.0%) |
| 16 and 17 Years | 0 (0.0%) | 25 (100.0%) |
| 18 to 24 Years | 0 (0.0%) | 49 (100.0%) |
| 25 to 34 Years | 53 (100.0%) | 51 (100.0%) |
| 35 to 44 Years | 55 (77.5%) | 114 (100.0%) |
| 45 to 54 Years | 92 (100.0%) | 0 (0.0%) |
| 55 to 64 Years | 129 (100.0%) | 153 (100.0%) |
| 65 to 74 Years | 129 (90.2%) | 79 (79.0%) |
| 75 Years and over | 0 (0.0%) | 0 (0.0%) |
| Total | 510 (94.4%) | 620 (96.7%) |
Income Below Poverty Among Married-Couple Families in Candlewood Lake
The poverty statistics for married-couple families in Candlewood Lake show that 5.3% or 21 of the total 396 families live below the poverty line. Families with no children have the highest poverty rate of 7.7%, comprising of 21 families. On the other hand, families with 1 or 2 children have the lowest poverty rate of 0.0%, which includes 0 families.
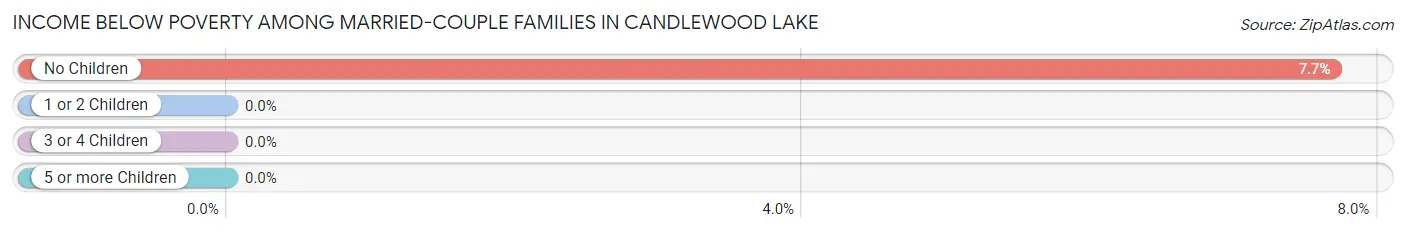
| Children | Above Poverty | Below Poverty |
| No Children | 252 (92.3%) | 21 (7.7%) |
| 1 or 2 Children | 79 (100.0%) | 0 (0.0%) |
| 3 or 4 Children | 44 (100.0%) | 0 (0.0%) |
| 5 or more Children | 0 (0.0%) | 0 (0.0%) |
| Total | 375 (94.7%) | 21 (5.3%) |
Income Below Poverty Among Single-Parent Households in Candlewood Lake
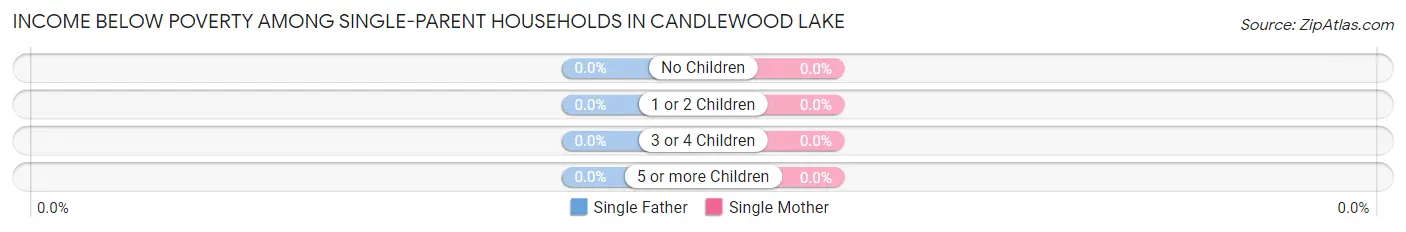
| Children | Single Father | Single Mother |
| No Children | 0 (0.0%) | 0 (0.0%) |
| 1 or 2 Children | 0 (0.0%) | 0 (0.0%) |
| 3 or 4 Children | 0 (0.0%) | 0 (0.0%) |
| 5 or more Children | 0 (0.0%) | 0 (0.0%) |
| Total | 0 (0.0%) | 0 (0.0%) |
Income Below Poverty Among Married-Couple vs Single-Parent Households in Candlewood Lake
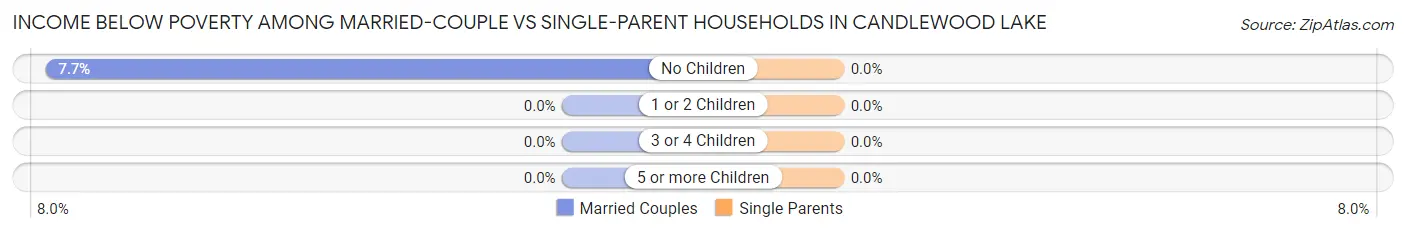
| Children | Married-Couple Families | Single-Parent Households |
| No Children | 21 (7.7%) | 0 (0.0%) |
| 1 or 2 Children | 0 (0.0%) | 0 (0.0%) |
| 3 or 4 Children | 0 (0.0%) | 0 (0.0%) |
| 5 or more Children | 0 (0.0%) | 0 (0.0%) |
| Total | 21 (5.3%) | 0 (0.0%) |
Employment Characteristics in Candlewood Lake
Employment by Class of Employer in Candlewood Lake
Among the 650 employed individuals in Candlewood Lake, private company employees (321 | 49.4%), self-employed (not incorporated) (91 | 14.0%), and self-employed (incorporated) (57 | 8.8%) make up the most common classes of employment.
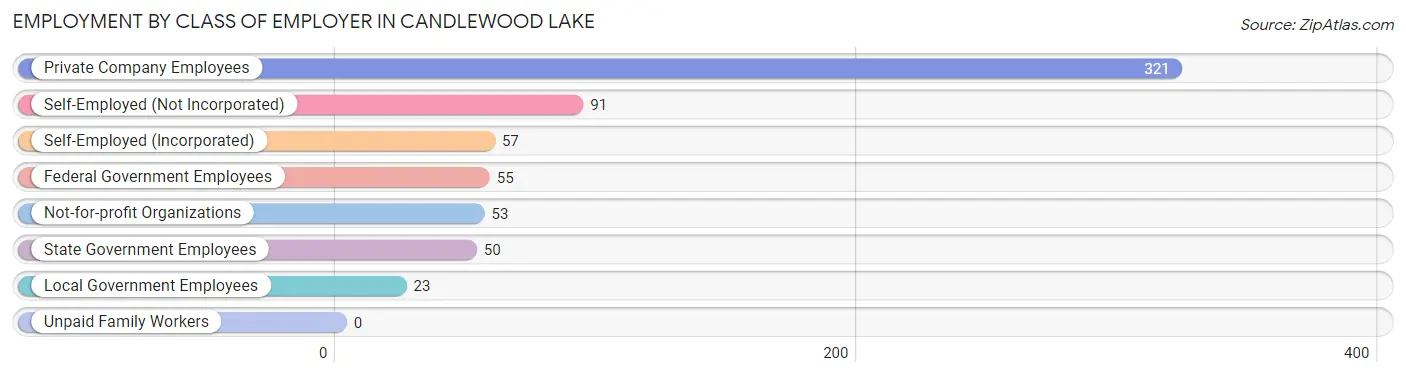
| Employer Class | # Employees | % Employees |
| Private Company Employees | 321 | 49.4% |
| Self-Employed (Incorporated) | 57 | 8.8% |
| Self-Employed (Not Incorporated) | 91 | 14.0% |
| Not-for-profit Organizations | 53 | 8.2% |
| Local Government Employees | 23 | 3.5% |
| State Government Employees | 50 | 7.7% |
| Federal Government Employees | 55 | 8.5% |
| Unpaid Family Workers | 0 | 0.0% |
| Total | 650 | 100.0% |
Employment Status by Age in Candlewood Lake
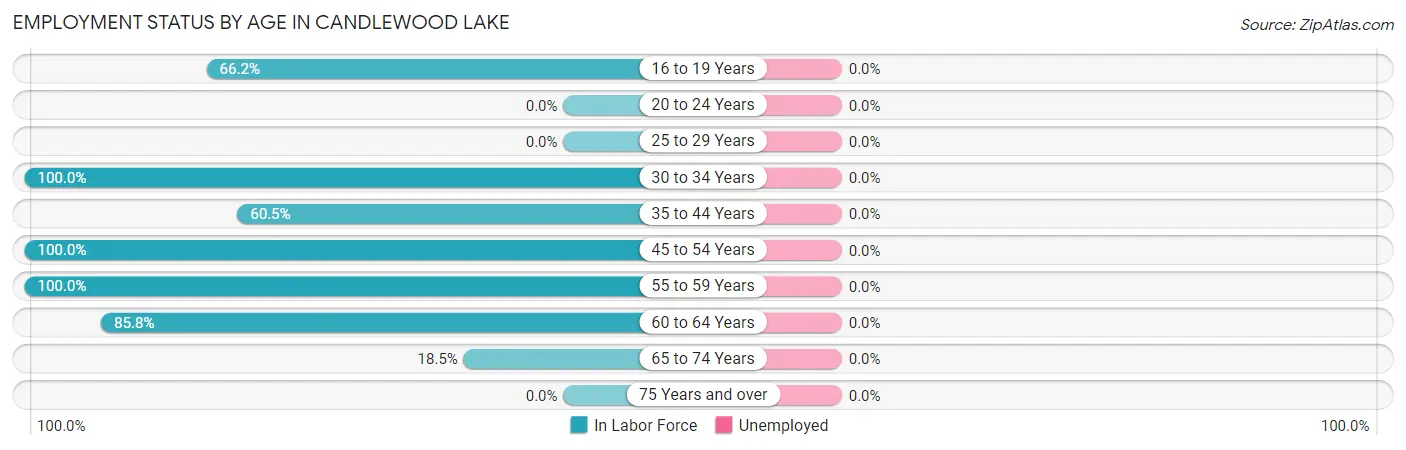
| Age Bracket | In Labor Force | Unemployed |
| 16 to 19 Years | 49 (66.2%) | 0 (0.0%) |
| 20 to 24 Years | 0 (0.0%) | 0 (0.0%) |
| 25 to 29 Years | 0 (0.0%) | 0 (0.0%) |
| 30 to 34 Years | 104 (100.0%) | 0 (0.0%) |
| 35 to 44 Years | 112 (60.5%) | 0 (0.0%) |
| 45 to 54 Years | 92 (100.0%) | 0 (0.0%) |
| 55 to 59 Years | 42 (100.0%) | 0 (0.0%) |
| 60 to 64 Years | 206 (85.8%) | 0 (0.0%) |
| 65 to 74 Years | 45 (18.5%) | 0 (0.0%) |
| 75 Years and over | 0 (0.0%) | 0 (0.0%) |
| Total | 650 (66.3%) | 0 (0.0%) |
Employment Status by Educational Attainment in Candlewood Lake
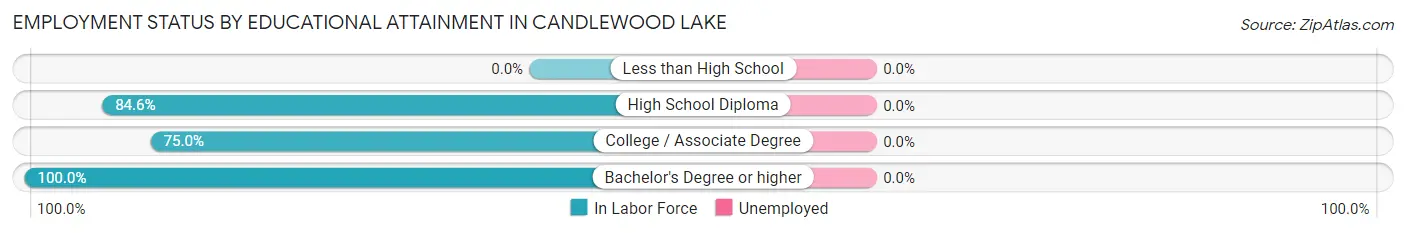
| Educational Attainment | In Labor Force | Unemployed |
| Less than High School | 0 (0.0%) | 0 (0.0%) |
| High School Diploma | 301 (84.6%) | 0 (0.0%) |
| College / Associate Degree | 156 (75.0%) | 0 (0.0%) |
| Bachelor's Degree or higher | 99 (100.0%) | 0 (0.0%) |
| Total | 556 (83.9%) | 0 (0.0%) |
Employment Occupations by Sex in Candlewood Lake
Management, Business, Science and Arts Occupations
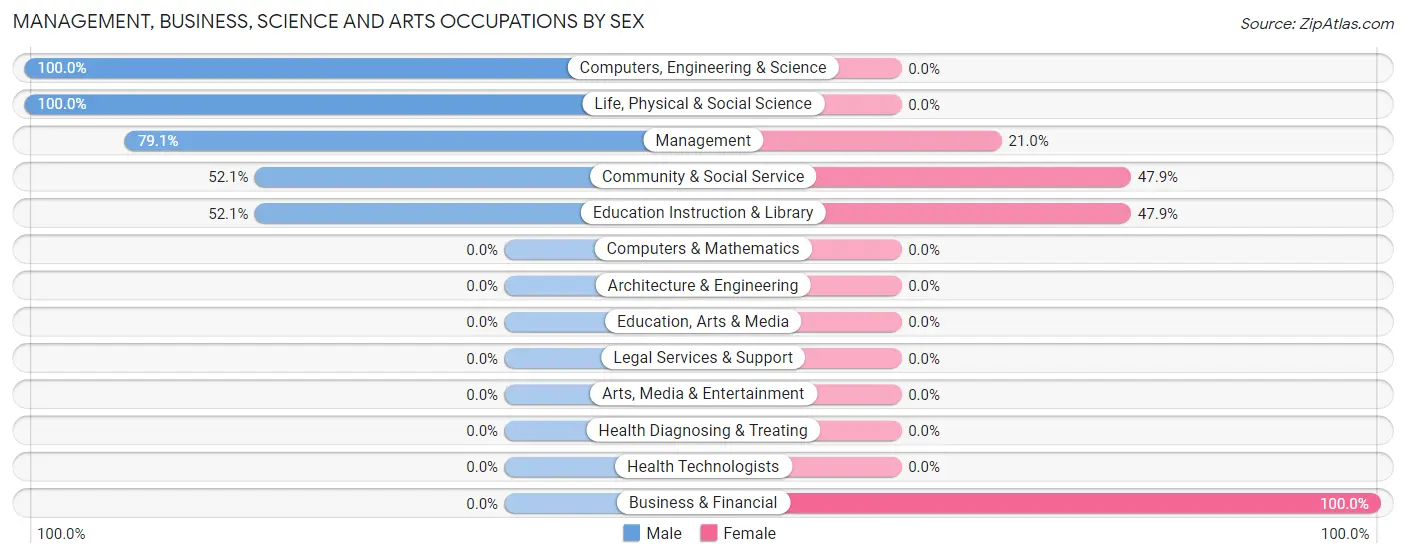
The most common Management, Business, Science and Arts occupations in Candlewood Lake are Management (105 | 17.6%), Community & Social Service (48 | 8.1%), Education Instruction & Library (48 | 8.1%), Business & Financial (23 | 3.9%), and Computers, Engineering & Science (23 | 3.9%).
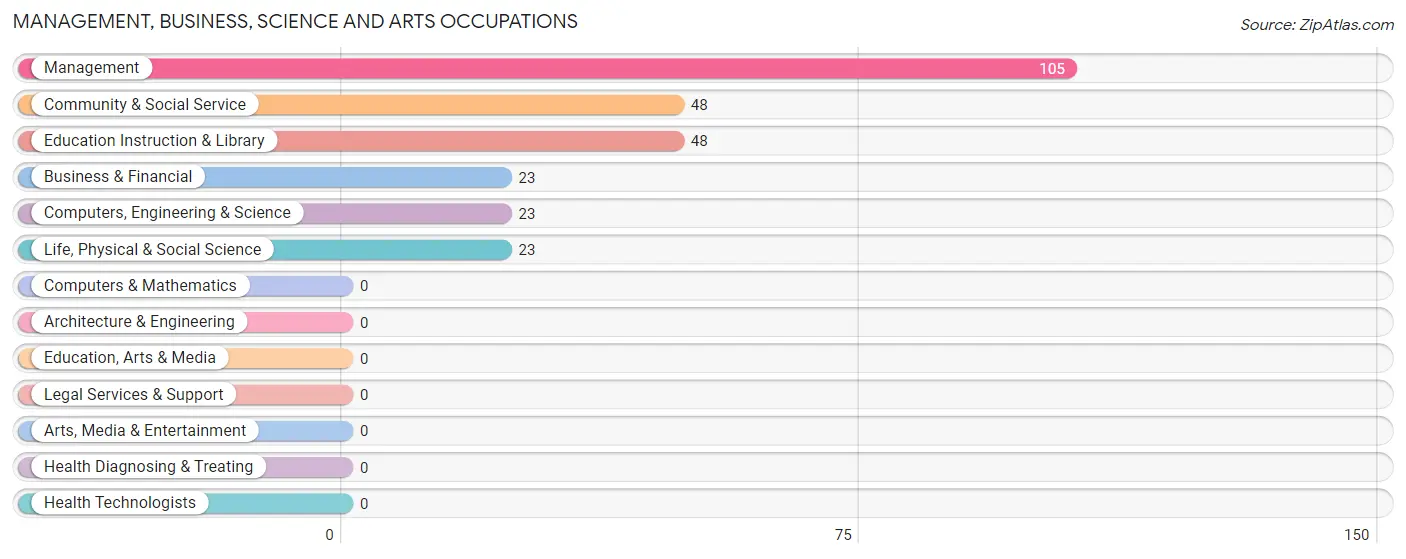
Management, Business, Science and Arts Occupations by Sex
Within the Management, Business, Science and Arts occupations in Candlewood Lake, the most male-oriented occupations are Computers, Engineering & Science (100.0%), Life, Physical & Social Science (100.0%), and Management (79.0%), while the most female-oriented occupations are Business & Financial (100.0%), Community & Social Service (47.9%), and Education Instruction & Library (47.9%).
| Occupation | Male | Female |
| Management | 83 (79.0%) | 22 (20.9%) |
| Business & Financial | 0 (0.0%) | 23 (100.0%) |
| Computers, Engineering & Science | 23 (100.0%) | 0 (0.0%) |
| Computers & Mathematics | 0 (0.0%) | 0 (0.0%) |
| Architecture & Engineering | 0 (0.0%) | 0 (0.0%) |
| Life, Physical & Social Science | 23 (100.0%) | 0 (0.0%) |
| Community & Social Service | 25 (52.1%) | 23 (47.9%) |
| Education, Arts & Media | 0 (0.0%) | 0 (0.0%) |
| Legal Services & Support | 0 (0.0%) | 0 (0.0%) |
| Education Instruction & Library | 25 (52.1%) | 23 (47.9%) |
| Arts, Media & Entertainment | 0 (0.0%) | 0 (0.0%) |
| Health Diagnosing & Treating | 0 (0.0%) | 0 (0.0%) |
| Health Technologists | 0 (0.0%) | 0 (0.0%) |
| Total (Category) | 131 (65.8%) | 68 (34.2%) |
| Total (Overall) | 299 (50.2%) | 296 (49.7%) |
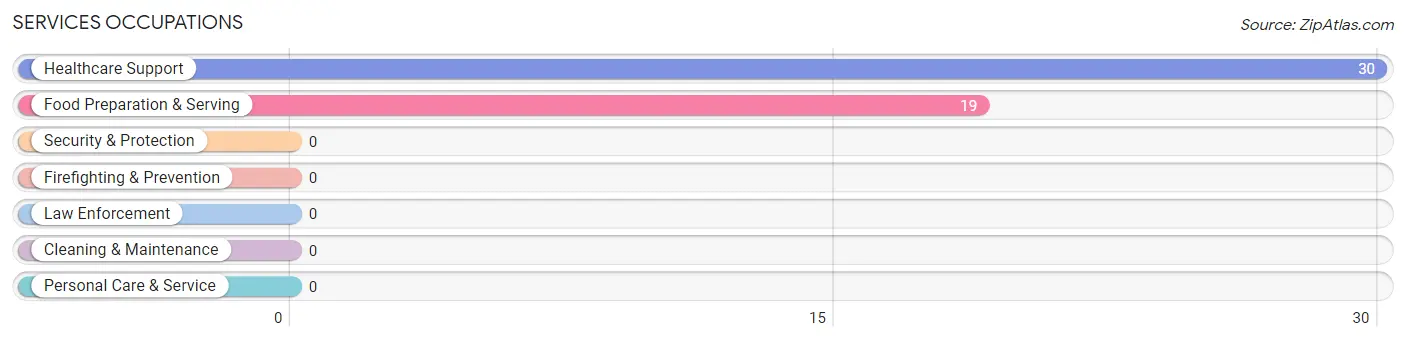
Services Occupations
The most common Services occupations in Candlewood Lake are Healthcare Support (30 | 5.0%), and Food Preparation & Serving (19 | 3.2%).
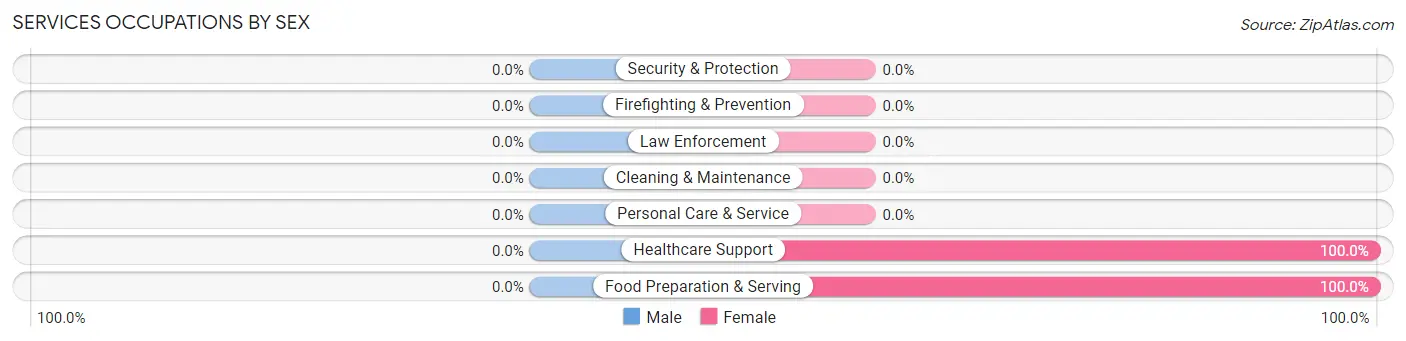
Services Occupations by Sex
| Occupation | Male | Female |
| Healthcare Support | 0 (0.0%) | 30 (100.0%) |
| Security & Protection | 0 (0.0%) | 0 (0.0%) |
| Firefighting & Prevention | 0 (0.0%) | 0 (0.0%) |
| Law Enforcement | 0 (0.0%) | 0 (0.0%) |
| Food Preparation & Serving | 0 (0.0%) | 19 (100.0%) |
| Cleaning & Maintenance | 0 (0.0%) | 0 (0.0%) |
| Personal Care & Service | 0 (0.0%) | 0 (0.0%) |
| Total (Category) | 0 (0.0%) | 49 (100.0%) |
| Total (Overall) | 299 (50.2%) | 296 (49.7%) |
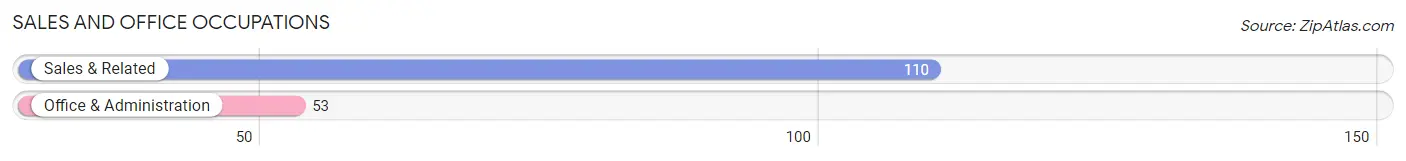
Sales and Office Occupations
The most common Sales and Office occupations in Candlewood Lake are Sales & Related (110 | 18.5%), and Office & Administration (53 | 8.9%).
Sales and Office Occupations by Sex
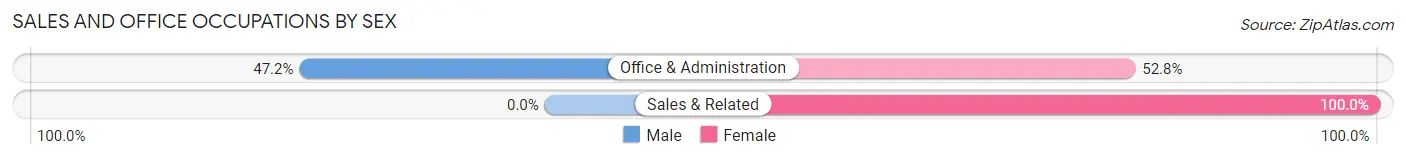
| Occupation | Male | Female |
| Sales & Related | 0 (0.0%) | 110 (100.0%) |
| Office & Administration | 25 (47.2%) | 28 (52.8%) |
| Total (Category) | 25 (15.3%) | 138 (84.7%) |
| Total (Overall) | 299 (50.2%) | 296 (49.7%) |
Natural Resources, Construction and Maintenance Occupations
The most common Natural Resources, Construction and Maintenance occupations in Candlewood Lake are Construction & Extraction (29 | 4.9%), and Installation, Maintenance & Repair (24 | 4.0%).
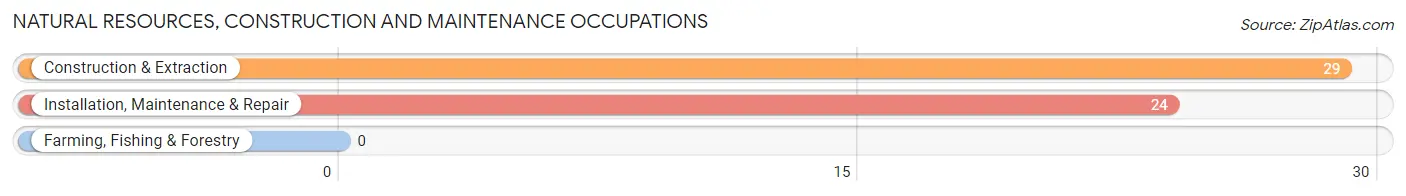
Natural Resources, Construction and Maintenance Occupations by Sex
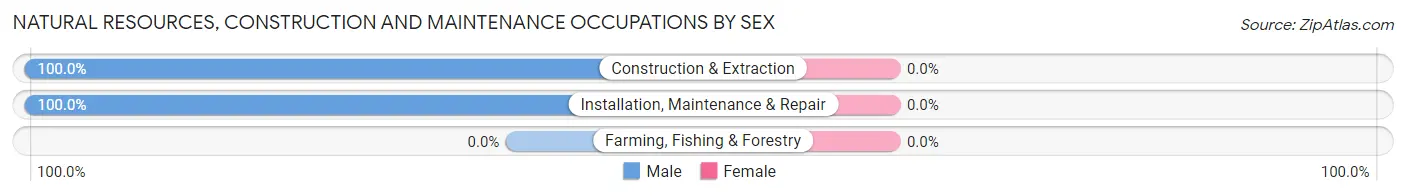
| Occupation | Male | Female |
| Farming, Fishing & Forestry | 0 (0.0%) | 0 (0.0%) |
| Construction & Extraction | 29 (100.0%) | 0 (0.0%) |
| Installation, Maintenance & Repair | 24 (100.0%) | 0 (0.0%) |
| Total (Category) | 53 (100.0%) | 0 (0.0%) |
| Total (Overall) | 299 (50.2%) | 296 (49.7%) |
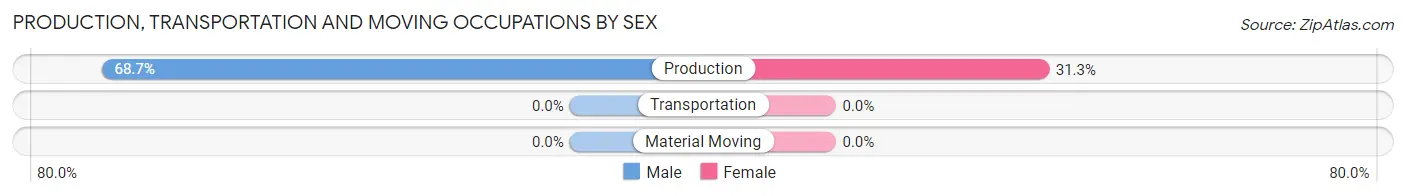
Production, Transportation and Moving Occupations
The most common Production, Transportation and Moving occupations in Candlewood Lake are , and Production (131 | 22.0%).
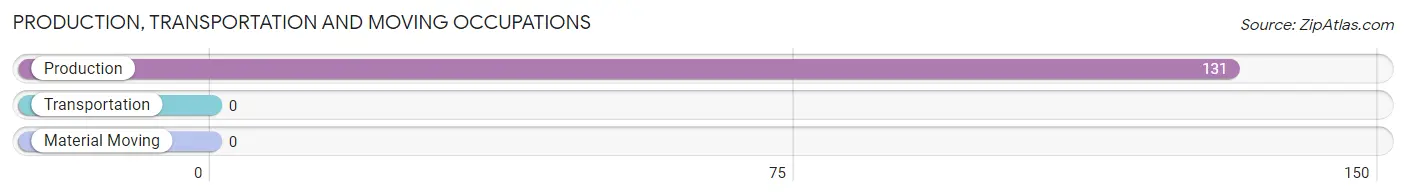
Production, Transportation and Moving Occupations by Sex
| Occupation | Male | Female |
| Production | 90 (68.7%) | 41 (31.3%) |
| Transportation | 0 (0.0%) | 0 (0.0%) |
| Material Moving | 0 (0.0%) | 0 (0.0%) |
| Total (Category) | 90 (68.7%) | 41 (31.3%) |
| Total (Overall) | 299 (50.2%) | 296 (49.7%) |
Employment Industries by Sex in Candlewood Lake
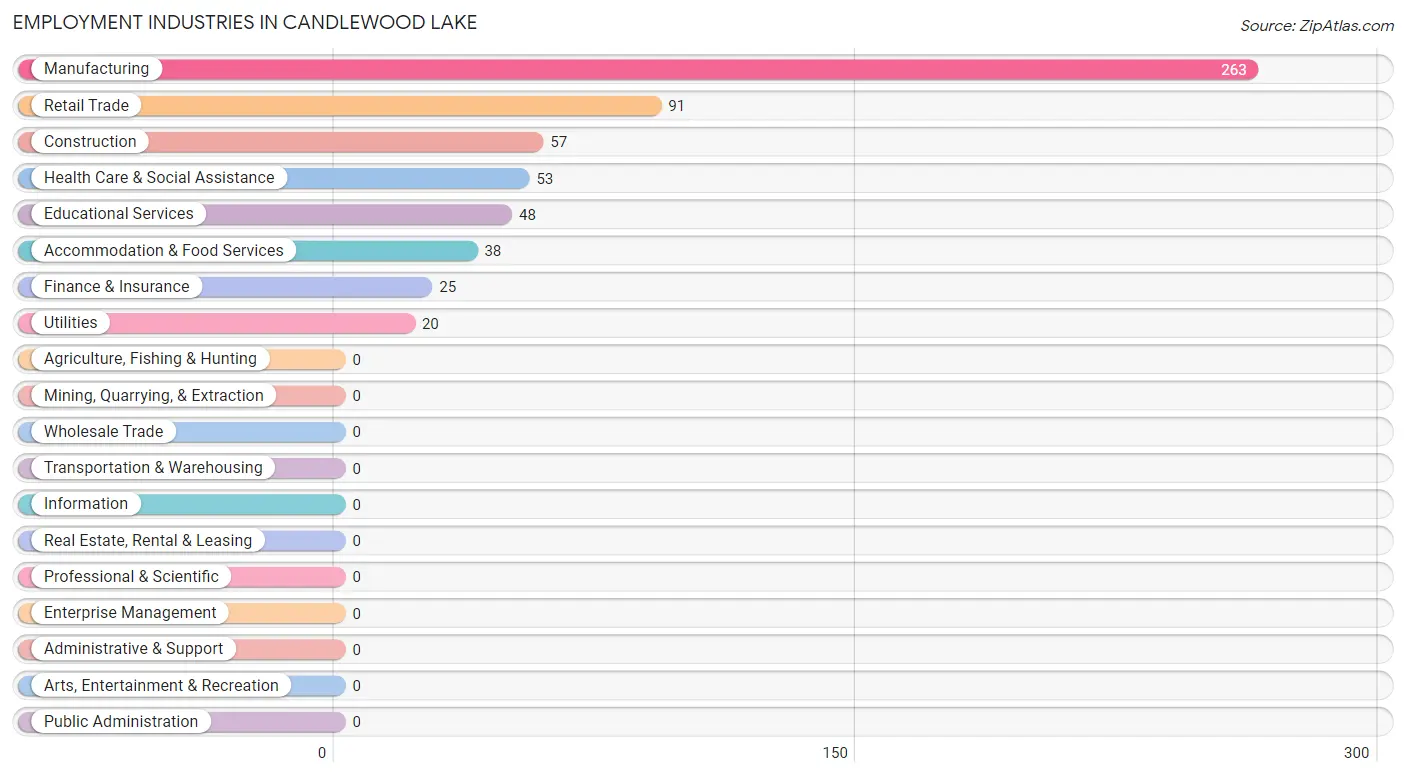
Employment Industries in Candlewood Lake
The major employment industries in Candlewood Lake include Manufacturing (263 | 44.2%), Retail Trade (91 | 15.3%), Construction (57 | 9.6%), Health Care & Social Assistance (53 | 8.9%), and Educational Services (48 | 8.1%).
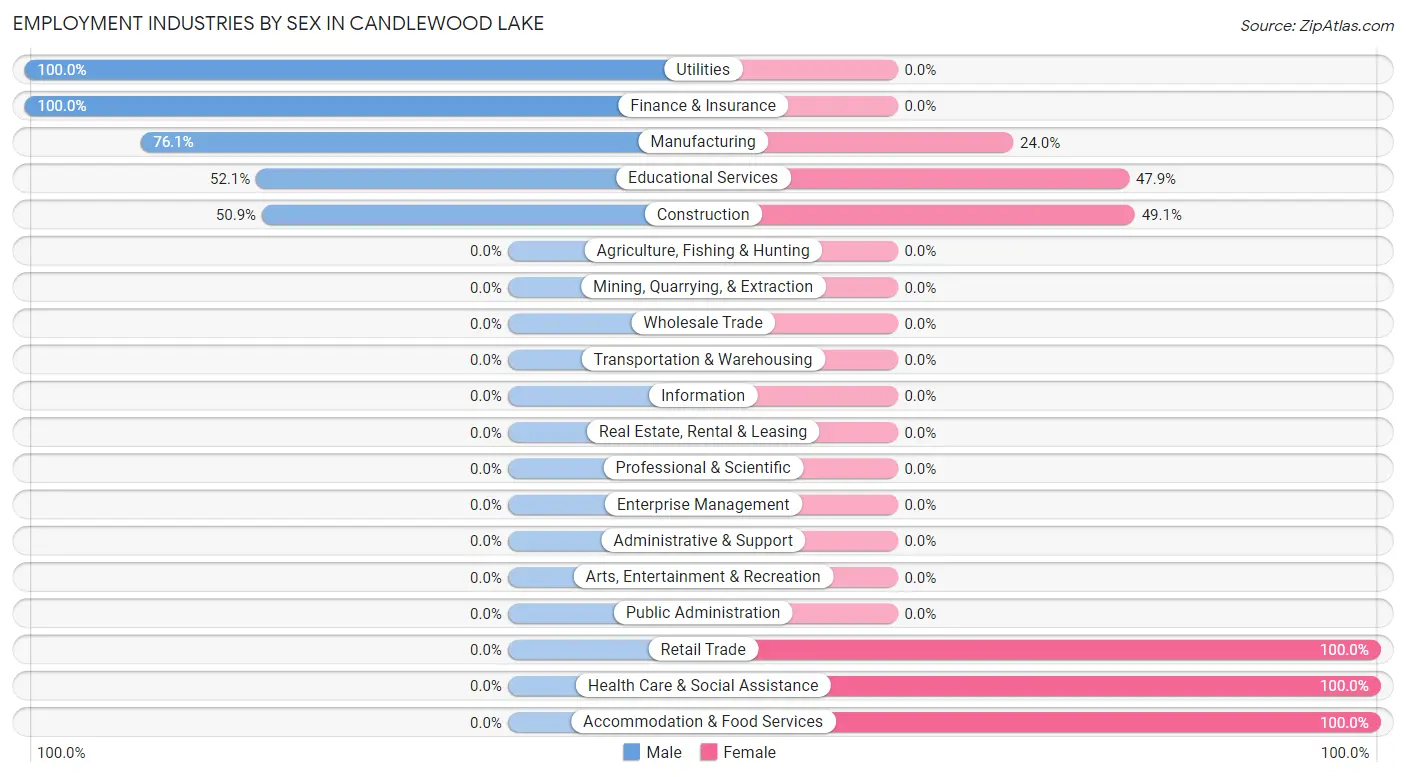
Employment Industries by Sex in Candlewood Lake
The Candlewood Lake industries that see more men than women are Utilities (100.0%), Finance & Insurance (100.0%), and Manufacturing (76.0%), whereas the industries that tend to have a higher number of women are Retail Trade (100.0%), Health Care & Social Assistance (100.0%), and Accommodation & Food Services (100.0%).
| Industry | Male | Female |
| Agriculture, Fishing & Hunting | 0 (0.0%) | 0 (0.0%) |
| Mining, Quarrying, & Extraction | 0 (0.0%) | 0 (0.0%) |
| Construction | 29 (50.9%) | 28 (49.1%) |
| Manufacturing | 200 (76.0%) | 63 (23.9%) |
| Wholesale Trade | 0 (0.0%) | 0 (0.0%) |
| Retail Trade | 0 (0.0%) | 91 (100.0%) |
| Transportation & Warehousing | 0 (0.0%) | 0 (0.0%) |
| Utilities | 20 (100.0%) | 0 (0.0%) |
| Information | 0 (0.0%) | 0 (0.0%) |
| Finance & Insurance | 25 (100.0%) | 0 (0.0%) |
| Real Estate, Rental & Leasing | 0 (0.0%) | 0 (0.0%) |
| Professional & Scientific | 0 (0.0%) | 0 (0.0%) |
| Enterprise Management | 0 (0.0%) | 0 (0.0%) |
| Administrative & Support | 0 (0.0%) | 0 (0.0%) |
| Educational Services | 25 (52.1%) | 23 (47.9%) |
| Health Care & Social Assistance | 0 (0.0%) | 53 (100.0%) |
| Arts, Entertainment & Recreation | 0 (0.0%) | 0 (0.0%) |
| Accommodation & Food Services | 0 (0.0%) | 38 (100.0%) |
| Public Administration | 0 (0.0%) | 0 (0.0%) |
| Total | 299 (50.2%) | 296 (49.7%) |
Education in Candlewood Lake
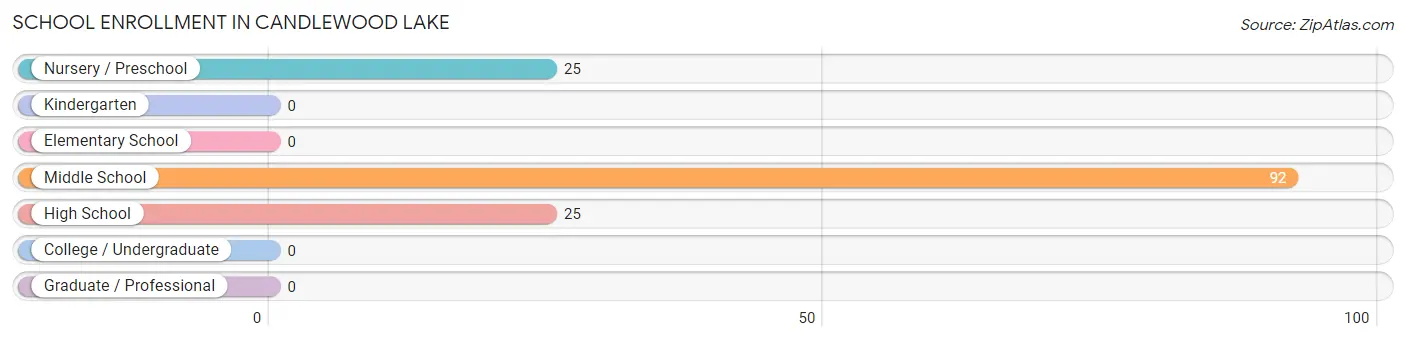
School Enrollment in Candlewood Lake
The most common levels of schooling among the 142 students in Candlewood Lake are middle school (92 | 64.8%), nursery / preschool (25 | 17.6%), and high school (25 | 17.6%).
| School Level | # Students | % Students |
| Nursery / Preschool | 25 | 17.6% |
| Kindergarten | 0 | 0.0% |
| Elementary School | 0 | 0.0% |
| Middle School | 92 | 64.8% |
| High School | 25 | 17.6% |
| College / Undergraduate | 0 | 0.0% |
| Graduate / Professional | 0 | 0.0% |
| Total | 142 | 100.0% |
School Enrollment by Age by Funding Source in Candlewood Lake
Out of a total of 142 students who are enrolled in schools in Candlewood Lake, 27 (19.0%) attend a private institution, while the remaining 115 (81.0%) are enrolled in public schools. The age group of 15 to 17 year olds has the highest likelihood of being enrolled in private schools, with 11 (28.2% in the age bracket) enrolled. Conversely, the age group of 5 to 9 year old has the lowest likelihood of being enrolled in a private school, with 25 (100.0% in the age bracket) attending a public institution.
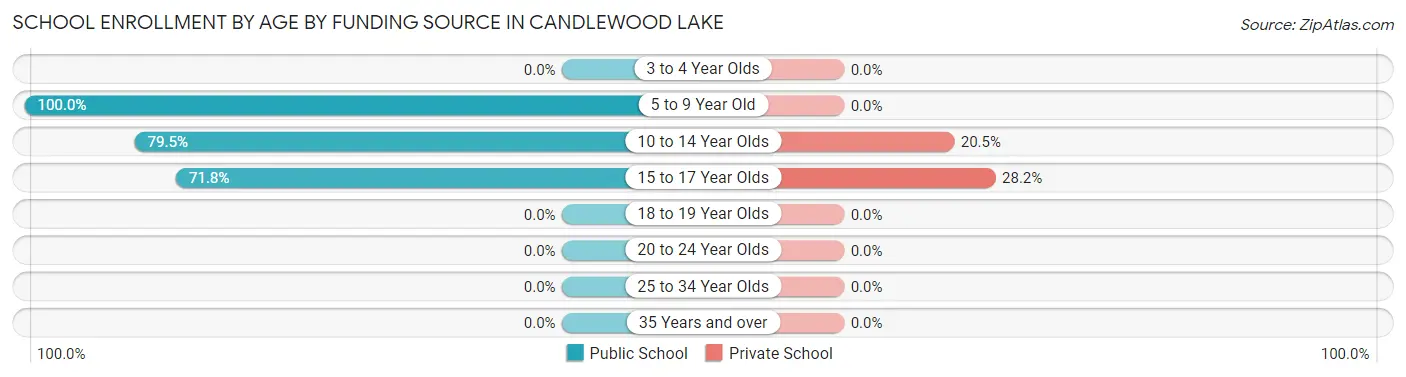
| Age Bracket | Public School | Private School |
| 3 to 4 Year Olds | 0 (0.0%) | 0 (0.0%) |
| 5 to 9 Year Old | 25 (100.0%) | 0 (0.0%) |
| 10 to 14 Year Olds | 62 (79.5%) | 16 (20.5%) |
| 15 to 17 Year Olds | 28 (71.8%) | 11 (28.2%) |
| 18 to 19 Year Olds | 0 (0.0%) | 0 (0.0%) |
| 20 to 24 Year Olds | 0 (0.0%) | 0 (0.0%) |
| 25 to 34 Year Olds | 0 (0.0%) | 0 (0.0%) |
| 35 Years and over | 0 (0.0%) | 0 (0.0%) |
| Total | 115 (81.0%) | 27 (19.0%) |
Educational Attainment by Field of Study in Candlewood Lake
Business (92 | 43.6%), social sciences (28 | 13.3%), physical & health sciences (23 | 10.9%), psychology (20 | 9.5%), and literature & languages (17 | 8.1%) are the most common fields of study among 211 individuals in Candlewood Lake who have obtained a bachelor's degree or higher.
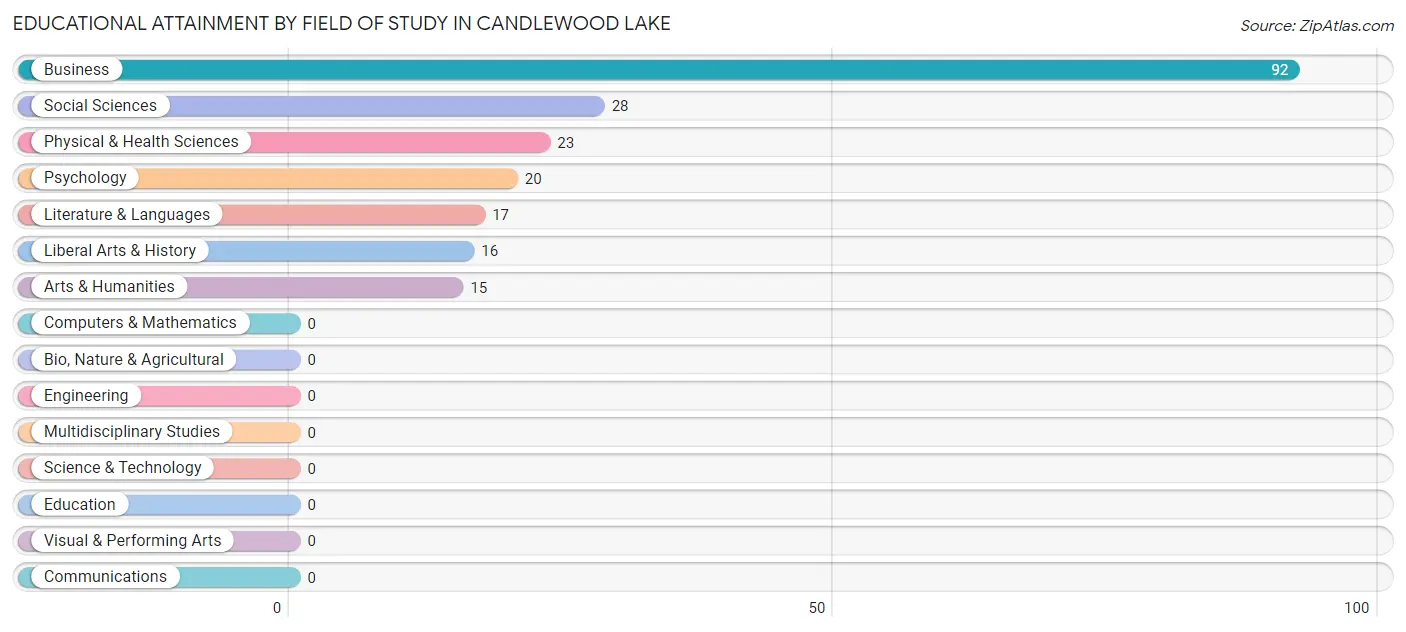
| Field of Study | # Graduates | % Graduates |
| Computers & Mathematics | 0 | 0.0% |
| Bio, Nature & Agricultural | 0 | 0.0% |
| Physical & Health Sciences | 23 | 10.9% |
| Psychology | 20 | 9.5% |
| Social Sciences | 28 | 13.3% |
| Engineering | 0 | 0.0% |
| Multidisciplinary Studies | 0 | 0.0% |
| Science & Technology | 0 | 0.0% |
| Business | 92 | 43.6% |
| Education | 0 | 0.0% |
| Literature & Languages | 17 | 8.1% |
| Liberal Arts & History | 16 | 7.6% |
| Visual & Performing Arts | 0 | 0.0% |
| Communications | 0 | 0.0% |
| Arts & Humanities | 15 | 7.1% |
| Total | 211 | 100.0% |
Transportation & Commute in Candlewood Lake
Vehicle Availability by Sex in Candlewood Lake
The most prevalent vehicle ownership categories in Candlewood Lake are males with 2 vehicles (215, accounting for 60.7%) and females with 2 vehicles (179, making up 72.6%).
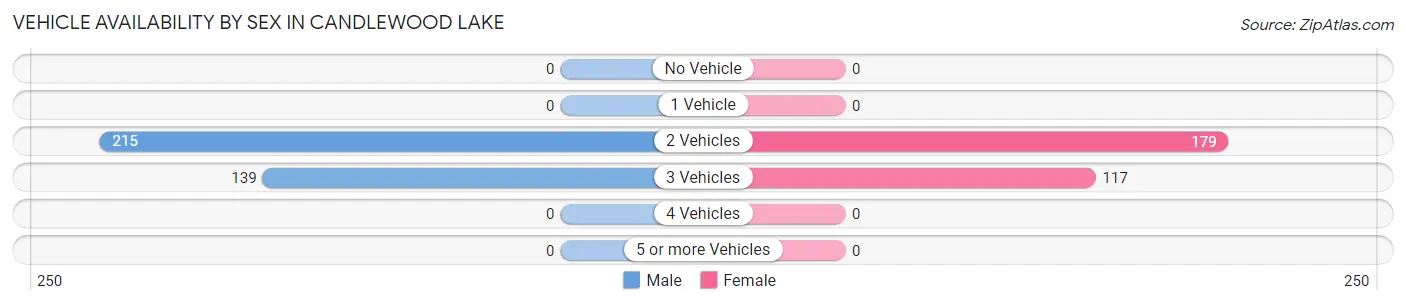
| Vehicles Available | Male | Female |
| No Vehicle | 0 (0.0%) | 0 (0.0%) |
| 1 Vehicle | 0 (0.0%) | 0 (0.0%) |
| 2 Vehicles | 215 (60.7%) | 179 (60.5%) |
| 3 Vehicles | 139 (39.3%) | 117 (39.5%) |
| 4 Vehicles | 0 (0.0%) | 0 (0.0%) |
| 5 or more Vehicles | 0 (0.0%) | 0 (0.0%) |
| Total | 354 (100.0%) | 296 (100.0%) |
Commute Time in Candlewood Lake
The most frequently occuring commute durations in Candlewood Lake are 15 to 19 minutes (206 commuters, 31.7%), 30 to 34 minutes (118 commuters, 18.1%), and 60 to 89 minutes (109 commuters, 16.8%).
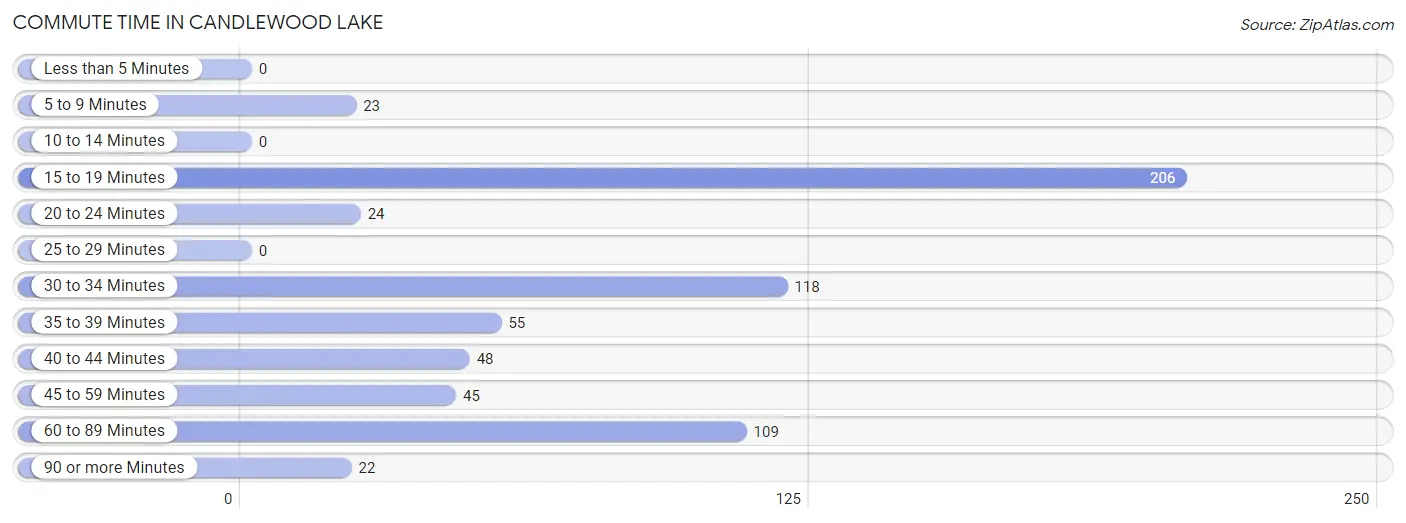
| Commute Time | # Commuters | % Commuters |
| Less than 5 Minutes | 0 | 0.0% |
| 5 to 9 Minutes | 23 | 3.5% |
| 10 to 14 Minutes | 0 | 0.0% |
| 15 to 19 Minutes | 206 | 31.7% |
| 20 to 24 Minutes | 24 | 3.7% |
| 25 to 29 Minutes | 0 | 0.0% |
| 30 to 34 Minutes | 118 | 18.1% |
| 35 to 39 Minutes | 55 | 8.5% |
| 40 to 44 Minutes | 48 | 7.4% |
| 45 to 59 Minutes | 45 | 6.9% |
| 60 to 89 Minutes | 109 | 16.8% |
| 90 or more Minutes | 22 | 3.4% |
Commute Time by Sex in Candlewood Lake
The most common commute times in Candlewood Lake are 15 to 19 minutes (115 commuters, 32.5%) for males and 15 to 19 minutes (91 commuters, 30.7%) for females.
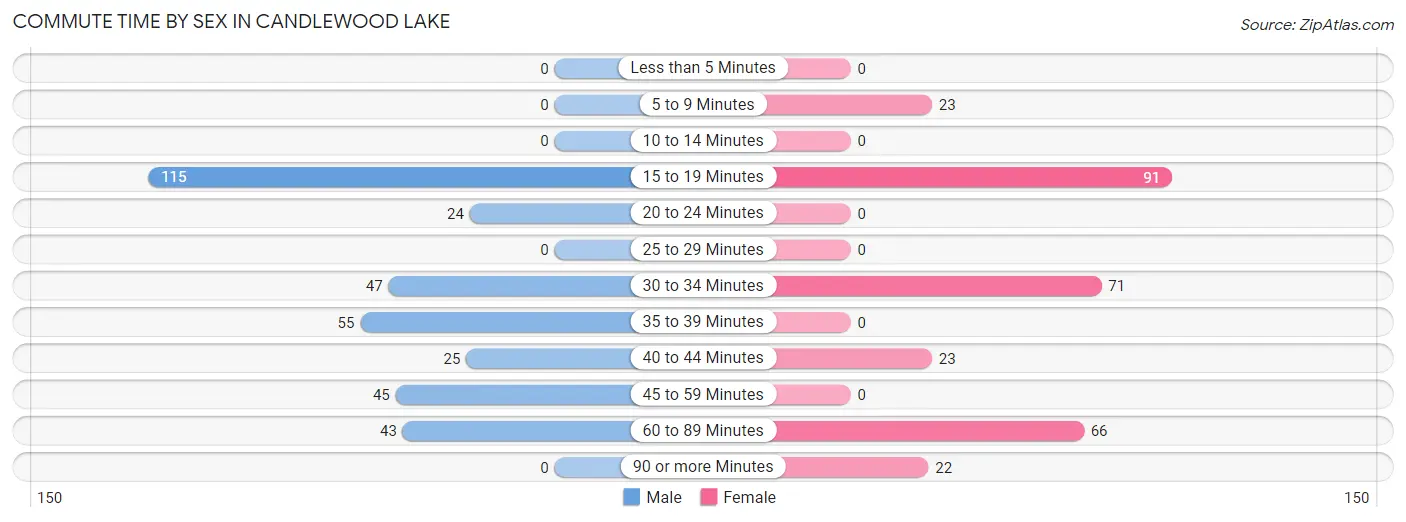
| Commute Time | Male | Female |
| Less than 5 Minutes | 0 (0.0%) | 0 (0.0%) |
| 5 to 9 Minutes | 0 (0.0%) | 23 (7.8%) |
| 10 to 14 Minutes | 0 (0.0%) | 0 (0.0%) |
| 15 to 19 Minutes | 115 (32.5%) | 91 (30.7%) |
| 20 to 24 Minutes | 24 (6.8%) | 0 (0.0%) |
| 25 to 29 Minutes | 0 (0.0%) | 0 (0.0%) |
| 30 to 34 Minutes | 47 (13.3%) | 71 (24.0%) |
| 35 to 39 Minutes | 55 (15.5%) | 0 (0.0%) |
| 40 to 44 Minutes | 25 (7.1%) | 23 (7.8%) |
| 45 to 59 Minutes | 45 (12.7%) | 0 (0.0%) |
| 60 to 89 Minutes | 43 (12.1%) | 66 (22.3%) |
| 90 or more Minutes | 0 (0.0%) | 22 (7.4%) |
Time of Departure to Work by Sex in Candlewood Lake
The most frequent times of departure to work in Candlewood Lake are 6:00 AM to 6:29 AM (135, 38.1%) for males and 9:00 AM to 9:59 AM (132, 44.6%) for females.
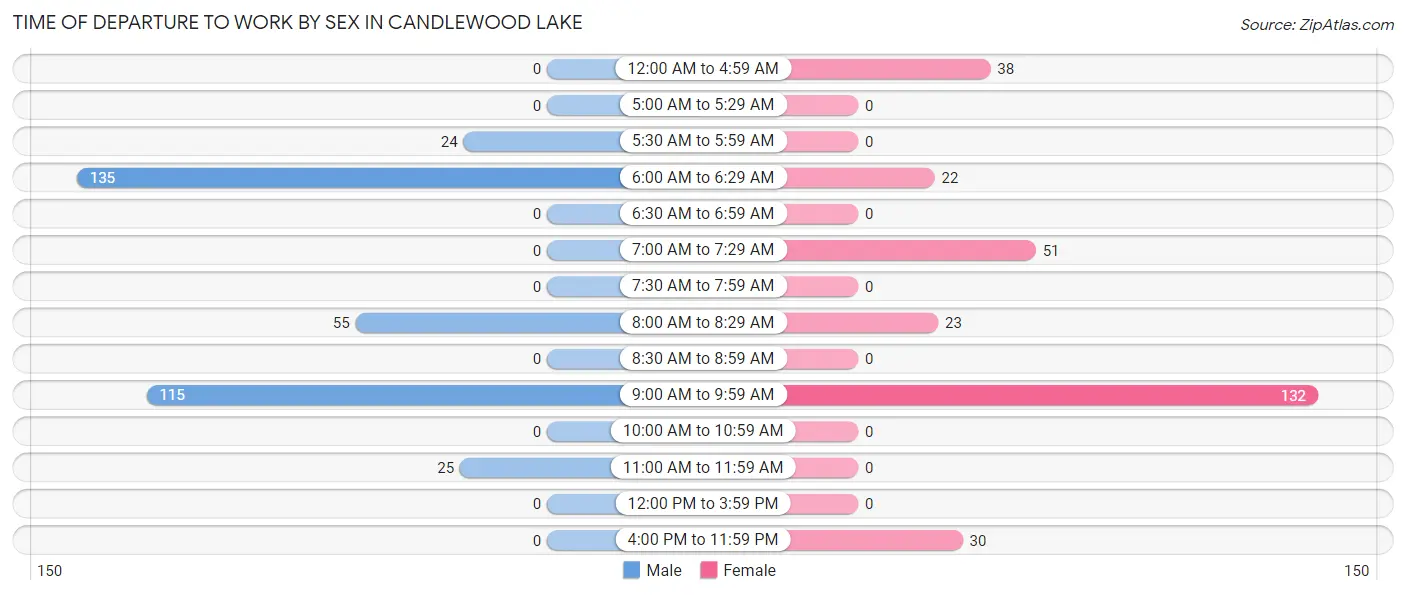
| Time of Departure | Male | Female |
| 12:00 AM to 4:59 AM | 0 (0.0%) | 38 (12.8%) |
| 5:00 AM to 5:29 AM | 0 (0.0%) | 0 (0.0%) |
| 5:30 AM to 5:59 AM | 24 (6.8%) | 0 (0.0%) |
| 6:00 AM to 6:29 AM | 135 (38.1%) | 22 (7.4%) |
| 6:30 AM to 6:59 AM | 0 (0.0%) | 0 (0.0%) |
| 7:00 AM to 7:29 AM | 0 (0.0%) | 51 (17.2%) |
| 7:30 AM to 7:59 AM | 0 (0.0%) | 0 (0.0%) |
| 8:00 AM to 8:29 AM | 55 (15.5%) | 23 (7.8%) |
| 8:30 AM to 8:59 AM | 0 (0.0%) | 0 (0.0%) |
| 9:00 AM to 9:59 AM | 115 (32.5%) | 132 (44.6%) |
| 10:00 AM to 10:59 AM | 0 (0.0%) | 0 (0.0%) |
| 11:00 AM to 11:59 AM | 25 (7.1%) | 0 (0.0%) |
| 12:00 PM to 3:59 PM | 0 (0.0%) | 0 (0.0%) |
| 4:00 PM to 11:59 PM | 0 (0.0%) | 30 (10.1%) |
| Total | 354 (100.0%) | 296 (100.0%) |
Housing Occupancy in Candlewood Lake
Occupancy by Ownership in Candlewood Lake
Of the total 473 dwellings in Candlewood Lake, owner-occupied units account for 473 (100.0%), while renter-occupied units make up 0 (0.0%).
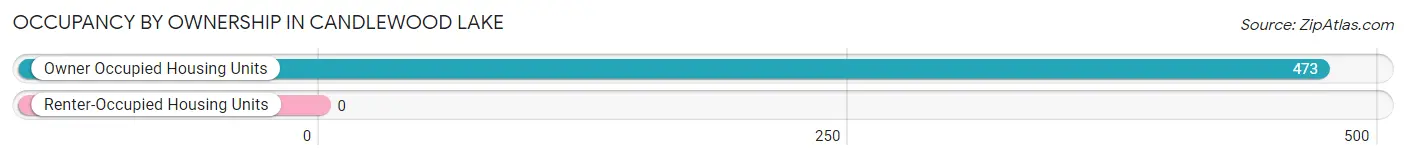
| Occupancy | # Housing Units | % Housing Units |
| Owner Occupied Housing Units | 473 | 100.0% |
| Renter-Occupied Housing Units | 0 | 0.0% |
| Total Occupied Housing Units | 473 | 100.0% |
Occupancy by Household Size in Candlewood Lake
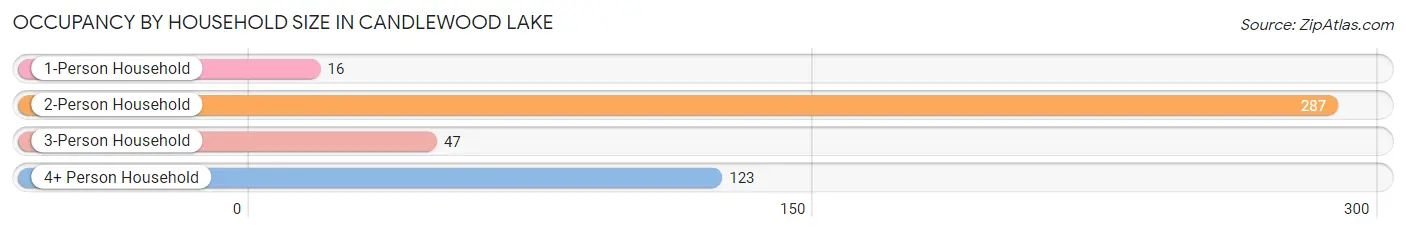
| Household Size | # Housing Units | % Housing Units |
| 1-Person Household | 16 | 3.4% |
| 2-Person Household | 287 | 60.7% |
| 3-Person Household | 47 | 9.9% |
| 4+ Person Household | 123 | 26.0% |
| Total Housing Units | 473 | 100.0% |
Occupancy by Ownership by Household Size in Candlewood Lake
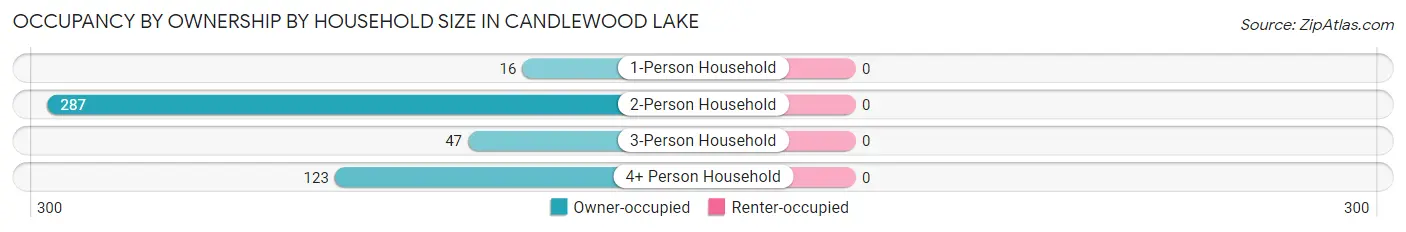
| Household Size | Owner-occupied | Renter-occupied |
| 1-Person Household | 16 (100.0%) | 0 (0.0%) |
| 2-Person Household | 287 (100.0%) | 0 (0.0%) |
| 3-Person Household | 47 (100.0%) | 0 (0.0%) |
| 4+ Person Household | 123 (100.0%) | 0 (0.0%) |
| Total Housing Units | 473 (100.0%) | 0 (0.0%) |
Occupancy by Educational Attainment in Candlewood Lake
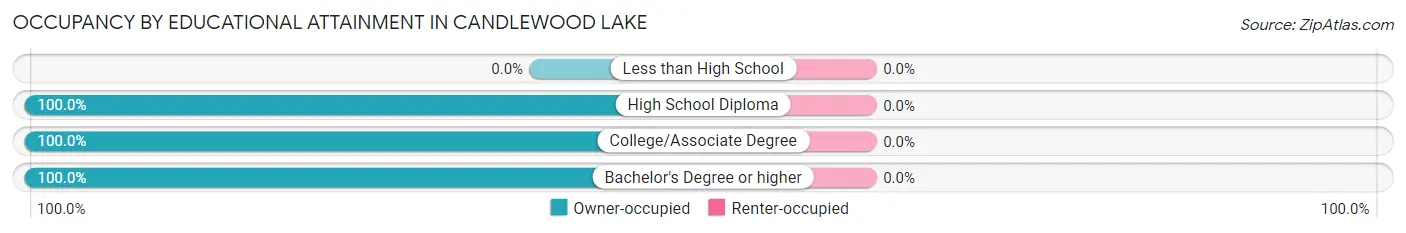
| Household Size | Owner-occupied | Renter-occupied |
| Less than High School | 0 (0.0%) | 0 (0.0%) |
| High School Diploma | 191 (100.0%) | 0 (0.0%) |
| College/Associate Degree | 176 (100.0%) | 0 (0.0%) |
| Bachelor's Degree or higher | 106 (100.0%) | 0 (0.0%) |
Occupancy by Age of Householder in Candlewood Lake
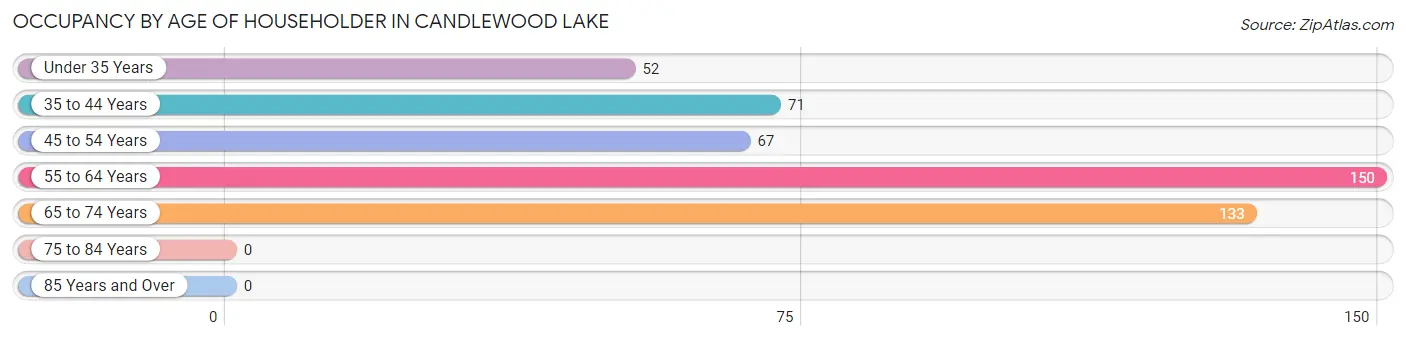
| Age Bracket | # Households | % Households |
| Under 35 Years | 52 | 11.0% |
| 35 to 44 Years | 71 | 15.0% |
| 45 to 54 Years | 67 | 14.2% |
| 55 to 64 Years | 150 | 31.7% |
| 65 to 74 Years | 133 | 28.1% |
| 75 to 84 Years | 0 | 0.0% |
| 85 Years and Over | 0 | 0.0% |
| Total | 473 | 100.0% |
Housing Finances in Candlewood Lake
Median Income by Occupancy in Candlewood Lake
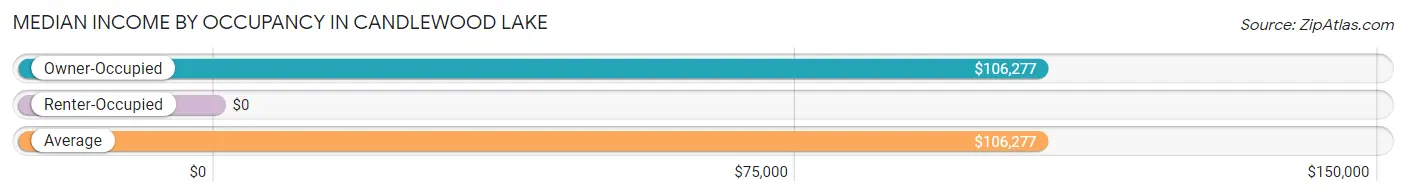
| Occupancy Type | # Households | Median Income |
| Owner-Occupied | 473 (100.0%) | $106,277 |
| Renter-Occupied | 0 (0.0%) | $0 |
| Average | 473 (100.0%) | $106,277 |
Occupancy by Householder Income Bracket in Candlewood Lake
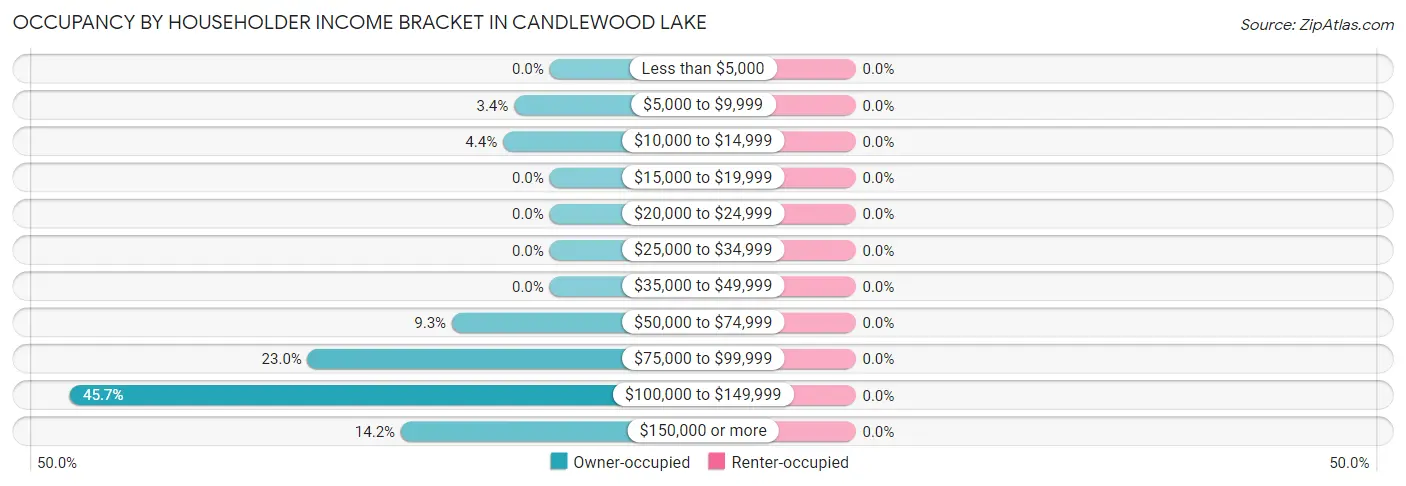
| Income Bracket | Owner-occupied | Renter-occupied |
| Less than $5,000 | 0 (0.0%) | 0 (0.0%) |
| $5,000 to $9,999 | 16 (3.4%) | 0 (0.0%) |
| $10,000 to $14,999 | 21 (4.4%) | 0 (0.0%) |
| $15,000 to $19,999 | 0 (0.0%) | 0 (0.0%) |
| $20,000 to $24,999 | 0 (0.0%) | 0 (0.0%) |
| $25,000 to $34,999 | 0 (0.0%) | 0 (0.0%) |
| $35,000 to $49,999 | 0 (0.0%) | 0 (0.0%) |
| $50,000 to $74,999 | 44 (9.3%) | 0 (0.0%) |
| $75,000 to $99,999 | 109 (23.0%) | 0 (0.0%) |
| $100,000 to $149,999 | 216 (45.7%) | 0 (0.0%) |
| $150,000 or more | 67 (14.2%) | 0 (0.0%) |
| Total | 473 (100.0%) | 0 (0.0%) |
Monthly Housing Cost Tiers in Candlewood Lake
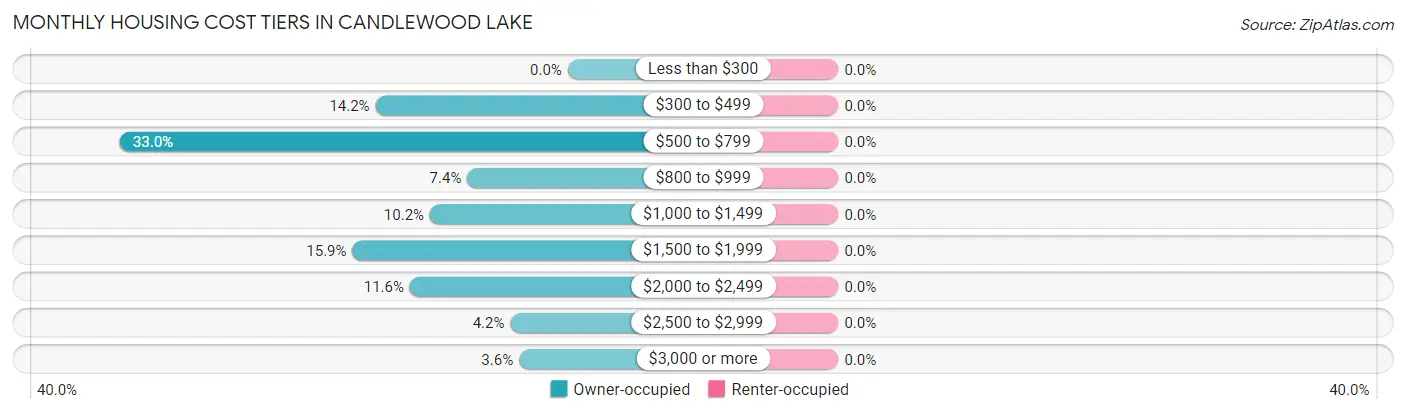
| Monthly Cost | Owner-occupied | Renter-occupied |
| Less than $300 | 0 (0.0%) | 0 (0.0%) |
| $300 to $499 | 67 (14.2%) | 0 (0.0%) |
| $500 to $799 | 156 (33.0%) | 0 (0.0%) |
| $800 to $999 | 35 (7.4%) | 0 (0.0%) |
| $1,000 to $1,499 | 48 (10.2%) | 0 (0.0%) |
| $1,500 to $1,999 | 75 (15.9%) | 0 (0.0%) |
| $2,000 to $2,499 | 55 (11.6%) | 0 (0.0%) |
| $2,500 to $2,999 | 20 (4.2%) | 0 (0.0%) |
| $3,000 or more | 17 (3.6%) | 0 (0.0%) |
| Total | 473 (100.0%) | 0 (0.0%) |
Physical Housing Characteristics in Candlewood Lake
Housing Structures in Candlewood Lake
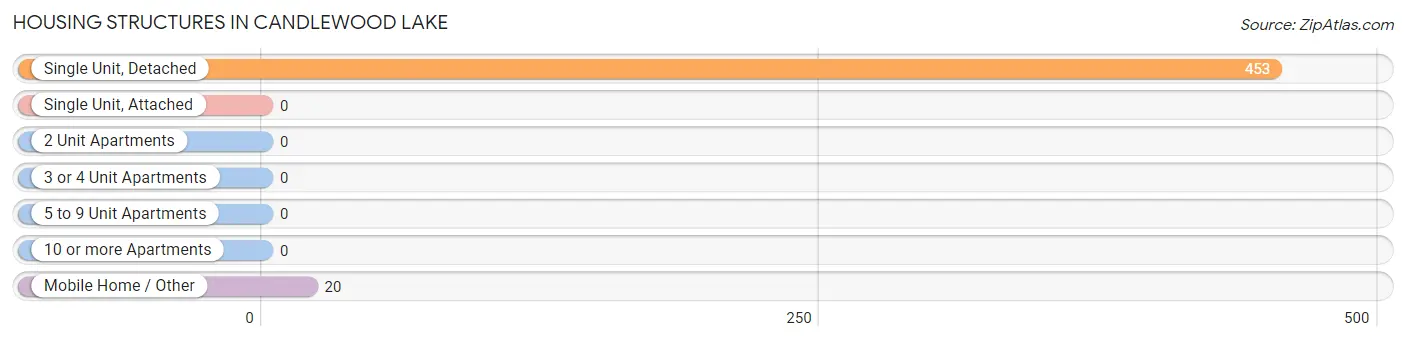
| Structure Type | # Housing Units | % Housing Units |
| Single Unit, Detached | 453 | 95.8% |
| Single Unit, Attached | 0 | 0.0% |
| 2 Unit Apartments | 0 | 0.0% |
| 3 or 4 Unit Apartments | 0 | 0.0% |
| 5 to 9 Unit Apartments | 0 | 0.0% |
| 10 or more Apartments | 0 | 0.0% |
| Mobile Home / Other | 20 | 4.2% |
| Total | 473 | 100.0% |
Housing Structures by Occupancy in Candlewood Lake
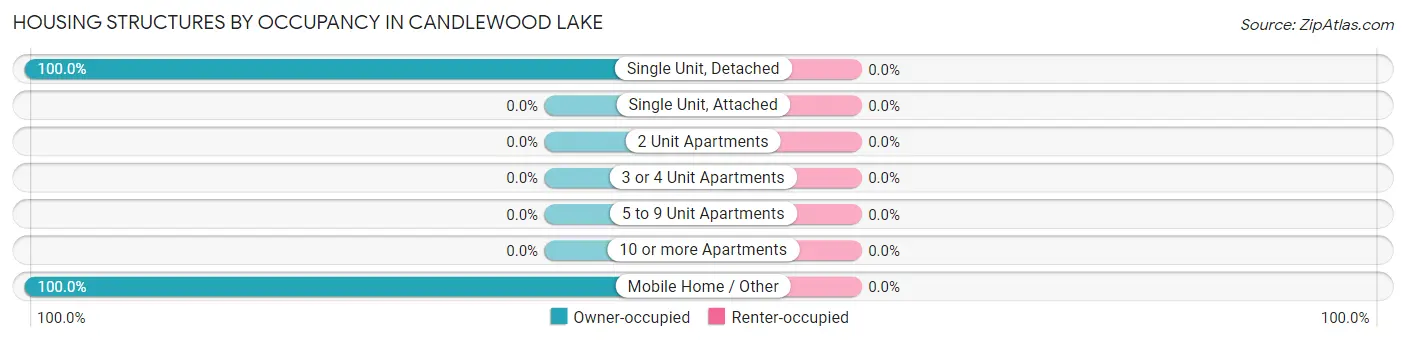
| Structure Type | Owner-occupied | Renter-occupied |
| Single Unit, Detached | 453 (100.0%) | 0 (0.0%) |
| Single Unit, Attached | 0 (0.0%) | 0 (0.0%) |
| 2 Unit Apartments | 0 (0.0%) | 0 (0.0%) |
| 3 or 4 Unit Apartments | 0 (0.0%) | 0 (0.0%) |
| 5 to 9 Unit Apartments | 0 (0.0%) | 0 (0.0%) |
| 10 or more Apartments | 0 (0.0%) | 0 (0.0%) |
| Mobile Home / Other | 20 (100.0%) | 0 (0.0%) |
| Total | 473 (100.0%) | 0 (0.0%) |
Housing Structures by Number of Rooms in Candlewood Lake
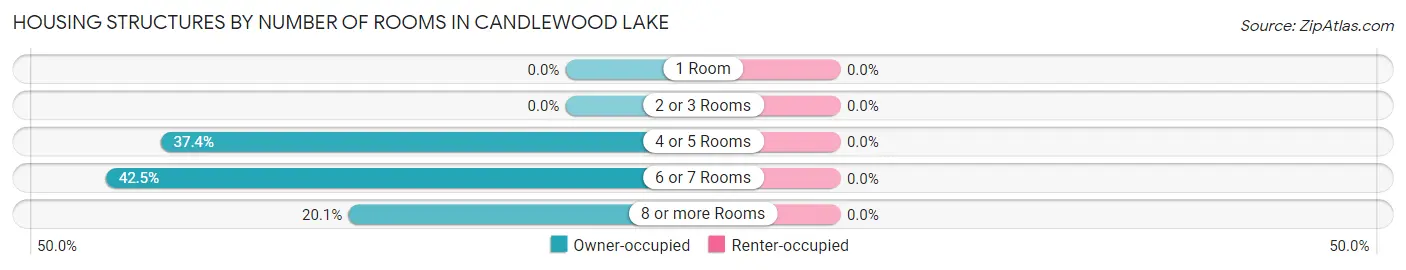
| Number of Rooms | Owner-occupied | Renter-occupied |
| 1 Room | 0 (0.0%) | 0 (0.0%) |
| 2 or 3 Rooms | 0 (0.0%) | 0 (0.0%) |
| 4 or 5 Rooms | 177 (37.4%) | 0 (0.0%) |
| 6 or 7 Rooms | 201 (42.5%) | 0 (0.0%) |
| 8 or more Rooms | 95 (20.1%) | 0 (0.0%) |
| Total | 473 (100.0%) | 0 (0.0%) |
Housing Structure by Heating Type in Candlewood Lake
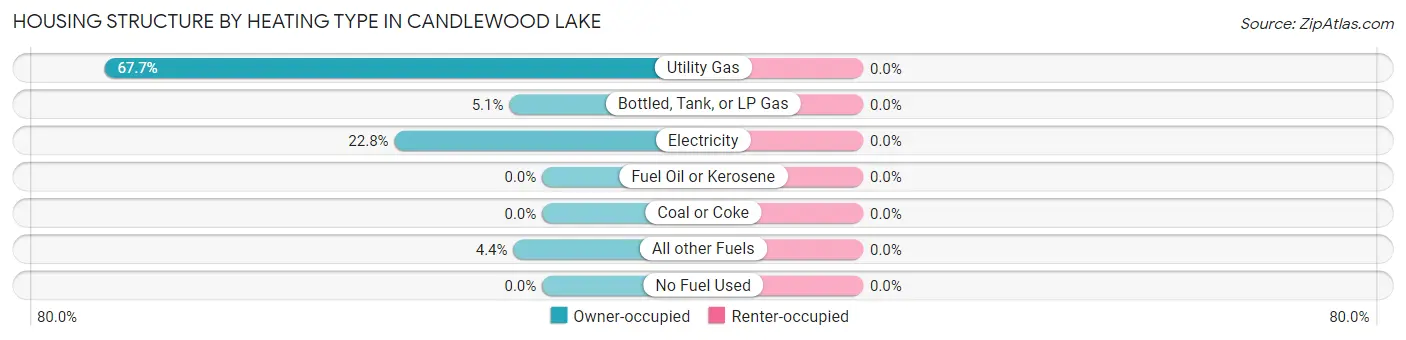
| Heating Type | Owner-occupied | Renter-occupied |
| Utility Gas | 320 (67.6%) | 0 (0.0%) |
| Bottled, Tank, or LP Gas | 24 (5.1%) | 0 (0.0%) |
| Electricity | 108 (22.8%) | 0 (0.0%) |
| Fuel Oil or Kerosene | 0 (0.0%) | 0 (0.0%) |
| Coal or Coke | 0 (0.0%) | 0 (0.0%) |
| All other Fuels | 21 (4.4%) | 0 (0.0%) |
| No Fuel Used | 0 (0.0%) | 0 (0.0%) |
| Total | 473 (100.0%) | 0 (0.0%) |
Household Vehicle Usage in Candlewood Lake
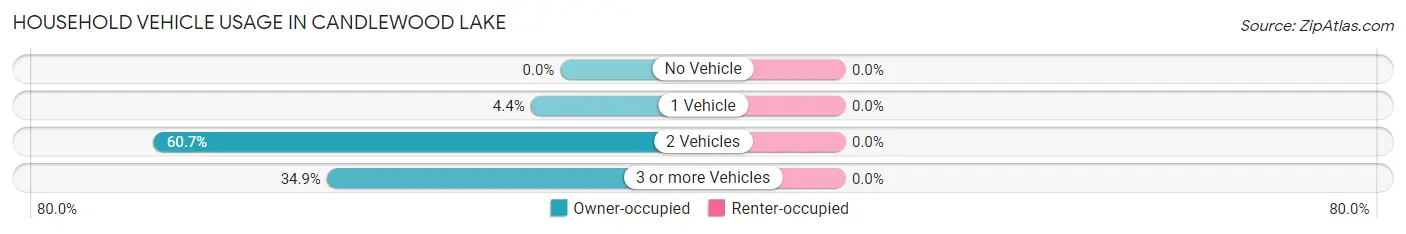
| Vehicles per Household | Owner-occupied | Renter-occupied |
| No Vehicle | 0 (0.0%) | 0 (0.0%) |
| 1 Vehicle | 21 (4.4%) | 0 (0.0%) |
| 2 Vehicles | 287 (60.7%) | 0 (0.0%) |
| 3 or more Vehicles | 165 (34.9%) | 0 (0.0%) |
| Total | 473 (100.0%) | 0 (0.0%) |
Real Estate & Mortgages in Candlewood Lake
Real Estate and Mortgage Overview in Candlewood Lake
| Characteristic | Without Mortgage | With Mortgage |
| Housing Units | 271 | 202 |
| Median Property Value | $222,000 | $361,200 |
| Median Household Income | $122,791 | $20 |
| Monthly Housing Costs | $604 | $17 |
| Real Estate Taxes | $3,239 | $0 |
Property Value by Mortgage Status in Candlewood Lake
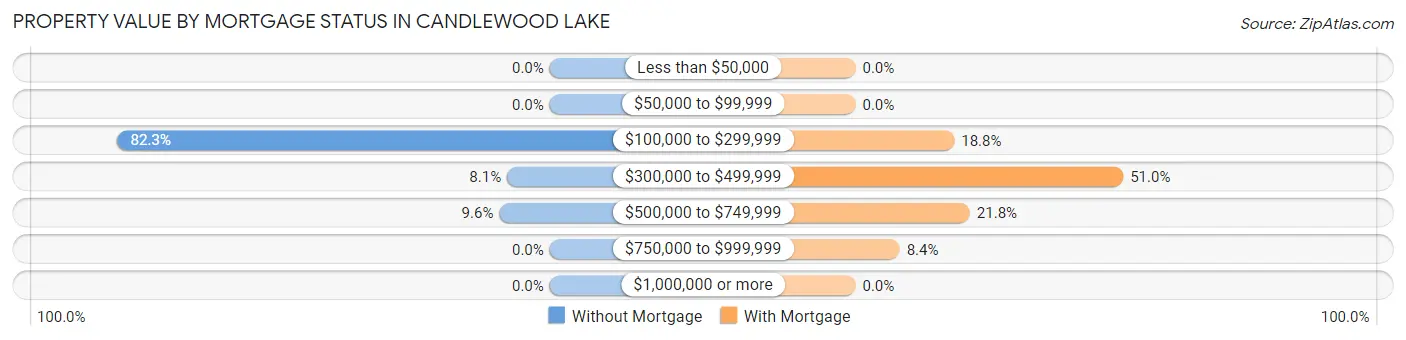
| Property Value | Without Mortgage | With Mortgage |
| Less than $50,000 | 0 (0.0%) | 0 (0.0%) |
| $50,000 to $99,999 | 0 (0.0%) | 0 (0.0%) |
| $100,000 to $299,999 | 223 (82.3%) | 38 (18.8%) |
| $300,000 to $499,999 | 22 (8.1%) | 103 (51.0%) |
| $500,000 to $749,999 | 26 (9.6%) | 44 (21.8%) |
| $750,000 to $999,999 | 0 (0.0%) | 17 (8.4%) |
| $1,000,000 or more | 0 (0.0%) | 0 (0.0%) |
| Total | 271 (100.0%) | 202 (100.0%) |
Household Income by Mortgage Status in Candlewood Lake
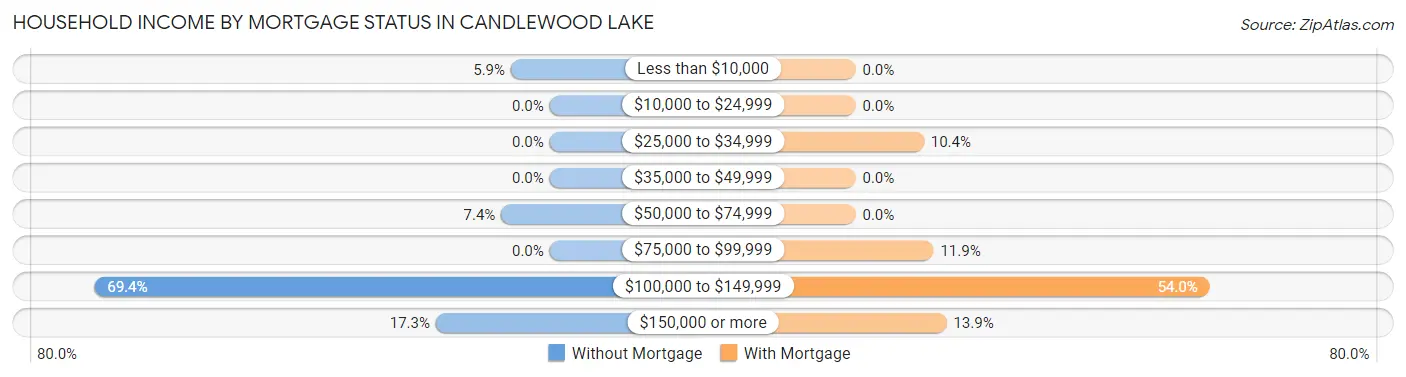
| Household Income | Without Mortgage | With Mortgage |
| Less than $10,000 | 16 (5.9%) | 0 (0.0%) |
| $10,000 to $24,999 | 0 (0.0%) | 0 (0.0%) |
| $25,000 to $34,999 | 0 (0.0%) | 21 (10.4%) |
| $35,000 to $49,999 | 0 (0.0%) | 0 (0.0%) |
| $50,000 to $74,999 | 20 (7.4%) | 0 (0.0%) |
| $75,000 to $99,999 | 0 (0.0%) | 24 (11.9%) |
| $100,000 to $149,999 | 188 (69.4%) | 109 (54.0%) |
| $150,000 or more | 47 (17.3%) | 28 (13.9%) |
| Total | 271 (100.0%) | 202 (100.0%) |
Property Value to Household Income Ratio in Candlewood Lake
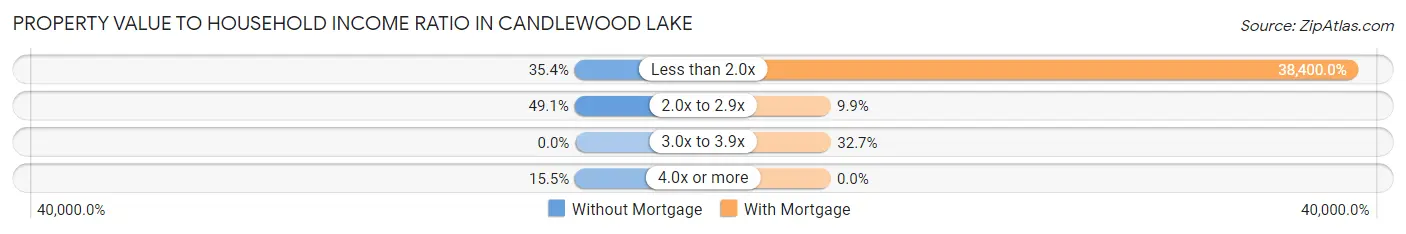
| Value-to-Income Ratio | Without Mortgage | With Mortgage |
| Less than 2.0x | 96 (35.4%) | 77,568 (38,400.0%) |
| 2.0x to 2.9x | 133 (49.1%) | 20 (9.9%) |
| 3.0x to 3.9x | 0 (0.0%) | 66 (32.7%) |
| 4.0x or more | 42 (15.5%) | 0 (0.0%) |
| Total | 271 (100.0%) | 202 (100.0%) |
Real Estate Taxes by Mortgage Status in Candlewood Lake
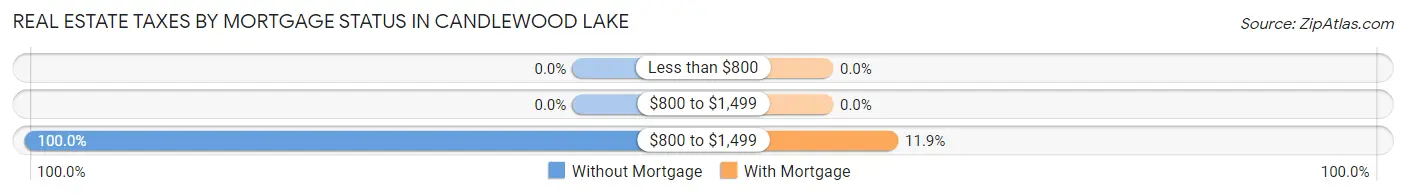
| Property Taxes | Without Mortgage | With Mortgage |
| Less than $800 | 0 (0.0%) | 0 (0.0%) |
| $800 to $1,499 | 0 (0.0%) | 0 (0.0%) |
| $800 to $1,499 | 271 (100.0%) | 24 (11.9%) |
| Total | 271 (100.0%) | 202 (100.0%) |
Health & Disability in Candlewood Lake
Health Insurance Coverage by Age in Candlewood Lake
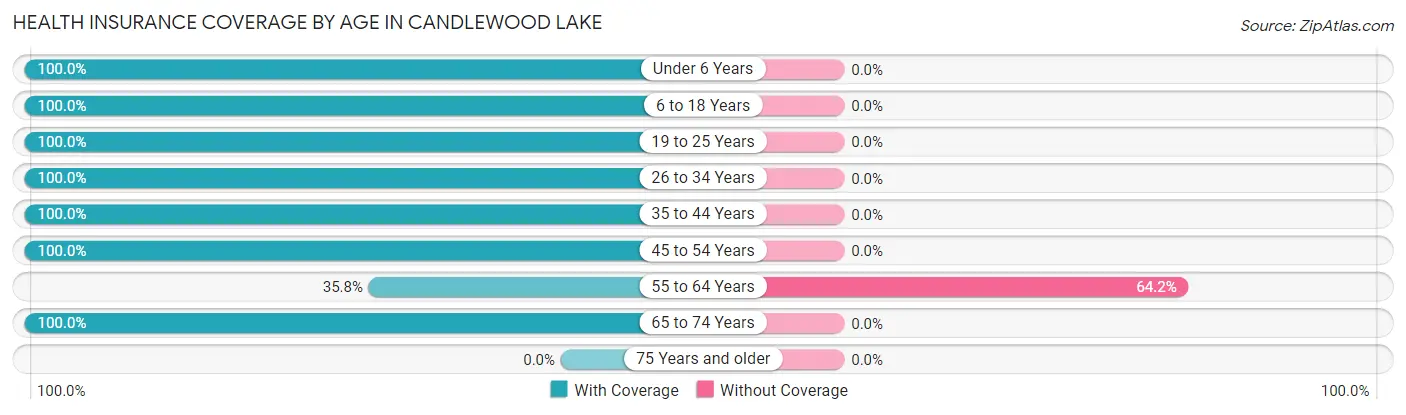
| Age Bracket | With Coverage | Without Coverage |
| Under 6 Years | 109 (100.0%) | 0 (0.0%) |
| 6 to 18 Years | 136 (100.0%) | 0 (0.0%) |
| 19 to 25 Years | 30 (100.0%) | 0 (0.0%) |
| 26 to 34 Years | 104 (100.0%) | 0 (0.0%) |
| 35 to 44 Years | 130 (100.0%) | 0 (0.0%) |
| 45 to 54 Years | 92 (100.0%) | 0 (0.0%) |
| 55 to 64 Years | 101 (35.8%) | 181 (64.2%) |
| 65 to 74 Years | 243 (100.0%) | 0 (0.0%) |
| 75 Years and older | 0 (0.0%) | 0 (0.0%) |
| Total | 945 (83.9%) | 181 (16.1%) |
Health Insurance Coverage by Citizenship Status in Candlewood Lake
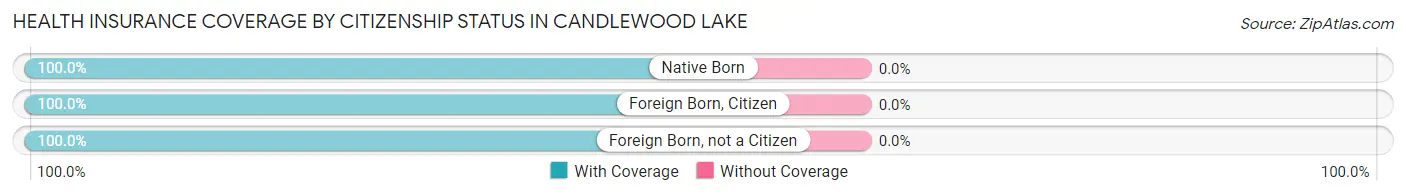
| Citizenship Status | With Coverage | Without Coverage |
| Native Born | 109 (100.0%) | 0 (0.0%) |
| Foreign Born, Citizen | 136 (100.0%) | 0 (0.0%) |
| Foreign Born, not a Citizen | 30 (100.0%) | 0 (0.0%) |
Health Insurance Coverage by Household Income in Candlewood Lake
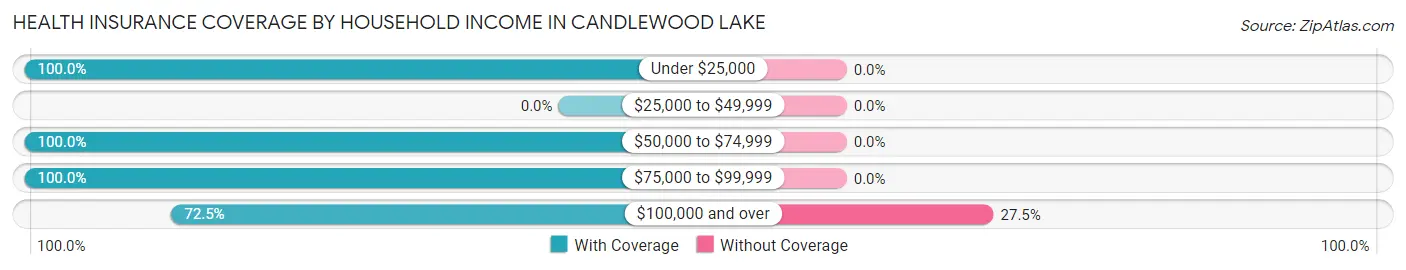
| Household Income | With Coverage | Without Coverage |
| Under $25,000 | 51 (100.0%) | 0 (0.0%) |
| $25,000 to $49,999 | 0 (0.0%) | 0 (0.0%) |
| $50,000 to $74,999 | 164 (100.0%) | 0 (0.0%) |
| $75,000 to $99,999 | 253 (100.0%) | 0 (0.0%) |
| $100,000 and over | 477 (72.5%) | 181 (27.5%) |
Public vs Private Health Insurance Coverage by Age in Candlewood Lake
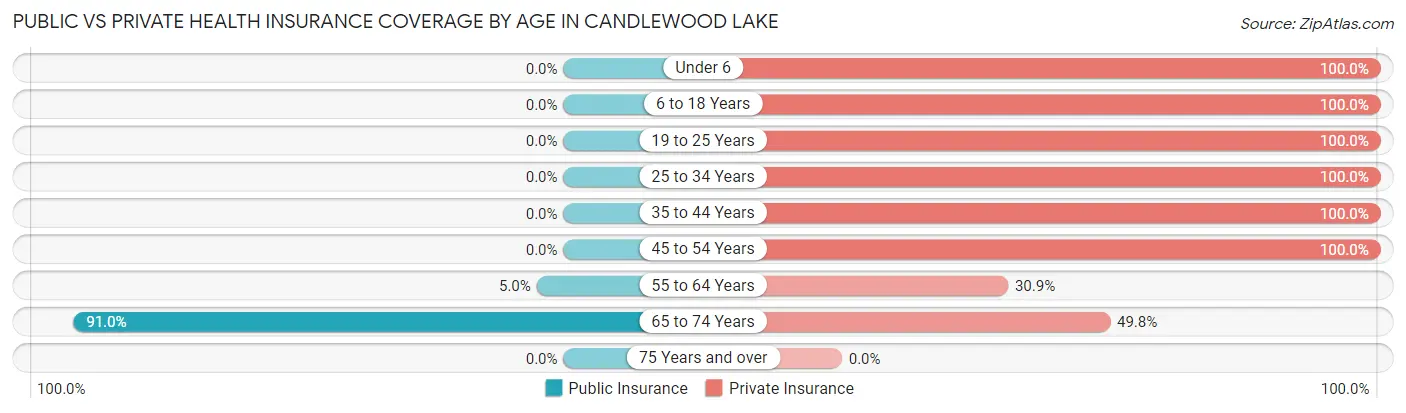
| Age Bracket | Public Insurance | Private Insurance |
| Under 6 | 0 (0.0%) | 109 (100.0%) |
| 6 to 18 Years | 0 (0.0%) | 136 (100.0%) |
| 19 to 25 Years | 0 (0.0%) | 30 (100.0%) |
| 25 to 34 Years | 0 (0.0%) | 104 (100.0%) |
| 35 to 44 Years | 0 (0.0%) | 130 (100.0%) |
| 45 to 54 Years | 0 (0.0%) | 92 (100.0%) |
| 55 to 64 Years | 14 (5.0%) | 87 (30.8%) |
| 65 to 74 Years | 221 (90.9%) | 121 (49.8%) |
| 75 Years and over | 0 (0.0%) | 0 (0.0%) |
| Total | 235 (20.9%) | 809 (71.9%) |
Disability Status by Sex by Age in Candlewood Lake
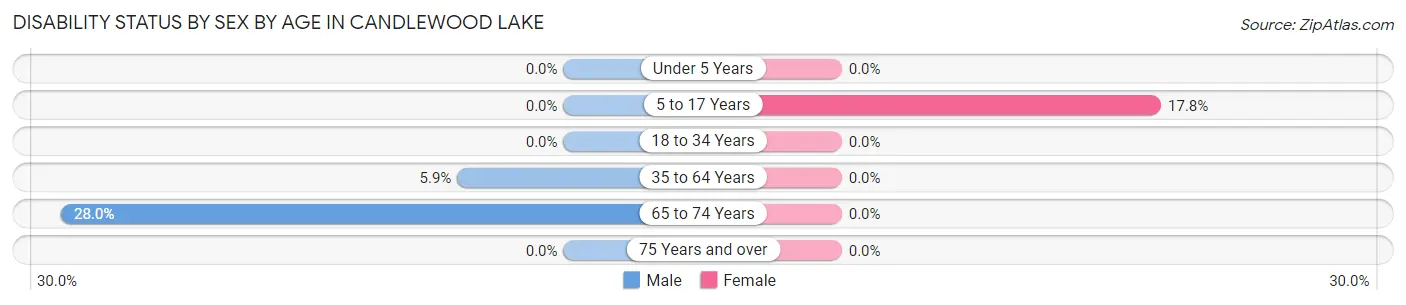
| Age Bracket | Male | Female |
| Under 5 Years | 0 (0.0%) | 0 (0.0%) |
| 5 to 17 Years | 0 (0.0%) | 16 (17.8%) |
| 18 to 34 Years | 0 (0.0%) | 0 (0.0%) |
| 35 to 64 Years | 14 (5.9%) | 0 (0.0%) |
| 65 to 74 Years | 40 (28.0%) | 0 (0.0%) |
| 75 Years and over | 0 (0.0%) | 0 (0.0%) |
Disability Class by Sex by Age in Candlewood Lake
Disability Class: Hearing Difficulty
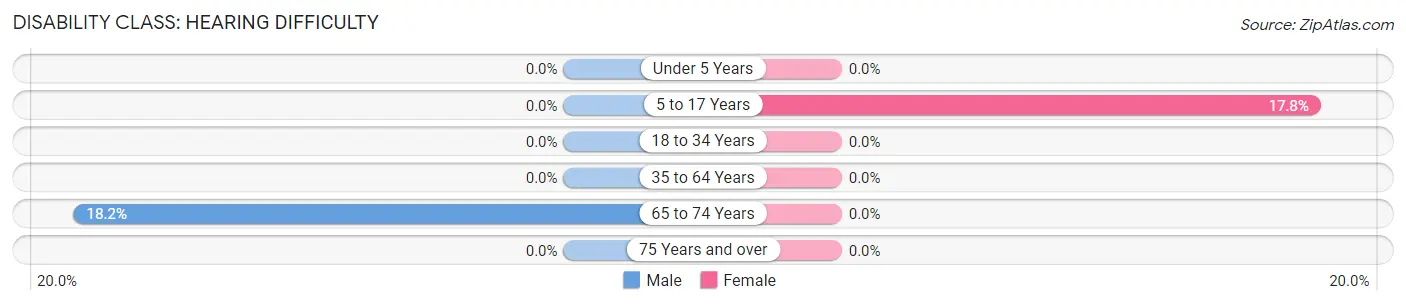
| Age Bracket | Male | Female |
| Under 5 Years | 0 (0.0%) | 0 (0.0%) |
| 5 to 17 Years | 0 (0.0%) | 16 (17.8%) |
| 18 to 34 Years | 0 (0.0%) | 0 (0.0%) |
| 35 to 64 Years | 0 (0.0%) | 0 (0.0%) |
| 65 to 74 Years | 26 (18.2%) | 0 (0.0%) |
| 75 Years and over | 0 (0.0%) | 0 (0.0%) |
Disability Class: Vision Difficulty
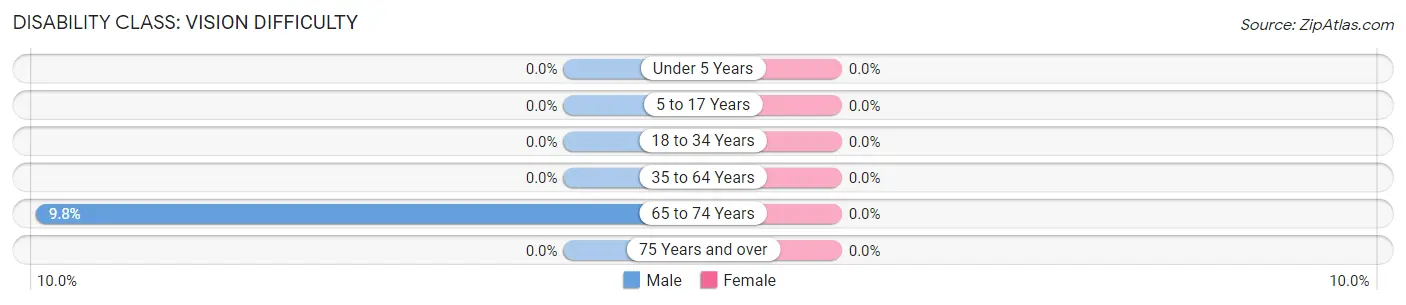
| Age Bracket | Male | Female |
| Under 5 Years | 0 (0.0%) | 0 (0.0%) |
| 5 to 17 Years | 0 (0.0%) | 0 (0.0%) |
| 18 to 34 Years | 0 (0.0%) | 0 (0.0%) |
| 35 to 64 Years | 0 (0.0%) | 0 (0.0%) |
| 65 to 74 Years | 14 (9.8%) | 0 (0.0%) |
| 75 Years and over | 0 (0.0%) | 0 (0.0%) |
Disability Class: Cognitive Difficulty
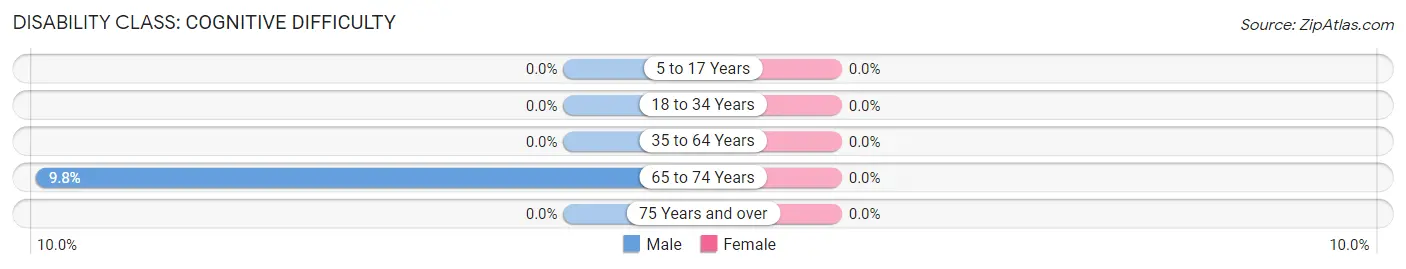
| Age Bracket | Male | Female |
| 5 to 17 Years | 0 (0.0%) | 0 (0.0%) |
| 18 to 34 Years | 0 (0.0%) | 0 (0.0%) |
| 35 to 64 Years | 0 (0.0%) | 0 (0.0%) |
| 65 to 74 Years | 14 (9.8%) | 0 (0.0%) |
| 75 Years and over | 0 (0.0%) | 0 (0.0%) |
Disability Class: Ambulatory Difficulty
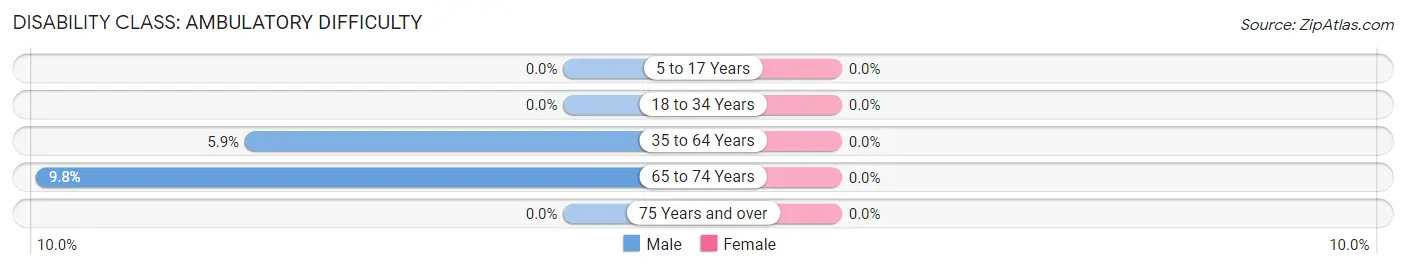
| Age Bracket | Male | Female |
| 5 to 17 Years | 0 (0.0%) | 0 (0.0%) |
| 18 to 34 Years | 0 (0.0%) | 0 (0.0%) |
| 35 to 64 Years | 14 (5.9%) | 0 (0.0%) |
| 65 to 74 Years | 14 (9.8%) | 0 (0.0%) |
| 75 Years and over | 0 (0.0%) | 0 (0.0%) |
Disability Class: Self-Care Difficulty

| Age Bracket | Male | Female |
| 5 to 17 Years | 0 (0.0%) | 0 (0.0%) |
| 18 to 34 Years | 0 (0.0%) | 0 (0.0%) |
| 35 to 64 Years | 0 (0.0%) | 0 (0.0%) |
| 65 to 74 Years | 14 (9.8%) | 0 (0.0%) |
| 75 Years and over | 0 (0.0%) | 0 (0.0%) |
Technology Access in Candlewood Lake
Computing Device Access in Candlewood Lake
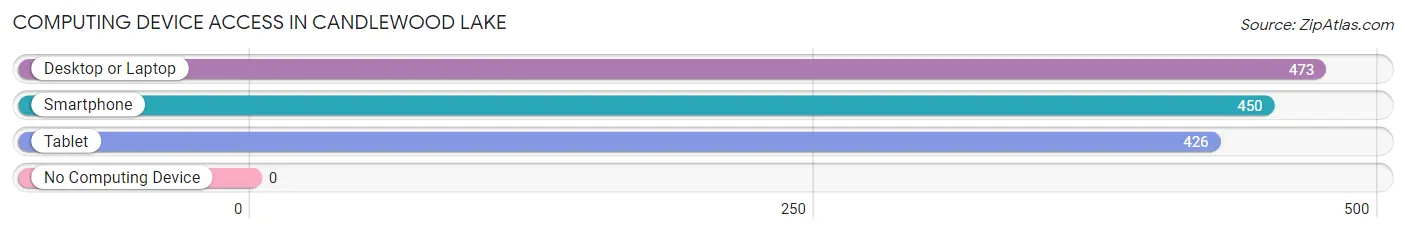
| Device Type | # Households | % Households |
| Desktop or Laptop | 473 | 100.0% |
| Smartphone | 450 | 95.1% |
| Tablet | 426 | 90.1% |
| No Computing Device | 0 | 0.0% |
| Total | 473 | 100.0% |
Internet Access in Candlewood Lake
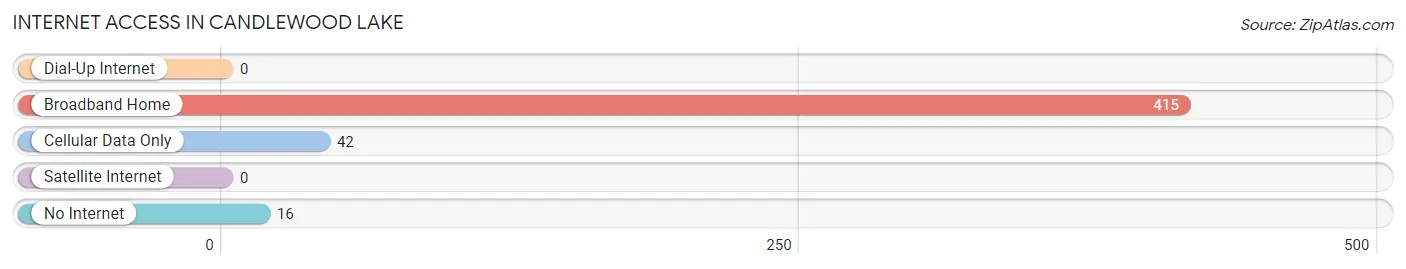
| Internet Type | # Households | % Households |
| Dial-Up Internet | 0 | 0.0% |
| Broadband Home | 415 | 87.7% |
| Cellular Data Only | 42 | 8.9% |
| Satellite Internet | 0 | 0.0% |
| No Internet | 16 | 3.4% |
| Total | 473 | 100.0% |
Candlewood Lake Summary
Candlewood Lake is a man-made lake located in the state of Ohio. It is the largest lake in the state and is located in the southwestern corner of the state. The lake was created in the early 1900s by the construction of a dam on the Little Miami River. The lake is approximately 4,800 acres in size and is surrounded by the towns of Bethel, New Richmond, and Felicity.
History
The area around Candlewood Lake has a long and varied history. The first settlers in the area were Native Americans, who lived in the area for thousands of years before the arrival of European settlers. The first Europeans to settle in the area were French fur traders, who established trading posts in the area in the late 1700s. The area was then part of the Northwest Territory, and was later part of the state of Ohio when it was admitted to the Union in 1803.
The area around Candlewood Lake was largely rural until the early 1900s, when the construction of a dam on the Little Miami River created the lake. The lake was created to provide water for the nearby towns of Bethel, New Richmond, and Felicity. The lake quickly became a popular destination for fishing, boating, and swimming.
In the 1950s, the lake was developed as a recreational area, with the construction of marinas, campgrounds, and other amenities. The lake has since become a popular destination for fishing, boating, and swimming.
Geography
Candlewood Lake is located in the southwestern corner of the state of Ohio. The lake is approximately 4,800 acres in size and is surrounded by the towns of Bethel, New Richmond, and Felicity. The lake is fed by the Little Miami River and is drained by the Great Miami River. The lake is approximately 25 feet deep at its deepest point.
The lake is surrounded by rolling hills and forests, and is home to a variety of wildlife, including deer, foxes, raccoons, and a variety of birds. The lake is also home to a variety of fish, including bass, catfish, and crappie.
Economy
The economy of the area around Candlewood Lake is largely based on tourism and recreation. The lake is a popular destination for fishing, boating, and swimming, and the surrounding towns are home to a variety of restaurants, shops, and other businesses catering to tourists. The lake is also home to a number of marinas, campgrounds, and other recreational facilities.
The area is also home to a number of manufacturing and industrial businesses, including a paper mill, a steel mill, and a chemical plant. The area is also home to a number of farms, which produce a variety of crops, including corn, soybeans, and wheat.
Demographics
The population of the area around Candlewood Lake is approximately 10,000. The population is largely white, with a small minority of African Americans and Hispanics. The median household income in the area is approximately $50,000, and the median home value is approximately $150,000. The area is largely rural, with a few small towns and villages.
Common Questions
What is the Total Population of Candlewood Lake?
Total Population of Candlewood Lake is 1,181.
What is the Total Male Population of Candlewood Lake?
Total Male Population of Candlewood Lake is 540.
What is the Total Female Population of Candlewood Lake?
Total Female Population of Candlewood Lake is 641.
What is the Ratio of Males per 100 Females in Candlewood Lake?
There are 84.24 Males per 100 Females in Candlewood Lake.
What is the Ratio of Females per 100 Males in Candlewood Lake?
There are 118.70 Females per 100 Males in Candlewood Lake.
What is the Median Population Age in Candlewood Lake?
Median Population Age in Candlewood Lake is 52.3 Years.
What is the Average Family Size in Candlewood Lake
Average Family Size in Candlewood Lake is 2.5 People.
What is the Average Household Size in Candlewood Lake
Average Household Size in Candlewood Lake is 2.5 People.
What is Per Capita Income in Candlewood Lake?
Per Capita income in Candlewood Lake is $41,514.
What is the Median Family Income in Candlewood Lake?
Median Family Income in Candlewood Lake is $106,044.
What is the Median Household income in Candlewood Lake?
Median Household Income in Candlewood Lake is $106,277.
What is Income or Wage Gap in Candlewood Lake?
Income or Wage Gap in Candlewood Lake is 0.3%.
Women in Candlewood Lake earn 99.7 cents for every dollar earned by a man.
What is Inequality or Gini Index in Candlewood Lake?
Inequality or Gini Index in Candlewood Lake is 0.25.
How Large is the Labor Force in Candlewood Lake?
There are 650 People in the Labor Forcein in Candlewood Lake.
What is the Percentage of People in the Labor Force in Candlewood Lake?
66.3% of People are in the Labor Force in Candlewood Lake.