West Rushville, OH
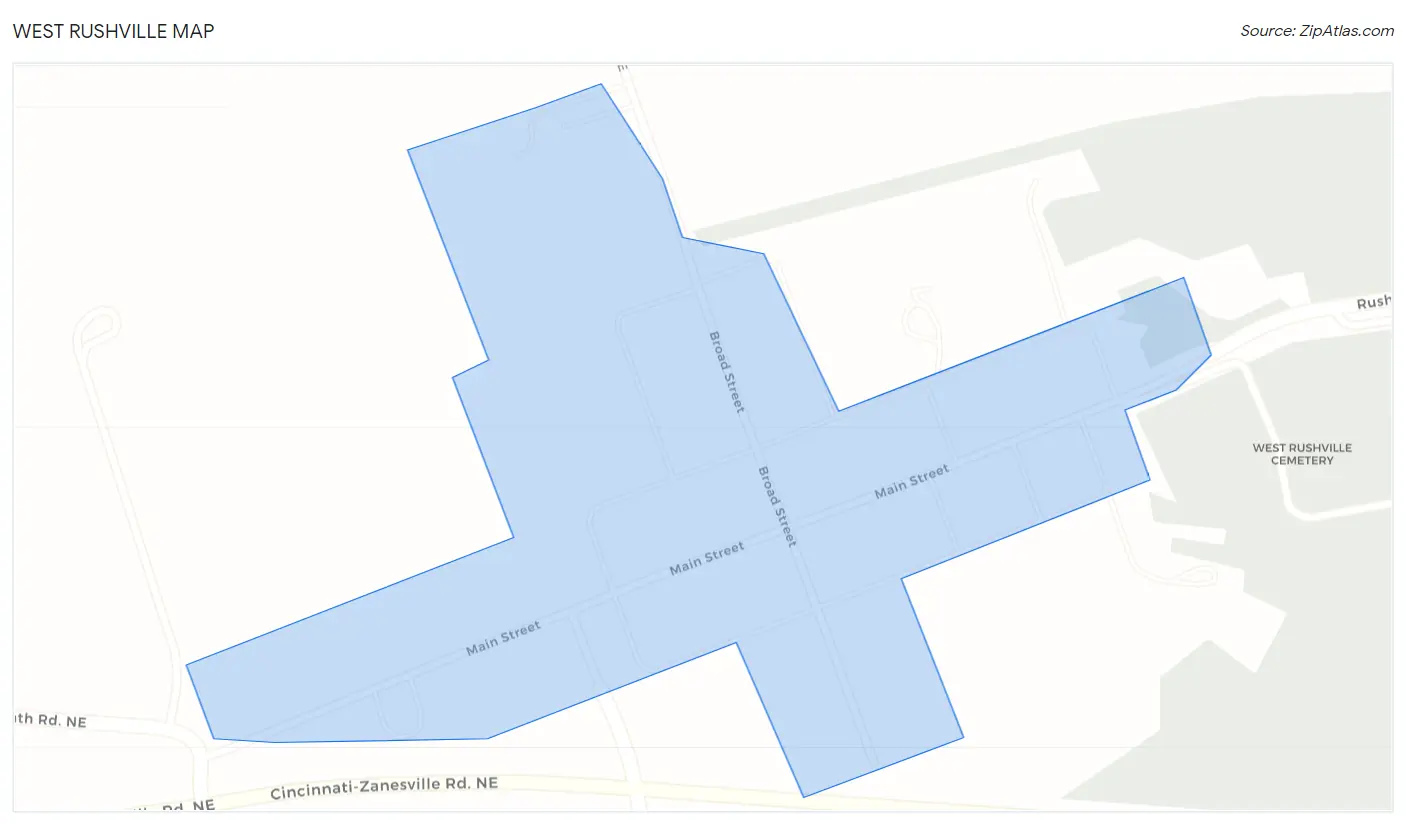
West Rushville Map
West Rushville Overview
278
TOTAL POPULATION
100
MALE POPULATION
178
FEMALE POPULATION
56.18
MALES / 100 FEMALES
178.00
FEMALES / 100 MALES
20.6
MEDIAN AGE
3.9
AVG FAMILY SIZE
3.9
AVG HOUSEHOLD SIZE
$17,626
PER CAPITA INCOME
$59,861
AVG FAMILY INCOME
$59,444
AVG HOUSEHOLD INCOME
35.8%
WAGE / INCOME GAP [ % ]
64.2¢/ $1
WAGE / INCOME GAP [ $ ]
0.27
INEQUALITY / GINI INDEX
110
LABOR FORCE [ PEOPLE ]
69.2%
PERCENT IN LABOR FORCE
2.7%
UNEMPLOYMENT RATE
West Rushville Area Codes
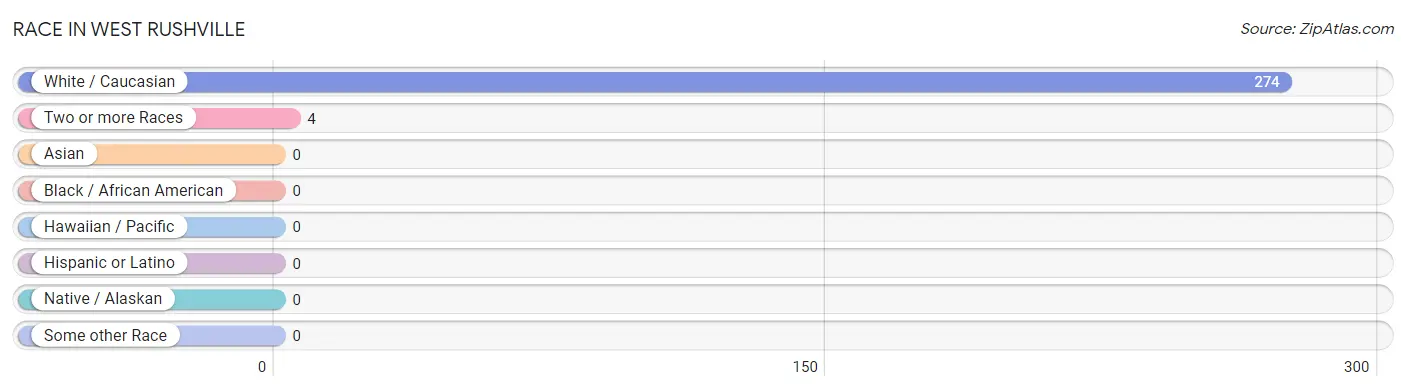
Race in West Rushville
The most populous races in West Rushville are White / Caucasian (274 | 98.6%), and Two or more Races (4 | 1.4%).
| Race | # Population | % Population |
| Asian | 0 | 0.0% |
| Black / African American | 0 | 0.0% |
| Hawaiian / Pacific | 0 | 0.0% |
| Hispanic or Latino | 0 | 0.0% |
| Native / Alaskan | 0 | 0.0% |
| White / Caucasian | 274 | 98.6% |
| Two or more Races | 4 | 1.4% |
| Some other Race | 0 | 0.0% |
| Total | 278 | 100.0% |
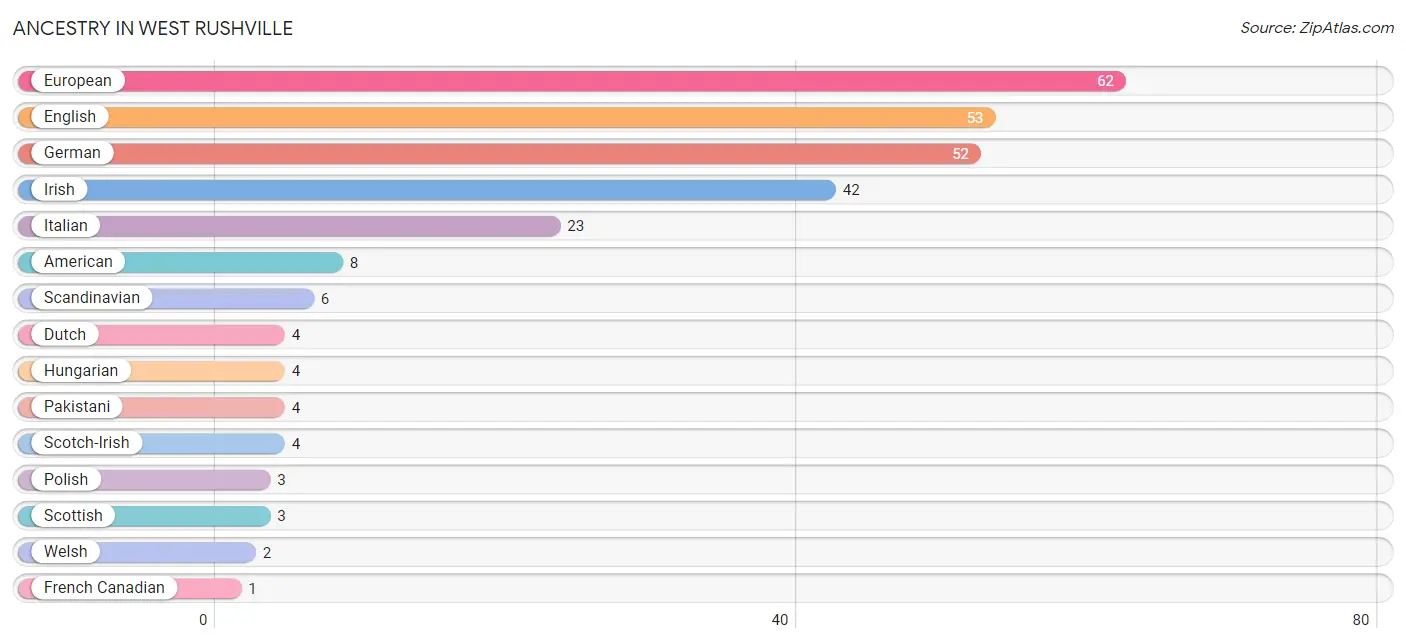
Ancestry in West Rushville
The most populous ancestries reported in West Rushville are European (62 | 22.3%), English (53 | 19.1%), German (52 | 18.7%), Irish (42 | 15.1%), and Italian (23 | 8.3%), together accounting for 83.5% of all West Rushville residents.
| Ancestry | # Population | % Population |
| American | 8 | 2.9% |
| Dutch | 4 | 1.4% |
| English | 53 | 19.1% |
| European | 62 | 22.3% |
| French Canadian | 1 | 0.4% |
| German | 52 | 18.7% |
| Hungarian | 4 | 1.4% |
| Irish | 42 | 15.1% |
| Italian | 23 | 8.3% |
| Pakistani | 4 | 1.4% |
| Polish | 3 | 1.1% |
| Scandinavian | 6 | 2.2% |
| Scotch-Irish | 4 | 1.4% |
| Scottish | 3 | 1.1% |
| Welsh | 2 | 0.7% | View All 15 Rows |
Immigrants in West Rushville

| Immigration Origin | # Population | % Population | View All 0 Rows |
Sex and Age in West Rushville
Sex and Age in West Rushville
The most populous age groups in West Rushville are Under 5 Years (22 | 22.0%) for men and Under 5 Years (35 | 19.7%) for women.
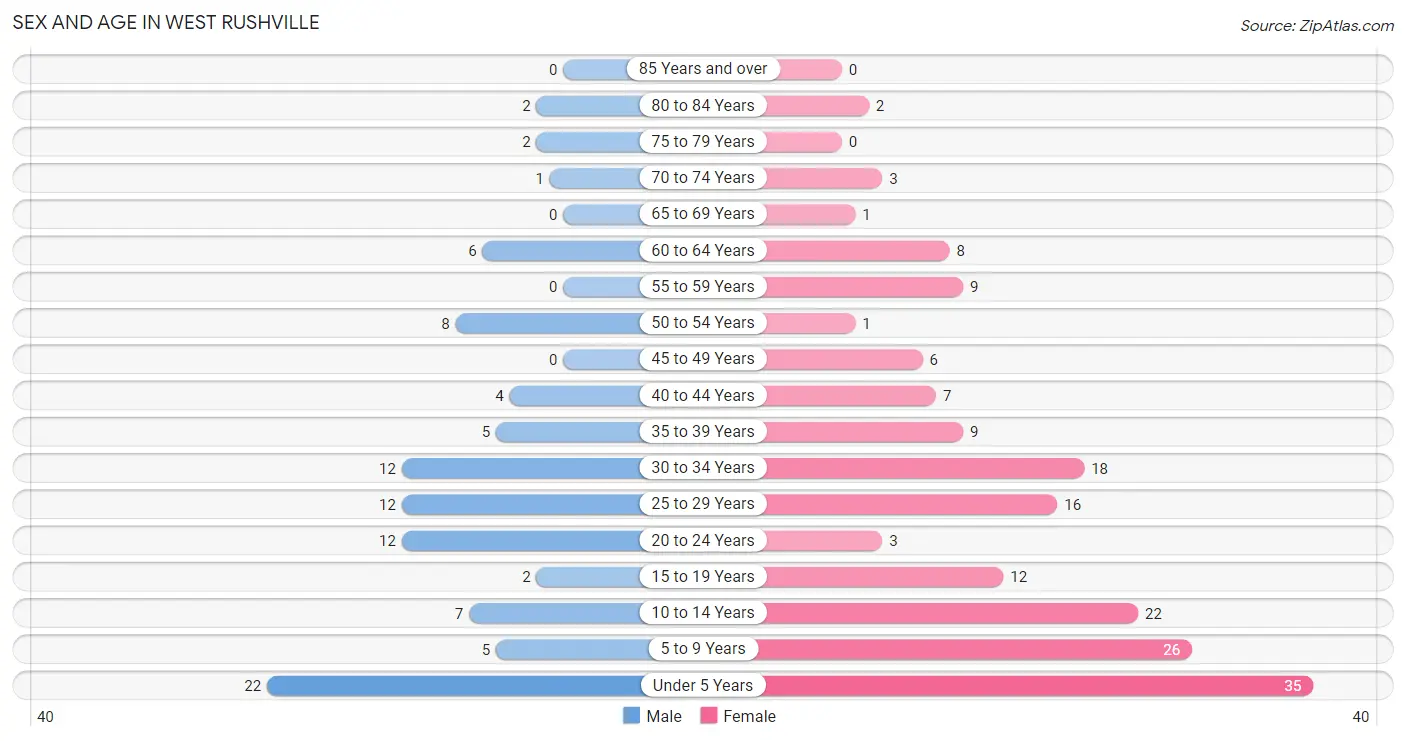
| Age Bracket | Male | Female |
| Under 5 Years | 22 (22.0%) | 35 (19.7%) |
| 5 to 9 Years | 5 (5.0%) | 26 (14.6%) |
| 10 to 14 Years | 7 (7.0%) | 22 (12.4%) |
| 15 to 19 Years | 2 (2.0%) | 12 (6.7%) |
| 20 to 24 Years | 12 (12.0%) | 3 (1.7%) |
| 25 to 29 Years | 12 (12.0%) | 16 (9.0%) |
| 30 to 34 Years | 12 (12.0%) | 18 (10.1%) |
| 35 to 39 Years | 5 (5.0%) | 9 (5.1%) |
| 40 to 44 Years | 4 (4.0%) | 7 (3.9%) |
| 45 to 49 Years | 0 (0.0%) | 6 (3.4%) |
| 50 to 54 Years | 8 (8.0%) | 1 (0.6%) |
| 55 to 59 Years | 0 (0.0%) | 9 (5.1%) |
| 60 to 64 Years | 6 (6.0%) | 8 (4.5%) |
| 65 to 69 Years | 0 (0.0%) | 1 (0.6%) |
| 70 to 74 Years | 1 (1.0%) | 3 (1.7%) |
| 75 to 79 Years | 2 (2.0%) | 0 (0.0%) |
| 80 to 84 Years | 2 (2.0%) | 2 (1.1%) |
| 85 Years and over | 0 (0.0%) | 0 (0.0%) |
| Total | 100 (100.0%) | 178 (100.0%) |
Families and Households in West Rushville
Median Family Size in West Rushville
The median family size in West Rushville is 3.90 persons per family, with single female/mother families (25 | 36.2%) accounting for the largest median family size of 4.56 persons per family. On the other hand, single male/father families (9 | 13.0%) represent the smallest median family size with 2.33 persons per family.
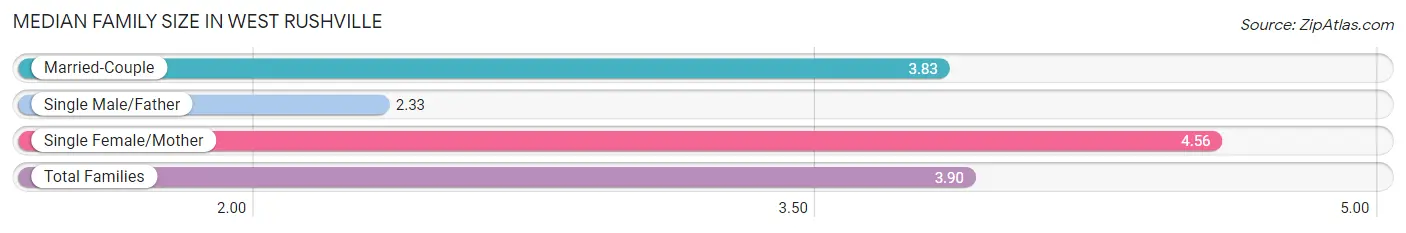
| Family Type | # Families | Family Size |
| Married-Couple | 35 (50.7%) | 3.83 |
| Single Male/Father | 9 (13.0%) | 2.33 |
| Single Female/Mother | 25 (36.2%) | 4.56 |
| Total Families | 69 (100.0%) | 3.90 |
Median Household Size in West Rushville
The median household size in West Rushville is 3.86 persons per household, with single female/mother households (25 | 34.7%) accounting for the largest median household size of 4.56 persons per household. non-family households (3 | 4.2%) represent the smallest median household size with 1.00 persons per household.
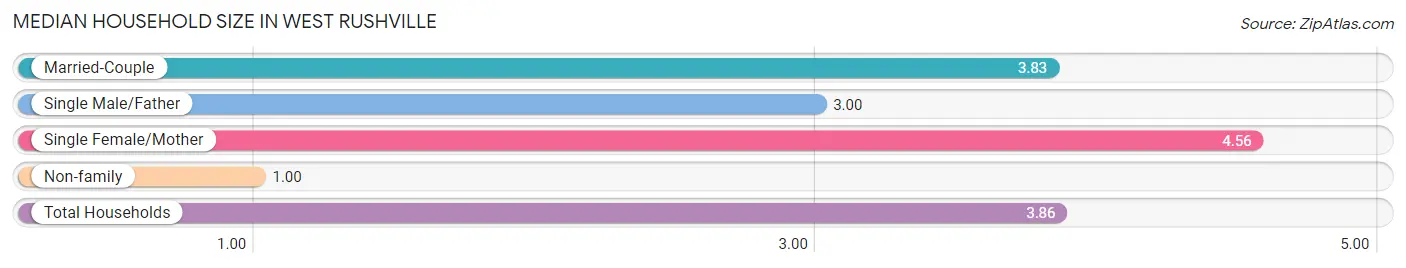
| Household Type | # Households | Household Size |
| Married-Couple | 35 (48.6%) | 3.83 |
| Single Male/Father | 9 (12.5%) | 3.00 |
| Single Female/Mother | 25 (34.7%) | 4.56 |
| Non-family | 3 (4.2%) | 1.00 |
| Total Households | 72 (100.0%) | 3.86 |
Household Size by Marriage Status in West Rushville
Out of a total of 72 households in West Rushville, 69 (95.8%) are family households, while 3 (4.2%) are nonfamily households. The most numerous type of family households are 3-person households, comprising 18, and the most common type of nonfamily households are 1-person households, comprising 3.
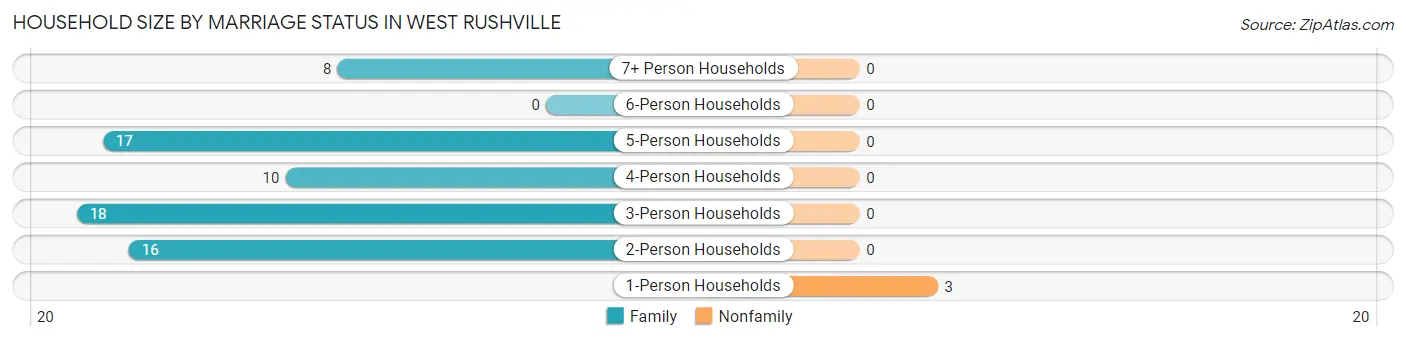
| Household Size | Family Households | Nonfamily Households |
| 1-Person Households | - | 3 (4.2%) |
| 2-Person Households | 16 (22.2%) | 0 (0.0%) |
| 3-Person Households | 18 (25.0%) | 0 (0.0%) |
| 4-Person Households | 10 (13.9%) | 0 (0.0%) |
| 5-Person Households | 17 (23.6%) | 0 (0.0%) |
| 6-Person Households | 0 (0.0%) | 0 (0.0%) |
| 7+ Person Households | 8 (11.1%) | 0 (0.0%) |
| Total | 69 (95.8%) | 3 (4.2%) |
Female Fertility in West Rushville
Fertility by Age in West Rushville
Average fertility rate in West Rushville is 169.0 births per 1,000 women. Women in the age bracket of 20 to 34 years have the highest fertility rate with 324.0 births per 1,000 women. Women in the age bracket of 20 to 34 years acount for 100.0% of all women with births.
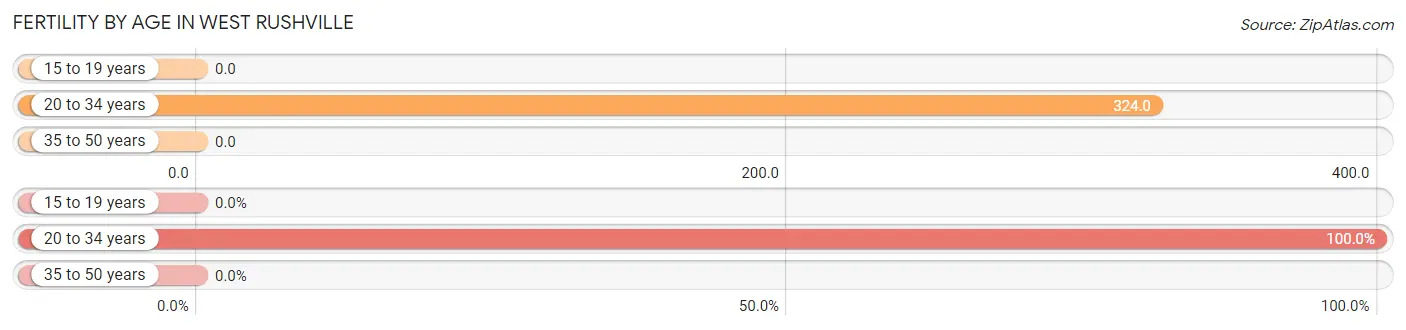
| Age Bracket | Women with Births | Births / 1,000 Women |
| 15 to 19 years | 0 (0.0%) | 0.0 |
| 20 to 34 years | 12 (100.0%) | 324.0 |
| 35 to 50 years | 0 (0.0%) | 0.0 |
| Total | 12 (100.0%) | 169.0 |
Fertility by Age by Marriage Status in West Rushville
83.3% of women with births (12) in West Rushville are married. The highest percentage of unmarried women with births falls into 20 to 34 years age bracket with 16.7% of them unmarried at the time of birth, while the lowest percentage of unmarried women with births belong to 20 to 34 years age bracket with 16.7% of them unmarried.
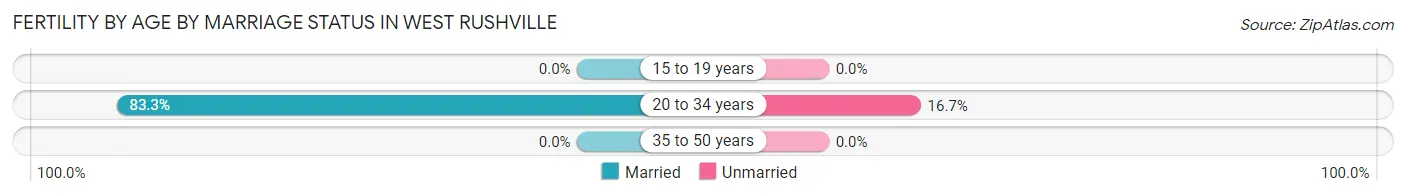
| Age Bracket | Married | Unmarried |
| 15 to 19 years | 0 (0.0%) | 0 (0.0%) |
| 20 to 34 years | 10 (83.3%) | 2 (16.7%) |
| 35 to 50 years | 0 (0.0%) | 0 (0.0%) |
| Total | 10 (83.3%) | 2 (16.7%) |
Fertility by Education in West Rushville
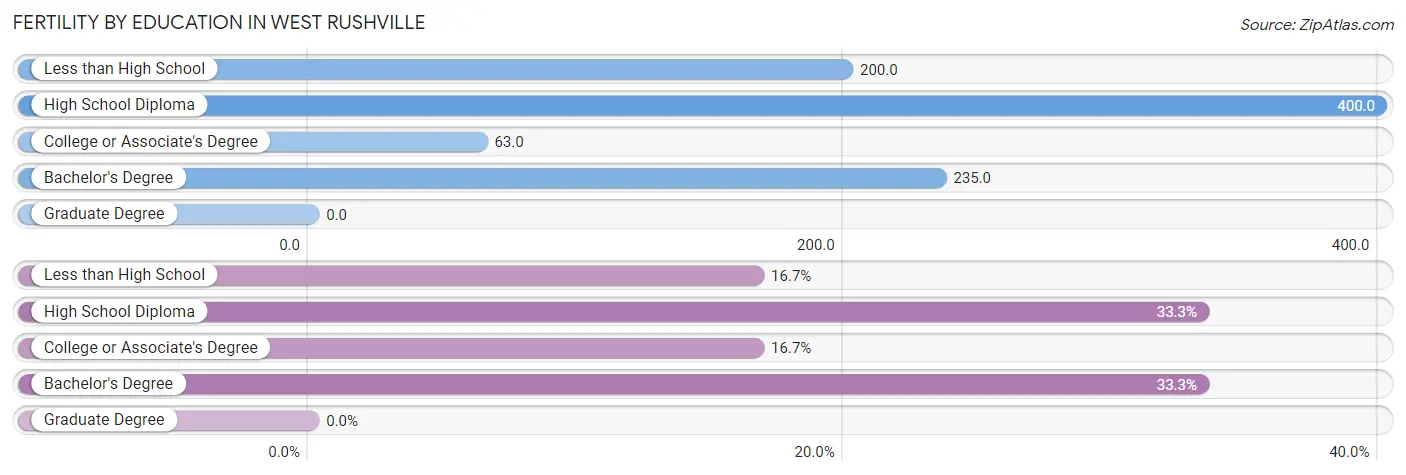
| Educational Attainment | Women with Births | Births / 1,000 Women |
| Less than High School | 2 (16.7%) | 200.0 |
| High School Diploma | 4 (33.3%) | 400.0 |
| College or Associate's Degree | 2 (16.7%) | 63.0 |
| Bachelor's Degree | 4 (33.3%) | 235.0 |
| Graduate Degree | 0 (0.0%) | 0.0 |
| Total | 12 (100.0%) | 169.0 |
Fertility by Education by Marriage Status in West Rushville
16.7% of women with births in West Rushville are unmarried. Women with the educational attainment of less than high school are most likely to be married with 100.0% of them married at childbirth, while women with the educational attainment of college or associate's degree are least likely to be married with 100.0% of them unmarried at childbirth.
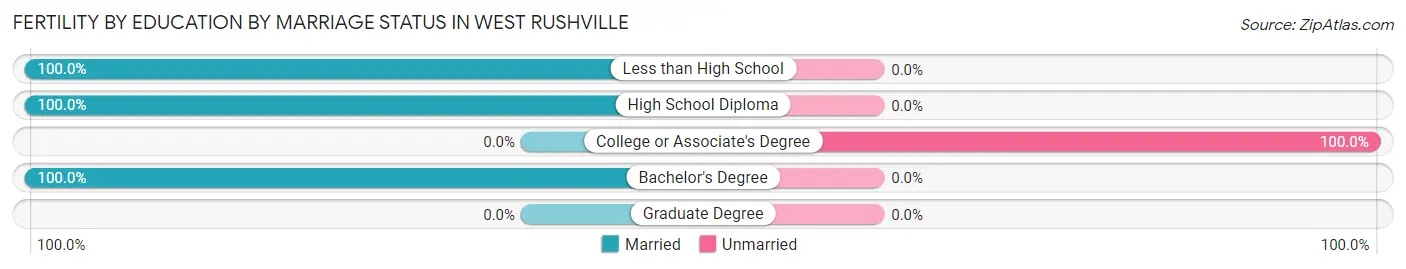
| Educational Attainment | Married | Unmarried |
| Less than High School | 2 (100.0%) | 0 (0.0%) |
| High School Diploma | 4 (100.0%) | 0 (0.0%) |
| College or Associate's Degree | 0 (0.0%) | 2 (100.0%) |
| Bachelor's Degree | 4 (100.0%) | 0 (0.0%) |
| Graduate Degree | 0 (0.0%) | 0 (0.0%) |
| Total | 10 (83.3%) | 2 (16.7%) |
Income in West Rushville
Income Overview in West Rushville
Per Capita Income in West Rushville is $17,626, while median incomes of families and households are $59,861 and $59,444 respectively.
| Characteristic | Number | Measure |
| Per Capita Income | 278 | $17,626 |
| Median Family Income | 69 | $59,861 |
| Mean Family Income | 69 | $66,804 |
| Median Household Income | 72 | $59,444 |
| Mean Household Income | 72 | $65,692 |
| Income Deficit | 69 | $0 |
| Wage / Income Gap (%) | 278 | 35.82% |
| Wage / Income Gap ($) | 278 | 64.18¢ per $1 |
| Gini / Inequality Index | 278 | 0.27 |
Earnings by Sex in West Rushville
Average Earnings in West Rushville are $36,500, $41,875 for men and $26,875 for women, a difference of 35.8%.
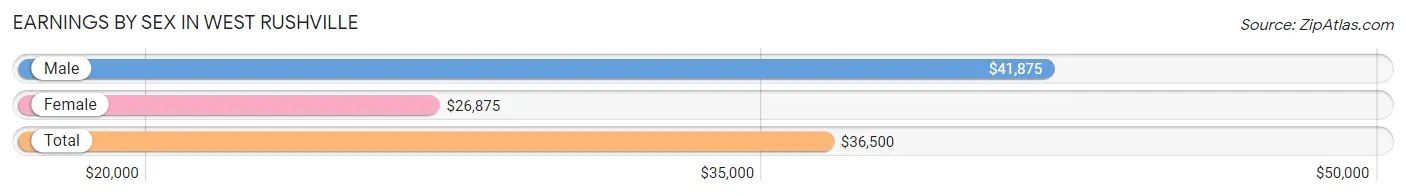
| Sex | Number | Average Earnings |
| Male | 53 (46.5%) | $41,875 |
| Female | 61 (53.5%) | $26,875 |
| Total | 114 (100.0%) | $36,500 |
Earnings by Sex by Income Bracket in West Rushville
The most common earnings brackets in West Rushville are $10,000 to $12,499 for men (15 | 28.3%) and $10,000 to $12,499 for women (12 | 19.7%).
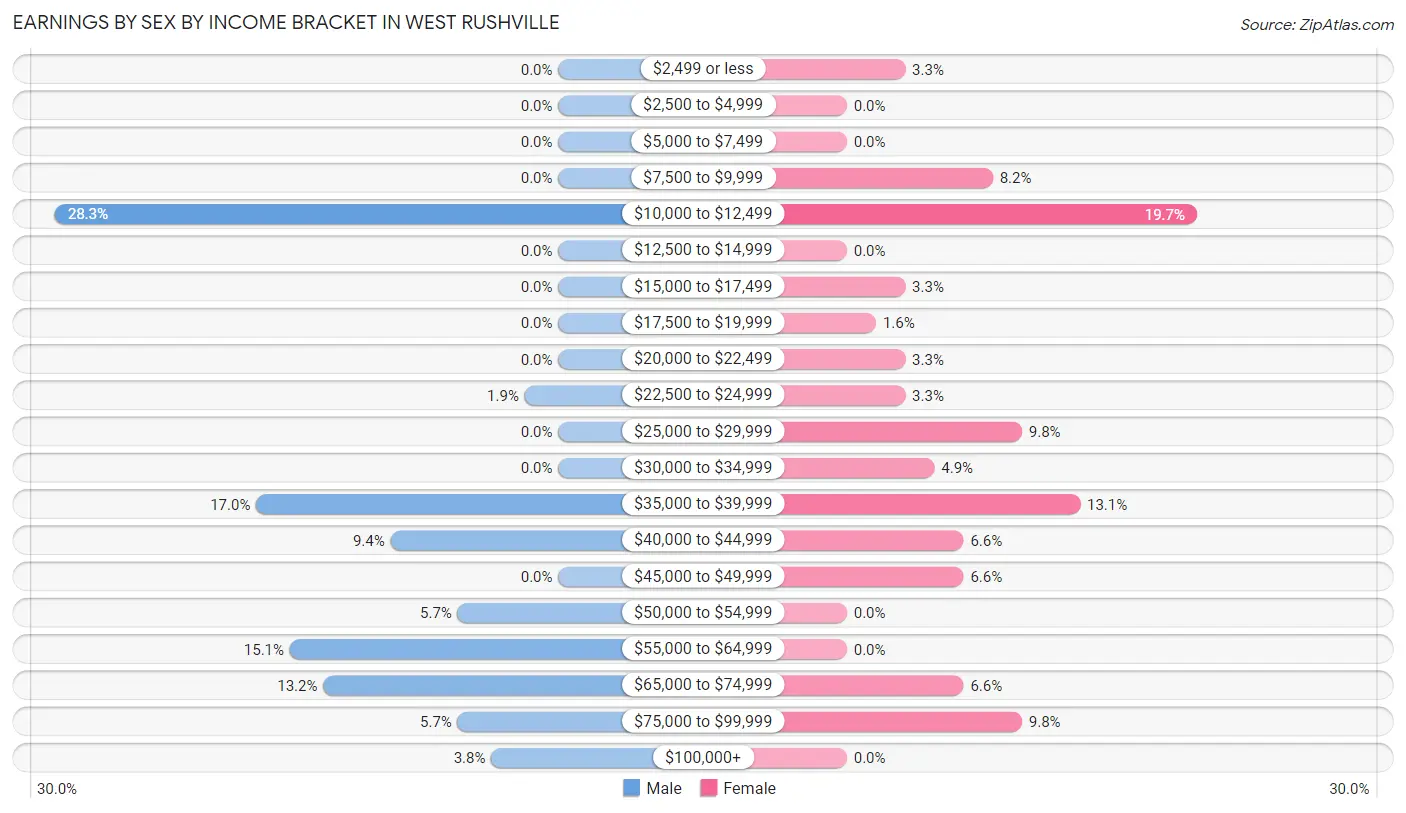
| Income | Male | Female |
| $2,499 or less | 0 (0.0%) | 2 (3.3%) |
| $2,500 to $4,999 | 0 (0.0%) | 0 (0.0%) |
| $5,000 to $7,499 | 0 (0.0%) | 0 (0.0%) |
| $7,500 to $9,999 | 0 (0.0%) | 5 (8.2%) |
| $10,000 to $12,499 | 15 (28.3%) | 12 (19.7%) |
| $12,500 to $14,999 | 0 (0.0%) | 0 (0.0%) |
| $15,000 to $17,499 | 0 (0.0%) | 2 (3.3%) |
| $17,500 to $19,999 | 0 (0.0%) | 1 (1.6%) |
| $20,000 to $22,499 | 0 (0.0%) | 2 (3.3%) |
| $22,500 to $24,999 | 1 (1.9%) | 2 (3.3%) |
| $25,000 to $29,999 | 0 (0.0%) | 6 (9.8%) |
| $30,000 to $34,999 | 0 (0.0%) | 3 (4.9%) |
| $35,000 to $39,999 | 9 (17.0%) | 8 (13.1%) |
| $40,000 to $44,999 | 5 (9.4%) | 4 (6.6%) |
| $45,000 to $49,999 | 0 (0.0%) | 4 (6.6%) |
| $50,000 to $54,999 | 3 (5.7%) | 0 (0.0%) |
| $55,000 to $64,999 | 8 (15.1%) | 0 (0.0%) |
| $65,000 to $74,999 | 7 (13.2%) | 4 (6.6%) |
| $75,000 to $99,999 | 3 (5.7%) | 6 (9.8%) |
| $100,000+ | 2 (3.8%) | 0 (0.0%) |
| Total | 53 (100.0%) | 61 (100.0%) |
Earnings by Sex by Educational Attainment in West Rushville
Average earnings in West Rushville are $54,583 for men and $30,833 for women, a difference of 43.5%. Men with an educational attainment of less than high school enjoy the highest average annual earnings of $63,333, while those with bachelor's degree education earn the least with $55,625. Women with an educational attainment of bachelor's degree earn the most with the average annual earnings of $37,500, while those with high school diploma education have the smallest earnings of $35,156.
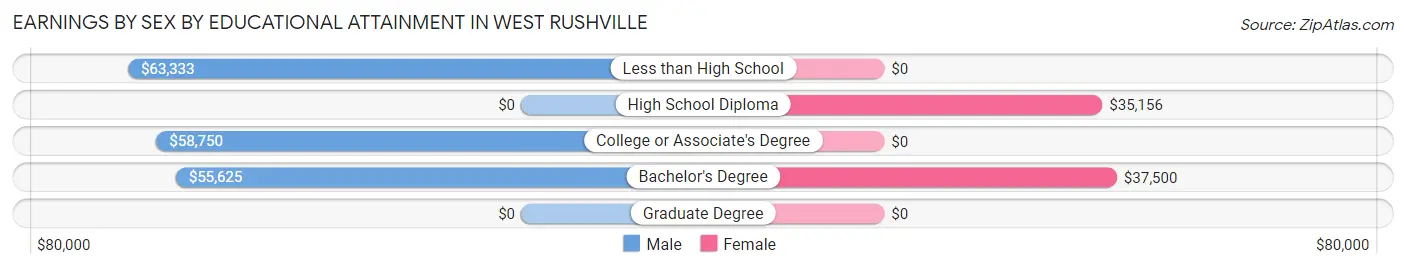
| Educational Attainment | Male Income | Female Income |
| Less than High School | $63,333 | $0 |
| High School Diploma | - | - |
| College or Associate's Degree | $58,750 | $0 |
| Bachelor's Degree | $55,625 | $37,500 |
| Graduate Degree | - | - |
| Total | $54,583 | $30,833 |
Family Income in West Rushville
Family Income Brackets in West Rushville
According to the West Rushville family income data, there are 22 families falling into the $75,000 to $99,999 income range, which is the most common income bracket and makes up 31.9% of all families.
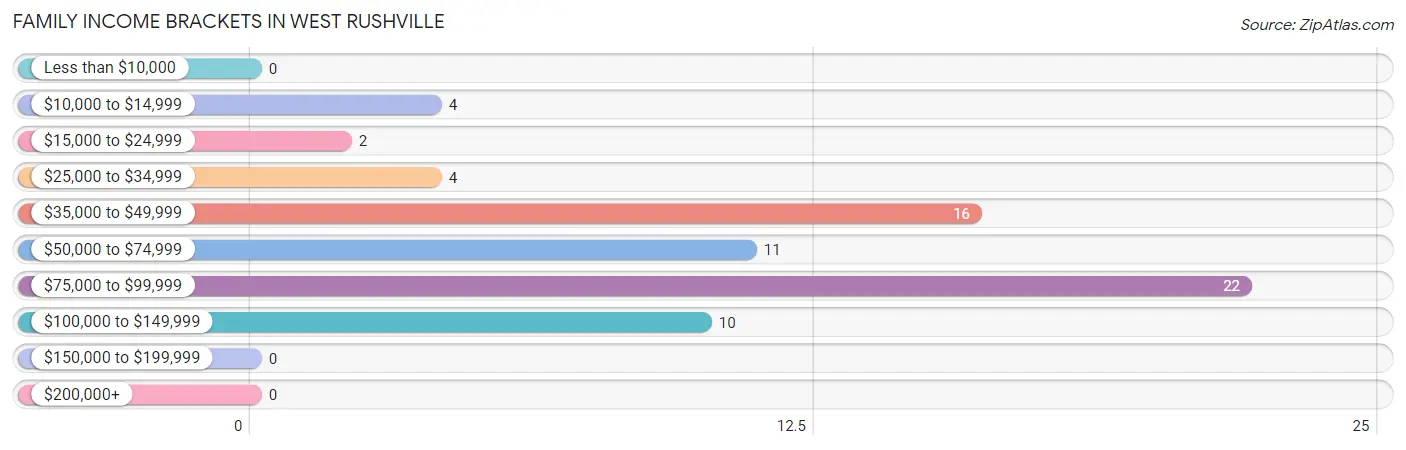
| Income Bracket | # Families | % Families |
| Less than $10,000 | 0 | 0.0% |
| $10,000 to $14,999 | 4 | 5.8% |
| $15,000 to $24,999 | 2 | 2.9% |
| $25,000 to $34,999 | 4 | 5.8% |
| $35,000 to $49,999 | 16 | 23.2% |
| $50,000 to $74,999 | 11 | 15.9% |
| $75,000 to $99,999 | 22 | 31.9% |
| $100,000 to $149,999 | 10 | 14.5% |
| $150,000 to $199,999 | 0 | 0.0% |
| $200,000+ | 0 | 0.0% |
Family Income by Famaliy Size in West Rushville
3-person families (20 | 29.0%) account for the highest median family income in West Rushville with $78,750 per family, while 3-person families (20 | 29.0%) have the highest median income of $26,250 per family member.
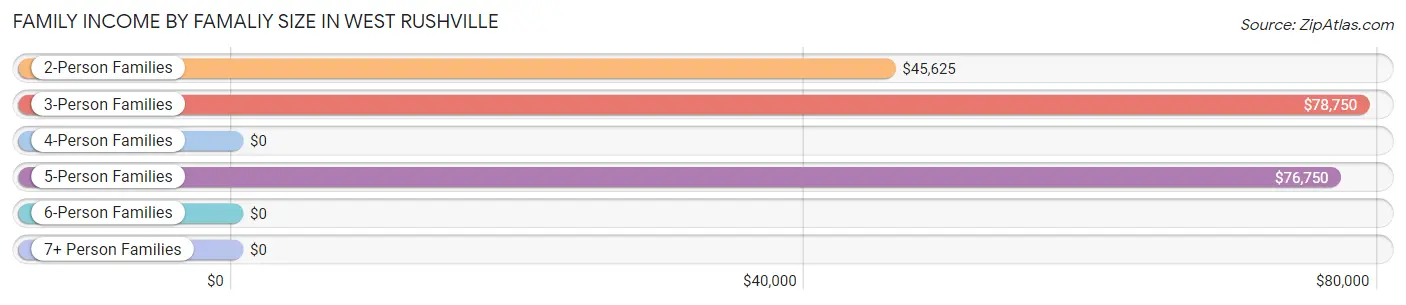
| Income Bracket | # Families | Median Income |
| 2-Person Families | 19 (27.5%) | $45,625 |
| 3-Person Families | 20 (29.0%) | $78,750 |
| 4-Person Families | 5 (7.2%) | $0 |
| 5-Person Families | 17 (24.6%) | $76,750 |
| 6-Person Families | 0 (0.0%) | $0 |
| 7+ Person Families | 8 (11.6%) | $0 |
| Total | 69 (100.0%) | $59,861 |
Family Income by Number of Earners in West Rushville
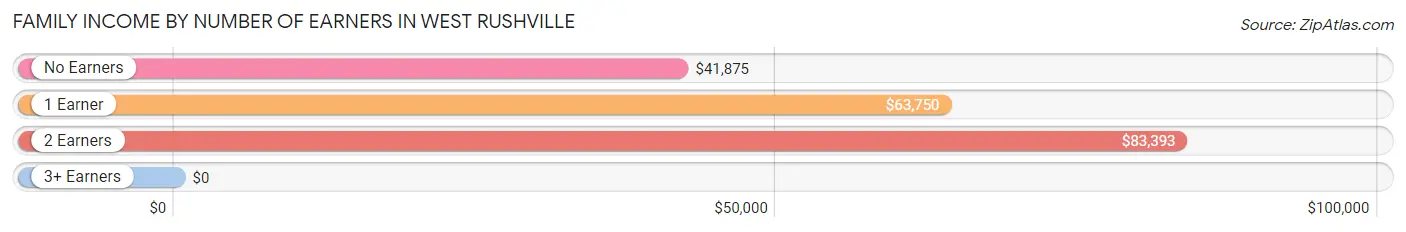
| Number of Earners | # Families | Median Income |
| No Earners | 13 (18.8%) | $41,875 |
| 1 Earner | 23 (33.3%) | $63,750 |
| 2 Earners | 23 (33.3%) | $83,393 |
| 3+ Earners | 10 (14.5%) | $0 |
| Total | 69 (100.0%) | $59,861 |
Household Income in West Rushville
Household Income Brackets in West Rushville
With 22 households falling in the category, the $75,000 to $99,999 income range is the most frequent in West Rushville, accounting for 30.6% of all households.
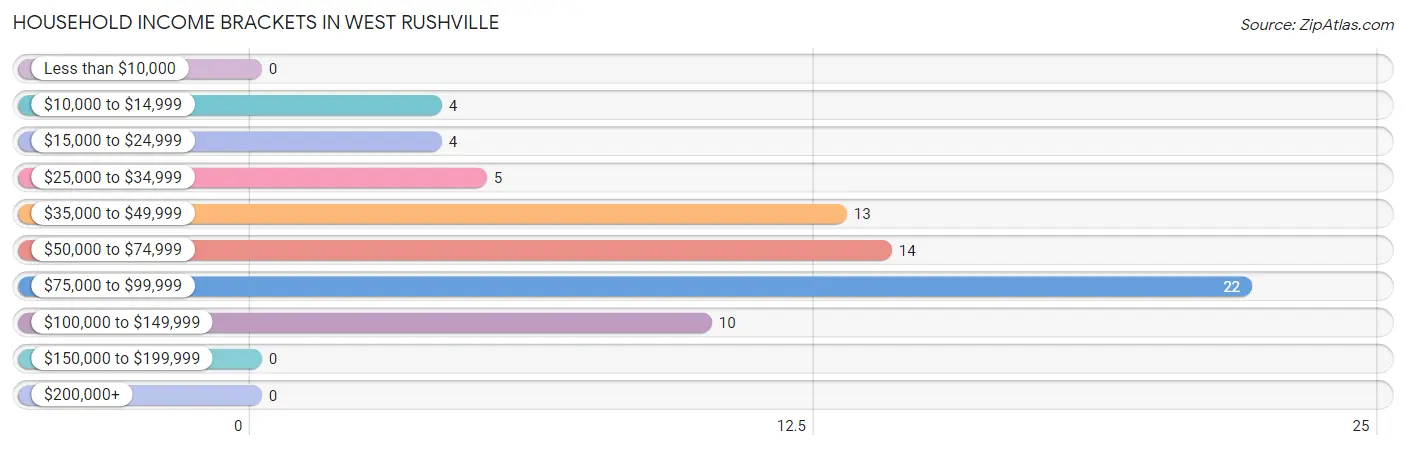
| Income Bracket | # Households | % Households |
| Less than $10,000 | 0 | 0.0% |
| $10,000 to $14,999 | 4 | 5.6% |
| $15,000 to $24,999 | 4 | 5.6% |
| $25,000 to $34,999 | 5 | 6.9% |
| $35,000 to $49,999 | 13 | 18.1% |
| $50,000 to $74,999 | 14 | 19.4% |
| $75,000 to $99,999 | 22 | 30.6% |
| $100,000 to $149,999 | 10 | 13.9% |
| $150,000 to $199,999 | 0 | 0.0% |
| $200,000+ | 0 | 0.0% |
Household Income by Householder Age in West Rushville
The median household income in West Rushville is $59,444, with the highest median household income of $78,125 found in the 25 to 44 years age bracket for the primary householder. A total of 42 households (58.3%) fall into this category. Meanwhile, the 15 to 24 years age bracket for the primary householder has the lowest median household income of $0, with 1 households (1.4%) in this group.
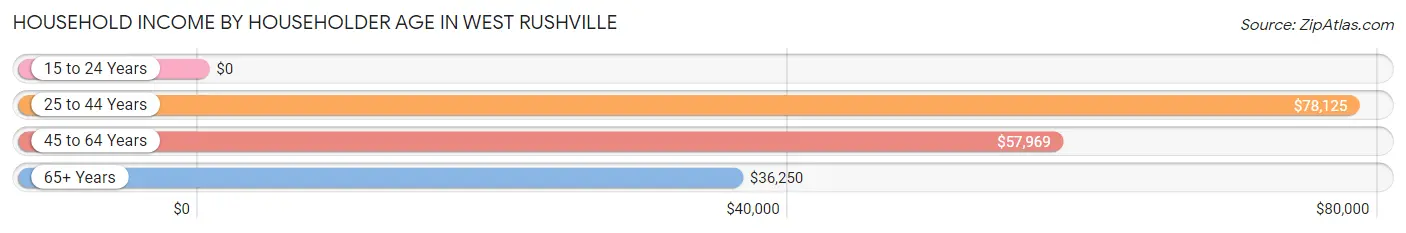
| Income Bracket | # Households | Median Income |
| 15 to 24 Years | 1 (1.4%) | $0 |
| 25 to 44 Years | 42 (58.3%) | $78,125 |
| 45 to 64 Years | 25 (34.7%) | $57,969 |
| 65+ Years | 4 (5.6%) | $36,250 |
| Total | 72 (100.0%) | $59,444 |
Poverty in West Rushville
Income Below Poverty by Sex and Age in West Rushville
With 4.0% poverty level for males and 10.1% for females among the residents of West Rushville, under 5 year old males and 5 year old females are the most vulnerable to poverty, with 4 males (18.2%) and 3 females (60.0%) in their respective age groups living below the poverty level.
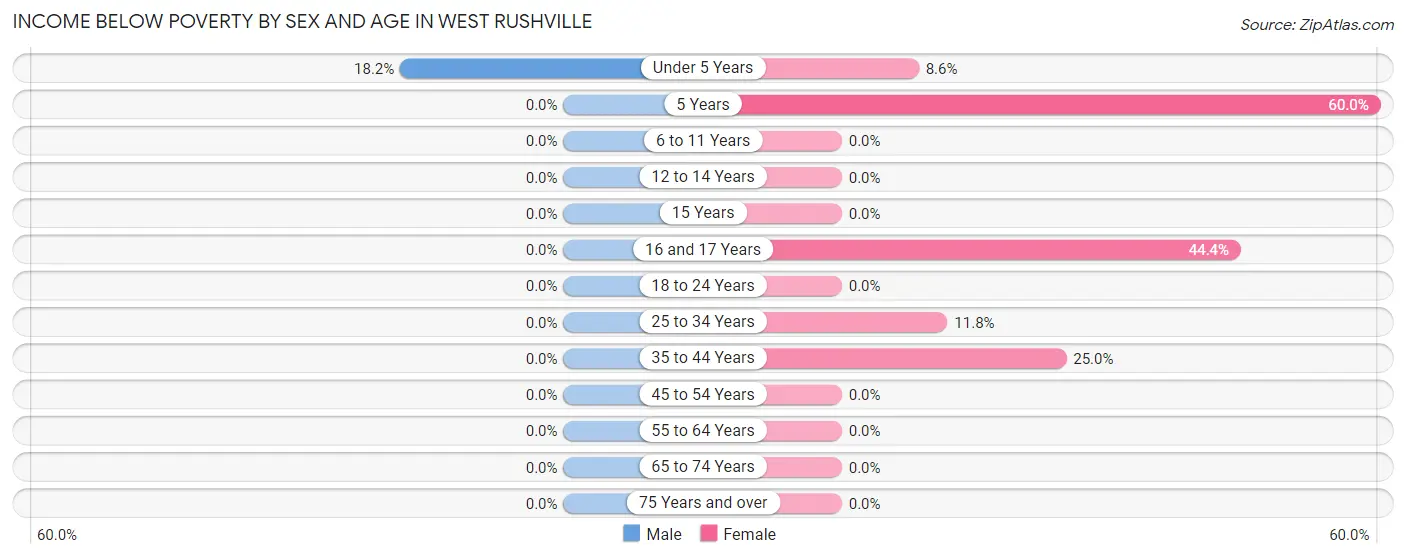
| Age Bracket | Male | Female |
| Under 5 Years | 4 (18.2%) | 3 (8.6%) |
| 5 Years | 0 (0.0%) | 3 (60.0%) |
| 6 to 11 Years | 0 (0.0%) | 0 (0.0%) |
| 12 to 14 Years | 0 (0.0%) | 0 (0.0%) |
| 15 Years | 0 (0.0%) | 0 (0.0%) |
| 16 and 17 Years | 0 (0.0%) | 4 (44.4%) |
| 18 to 24 Years | 0 (0.0%) | 0 (0.0%) |
| 25 to 34 Years | 0 (0.0%) | 4 (11.8%) |
| 35 to 44 Years | 0 (0.0%) | 4 (25.0%) |
| 45 to 54 Years | 0 (0.0%) | 0 (0.0%) |
| 55 to 64 Years | 0 (0.0%) | 0 (0.0%) |
| 65 to 74 Years | 0 (0.0%) | 0 (0.0%) |
| 75 Years and over | 0 (0.0%) | 0 (0.0%) |
| Total | 4 (4.0%) | 18 (10.1%) |
Income Above Poverty by Sex and Age in West Rushville
According to the poverty statistics in West Rushville, males aged 6 to 11 years and females aged 6 to 11 years are the age groups that are most secure financially, with 100.0% of males and 100.0% of females in these age groups living above the poverty line.
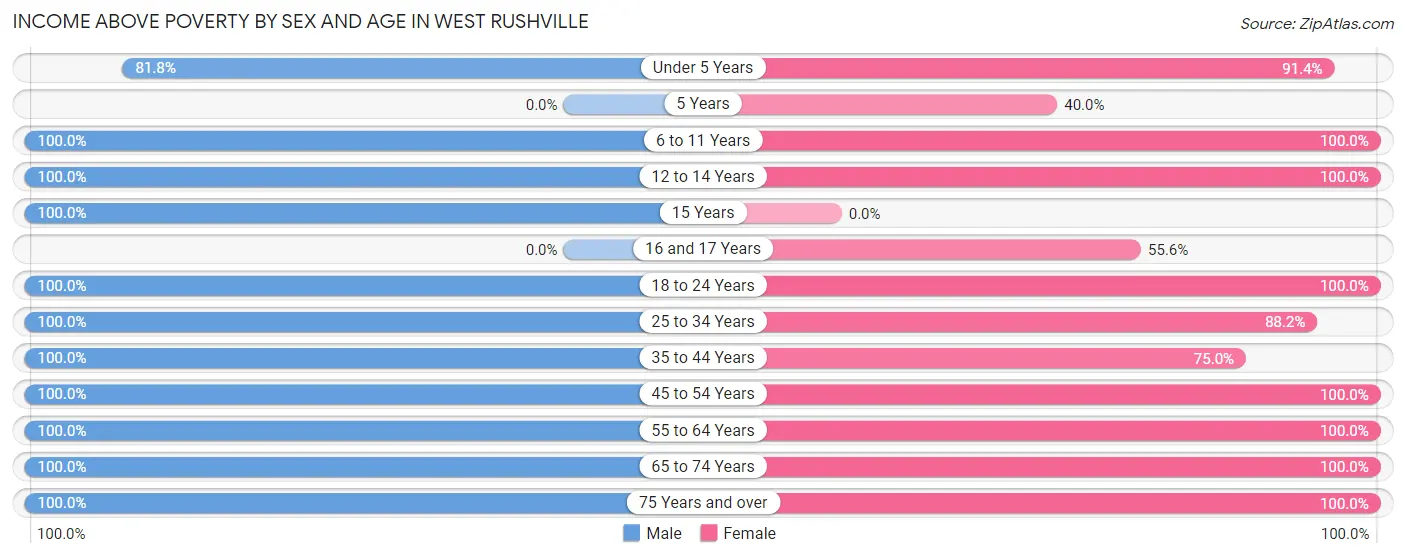
| Age Bracket | Male | Female |
| Under 5 Years | 18 (81.8%) | 32 (91.4%) |
| 5 Years | 0 (0.0%) | 2 (40.0%) |
| 6 to 11 Years | 5 (100.0%) | 25 (100.0%) |
| 12 to 14 Years | 7 (100.0%) | 18 (100.0%) |
| 15 Years | 2 (100.0%) | 0 (0.0%) |
| 16 and 17 Years | 0 (0.0%) | 5 (55.6%) |
| 18 to 24 Years | 12 (100.0%) | 6 (100.0%) |
| 25 to 34 Years | 24 (100.0%) | 30 (88.2%) |
| 35 to 44 Years | 9 (100.0%) | 12 (75.0%) |
| 45 to 54 Years | 8 (100.0%) | 7 (100.0%) |
| 55 to 64 Years | 6 (100.0%) | 17 (100.0%) |
| 65 to 74 Years | 1 (100.0%) | 4 (100.0%) |
| 75 Years and over | 4 (100.0%) | 2 (100.0%) |
| Total | 96 (96.0%) | 160 (89.9%) |
Income Below Poverty Among Married-Couple Families in West Rushville
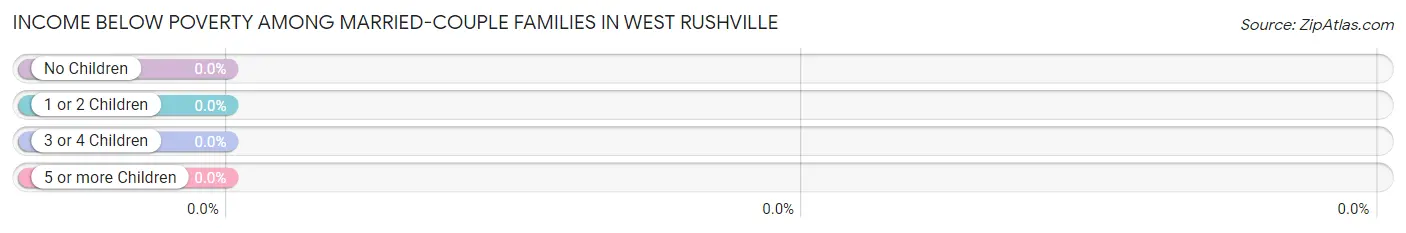
| Children | Above Poverty | Below Poverty |
| No Children | 17 (100.0%) | 0 (0.0%) |
| 1 or 2 Children | 11 (100.0%) | 0 (0.0%) |
| 3 or 4 Children | 7 (100.0%) | 0 (0.0%) |
| 5 or more Children | 0 (0.0%) | 0 (0.0%) |
| Total | 35 (100.0%) | 0 (0.0%) |
Income Below Poverty Among Single-Parent Households in West Rushville
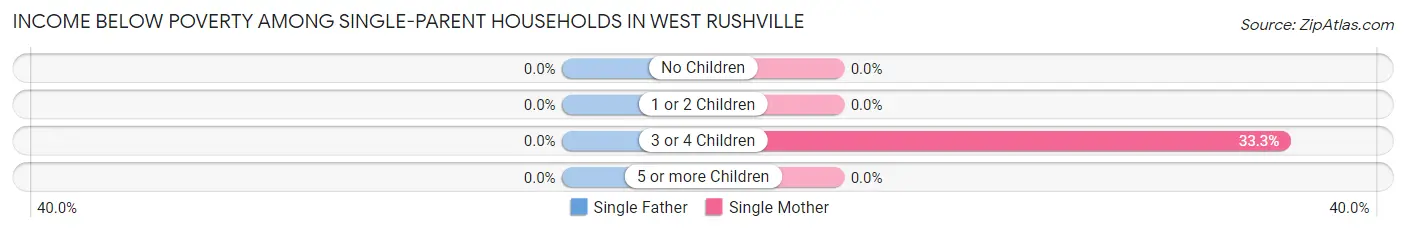
| Children | Single Father | Single Mother |
| No Children | 0 (0.0%) | 0 (0.0%) |
| 1 or 2 Children | 0 (0.0%) | 0 (0.0%) |
| 3 or 4 Children | 0 (0.0%) | 4 (33.3%) |
| 5 or more Children | 0 (0.0%) | 0 (0.0%) |
| Total | 0 (0.0%) | 4 (16.0%) |
Income Below Poverty Among Married-Couple vs Single-Parent Households in West Rushville
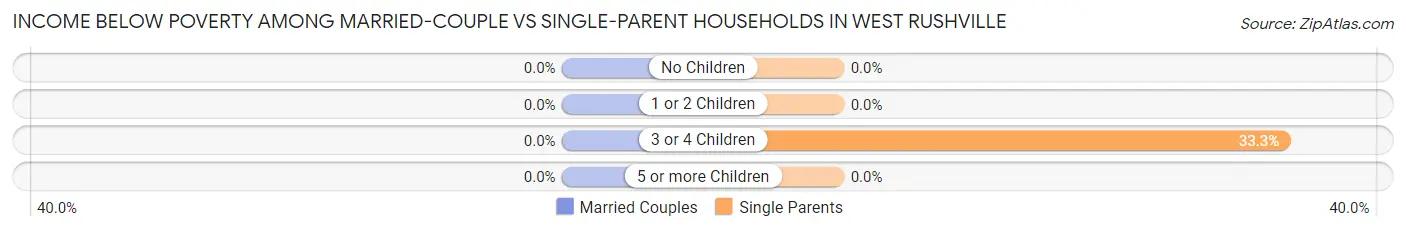
| Children | Married-Couple Families | Single-Parent Households |
| No Children | 0 (0.0%) | 0 (0.0%) |
| 1 or 2 Children | 0 (0.0%) | 0 (0.0%) |
| 3 or 4 Children | 0 (0.0%) | 4 (33.3%) |
| 5 or more Children | 0 (0.0%) | 0 (0.0%) |
| Total | 0 (0.0%) | 4 (11.8%) |
Employment Characteristics in West Rushville
Employment by Class of Employer in West Rushville
Among the 107 employed individuals in West Rushville, private company employees (72 | 67.3%), self-employed (not incorporated) (17 | 15.9%), and not-for-profit organizations (9 | 8.4%) make up the most common classes of employment.
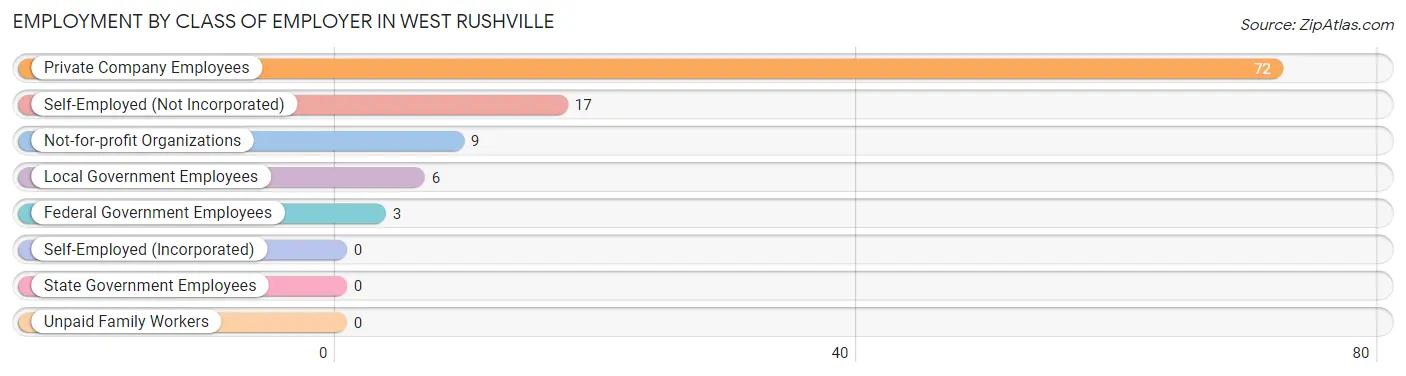
| Employer Class | # Employees | % Employees |
| Private Company Employees | 72 | 67.3% |
| Self-Employed (Incorporated) | 0 | 0.0% |
| Self-Employed (Not Incorporated) | 17 | 15.9% |
| Not-for-profit Organizations | 9 | 8.4% |
| Local Government Employees | 6 | 5.6% |
| State Government Employees | 0 | 0.0% |
| Federal Government Employees | 3 | 2.8% |
| Unpaid Family Workers | 0 | 0.0% |
| Total | 107 | 100.0% |
Employment Status by Age in West Rushville
According to the labor force statistics for West Rushville, out of the total population over 16 years of age (159), 69.2% or 110 individuals are in the labor force, with 2.7% or 3 of them unemployed. The age group with the highest labor force participation rate is 30 to 34 years, with 100.0% or 30 individuals in the labor force. Within the labor force, the 25 to 29 years age range has the highest percentage of unemployed individuals, with 12.5% or 2 of them being unemployed.
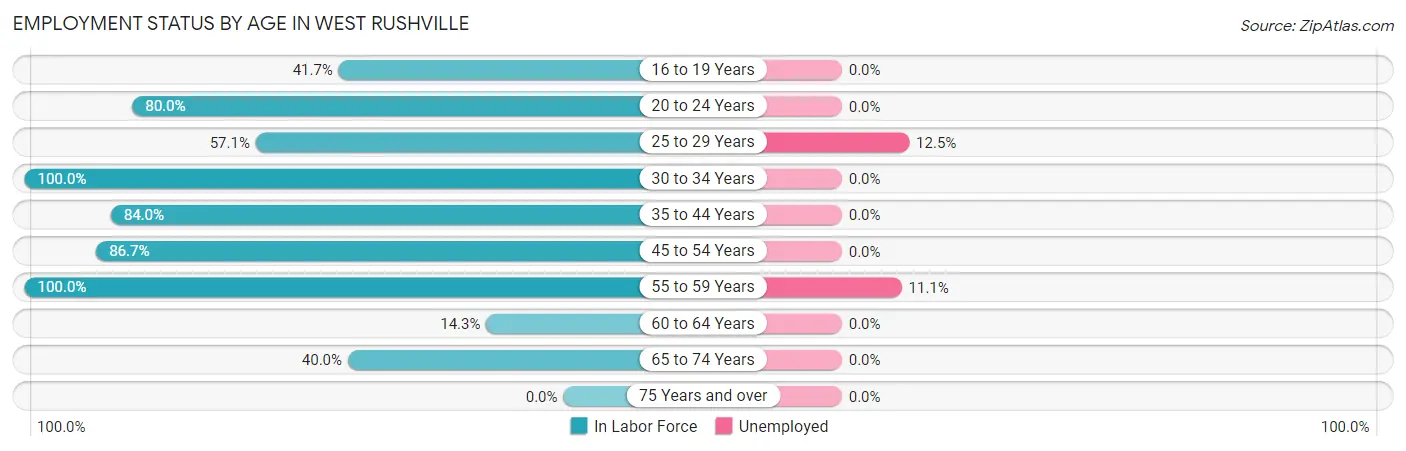
| Age Bracket | In Labor Force | Unemployed |
| 16 to 19 Years | 5 (41.7%) | 0 (0.0%) |
| 20 to 24 Years | 12 (80.0%) | 0 (0.0%) |
| 25 to 29 Years | 16 (57.1%) | 2 (12.5%) |
| 30 to 34 Years | 30 (100.0%) | 0 (0.0%) |
| 35 to 44 Years | 21 (84.0%) | 0 (0.0%) |
| 45 to 54 Years | 13 (86.7%) | 0 (0.0%) |
| 55 to 59 Years | 9 (100.0%) | 1 (11.1%) |
| 60 to 64 Years | 2 (14.3%) | 0 (0.0%) |
| 65 to 74 Years | 2 (40.0%) | 0 (0.0%) |
| 75 Years and over | 0 (0.0%) | 0 (0.0%) |
| Total | 110 (69.2%) | 3 (2.7%) |
Employment Status by Educational Attainment in West Rushville
According to labor force statistics for West Rushville, 75.2% of individuals (91) out of the total population between 25 and 64 years of age (121) are in the labor force, with 3.3% or 3 of them being unemployed. The group with the highest labor force participation rate are those with the educational attainment of bachelor's degree or higher, with 100.0% or 38 individuals in the labor force. Within the labor force, individuals with college / associate degree education have the highest percentage of unemployment, with 10.7% or 3 of them being unemployed.
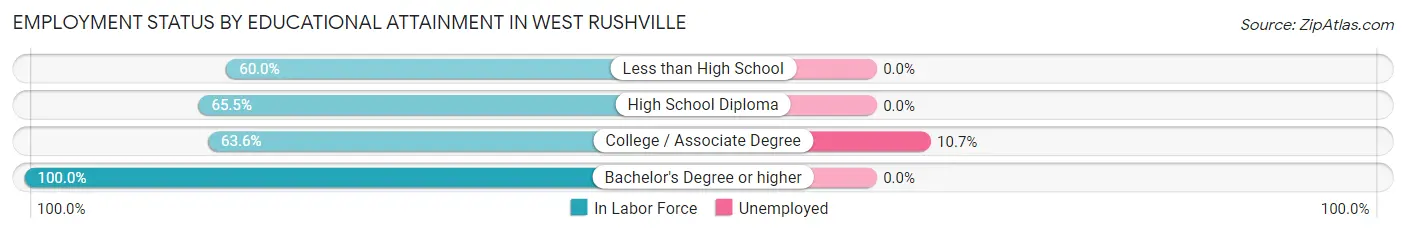
| Educational Attainment | In Labor Force | Unemployed |
| Less than High School | 6 (60.0%) | 0 (0.0%) |
| High School Diploma | 19 (65.5%) | 0 (0.0%) |
| College / Associate Degree | 28 (63.6%) | 5 (10.7%) |
| Bachelor's Degree or higher | 38 (100.0%) | 0 (0.0%) |
| Total | 91 (75.2%) | 4 (3.3%) |
Employment Occupations by Sex in West Rushville
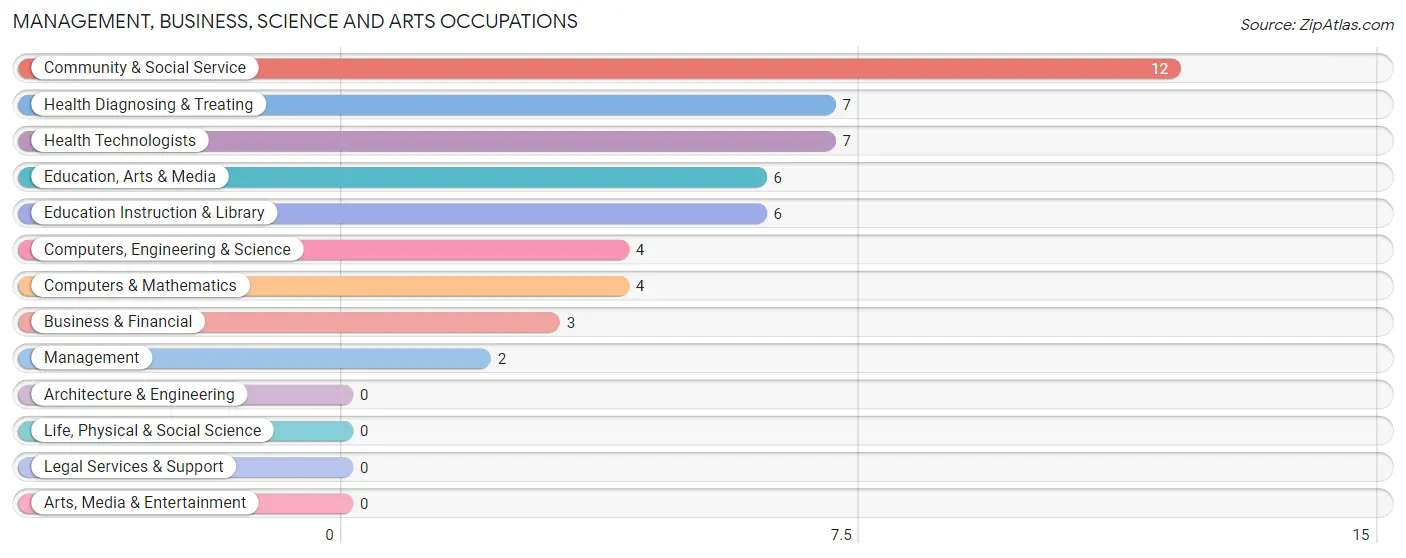
Management, Business, Science and Arts Occupations
The most common Management, Business, Science and Arts occupations in West Rushville are Community & Social Service (12 | 11.2%), Health Diagnosing & Treating (7 | 6.5%), Health Technologists (7 | 6.5%), Education, Arts & Media (6 | 5.6%), and Education Instruction & Library (6 | 5.6%).
Management, Business, Science and Arts Occupations by Sex
Within the Management, Business, Science and Arts occupations in West Rushville, the most male-oriented occupations are Management (100.0%), Business & Financial (100.0%), and Computers, Engineering & Science (50.0%), while the most female-oriented occupations are Education Instruction & Library (100.0%), Health Diagnosing & Treating (100.0%), and Health Technologists (100.0%).
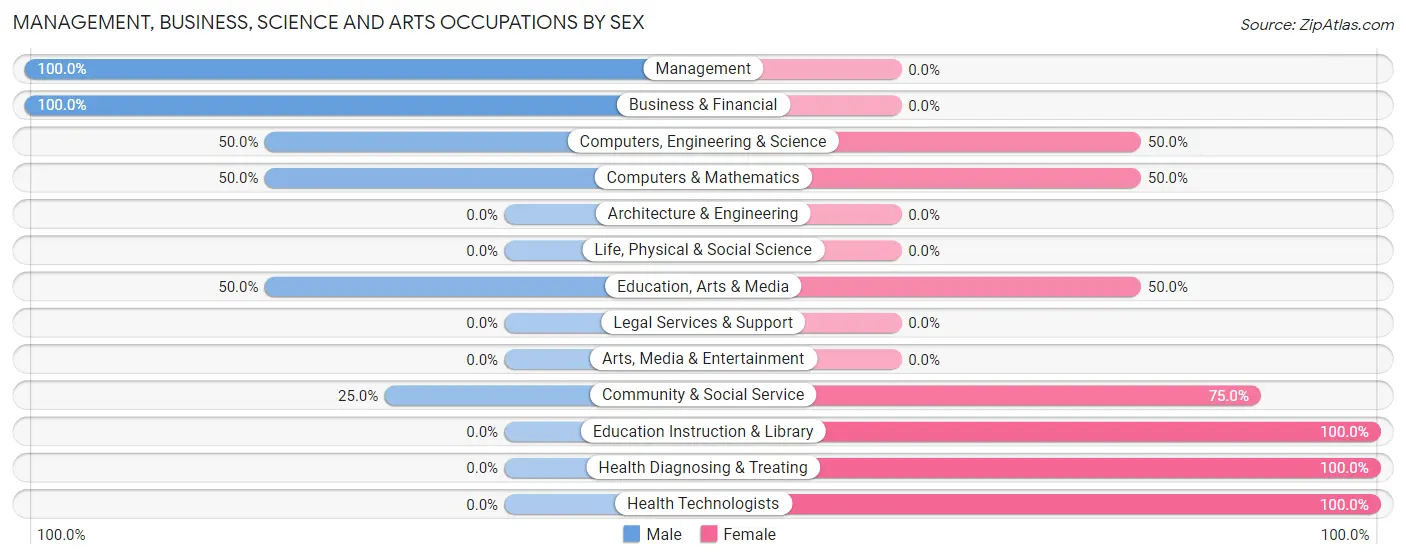
| Occupation | Male | Female |
| Management | 2 (100.0%) | 0 (0.0%) |
| Business & Financial | 3 (100.0%) | 0 (0.0%) |
| Computers, Engineering & Science | 2 (50.0%) | 2 (50.0%) |
| Computers & Mathematics | 2 (50.0%) | 2 (50.0%) |
| Architecture & Engineering | 0 (0.0%) | 0 (0.0%) |
| Life, Physical & Social Science | 0 (0.0%) | 0 (0.0%) |
| Community & Social Service | 3 (25.0%) | 9 (75.0%) |
| Education, Arts & Media | 3 (50.0%) | 3 (50.0%) |
| Legal Services & Support | 0 (0.0%) | 0 (0.0%) |
| Education Instruction & Library | 0 (0.0%) | 6 (100.0%) |
| Arts, Media & Entertainment | 0 (0.0%) | 0 (0.0%) |
| Health Diagnosing & Treating | 0 (0.0%) | 7 (100.0%) |
| Health Technologists | 0 (0.0%) | 7 (100.0%) |
| Total (Category) | 10 (35.7%) | 18 (64.3%) |
| Total (Overall) | 49 (45.8%) | 58 (54.2%) |
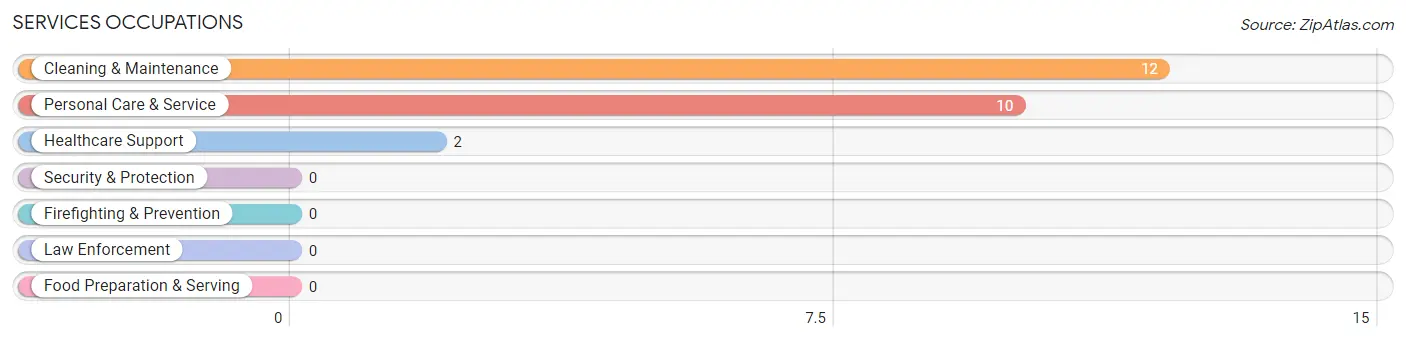
Services Occupations
The most common Services occupations in West Rushville are Cleaning & Maintenance (12 | 11.2%), Personal Care & Service (10 | 9.3%), and Healthcare Support (2 | 1.9%).
Services Occupations by Sex
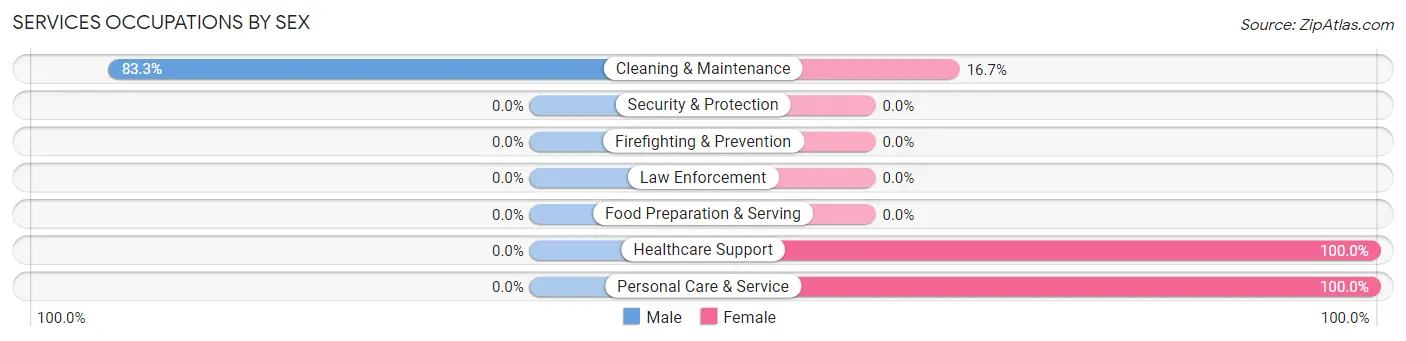
| Occupation | Male | Female |
| Healthcare Support | 0 (0.0%) | 2 (100.0%) |
| Security & Protection | 0 (0.0%) | 0 (0.0%) |
| Firefighting & Prevention | 0 (0.0%) | 0 (0.0%) |
| Law Enforcement | 0 (0.0%) | 0 (0.0%) |
| Food Preparation & Serving | 0 (0.0%) | 0 (0.0%) |
| Cleaning & Maintenance | 10 (83.3%) | 2 (16.7%) |
| Personal Care & Service | 0 (0.0%) | 10 (100.0%) |
| Total (Category) | 10 (41.7%) | 14 (58.3%) |
| Total (Overall) | 49 (45.8%) | 58 (54.2%) |
Sales and Office Occupations
The most common Sales and Office occupations in West Rushville are Sales & Related (26 | 24.3%), and Office & Administration (6 | 5.6%).

Sales and Office Occupations by Sex

| Occupation | Male | Female |
| Sales & Related | 5 (19.2%) | 21 (80.8%) |
| Office & Administration | 1 (16.7%) | 5 (83.3%) |
| Total (Category) | 6 (18.8%) | 26 (81.2%) |
| Total (Overall) | 49 (45.8%) | 58 (54.2%) |
Natural Resources, Construction and Maintenance Occupations
The most common Natural Resources, Construction and Maintenance occupations in West Rushville are Installation, Maintenance & Repair (8 | 7.5%), and Construction & Extraction (4 | 3.7%).
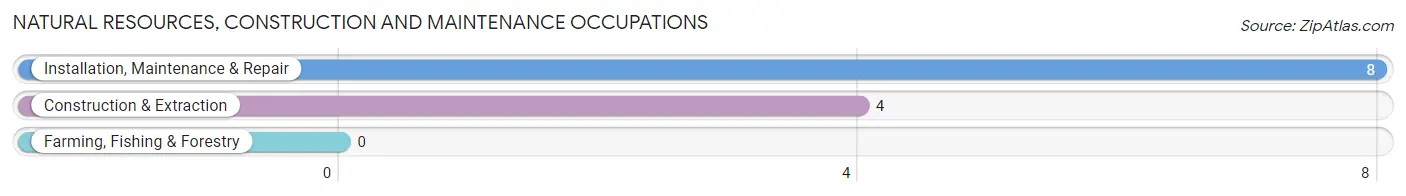
Natural Resources, Construction and Maintenance Occupations by Sex
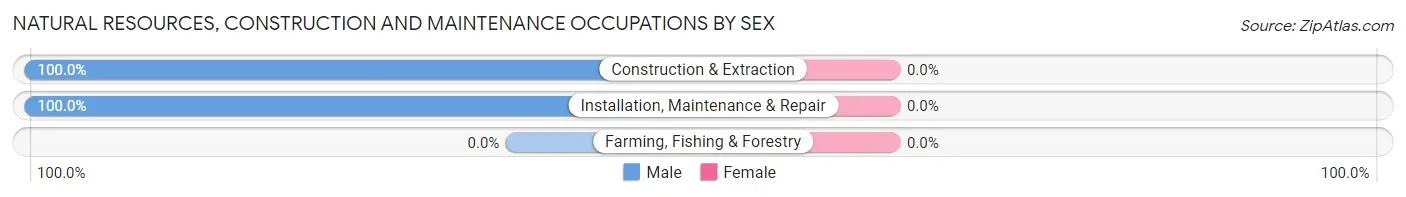
| Occupation | Male | Female |
| Farming, Fishing & Forestry | 0 (0.0%) | 0 (0.0%) |
| Construction & Extraction | 4 (100.0%) | 0 (0.0%) |
| Installation, Maintenance & Repair | 8 (100.0%) | 0 (0.0%) |
| Total (Category) | 12 (100.0%) | 0 (0.0%) |
| Total (Overall) | 49 (45.8%) | 58 (54.2%) |
Production, Transportation and Moving Occupations
The most common Production, Transportation and Moving occupations in West Rushville are Material Moving (6 | 5.6%), and Transportation (5 | 4.7%).
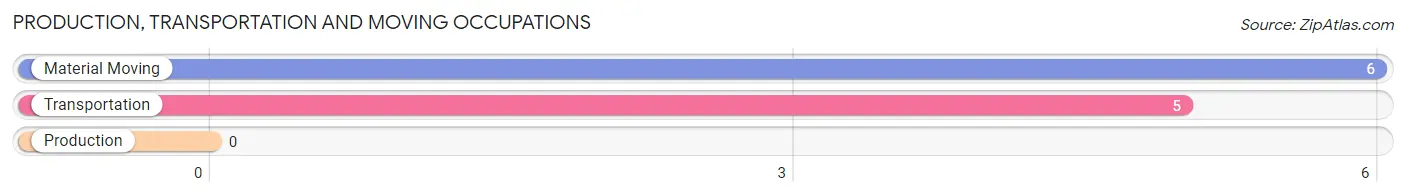
Production, Transportation and Moving Occupations by Sex
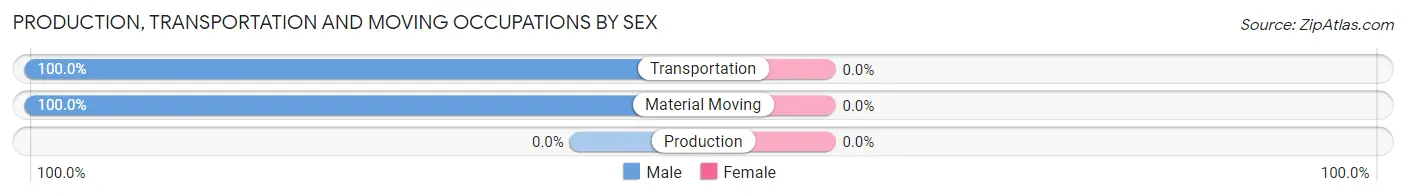
| Occupation | Male | Female |
| Production | 0 (0.0%) | 0 (0.0%) |
| Transportation | 5 (100.0%) | 0 (0.0%) |
| Material Moving | 6 (100.0%) | 0 (0.0%) |
| Total (Category) | 11 (100.0%) | 0 (0.0%) |
| Total (Overall) | 49 (45.8%) | 58 (54.2%) |
Employment Industries by Sex in West Rushville
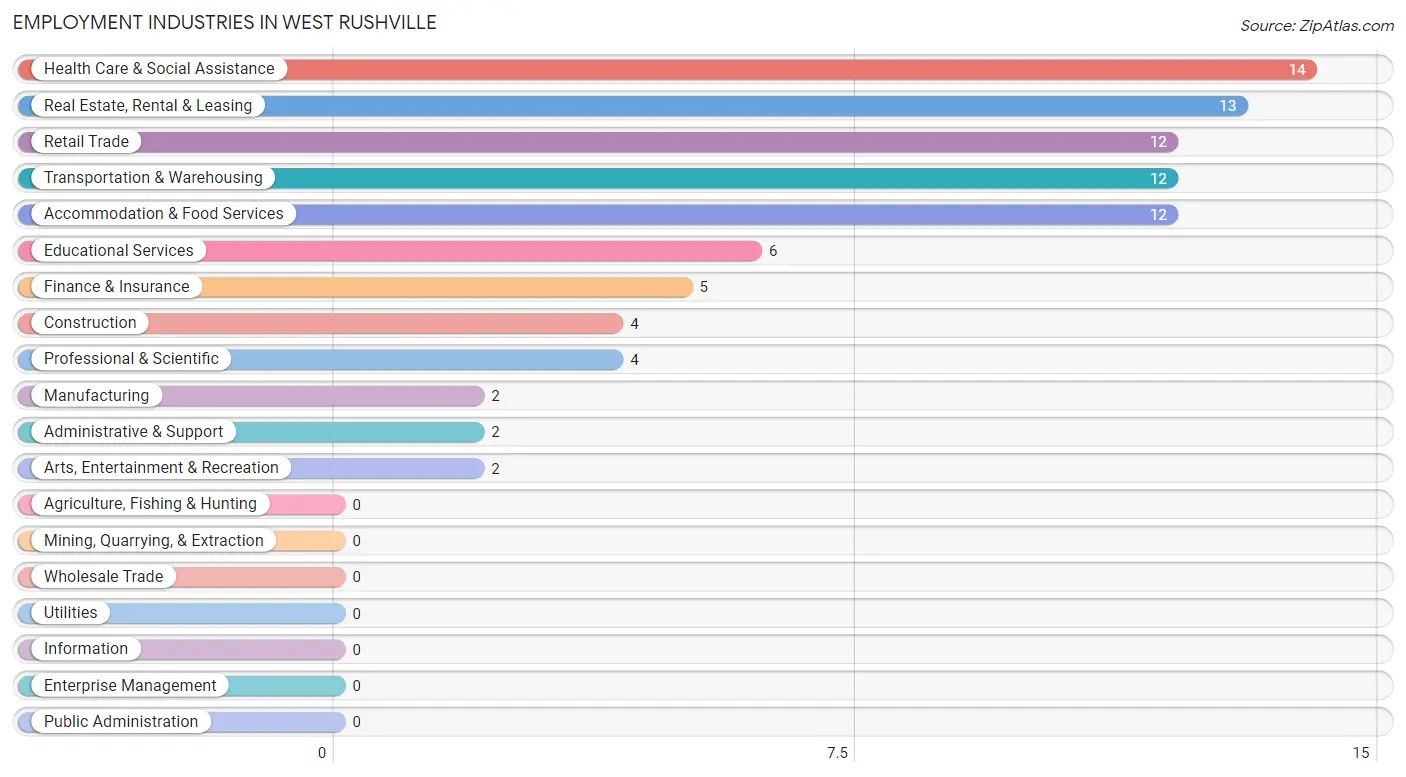
Employment Industries in West Rushville
The major employment industries in West Rushville include Health Care & Social Assistance (14 | 13.1%), Real Estate, Rental & Leasing (13 | 12.1%), Retail Trade (12 | 11.2%), Transportation & Warehousing (12 | 11.2%), and Accommodation & Food Services (12 | 11.2%).
Employment Industries by Sex in West Rushville
The West Rushville industries that see more men than women are Construction (100.0%), Manufacturing (100.0%), and Transportation & Warehousing (100.0%), whereas the industries that tend to have a higher number of women are Professional & Scientific (100.0%), Educational Services (100.0%), and Health Care & Social Assistance (100.0%).
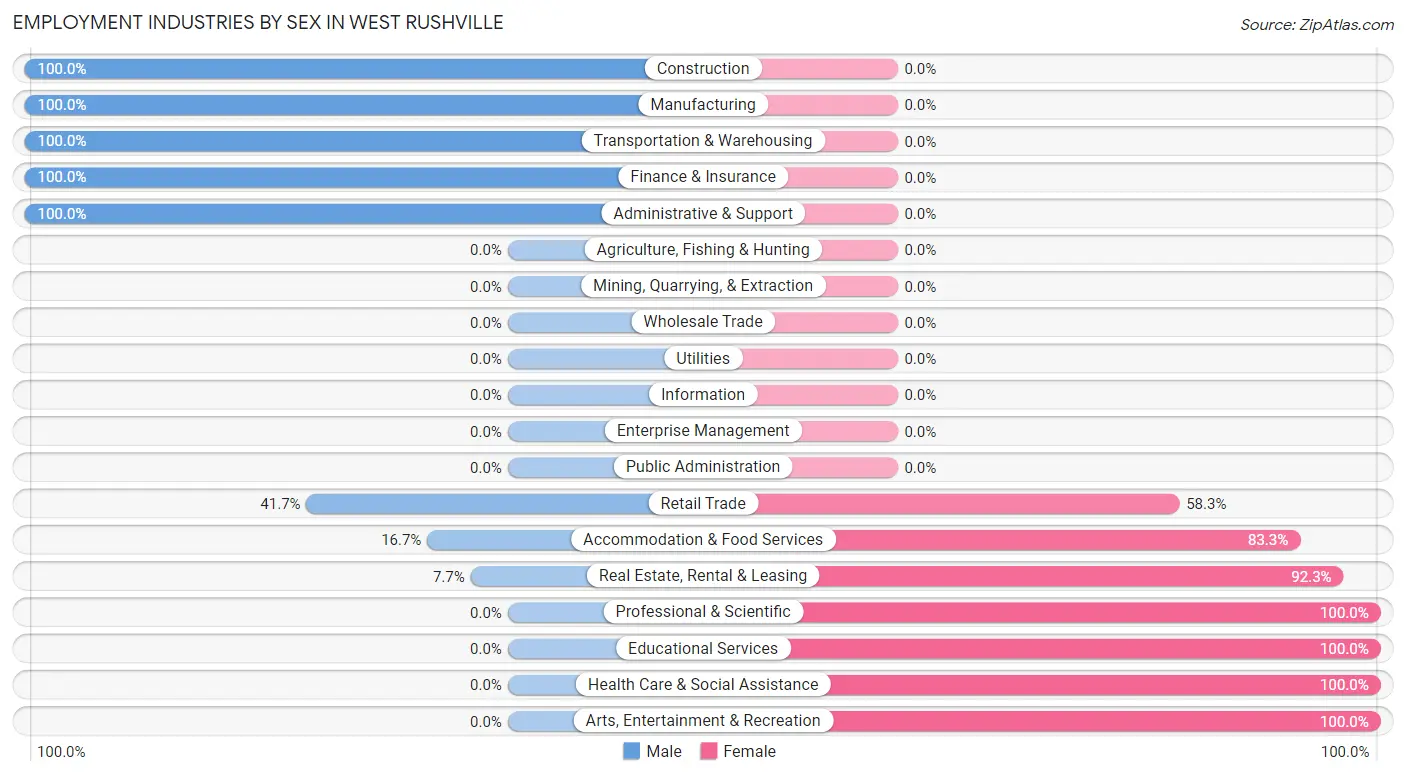
| Industry | Male | Female |
| Agriculture, Fishing & Hunting | 0 (0.0%) | 0 (0.0%) |
| Mining, Quarrying, & Extraction | 0 (0.0%) | 0 (0.0%) |
| Construction | 4 (100.0%) | 0 (0.0%) |
| Manufacturing | 2 (100.0%) | 0 (0.0%) |
| Wholesale Trade | 0 (0.0%) | 0 (0.0%) |
| Retail Trade | 5 (41.7%) | 7 (58.3%) |
| Transportation & Warehousing | 12 (100.0%) | 0 (0.0%) |
| Utilities | 0 (0.0%) | 0 (0.0%) |
| Information | 0 (0.0%) | 0 (0.0%) |
| Finance & Insurance | 5 (100.0%) | 0 (0.0%) |
| Real Estate, Rental & Leasing | 1 (7.7%) | 12 (92.3%) |
| Professional & Scientific | 0 (0.0%) | 4 (100.0%) |
| Enterprise Management | 0 (0.0%) | 0 (0.0%) |
| Administrative & Support | 2 (100.0%) | 0 (0.0%) |
| Educational Services | 0 (0.0%) | 6 (100.0%) |
| Health Care & Social Assistance | 0 (0.0%) | 14 (100.0%) |
| Arts, Entertainment & Recreation | 0 (0.0%) | 2 (100.0%) |
| Accommodation & Food Services | 2 (16.7%) | 10 (83.3%) |
| Public Administration | 0 (0.0%) | 0 (0.0%) |
| Total | 49 (45.8%) | 58 (54.2%) |
Education in West Rushville
School Enrollment in West Rushville
The most common levels of schooling among the 91 students in West Rushville are elementary school (28 | 30.8%), middle school (25 | 27.5%), and college / undergraduate (20 | 22.0%).
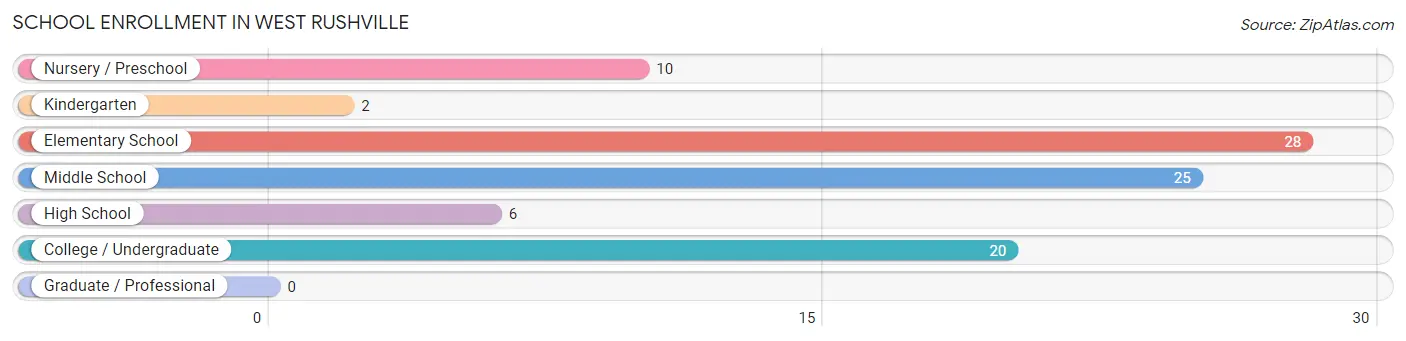
| School Level | # Students | % Students |
| Nursery / Preschool | 10 | 11.0% |
| Kindergarten | 2 | 2.2% |
| Elementary School | 28 | 30.8% |
| Middle School | 25 | 27.5% |
| High School | 6 | 6.6% |
| College / Undergraduate | 20 | 22.0% |
| Graduate / Professional | 0 | 0.0% |
| Total | 91 | 100.0% |
School Enrollment by Age by Funding Source in West Rushville
Out of a total of 91 students who are enrolled in schools in West Rushville, 8 (8.8%) attend a private institution, while the remaining 83 (91.2%) are enrolled in public schools. The age group of 20 to 24 year olds has the highest likelihood of being enrolled in private schools, with 1 (100.0% in the age bracket) enrolled. Conversely, the age group of 10 to 14 year olds has the lowest likelihood of being enrolled in a private school, with 29 (100.0% in the age bracket) attending a public institution.
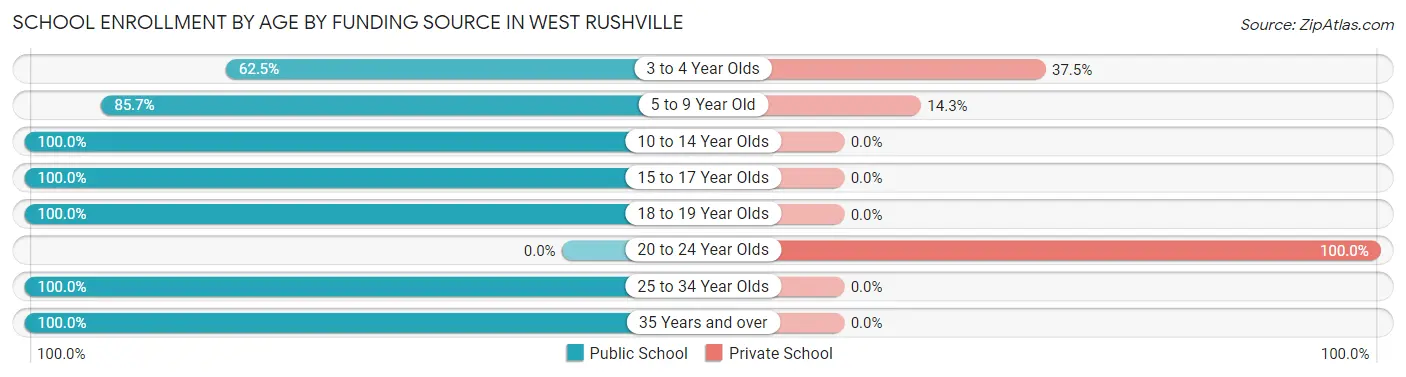
| Age Bracket | Public School | Private School |
| 3 to 4 Year Olds | 5 (62.5%) | 3 (37.5%) |
| 5 to 9 Year Old | 24 (85.7%) | 4 (14.3%) |
| 10 to 14 Year Olds | 29 (100.0%) | 0 (0.0%) |
| 15 to 17 Year Olds | 6 (100.0%) | 0 (0.0%) |
| 18 to 19 Year Olds | 3 (100.0%) | 0 (0.0%) |
| 20 to 24 Year Olds | 0 (0.0%) | 1 (100.0%) |
| 25 to 34 Year Olds | 10 (100.0%) | 0 (0.0%) |
| 35 Years and over | 6 (100.0%) | 0 (0.0%) |
| Total | 83 (91.2%) | 8 (8.8%) |
Educational Attainment by Field of Study in West Rushville
Business (12 | 27.3%), education (10 | 22.7%), liberal arts & history (7 | 15.9%), bio, nature & agricultural (6 | 13.6%), and physical & health sciences (6 | 13.6%) are the most common fields of study among 44 individuals in West Rushville who have obtained a bachelor's degree or higher.
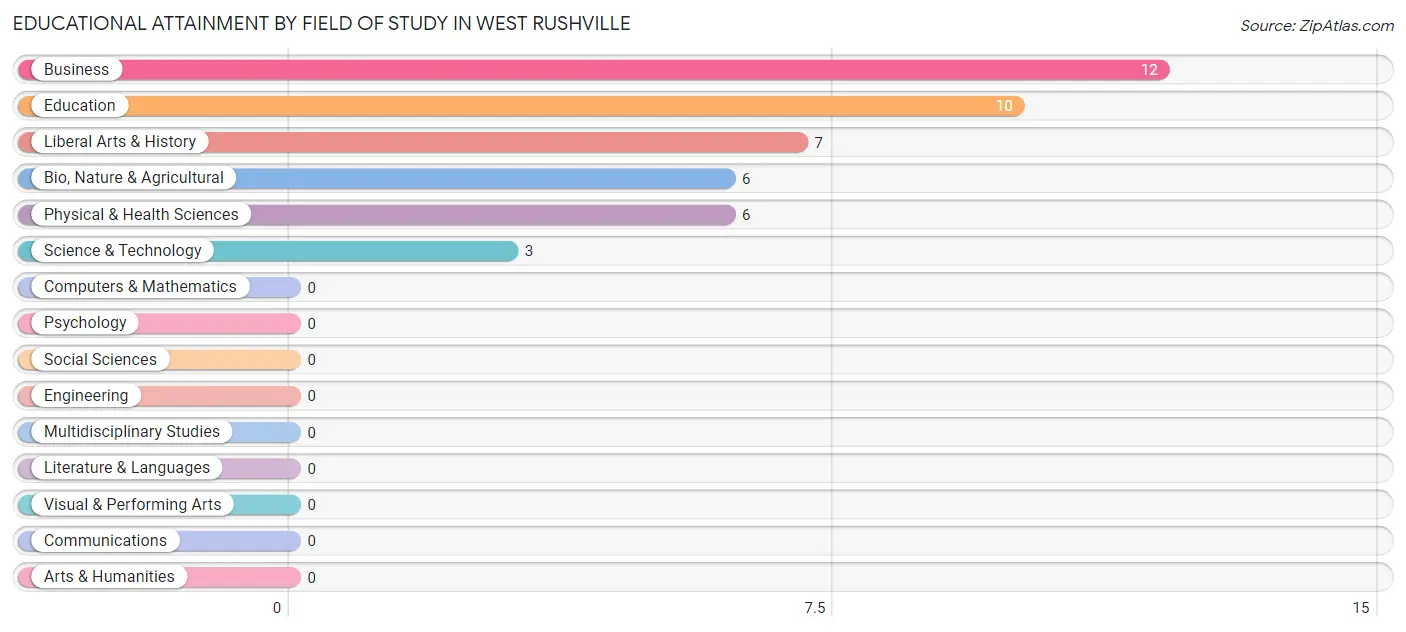
| Field of Study | # Graduates | % Graduates |
| Computers & Mathematics | 0 | 0.0% |
| Bio, Nature & Agricultural | 6 | 13.6% |
| Physical & Health Sciences | 6 | 13.6% |
| Psychology | 0 | 0.0% |
| Social Sciences | 0 | 0.0% |
| Engineering | 0 | 0.0% |
| Multidisciplinary Studies | 0 | 0.0% |
| Science & Technology | 3 | 6.8% |
| Business | 12 | 27.3% |
| Education | 10 | 22.7% |
| Literature & Languages | 0 | 0.0% |
| Liberal Arts & History | 7 | 15.9% |
| Visual & Performing Arts | 0 | 0.0% |
| Communications | 0 | 0.0% |
| Arts & Humanities | 0 | 0.0% |
| Total | 44 | 100.0% |
Transportation & Commute in West Rushville
Vehicle Availability by Sex in West Rushville
The most prevalent vehicle ownership categories in West Rushville are males with 2 vehicles (19, accounting for 38.8%) and females with 2 vehicles (17, making up 32.8%).
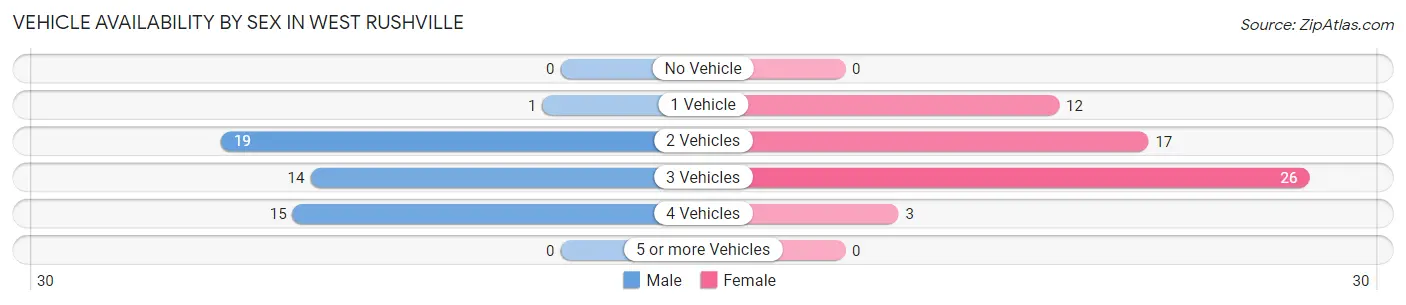
| Vehicles Available | Male | Female |
| No Vehicle | 0 (0.0%) | 0 (0.0%) |
| 1 Vehicle | 1 (2.0%) | 12 (20.7%) |
| 2 Vehicles | 19 (38.8%) | 17 (29.3%) |
| 3 Vehicles | 14 (28.6%) | 26 (44.8%) |
| 4 Vehicles | 15 (30.6%) | 3 (5.2%) |
| 5 or more Vehicles | 0 (0.0%) | 0 (0.0%) |
| Total | 49 (100.0%) | 58 (100.0%) |
Commute Time in West Rushville
The most frequently occuring commute durations in West Rushville are 45 to 59 minutes (28 commuters, 26.7%), 15 to 19 minutes (16 commuters, 15.2%), and 10 to 14 minutes (15 commuters, 14.3%).
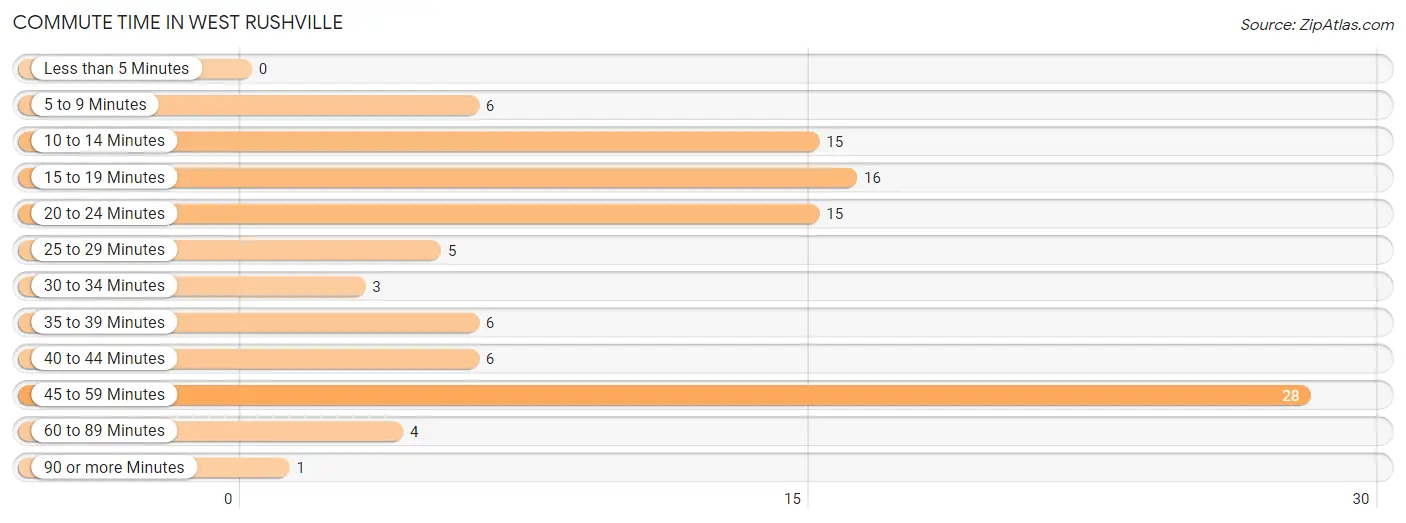
| Commute Time | # Commuters | % Commuters |
| Less than 5 Minutes | 0 | 0.0% |
| 5 to 9 Minutes | 6 | 5.7% |
| 10 to 14 Minutes | 15 | 14.3% |
| 15 to 19 Minutes | 16 | 15.2% |
| 20 to 24 Minutes | 15 | 14.3% |
| 25 to 29 Minutes | 5 | 4.8% |
| 30 to 34 Minutes | 3 | 2.9% |
| 35 to 39 Minutes | 6 | 5.7% |
| 40 to 44 Minutes | 6 | 5.7% |
| 45 to 59 Minutes | 28 | 26.7% |
| 60 to 89 Minutes | 4 | 3.8% |
| 90 or more Minutes | 1 | 0.9% |
Commute Time by Sex in West Rushville
The most common commute times in West Rushville are 45 to 59 minutes (16 commuters, 32.7%) for males and 10 to 14 minutes (12 commuters, 21.4%) for females.
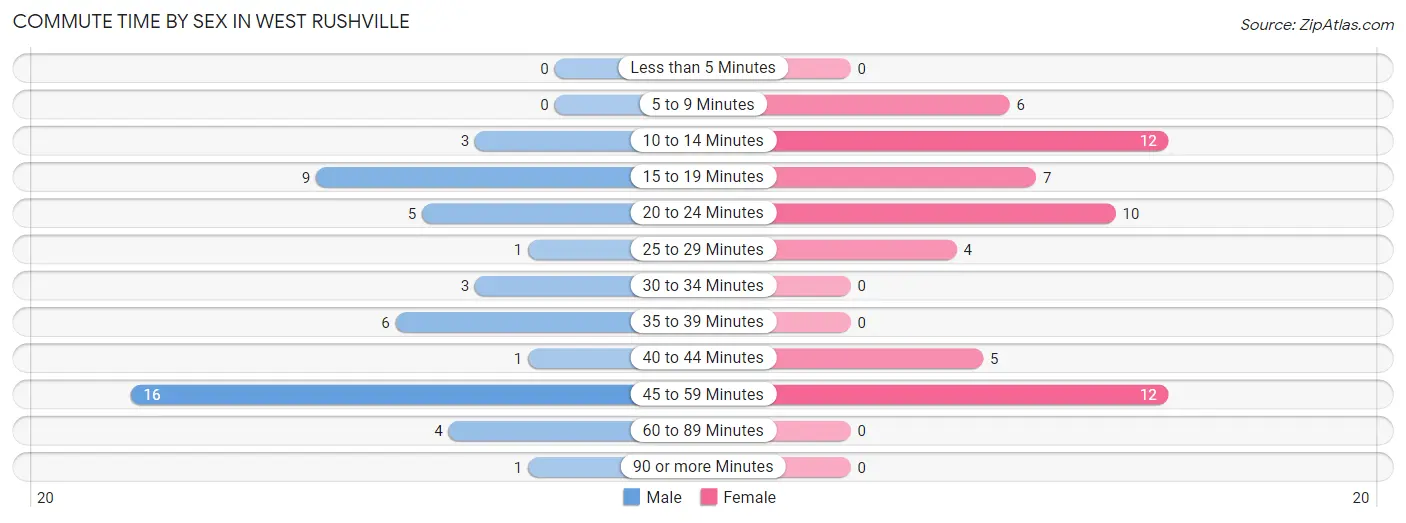
| Commute Time | Male | Female |
| Less than 5 Minutes | 0 (0.0%) | 0 (0.0%) |
| 5 to 9 Minutes | 0 (0.0%) | 6 (10.7%) |
| 10 to 14 Minutes | 3 (6.1%) | 12 (21.4%) |
| 15 to 19 Minutes | 9 (18.4%) | 7 (12.5%) |
| 20 to 24 Minutes | 5 (10.2%) | 10 (17.9%) |
| 25 to 29 Minutes | 1 (2.0%) | 4 (7.1%) |
| 30 to 34 Minutes | 3 (6.1%) | 0 (0.0%) |
| 35 to 39 Minutes | 6 (12.2%) | 0 (0.0%) |
| 40 to 44 Minutes | 1 (2.0%) | 5 (8.9%) |
| 45 to 59 Minutes | 16 (32.7%) | 12 (21.4%) |
| 60 to 89 Minutes | 4 (8.2%) | 0 (0.0%) |
| 90 or more Minutes | 1 (2.0%) | 0 (0.0%) |
Time of Departure to Work by Sex in West Rushville
The most frequent times of departure to work in West Rushville are 12:00 AM to 4:59 AM (11, 22.5%) for males and 6:00 AM to 6:29 AM (12, 21.4%) for females.
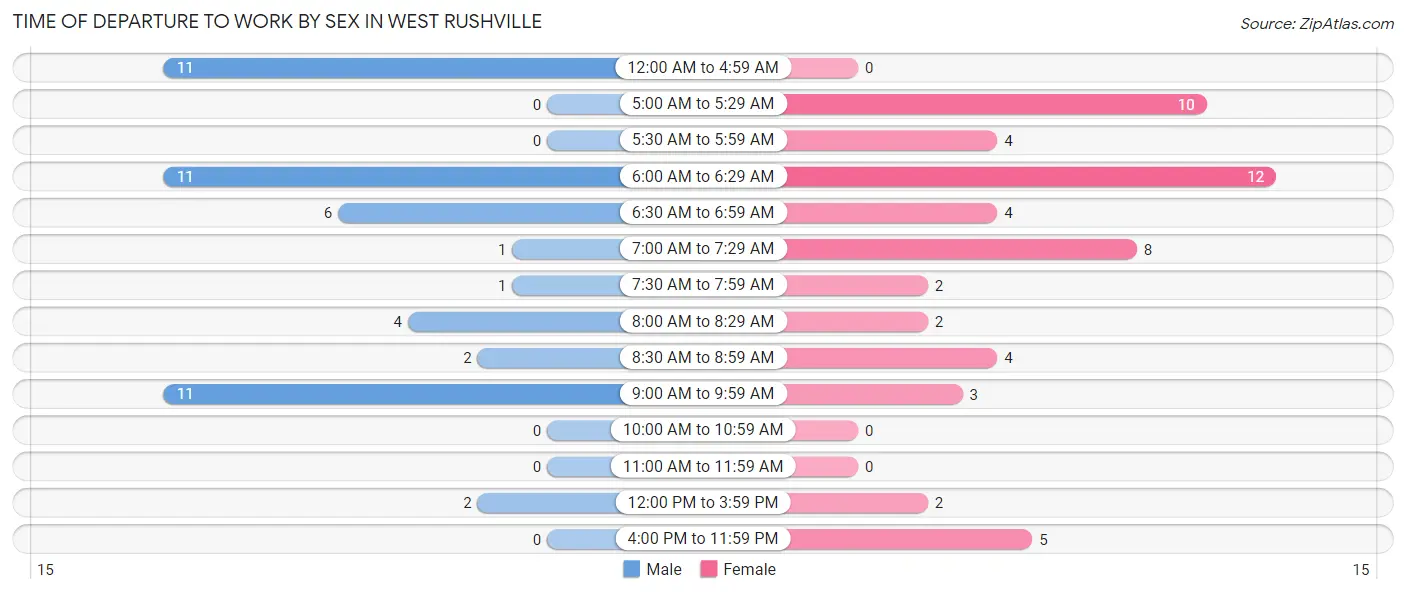
| Time of Departure | Male | Female |
| 12:00 AM to 4:59 AM | 11 (22.5%) | 0 (0.0%) |
| 5:00 AM to 5:29 AM | 0 (0.0%) | 10 (17.9%) |
| 5:30 AM to 5:59 AM | 0 (0.0%) | 4 (7.1%) |
| 6:00 AM to 6:29 AM | 11 (22.5%) | 12 (21.4%) |
| 6:30 AM to 6:59 AM | 6 (12.2%) | 4 (7.1%) |
| 7:00 AM to 7:29 AM | 1 (2.0%) | 8 (14.3%) |
| 7:30 AM to 7:59 AM | 1 (2.0%) | 2 (3.6%) |
| 8:00 AM to 8:29 AM | 4 (8.2%) | 2 (3.6%) |
| 8:30 AM to 8:59 AM | 2 (4.1%) | 4 (7.1%) |
| 9:00 AM to 9:59 AM | 11 (22.5%) | 3 (5.4%) |
| 10:00 AM to 10:59 AM | 0 (0.0%) | 0 (0.0%) |
| 11:00 AM to 11:59 AM | 0 (0.0%) | 0 (0.0%) |
| 12:00 PM to 3:59 PM | 2 (4.1%) | 2 (3.6%) |
| 4:00 PM to 11:59 PM | 0 (0.0%) | 5 (8.9%) |
| Total | 49 (100.0%) | 56 (100.0%) |
Housing Occupancy in West Rushville
Occupancy by Ownership in West Rushville
Of the total 72 dwellings in West Rushville, owner-occupied units account for 46 (63.9%), while renter-occupied units make up 26 (36.1%).
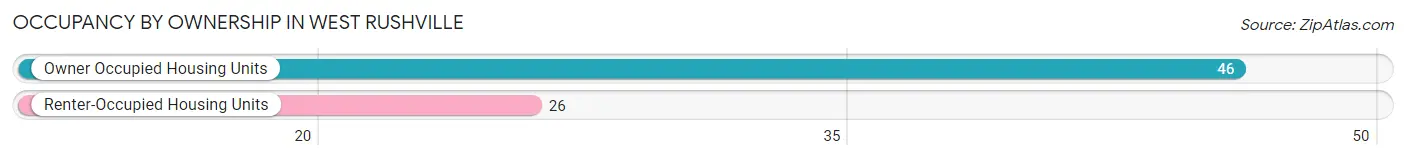
| Occupancy | # Housing Units | % Housing Units |
| Owner Occupied Housing Units | 46 | 63.9% |
| Renter-Occupied Housing Units | 26 | 36.1% |
| Total Occupied Housing Units | 72 | 100.0% |
Occupancy by Household Size in West Rushville
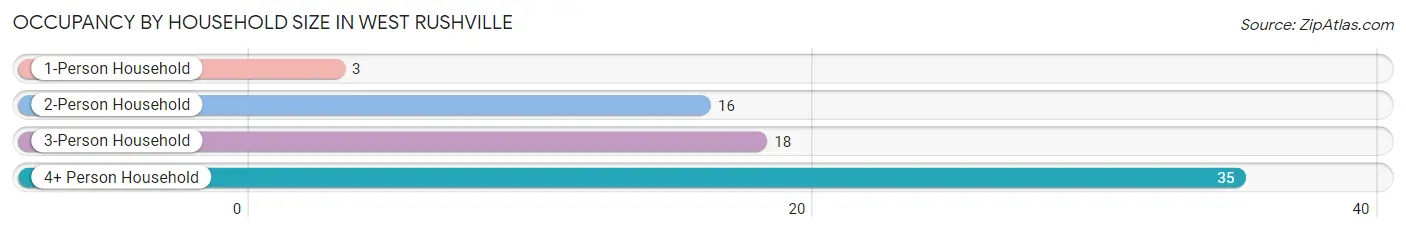
| Household Size | # Housing Units | % Housing Units |
| 1-Person Household | 3 | 4.2% |
| 2-Person Household | 16 | 22.2% |
| 3-Person Household | 18 | 25.0% |
| 4+ Person Household | 35 | 48.6% |
| Total Housing Units | 72 | 100.0% |
Occupancy by Ownership by Household Size in West Rushville
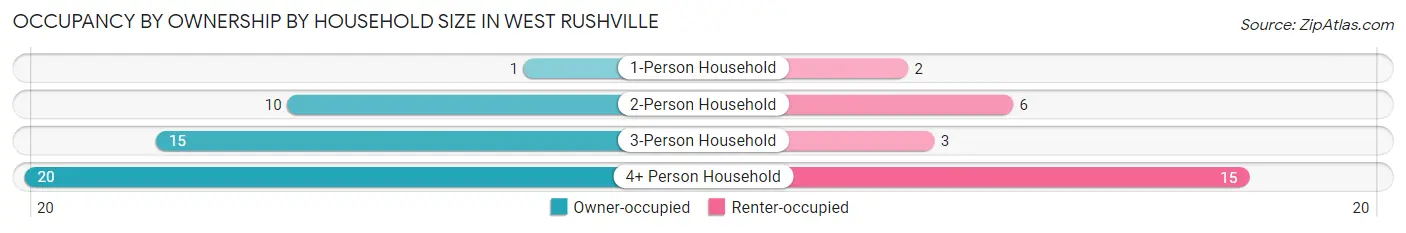
| Household Size | Owner-occupied | Renter-occupied |
| 1-Person Household | 1 (33.3%) | 2 (66.7%) |
| 2-Person Household | 10 (62.5%) | 6 (37.5%) |
| 3-Person Household | 15 (83.3%) | 3 (16.7%) |
| 4+ Person Household | 20 (57.1%) | 15 (42.9%) |
| Total Housing Units | 46 (63.9%) | 26 (36.1%) |
Occupancy by Educational Attainment in West Rushville
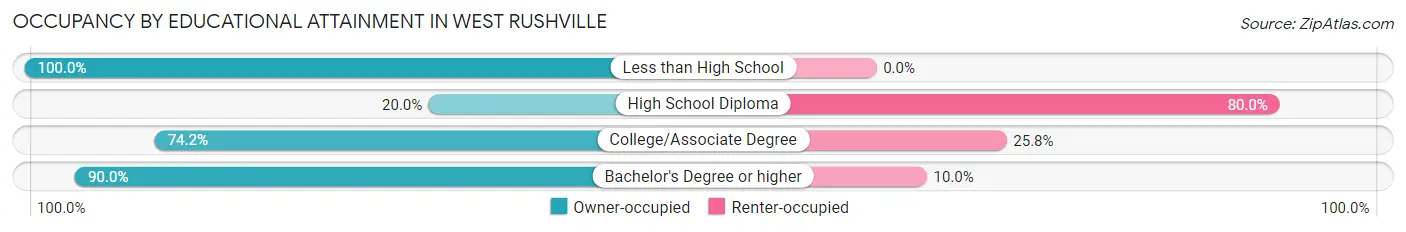
| Household Size | Owner-occupied | Renter-occupied |
| Less than High School | 1 (100.0%) | 0 (0.0%) |
| High School Diploma | 4 (20.0%) | 16 (80.0%) |
| College/Associate Degree | 23 (74.2%) | 8 (25.8%) |
| Bachelor's Degree or higher | 18 (90.0%) | 2 (10.0%) |
Occupancy by Age of Householder in West Rushville
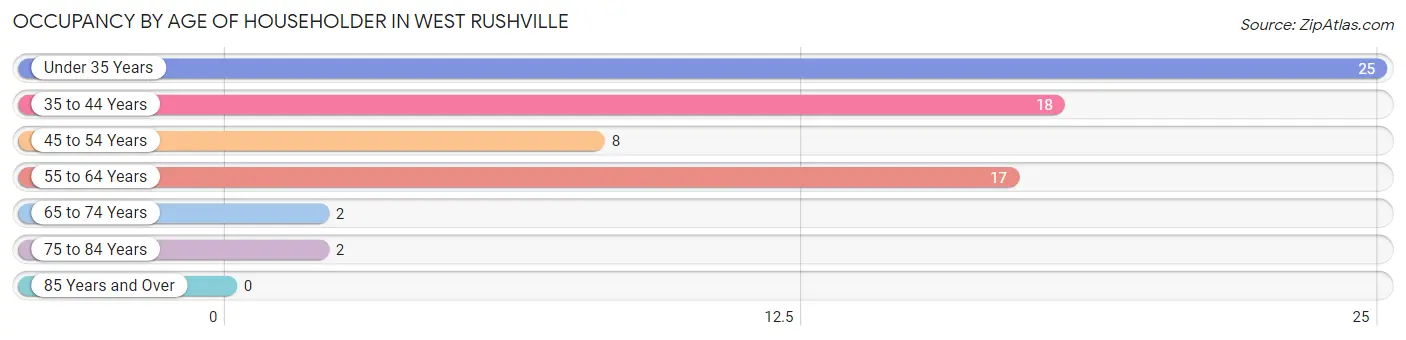
| Age Bracket | # Households | % Households |
| Under 35 Years | 25 | 34.7% |
| 35 to 44 Years | 18 | 25.0% |
| 45 to 54 Years | 8 | 11.1% |
| 55 to 64 Years | 17 | 23.6% |
| 65 to 74 Years | 2 | 2.8% |
| 75 to 84 Years | 2 | 2.8% |
| 85 Years and Over | 0 | 0.0% |
| Total | 72 | 100.0% |
Housing Finances in West Rushville
Median Income by Occupancy in West Rushville
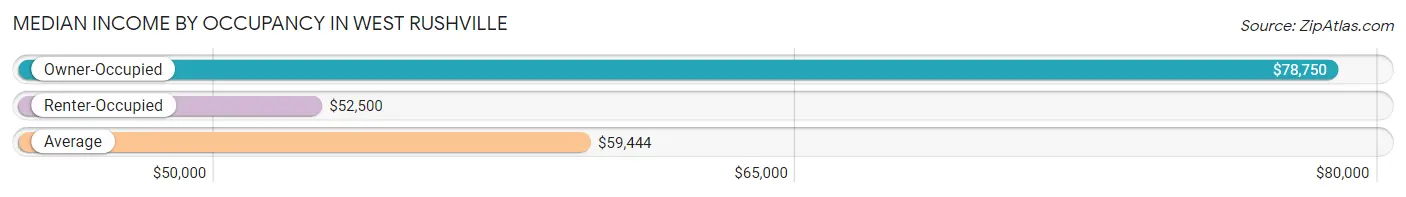
| Occupancy Type | # Households | Median Income |
| Owner-Occupied | 46 (63.9%) | $78,750 |
| Renter-Occupied | 26 (36.1%) | $52,500 |
| Average | 72 (100.0%) | $59,444 |
Occupancy by Householder Income Bracket in West Rushville
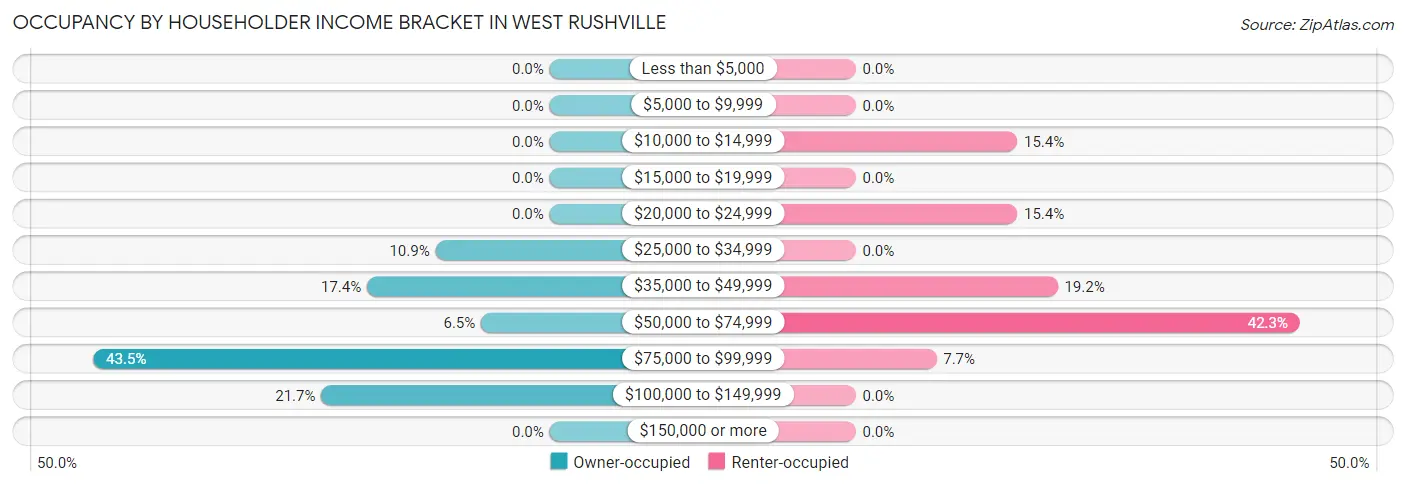
| Income Bracket | Owner-occupied | Renter-occupied |
| Less than $5,000 | 0 (0.0%) | 0 (0.0%) |
| $5,000 to $9,999 | 0 (0.0%) | 0 (0.0%) |
| $10,000 to $14,999 | 0 (0.0%) | 4 (15.4%) |
| $15,000 to $19,999 | 0 (0.0%) | 0 (0.0%) |
| $20,000 to $24,999 | 0 (0.0%) | 4 (15.4%) |
| $25,000 to $34,999 | 5 (10.9%) | 0 (0.0%) |
| $35,000 to $49,999 | 8 (17.4%) | 5 (19.2%) |
| $50,000 to $74,999 | 3 (6.5%) | 11 (42.3%) |
| $75,000 to $99,999 | 20 (43.5%) | 2 (7.7%) |
| $100,000 to $149,999 | 10 (21.7%) | 0 (0.0%) |
| $150,000 or more | 0 (0.0%) | 0 (0.0%) |
| Total | 46 (100.0%) | 26 (100.0%) |
Monthly Housing Cost Tiers in West Rushville
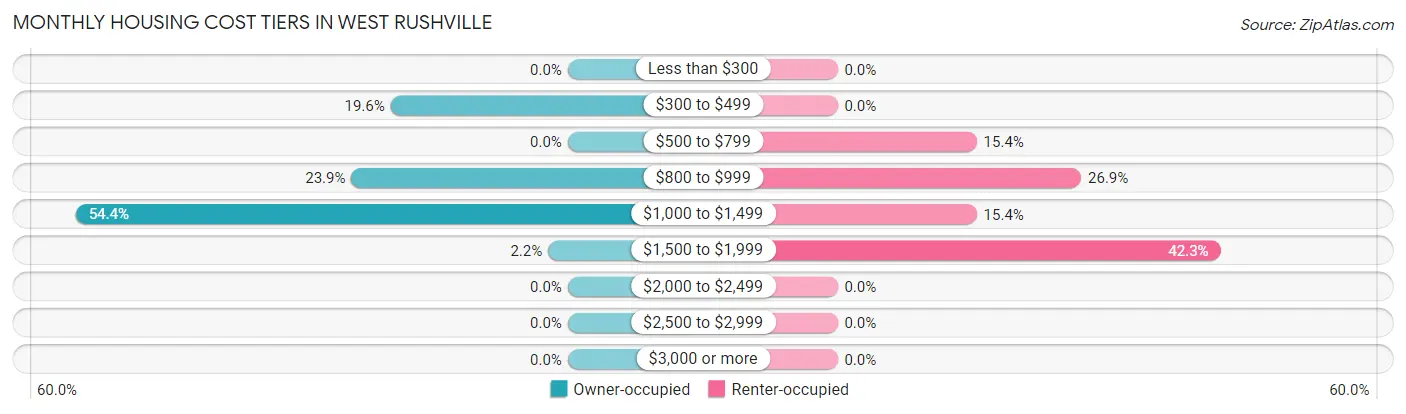
| Monthly Cost | Owner-occupied | Renter-occupied |
| Less than $300 | 0 (0.0%) | 0 (0.0%) |
| $300 to $499 | 9 (19.6%) | 0 (0.0%) |
| $500 to $799 | 0 (0.0%) | 4 (15.4%) |
| $800 to $999 | 11 (23.9%) | 7 (26.9%) |
| $1,000 to $1,499 | 25 (54.3%) | 4 (15.4%) |
| $1,500 to $1,999 | 1 (2.2%) | 11 (42.3%) |
| $2,000 to $2,499 | 0 (0.0%) | 0 (0.0%) |
| $2,500 to $2,999 | 0 (0.0%) | 0 (0.0%) |
| $3,000 or more | 0 (0.0%) | 0 (0.0%) |
| Total | 46 (100.0%) | 26 (100.0%) |
Physical Housing Characteristics in West Rushville
Housing Structures in West Rushville
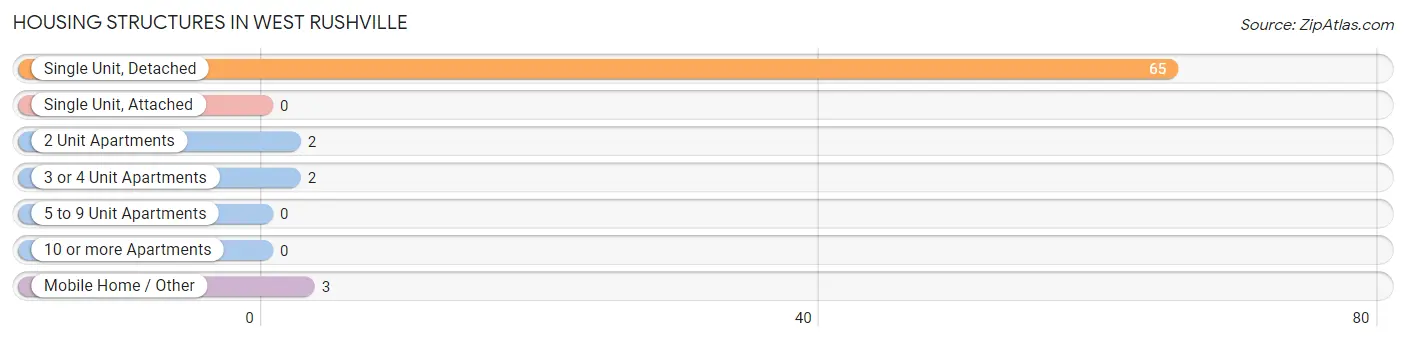
| Structure Type | # Housing Units | % Housing Units |
| Single Unit, Detached | 65 | 90.3% |
| Single Unit, Attached | 0 | 0.0% |
| 2 Unit Apartments | 2 | 2.8% |
| 3 or 4 Unit Apartments | 2 | 2.8% |
| 5 to 9 Unit Apartments | 0 | 0.0% |
| 10 or more Apartments | 0 | 0.0% |
| Mobile Home / Other | 3 | 4.2% |
| Total | 72 | 100.0% |
Housing Structures by Occupancy in West Rushville
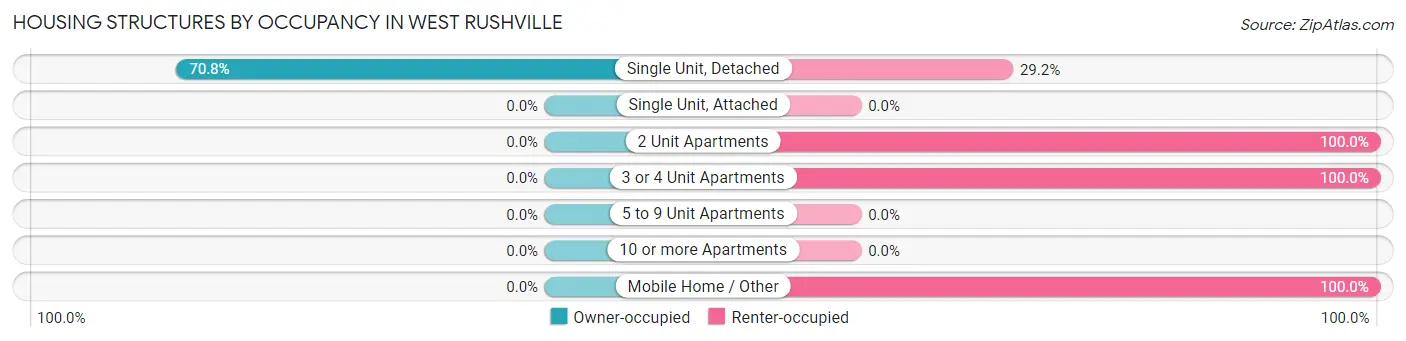
| Structure Type | Owner-occupied | Renter-occupied |
| Single Unit, Detached | 46 (70.8%) | 19 (29.2%) |
| Single Unit, Attached | 0 (0.0%) | 0 (0.0%) |
| 2 Unit Apartments | 0 (0.0%) | 2 (100.0%) |
| 3 or 4 Unit Apartments | 0 (0.0%) | 2 (100.0%) |
| 5 to 9 Unit Apartments | 0 (0.0%) | 0 (0.0%) |
| 10 or more Apartments | 0 (0.0%) | 0 (0.0%) |
| Mobile Home / Other | 0 (0.0%) | 3 (100.0%) |
| Total | 46 (63.9%) | 26 (36.1%) |
Housing Structures by Number of Rooms in West Rushville
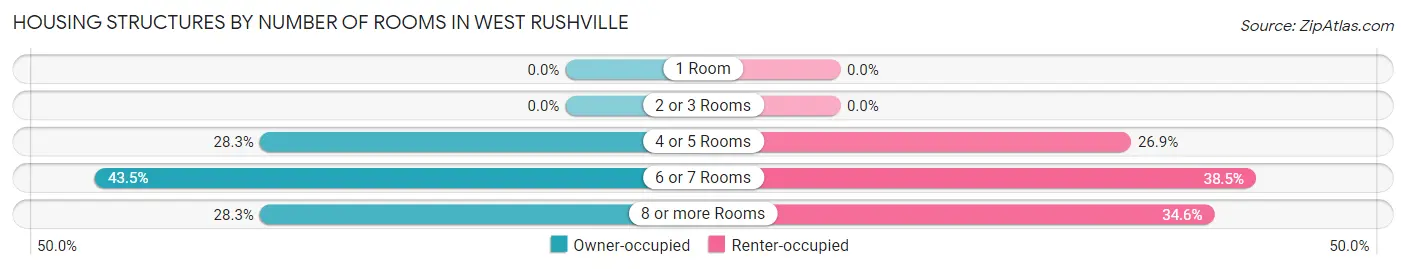
| Number of Rooms | Owner-occupied | Renter-occupied |
| 1 Room | 0 (0.0%) | 0 (0.0%) |
| 2 or 3 Rooms | 0 (0.0%) | 0 (0.0%) |
| 4 or 5 Rooms | 13 (28.3%) | 7 (26.9%) |
| 6 or 7 Rooms | 20 (43.5%) | 10 (38.5%) |
| 8 or more Rooms | 13 (28.3%) | 9 (34.6%) |
| Total | 46 (100.0%) | 26 (100.0%) |
Housing Structure by Heating Type in West Rushville
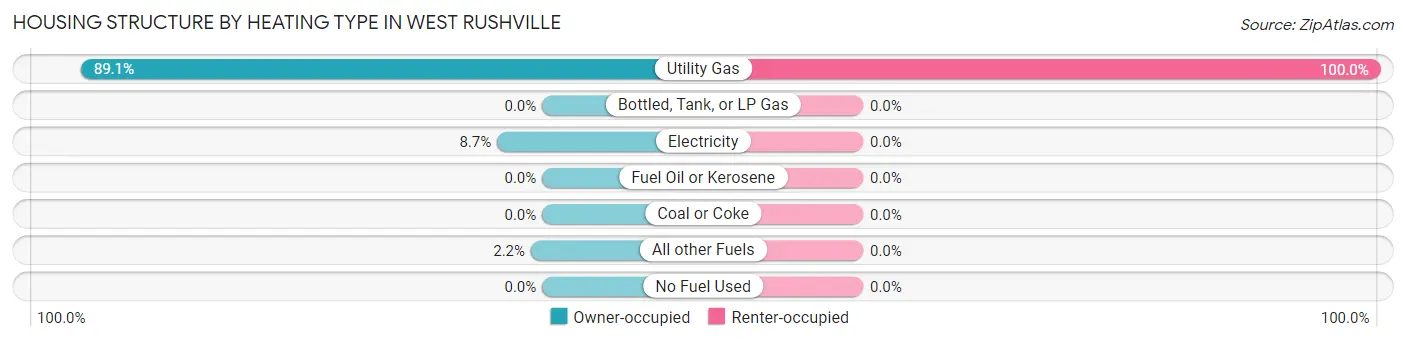
| Heating Type | Owner-occupied | Renter-occupied |
| Utility Gas | 41 (89.1%) | 26 (100.0%) |
| Bottled, Tank, or LP Gas | 0 (0.0%) | 0 (0.0%) |
| Electricity | 4 (8.7%) | 0 (0.0%) |
| Fuel Oil or Kerosene | 0 (0.0%) | 0 (0.0%) |
| Coal or Coke | 0 (0.0%) | 0 (0.0%) |
| All other Fuels | 1 (2.2%) | 0 (0.0%) |
| No Fuel Used | 0 (0.0%) | 0 (0.0%) |
| Total | 46 (100.0%) | 26 (100.0%) |
Household Vehicle Usage in West Rushville
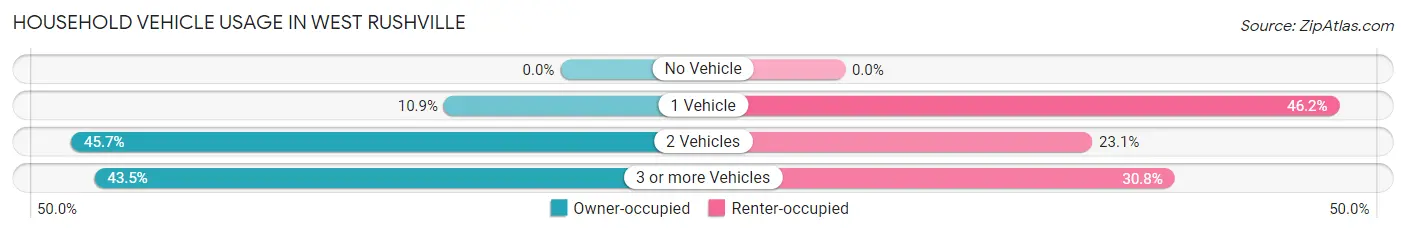
| Vehicles per Household | Owner-occupied | Renter-occupied |
| No Vehicle | 0 (0.0%) | 0 (0.0%) |
| 1 Vehicle | 5 (10.9%) | 12 (46.2%) |
| 2 Vehicles | 21 (45.7%) | 6 (23.1%) |
| 3 or more Vehicles | 20 (43.5%) | 8 (30.8%) |
| Total | 46 (100.0%) | 26 (100.0%) |
Real Estate & Mortgages in West Rushville
Real Estate and Mortgage Overview in West Rushville
| Characteristic | Without Mortgage | With Mortgage |
| Housing Units | 10 | 36 |
| Median Property Value | $179,200 | $175,000 |
| Median Household Income | $46,250 | $0 |
| Monthly Housing Costs | $456 | $0 |
| Real Estate Taxes | $1,357 | $3 |
Property Value by Mortgage Status in West Rushville
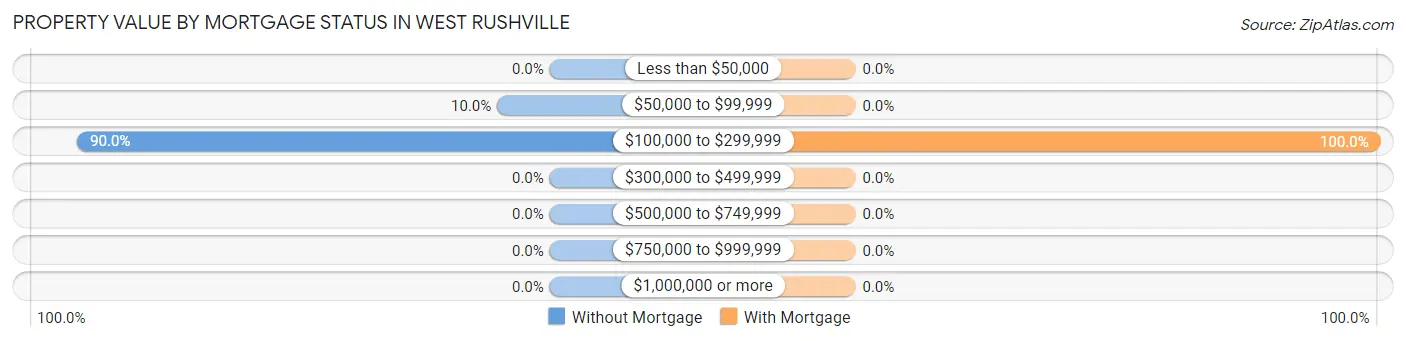
| Property Value | Without Mortgage | With Mortgage |
| Less than $50,000 | 0 (0.0%) | 0 (0.0%) |
| $50,000 to $99,999 | 1 (10.0%) | 0 (0.0%) |
| $100,000 to $299,999 | 9 (90.0%) | 36 (100.0%) |
| $300,000 to $499,999 | 0 (0.0%) | 0 (0.0%) |
| $500,000 to $749,999 | 0 (0.0%) | 0 (0.0%) |
| $750,000 to $999,999 | 0 (0.0%) | 0 (0.0%) |
| $1,000,000 or more | 0 (0.0%) | 0 (0.0%) |
| Total | 10 (100.0%) | 36 (100.0%) |
Household Income by Mortgage Status in West Rushville
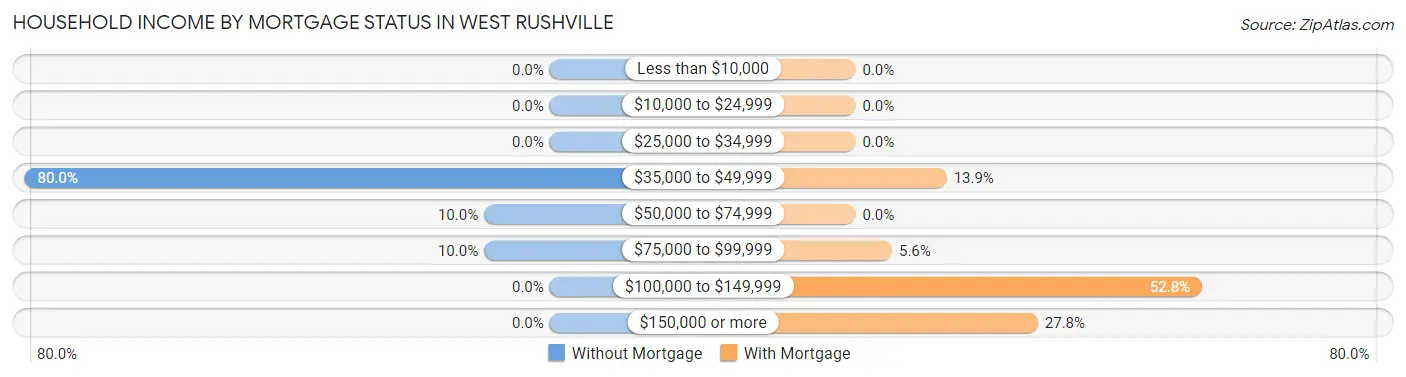
| Household Income | Without Mortgage | With Mortgage |
| Less than $10,000 | 0 (0.0%) | 0 (0.0%) |
| $10,000 to $24,999 | 0 (0.0%) | 0 (0.0%) |
| $25,000 to $34,999 | 0 (0.0%) | 0 (0.0%) |
| $35,000 to $49,999 | 8 (80.0%) | 5 (13.9%) |
| $50,000 to $74,999 | 1 (10.0%) | 0 (0.0%) |
| $75,000 to $99,999 | 1 (10.0%) | 2 (5.6%) |
| $100,000 to $149,999 | 0 (0.0%) | 19 (52.8%) |
| $150,000 or more | 0 (0.0%) | 10 (27.8%) |
| Total | 10 (100.0%) | 36 (100.0%) |
Property Value to Household Income Ratio in West Rushville
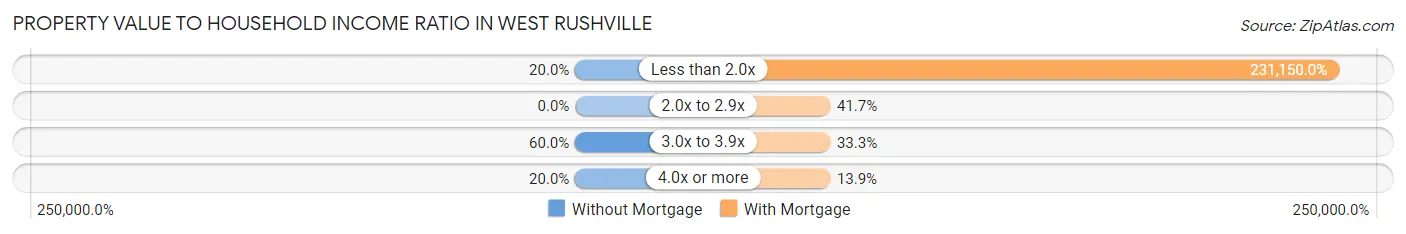
| Value-to-Income Ratio | Without Mortgage | With Mortgage |
| Less than 2.0x | 2 (20.0%) | 83,214 (231,150.0%) |
| 2.0x to 2.9x | 0 (0.0%) | 15 (41.7%) |
| 3.0x to 3.9x | 6 (60.0%) | 12 (33.3%) |
| 4.0x or more | 2 (20.0%) | 5 (13.9%) |
| Total | 10 (100.0%) | 36 (100.0%) |
Real Estate Taxes by Mortgage Status in West Rushville
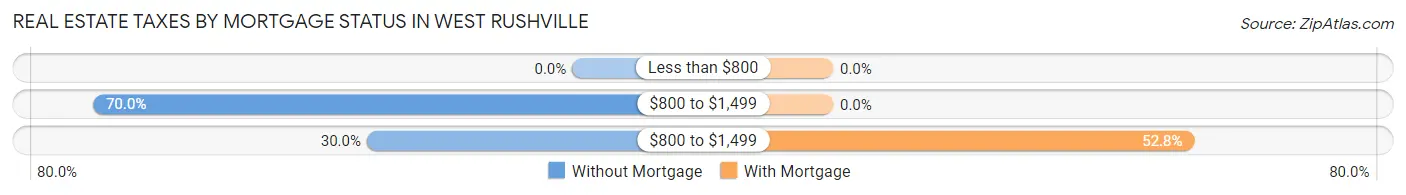
| Property Taxes | Without Mortgage | With Mortgage |
| Less than $800 | 0 (0.0%) | 0 (0.0%) |
| $800 to $1,499 | 7 (70.0%) | 0 (0.0%) |
| $800 to $1,499 | 3 (30.0%) | 19 (52.8%) |
| Total | 10 (100.0%) | 36 (100.0%) |
Health & Disability in West Rushville
Health Insurance Coverage by Age in West Rushville
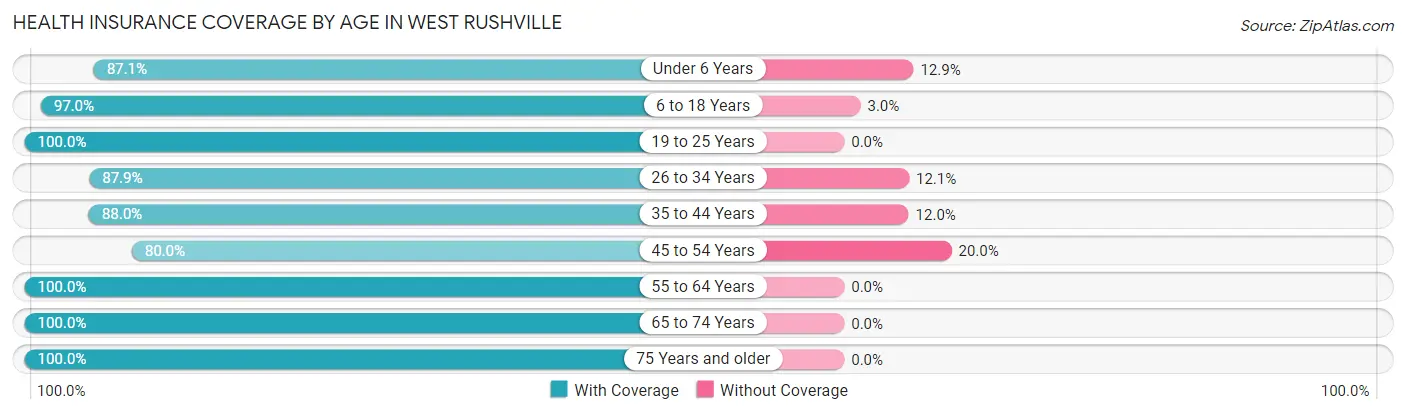
| Age Bracket | With Coverage | Without Coverage |
| Under 6 Years | 54 (87.1%) | 8 (12.9%) |
| 6 to 18 Years | 64 (97.0%) | 2 (3.0%) |
| 19 to 25 Years | 18 (100.0%) | 0 (0.0%) |
| 26 to 34 Years | 51 (87.9%) | 7 (12.1%) |
| 35 to 44 Years | 22 (88.0%) | 3 (12.0%) |
| 45 to 54 Years | 12 (80.0%) | 3 (20.0%) |
| 55 to 64 Years | 23 (100.0%) | 0 (0.0%) |
| 65 to 74 Years | 5 (100.0%) | 0 (0.0%) |
| 75 Years and older | 6 (100.0%) | 0 (0.0%) |
| Total | 255 (91.7%) | 23 (8.3%) |
Health Insurance Coverage by Citizenship Status in West Rushville
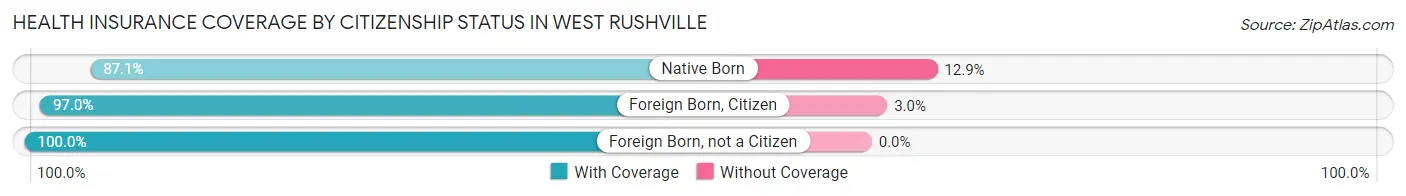
| Citizenship Status | With Coverage | Without Coverage |
| Native Born | 54 (87.1%) | 8 (12.9%) |
| Foreign Born, Citizen | 64 (97.0%) | 2 (3.0%) |
| Foreign Born, not a Citizen | 18 (100.0%) | 0 (0.0%) |
Health Insurance Coverage by Household Income in West Rushville
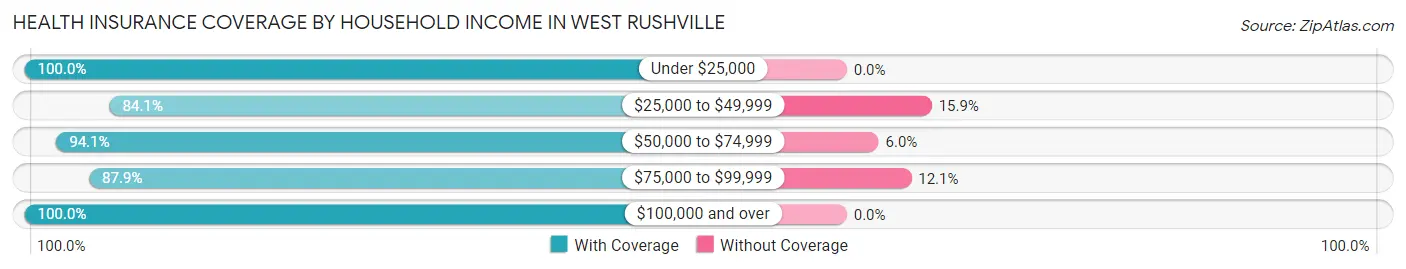
| Household Income | With Coverage | Without Coverage |
| Under $25,000 | 25 (100.0%) | 0 (0.0%) |
| $25,000 to $49,999 | 37 (84.1%) | 7 (15.9%) |
| $50,000 to $74,999 | 79 (94.1%) | 5 (5.9%) |
| $75,000 to $99,999 | 80 (87.9%) | 11 (12.1%) |
| $100,000 and over | 34 (100.0%) | 0 (0.0%) |
Public vs Private Health Insurance Coverage by Age in West Rushville
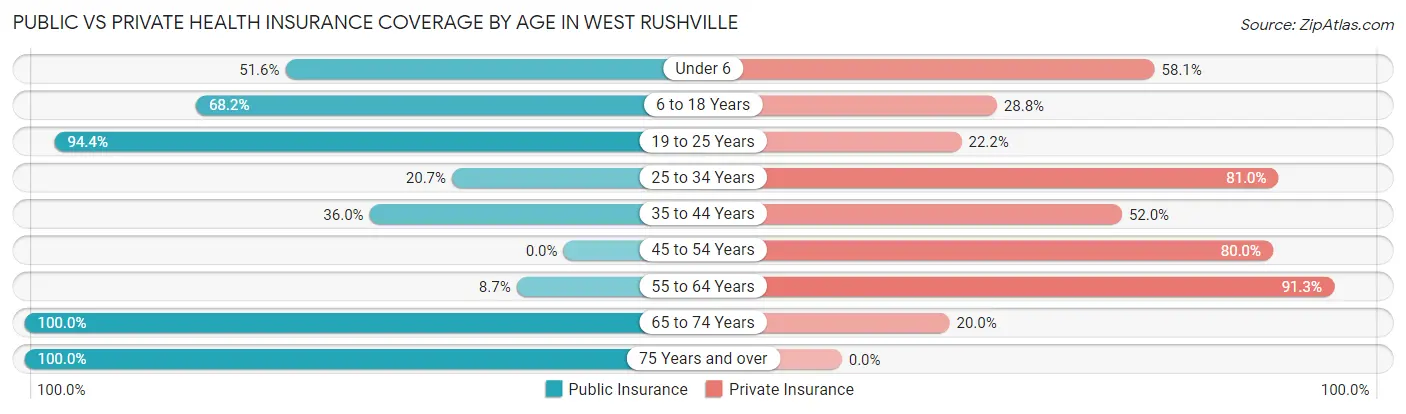
| Age Bracket | Public Insurance | Private Insurance |
| Under 6 | 32 (51.6%) | 36 (58.1%) |
| 6 to 18 Years | 45 (68.2%) | 19 (28.8%) |
| 19 to 25 Years | 17 (94.4%) | 4 (22.2%) |
| 25 to 34 Years | 12 (20.7%) | 47 (81.0%) |
| 35 to 44 Years | 9 (36.0%) | 13 (52.0%) |
| 45 to 54 Years | 0 (0.0%) | 12 (80.0%) |
| 55 to 64 Years | 2 (8.7%) | 21 (91.3%) |
| 65 to 74 Years | 5 (100.0%) | 1 (20.0%) |
| 75 Years and over | 6 (100.0%) | 0 (0.0%) |
| Total | 128 (46.0%) | 153 (55.0%) |
Disability Status by Sex by Age in West Rushville
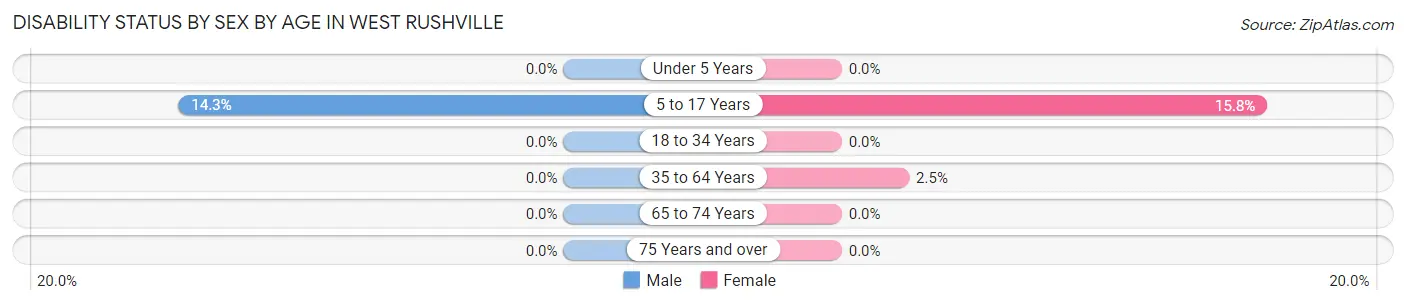
| Age Bracket | Male | Female |
| Under 5 Years | 0 (0.0%) | 0 (0.0%) |
| 5 to 17 Years | 2 (14.3%) | 9 (15.8%) |
| 18 to 34 Years | 0 (0.0%) | 0 (0.0%) |
| 35 to 64 Years | 0 (0.0%) | 1 (2.5%) |
| 65 to 74 Years | 0 (0.0%) | 0 (0.0%) |
| 75 Years and over | 0 (0.0%) | 0 (0.0%) |
Disability Class by Sex by Age in West Rushville
Disability Class: Hearing Difficulty
| Age Bracket | Male | Female |
| Under 5 Years | 0 (0.0%) | 0 (0.0%) |
| 5 to 17 Years | 0 (0.0%) | 0 (0.0%) |
| 18 to 34 Years | 0 (0.0%) | 0 (0.0%) |
| 35 to 64 Years | 0 (0.0%) | 0 (0.0%) |
| 65 to 74 Years | 0 (0.0%) | 0 (0.0%) |
| 75 Years and over | 0 (0.0%) | 0 (0.0%) |
Disability Class: Vision Difficulty
| Age Bracket | Male | Female |
| Under 5 Years | 0 (0.0%) | 0 (0.0%) |
| 5 to 17 Years | 0 (0.0%) | 0 (0.0%) |
| 18 to 34 Years | 0 (0.0%) | 0 (0.0%) |
| 35 to 64 Years | 0 (0.0%) | 0 (0.0%) |
| 65 to 74 Years | 0 (0.0%) | 0 (0.0%) |
| 75 Years and over | 0 (0.0%) | 0 (0.0%) |
Disability Class: Cognitive Difficulty
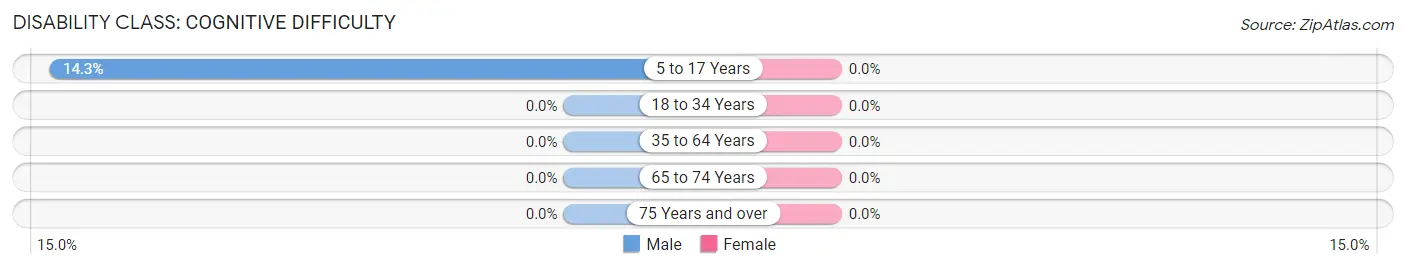
| Age Bracket | Male | Female |
| 5 to 17 Years | 2 (14.3%) | 0 (0.0%) |
| 18 to 34 Years | 0 (0.0%) | 0 (0.0%) |
| 35 to 64 Years | 0 (0.0%) | 0 (0.0%) |
| 65 to 74 Years | 0 (0.0%) | 0 (0.0%) |
| 75 Years and over | 0 (0.0%) | 0 (0.0%) |
Disability Class: Ambulatory Difficulty
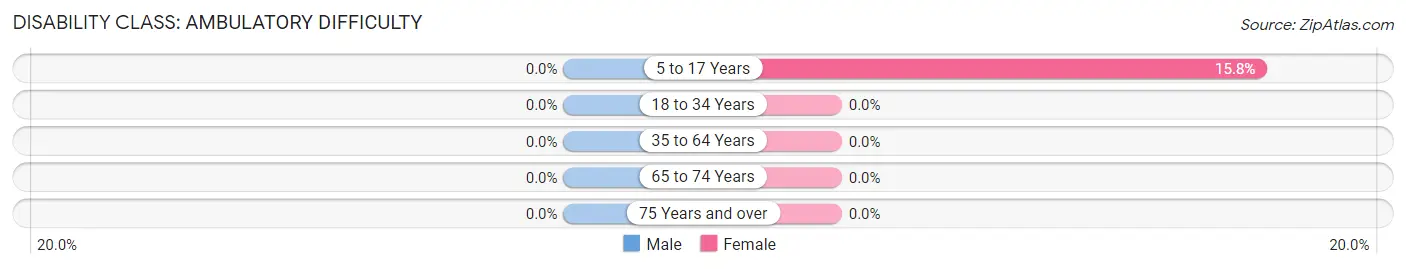
| Age Bracket | Male | Female |
| 5 to 17 Years | 0 (0.0%) | 9 (15.8%) |
| 18 to 34 Years | 0 (0.0%) | 0 (0.0%) |
| 35 to 64 Years | 0 (0.0%) | 0 (0.0%) |
| 65 to 74 Years | 0 (0.0%) | 0 (0.0%) |
| 75 Years and over | 0 (0.0%) | 0 (0.0%) |
Disability Class: Self-Care Difficulty
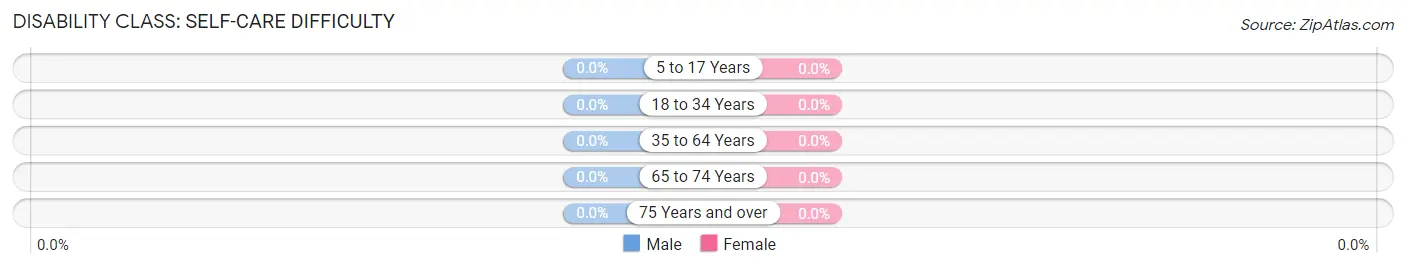
| Age Bracket | Male | Female |
| 5 to 17 Years | 0 (0.0%) | 0 (0.0%) |
| 18 to 34 Years | 0 (0.0%) | 0 (0.0%) |
| 35 to 64 Years | 0 (0.0%) | 0 (0.0%) |
| 65 to 74 Years | 0 (0.0%) | 0 (0.0%) |
| 75 Years and over | 0 (0.0%) | 0 (0.0%) |
Technology Access in West Rushville
Computing Device Access in West Rushville
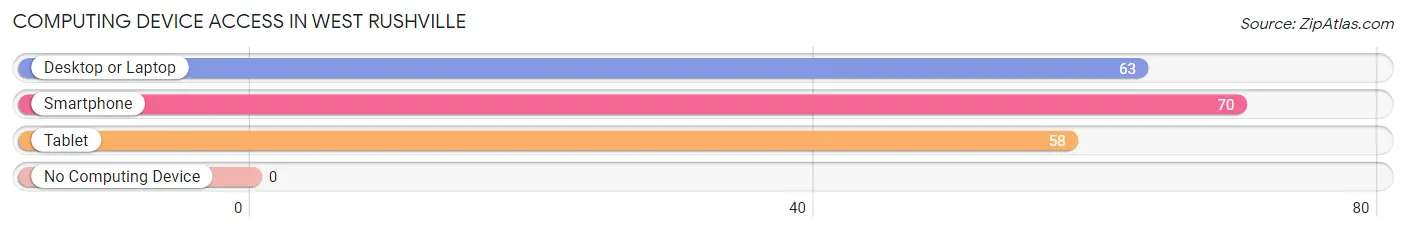
| Device Type | # Households | % Households |
| Desktop or Laptop | 63 | 87.5% |
| Smartphone | 70 | 97.2% |
| Tablet | 58 | 80.6% |
| No Computing Device | 0 | 0.0% |
| Total | 72 | 100.0% |
Internet Access in West Rushville
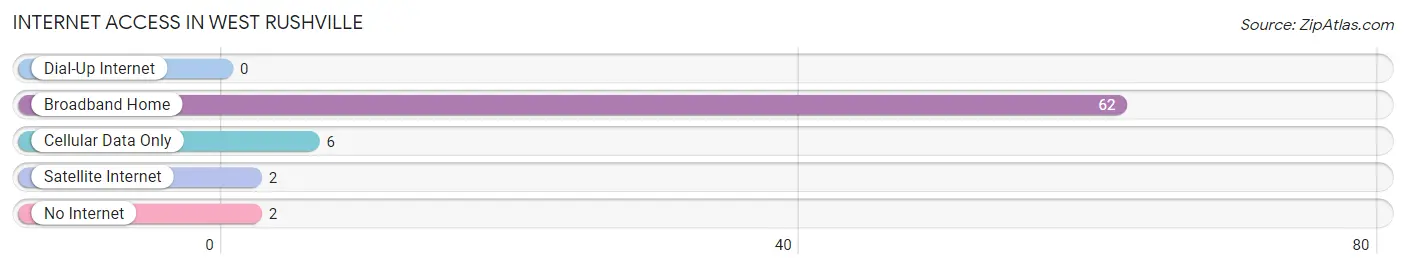
| Internet Type | # Households | % Households |
| Dial-Up Internet | 0 | 0.0% |
| Broadband Home | 62 | 86.1% |
| Cellular Data Only | 6 | 8.3% |
| Satellite Internet | 2 | 2.8% |
| No Internet | 2 | 2.8% |
| Total | 72 | 100.0% |
West Rushville Summary
Rushville, Ohio is a small village located in Fairfield County, Ohio. It is situated on the west side of the county, just south of Lancaster. The village has a population of approximately 1,000 people and is part of the Lancaster Metropolitan Statistical Area.
History
The area that is now Rushville was first settled in 1805 by a group of settlers from Pennsylvania. The village was originally known as West Rushville, and was incorporated in 1817. The village was named after the nearby Rush Creek, which was named after the Rush family, who were among the first settlers in the area.
The village grew slowly over the years, and by the mid-1800s, it had become a thriving agricultural community. The village was home to several mills, including a grist mill, a saw mill, and a woolen mill. The village also had a blacksmith shop, a general store, and a post office.
In the late 1800s, the village began to experience a period of growth and development. The village was connected to the outside world by the Columbus and Toledo Railroad, which ran through the village. This allowed the village to become a shipping center for the surrounding area.
The village continued to grow and prosper throughout the early 1900s. In the 1920s, the village was home to several businesses, including a bank, a hotel, a movie theater, and a variety of stores. The village also had a school, a library, and a fire department.
Geography
Rushville is located in Fairfield County, Ohio. It is situated on the west side of the county, just south of Lancaster. The village is located on the banks of Rush Creek, which flows through the village. The village is surrounded by rolling hills and farmland.
The village is located approximately 30 miles east of Columbus, Ohio, and approximately 40 miles west of Pittsburgh, Pennsylvania. The village is located near several major highways, including Interstate 70, Interstate 71, and State Route 33.
Economy
The economy of Rushville is largely based on agriculture. The village is home to several farms, which produce a variety of crops, including corn, soybeans, wheat, and hay. The village also has several businesses, including a bank, a hotel, a movie theater, and a variety of stores.
The village is also home to several manufacturing companies, including a plastics manufacturer, a metal fabricator, and a machine shop. The village is also home to several small businesses, including a bakery, a restaurant, and a barber shop.
Demographics
As of the 2010 census, the population of Rushville was 1,000 people. The village is predominantly white, with approximately 95% of the population being white. The median household income in the village is $45,000, and the median home value is $125,000.
The village is home to several churches, including the Rushville United Methodist Church, the Rushville Baptist Church, and the Rushville Presbyterian Church. The village also has a public library, a fire department, and a post office.
Conclusion
Rushville, Ohio is a small village located in Fairfield County, Ohio. It is situated on the west side of the county, just south of Lancaster. The village has a population of approximately 1,000 people and is part of the Lancaster Metropolitan Statistical Area. The village has a long history of agriculture and is home to several businesses, including a bank, a hotel, a movie theater, and a variety of stores. The village is also home to several manufacturing companies, including a plastics manufacturer, a metal fabricator, and a machine shop. The village is predominantly white, with approximately 95% of the population being white. The median household income in the village is $45,000, and the median home value is $125,000.
Common Questions
What is the Total Population of West Rushville?
Total Population of West Rushville is 278.
What is the Total Male Population of West Rushville?
Total Male Population of West Rushville is 100.
What is the Total Female Population of West Rushville?
Total Female Population of West Rushville is 178.
What is the Ratio of Males per 100 Females in West Rushville?
There are 56.18 Males per 100 Females in West Rushville.
What is the Ratio of Females per 100 Males in West Rushville?
There are 178.00 Females per 100 Males in West Rushville.
What is the Median Population Age in West Rushville?
Median Population Age in West Rushville is 20.6 Years.
What is the Average Family Size in West Rushville
Average Family Size in West Rushville is 3.9 People.
What is the Average Household Size in West Rushville
Average Household Size in West Rushville is 3.9 People.
What is Per Capita Income in West Rushville?
Per Capita income in West Rushville is $17,626.
What is the Median Family Income in West Rushville?
Median Family Income in West Rushville is $59,861.
What is the Median Household income in West Rushville?
Median Household Income in West Rushville is $59,444.
What is Income or Wage Gap in West Rushville?
Income or Wage Gap in West Rushville is 35.8%.
Women in West Rushville earn 64.2 cents for every dollar earned by a man.
What is Inequality or Gini Index in West Rushville?
Inequality or Gini Index in West Rushville is 0.27.
How Large is the Labor Force in West Rushville?
There are 110 People in the Labor Forcein in West Rushville.
What is the Percentage of People in the Labor Force in West Rushville?
69.2% of People are in the Labor Force in West Rushville.
What is the Unemployment Rate in West Rushville?
Unemployment Rate in West Rushville is 2.7%.