Andersonville, OH
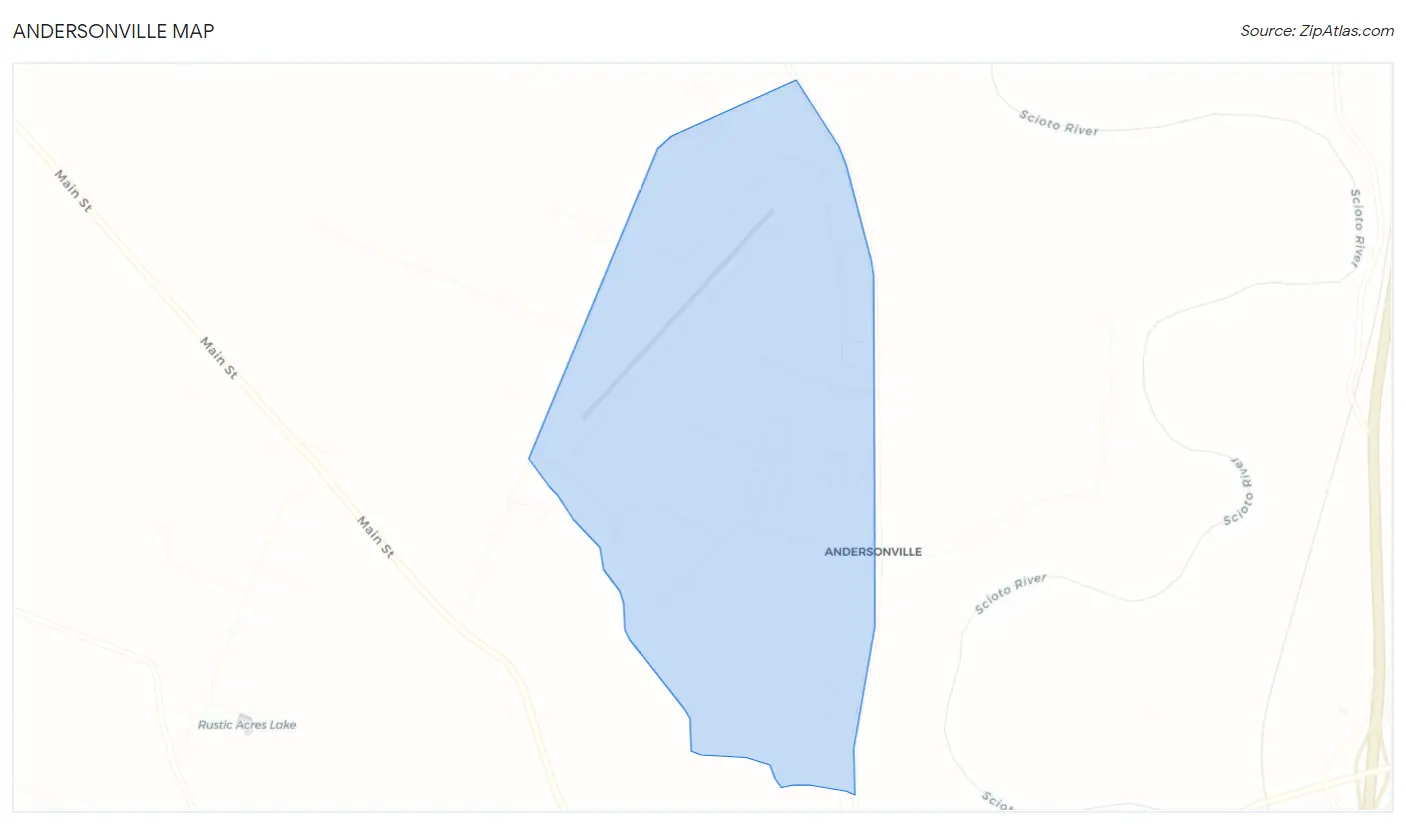
Andersonville Map
Andersonville Overview
433
TOTAL POPULATION
182
MALE POPULATION
251
FEMALE POPULATION
72.51
MALES / 100 FEMALES
137.91
FEMALES / 100 MALES
52.8
MEDIAN AGE
2.9
AVG FAMILY SIZE
2.5
AVG HOUSEHOLD SIZE
$37,175
PER CAPITA INCOME
$108,958
AVG FAMILY INCOME
$78,333
AVG HOUSEHOLD INCOME
35.8%
WAGE / INCOME GAP [ % ]
64.2¢/ $1
WAGE / INCOME GAP [ $ ]
$10,321
FAMILY INCOME DEFICIT
0.37
INEQUALITY / GINI INDEX
167
LABOR FORCE [ PEOPLE ]
44.3%
PERCENT IN LABOR FORCE
3.6%
UNEMPLOYMENT RATE
Race in Andersonville
The most populous races in Andersonville are White / Caucasian (418 | 96.5%), Two or more Races (9 | 2.1%), and Native / Alaskan (6 | 1.4%).
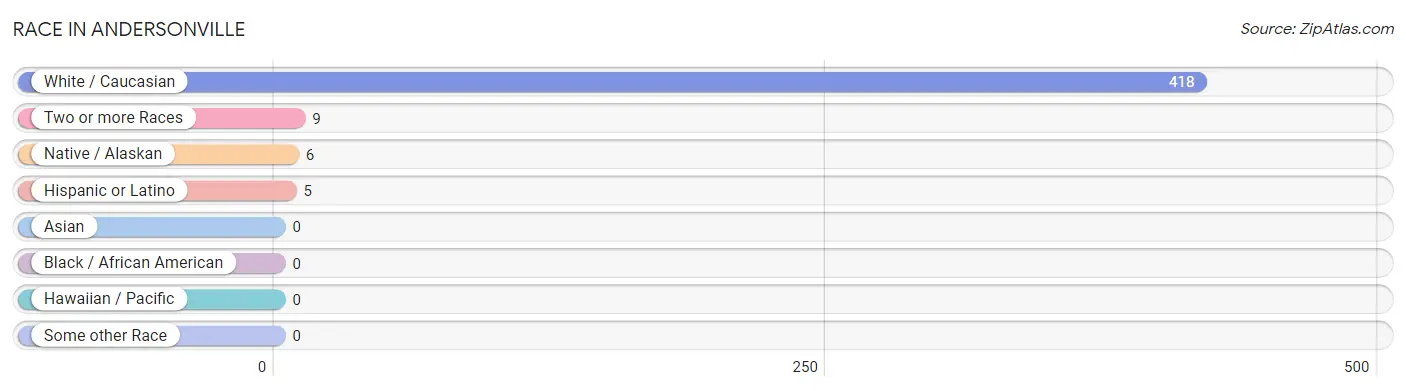
| Race | # Population | % Population |
| Asian | 0 | 0.0% |
| Black / African American | 0 | 0.0% |
| Hawaiian / Pacific | 0 | 0.0% |
| Hispanic or Latino | 5 | 1.1% |
| Native / Alaskan | 6 | 1.4% |
| White / Caucasian | 418 | 96.5% |
| Two or more Races | 9 | 2.1% |
| Some other Race | 0 | 0.0% |
| Total | 433 | 100.0% |
Ancestry in Andersonville
The most populous ancestries reported in Andersonville are German (88 | 20.3%), English (78 | 18.0%), Irish (76 | 17.5%), American (36 | 8.3%), and Scandinavian (21 | 4.9%), together accounting for 69.0% of all Andersonville residents.
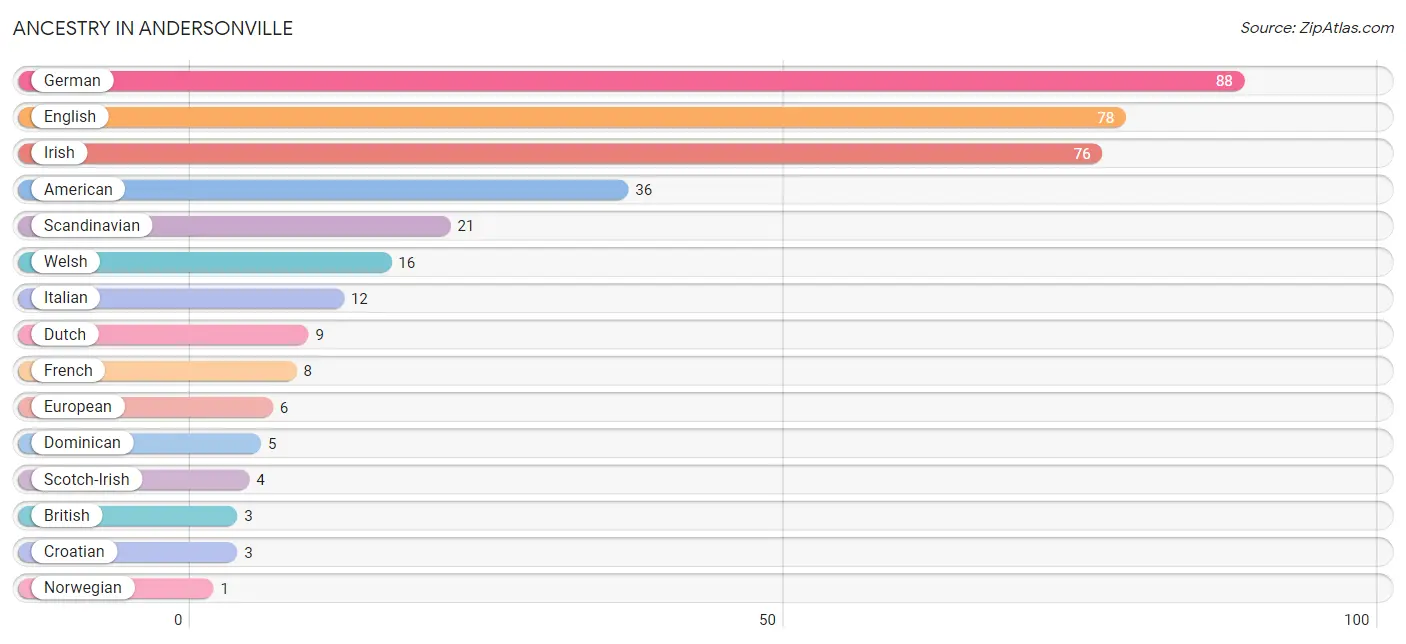
| Ancestry | # Population | % Population |
| American | 36 | 8.3% |
| British | 3 | 0.7% |
| Croatian | 3 | 0.7% |
| Dominican | 5 | 1.1% |
| Dutch | 9 | 2.1% |
| English | 78 | 18.0% |
| European | 6 | 1.4% |
| French | 8 | 1.8% |
| German | 88 | 20.3% |
| Irish | 76 | 17.5% |
| Italian | 12 | 2.8% |
| Norwegian | 1 | 0.2% |
| Scandinavian | 21 | 4.9% |
| Scotch-Irish | 4 | 0.9% |
| Welsh | 16 | 3.7% | View All 15 Rows |
Immigrants in Andersonville
The most numerous immigrant groups reported in Andersonville came from Caribbean (5 | 1.1%), Dominican Republic (5 | 1.1%), and Latin America (5 | 1.1%), together accounting for 3.5% of all Andersonville residents.
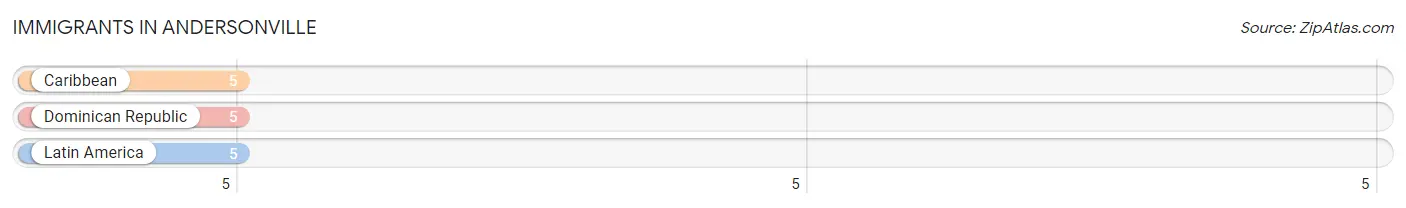
| Immigration Origin | # Population | % Population |
| Caribbean | 5 | 1.1% |
| Dominican Republic | 5 | 1.1% |
| Latin America | 5 | 1.1% | View All 3 Rows |
Sex and Age in Andersonville
Sex and Age in Andersonville
The most populous age groups in Andersonville are 45 to 49 Years (34 | 18.7%) for men and 60 to 64 Years (25 | 10.0%) for women.
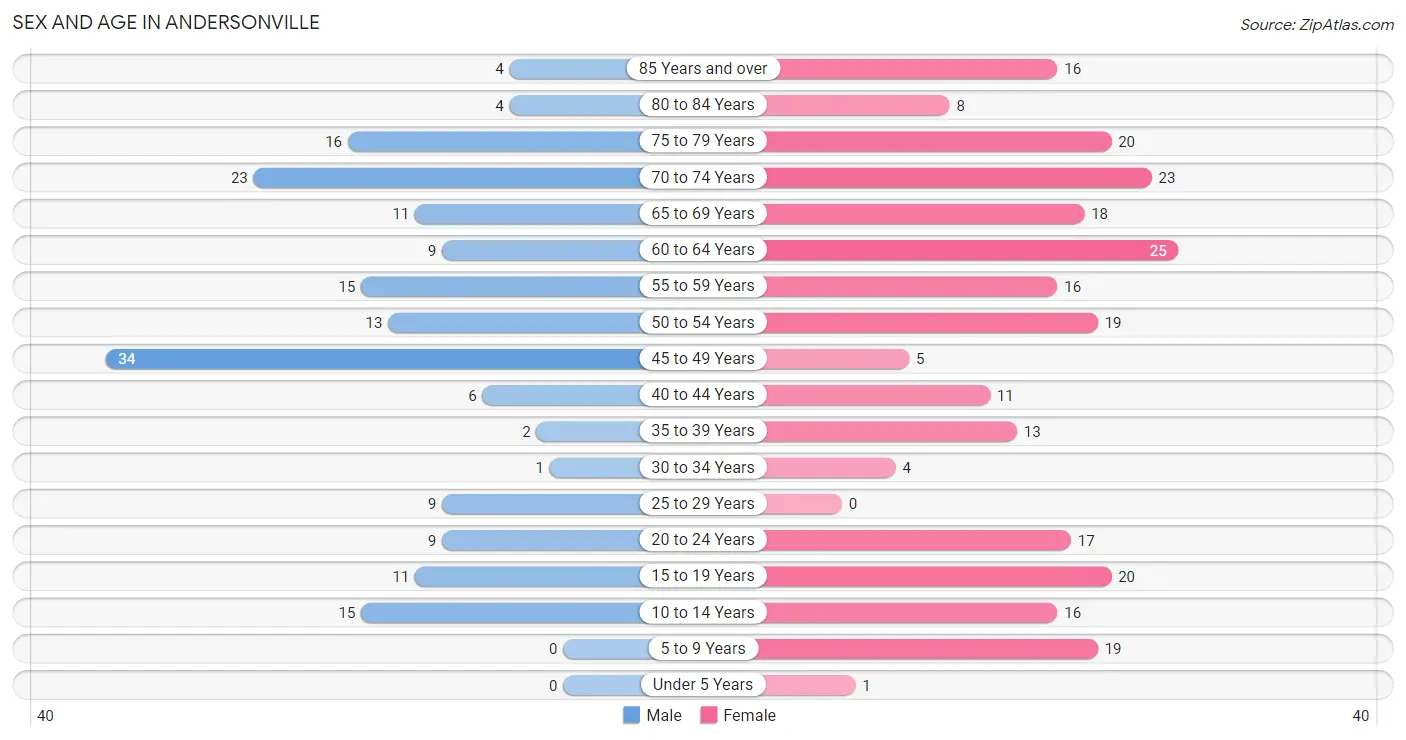
| Age Bracket | Male | Female |
| Under 5 Years | 0 (0.0%) | 1 (0.4%) |
| 5 to 9 Years | 0 (0.0%) | 19 (7.6%) |
| 10 to 14 Years | 15 (8.2%) | 16 (6.4%) |
| 15 to 19 Years | 11 (6.0%) | 20 (8.0%) |
| 20 to 24 Years | 9 (5.0%) | 17 (6.8%) |
| 25 to 29 Years | 9 (5.0%) | 0 (0.0%) |
| 30 to 34 Years | 1 (0.5%) | 4 (1.6%) |
| 35 to 39 Years | 2 (1.1%) | 13 (5.2%) |
| 40 to 44 Years | 6 (3.3%) | 11 (4.4%) |
| 45 to 49 Years | 34 (18.7%) | 5 (2.0%) |
| 50 to 54 Years | 13 (7.1%) | 19 (7.6%) |
| 55 to 59 Years | 15 (8.2%) | 16 (6.4%) |
| 60 to 64 Years | 9 (5.0%) | 25 (10.0%) |
| 65 to 69 Years | 11 (6.0%) | 18 (7.2%) |
| 70 to 74 Years | 23 (12.6%) | 23 (9.2%) |
| 75 to 79 Years | 16 (8.8%) | 20 (8.0%) |
| 80 to 84 Years | 4 (2.2%) | 8 (3.2%) |
| 85 Years and over | 4 (2.2%) | 16 (6.4%) |
| Total | 182 (100.0%) | 251 (100.0%) |
Families and Households in Andersonville
Median Family Size in Andersonville
The median family size in Andersonville is 2.93 persons per family, with married-couple families (122 | 90.4%) accounting for the largest median family size of 3.04 persons per family. On the other hand, single male/father families (9 | 6.7%) represent the smallest median family size with 1.89 persons per family.
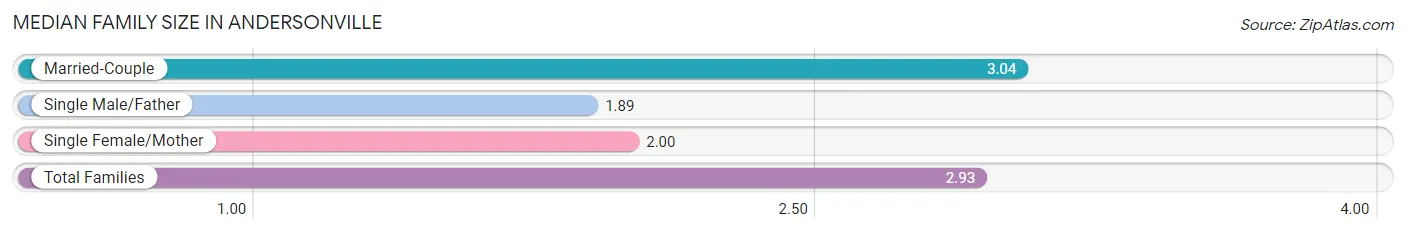
| Family Type | # Families | Family Size |
| Married-Couple | 122 (90.4%) | 3.04 |
| Single Male/Father | 9 (6.7%) | 1.89 |
| Single Female/Mother | 4 (3.0%) | 2.00 |
| Total Families | 135 (100.0%) | 2.93 |
Median Household Size in Andersonville
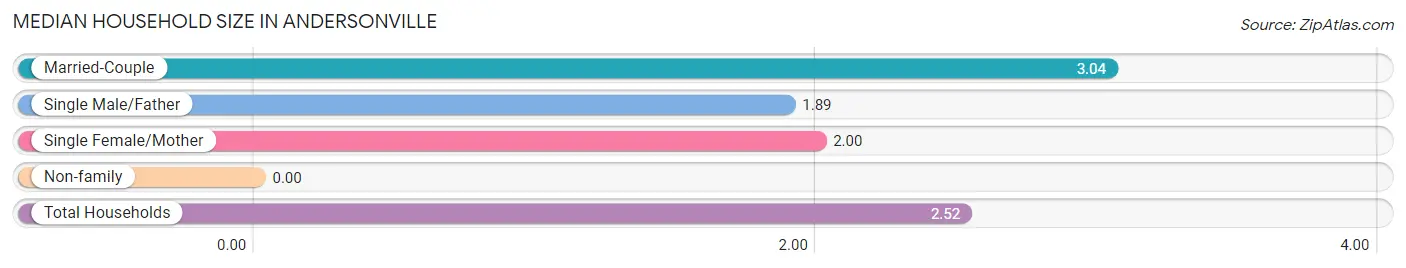
| Household Type | # Households | Household Size |
| Married-Couple | 122 (70.9%) | 3.04 |
| Single Male/Father | 9 (5.2%) | 1.89 |
| Single Female/Mother | 4 (2.3%) | 2.00 |
| Non-family | 37 (21.5%) | - |
| Total Households | 172 (100.0%) | 2.52 |
Household Size by Marriage Status in Andersonville
Out of a total of 172 households in Andersonville, 135 (78.5%) are family households, while 37 (21.5%) are nonfamily households. The most numerous type of family households are 2-person households, comprising 82, and the most common type of nonfamily households are 1-person households, comprising 37.
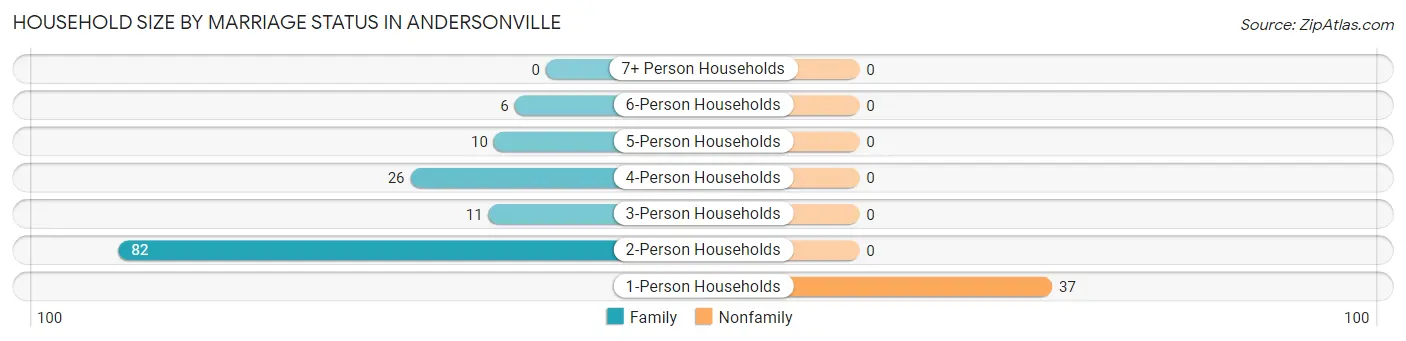
| Household Size | Family Households | Nonfamily Households |
| 1-Person Households | - | 37 (21.5%) |
| 2-Person Households | 82 (47.7%) | 0 (0.0%) |
| 3-Person Households | 11 (6.4%) | 0 (0.0%) |
| 4-Person Households | 26 (15.1%) | 0 (0.0%) |
| 5-Person Households | 10 (5.8%) | 0 (0.0%) |
| 6-Person Households | 6 (3.5%) | 0 (0.0%) |
| 7+ Person Households | 0 (0.0%) | 0 (0.0%) |
| Total | 135 (78.5%) | 37 (21.5%) |
Female Fertility in Andersonville
Fertility by Age in Andersonville
Average fertility rate in Andersonville is 49.0 births per 1,000 women. Women in the age bracket of 20 to 34 years have the highest fertility rate with 190.0 births per 1,000 women. Women in the age bracket of 20 to 34 years acount for 100.0% of all women with births.
| Age Bracket | Women with Births | Births / 1,000 Women |
| 15 to 19 years | 0 (0.0%) | 0.0 |
| 20 to 34 years | 4 (100.0%) | 190.0 |
| 35 to 50 years | 0 (0.0%) | 0.0 |
| Total | 4 (100.0%) | 49.0 |
Fertility by Age by Marriage Status in Andersonville
| Age Bracket | Married | Unmarried |
| 15 to 19 years | 0 (0.0%) | 0 (0.0%) |
| 20 to 34 years | 0 (0.0%) | 4 (100.0%) |
| 35 to 50 years | 0 (0.0%) | 0 (0.0%) |
| Total | 0 (0.0%) | 4 (100.0%) |
Fertility by Education in Andersonville
| Educational Attainment | Women with Births | Births / 1,000 Women |
| Less than High School | 0 (0.0%) | 0.0 |
| High School Diploma | 0 (0.0%) | 0.0 |
| College or Associate's Degree | 4 (100.0%) | 222.0 |
| Bachelor's Degree | 0 (0.0%) | 0.0 |
| Graduate Degree | 0 (0.0%) | 0.0 |
| Total | 4 (100.0%) | 49.0 |
Fertility by Education by Marriage Status in Andersonville
| Educational Attainment | Married | Unmarried |
| Less than High School | 0 (0.0%) | 0 (0.0%) |
| High School Diploma | 0 (0.0%) | 0 (0.0%) |
| College or Associate's Degree | 0 (0.0%) | 4 (100.0%) |
| Bachelor's Degree | 0 (0.0%) | 0 (0.0%) |
| Graduate Degree | 0 (0.0%) | 0 (0.0%) |
| Total | 0 (0.0%) | 4 (100.0%) |
Income in Andersonville
Income Overview in Andersonville
Per Capita Income in Andersonville is $37,175, while median incomes of families and households are $108,958 and $78,333 respectively.
| Characteristic | Number | Measure |
| Per Capita Income | 433 | $37,175 |
| Median Family Income | 135 | $108,958 |
| Mean Family Income | 135 | $104,710 |
| Median Household Income | 172 | $78,333 |
| Mean Household Income | 172 | $91,194 |
| Income Deficit | 135 | $10,321 |
| Wage / Income Gap (%) | 433 | 35.83% |
| Wage / Income Gap ($) | 433 | 64.17¢ per $1 |
| Gini / Inequality Index | 433 | 0.37 |
Earnings by Sex in Andersonville
Average Earnings in Andersonville are $46,667, $66,719 for men and $42,813 for women, a difference of 35.8%.
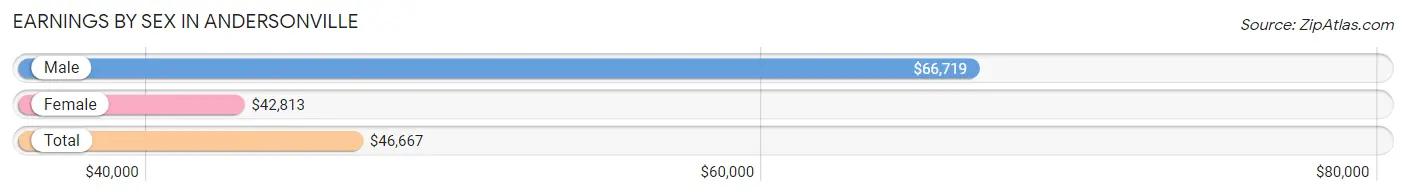
| Sex | Number | Average Earnings |
| Male | 89 (50.6%) | $66,719 |
| Female | 87 (49.4%) | $42,813 |
| Total | 176 (100.0%) | $46,667 |
Earnings by Sex by Income Bracket in Andersonville
The most common earnings brackets in Andersonville are $75,000 to $99,999 for men (25 | 28.1%) and $100,000+ for women (11 | 12.6%).
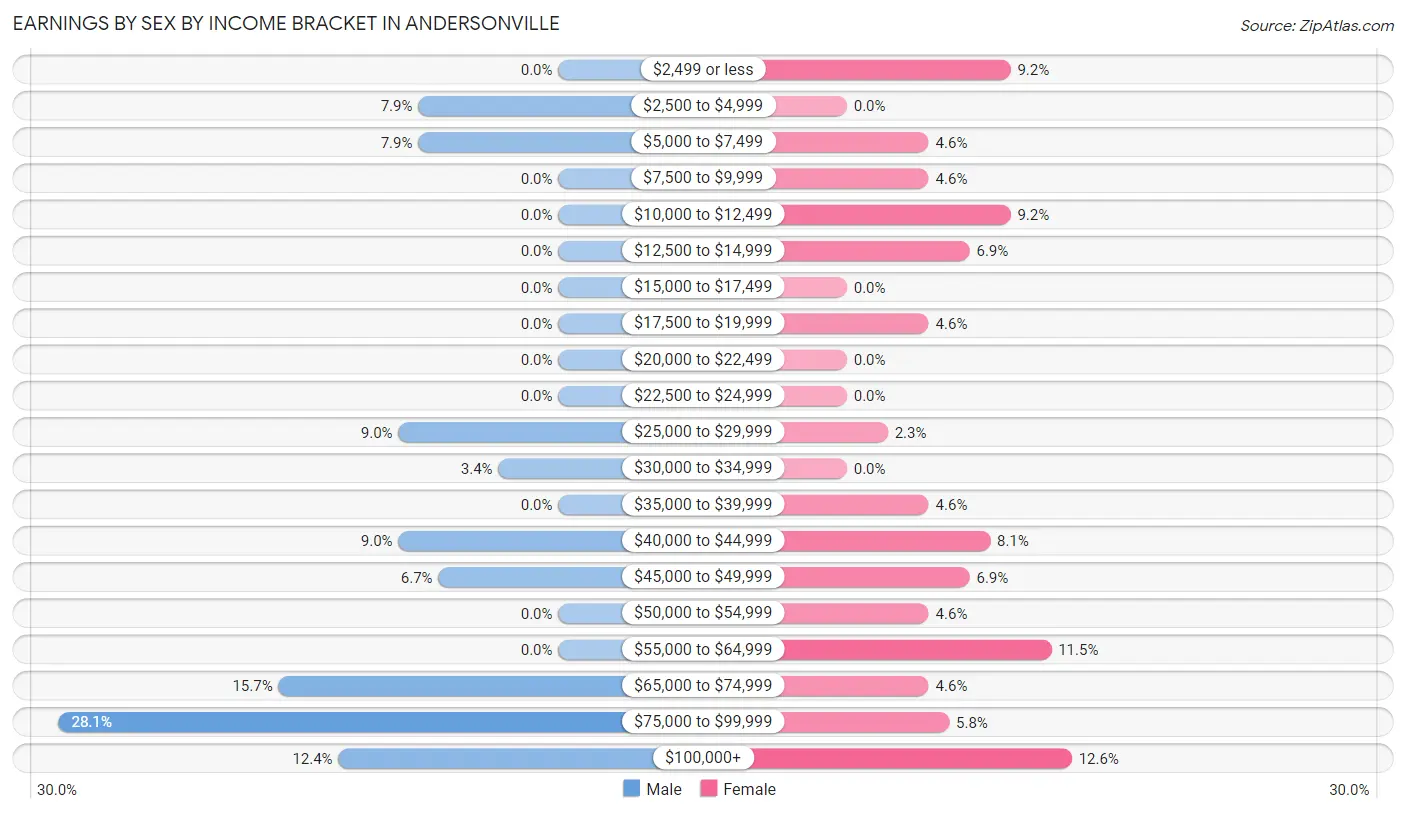
| Income | Male | Female |
| $2,499 or less | 0 (0.0%) | 8 (9.2%) |
| $2,500 to $4,999 | 7 (7.9%) | 0 (0.0%) |
| $5,000 to $7,499 | 7 (7.9%) | 4 (4.6%) |
| $7,500 to $9,999 | 0 (0.0%) | 4 (4.6%) |
| $10,000 to $12,499 | 0 (0.0%) | 8 (9.2%) |
| $12,500 to $14,999 | 0 (0.0%) | 6 (6.9%) |
| $15,000 to $17,499 | 0 (0.0%) | 0 (0.0%) |
| $17,500 to $19,999 | 0 (0.0%) | 4 (4.6%) |
| $20,000 to $22,499 | 0 (0.0%) | 0 (0.0%) |
| $22,500 to $24,999 | 0 (0.0%) | 0 (0.0%) |
| $25,000 to $29,999 | 8 (9.0%) | 2 (2.3%) |
| $30,000 to $34,999 | 3 (3.4%) | 0 (0.0%) |
| $35,000 to $39,999 | 0 (0.0%) | 4 (4.6%) |
| $40,000 to $44,999 | 8 (9.0%) | 7 (8.1%) |
| $45,000 to $49,999 | 6 (6.7%) | 6 (6.9%) |
| $50,000 to $54,999 | 0 (0.0%) | 4 (4.6%) |
| $55,000 to $64,999 | 0 (0.0%) | 10 (11.5%) |
| $65,000 to $74,999 | 14 (15.7%) | 4 (4.6%) |
| $75,000 to $99,999 | 25 (28.1%) | 5 (5.8%) |
| $100,000+ | 11 (12.4%) | 11 (12.6%) |
| Total | 89 (100.0%) | 87 (100.0%) |
Earnings by Sex by Educational Attainment in Andersonville
Average earnings in Andersonville are $74,792 for men and $46,875 for women, a difference of 37.3%. Men with an educational attainment of bachelor's degree enjoy the highest average annual earnings of $98,125, while those with high school diploma education earn the least with $67,292. Women with an educational attainment of college or associate's degree earn the most with the average annual earnings of $52,813, while those with high school diploma education have the smallest earnings of $43,125.
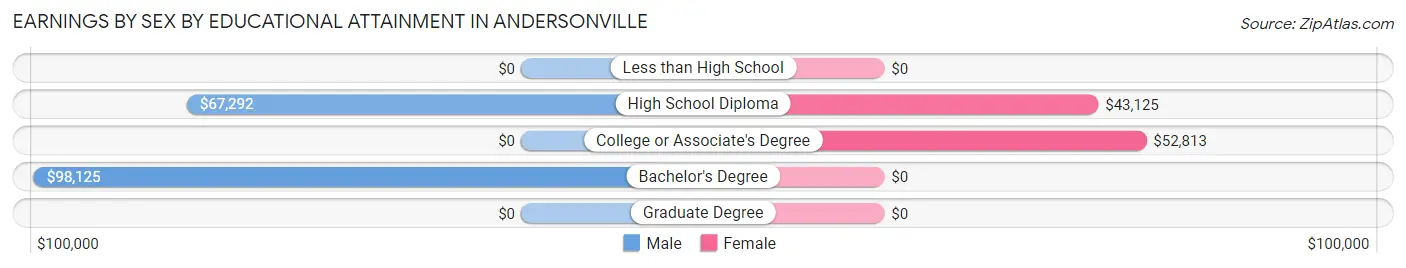
| Educational Attainment | Male Income | Female Income |
| Less than High School | - | - |
| High School Diploma | $67,292 | $43,125 |
| College or Associate's Degree | - | - |
| Bachelor's Degree | $98,125 | $0 |
| Graduate Degree | - | - |
| Total | $74,792 | $46,875 |
Family Income in Andersonville
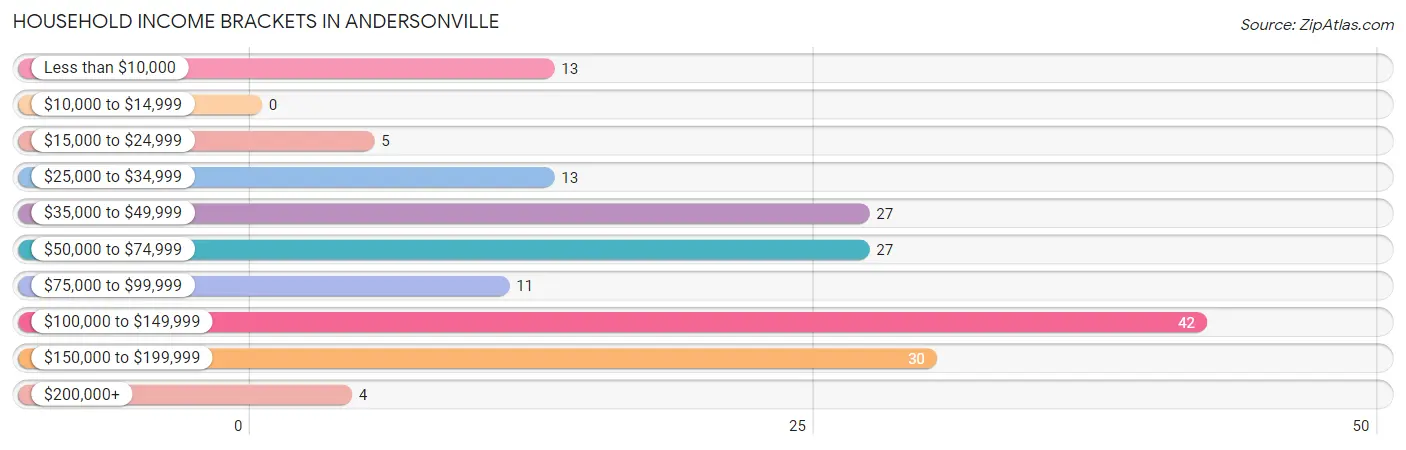
Family Income Brackets in Andersonville
According to the Andersonville family income data, there are 42 families falling into the $100,000 to $149,999 income range, which is the most common income bracket and makes up 31.1% of all families.
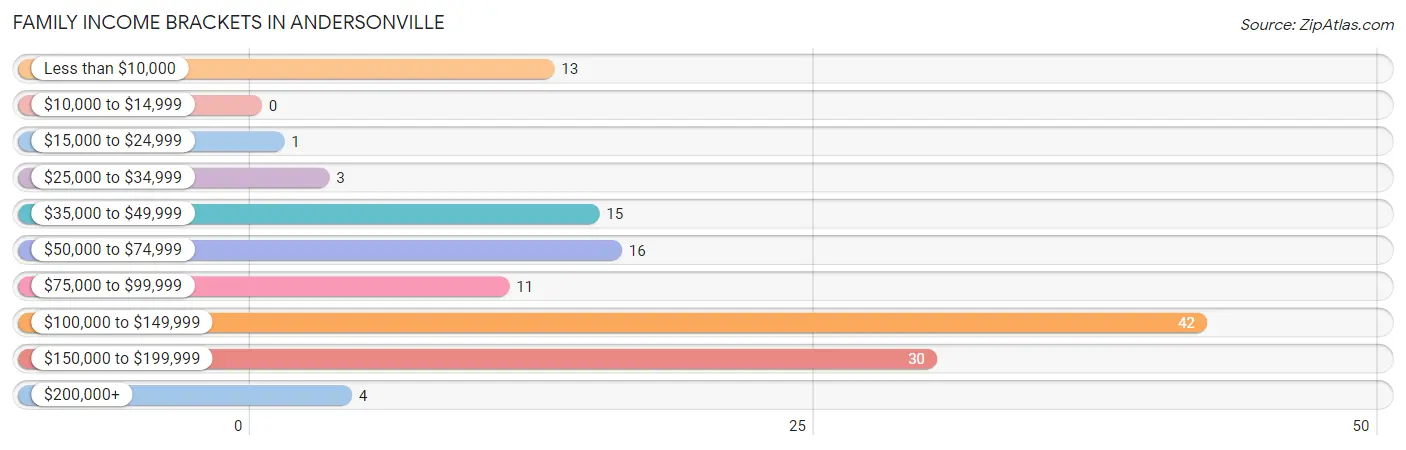
| Income Bracket | # Families | % Families |
| Less than $10,000 | 13 | 9.6% |
| $10,000 to $14,999 | 0 | 0.0% |
| $15,000 to $24,999 | 1 | 0.7% |
| $25,000 to $34,999 | 3 | 2.2% |
| $35,000 to $49,999 | 15 | 11.1% |
| $50,000 to $74,999 | 16 | 11.9% |
| $75,000 to $99,999 | 11 | 8.1% |
| $100,000 to $149,999 | 42 | 31.1% |
| $150,000 to $199,999 | 30 | 22.2% |
| $200,000+ | 4 | 3.0% |
Family Income by Famaliy Size in Andersonville
4-person families (26 | 19.3%) account for the highest median family income in Andersonville with $156,250 per family, while 4-person families (26 | 19.3%) have the highest median income of $39,062 per family member.
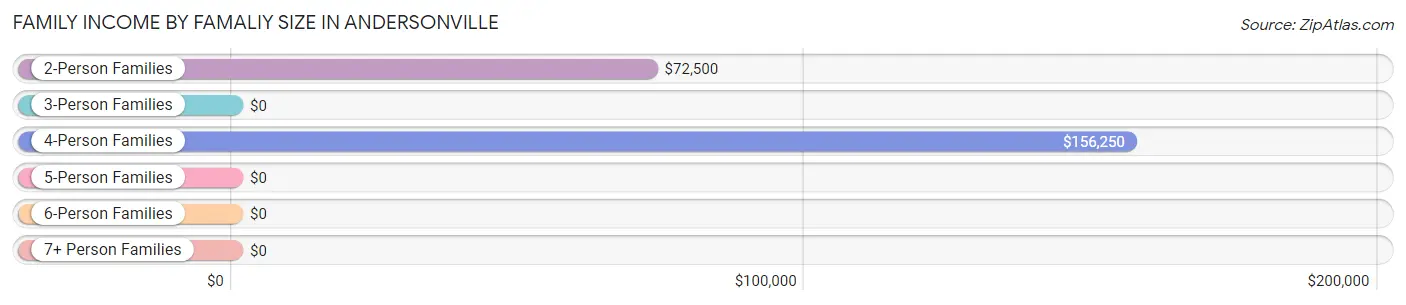
| Income Bracket | # Families | Median Income |
| 2-Person Families | 82 (60.7%) | $72,500 |
| 3-Person Families | 11 (8.2%) | $0 |
| 4-Person Families | 26 (19.3%) | $156,250 |
| 5-Person Families | 10 (7.4%) | $0 |
| 6-Person Families | 6 (4.4%) | $0 |
| 7+ Person Families | 0 (0.0%) | $0 |
| Total | 135 (100.0%) | $108,958 |
Family Income by Number of Earners in Andersonville
The median family income in Andersonville is $108,958, with families comprising 3+ earners (21) having the highest median family income of $167,344, while families with no earners (54) have the lowest median family income of $68,750, accounting for 15.6% and 40.0% of families, respectively.
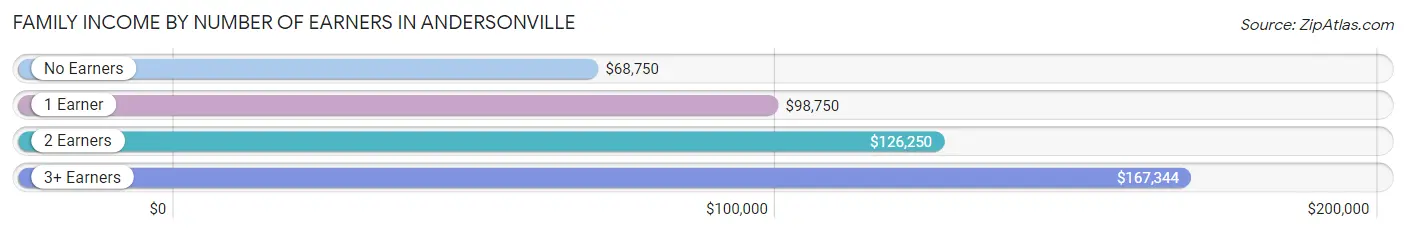
| Number of Earners | # Families | Median Income |
| No Earners | 54 (40.0%) | $68,750 |
| 1 Earner | 30 (22.2%) | $98,750 |
| 2 Earners | 30 (22.2%) | $126,250 |
| 3+ Earners | 21 (15.6%) | $167,344 |
| Total | 135 (100.0%) | $108,958 |
Household Income in Andersonville
Household Income Brackets in Andersonville
With 42 households falling in the category, the $100,000 to $149,999 income range is the most frequent in Andersonville, accounting for 24.4% of all households.
| Income Bracket | # Households | % Households |
| Less than $10,000 | 13 | 7.6% |
| $10,000 to $14,999 | 0 | 0.0% |
| $15,000 to $24,999 | 5 | 2.9% |
| $25,000 to $34,999 | 13 | 7.6% |
| $35,000 to $49,999 | 27 | 15.7% |
| $50,000 to $74,999 | 27 | 15.7% |
| $75,000 to $99,999 | 11 | 6.4% |
| $100,000 to $149,999 | 42 | 24.4% |
| $150,000 to $199,999 | 30 | 17.4% |
| $200,000+ | 4 | 2.3% |
Household Income by Householder Age in Andersonville
The median household income in Andersonville is $78,333, with the highest median household income of $118,125 found in the 25 to 44 years age bracket for the primary householder. A total of 17 households (9.9%) fall into this category.
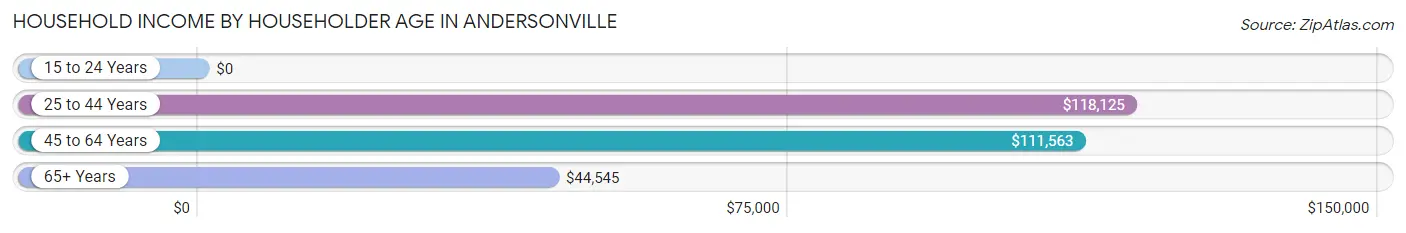
| Income Bracket | # Households | Median Income |
| 15 to 24 Years | 0 (0.0%) | $0 |
| 25 to 44 Years | 17 (9.9%) | $118,125 |
| 45 to 64 Years | 65 (37.8%) | $111,563 |
| 65+ Years | 90 (52.3%) | $44,545 |
| Total | 172 (100.0%) | $78,333 |
Poverty in Andersonville
Income Below Poverty by Sex and Age in Andersonville
With 7.1% poverty level for males and 6.0% for females among the residents of Andersonville, 55 to 64 year old males and under 5 year old females are the most vulnerable to poverty, with 7 males (29.2%) and 1 females (100.0%) in their respective age groups living below the poverty level.
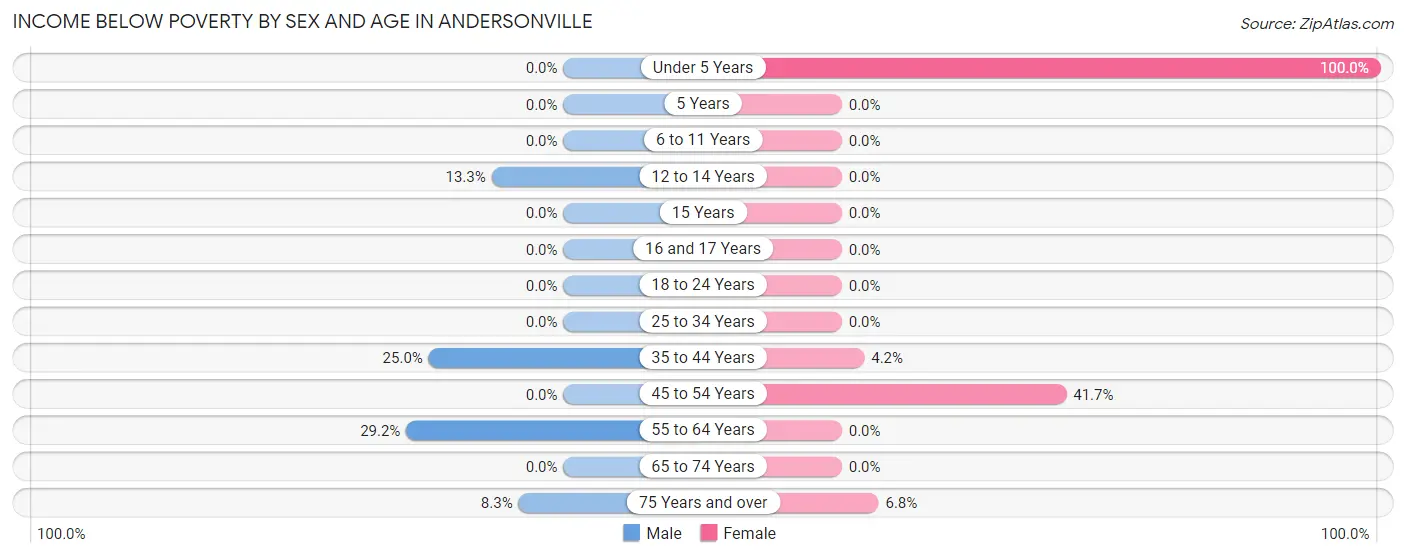
| Age Bracket | Male | Female |
| Under 5 Years | 0 (0.0%) | 1 (100.0%) |
| 5 Years | 0 (0.0%) | 0 (0.0%) |
| 6 to 11 Years | 0 (0.0%) | 0 (0.0%) |
| 12 to 14 Years | 2 (13.3%) | 0 (0.0%) |
| 15 Years | 0 (0.0%) | 0 (0.0%) |
| 16 and 17 Years | 0 (0.0%) | 0 (0.0%) |
| 18 to 24 Years | 0 (0.0%) | 0 (0.0%) |
| 25 to 34 Years | 0 (0.0%) | 0 (0.0%) |
| 35 to 44 Years | 2 (25.0%) | 1 (4.2%) |
| 45 to 54 Years | 0 (0.0%) | 10 (41.7%) |
| 55 to 64 Years | 7 (29.2%) | 0 (0.0%) |
| 65 to 74 Years | 0 (0.0%) | 0 (0.0%) |
| 75 Years and over | 2 (8.3%) | 3 (6.8%) |
| Total | 13 (7.1%) | 15 (6.0%) |
Income Above Poverty by Sex and Age in Andersonville
According to the poverty statistics in Andersonville, males aged 16 and 17 years and females aged 5 years are the age groups that are most secure financially, with 100.0% of males and 100.0% of females in these age groups living above the poverty line.
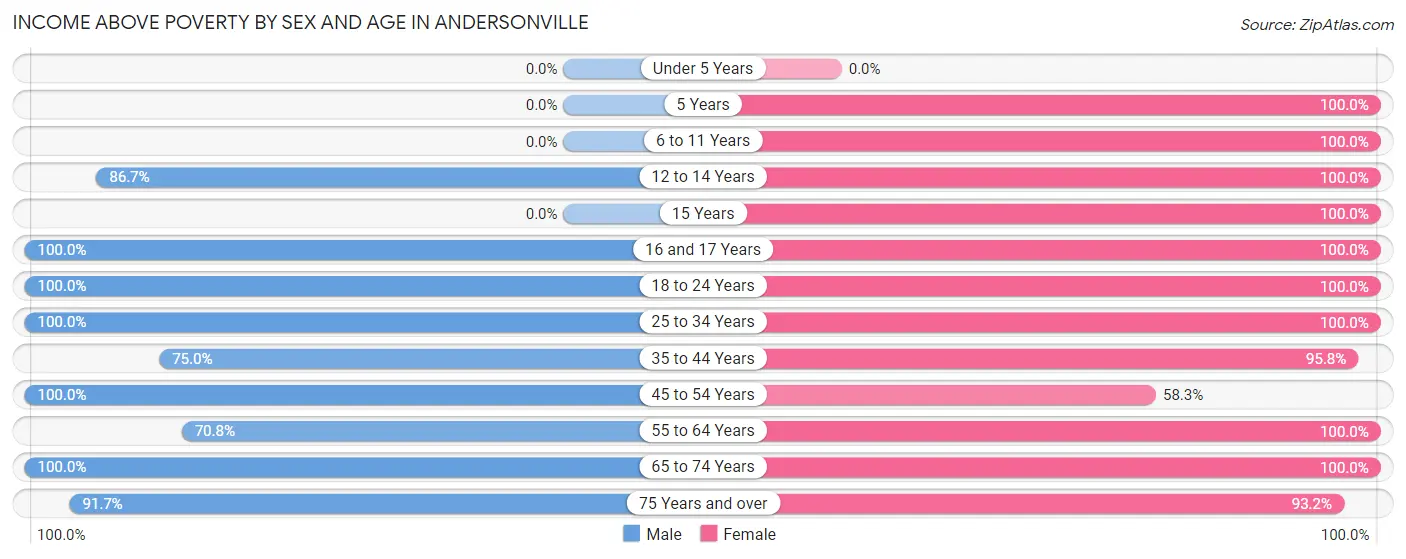
| Age Bracket | Male | Female |
| Under 5 Years | 0 (0.0%) | 0 (0.0%) |
| 5 Years | 0 (0.0%) | 5 (100.0%) |
| 6 to 11 Years | 0 (0.0%) | 20 (100.0%) |
| 12 to 14 Years | 13 (86.7%) | 10 (100.0%) |
| 15 Years | 0 (0.0%) | 5 (100.0%) |
| 16 and 17 Years | 4 (100.0%) | 15 (100.0%) |
| 18 to 24 Years | 16 (100.0%) | 17 (100.0%) |
| 25 to 34 Years | 10 (100.0%) | 4 (100.0%) |
| 35 to 44 Years | 6 (75.0%) | 23 (95.8%) |
| 45 to 54 Years | 47 (100.0%) | 14 (58.3%) |
| 55 to 64 Years | 17 (70.8%) | 41 (100.0%) |
| 65 to 74 Years | 34 (100.0%) | 41 (100.0%) |
| 75 Years and over | 22 (91.7%) | 41 (93.2%) |
| Total | 169 (92.9%) | 236 (94.0%) |
Income Below Poverty Among Married-Couple Families in Andersonville
The poverty statistics for married-couple families in Andersonville show that 11.5% or 14 of the total 122 families live below the poverty line. Families with no children have the highest poverty rate of 14.8%, comprising of 13 families. On the other hand, families with 3 or 4 children have the lowest poverty rate of 0.0%, which includes 0 families.
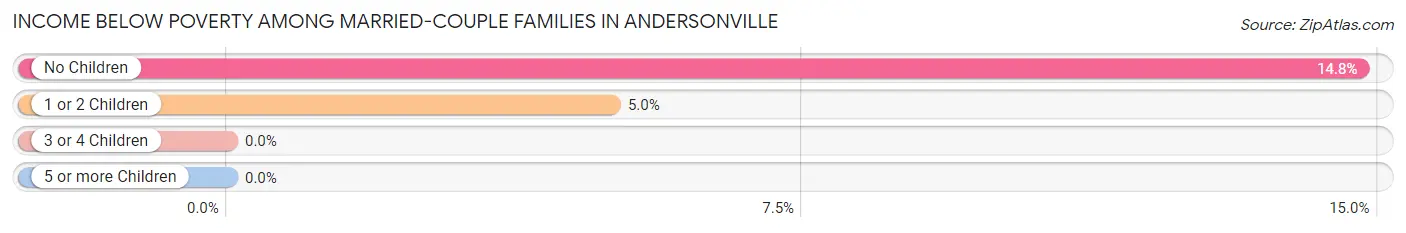
| Children | Above Poverty | Below Poverty |
| No Children | 75 (85.2%) | 13 (14.8%) |
| 1 or 2 Children | 19 (95.0%) | 1 (5.0%) |
| 3 or 4 Children | 14 (100.0%) | 0 (0.0%) |
| 5 or more Children | 0 (0.0%) | 0 (0.0%) |
| Total | 108 (88.5%) | 14 (11.5%) |
Income Below Poverty Among Single-Parent Households in Andersonville
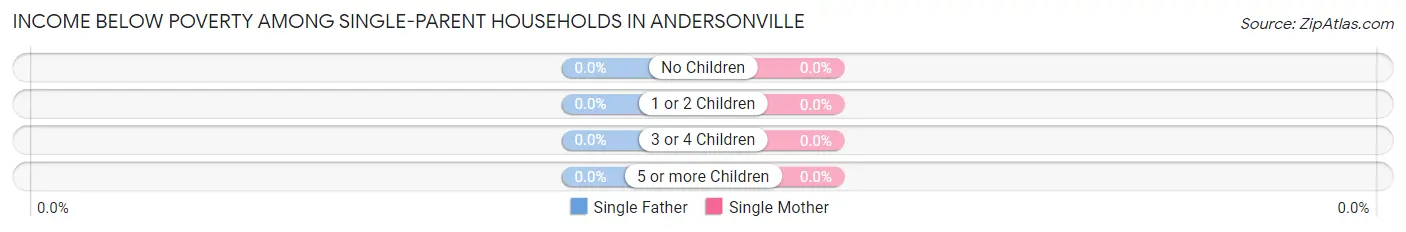
| Children | Single Father | Single Mother |
| No Children | 0 (0.0%) | 0 (0.0%) |
| 1 or 2 Children | 0 (0.0%) | 0 (0.0%) |
| 3 or 4 Children | 0 (0.0%) | 0 (0.0%) |
| 5 or more Children | 0 (0.0%) | 0 (0.0%) |
| Total | 0 (0.0%) | 0 (0.0%) |
Income Below Poverty Among Married-Couple vs Single-Parent Households in Andersonville
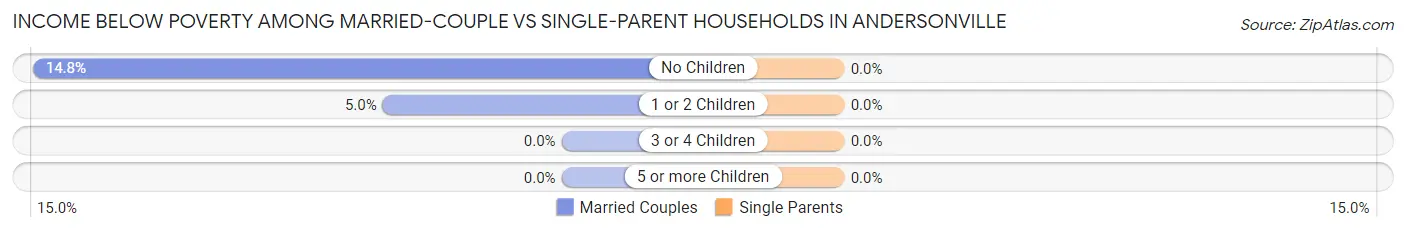
| Children | Married-Couple Families | Single-Parent Households |
| No Children | 13 (14.8%) | 0 (0.0%) |
| 1 or 2 Children | 1 (5.0%) | 0 (0.0%) |
| 3 or 4 Children | 0 (0.0%) | 0 (0.0%) |
| 5 or more Children | 0 (0.0%) | 0 (0.0%) |
| Total | 14 (11.5%) | 0 (0.0%) |
Employment Characteristics in Andersonville
Employment by Class of Employer in Andersonville
Among the 155 employed individuals in Andersonville, private company employees (96 | 61.9%), not-for-profit organizations (17 | 11.0%), and local government employees (16 | 10.3%) make up the most common classes of employment.
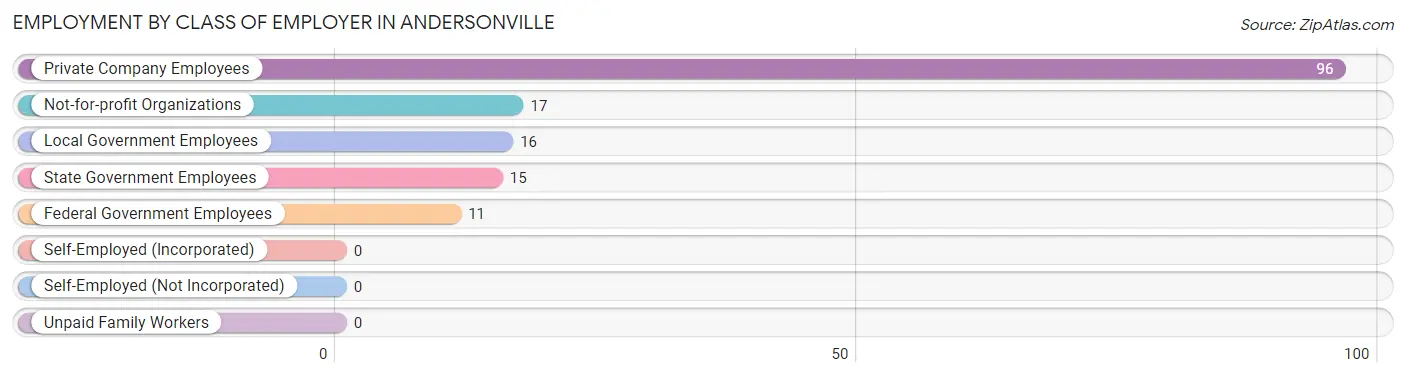
| Employer Class | # Employees | % Employees |
| Private Company Employees | 96 | 61.9% |
| Self-Employed (Incorporated) | 0 | 0.0% |
| Self-Employed (Not Incorporated) | 0 | 0.0% |
| Not-for-profit Organizations | 17 | 11.0% |
| Local Government Employees | 16 | 10.3% |
| State Government Employees | 15 | 9.7% |
| Federal Government Employees | 11 | 7.1% |
| Unpaid Family Workers | 0 | 0.0% |
| Total | 155 | 100.0% |
Employment Status by Age in Andersonville
According to the labor force statistics for Andersonville, out of the total population over 16 years of age (377), 44.3% or 167 individuals are in the labor force, with 3.6% or 6 of them unemployed. The age group with the highest labor force participation rate is 25 to 29 years, with 100.0% or 9 individuals in the labor force. Within the labor force, the 20 to 24 years age range has the highest percentage of unemployed individuals, with 26.1% or 6 of them being unemployed.
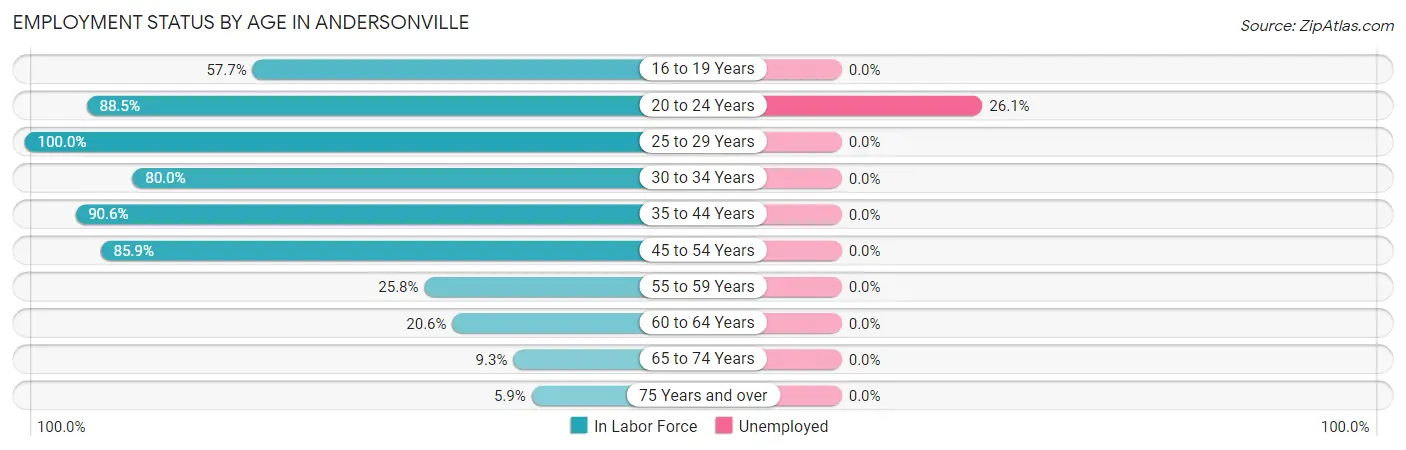
| Age Bracket | In Labor Force | Unemployed |
| 16 to 19 Years | 15 (57.7%) | 0 (0.0%) |
| 20 to 24 Years | 23 (88.5%) | 6 (26.1%) |
| 25 to 29 Years | 9 (100.0%) | 0 (0.0%) |
| 30 to 34 Years | 4 (80.0%) | 0 (0.0%) |
| 35 to 44 Years | 29 (90.6%) | 0 (0.0%) |
| 45 to 54 Years | 61 (85.9%) | 0 (0.0%) |
| 55 to 59 Years | 8 (25.8%) | 0 (0.0%) |
| 60 to 64 Years | 7 (20.6%) | 0 (0.0%) |
| 65 to 74 Years | 7 (9.3%) | 0 (0.0%) |
| 75 Years and over | 4 (5.9%) | 0 (0.0%) |
| Total | 167 (44.3%) | 6 (3.6%) |
Employment Status by Educational Attainment in Andersonville
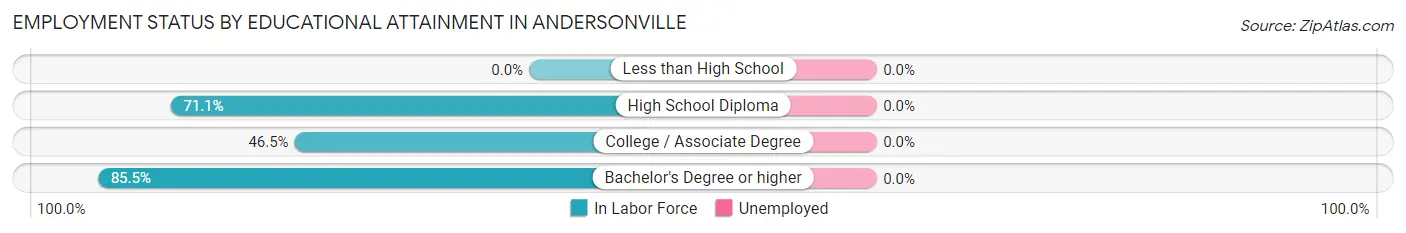
| Educational Attainment | In Labor Force | Unemployed |
| Less than High School | 0 (0.0%) | 0 (0.0%) |
| High School Diploma | 32 (71.1%) | 0 (0.0%) |
| College / Associate Degree | 33 (46.5%) | 0 (0.0%) |
| Bachelor's Degree or higher | 53 (85.5%) | 0 (0.0%) |
| Total | 118 (64.8%) | 0 (0.0%) |
Employment Occupations by Sex in Andersonville
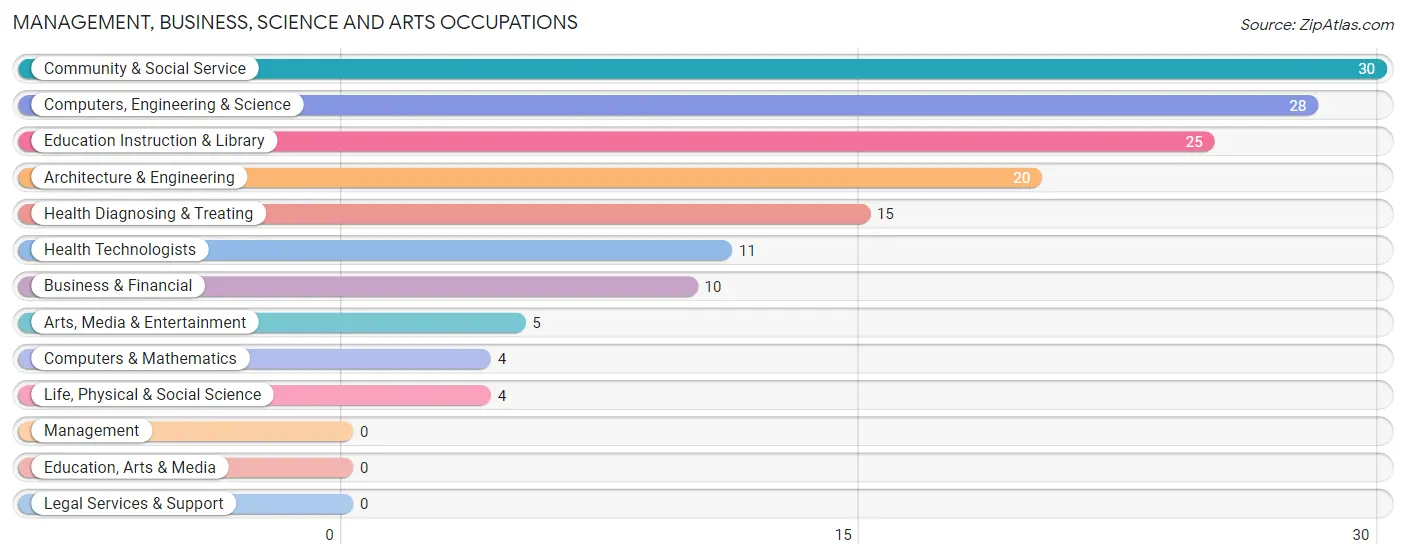
Management, Business, Science and Arts Occupations
The most common Management, Business, Science and Arts occupations in Andersonville are Community & Social Service (30 | 18.6%), Computers, Engineering & Science (28 | 17.4%), Education Instruction & Library (25 | 15.5%), Architecture & Engineering (20 | 12.4%), and Health Diagnosing & Treating (15 | 9.3%).
Management, Business, Science and Arts Occupations by Sex
Within the Management, Business, Science and Arts occupations in Andersonville, the most male-oriented occupations are Business & Financial (100.0%), Computers & Mathematics (100.0%), and Architecture & Engineering (100.0%), while the most female-oriented occupations are Life, Physical & Social Science (100.0%), Health Diagnosing & Treating (100.0%), and Health Technologists (100.0%).
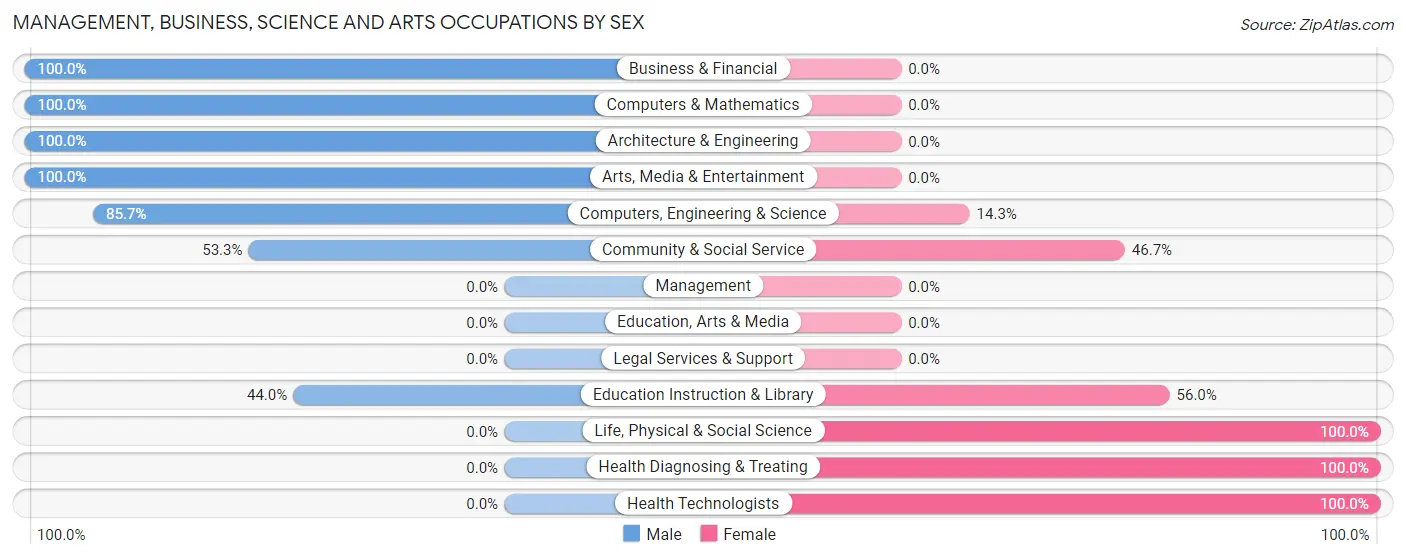
| Occupation | Male | Female |
| Management | 0 (0.0%) | 0 (0.0%) |
| Business & Financial | 10 (100.0%) | 0 (0.0%) |
| Computers, Engineering & Science | 24 (85.7%) | 4 (14.3%) |
| Computers & Mathematics | 4 (100.0%) | 0 (0.0%) |
| Architecture & Engineering | 20 (100.0%) | 0 (0.0%) |
| Life, Physical & Social Science | 0 (0.0%) | 4 (100.0%) |
| Community & Social Service | 16 (53.3%) | 14 (46.7%) |
| Education, Arts & Media | 0 (0.0%) | 0 (0.0%) |
| Legal Services & Support | 0 (0.0%) | 0 (0.0%) |
| Education Instruction & Library | 11 (44.0%) | 14 (56.0%) |
| Arts, Media & Entertainment | 5 (100.0%) | 0 (0.0%) |
| Health Diagnosing & Treating | 0 (0.0%) | 15 (100.0%) |
| Health Technologists | 0 (0.0%) | 11 (100.0%) |
| Total (Category) | 50 (60.2%) | 33 (39.8%) |
| Total (Overall) | 86 (53.4%) | 75 (46.6%) |
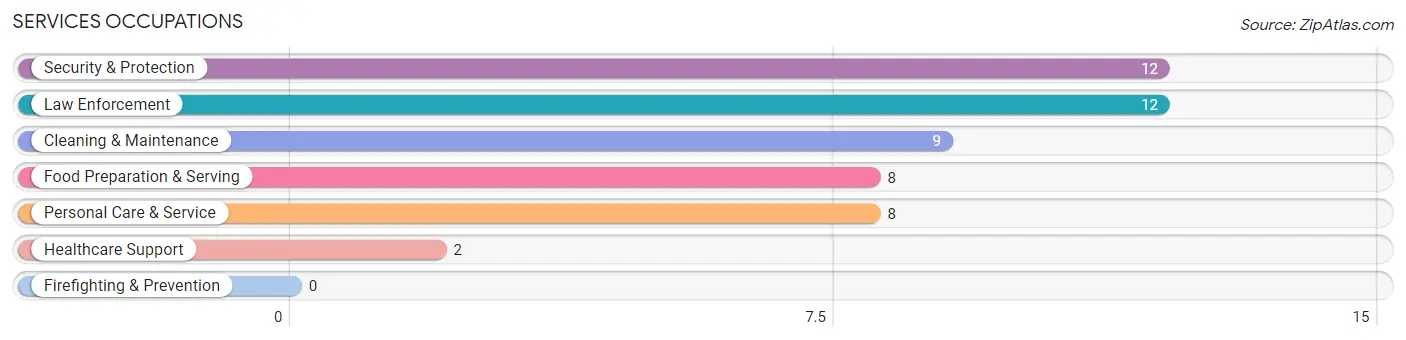
Services Occupations
The most common Services occupations in Andersonville are Security & Protection (12 | 7.4%), Law Enforcement (12 | 7.4%), Cleaning & Maintenance (9 | 5.6%), Food Preparation & Serving (8 | 5.0%), and Personal Care & Service (8 | 5.0%).
Services Occupations by Sex
Within the Services occupations in Andersonville, the most male-oriented occupations are Cleaning & Maintenance (100.0%), Security & Protection (66.7%), and Law Enforcement (66.7%), while the most female-oriented occupations are Healthcare Support (100.0%), Food Preparation & Serving (100.0%), and Personal Care & Service (100.0%).
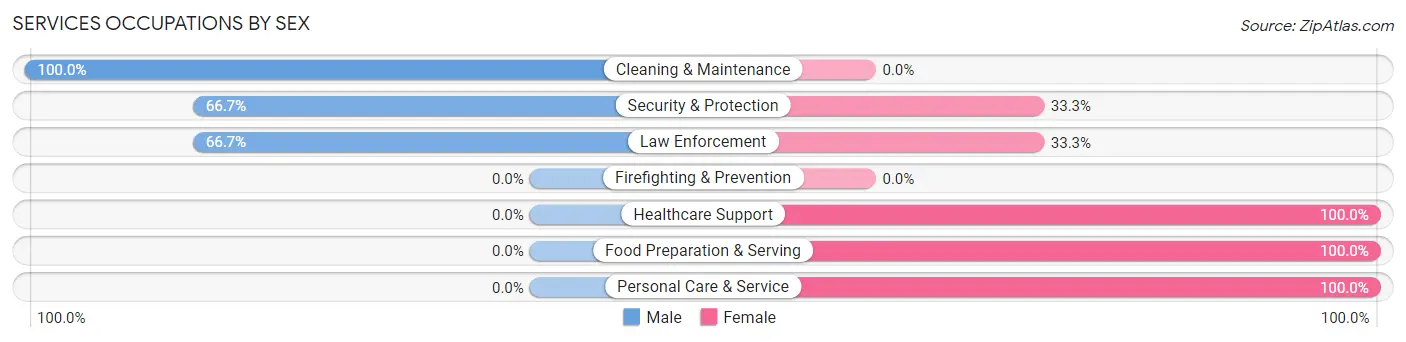
| Occupation | Male | Female |
| Healthcare Support | 0 (0.0%) | 2 (100.0%) |
| Security & Protection | 8 (66.7%) | 4 (33.3%) |
| Firefighting & Prevention | 0 (0.0%) | 0 (0.0%) |
| Law Enforcement | 8 (66.7%) | 4 (33.3%) |
| Food Preparation & Serving | 0 (0.0%) | 8 (100.0%) |
| Cleaning & Maintenance | 9 (100.0%) | 0 (0.0%) |
| Personal Care & Service | 0 (0.0%) | 8 (100.0%) |
| Total (Category) | 17 (43.6%) | 22 (56.4%) |
| Total (Overall) | 86 (53.4%) | 75 (46.6%) |
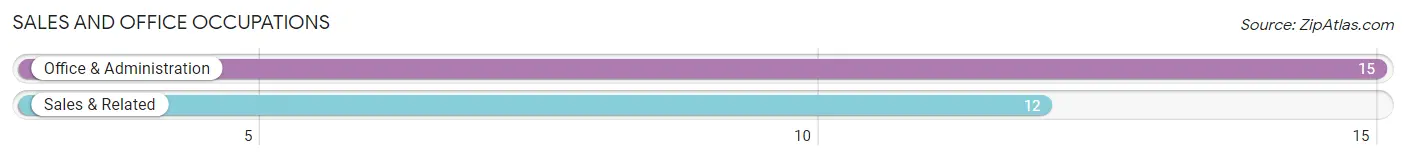
Sales and Office Occupations
The most common Sales and Office occupations in Andersonville are Office & Administration (15 | 9.3%), and Sales & Related (12 | 7.4%).
Sales and Office Occupations by Sex
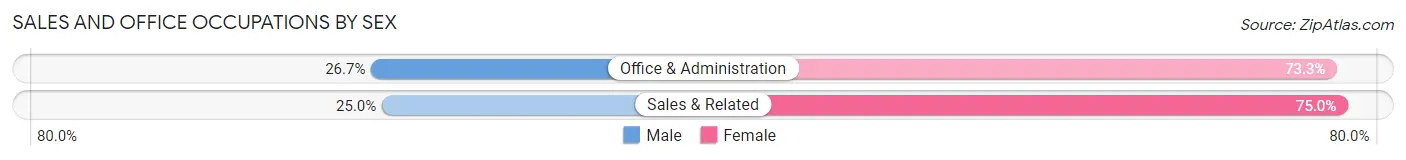
| Occupation | Male | Female |
| Sales & Related | 3 (25.0%) | 9 (75.0%) |
| Office & Administration | 4 (26.7%) | 11 (73.3%) |
| Total (Category) | 7 (25.9%) | 20 (74.1%) |
| Total (Overall) | 86 (53.4%) | 75 (46.6%) |
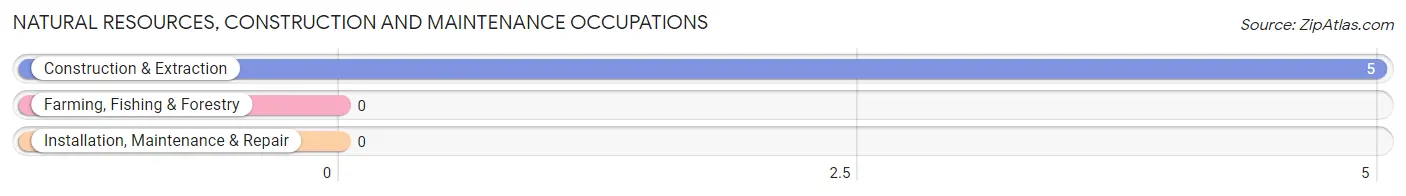
Natural Resources, Construction and Maintenance Occupations
The most common Natural Resources, Construction and Maintenance occupations in Andersonville are , and Construction & Extraction (5 | 3.1%).
Natural Resources, Construction and Maintenance Occupations by Sex
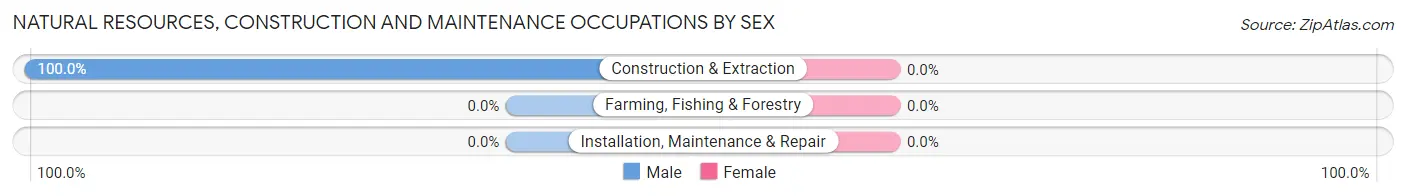
| Occupation | Male | Female |
| Farming, Fishing & Forestry | 0 (0.0%) | 0 (0.0%) |
| Construction & Extraction | 5 (100.0%) | 0 (0.0%) |
| Installation, Maintenance & Repair | 0 (0.0%) | 0 (0.0%) |
| Total (Category) | 5 (100.0%) | 0 (0.0%) |
| Total (Overall) | 86 (53.4%) | 75 (46.6%) |
Production, Transportation and Moving Occupations
The most common Production, Transportation and Moving occupations in Andersonville are Transportation (4 | 2.5%), and Production (3 | 1.9%).
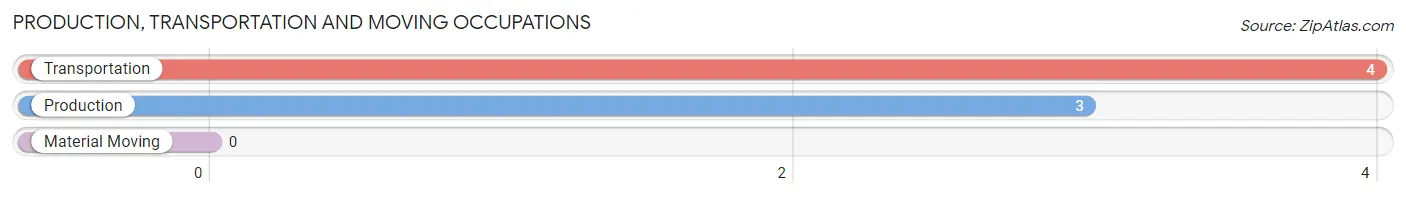
Production, Transportation and Moving Occupations by Sex
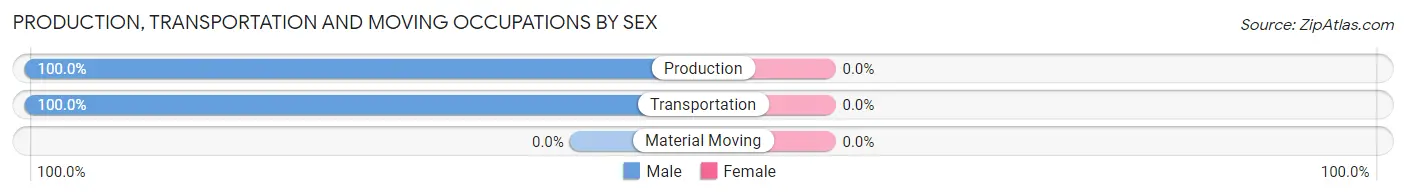
| Occupation | Male | Female |
| Production | 3 (100.0%) | 0 (0.0%) |
| Transportation | 4 (100.0%) | 0 (0.0%) |
| Material Moving | 0 (0.0%) | 0 (0.0%) |
| Total (Category) | 7 (100.0%) | 0 (0.0%) |
| Total (Overall) | 86 (53.4%) | 75 (46.6%) |
Employment Industries by Sex in Andersonville
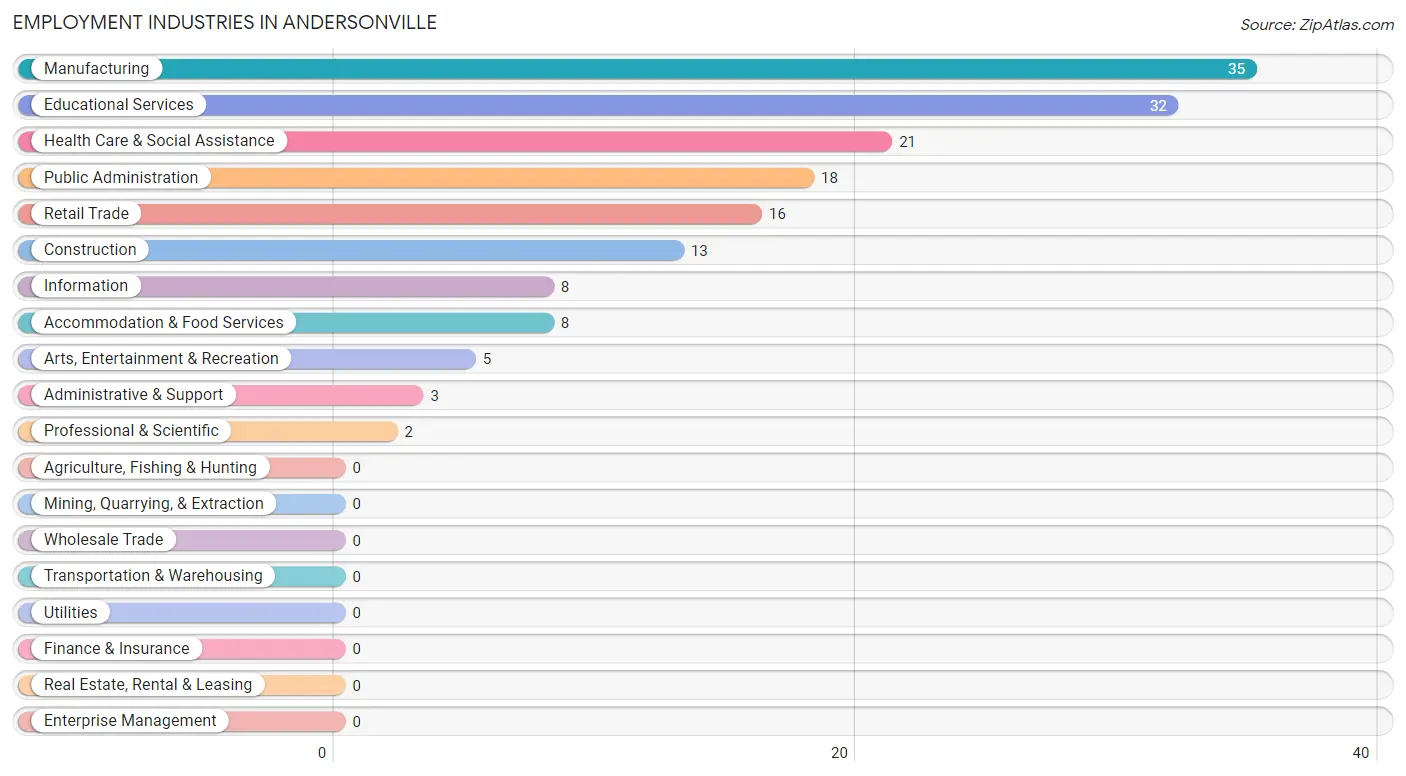
Employment Industries in Andersonville
The major employment industries in Andersonville include Manufacturing (35 | 21.7%), Educational Services (32 | 19.9%), Health Care & Social Assistance (21 | 13.0%), Public Administration (18 | 11.2%), and Retail Trade (16 | 9.9%).
Employment Industries by Sex in Andersonville
The Andersonville industries that see more men than women are Construction (100.0%), Professional & Scientific (100.0%), and Administrative & Support (100.0%), whereas the industries that tend to have a higher number of women are Information (100.0%), Retail Trade (81.2%), and Health Care & Social Assistance (80.9%).
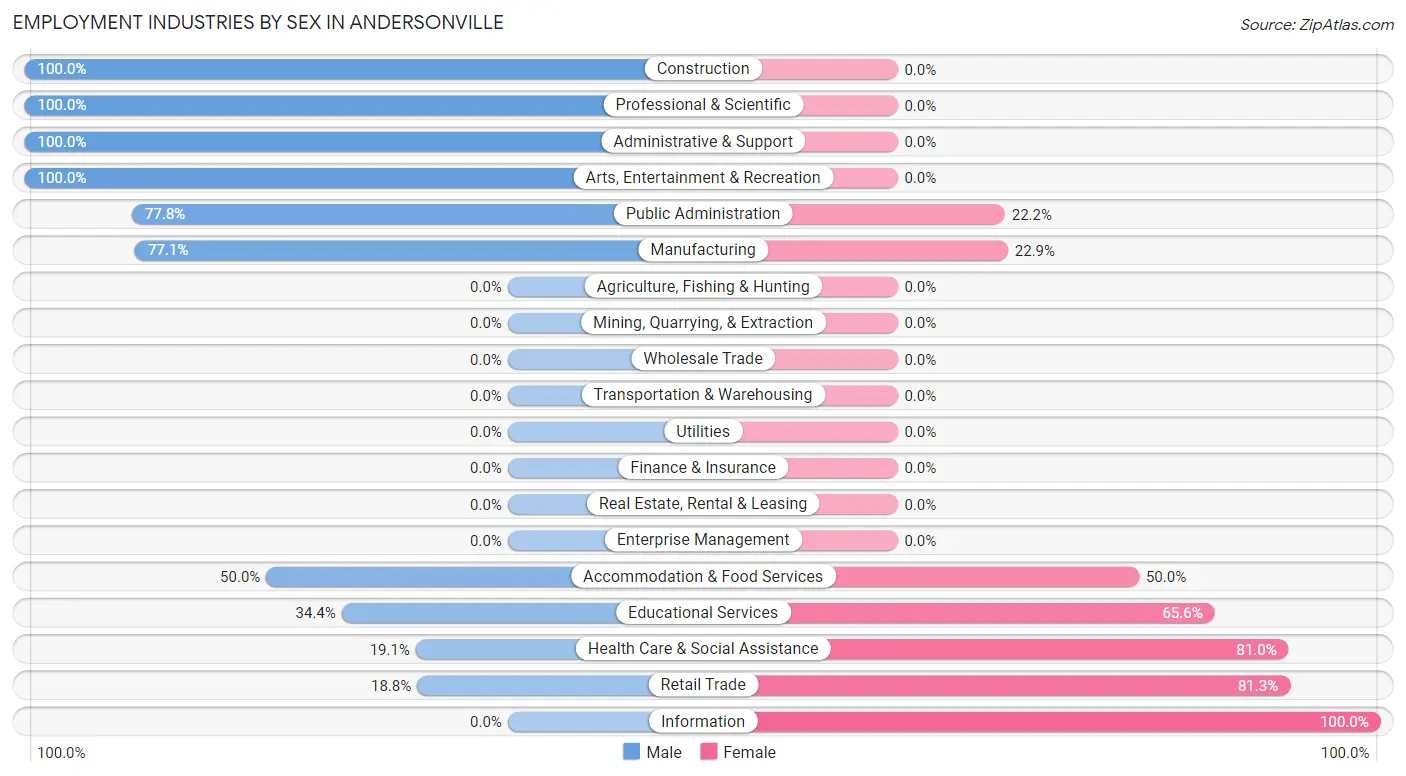
| Industry | Male | Female |
| Agriculture, Fishing & Hunting | 0 (0.0%) | 0 (0.0%) |
| Mining, Quarrying, & Extraction | 0 (0.0%) | 0 (0.0%) |
| Construction | 13 (100.0%) | 0 (0.0%) |
| Manufacturing | 27 (77.1%) | 8 (22.9%) |
| Wholesale Trade | 0 (0.0%) | 0 (0.0%) |
| Retail Trade | 3 (18.8%) | 13 (81.2%) |
| Transportation & Warehousing | 0 (0.0%) | 0 (0.0%) |
| Utilities | 0 (0.0%) | 0 (0.0%) |
| Information | 0 (0.0%) | 8 (100.0%) |
| Finance & Insurance | 0 (0.0%) | 0 (0.0%) |
| Real Estate, Rental & Leasing | 0 (0.0%) | 0 (0.0%) |
| Professional & Scientific | 2 (100.0%) | 0 (0.0%) |
| Enterprise Management | 0 (0.0%) | 0 (0.0%) |
| Administrative & Support | 3 (100.0%) | 0 (0.0%) |
| Educational Services | 11 (34.4%) | 21 (65.6%) |
| Health Care & Social Assistance | 4 (19.1%) | 17 (80.9%) |
| Arts, Entertainment & Recreation | 5 (100.0%) | 0 (0.0%) |
| Accommodation & Food Services | 4 (50.0%) | 4 (50.0%) |
| Public Administration | 14 (77.8%) | 4 (22.2%) |
| Total | 86 (53.4%) | 75 (46.6%) |
Education in Andersonville
School Enrollment in Andersonville
The most common levels of schooling among the 84 students in Andersonville are high school (31 | 36.9%), middle school (24 | 28.6%), and elementary school (14 | 16.7%).
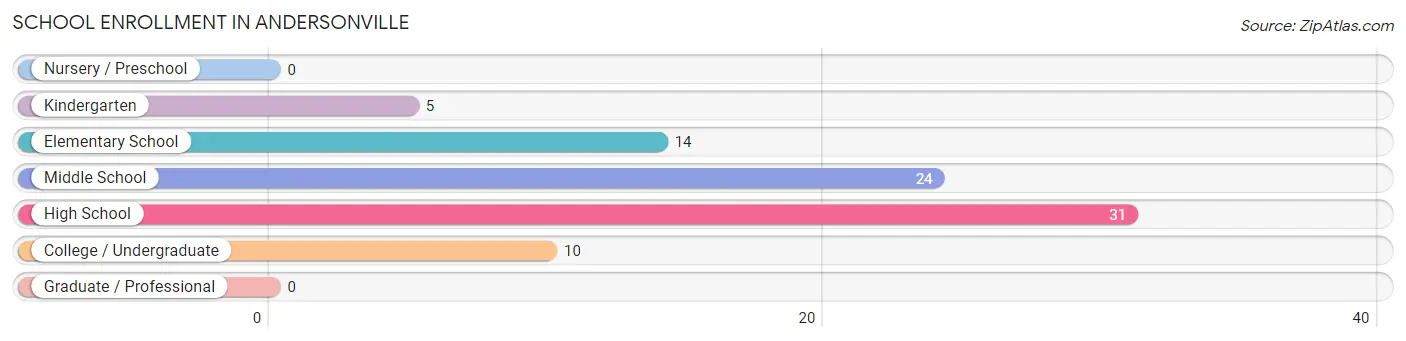
| School Level | # Students | % Students |
| Nursery / Preschool | 0 | 0.0% |
| Kindergarten | 5 | 5.9% |
| Elementary School | 14 | 16.7% |
| Middle School | 24 | 28.6% |
| High School | 31 | 36.9% |
| College / Undergraduate | 10 | 11.9% |
| Graduate / Professional | 0 | 0.0% |
| Total | 84 | 100.0% |
School Enrollment by Age by Funding Source in Andersonville
Out of a total of 84 students who are enrolled in schools in Andersonville, 2 (2.4%) attend a private institution, while the remaining 82 (97.6%) are enrolled in public schools. The age group of 10 to 14 year olds has the highest likelihood of being enrolled in private schools, with 2 (6.5% in the age bracket) enrolled. Conversely, the age group of 5 to 9 year old has the lowest likelihood of being enrolled in a private school, with 19 (100.0% in the age bracket) attending a public institution.
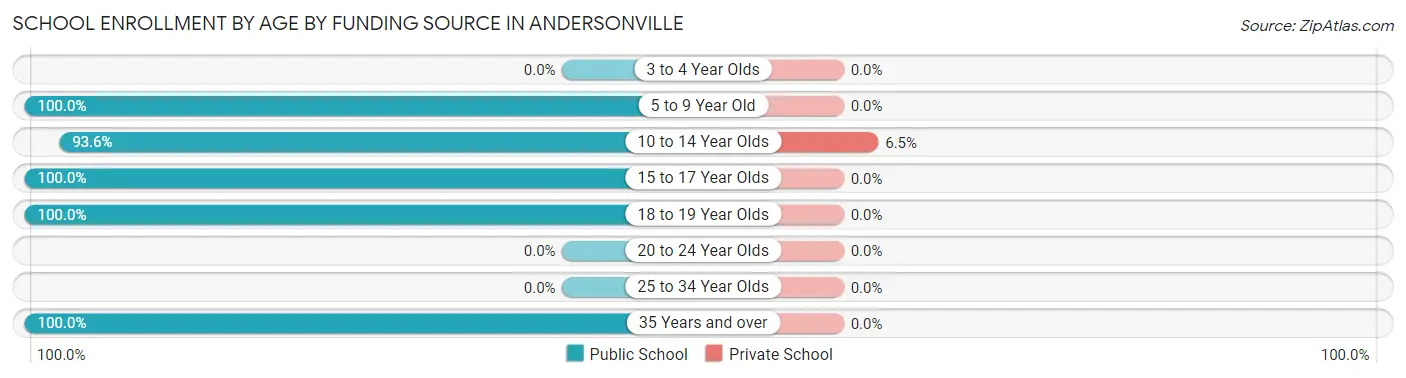
| Age Bracket | Public School | Private School |
| 3 to 4 Year Olds | 0 (0.0%) | 0 (0.0%) |
| 5 to 9 Year Old | 19 (100.0%) | 0 (0.0%) |
| 10 to 14 Year Olds | 29 (93.5%) | 2 (6.5%) |
| 15 to 17 Year Olds | 24 (100.0%) | 0 (0.0%) |
| 18 to 19 Year Olds | 4 (100.0%) | 0 (0.0%) |
| 20 to 24 Year Olds | 0 (0.0%) | 0 (0.0%) |
| 25 to 34 Year Olds | 0 (0.0%) | 0 (0.0%) |
| 35 Years and over | 6 (100.0%) | 0 (0.0%) |
| Total | 82 (97.6%) | 2 (2.4%) |
Educational Attainment by Field of Study in Andersonville
Education (44 | 42.3%), engineering (18 | 17.3%), business (10 | 9.6%), science & technology (7 | 6.7%), and bio, nature & agricultural (6 | 5.8%) are the most common fields of study among 104 individuals in Andersonville who have obtained a bachelor's degree or higher.
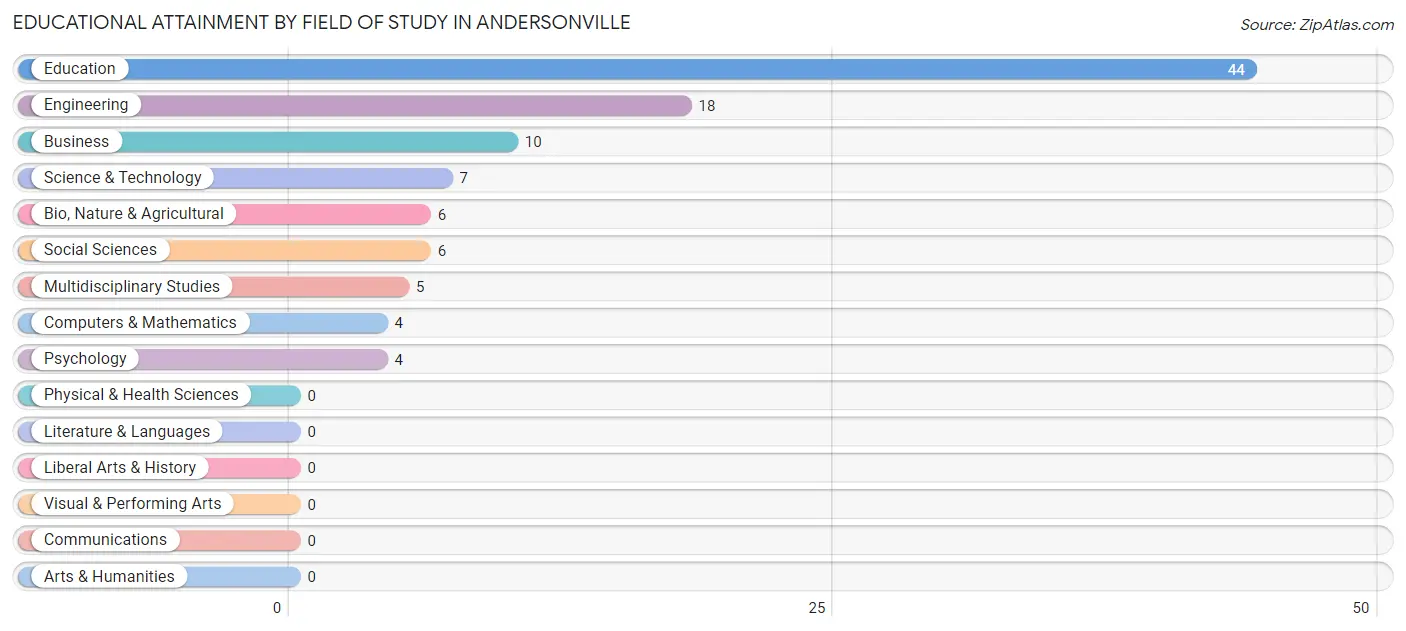
| Field of Study | # Graduates | % Graduates |
| Computers & Mathematics | 4 | 3.8% |
| Bio, Nature & Agricultural | 6 | 5.8% |
| Physical & Health Sciences | 0 | 0.0% |
| Psychology | 4 | 3.8% |
| Social Sciences | 6 | 5.8% |
| Engineering | 18 | 17.3% |
| Multidisciplinary Studies | 5 | 4.8% |
| Science & Technology | 7 | 6.7% |
| Business | 10 | 9.6% |
| Education | 44 | 42.3% |
| Literature & Languages | 0 | 0.0% |
| Liberal Arts & History | 0 | 0.0% |
| Visual & Performing Arts | 0 | 0.0% |
| Communications | 0 | 0.0% |
| Arts & Humanities | 0 | 0.0% |
| Total | 104 | 100.0% |
Transportation & Commute in Andersonville
Vehicle Availability by Sex in Andersonville
The most prevalent vehicle ownership categories in Andersonville are males with 4 vehicles (36, accounting for 45.0%) and females with 4 vehicles (38, making up 48.0%).
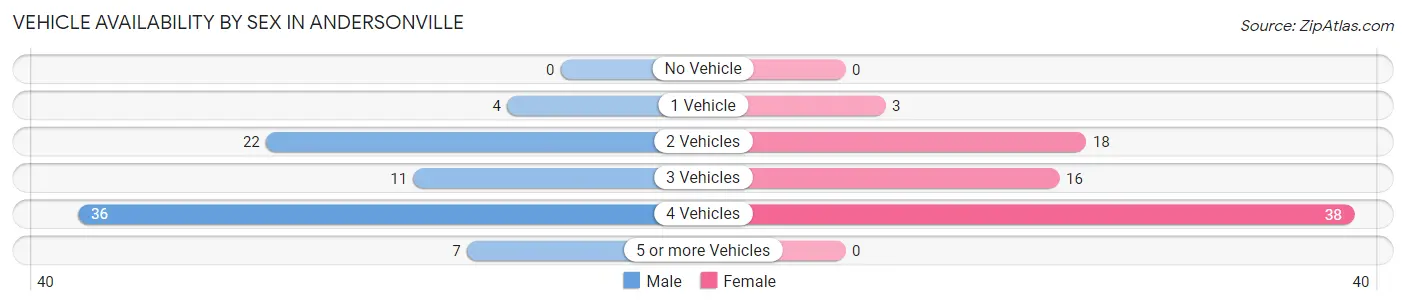
| Vehicles Available | Male | Female |
| No Vehicle | 0 (0.0%) | 0 (0.0%) |
| 1 Vehicle | 4 (5.0%) | 3 (4.0%) |
| 2 Vehicles | 22 (27.5%) | 18 (24.0%) |
| 3 Vehicles | 11 (13.8%) | 16 (21.3%) |
| 4 Vehicles | 36 (45.0%) | 38 (50.7%) |
| 5 or more Vehicles | 7 (8.7%) | 0 (0.0%) |
| Total | 80 (100.0%) | 75 (100.0%) |
Commute Time in Andersonville
The most frequently occuring commute durations in Andersonville are 15 to 19 minutes (62 commuters, 44.3%), 20 to 24 minutes (23 commuters, 16.4%), and 60 to 89 minutes (15 commuters, 10.7%).
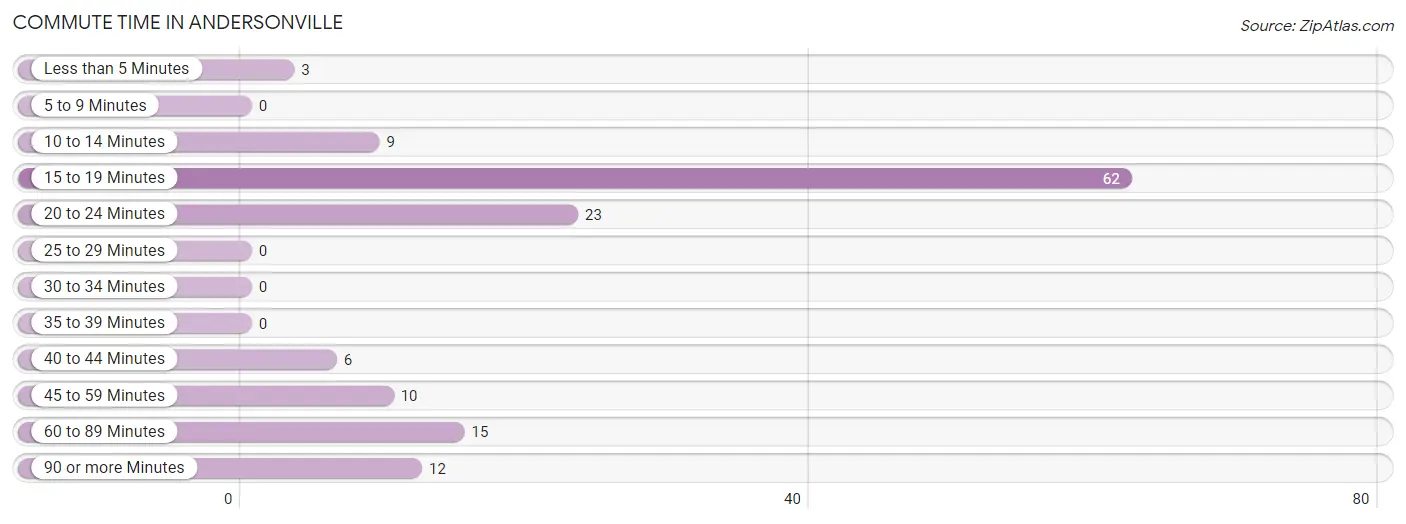
| Commute Time | # Commuters | % Commuters |
| Less than 5 Minutes | 3 | 2.1% |
| 5 to 9 Minutes | 0 | 0.0% |
| 10 to 14 Minutes | 9 | 6.4% |
| 15 to 19 Minutes | 62 | 44.3% |
| 20 to 24 Minutes | 23 | 16.4% |
| 25 to 29 Minutes | 0 | 0.0% |
| 30 to 34 Minutes | 0 | 0.0% |
| 35 to 39 Minutes | 0 | 0.0% |
| 40 to 44 Minutes | 6 | 4.3% |
| 45 to 59 Minutes | 10 | 7.1% |
| 60 to 89 Minutes | 15 | 10.7% |
| 90 or more Minutes | 12 | 8.6% |
Commute Time by Sex in Andersonville
The most common commute times in Andersonville are 15 to 19 minutes (18 commuters, 23.7%) for males and 15 to 19 minutes (44 commuters, 68.8%) for females.
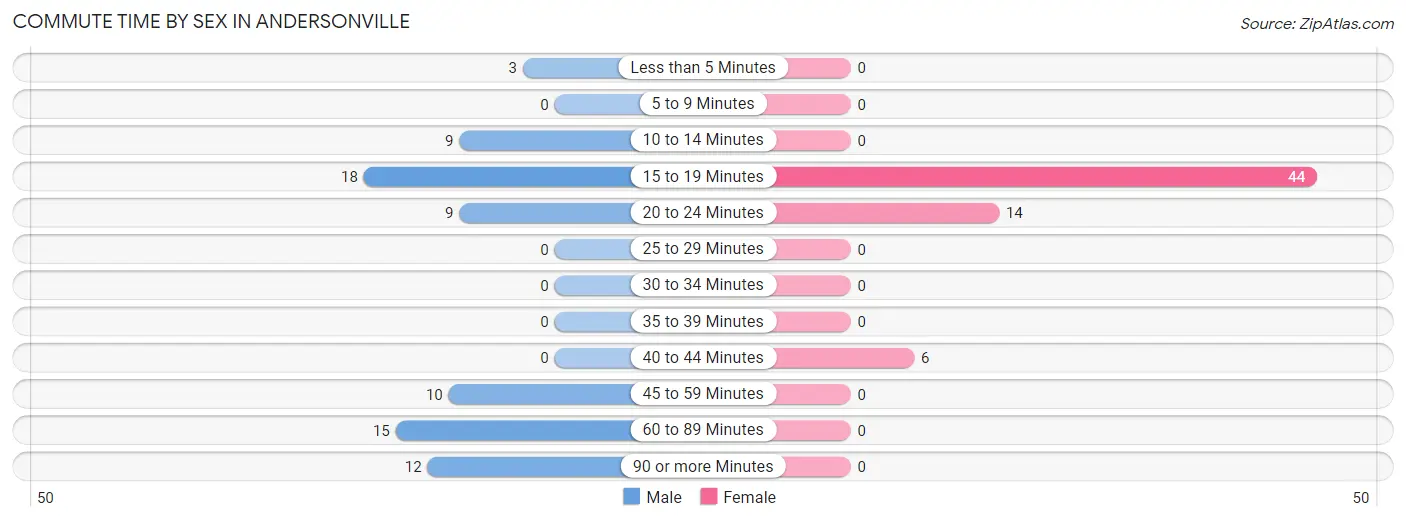
| Commute Time | Male | Female |
| Less than 5 Minutes | 3 (4.0%) | 0 (0.0%) |
| 5 to 9 Minutes | 0 (0.0%) | 0 (0.0%) |
| 10 to 14 Minutes | 9 (11.8%) | 0 (0.0%) |
| 15 to 19 Minutes | 18 (23.7%) | 44 (68.8%) |
| 20 to 24 Minutes | 9 (11.8%) | 14 (21.9%) |
| 25 to 29 Minutes | 0 (0.0%) | 0 (0.0%) |
| 30 to 34 Minutes | 0 (0.0%) | 0 (0.0%) |
| 35 to 39 Minutes | 0 (0.0%) | 0 (0.0%) |
| 40 to 44 Minutes | 0 (0.0%) | 6 (9.4%) |
| 45 to 59 Minutes | 10 (13.2%) | 0 (0.0%) |
| 60 to 89 Minutes | 15 (19.7%) | 0 (0.0%) |
| 90 or more Minutes | 12 (15.8%) | 0 (0.0%) |
Time of Departure to Work by Sex in Andersonville
The most frequent times of departure to work in Andersonville are 7:00 AM to 7:29 AM (19, 25.0%) for males and 7:30 AM to 7:59 AM (31, 48.4%) for females.
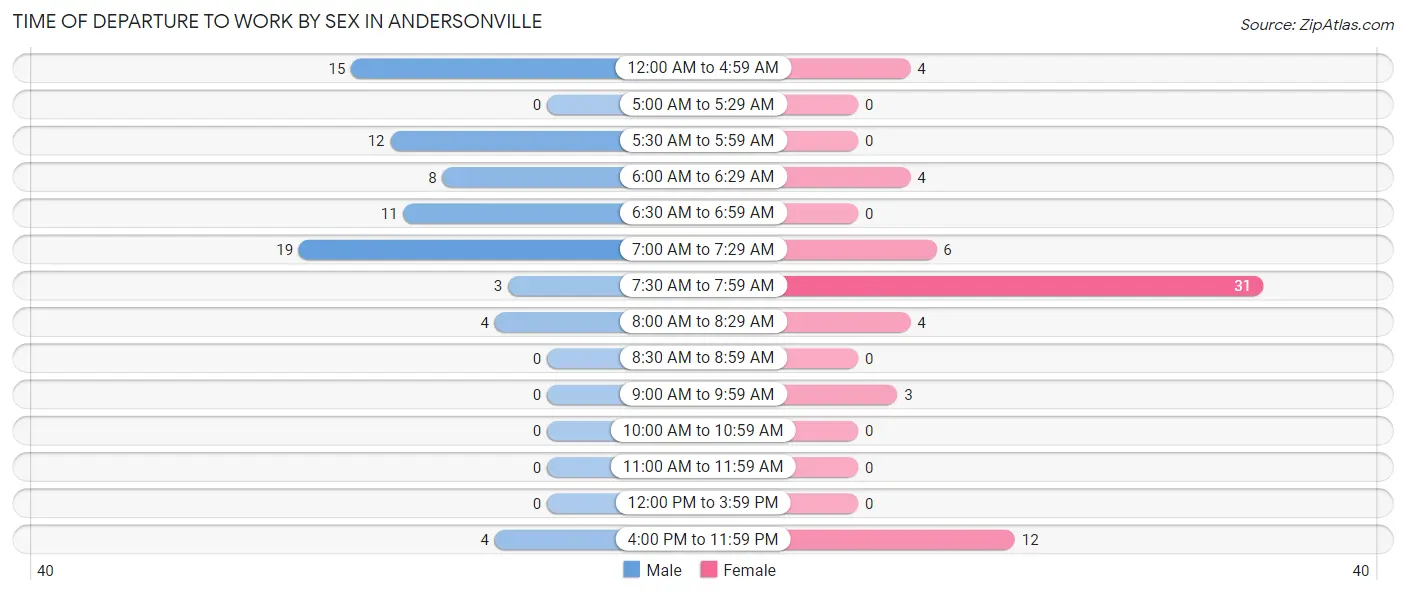
| Time of Departure | Male | Female |
| 12:00 AM to 4:59 AM | 15 (19.7%) | 4 (6.2%) |
| 5:00 AM to 5:29 AM | 0 (0.0%) | 0 (0.0%) |
| 5:30 AM to 5:59 AM | 12 (15.8%) | 0 (0.0%) |
| 6:00 AM to 6:29 AM | 8 (10.5%) | 4 (6.2%) |
| 6:30 AM to 6:59 AM | 11 (14.5%) | 0 (0.0%) |
| 7:00 AM to 7:29 AM | 19 (25.0%) | 6 (9.4%) |
| 7:30 AM to 7:59 AM | 3 (4.0%) | 31 (48.4%) |
| 8:00 AM to 8:29 AM | 4 (5.3%) | 4 (6.2%) |
| 8:30 AM to 8:59 AM | 0 (0.0%) | 0 (0.0%) |
| 9:00 AM to 9:59 AM | 0 (0.0%) | 3 (4.7%) |
| 10:00 AM to 10:59 AM | 0 (0.0%) | 0 (0.0%) |
| 11:00 AM to 11:59 AM | 0 (0.0%) | 0 (0.0%) |
| 12:00 PM to 3:59 PM | 0 (0.0%) | 0 (0.0%) |
| 4:00 PM to 11:59 PM | 4 (5.3%) | 12 (18.8%) |
| Total | 76 (100.0%) | 64 (100.0%) |
Housing Occupancy in Andersonville
Occupancy by Ownership in Andersonville
Of the total 172 dwellings in Andersonville, owner-occupied units account for 171 (99.4%), while renter-occupied units make up 1 (0.6%).

| Occupancy | # Housing Units | % Housing Units |
| Owner Occupied Housing Units | 171 | 99.4% |
| Renter-Occupied Housing Units | 1 | 0.6% |
| Total Occupied Housing Units | 172 | 100.0% |
Occupancy by Household Size in Andersonville
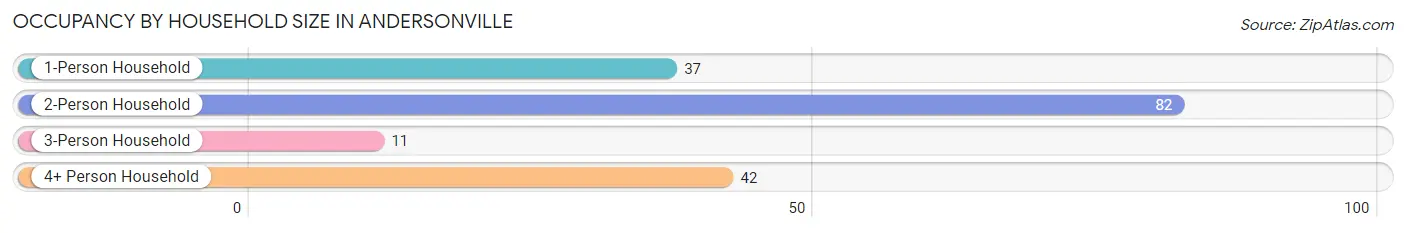
| Household Size | # Housing Units | % Housing Units |
| 1-Person Household | 37 | 21.5% |
| 2-Person Household | 82 | 47.7% |
| 3-Person Household | 11 | 6.4% |
| 4+ Person Household | 42 | 24.4% |
| Total Housing Units | 172 | 100.0% |
Occupancy by Ownership by Household Size in Andersonville
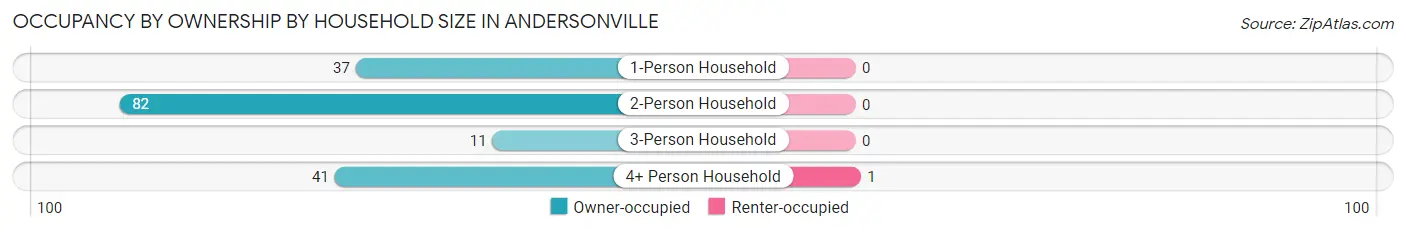
| Household Size | Owner-occupied | Renter-occupied |
| 1-Person Household | 37 (100.0%) | 0 (0.0%) |
| 2-Person Household | 82 (100.0%) | 0 (0.0%) |
| 3-Person Household | 11 (100.0%) | 0 (0.0%) |
| 4+ Person Household | 41 (97.6%) | 1 (2.4%) |
| Total Housing Units | 171 (99.4%) | 1 (0.6%) |
Occupancy by Educational Attainment in Andersonville
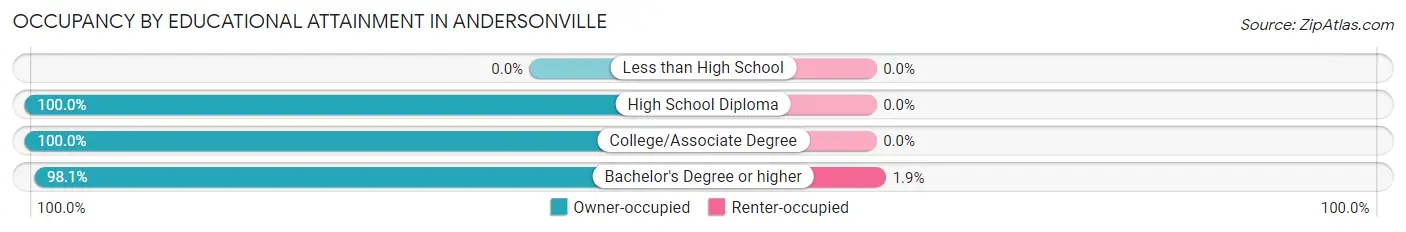
| Household Size | Owner-occupied | Renter-occupied |
| Less than High School | 0 (0.0%) | 0 (0.0%) |
| High School Diploma | 73 (100.0%) | 0 (0.0%) |
| College/Associate Degree | 46 (100.0%) | 0 (0.0%) |
| Bachelor's Degree or higher | 52 (98.1%) | 1 (1.9%) |
Occupancy by Age of Householder in Andersonville
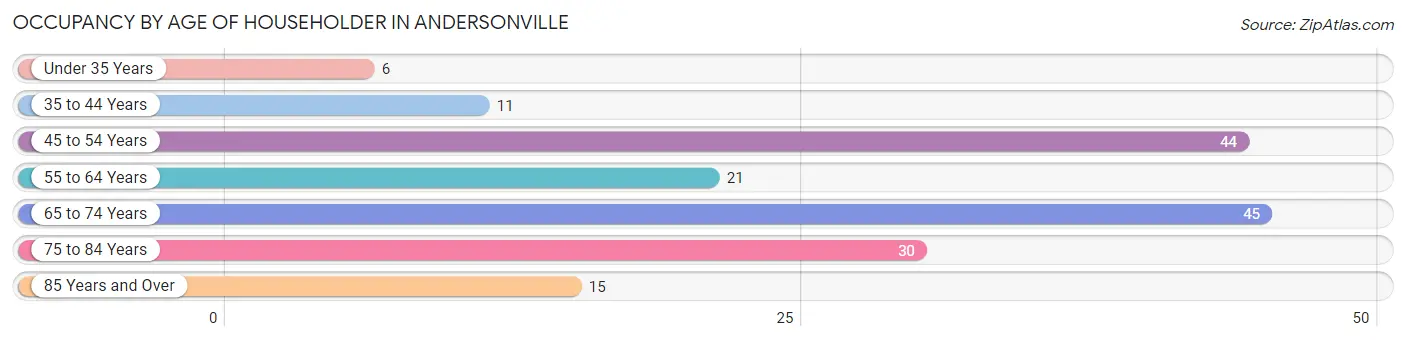
| Age Bracket | # Households | % Households |
| Under 35 Years | 6 | 3.5% |
| 35 to 44 Years | 11 | 6.4% |
| 45 to 54 Years | 44 | 25.6% |
| 55 to 64 Years | 21 | 12.2% |
| 65 to 74 Years | 45 | 26.2% |
| 75 to 84 Years | 30 | 17.4% |
| 85 Years and Over | 15 | 8.7% |
| Total | 172 | 100.0% |
Housing Finances in Andersonville
Median Income by Occupancy in Andersonville
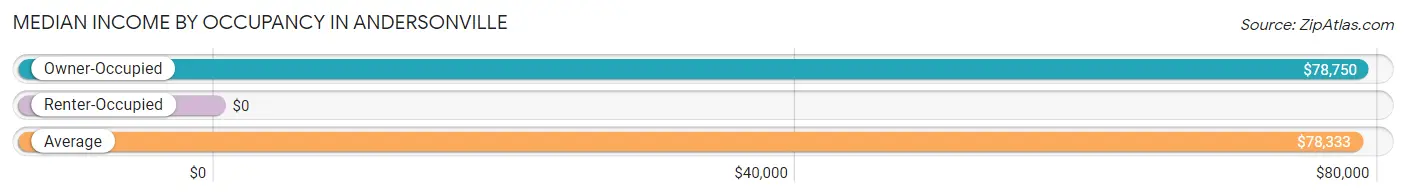
| Occupancy Type | # Households | Median Income |
| Owner-Occupied | 171 (99.4%) | $78,750 |
| Renter-Occupied | 1 (0.6%) | $0 |
| Average | 172 (100.0%) | $78,333 |
Occupancy by Householder Income Bracket in Andersonville
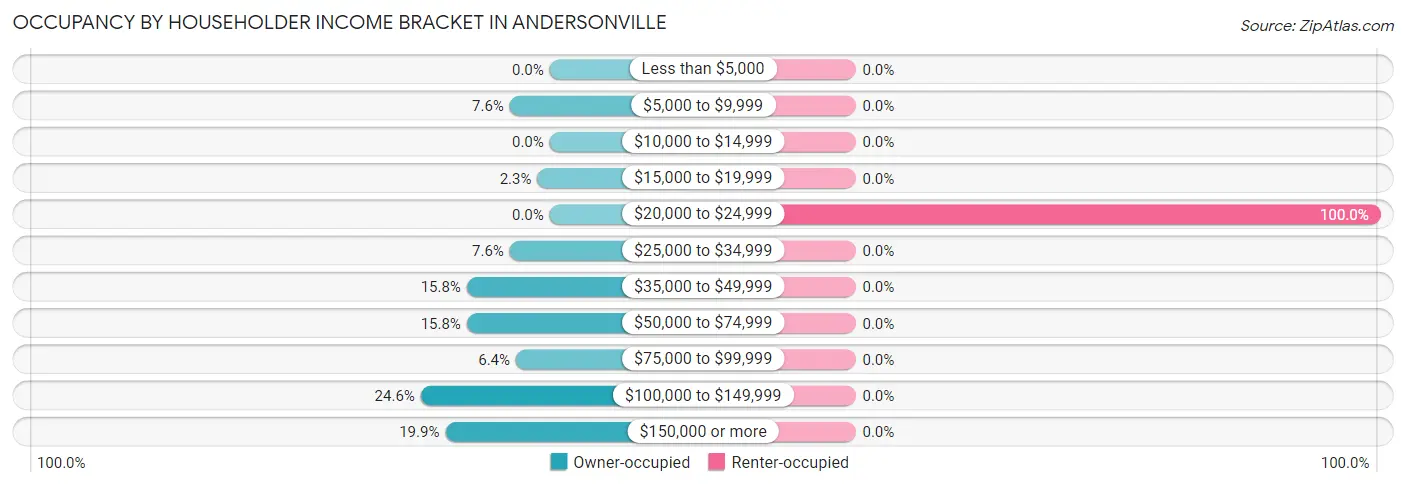
| Income Bracket | Owner-occupied | Renter-occupied |
| Less than $5,000 | 0 (0.0%) | 0 (0.0%) |
| $5,000 to $9,999 | 13 (7.6%) | 0 (0.0%) |
| $10,000 to $14,999 | 0 (0.0%) | 0 (0.0%) |
| $15,000 to $19,999 | 4 (2.3%) | 0 (0.0%) |
| $20,000 to $24,999 | 0 (0.0%) | 1 (100.0%) |
| $25,000 to $34,999 | 13 (7.6%) | 0 (0.0%) |
| $35,000 to $49,999 | 27 (15.8%) | 0 (0.0%) |
| $50,000 to $74,999 | 27 (15.8%) | 0 (0.0%) |
| $75,000 to $99,999 | 11 (6.4%) | 0 (0.0%) |
| $100,000 to $149,999 | 42 (24.6%) | 0 (0.0%) |
| $150,000 or more | 34 (19.9%) | 0 (0.0%) |
| Total | 171 (100.0%) | 1 (100.0%) |
Monthly Housing Cost Tiers in Andersonville
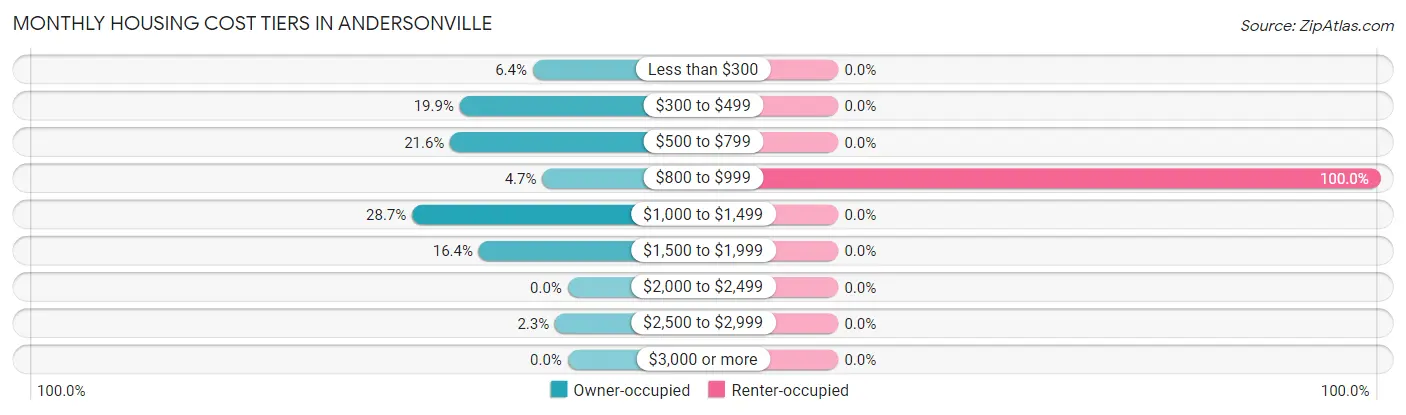
| Monthly Cost | Owner-occupied | Renter-occupied |
| Less than $300 | 11 (6.4%) | 0 (0.0%) |
| $300 to $499 | 34 (19.9%) | 0 (0.0%) |
| $500 to $799 | 37 (21.6%) | 0 (0.0%) |
| $800 to $999 | 8 (4.7%) | 1 (100.0%) |
| $1,000 to $1,499 | 49 (28.6%) | 0 (0.0%) |
| $1,500 to $1,999 | 28 (16.4%) | 0 (0.0%) |
| $2,000 to $2,499 | 0 (0.0%) | 0 (0.0%) |
| $2,500 to $2,999 | 4 (2.3%) | 0 (0.0%) |
| $3,000 or more | 0 (0.0%) | 0 (0.0%) |
| Total | 171 (100.0%) | 1 (100.0%) |
Physical Housing Characteristics in Andersonville
Housing Structures in Andersonville
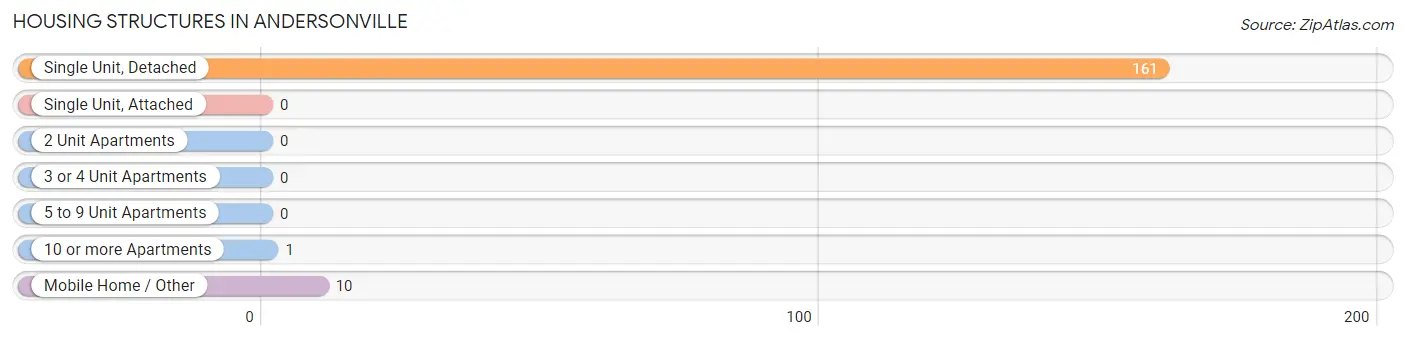
| Structure Type | # Housing Units | % Housing Units |
| Single Unit, Detached | 161 | 93.6% |
| Single Unit, Attached | 0 | 0.0% |
| 2 Unit Apartments | 0 | 0.0% |
| 3 or 4 Unit Apartments | 0 | 0.0% |
| 5 to 9 Unit Apartments | 0 | 0.0% |
| 10 or more Apartments | 1 | 0.6% |
| Mobile Home / Other | 10 | 5.8% |
| Total | 172 | 100.0% |
Housing Structures by Occupancy in Andersonville
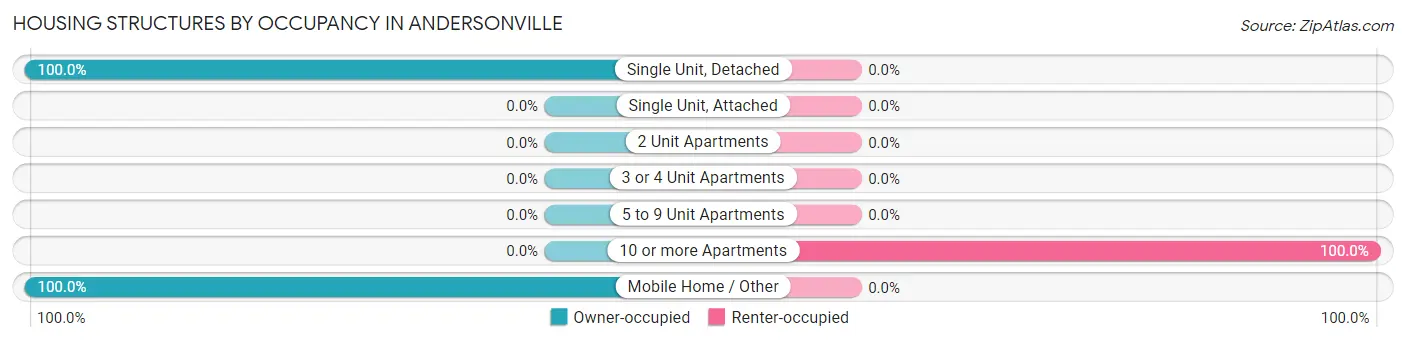
| Structure Type | Owner-occupied | Renter-occupied |
| Single Unit, Detached | 161 (100.0%) | 0 (0.0%) |
| Single Unit, Attached | 0 (0.0%) | 0 (0.0%) |
| 2 Unit Apartments | 0 (0.0%) | 0 (0.0%) |
| 3 or 4 Unit Apartments | 0 (0.0%) | 0 (0.0%) |
| 5 to 9 Unit Apartments | 0 (0.0%) | 0 (0.0%) |
| 10 or more Apartments | 0 (0.0%) | 1 (100.0%) |
| Mobile Home / Other | 10 (100.0%) | 0 (0.0%) |
| Total | 171 (99.4%) | 1 (0.6%) |
Housing Structures by Number of Rooms in Andersonville
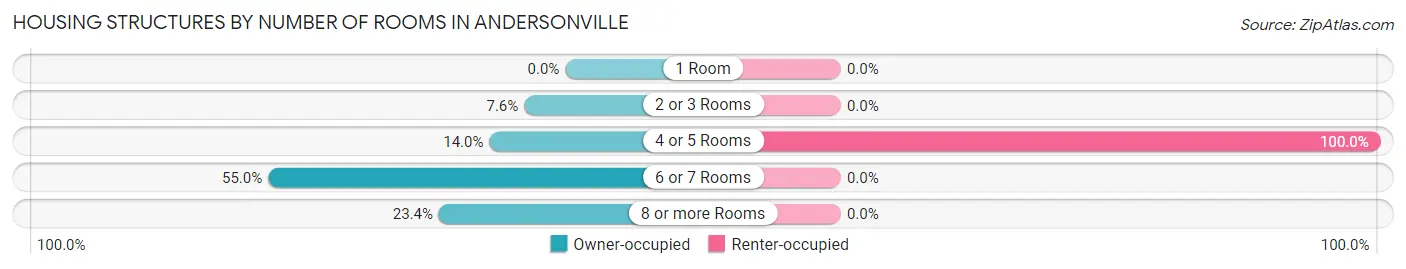
| Number of Rooms | Owner-occupied | Renter-occupied |
| 1 Room | 0 (0.0%) | 0 (0.0%) |
| 2 or 3 Rooms | 13 (7.6%) | 0 (0.0%) |
| 4 or 5 Rooms | 24 (14.0%) | 1 (100.0%) |
| 6 or 7 Rooms | 94 (55.0%) | 0 (0.0%) |
| 8 or more Rooms | 40 (23.4%) | 0 (0.0%) |
| Total | 171 (100.0%) | 1 (100.0%) |
Housing Structure by Heating Type in Andersonville
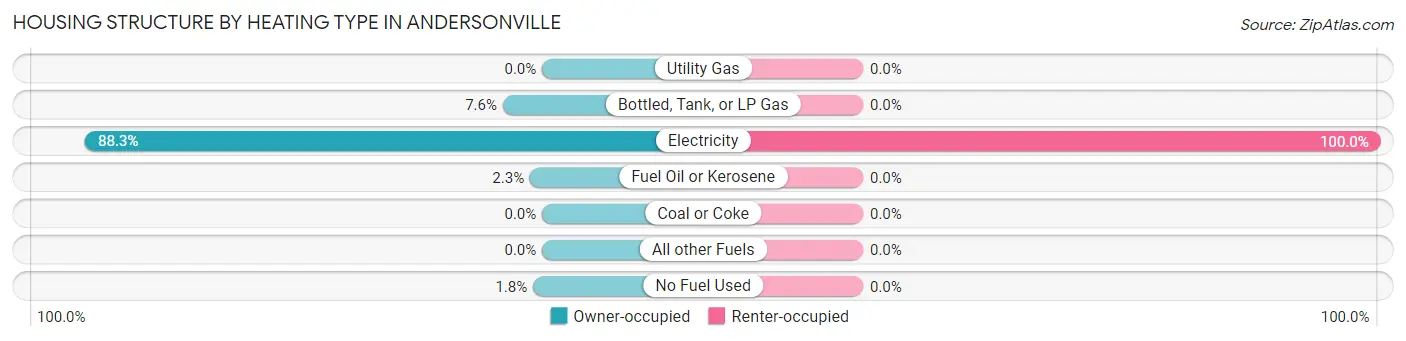
| Heating Type | Owner-occupied | Renter-occupied |
| Utility Gas | 0 (0.0%) | 0 (0.0%) |
| Bottled, Tank, or LP Gas | 13 (7.6%) | 0 (0.0%) |
| Electricity | 151 (88.3%) | 1 (100.0%) |
| Fuel Oil or Kerosene | 4 (2.3%) | 0 (0.0%) |
| Coal or Coke | 0 (0.0%) | 0 (0.0%) |
| All other Fuels | 0 (0.0%) | 0 (0.0%) |
| No Fuel Used | 3 (1.8%) | 0 (0.0%) |
| Total | 171 (100.0%) | 1 (100.0%) |
Household Vehicle Usage in Andersonville
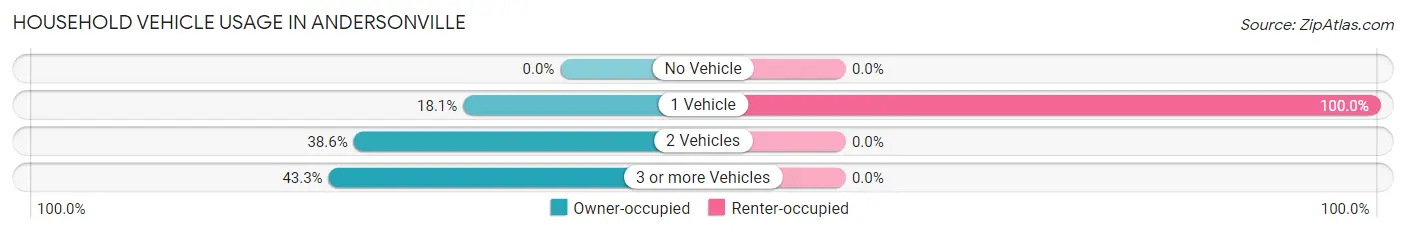
| Vehicles per Household | Owner-occupied | Renter-occupied |
| No Vehicle | 0 (0.0%) | 0 (0.0%) |
| 1 Vehicle | 31 (18.1%) | 1 (100.0%) |
| 2 Vehicles | 66 (38.6%) | 0 (0.0%) |
| 3 or more Vehicles | 74 (43.3%) | 0 (0.0%) |
| Total | 171 (100.0%) | 1 (100.0%) |
Real Estate & Mortgages in Andersonville
Real Estate and Mortgage Overview in Andersonville
| Characteristic | Without Mortgage | With Mortgage |
| Housing Units | 82 | 89 |
| Median Property Value | $166,700 | $190,200 |
| Median Household Income | $43,125 | $34 |
| Monthly Housing Costs | $500 | $0 |
| Real Estate Taxes | $1,565 | $0 |
Property Value by Mortgage Status in Andersonville
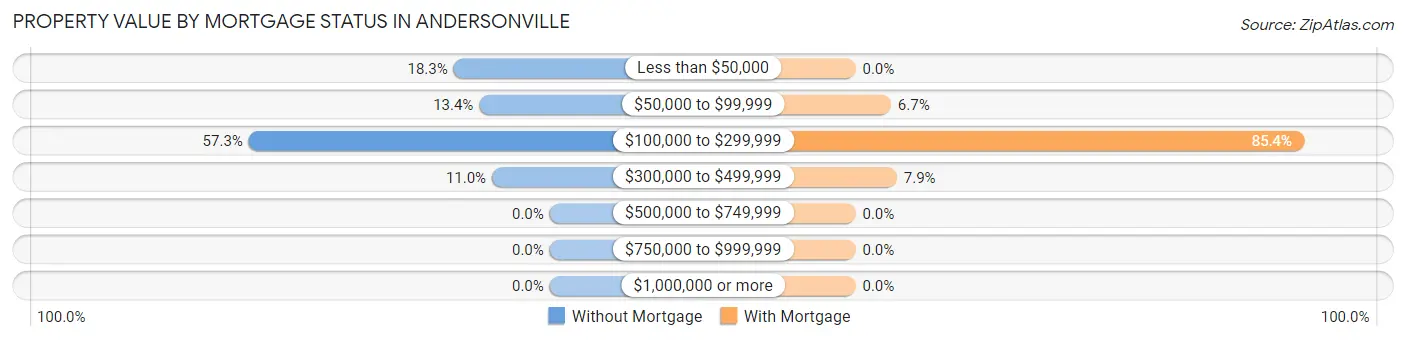
| Property Value | Without Mortgage | With Mortgage |
| Less than $50,000 | 15 (18.3%) | 0 (0.0%) |
| $50,000 to $99,999 | 11 (13.4%) | 6 (6.7%) |
| $100,000 to $299,999 | 47 (57.3%) | 76 (85.4%) |
| $300,000 to $499,999 | 9 (11.0%) | 7 (7.9%) |
| $500,000 to $749,999 | 0 (0.0%) | 0 (0.0%) |
| $750,000 to $999,999 | 0 (0.0%) | 0 (0.0%) |
| $1,000,000 or more | 0 (0.0%) | 0 (0.0%) |
| Total | 82 (100.0%) | 89 (100.0%) |
Household Income by Mortgage Status in Andersonville
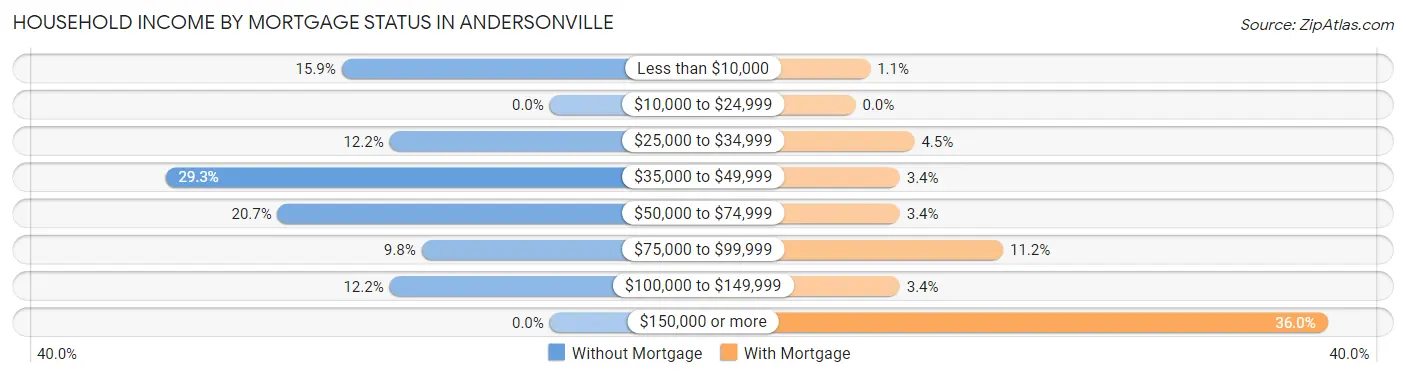
| Household Income | Without Mortgage | With Mortgage |
| Less than $10,000 | 13 (15.9%) | 1 (1.1%) |
| $10,000 to $24,999 | 0 (0.0%) | 0 (0.0%) |
| $25,000 to $34,999 | 10 (12.2%) | 4 (4.5%) |
| $35,000 to $49,999 | 24 (29.3%) | 3 (3.4%) |
| $50,000 to $74,999 | 17 (20.7%) | 3 (3.4%) |
| $75,000 to $99,999 | 8 (9.8%) | 10 (11.2%) |
| $100,000 to $149,999 | 10 (12.2%) | 3 (3.4%) |
| $150,000 or more | 0 (0.0%) | 32 (36.0%) |
| Total | 82 (100.0%) | 89 (100.0%) |
Property Value to Household Income Ratio in Andersonville
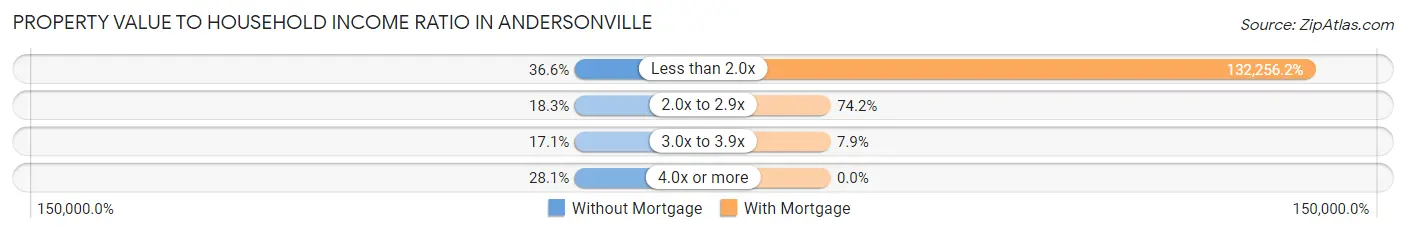
| Value-to-Income Ratio | Without Mortgage | With Mortgage |
| Less than 2.0x | 30 (36.6%) | 117,708 (132,256.2%) |
| 2.0x to 2.9x | 15 (18.3%) | 66 (74.2%) |
| 3.0x to 3.9x | 14 (17.1%) | 7 (7.9%) |
| 4.0x or more | 23 (28.1%) | 0 (0.0%) |
| Total | 82 (100.0%) | 89 (100.0%) |
Real Estate Taxes by Mortgage Status in Andersonville
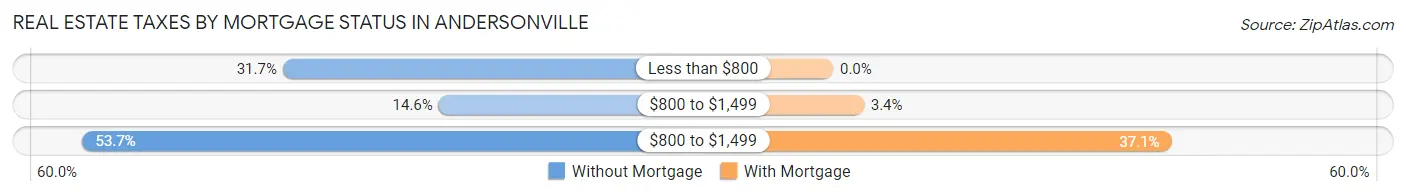
| Property Taxes | Without Mortgage | With Mortgage |
| Less than $800 | 26 (31.7%) | 0 (0.0%) |
| $800 to $1,499 | 12 (14.6%) | 3 (3.4%) |
| $800 to $1,499 | 44 (53.7%) | 33 (37.1%) |
| Total | 82 (100.0%) | 89 (100.0%) |
Health & Disability in Andersonville
Health Insurance Coverage by Age in Andersonville
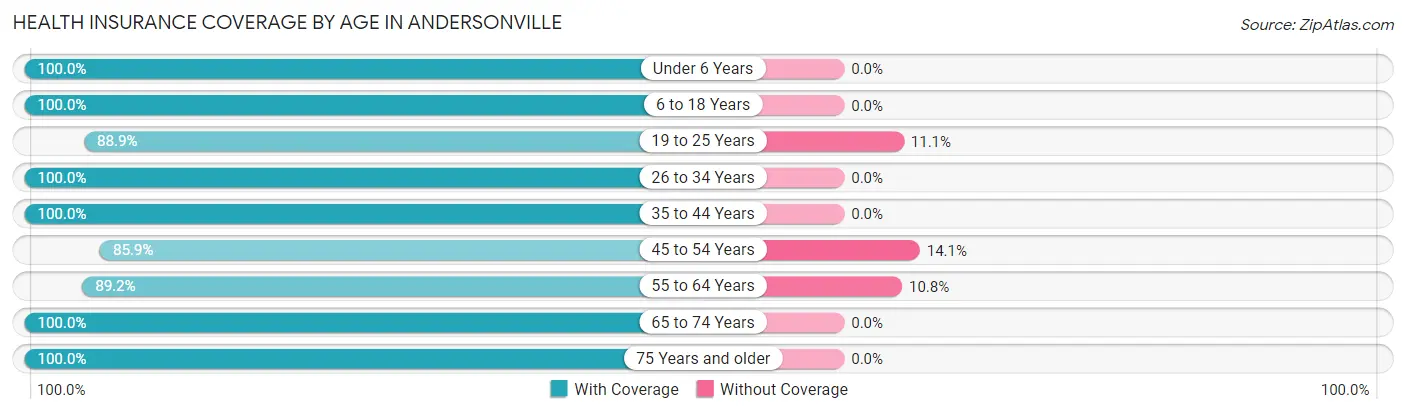
| Age Bracket | With Coverage | Without Coverage |
| Under 6 Years | 6 (100.0%) | 0 (0.0%) |
| 6 to 18 Years | 69 (100.0%) | 0 (0.0%) |
| 19 to 25 Years | 32 (88.9%) | 4 (11.1%) |
| 26 to 34 Years | 11 (100.0%) | 0 (0.0%) |
| 35 to 44 Years | 32 (100.0%) | 0 (0.0%) |
| 45 to 54 Years | 61 (85.9%) | 10 (14.1%) |
| 55 to 64 Years | 58 (89.2%) | 7 (10.8%) |
| 65 to 74 Years | 75 (100.0%) | 0 (0.0%) |
| 75 Years and older | 68 (100.0%) | 0 (0.0%) |
| Total | 412 (95.2%) | 21 (4.9%) |
Health Insurance Coverage by Citizenship Status in Andersonville
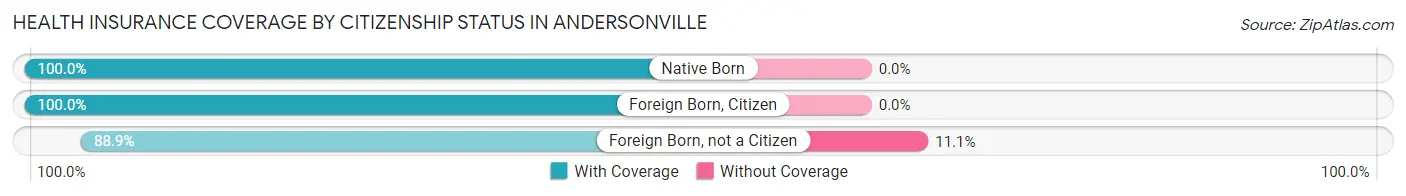
| Citizenship Status | With Coverage | Without Coverage |
| Native Born | 6 (100.0%) | 0 (0.0%) |
| Foreign Born, Citizen | 69 (100.0%) | 0 (0.0%) |
| Foreign Born, not a Citizen | 32 (88.9%) | 4 (11.1%) |
Health Insurance Coverage by Household Income in Andersonville
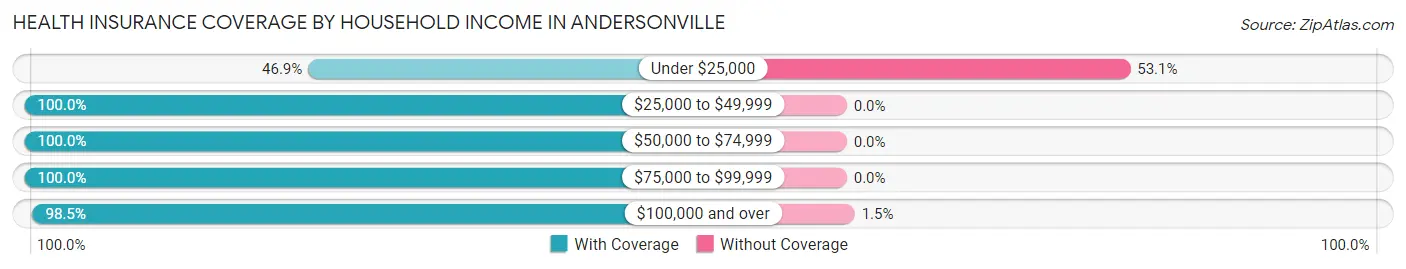
| Household Income | With Coverage | Without Coverage |
| Under $25,000 | 15 (46.9%) | 17 (53.1%) |
| $25,000 to $49,999 | 60 (100.0%) | 0 (0.0%) |
| $50,000 to $74,999 | 45 (100.0%) | 0 (0.0%) |
| $75,000 to $99,999 | 28 (100.0%) | 0 (0.0%) |
| $100,000 and over | 264 (98.5%) | 4 (1.5%) |
Public vs Private Health Insurance Coverage by Age in Andersonville
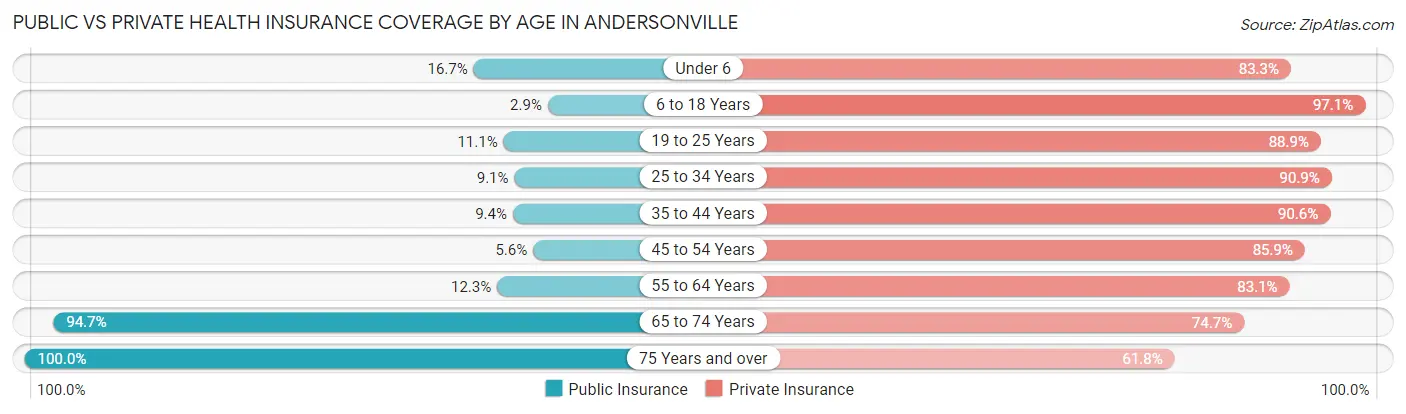
| Age Bracket | Public Insurance | Private Insurance |
| Under 6 | 1 (16.7%) | 5 (83.3%) |
| 6 to 18 Years | 2 (2.9%) | 67 (97.1%) |
| 19 to 25 Years | 4 (11.1%) | 32 (88.9%) |
| 25 to 34 Years | 1 (9.1%) | 10 (90.9%) |
| 35 to 44 Years | 3 (9.4%) | 29 (90.6%) |
| 45 to 54 Years | 4 (5.6%) | 61 (85.9%) |
| 55 to 64 Years | 8 (12.3%) | 54 (83.1%) |
| 65 to 74 Years | 71 (94.7%) | 56 (74.7%) |
| 75 Years and over | 68 (100.0%) | 42 (61.8%) |
| Total | 162 (37.4%) | 356 (82.2%) |
Disability Status by Sex by Age in Andersonville
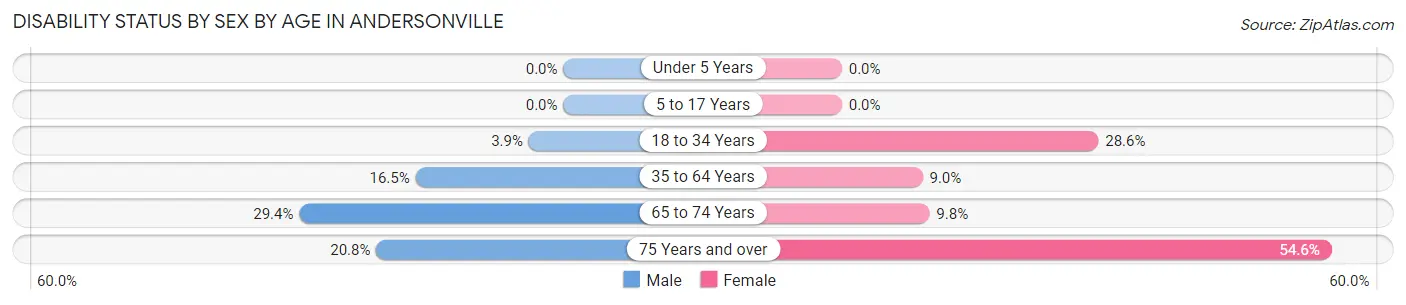
| Age Bracket | Male | Female |
| Under 5 Years | 0 (0.0%) | 0 (0.0%) |
| 5 to 17 Years | 0 (0.0%) | 0 (0.0%) |
| 18 to 34 Years | 1 (3.8%) | 6 (28.6%) |
| 35 to 64 Years | 13 (16.5%) | 8 (9.0%) |
| 65 to 74 Years | 10 (29.4%) | 4 (9.8%) |
| 75 Years and over | 5 (20.8%) | 24 (54.5%) |
Disability Class by Sex by Age in Andersonville
Disability Class: Hearing Difficulty
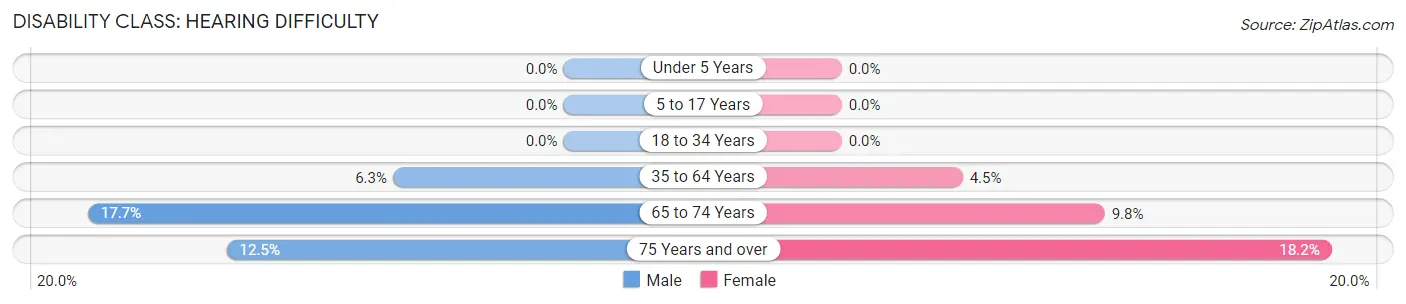
| Age Bracket | Male | Female |
| Under 5 Years | 0 (0.0%) | 0 (0.0%) |
| 5 to 17 Years | 0 (0.0%) | 0 (0.0%) |
| 18 to 34 Years | 0 (0.0%) | 0 (0.0%) |
| 35 to 64 Years | 5 (6.3%) | 4 (4.5%) |
| 65 to 74 Years | 6 (17.6%) | 4 (9.8%) |
| 75 Years and over | 3 (12.5%) | 8 (18.2%) |
Disability Class: Vision Difficulty
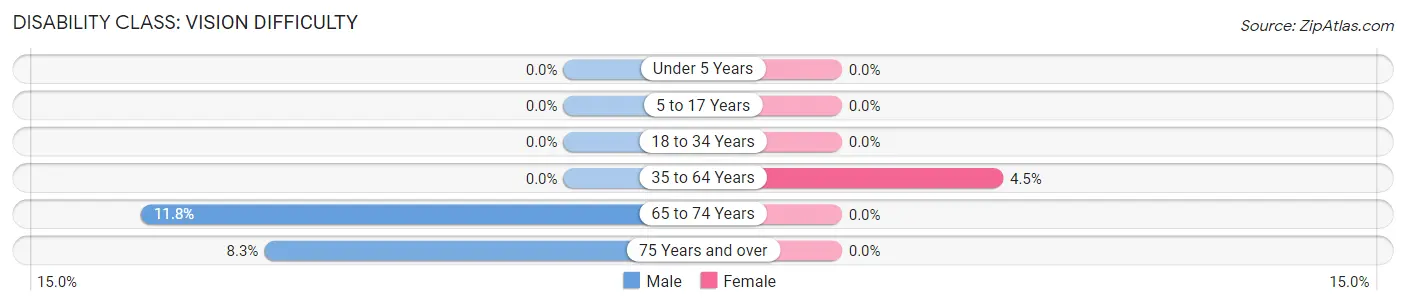
| Age Bracket | Male | Female |
| Under 5 Years | 0 (0.0%) | 0 (0.0%) |
| 5 to 17 Years | 0 (0.0%) | 0 (0.0%) |
| 18 to 34 Years | 0 (0.0%) | 0 (0.0%) |
| 35 to 64 Years | 0 (0.0%) | 4 (4.5%) |
| 65 to 74 Years | 4 (11.8%) | 0 (0.0%) |
| 75 Years and over | 2 (8.3%) | 0 (0.0%) |
Disability Class: Cognitive Difficulty
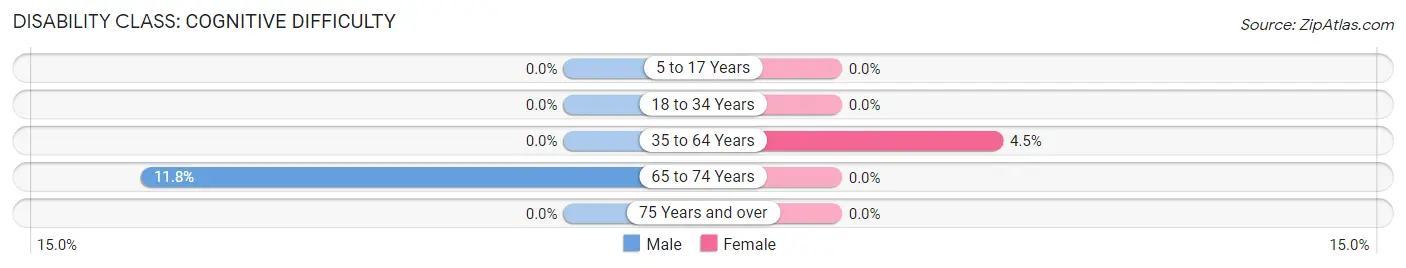
| Age Bracket | Male | Female |
| 5 to 17 Years | 0 (0.0%) | 0 (0.0%) |
| 18 to 34 Years | 0 (0.0%) | 0 (0.0%) |
| 35 to 64 Years | 0 (0.0%) | 4 (4.5%) |
| 65 to 74 Years | 4 (11.8%) | 0 (0.0%) |
| 75 Years and over | 0 (0.0%) | 0 (0.0%) |
Disability Class: Ambulatory Difficulty
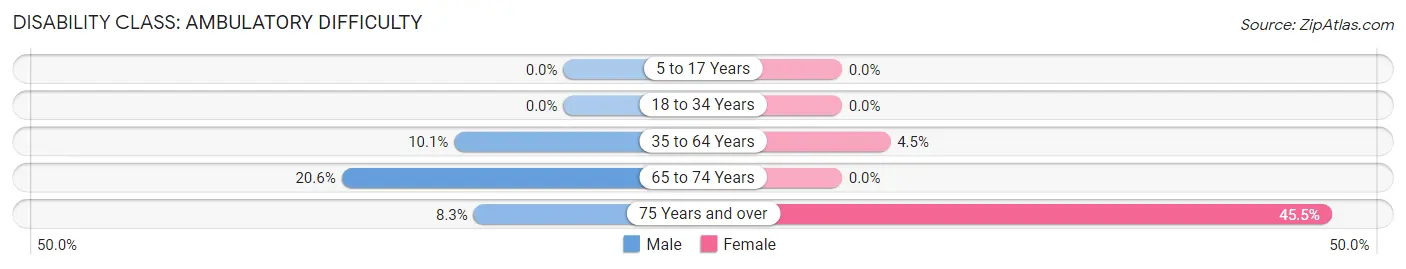
| Age Bracket | Male | Female |
| 5 to 17 Years | 0 (0.0%) | 0 (0.0%) |
| 18 to 34 Years | 0 (0.0%) | 0 (0.0%) |
| 35 to 64 Years | 8 (10.1%) | 4 (4.5%) |
| 65 to 74 Years | 7 (20.6%) | 0 (0.0%) |
| 75 Years and over | 2 (8.3%) | 20 (45.5%) |
Disability Class: Self-Care Difficulty
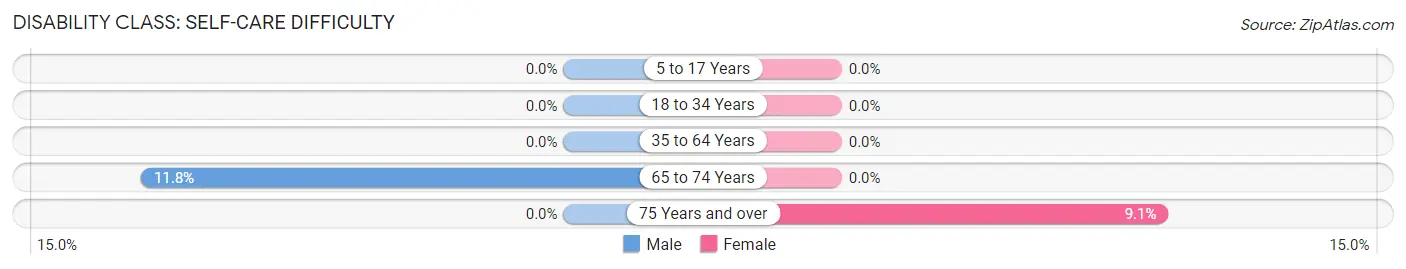
| Age Bracket | Male | Female |
| 5 to 17 Years | 0 (0.0%) | 0 (0.0%) |
| 18 to 34 Years | 0 (0.0%) | 0 (0.0%) |
| 35 to 64 Years | 0 (0.0%) | 0 (0.0%) |
| 65 to 74 Years | 4 (11.8%) | 0 (0.0%) |
| 75 Years and over | 0 (0.0%) | 4 (9.1%) |
Technology Access in Andersonville
Computing Device Access in Andersonville
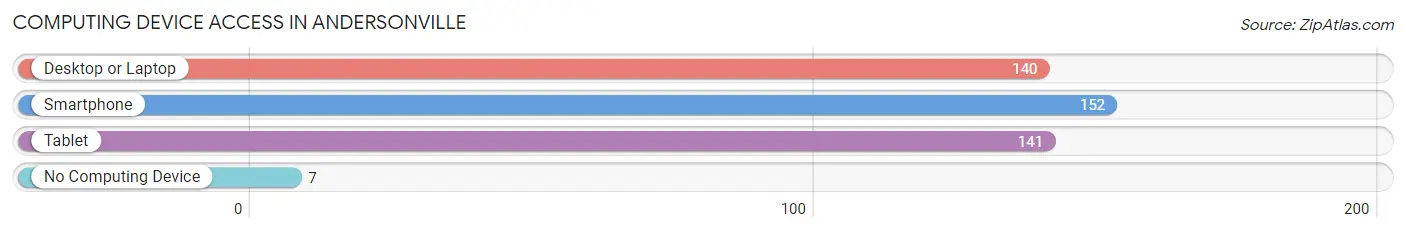
| Device Type | # Households | % Households |
| Desktop or Laptop | 140 | 81.4% |
| Smartphone | 152 | 88.4% |
| Tablet | 141 | 82.0% |
| No Computing Device | 7 | 4.1% |
| Total | 172 | 100.0% |
Internet Access in Andersonville
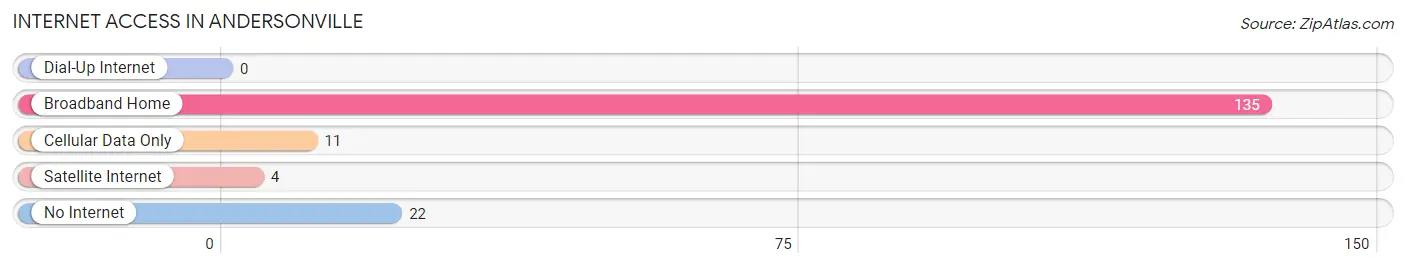
| Internet Type | # Households | % Households |
| Dial-Up Internet | 0 | 0.0% |
| Broadband Home | 135 | 78.5% |
| Cellular Data Only | 11 | 6.4% |
| Satellite Internet | 4 | 2.3% |
| No Internet | 22 | 12.8% |
| Total | 172 | 100.0% |
Andersonville Summary
Andersonville is a small unincorporated community located in the southeastern corner of Ohio, in the county of Meigs. It is situated on the banks of the Ohio River, and is bordered by the towns of Rutland, Middleport, and Pomeroy. The population of Andersonville was estimated to be around 500 people in 2020.
History
The area that is now Andersonville was first settled in the early 1800s by a group of settlers from Pennsylvania. The settlement was originally known as “Rutland”, and was located on the banks of the Ohio River. The settlement was later renamed “Andersonville” in honor of the first settler, John Anderson.
The town of Andersonville was officially incorporated in 1837. During the 19th century, the town was a thriving river port, and was home to a number of businesses, including a sawmill, a grist mill, a blacksmith shop, and a general store.
In the early 20th century, Andersonville began to decline as the river port industry shifted to larger cities. The town’s population began to dwindle, and by the 1950s, the town was nearly abandoned.
In the late 1970s, the town was revitalized by a group of local residents who wanted to preserve the town’s history and culture. The town was listed on the National Register of Historic Places in 1979, and has since become a popular tourist destination.
Geography
Andersonville is located in the southeastern corner of Ohio, in the county of Meigs. It is situated on the banks of the Ohio River, and is bordered by the towns of Rutland, Middleport, and Pomeroy. The town is located in a rural area, and is surrounded by rolling hills and farmland.
The climate in Andersonville is humid continental, with hot summers and cold winters. The average temperature in the summer is around 75 degrees Fahrenheit, and the average temperature in the winter is around 30 degrees Fahrenheit.
Economy
The economy of Andersonville is largely based on tourism. The town is home to a number of historic sites, including the Andersonville Historic District, the Andersonville National Cemetery, and the Andersonville National Historic Site. The town also hosts a number of festivals and events throughout the year, including the Andersonville Arts and Crafts Festival and the Andersonville Music Festival.
In addition to tourism, Andersonville is home to a number of small businesses, including a general store, a gas station, and a few restaurants. The town is also home to a number of farms, which produce a variety of crops, including corn, soybeans, and wheat.
Demographics
As of the 2020 census, the population of Andersonville was estimated to be around 500 people. The racial makeup of the town was 97.2% White, 0.8% African American, 0.4% Native American, 0.2% Asian, and 1.4% from other races. The median household income in Andersonville was $37,500, and the median home value was $90,000.
Conclusion
Andersonville is a small unincorporated community located in the southeastern corner of Ohio, in the county of Meigs. It is situated on the banks of the Ohio River, and is bordered by the towns of Rutland, Middleport, and Pomeroy. The town has a rich history, and is home to a number of historic sites and attractions. The economy of Andersonville is largely based on tourism, and the town is home to a number of small businesses. The population of Andersonville was estimated to be around 500 people in 2020, and the racial makeup of the town was 97.2% White, 0.8% African American, 0.4% Native American, 0.2% Asian, and 1.4% from other races.
Common Questions
What is the Total Population of Andersonville?
Total Population of Andersonville is 433.
What is the Total Male Population of Andersonville?
Total Male Population of Andersonville is 182.
What is the Total Female Population of Andersonville?
Total Female Population of Andersonville is 251.
What is the Ratio of Males per 100 Females in Andersonville?
There are 72.51 Males per 100 Females in Andersonville.
What is the Ratio of Females per 100 Males in Andersonville?
There are 137.91 Females per 100 Males in Andersonville.
What is the Median Population Age in Andersonville?
Median Population Age in Andersonville is 52.8 Years.
What is the Average Family Size in Andersonville
Average Family Size in Andersonville is 2.9 People.
What is the Average Household Size in Andersonville
Average Household Size in Andersonville is 2.5 People.
What is Per Capita Income in Andersonville?
Per Capita income in Andersonville is $37,175.
What is the Median Family Income in Andersonville?
Median Family Income in Andersonville is $108,958.
What is the Median Household income in Andersonville?
Median Household Income in Andersonville is $78,333.
What is Income or Wage Gap in Andersonville?
Income or Wage Gap in Andersonville is 35.8%.
Women in Andersonville earn 64.2 cents for every dollar earned by a man.
What is Family Income Deficit in Andersonville?
Family Income Deficit in Andersonville is $10,321.
Families that are below poverty line in Andersonville earn $10,321 less on average than the poverty threshold level.
What is Inequality or Gini Index in Andersonville?
Inequality or Gini Index in Andersonville is 0.37.
How Large is the Labor Force in Andersonville?
There are 167 People in the Labor Forcein in Andersonville.
What is the Percentage of People in the Labor Force in Andersonville?
44.3% of People are in the Labor Force in Andersonville.
What is the Unemployment Rate in Andersonville?
Unemployment Rate in Andersonville is 3.6%.