Brookfield Center, OH
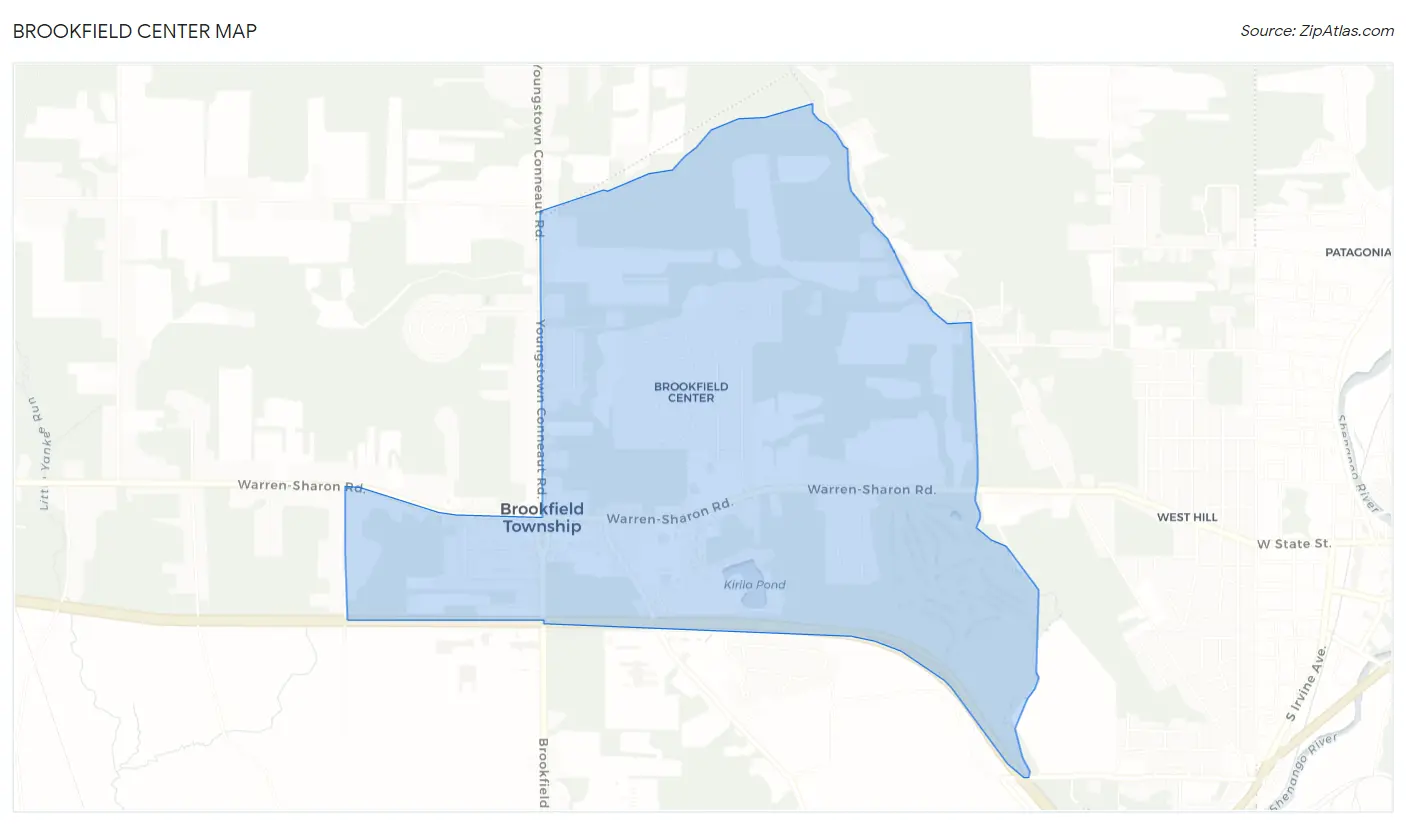
Brookfield Center Map
Brookfield Center Overview
1,255
TOTAL POPULATION
583
MALE POPULATION
672
FEMALE POPULATION
86.76
MALES / 100 FEMALES
115.27
FEMALES / 100 MALES
55.6
MEDIAN AGE
2.8
AVG FAMILY SIZE
2.0
AVG HOUSEHOLD SIZE
$34,285
PER CAPITA INCOME
$79,444
AVG FAMILY INCOME
$51,534
AVG HOUSEHOLD INCOME
48.2%
WAGE / INCOME GAP [ % ]
51.8¢/ $1
WAGE / INCOME GAP [ $ ]
0.44
INEQUALITY / GINI INDEX
541
LABOR FORCE [ PEOPLE ]
48.5%
PERCENT IN LABOR FORCE
2.8%
UNEMPLOYMENT RATE
Race in Brookfield Center
The most populous races in Brookfield Center are White / Caucasian (1,253 | 99.8%), and Black / African American (2 | 0.2%).
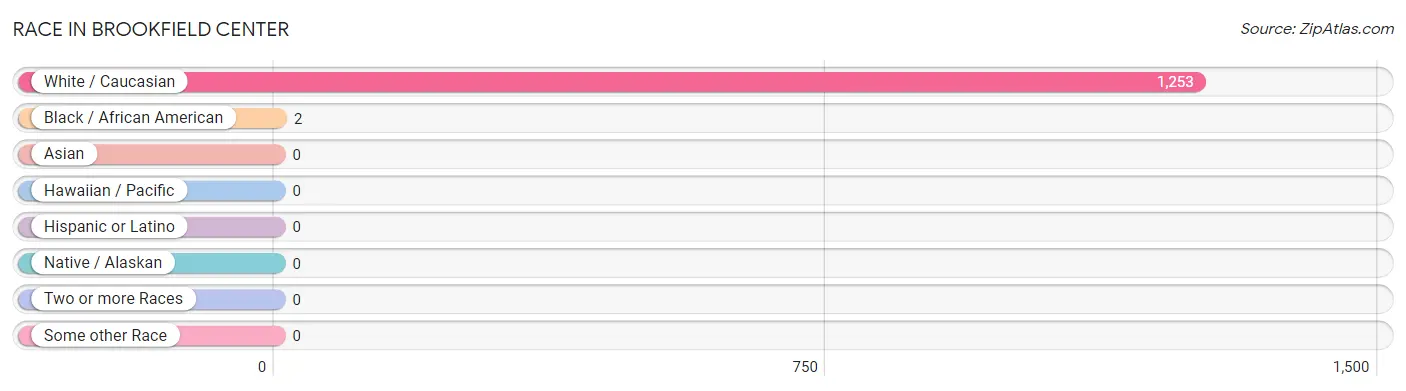
| Race | # Population | % Population |
| Asian | 0 | 0.0% |
| Black / African American | 2 | 0.2% |
| Hawaiian / Pacific | 0 | 0.0% |
| Hispanic or Latino | 0 | 0.0% |
| Native / Alaskan | 0 | 0.0% |
| White / Caucasian | 1,253 | 99.8% |
| Two or more Races | 0 | 0.0% |
| Some other Race | 0 | 0.0% |
| Total | 1,255 | 100.0% |
Ancestry in Brookfield Center
The most populous ancestries reported in Brookfield Center are American (326 | 26.0%), Italian (227 | 18.1%), German (181 | 14.4%), Irish (106 | 8.5%), and English (99 | 7.9%), together accounting for 74.8% of all Brookfield Center residents.
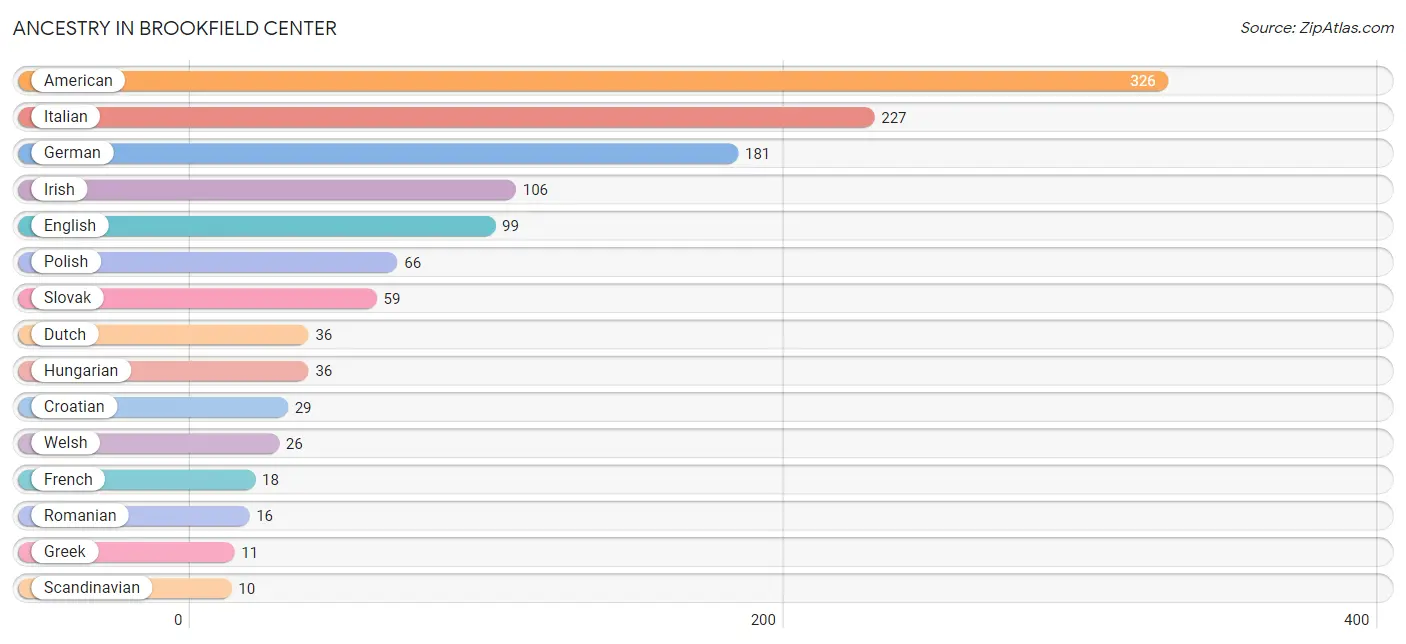
| Ancestry | # Population | % Population |
| American | 326 | 26.0% |
| Arab | 8 | 0.6% |
| Croatian | 29 | 2.3% |
| Dutch | 36 | 2.9% |
| English | 99 | 7.9% |
| French | 18 | 1.4% |
| German | 181 | 14.4% |
| Greek | 11 | 0.9% |
| Hungarian | 36 | 2.9% |
| Irish | 106 | 8.5% |
| Italian | 227 | 18.1% |
| Lebanese | 8 | 0.6% |
| Polish | 66 | 5.3% |
| Romanian | 16 | 1.3% |
| Russian | 7 | 0.6% |
| Scandinavian | 10 | 0.8% |
| Scottish | 10 | 0.8% |
| Slovak | 59 | 4.7% |
| Slovene | 9 | 0.7% |
| Ukrainian | 7 | 0.6% |
| Welsh | 26 | 2.1% | View All 21 Rows |
Immigrants in Brookfield Center
The most numerous immigrant groups reported in Brookfield Center came from Eastern Europe (8 | 0.6%), Europe (8 | 0.6%), and Poland (8 | 0.6%), together accounting for 1.9% of all Brookfield Center residents.
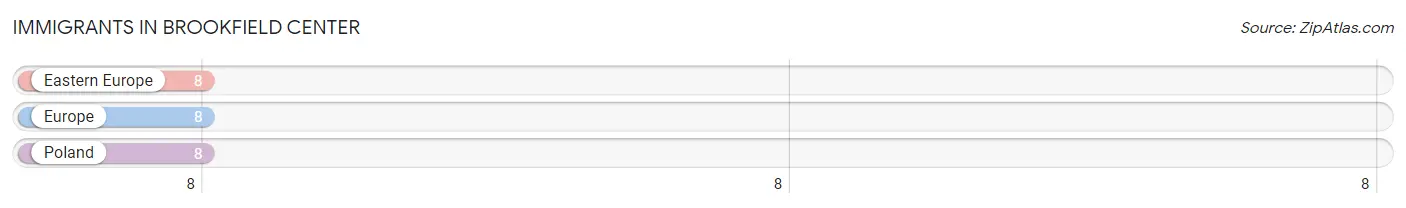
| Immigration Origin | # Population | % Population |
| Eastern Europe | 8 | 0.6% |
| Europe | 8 | 0.6% |
| Poland | 8 | 0.6% | View All 3 Rows |
Sex and Age in Brookfield Center
Sex and Age in Brookfield Center
The most populous age groups in Brookfield Center are 15 to 19 Years (102 | 17.5%) for men and 85 Years and over (163 | 24.3%) for women.
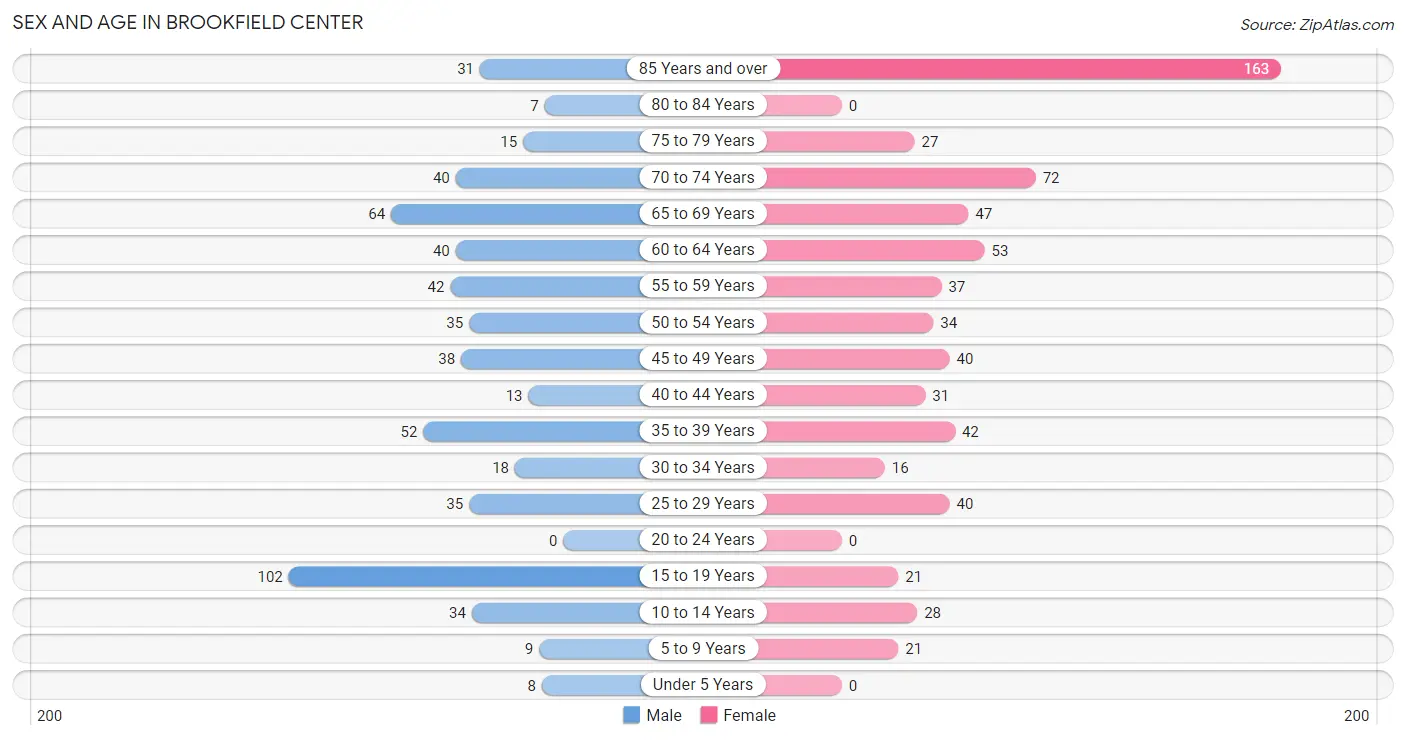
| Age Bracket | Male | Female |
| Under 5 Years | 8 (1.4%) | 0 (0.0%) |
| 5 to 9 Years | 9 (1.5%) | 21 (3.1%) |
| 10 to 14 Years | 34 (5.8%) | 28 (4.2%) |
| 15 to 19 Years | 102 (17.5%) | 21 (3.1%) |
| 20 to 24 Years | 0 (0.0%) | 0 (0.0%) |
| 25 to 29 Years | 35 (6.0%) | 40 (5.9%) |
| 30 to 34 Years | 18 (3.1%) | 16 (2.4%) |
| 35 to 39 Years | 52 (8.9%) | 42 (6.2%) |
| 40 to 44 Years | 13 (2.2%) | 31 (4.6%) |
| 45 to 49 Years | 38 (6.5%) | 40 (5.9%) |
| 50 to 54 Years | 35 (6.0%) | 34 (5.1%) |
| 55 to 59 Years | 42 (7.2%) | 37 (5.5%) |
| 60 to 64 Years | 40 (6.9%) | 53 (7.9%) |
| 65 to 69 Years | 64 (11.0%) | 47 (7.0%) |
| 70 to 74 Years | 40 (6.9%) | 72 (10.7%) |
| 75 to 79 Years | 15 (2.6%) | 27 (4.0%) |
| 80 to 84 Years | 7 (1.2%) | 0 (0.0%) |
| 85 Years and over | 31 (5.3%) | 163 (24.3%) |
| Total | 583 (100.0%) | 672 (100.0%) |
Families and Households in Brookfield Center
Median Family Size in Brookfield Center
The median family size in Brookfield Center is 2.79 persons per family, with single male/father families (7 | 2.3%) accounting for the largest median family size of 4.57 persons per family. On the other hand, married-couple families (229 | 74.8%) represent the smallest median family size with 2.70 persons per family.
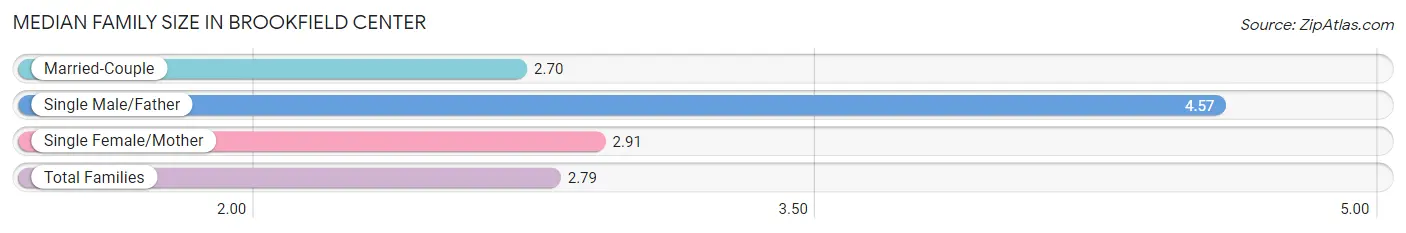
| Family Type | # Families | Family Size |
| Married-Couple | 229 (74.8%) | 2.70 |
| Single Male/Father | 7 (2.3%) | 4.57 |
| Single Female/Mother | 70 (22.9%) | 2.91 |
| Total Families | 306 (100.0%) | 2.79 |
Median Household Size in Brookfield Center
The median household size in Brookfield Center is 1.96 persons per household, with single male/father households (7 | 1.1%) accounting for the largest median household size of 4.57 persons per household. non-family households (327 | 51.7%) represent the smallest median household size with 1.09 persons per household.
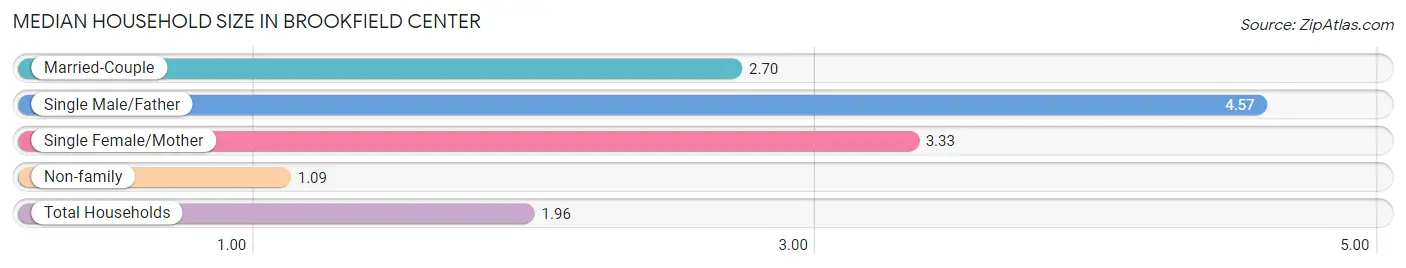
| Household Type | # Households | Household Size |
| Married-Couple | 229 (36.2%) | 2.70 |
| Single Male/Father | 7 (1.1%) | 4.57 |
| Single Female/Mother | 70 (11.1%) | 3.33 |
| Non-family | 327 (51.7%) | 1.09 |
| Total Households | 633 (100.0%) | 1.96 |
Household Size by Marriage Status in Brookfield Center
Out of a total of 633 households in Brookfield Center, 306 (48.3%) are family households, while 327 (51.7%) are nonfamily households. The most numerous type of family households are 2-person households, comprising 174, and the most common type of nonfamily households are 1-person households, comprising 298.
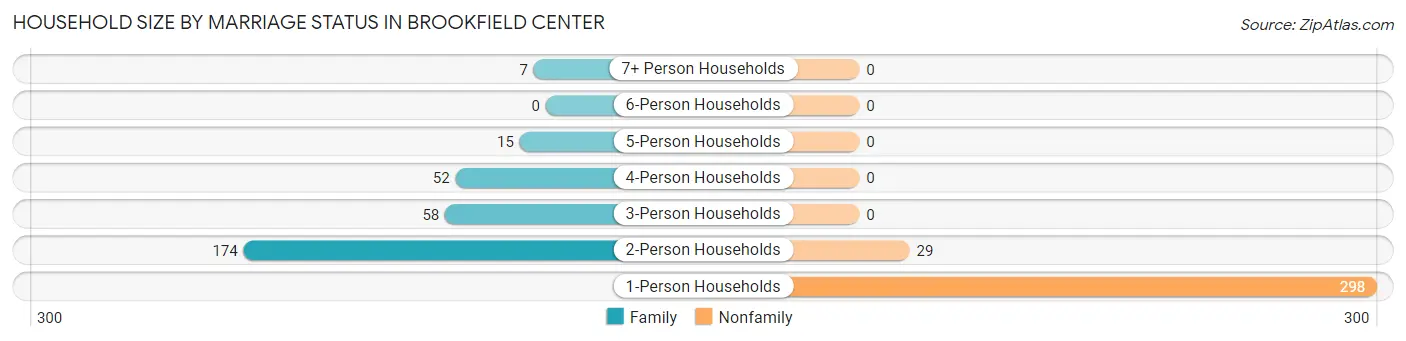
| Household Size | Family Households | Nonfamily Households |
| 1-Person Households | - | 298 (47.1%) |
| 2-Person Households | 174 (27.5%) | 29 (4.6%) |
| 3-Person Households | 58 (9.2%) | 0 (0.0%) |
| 4-Person Households | 52 (8.2%) | 0 (0.0%) |
| 5-Person Households | 15 (2.4%) | 0 (0.0%) |
| 6-Person Households | 0 (0.0%) | 0 (0.0%) |
| 7+ Person Households | 7 (1.1%) | 0 (0.0%) |
| Total | 306 (48.3%) | 327 (51.7%) |
Female Fertility in Brookfield Center
Fertility by Age in Brookfield Center
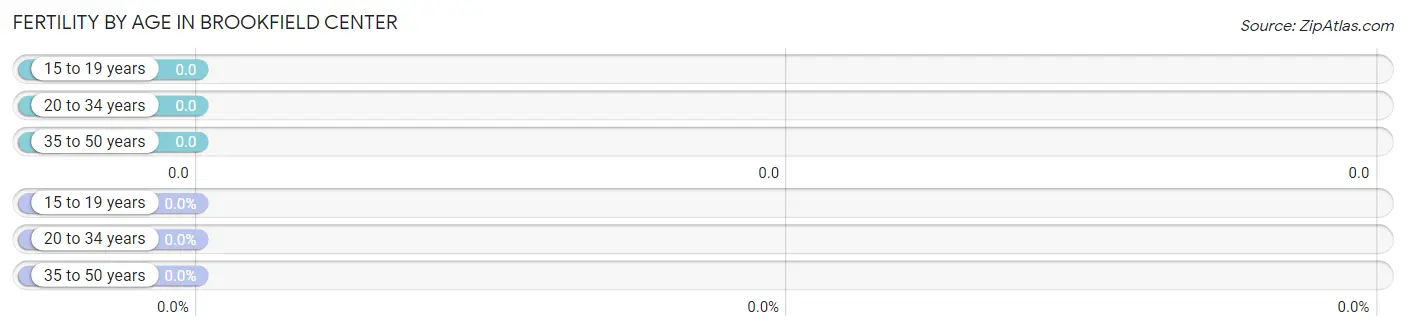
| Age Bracket | Women with Births | Births / 1,000 Women |
| 15 to 19 years | 0 (0.0%) | 0.0 |
| 20 to 34 years | 0 (0.0%) | 0.0 |
| 35 to 50 years | 0 (0.0%) | 0.0 |
| Total | 0 (0.0%) | 0.0 |
Fertility by Age by Marriage Status in Brookfield Center
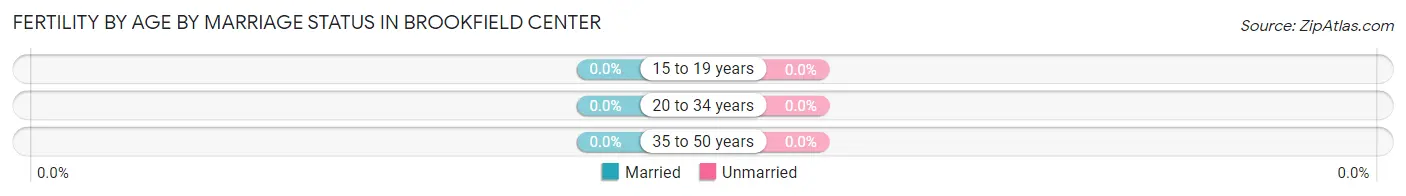
| Age Bracket | Married | Unmarried |
| 15 to 19 years | 0 (0.0%) | 0 (0.0%) |
| 20 to 34 years | 0 (0.0%) | 0 (0.0%) |
| 35 to 50 years | 0 (0.0%) | 0 (0.0%) |
| Total | 0 (0.0%) | 0 (0.0%) |
Fertility by Education in Brookfield Center
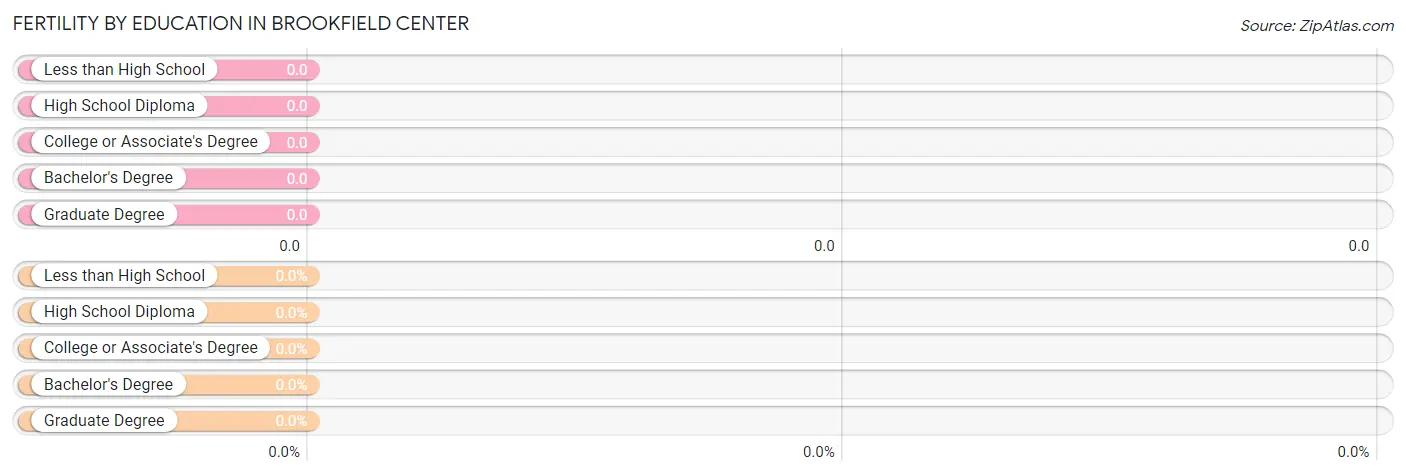
| Educational Attainment | Women with Births | Births / 1,000 Women |
| Less than High School | 0 (0.0%) | 0.0 |
| High School Diploma | 0 (0.0%) | 0.0 |
| College or Associate's Degree | 0 (0.0%) | 0.0 |
| Bachelor's Degree | 0 (0.0%) | 0.0 |
| Graduate Degree | 0 (0.0%) | 0.0 |
| Total | 0 (0.0%) | 0.0 |
Fertility by Education by Marriage Status in Brookfield Center
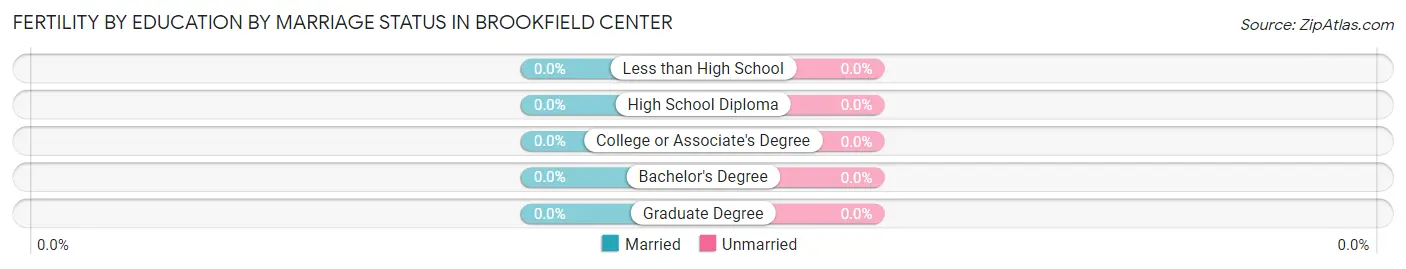
| Educational Attainment | Married | Unmarried |
| Less than High School | 0 (0.0%) | 0 (0.0%) |
| High School Diploma | 0 (0.0%) | 0 (0.0%) |
| College or Associate's Degree | 0 (0.0%) | 0 (0.0%) |
| Bachelor's Degree | 0 (0.0%) | 0 (0.0%) |
| Graduate Degree | 0 (0.0%) | 0 (0.0%) |
| Total | 0 (0.0%) | 0 (0.0%) |
Income in Brookfield Center
Income Overview in Brookfield Center
Per Capita Income in Brookfield Center is $34,285, while median incomes of families and households are $79,444 and $51,534 respectively.
| Characteristic | Number | Measure |
| Per Capita Income | 1,255 | $34,285 |
| Median Family Income | 306 | $79,444 |
| Mean Family Income | 306 | $90,037 |
| Median Household Income | 633 | $51,534 |
| Mean Household Income | 633 | $66,368 |
| Income Deficit | 306 | $0 |
| Wage / Income Gap (%) | 1,255 | 48.20% |
| Wage / Income Gap ($) | 1,255 | 51.80¢ per $1 |
| Gini / Inequality Index | 1,255 | 0.44 |
Earnings by Sex in Brookfield Center
Average Earnings in Brookfield Center are $33,214, $47,000 for men and $24,348 for women, a difference of 48.2%.
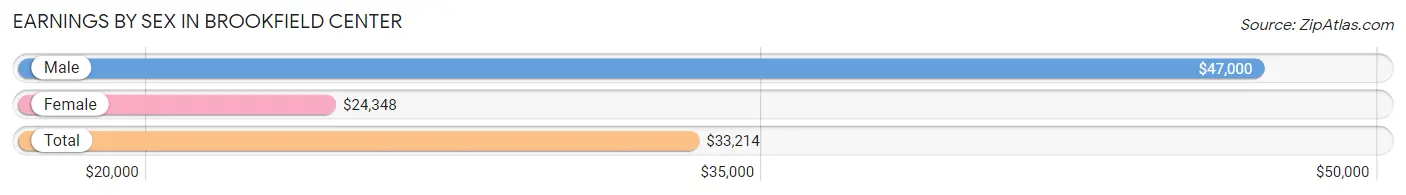
| Sex | Number | Average Earnings |
| Male | 270 (47.5%) | $47,000 |
| Female | 298 (52.5%) | $24,348 |
| Total | 568 (100.0%) | $33,214 |
Earnings by Sex by Income Bracket in Brookfield Center
The most common earnings brackets in Brookfield Center are $100,000+ for men (42 | 15.6%) and $25,000 to $29,999 for women (52 | 17.4%).
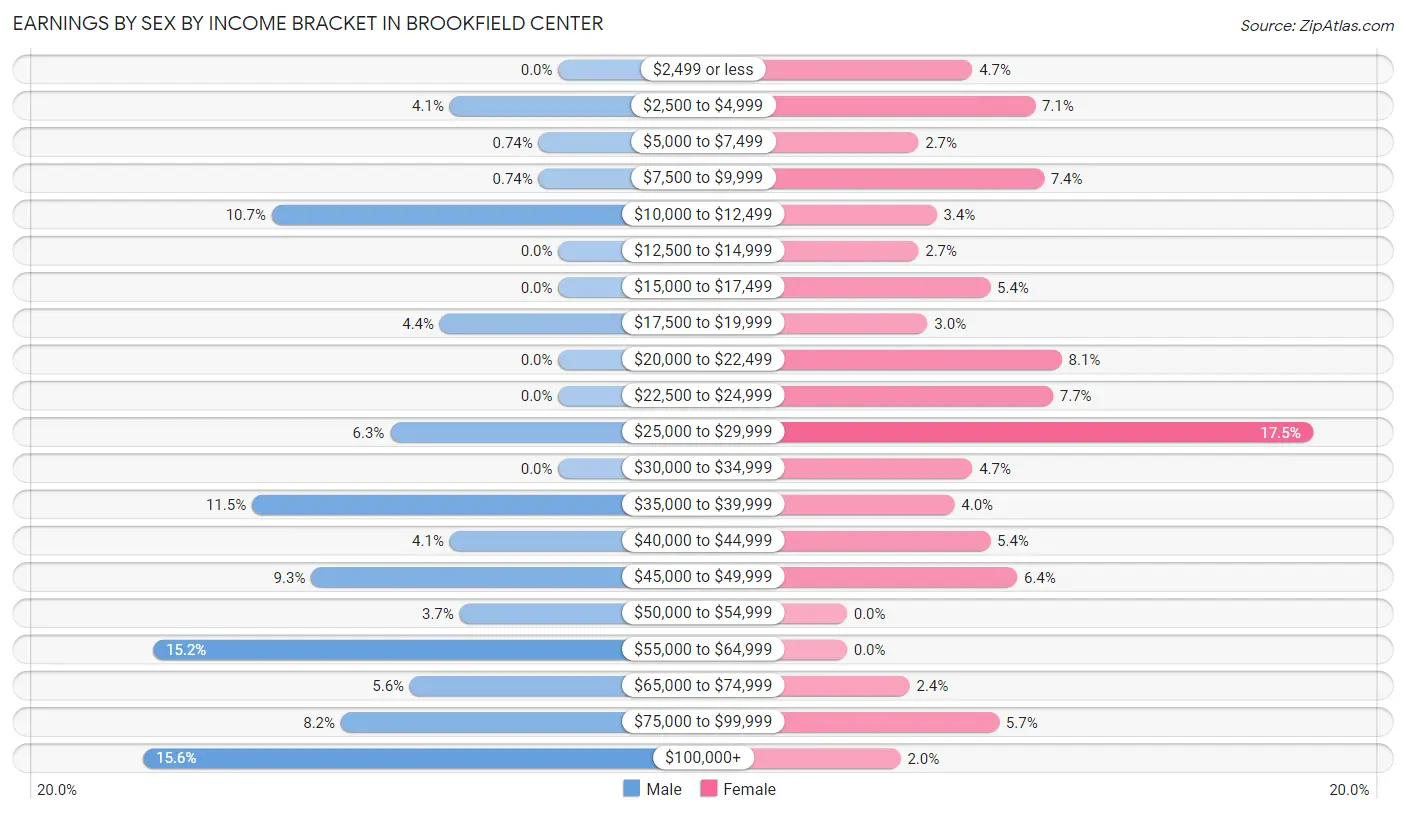
| Income | Male | Female |
| $2,499 or less | 0 (0.0%) | 14 (4.7%) |
| $2,500 to $4,999 | 11 (4.1%) | 21 (7.0%) |
| $5,000 to $7,499 | 2 (0.7%) | 8 (2.7%) |
| $7,500 to $9,999 | 2 (0.7%) | 22 (7.4%) |
| $10,000 to $12,499 | 29 (10.7%) | 10 (3.4%) |
| $12,500 to $14,999 | 0 (0.0%) | 8 (2.7%) |
| $15,000 to $17,499 | 0 (0.0%) | 16 (5.4%) |
| $17,500 to $19,999 | 12 (4.4%) | 9 (3.0%) |
| $20,000 to $22,499 | 0 (0.0%) | 24 (8.1%) |
| $22,500 to $24,999 | 0 (0.0%) | 23 (7.7%) |
| $25,000 to $29,999 | 17 (6.3%) | 52 (17.4%) |
| $30,000 to $34,999 | 0 (0.0%) | 14 (4.7%) |
| $35,000 to $39,999 | 31 (11.5%) | 12 (4.0%) |
| $40,000 to $44,999 | 11 (4.1%) | 16 (5.4%) |
| $45,000 to $49,999 | 25 (9.3%) | 19 (6.4%) |
| $50,000 to $54,999 | 10 (3.7%) | 0 (0.0%) |
| $55,000 to $64,999 | 41 (15.2%) | 0 (0.0%) |
| $65,000 to $74,999 | 15 (5.6%) | 7 (2.4%) |
| $75,000 to $99,999 | 22 (8.2%) | 17 (5.7%) |
| $100,000+ | 42 (15.6%) | 6 (2.0%) |
| Total | 270 (100.0%) | 298 (100.0%) |
Earnings by Sex by Educational Attainment in Brookfield Center
Average earnings in Brookfield Center are $51,125 for men and $25,074 for women, a difference of 51.0%. Men with an educational attainment of less than high school enjoy the highest average annual earnings of $58,125, while those with high school diploma education earn the least with $44,318. Women with an educational attainment of high school diploma earn the most with the average annual earnings of $26,364, while those with college or associate's degree education have the smallest earnings of $21,964.
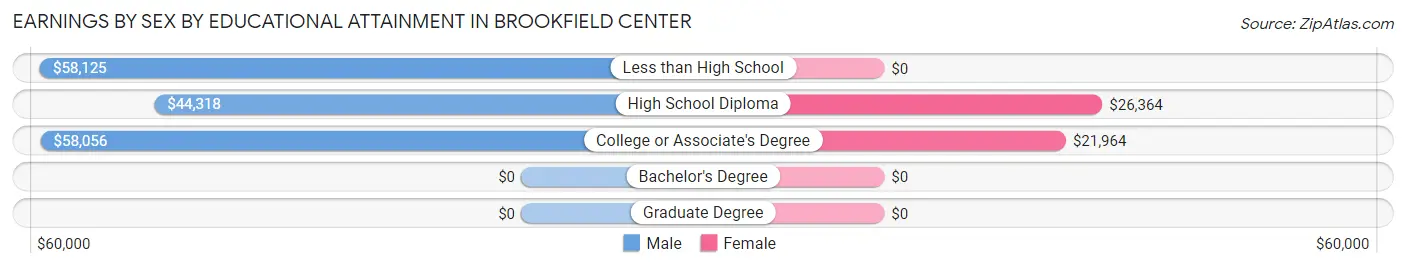
| Educational Attainment | Male Income | Female Income |
| Less than High School | $58,125 | $0 |
| High School Diploma | $44,318 | $26,364 |
| College or Associate's Degree | $58,056 | $21,964 |
| Bachelor's Degree | - | - |
| Graduate Degree | - | - |
| Total | $51,125 | $25,074 |
Family Income in Brookfield Center
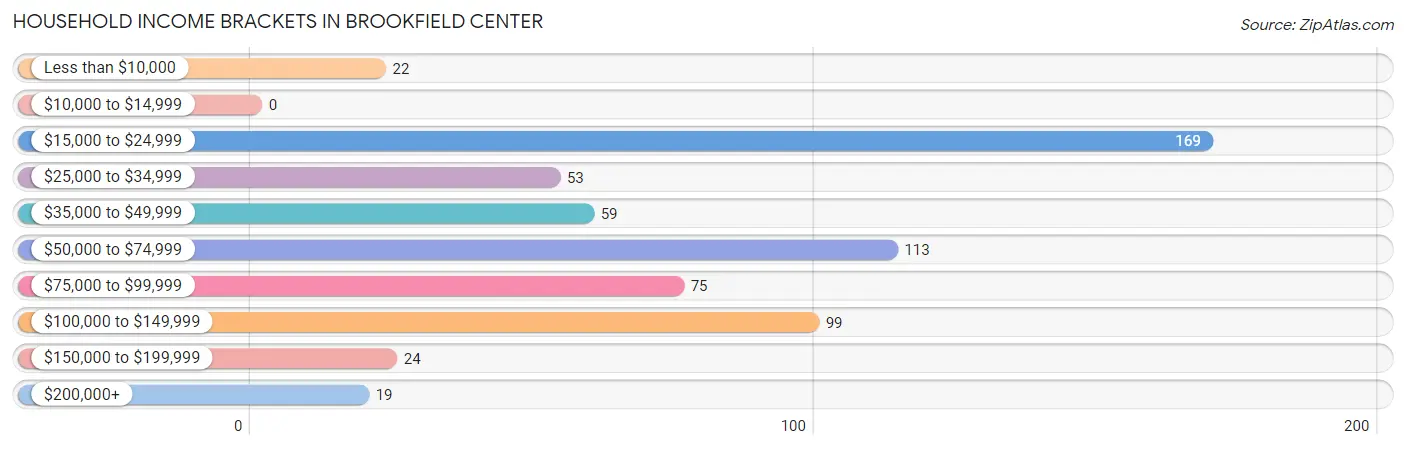
Family Income Brackets in Brookfield Center
According to the Brookfield Center family income data, there are 75 families falling into the $75,000 to $99,999 income range, which is the most common income bracket and makes up 24.5% of all families.
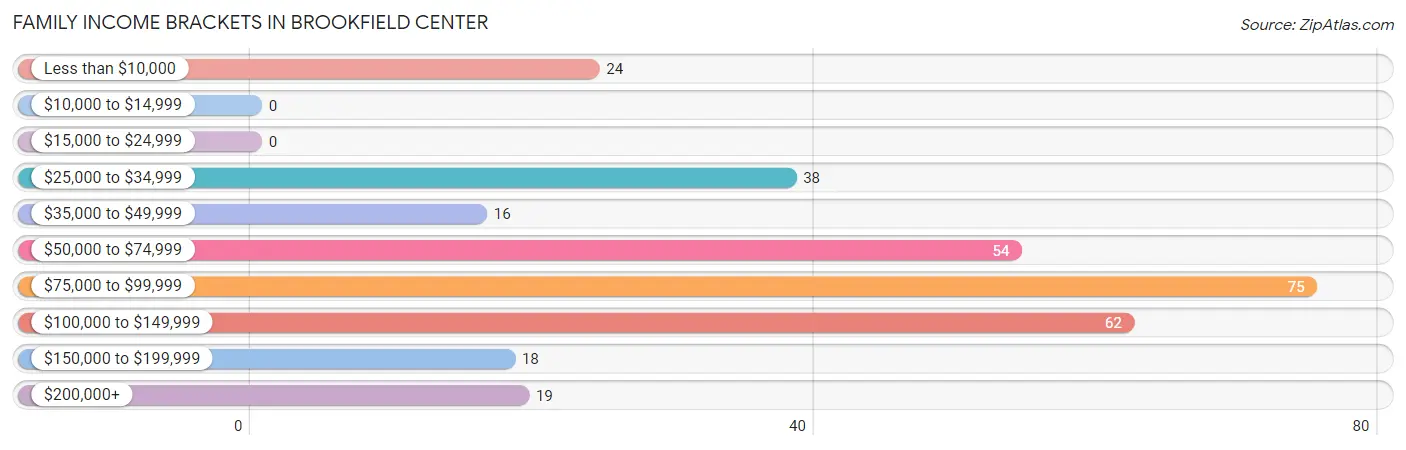
| Income Bracket | # Families | % Families |
| Less than $10,000 | 24 | 7.8% |
| $10,000 to $14,999 | 0 | 0.0% |
| $15,000 to $24,999 | 0 | 0.0% |
| $25,000 to $34,999 | 38 | 12.4% |
| $35,000 to $49,999 | 16 | 5.2% |
| $50,000 to $74,999 | 54 | 17.6% |
| $75,000 to $99,999 | 75 | 24.5% |
| $100,000 to $149,999 | 62 | 20.3% |
| $150,000 to $199,999 | 18 | 5.9% |
| $200,000+ | 19 | 6.2% |
Family Income by Famaliy Size in Brookfield Center
2-person families (182 | 59.5%) account for the highest median family income in Brookfield Center with $82,500 per family, while 2-person families (182 | 59.5%) have the highest median income of $41,250 per family member.
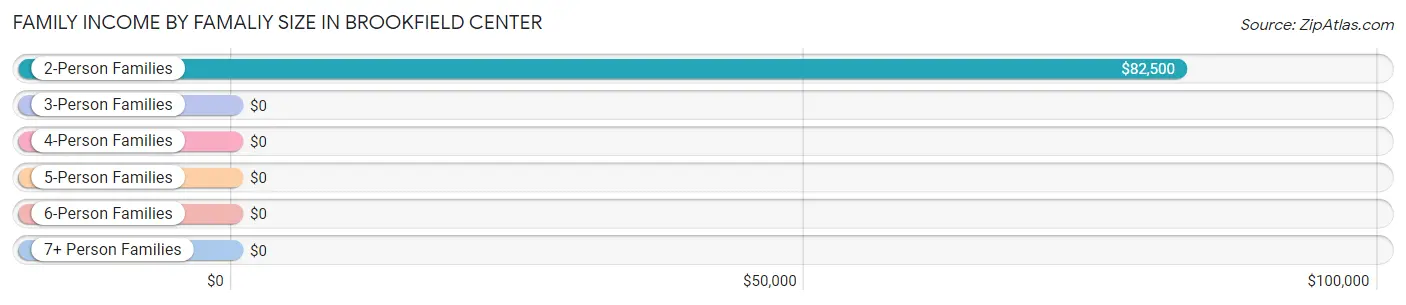
| Income Bracket | # Families | Median Income |
| 2-Person Families | 182 (59.5%) | $82,500 |
| 3-Person Families | 74 (24.2%) | $0 |
| 4-Person Families | 28 (9.1%) | $0 |
| 5-Person Families | 15 (4.9%) | $0 |
| 6-Person Families | 0 (0.0%) | $0 |
| 7+ Person Families | 7 (2.3%) | $0 |
| Total | 306 (100.0%) | $79,444 |
Family Income by Number of Earners in Brookfield Center
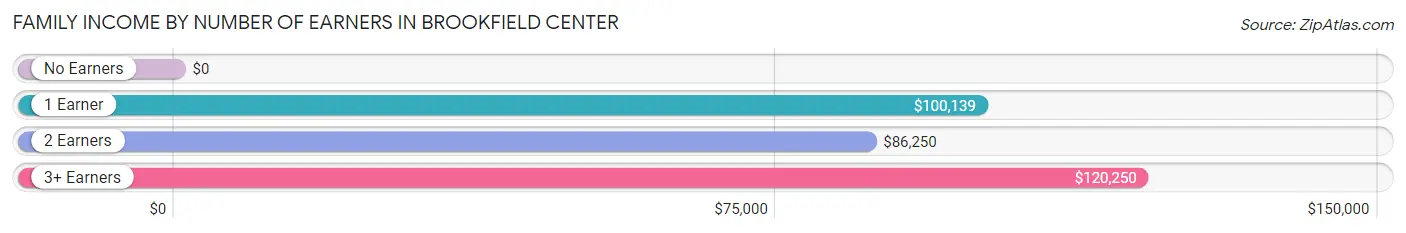
| Number of Earners | # Families | Median Income |
| No Earners | 85 (27.8%) | $0 |
| 1 Earner | 81 (26.5%) | $100,139 |
| 2 Earners | 110 (35.9%) | $86,250 |
| 3+ Earners | 30 (9.8%) | $120,250 |
| Total | 306 (100.0%) | $79,444 |
Household Income in Brookfield Center
Household Income Brackets in Brookfield Center
With 169 households falling in the category, the $15,000 to $24,999 income range is the most frequent in Brookfield Center, accounting for 26.7% of all households.
| Income Bracket | # Households | % Households |
| Less than $10,000 | 22 | 3.5% |
| $10,000 to $14,999 | 0 | 0.0% |
| $15,000 to $24,999 | 169 | 26.7% |
| $25,000 to $34,999 | 53 | 8.4% |
| $35,000 to $49,999 | 59 | 9.3% |
| $50,000 to $74,999 | 113 | 17.9% |
| $75,000 to $99,999 | 75 | 11.8% |
| $100,000 to $149,999 | 99 | 15.6% |
| $150,000 to $199,999 | 24 | 3.8% |
| $200,000+ | 19 | 3.0% |
Household Income by Householder Age in Brookfield Center
The median household income in Brookfield Center is $51,534, with the highest median household income of $87,917 found in the 45 to 64 years age bracket for the primary householder. A total of 147 households (23.2%) fall into this category. Meanwhile, the 15 to 24 years age bracket for the primary householder has the lowest median household income of $0, with 7 households (1.1%) in this group.
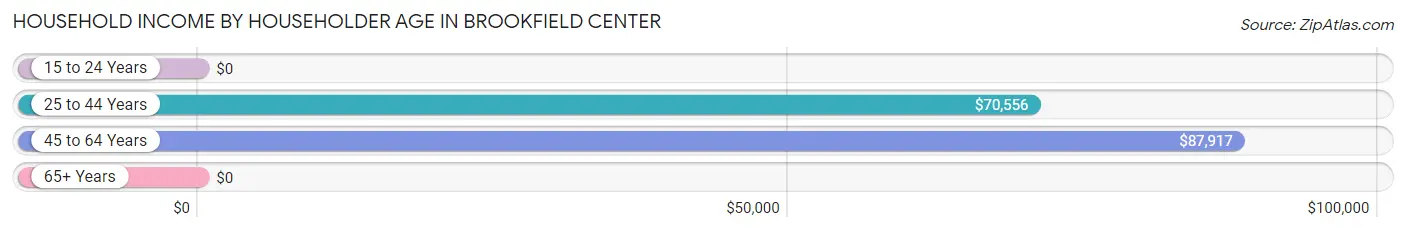
| Income Bracket | # Households | Median Income |
| 15 to 24 Years | 7 (1.1%) | $0 |
| 25 to 44 Years | 126 (19.9%) | $70,556 |
| 45 to 64 Years | 147 (23.2%) | $87,917 |
| 65+ Years | 353 (55.8%) | $0 |
| Total | 633 (100.0%) | $51,534 |
Poverty in Brookfield Center
Income Below Poverty by Sex and Age in Brookfield Center
With 19.9% poverty level for males and 8.3% for females among the residents of Brookfield Center, 6 to 11 year old males and 18 to 24 year old females are the most vulnerable to poverty, with 25 males (73.5%) and 7 females (50.0%) in their respective age groups living below the poverty level.
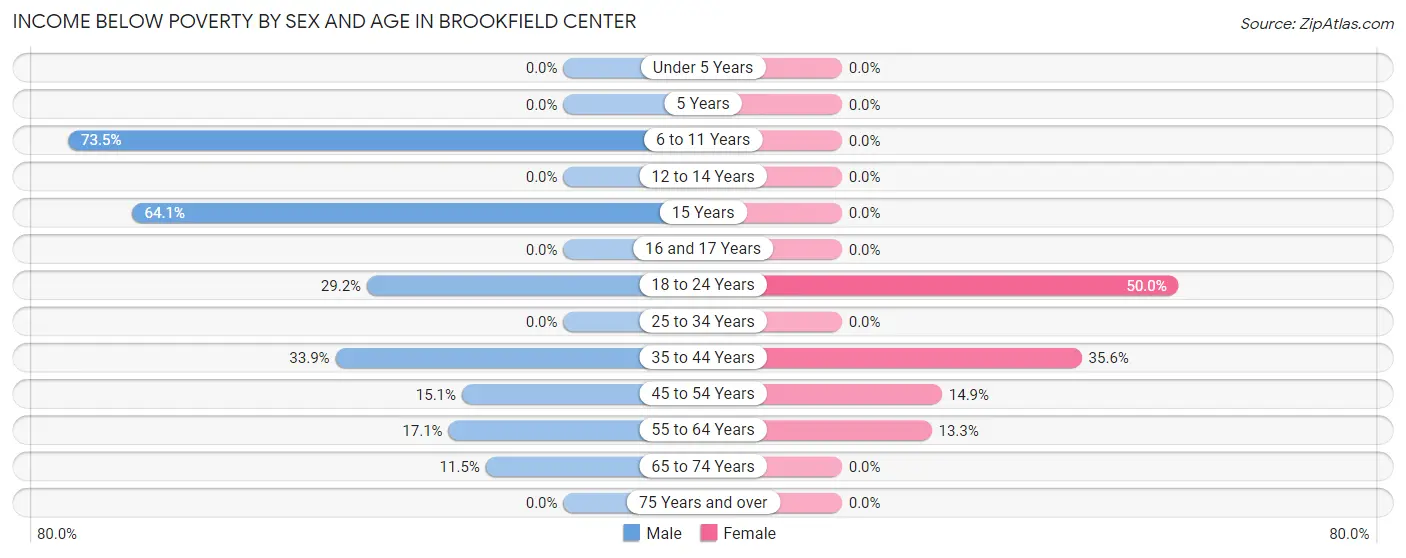
| Age Bracket | Male | Female |
| Under 5 Years | 0 (0.0%) | 0 (0.0%) |
| 5 Years | 0 (0.0%) | 0 (0.0%) |
| 6 to 11 Years | 25 (73.5%) | 0 (0.0%) |
| 12 to 14 Years | 0 (0.0%) | 0 (0.0%) |
| 15 Years | 25 (64.1%) | 0 (0.0%) |
| 16 and 17 Years | 0 (0.0%) | 0 (0.0%) |
| 18 to 24 Years | 7 (29.2%) | 7 (50.0%) |
| 25 to 34 Years | 0 (0.0%) | 0 (0.0%) |
| 35 to 44 Years | 22 (33.9%) | 26 (35.6%) |
| 45 to 54 Years | 11 (15.1%) | 11 (14.9%) |
| 55 to 64 Years | 14 (17.1%) | 12 (13.3%) |
| 65 to 74 Years | 12 (11.5%) | 0 (0.0%) |
| 75 Years and over | 0 (0.0%) | 0 (0.0%) |
| Total | 116 (19.9%) | 56 (8.3%) |
Income Above Poverty by Sex and Age in Brookfield Center
According to the poverty statistics in Brookfield Center, males aged under 5 years and females aged 5 years are the age groups that are most secure financially, with 100.0% of males and 100.0% of females in these age groups living above the poverty line.
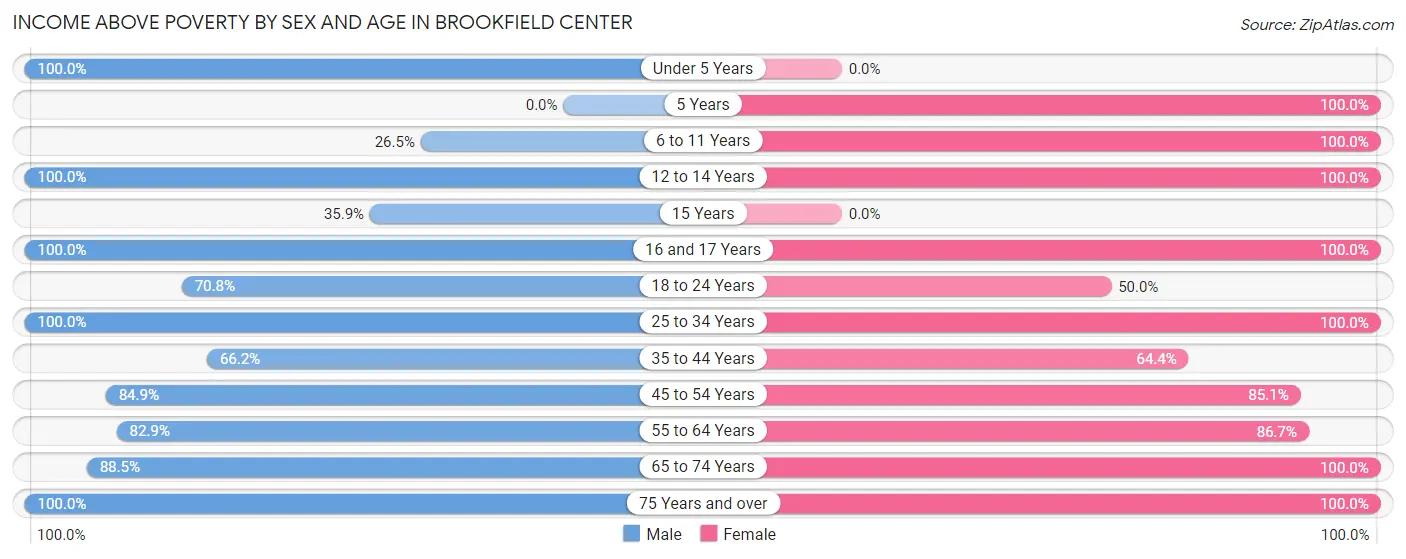
| Age Bracket | Male | Female |
| Under 5 Years | 8 (100.0%) | 0 (0.0%) |
| 5 Years | 0 (0.0%) | 11 (100.0%) |
| 6 to 11 Years | 9 (26.5%) | 19 (100.0%) |
| 12 to 14 Years | 9 (100.0%) | 19 (100.0%) |
| 15 Years | 14 (35.9%) | 0 (0.0%) |
| 16 and 17 Years | 39 (100.0%) | 7 (100.0%) |
| 18 to 24 Years | 17 (70.8%) | 7 (50.0%) |
| 25 to 34 Years | 53 (100.0%) | 56 (100.0%) |
| 35 to 44 Years | 43 (66.1%) | 47 (64.4%) |
| 45 to 54 Years | 62 (84.9%) | 63 (85.1%) |
| 55 to 64 Years | 68 (82.9%) | 78 (86.7%) |
| 65 to 74 Years | 92 (88.5%) | 119 (100.0%) |
| 75 Years and over | 53 (100.0%) | 190 (100.0%) |
| Total | 467 (80.1%) | 616 (91.7%) |
Income Below Poverty Among Married-Couple Families in Brookfield Center
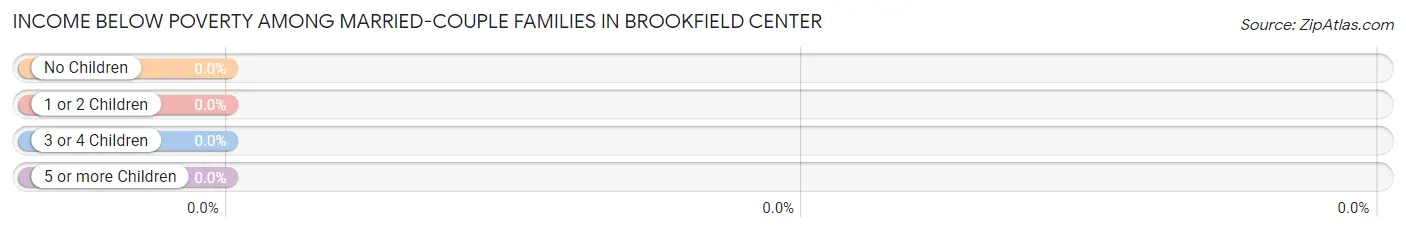
| Children | Above Poverty | Below Poverty |
| No Children | 192 (100.0%) | 0 (0.0%) |
| 1 or 2 Children | 21 (100.0%) | 0 (0.0%) |
| 3 or 4 Children | 16 (100.0%) | 0 (0.0%) |
| 5 or more Children | 0 (0.0%) | 0 (0.0%) |
| Total | 229 (100.0%) | 0 (0.0%) |
Income Below Poverty Among Single-Parent Households in Brookfield Center
According to the poverty data in Brookfield Center, 100.0% or 7 single-father households and 34.3% or 24 single-mother households are living below the poverty line. Among single-father households, those with no children have the highest poverty rate, with 7 households (100.0%) experiencing poverty. Likewise, among single-mother households, those with 1 or 2 children have the highest poverty rate, with 24 households (46.2%) falling below the poverty line.
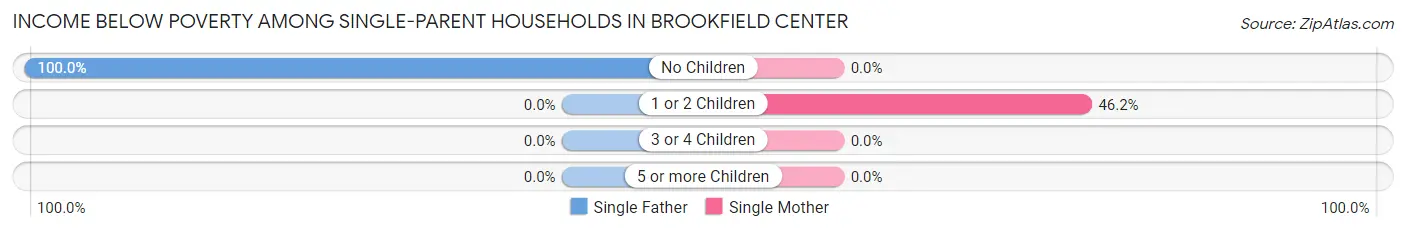
| Children | Single Father | Single Mother |
| No Children | 7 (100.0%) | 0 (0.0%) |
| 1 or 2 Children | 0 (0.0%) | 24 (46.2%) |
| 3 or 4 Children | 0 (0.0%) | 0 (0.0%) |
| 5 or more Children | 0 (0.0%) | 0 (0.0%) |
| Total | 7 (100.0%) | 24 (34.3%) |
Income Below Poverty Among Married-Couple vs Single-Parent Households in Brookfield Center
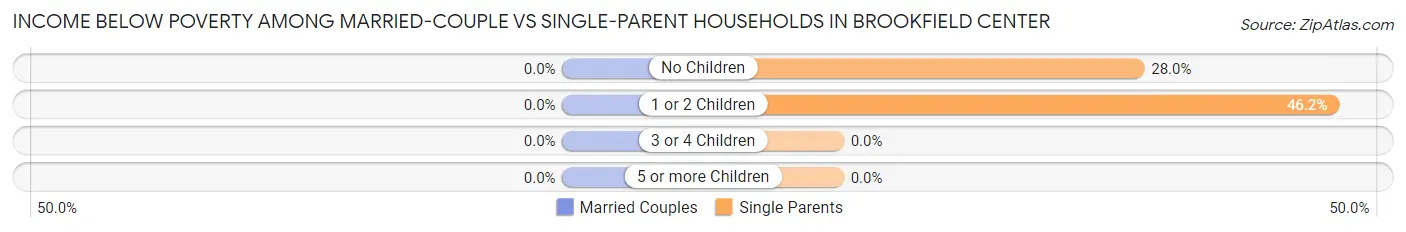
| Children | Married-Couple Families | Single-Parent Households |
| No Children | 0 (0.0%) | 7 (28.0%) |
| 1 or 2 Children | 0 (0.0%) | 24 (46.2%) |
| 3 or 4 Children | 0 (0.0%) | 0 (0.0%) |
| 5 or more Children | 0 (0.0%) | 0 (0.0%) |
| Total | 0 (0.0%) | 31 (40.3%) |
Employment Characteristics in Brookfield Center
Employment by Class of Employer in Brookfield Center
Among the 515 employed individuals in Brookfield Center, private company employees (427 | 82.9%), not-for-profit organizations (29 | 5.6%), and self-employed (incorporated) (23 | 4.5%) make up the most common classes of employment.
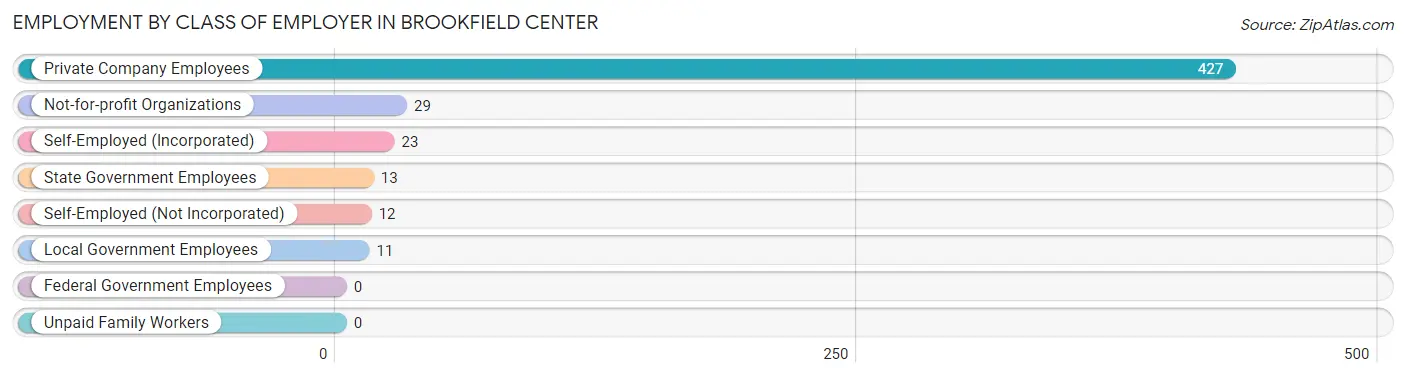
| Employer Class | # Employees | % Employees |
| Private Company Employees | 427 | 82.9% |
| Self-Employed (Incorporated) | 23 | 4.5% |
| Self-Employed (Not Incorporated) | 12 | 2.3% |
| Not-for-profit Organizations | 29 | 5.6% |
| Local Government Employees | 11 | 2.1% |
| State Government Employees | 13 | 2.5% |
| Federal Government Employees | 0 | 0.0% |
| Unpaid Family Workers | 0 | 0.0% |
| Total | 515 | 100.0% |
Employment Status by Age in Brookfield Center
According to the labor force statistics for Brookfield Center, out of the total population over 16 years of age (1,116), 48.5% or 541 individuals are in the labor force, with 2.8% or 15 of them unemployed. The age group with the highest labor force participation rate is 25 to 29 years, with 100.0% or 75 individuals in the labor force. Within the labor force, the 60 to 64 years age range has the highest percentage of unemployed individuals, with 8.8% or 6 of them being unemployed.
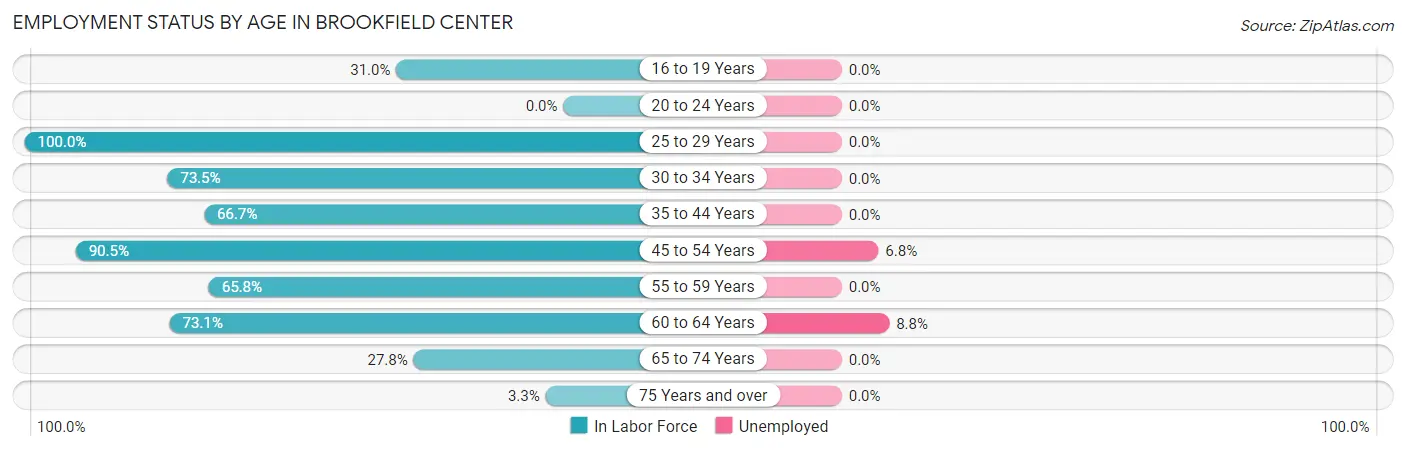
| Age Bracket | In Labor Force | Unemployed |
| 16 to 19 Years | 26 (31.0%) | 0 (0.0%) |
| 20 to 24 Years | 0 (0.0%) | 0 (0.0%) |
| 25 to 29 Years | 75 (100.0%) | 0 (0.0%) |
| 30 to 34 Years | 25 (73.5%) | 0 (0.0%) |
| 35 to 44 Years | 92 (66.7%) | 0 (0.0%) |
| 45 to 54 Years | 133 (90.5%) | 9 (6.8%) |
| 55 to 59 Years | 52 (65.8%) | 0 (0.0%) |
| 60 to 64 Years | 68 (73.1%) | 6 (8.8%) |
| 65 to 74 Years | 62 (27.8%) | 0 (0.0%) |
| 75 Years and over | 8 (3.3%) | 0 (0.0%) |
| Total | 541 (48.5%) | 15 (2.8%) |
Employment Status by Educational Attainment in Brookfield Center
According to labor force statistics for Brookfield Center, 78.6% of individuals (445) out of the total population between 25 and 64 years of age (566) are in the labor force, with 3.4% or 15 of them being unemployed. The group with the highest labor force participation rate are those with the educational attainment of high school diploma, with 84.6% or 226 individuals in the labor force. Within the labor force, individuals with bachelor's degree or higher education have the highest percentage of unemployment, with 12.5% or 9 of them being unemployed.
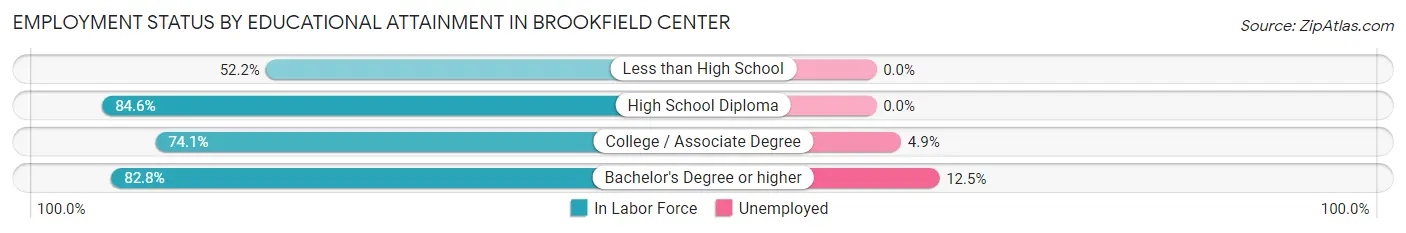
| Educational Attainment | In Labor Force | Unemployed |
| Less than High School | 24 (52.2%) | 0 (0.0%) |
| High School Diploma | 226 (84.6%) | 0 (0.0%) |
| College / Associate Degree | 123 (74.1%) | 8 (4.9%) |
| Bachelor's Degree or higher | 72 (82.8%) | 11 (12.5%) |
| Total | 445 (78.6%) | 19 (3.4%) |
Employment Occupations by Sex in Brookfield Center
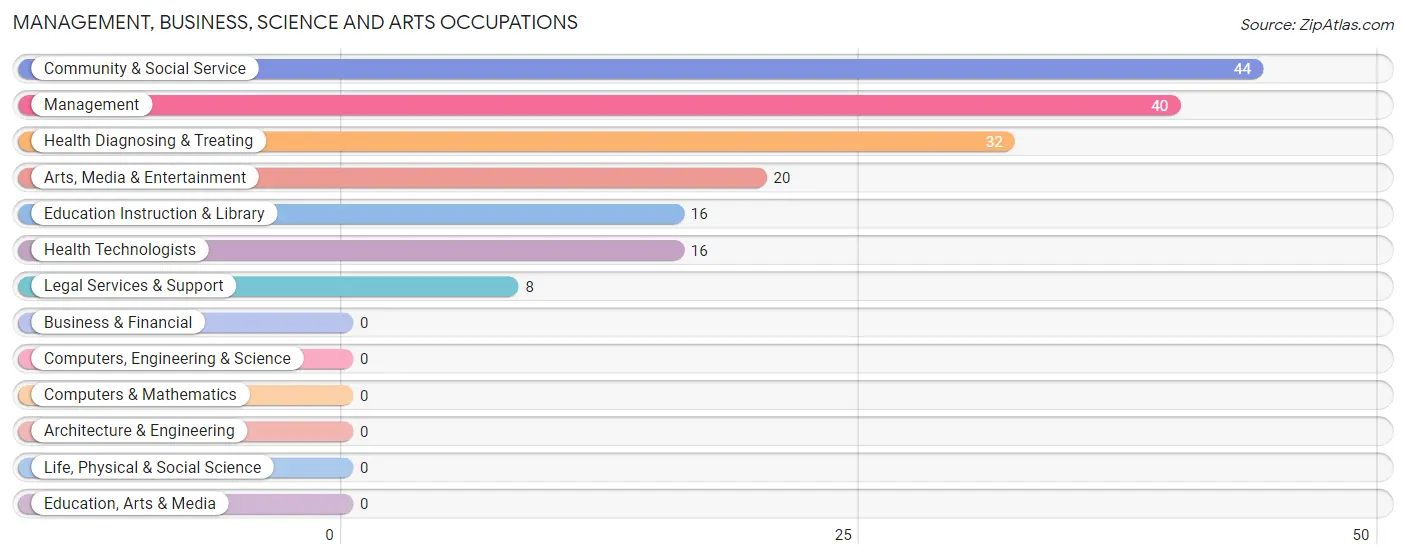
Management, Business, Science and Arts Occupations
The most common Management, Business, Science and Arts occupations in Brookfield Center are Community & Social Service (44 | 8.4%), Management (40 | 7.6%), Health Diagnosing & Treating (32 | 6.1%), Arts, Media & Entertainment (20 | 3.8%), and Education Instruction & Library (16 | 3.0%).
Management, Business, Science and Arts Occupations by Sex
Within the Management, Business, Science and Arts occupations in Brookfield Center, the most male-oriented occupations are Management (82.5%), Education Instruction & Library (37.5%), and Community & Social Service (13.6%), while the most female-oriented occupations are Legal Services & Support (100.0%), Arts, Media & Entertainment (100.0%), and Health Diagnosing & Treating (100.0%).
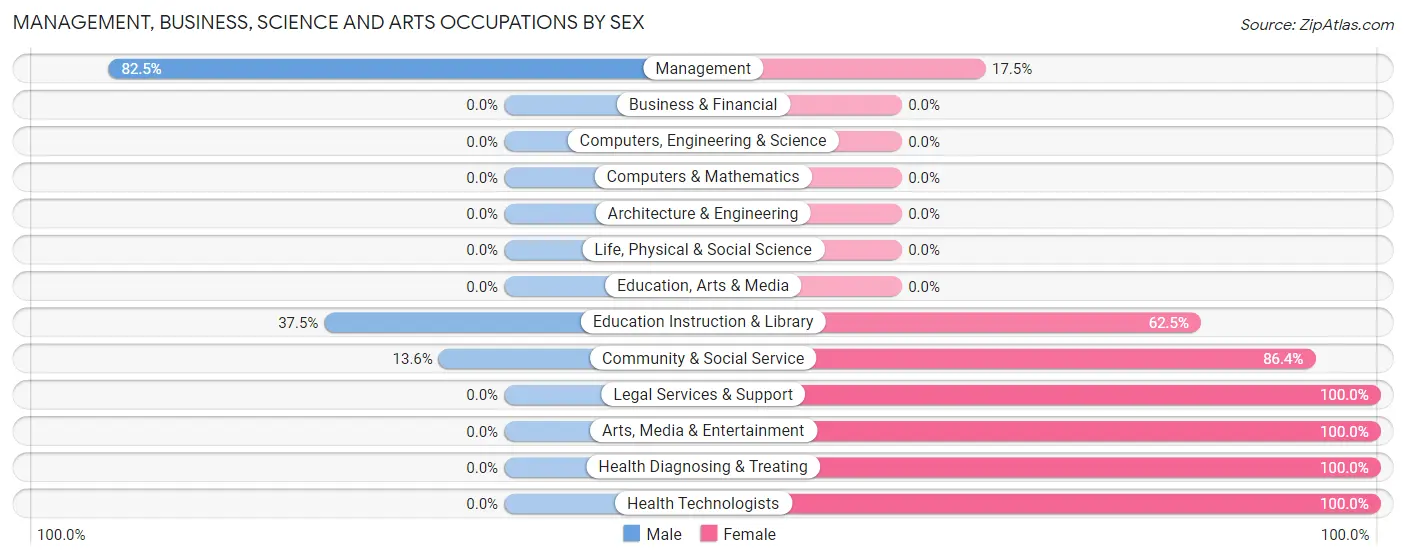
| Occupation | Male | Female |
| Management | 33 (82.5%) | 7 (17.5%) |
| Business & Financial | 0 (0.0%) | 0 (0.0%) |
| Computers, Engineering & Science | 0 (0.0%) | 0 (0.0%) |
| Computers & Mathematics | 0 (0.0%) | 0 (0.0%) |
| Architecture & Engineering | 0 (0.0%) | 0 (0.0%) |
| Life, Physical & Social Science | 0 (0.0%) | 0 (0.0%) |
| Community & Social Service | 6 (13.6%) | 38 (86.4%) |
| Education, Arts & Media | 0 (0.0%) | 0 (0.0%) |
| Legal Services & Support | 0 (0.0%) | 8 (100.0%) |
| Education Instruction & Library | 6 (37.5%) | 10 (62.5%) |
| Arts, Media & Entertainment | 0 (0.0%) | 20 (100.0%) |
| Health Diagnosing & Treating | 0 (0.0%) | 32 (100.0%) |
| Health Technologists | 0 (0.0%) | 16 (100.0%) |
| Total (Category) | 39 (33.6%) | 77 (66.4%) |
| Total (Overall) | 253 (48.1%) | 273 (51.9%) |
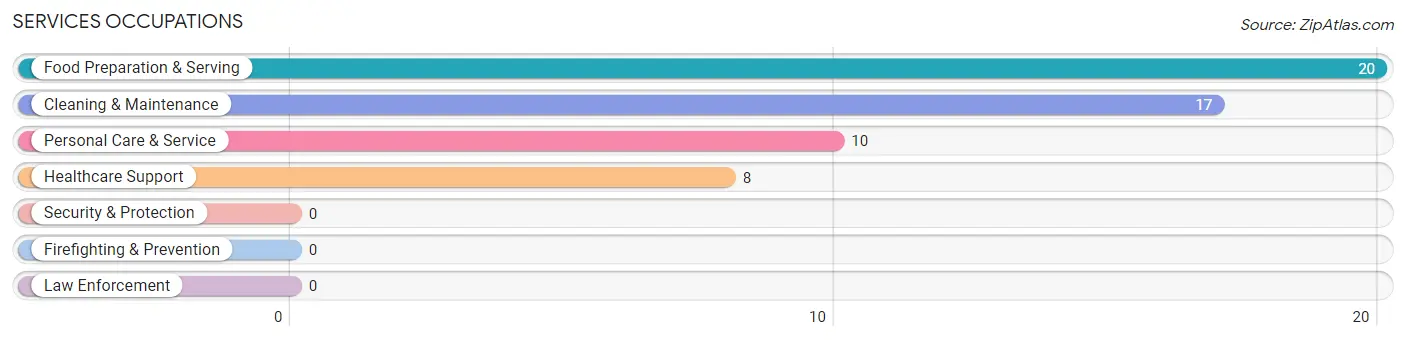
Services Occupations
The most common Services occupations in Brookfield Center are Food Preparation & Serving (20 | 3.8%), Cleaning & Maintenance (17 | 3.2%), Personal Care & Service (10 | 1.9%), and Healthcare Support (8 | 1.5%).
Services Occupations by Sex
Within the Services occupations in Brookfield Center, the most male-oriented occupations are Food Preparation & Serving (60.0%), and Cleaning & Maintenance (11.8%), while the most female-oriented occupations are Healthcare Support (100.0%), Personal Care & Service (100.0%), and Cleaning & Maintenance (88.2%).
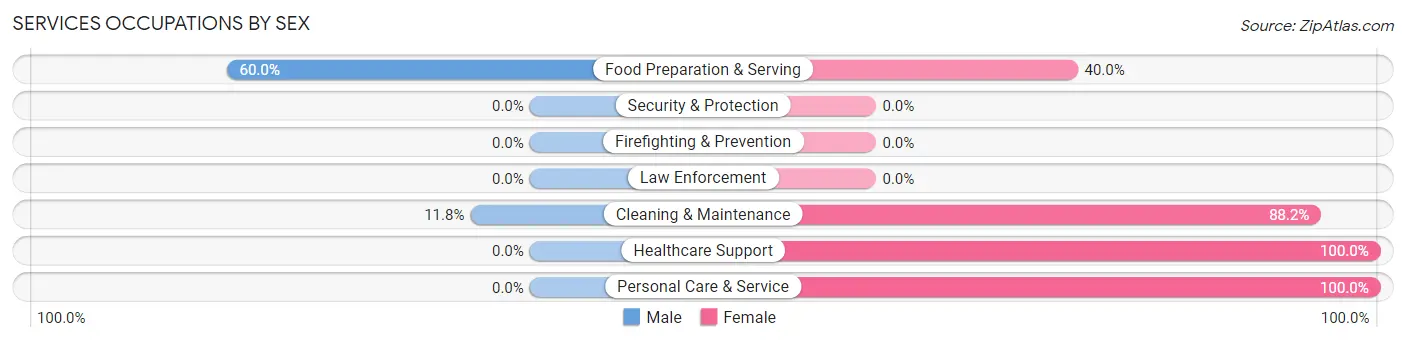
| Occupation | Male | Female |
| Healthcare Support | 0 (0.0%) | 8 (100.0%) |
| Security & Protection | 0 (0.0%) | 0 (0.0%) |
| Firefighting & Prevention | 0 (0.0%) | 0 (0.0%) |
| Law Enforcement | 0 (0.0%) | 0 (0.0%) |
| Food Preparation & Serving | 12 (60.0%) | 8 (40.0%) |
| Cleaning & Maintenance | 2 (11.8%) | 15 (88.2%) |
| Personal Care & Service | 0 (0.0%) | 10 (100.0%) |
| Total (Category) | 14 (25.5%) | 41 (74.6%) |
| Total (Overall) | 253 (48.1%) | 273 (51.9%) |
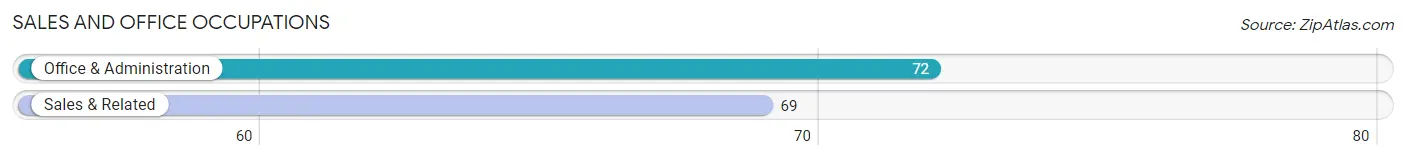
Sales and Office Occupations
The most common Sales and Office occupations in Brookfield Center are Office & Administration (72 | 13.7%), and Sales & Related (69 | 13.1%).
Sales and Office Occupations by Sex
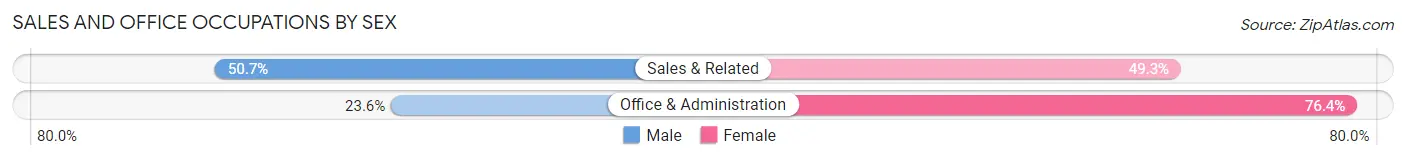
| Occupation | Male | Female |
| Sales & Related | 35 (50.7%) | 34 (49.3%) |
| Office & Administration | 17 (23.6%) | 55 (76.4%) |
| Total (Category) | 52 (36.9%) | 89 (63.1%) |
| Total (Overall) | 253 (48.1%) | 273 (51.9%) |
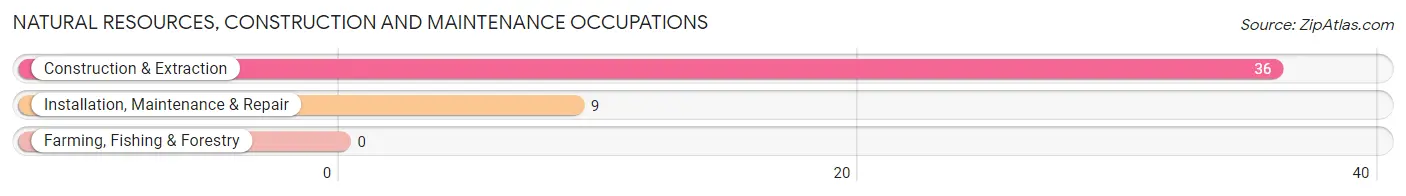
Natural Resources, Construction and Maintenance Occupations
The most common Natural Resources, Construction and Maintenance occupations in Brookfield Center are Construction & Extraction (36 | 6.8%), and Installation, Maintenance & Repair (9 | 1.7%).
Natural Resources, Construction and Maintenance Occupations by Sex
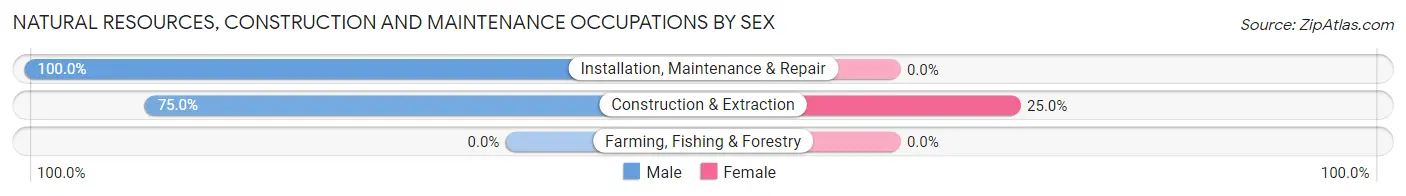
| Occupation | Male | Female |
| Farming, Fishing & Forestry | 0 (0.0%) | 0 (0.0%) |
| Construction & Extraction | 27 (75.0%) | 9 (25.0%) |
| Installation, Maintenance & Repair | 9 (100.0%) | 0 (0.0%) |
| Total (Category) | 36 (80.0%) | 9 (20.0%) |
| Total (Overall) | 253 (48.1%) | 273 (51.9%) |
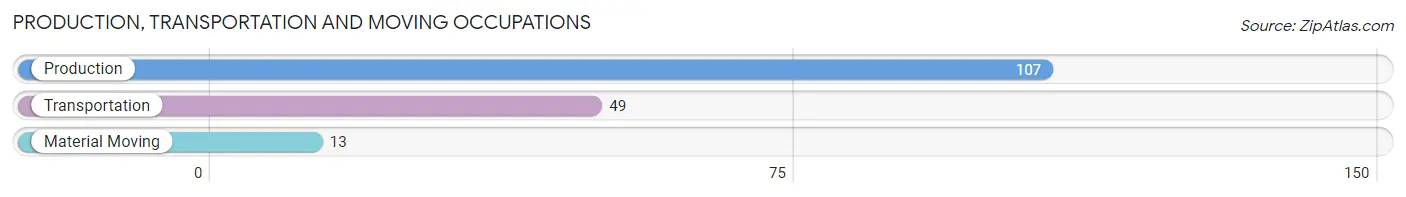
Production, Transportation and Moving Occupations
The most common Production, Transportation and Moving occupations in Brookfield Center are Production (107 | 20.3%), Transportation (49 | 9.3%), and Material Moving (13 | 2.5%).
Production, Transportation and Moving Occupations by Sex
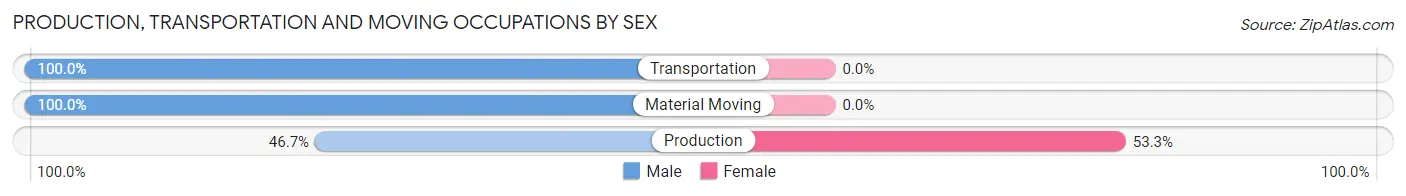
| Occupation | Male | Female |
| Production | 50 (46.7%) | 57 (53.3%) |
| Transportation | 49 (100.0%) | 0 (0.0%) |
| Material Moving | 13 (100.0%) | 0 (0.0%) |
| Total (Category) | 112 (66.3%) | 57 (33.7%) |
| Total (Overall) | 253 (48.1%) | 273 (51.9%) |
Employment Industries by Sex in Brookfield Center
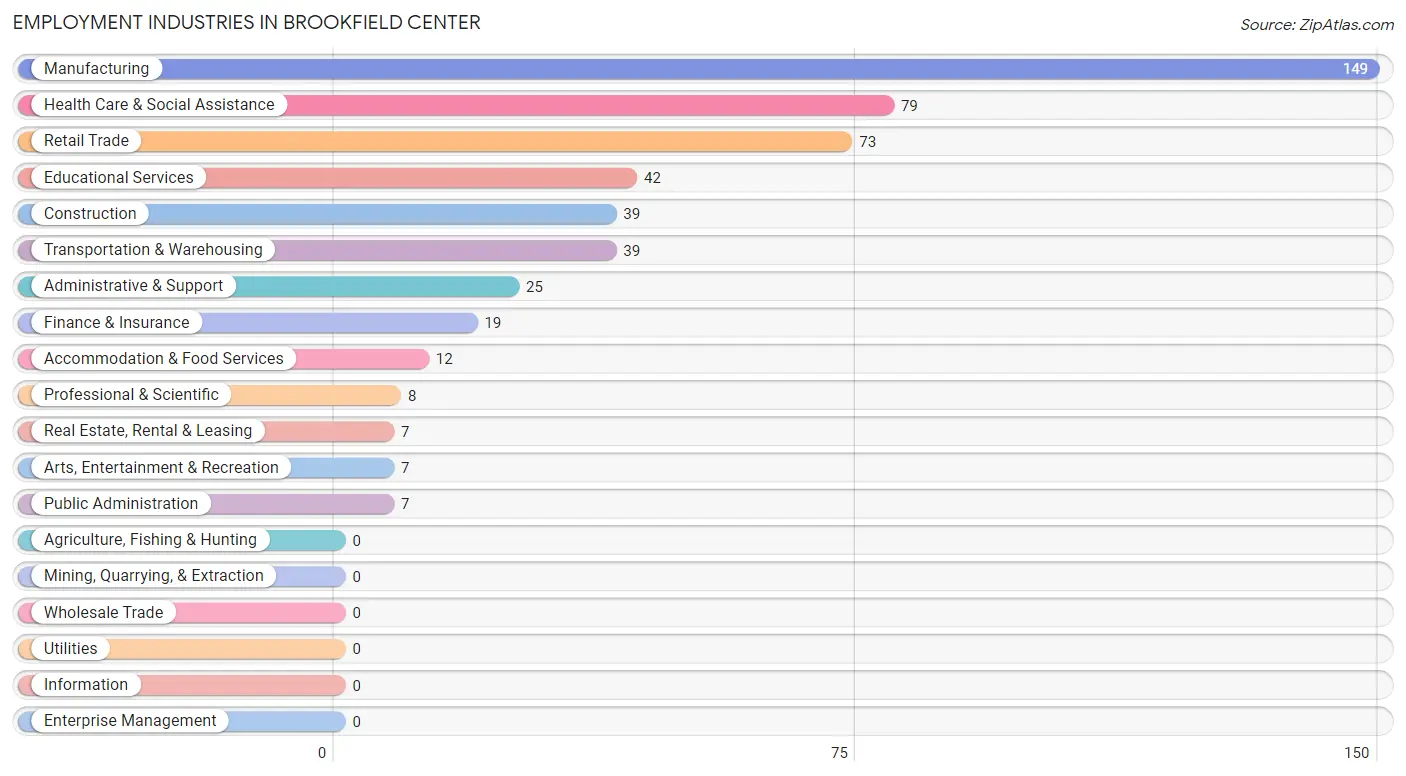
Employment Industries in Brookfield Center
The major employment industries in Brookfield Center include Manufacturing (149 | 28.3%), Health Care & Social Assistance (79 | 15.0%), Retail Trade (73 | 13.9%), Educational Services (42 | 8.0%), and Construction (39 | 7.4%).
Employment Industries by Sex in Brookfield Center
The Brookfield Center industries that see more men than women are Transportation & Warehousing (100.0%), Accommodation & Food Services (100.0%), and Construction (76.9%), whereas the industries that tend to have a higher number of women are Finance & Insurance (100.0%), Real Estate, Rental & Leasing (100.0%), and Professional & Scientific (100.0%).
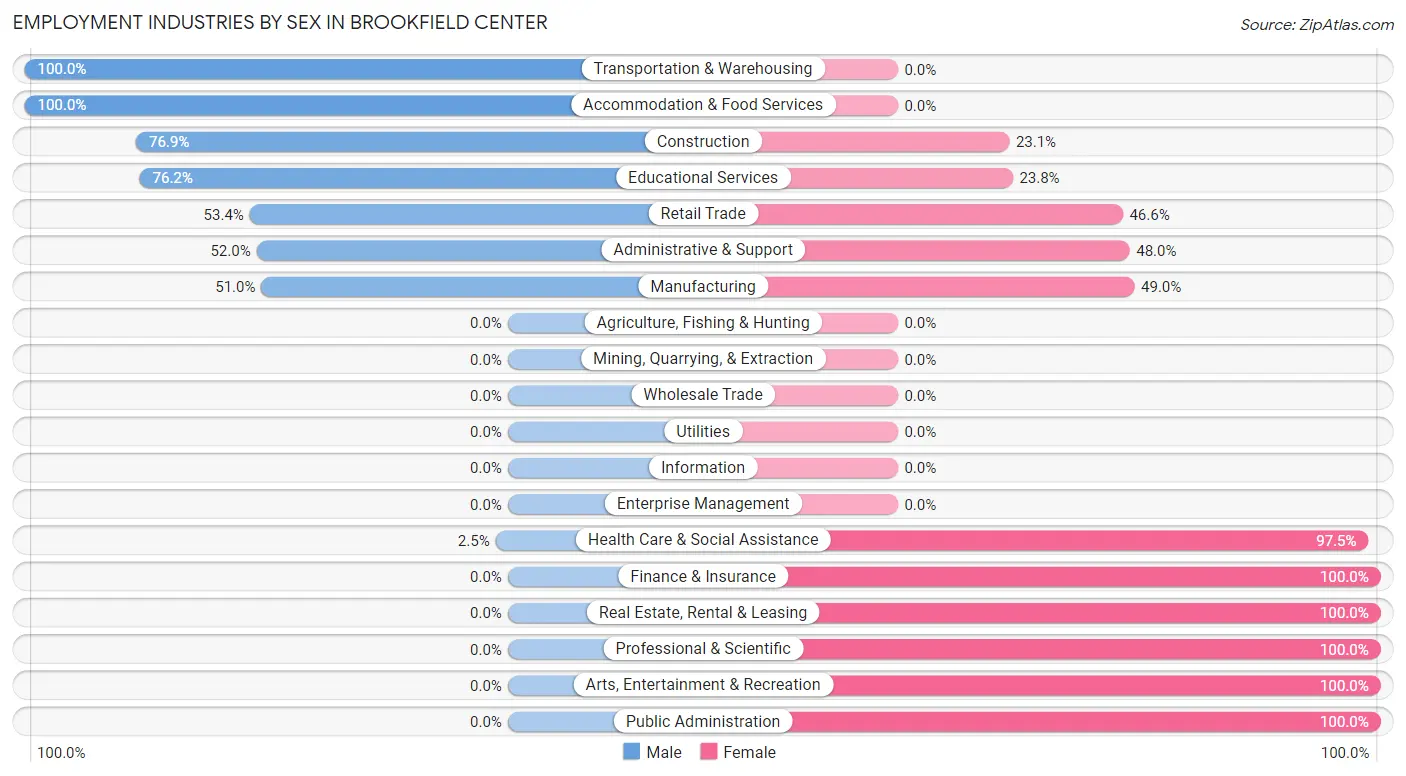
| Industry | Male | Female |
| Agriculture, Fishing & Hunting | 0 (0.0%) | 0 (0.0%) |
| Mining, Quarrying, & Extraction | 0 (0.0%) | 0 (0.0%) |
| Construction | 30 (76.9%) | 9 (23.1%) |
| Manufacturing | 76 (51.0%) | 73 (49.0%) |
| Wholesale Trade | 0 (0.0%) | 0 (0.0%) |
| Retail Trade | 39 (53.4%) | 34 (46.6%) |
| Transportation & Warehousing | 39 (100.0%) | 0 (0.0%) |
| Utilities | 0 (0.0%) | 0 (0.0%) |
| Information | 0 (0.0%) | 0 (0.0%) |
| Finance & Insurance | 0 (0.0%) | 19 (100.0%) |
| Real Estate, Rental & Leasing | 0 (0.0%) | 7 (100.0%) |
| Professional & Scientific | 0 (0.0%) | 8 (100.0%) |
| Enterprise Management | 0 (0.0%) | 0 (0.0%) |
| Administrative & Support | 13 (52.0%) | 12 (48.0%) |
| Educational Services | 32 (76.2%) | 10 (23.8%) |
| Health Care & Social Assistance | 2 (2.5%) | 77 (97.5%) |
| Arts, Entertainment & Recreation | 0 (0.0%) | 7 (100.0%) |
| Accommodation & Food Services | 12 (100.0%) | 0 (0.0%) |
| Public Administration | 0 (0.0%) | 7 (100.0%) |
| Total | 253 (48.1%) | 273 (51.9%) |
Education in Brookfield Center
School Enrollment in Brookfield Center
The most common levels of schooling among the 183 students in Brookfield Center are high school (71 | 38.8%), middle school (53 | 29.0%), and college / undergraduate (31 | 16.9%).
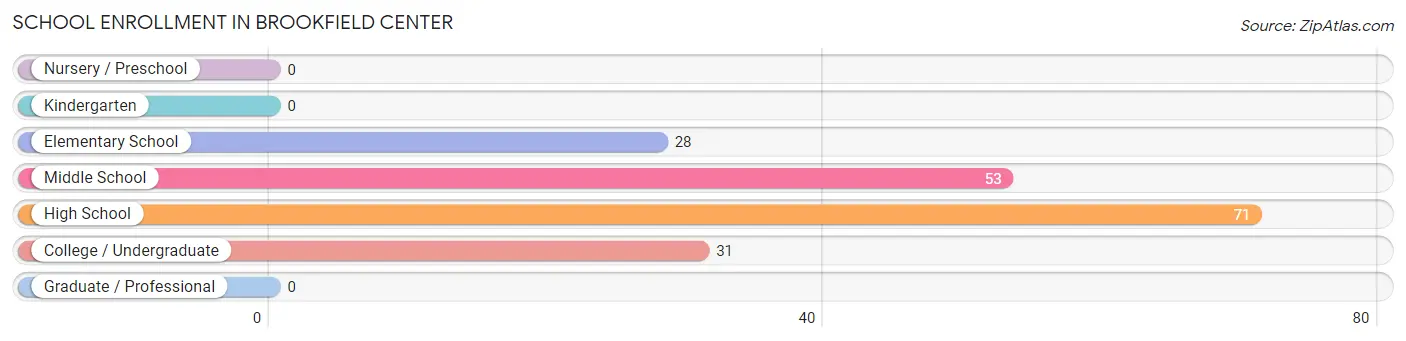
| School Level | # Students | % Students |
| Nursery / Preschool | 0 | 0.0% |
| Kindergarten | 0 | 0.0% |
| Elementary School | 28 | 15.3% |
| Middle School | 53 | 29.0% |
| High School | 71 | 38.8% |
| College / Undergraduate | 31 | 16.9% |
| Graduate / Professional | 0 | 0.0% |
| Total | 183 | 100.0% |
School Enrollment by Age by Funding Source in Brookfield Center
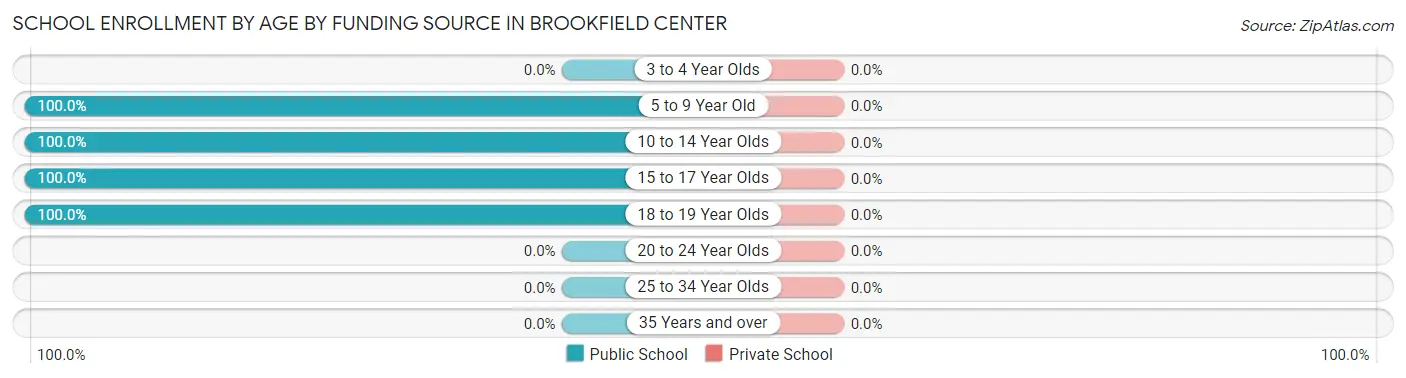
| Age Bracket | Public School | Private School |
| 3 to 4 Year Olds | 0 (0.0%) | 0 (0.0%) |
| 5 to 9 Year Old | 19 (100.0%) | 0 (0.0%) |
| 10 to 14 Year Olds | 62 (100.0%) | 0 (0.0%) |
| 15 to 17 Year Olds | 71 (100.0%) | 0 (0.0%) |
| 18 to 19 Year Olds | 31 (100.0%) | 0 (0.0%) |
| 20 to 24 Year Olds | 0 (0.0%) | 0 (0.0%) |
| 25 to 34 Year Olds | 0 (0.0%) | 0 (0.0%) |
| 35 Years and over | 0 (0.0%) | 0 (0.0%) |
| Total | 183 (100.0%) | 0 (0.0%) |
Educational Attainment by Field of Study in Brookfield Center
Education (54 | 31.8%), engineering (20 | 11.8%), arts & humanities (18 | 10.6%), business (17 | 10.0%), and visual & performing arts (17 | 10.0%) are the most common fields of study among 170 individuals in Brookfield Center who have obtained a bachelor's degree or higher.
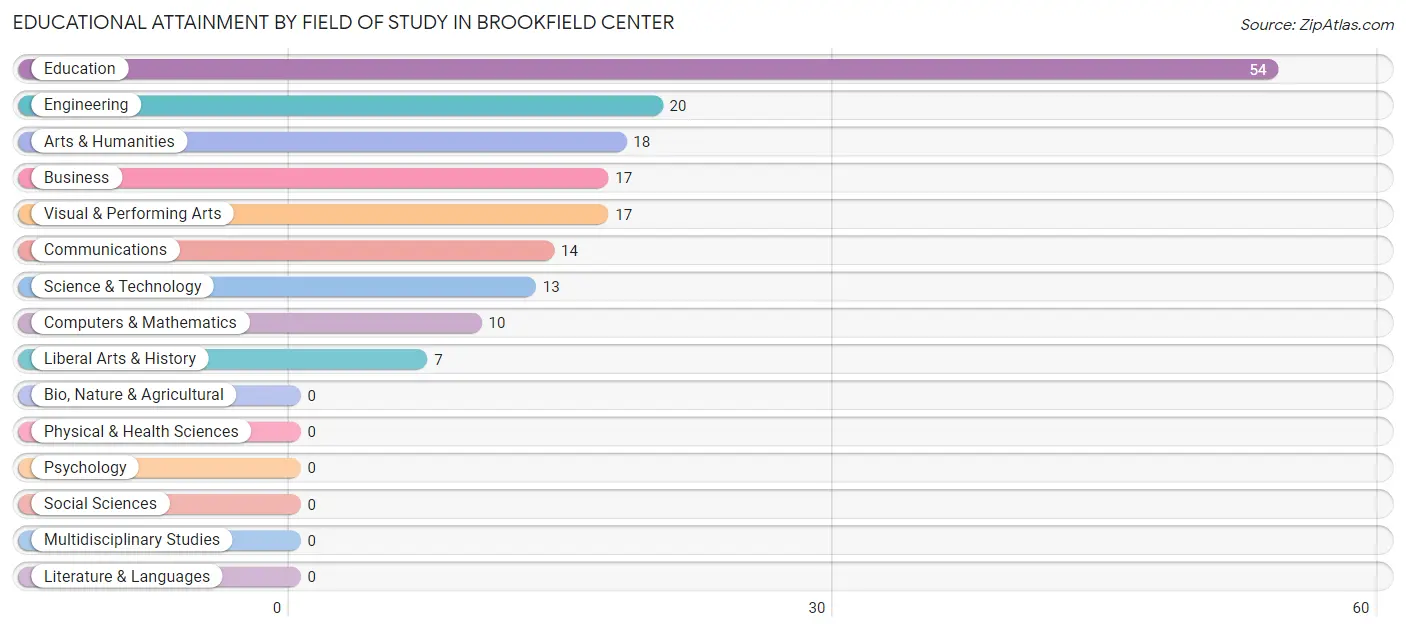
| Field of Study | # Graduates | % Graduates |
| Computers & Mathematics | 10 | 5.9% |
| Bio, Nature & Agricultural | 0 | 0.0% |
| Physical & Health Sciences | 0 | 0.0% |
| Psychology | 0 | 0.0% |
| Social Sciences | 0 | 0.0% |
| Engineering | 20 | 11.8% |
| Multidisciplinary Studies | 0 | 0.0% |
| Science & Technology | 13 | 7.6% |
| Business | 17 | 10.0% |
| Education | 54 | 31.8% |
| Literature & Languages | 0 | 0.0% |
| Liberal Arts & History | 7 | 4.1% |
| Visual & Performing Arts | 17 | 10.0% |
| Communications | 14 | 8.2% |
| Arts & Humanities | 18 | 10.6% |
| Total | 170 | 100.0% |
Transportation & Commute in Brookfield Center
Vehicle Availability by Sex in Brookfield Center
The most prevalent vehicle ownership categories in Brookfield Center are males with 2 vehicles (90, accounting for 36.1%) and females with 2 vehicles (122, making up 34.4%).
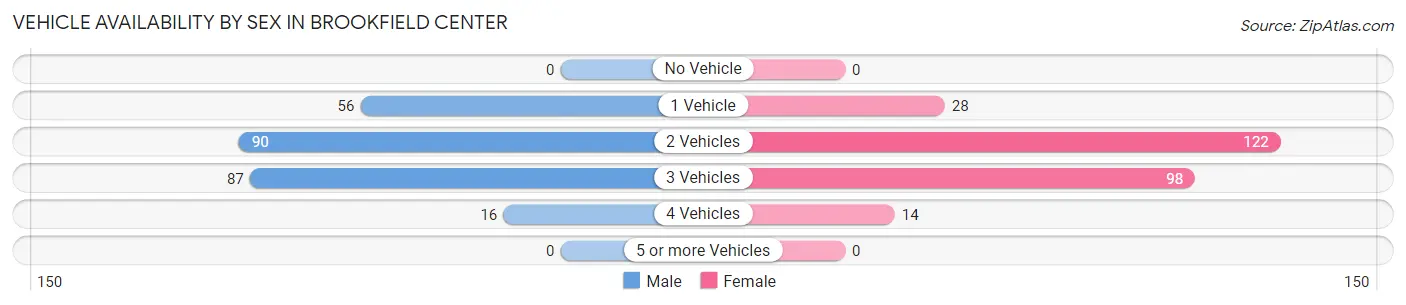
| Vehicles Available | Male | Female |
| No Vehicle | 0 (0.0%) | 0 (0.0%) |
| 1 Vehicle | 56 (22.5%) | 28 (10.7%) |
| 2 Vehicles | 90 (36.1%) | 122 (46.6%) |
| 3 Vehicles | 87 (34.9%) | 98 (37.4%) |
| 4 Vehicles | 16 (6.4%) | 14 (5.3%) |
| 5 or more Vehicles | 0 (0.0%) | 0 (0.0%) |
| Total | 249 (100.0%) | 262 (100.0%) |
Commute Time in Brookfield Center
The most frequently occuring commute durations in Brookfield Center are less than 5 minutes (112 commuters, 22.2%), 15 to 19 minutes (103 commuters, 20.4%), and 20 to 24 minutes (96 commuters, 19.0%).
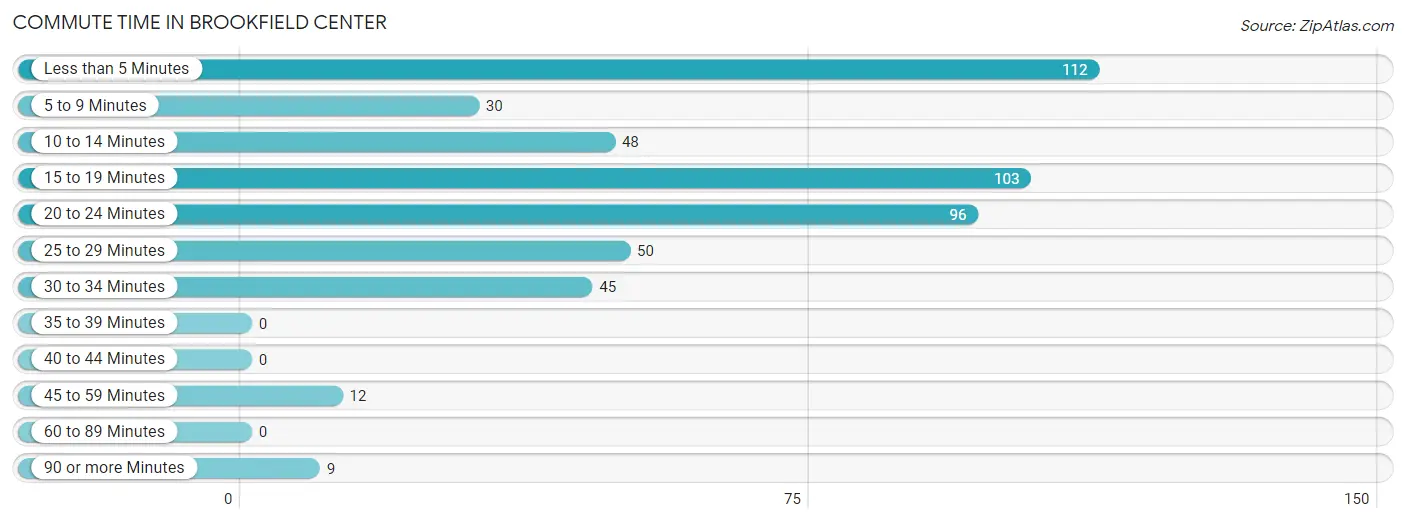
| Commute Time | # Commuters | % Commuters |
| Less than 5 Minutes | 112 | 22.2% |
| 5 to 9 Minutes | 30 | 5.9% |
| 10 to 14 Minutes | 48 | 9.5% |
| 15 to 19 Minutes | 103 | 20.4% |
| 20 to 24 Minutes | 96 | 19.0% |
| 25 to 29 Minutes | 50 | 9.9% |
| 30 to 34 Minutes | 45 | 8.9% |
| 35 to 39 Minutes | 0 | 0.0% |
| 40 to 44 Minutes | 0 | 0.0% |
| 45 to 59 Minutes | 12 | 2.4% |
| 60 to 89 Minutes | 0 | 0.0% |
| 90 or more Minutes | 9 | 1.8% |
Commute Time by Sex in Brookfield Center
The most common commute times in Brookfield Center are less than 5 minutes (59 commuters, 23.5%) for males and 15 to 19 minutes (65 commuters, 25.6%) for females.
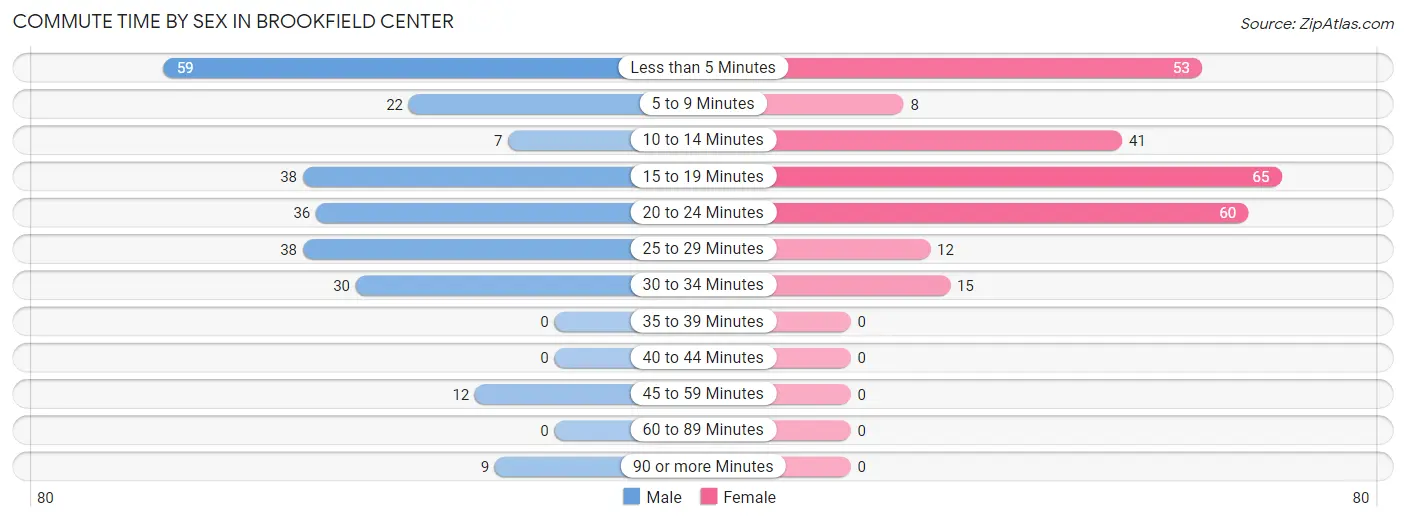
| Commute Time | Male | Female |
| Less than 5 Minutes | 59 (23.5%) | 53 (20.9%) |
| 5 to 9 Minutes | 22 (8.8%) | 8 (3.2%) |
| 10 to 14 Minutes | 7 (2.8%) | 41 (16.1%) |
| 15 to 19 Minutes | 38 (15.1%) | 65 (25.6%) |
| 20 to 24 Minutes | 36 (14.3%) | 60 (23.6%) |
| 25 to 29 Minutes | 38 (15.1%) | 12 (4.7%) |
| 30 to 34 Minutes | 30 (11.9%) | 15 (5.9%) |
| 35 to 39 Minutes | 0 (0.0%) | 0 (0.0%) |
| 40 to 44 Minutes | 0 (0.0%) | 0 (0.0%) |
| 45 to 59 Minutes | 12 (4.8%) | 0 (0.0%) |
| 60 to 89 Minutes | 0 (0.0%) | 0 (0.0%) |
| 90 or more Minutes | 9 (3.6%) | 0 (0.0%) |
Time of Departure to Work by Sex in Brookfield Center
The most frequent times of departure to work in Brookfield Center are 6:30 AM to 6:59 AM (45, 17.9%) for males and 6:30 AM to 6:59 AM (50, 19.7%) for females.
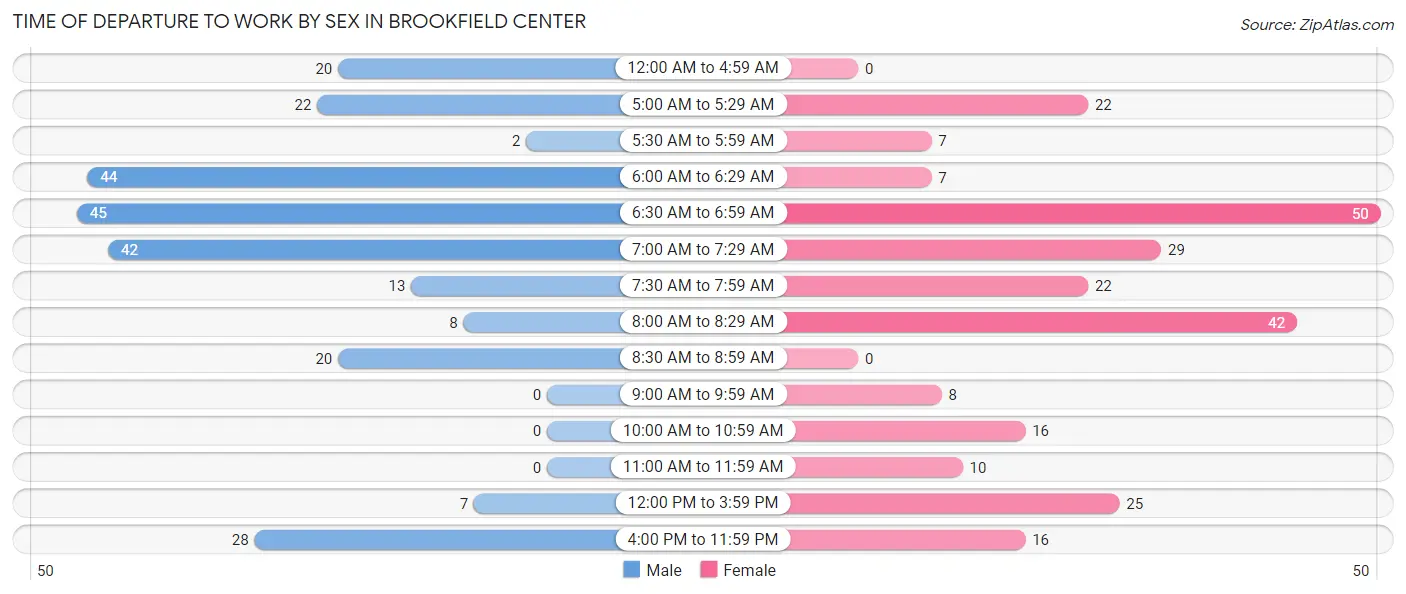
| Time of Departure | Male | Female |
| 12:00 AM to 4:59 AM | 20 (8.0%) | 0 (0.0%) |
| 5:00 AM to 5:29 AM | 22 (8.8%) | 22 (8.7%) |
| 5:30 AM to 5:59 AM | 2 (0.8%) | 7 (2.8%) |
| 6:00 AM to 6:29 AM | 44 (17.5%) | 7 (2.8%) |
| 6:30 AM to 6:59 AM | 45 (17.9%) | 50 (19.7%) |
| 7:00 AM to 7:29 AM | 42 (16.7%) | 29 (11.4%) |
| 7:30 AM to 7:59 AM | 13 (5.2%) | 22 (8.7%) |
| 8:00 AM to 8:29 AM | 8 (3.2%) | 42 (16.5%) |
| 8:30 AM to 8:59 AM | 20 (8.0%) | 0 (0.0%) |
| 9:00 AM to 9:59 AM | 0 (0.0%) | 8 (3.2%) |
| 10:00 AM to 10:59 AM | 0 (0.0%) | 16 (6.3%) |
| 11:00 AM to 11:59 AM | 0 (0.0%) | 10 (3.9%) |
| 12:00 PM to 3:59 PM | 7 (2.8%) | 25 (9.8%) |
| 4:00 PM to 11:59 PM | 28 (11.2%) | 16 (6.3%) |
| Total | 251 (100.0%) | 254 (100.0%) |
Housing Occupancy in Brookfield Center
Occupancy by Ownership in Brookfield Center
Of the total 633 dwellings in Brookfield Center, owner-occupied units account for 540 (85.3%), while renter-occupied units make up 93 (14.7%).
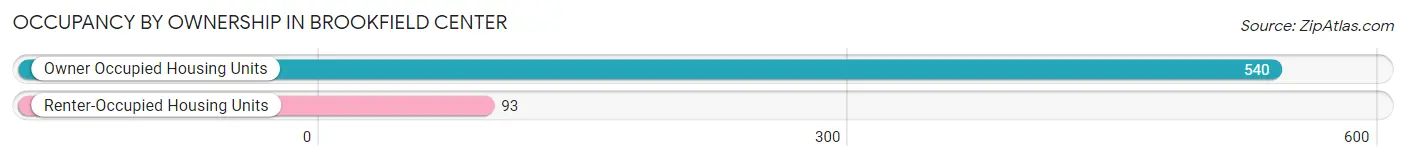
| Occupancy | # Housing Units | % Housing Units |
| Owner Occupied Housing Units | 540 | 85.3% |
| Renter-Occupied Housing Units | 93 | 14.7% |
| Total Occupied Housing Units | 633 | 100.0% |
Occupancy by Household Size in Brookfield Center
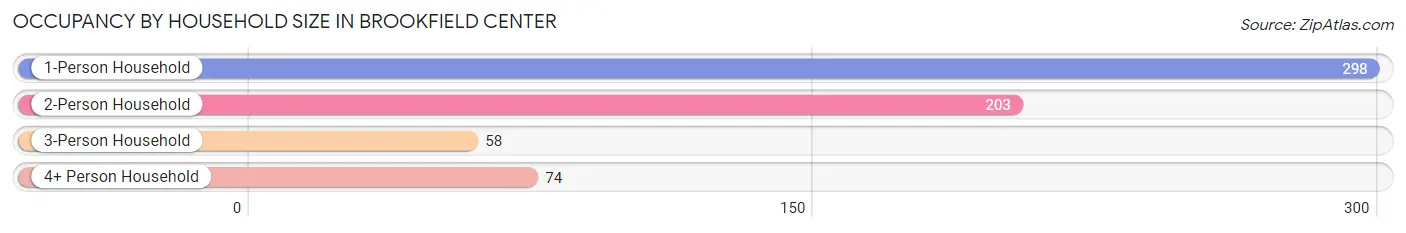
| Household Size | # Housing Units | % Housing Units |
| 1-Person Household | 298 | 47.1% |
| 2-Person Household | 203 | 32.1% |
| 3-Person Household | 58 | 9.2% |
| 4+ Person Household | 74 | 11.7% |
| Total Housing Units | 633 | 100.0% |
Occupancy by Ownership by Household Size in Brookfield Center
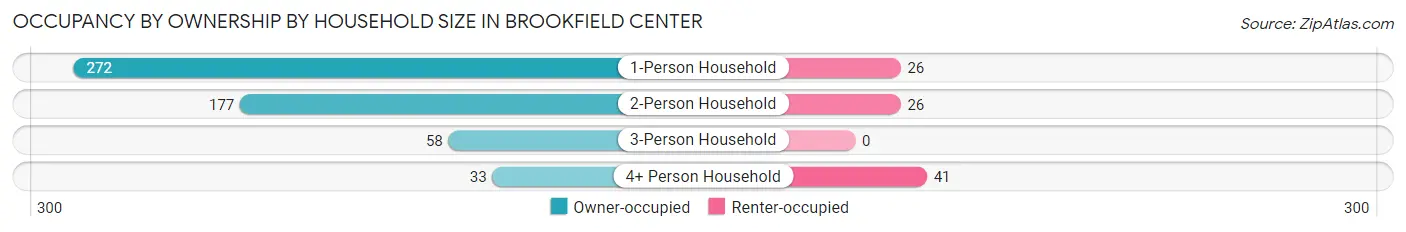
| Household Size | Owner-occupied | Renter-occupied |
| 1-Person Household | 272 (91.3%) | 26 (8.7%) |
| 2-Person Household | 177 (87.2%) | 26 (12.8%) |
| 3-Person Household | 58 (100.0%) | 0 (0.0%) |
| 4+ Person Household | 33 (44.6%) | 41 (55.4%) |
| Total Housing Units | 540 (85.3%) | 93 (14.7%) |
Occupancy by Educational Attainment in Brookfield Center
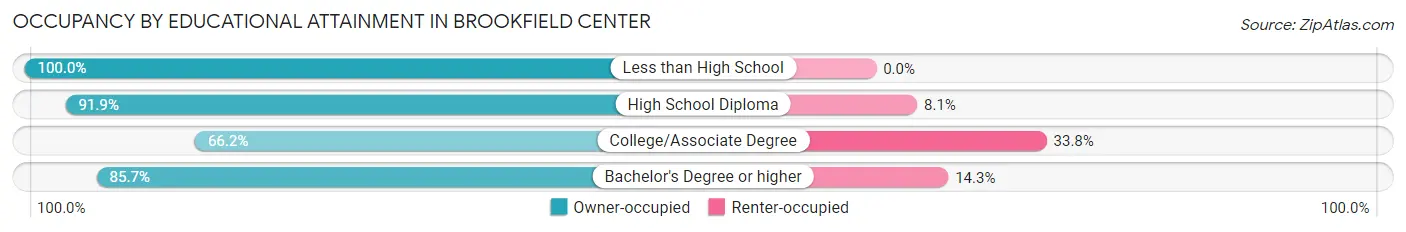
| Household Size | Owner-occupied | Renter-occupied |
| Less than High School | 20 (100.0%) | 0 (0.0%) |
| High School Diploma | 340 (91.9%) | 30 (8.1%) |
| College/Associate Degree | 96 (66.2%) | 49 (33.8%) |
| Bachelor's Degree or higher | 84 (85.7%) | 14 (14.3%) |
Occupancy by Age of Householder in Brookfield Center
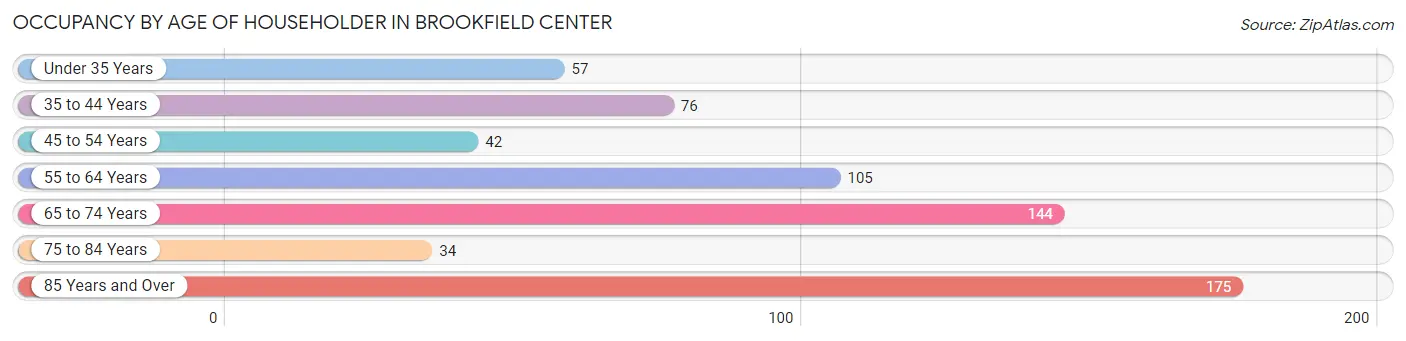
| Age Bracket | # Households | % Households |
| Under 35 Years | 57 | 9.0% |
| 35 to 44 Years | 76 | 12.0% |
| 45 to 54 Years | 42 | 6.6% |
| 55 to 64 Years | 105 | 16.6% |
| 65 to 74 Years | 144 | 22.8% |
| 75 to 84 Years | 34 | 5.4% |
| 85 Years and Over | 175 | 27.7% |
| Total | 633 | 100.0% |
Housing Finances in Brookfield Center
Median Income by Occupancy in Brookfield Center
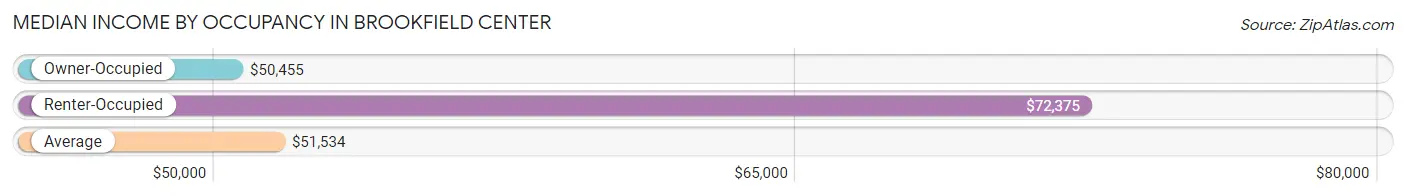
| Occupancy Type | # Households | Median Income |
| Owner-Occupied | 540 (85.3%) | $50,455 |
| Renter-Occupied | 93 (14.7%) | $72,375 |
| Average | 633 (100.0%) | $51,534 |
Occupancy by Householder Income Bracket in Brookfield Center
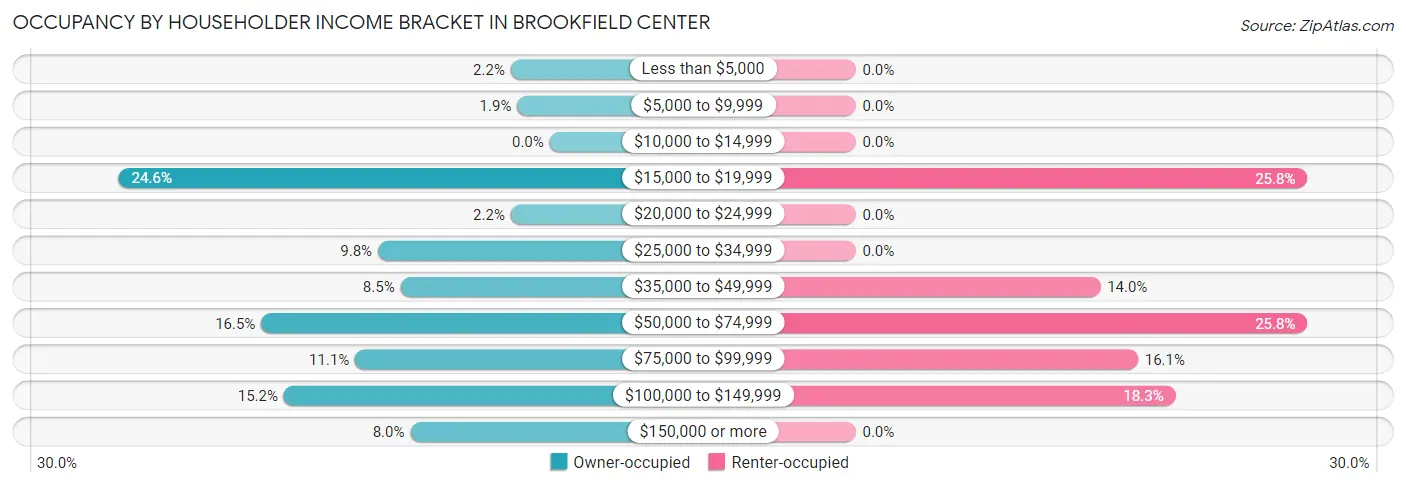
| Income Bracket | Owner-occupied | Renter-occupied |
| Less than $5,000 | 12 (2.2%) | 0 (0.0%) |
| $5,000 to $9,999 | 10 (1.8%) | 0 (0.0%) |
| $10,000 to $14,999 | 0 (0.0%) | 0 (0.0%) |
| $15,000 to $19,999 | 133 (24.6%) | 24 (25.8%) |
| $20,000 to $24,999 | 12 (2.2%) | 0 (0.0%) |
| $25,000 to $34,999 | 53 (9.8%) | 0 (0.0%) |
| $35,000 to $49,999 | 46 (8.5%) | 13 (14.0%) |
| $50,000 to $74,999 | 89 (16.5%) | 24 (25.8%) |
| $75,000 to $99,999 | 60 (11.1%) | 15 (16.1%) |
| $100,000 to $149,999 | 82 (15.2%) | 17 (18.3%) |
| $150,000 or more | 43 (8.0%) | 0 (0.0%) |
| Total | 540 (100.0%) | 93 (100.0%) |
Monthly Housing Cost Tiers in Brookfield Center
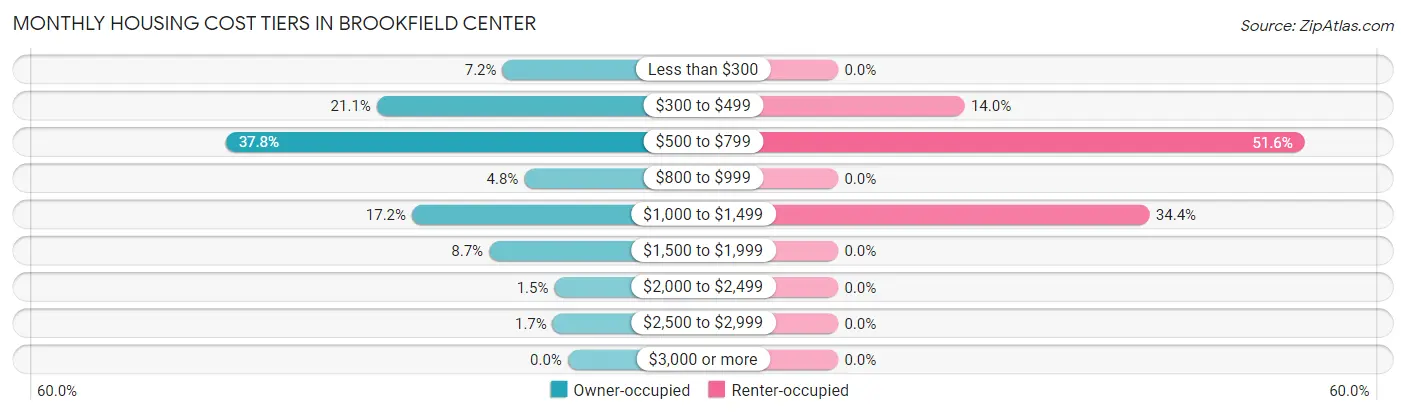
| Monthly Cost | Owner-occupied | Renter-occupied |
| Less than $300 | 39 (7.2%) | 0 (0.0%) |
| $300 to $499 | 114 (21.1%) | 13 (14.0%) |
| $500 to $799 | 204 (37.8%) | 48 (51.6%) |
| $800 to $999 | 26 (4.8%) | 0 (0.0%) |
| $1,000 to $1,499 | 93 (17.2%) | 32 (34.4%) |
| $1,500 to $1,999 | 47 (8.7%) | 0 (0.0%) |
| $2,000 to $2,499 | 8 (1.5%) | 0 (0.0%) |
| $2,500 to $2,999 | 9 (1.7%) | 0 (0.0%) |
| $3,000 or more | 0 (0.0%) | 0 (0.0%) |
| Total | 540 (100.0%) | 93 (100.0%) |
Physical Housing Characteristics in Brookfield Center
Housing Structures in Brookfield Center
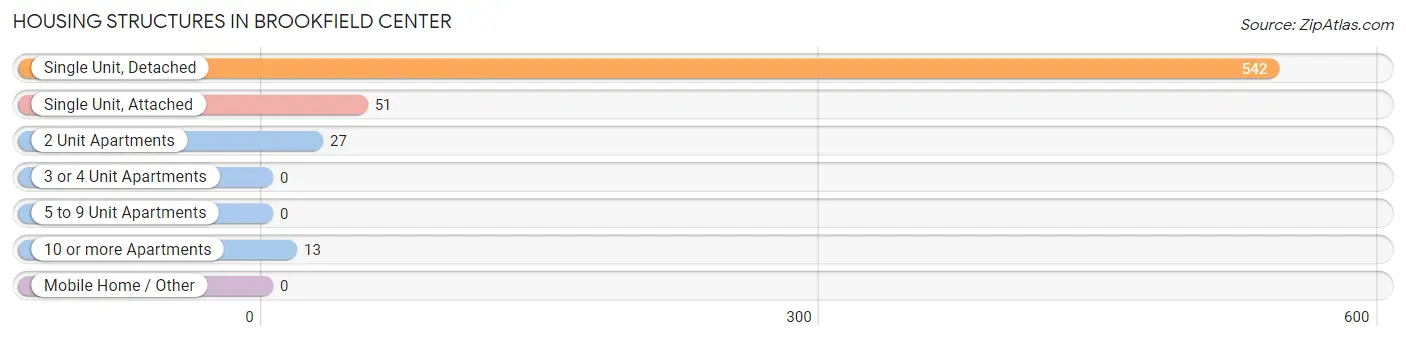
| Structure Type | # Housing Units | % Housing Units |
| Single Unit, Detached | 542 | 85.6% |
| Single Unit, Attached | 51 | 8.1% |
| 2 Unit Apartments | 27 | 4.3% |
| 3 or 4 Unit Apartments | 0 | 0.0% |
| 5 to 9 Unit Apartments | 0 | 0.0% |
| 10 or more Apartments | 13 | 2.1% |
| Mobile Home / Other | 0 | 0.0% |
| Total | 633 | 100.0% |
Housing Structures by Occupancy in Brookfield Center
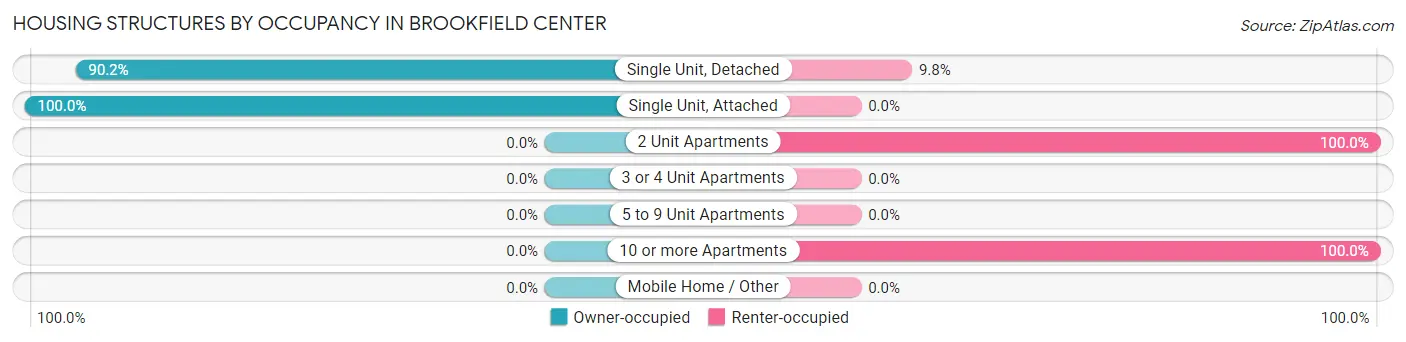
| Structure Type | Owner-occupied | Renter-occupied |
| Single Unit, Detached | 489 (90.2%) | 53 (9.8%) |
| Single Unit, Attached | 51 (100.0%) | 0 (0.0%) |
| 2 Unit Apartments | 0 (0.0%) | 27 (100.0%) |
| 3 or 4 Unit Apartments | 0 (0.0%) | 0 (0.0%) |
| 5 to 9 Unit Apartments | 0 (0.0%) | 0 (0.0%) |
| 10 or more Apartments | 0 (0.0%) | 13 (100.0%) |
| Mobile Home / Other | 0 (0.0%) | 0 (0.0%) |
| Total | 540 (85.3%) | 93 (14.7%) |
Housing Structures by Number of Rooms in Brookfield Center
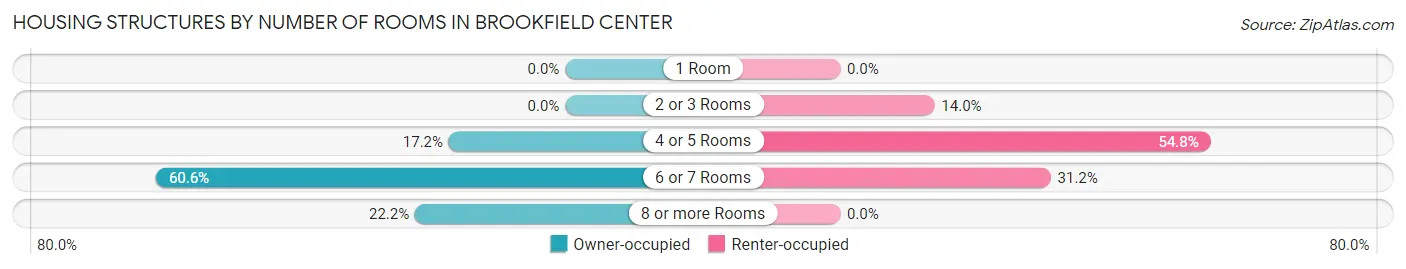
| Number of Rooms | Owner-occupied | Renter-occupied |
| 1 Room | 0 (0.0%) | 0 (0.0%) |
| 2 or 3 Rooms | 0 (0.0%) | 13 (14.0%) |
| 4 or 5 Rooms | 93 (17.2%) | 51 (54.8%) |
| 6 or 7 Rooms | 327 (60.6%) | 29 (31.2%) |
| 8 or more Rooms | 120 (22.2%) | 0 (0.0%) |
| Total | 540 (100.0%) | 93 (100.0%) |
Housing Structure by Heating Type in Brookfield Center
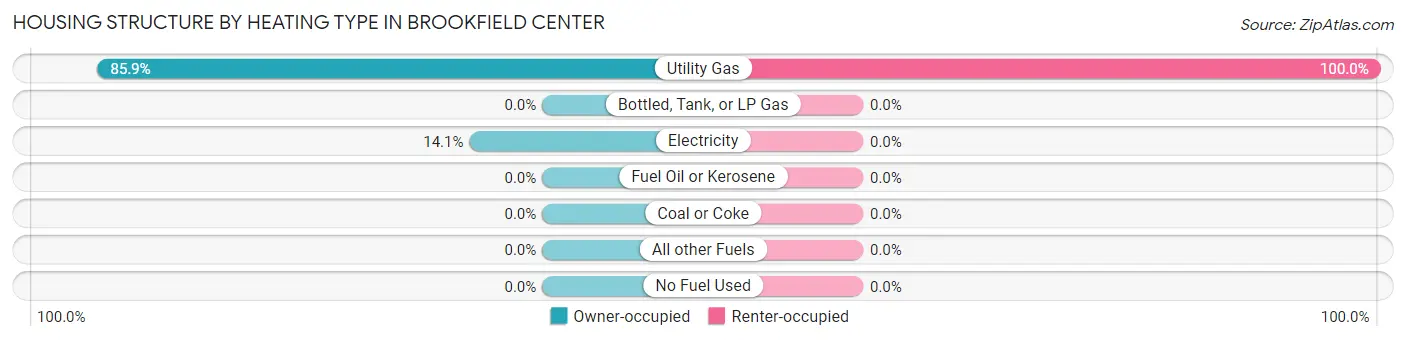
| Heating Type | Owner-occupied | Renter-occupied |
| Utility Gas | 464 (85.9%) | 93 (100.0%) |
| Bottled, Tank, or LP Gas | 0 (0.0%) | 0 (0.0%) |
| Electricity | 76 (14.1%) | 0 (0.0%) |
| Fuel Oil or Kerosene | 0 (0.0%) | 0 (0.0%) |
| Coal or Coke | 0 (0.0%) | 0 (0.0%) |
| All other Fuels | 0 (0.0%) | 0 (0.0%) |
| No Fuel Used | 0 (0.0%) | 0 (0.0%) |
| Total | 540 (100.0%) | 93 (100.0%) |
Household Vehicle Usage in Brookfield Center
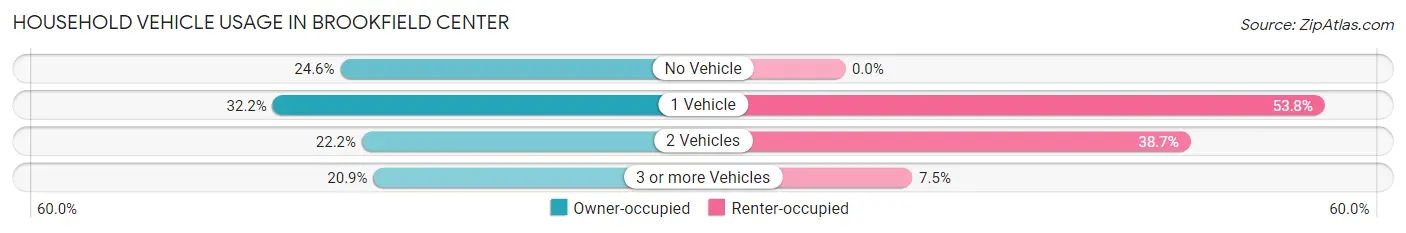
| Vehicles per Household | Owner-occupied | Renter-occupied |
| No Vehicle | 133 (24.6%) | 0 (0.0%) |
| 1 Vehicle | 174 (32.2%) | 50 (53.8%) |
| 2 Vehicles | 120 (22.2%) | 36 (38.7%) |
| 3 or more Vehicles | 113 (20.9%) | 7 (7.5%) |
| Total | 540 (100.0%) | 93 (100.0%) |
Real Estate & Mortgages in Brookfield Center
Real Estate and Mortgage Overview in Brookfield Center
| Characteristic | Without Mortgage | With Mortgage |
| Housing Units | 357 | 183 |
| Median Property Value | $211,700 | $152,500 |
| Median Household Income | - | - |
| Monthly Housing Costs | $607 | $0 |
| Real Estate Taxes | $2,713 | $0 |
Property Value by Mortgage Status in Brookfield Center
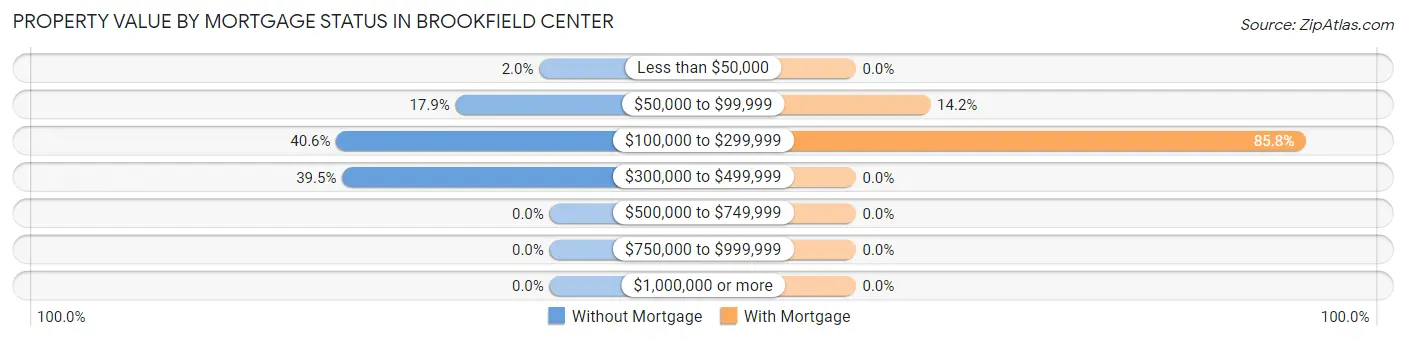
| Property Value | Without Mortgage | With Mortgage |
| Less than $50,000 | 7 (2.0%) | 0 (0.0%) |
| $50,000 to $99,999 | 64 (17.9%) | 26 (14.2%) |
| $100,000 to $299,999 | 145 (40.6%) | 157 (85.8%) |
| $300,000 to $499,999 | 141 (39.5%) | 0 (0.0%) |
| $500,000 to $749,999 | 0 (0.0%) | 0 (0.0%) |
| $750,000 to $999,999 | 0 (0.0%) | 0 (0.0%) |
| $1,000,000 or more | 0 (0.0%) | 0 (0.0%) |
| Total | 357 (100.0%) | 183 (100.0%) |
Household Income by Mortgage Status in Brookfield Center
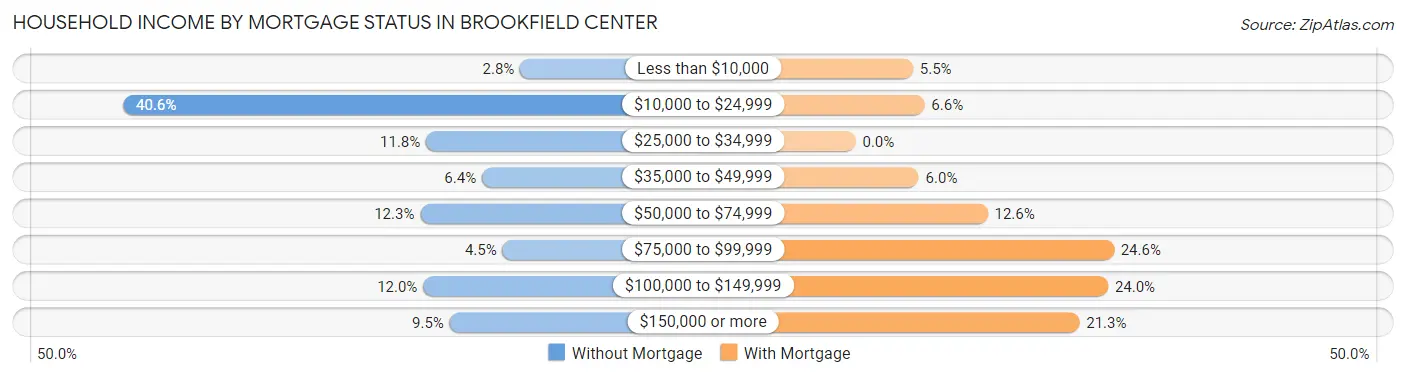
| Household Income | Without Mortgage | With Mortgage |
| Less than $10,000 | 10 (2.8%) | 10 (5.5%) |
| $10,000 to $24,999 | 145 (40.6%) | 12 (6.6%) |
| $25,000 to $34,999 | 42 (11.8%) | 0 (0.0%) |
| $35,000 to $49,999 | 23 (6.4%) | 11 (6.0%) |
| $50,000 to $74,999 | 44 (12.3%) | 23 (12.6%) |
| $75,000 to $99,999 | 16 (4.5%) | 45 (24.6%) |
| $100,000 to $149,999 | 43 (12.0%) | 44 (24.0%) |
| $150,000 or more | 34 (9.5%) | 39 (21.3%) |
| Total | 357 (100.0%) | 183 (100.0%) |
Property Value to Household Income Ratio in Brookfield Center
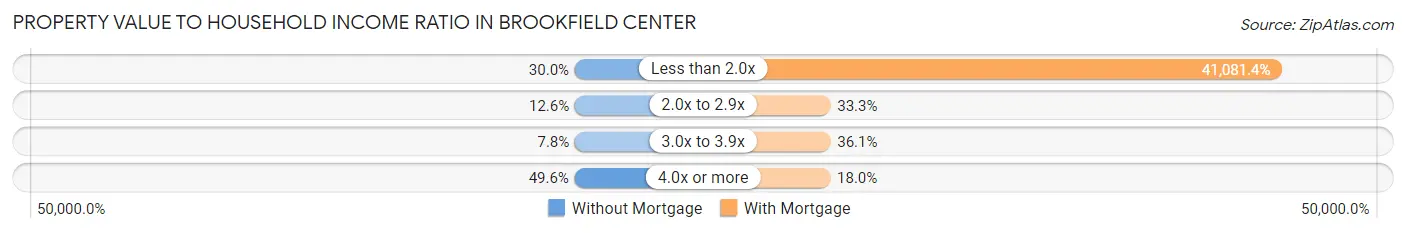
| Value-to-Income Ratio | Without Mortgage | With Mortgage |
| Less than 2.0x | 107 (30.0%) | 75,179 (41,081.4%) |
| 2.0x to 2.9x | 45 (12.6%) | 61 (33.3%) |
| 3.0x to 3.9x | 28 (7.8%) | 66 (36.1%) |
| 4.0x or more | 177 (49.6%) | 33 (18.0%) |
| Total | 357 (100.0%) | 183 (100.0%) |
Real Estate Taxes by Mortgage Status in Brookfield Center
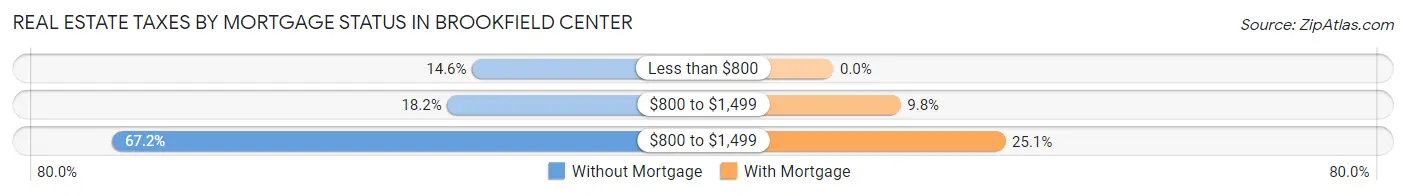
| Property Taxes | Without Mortgage | With Mortgage |
| Less than $800 | 52 (14.6%) | 0 (0.0%) |
| $800 to $1,499 | 65 (18.2%) | 18 (9.8%) |
| $800 to $1,499 | 240 (67.2%) | 46 (25.1%) |
| Total | 357 (100.0%) | 183 (100.0%) |
Health & Disability in Brookfield Center
Health Insurance Coverage by Age in Brookfield Center
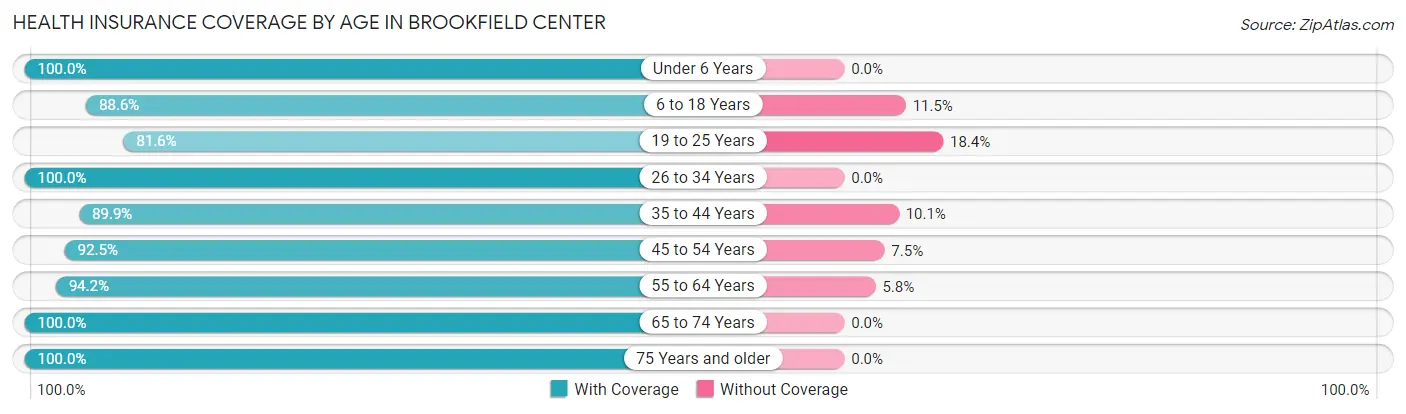
| Age Bracket | With Coverage | Without Coverage |
| Under 6 Years | 19 (100.0%) | 0 (0.0%) |
| 6 to 18 Years | 147 (88.5%) | 19 (11.5%) |
| 19 to 25 Years | 31 (81.6%) | 7 (18.4%) |
| 26 to 34 Years | 109 (100.0%) | 0 (0.0%) |
| 35 to 44 Years | 124 (89.9%) | 14 (10.1%) |
| 45 to 54 Years | 136 (92.5%) | 11 (7.5%) |
| 55 to 64 Years | 162 (94.2%) | 10 (5.8%) |
| 65 to 74 Years | 223 (100.0%) | 0 (0.0%) |
| 75 Years and older | 243 (100.0%) | 0 (0.0%) |
| Total | 1,194 (95.1%) | 61 (4.9%) |
Health Insurance Coverage by Citizenship Status in Brookfield Center
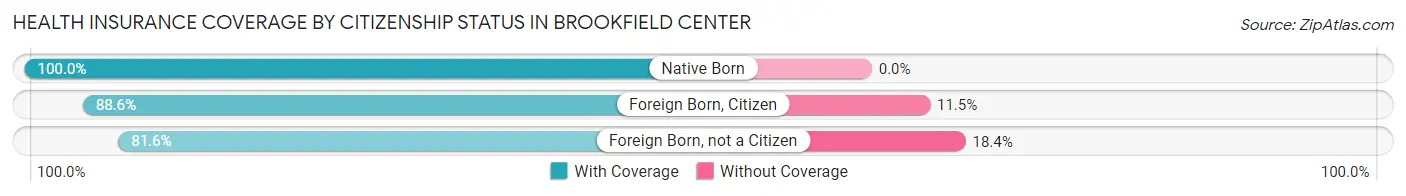
| Citizenship Status | With Coverage | Without Coverage |
| Native Born | 19 (100.0%) | 0 (0.0%) |
| Foreign Born, Citizen | 147 (88.5%) | 19 (11.5%) |
| Foreign Born, not a Citizen | 31 (81.6%) | 7 (18.4%) |
Health Insurance Coverage by Household Income in Brookfield Center
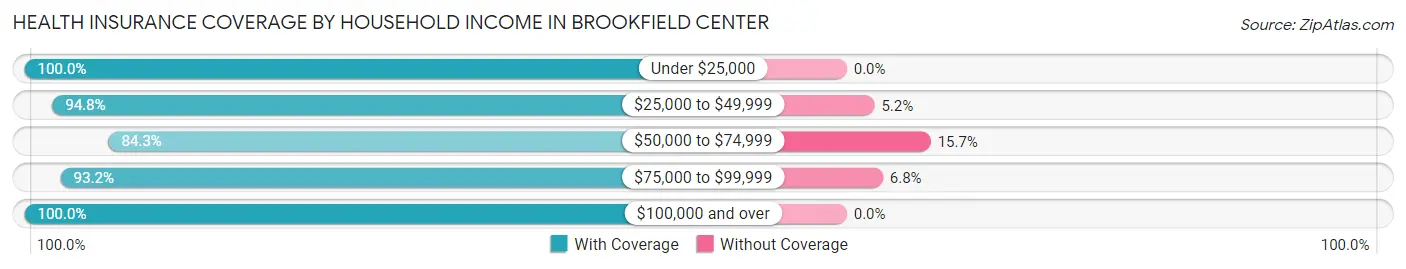
| Household Income | With Coverage | Without Coverage |
| Under $25,000 | 263 (100.0%) | 0 (0.0%) |
| $25,000 to $49,999 | 201 (94.8%) | 11 (5.2%) |
| $50,000 to $74,999 | 193 (84.3%) | 36 (15.7%) |
| $75,000 to $99,999 | 193 (93.2%) | 14 (6.8%) |
| $100,000 and over | 330 (100.0%) | 0 (0.0%) |
Public vs Private Health Insurance Coverage by Age in Brookfield Center
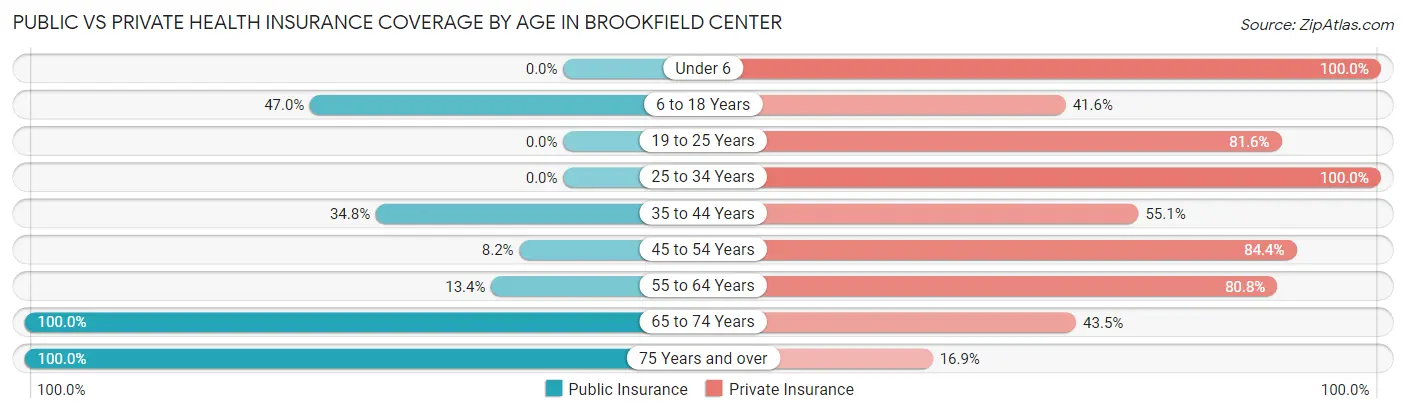
| Age Bracket | Public Insurance | Private Insurance |
| Under 6 | 0 (0.0%) | 19 (100.0%) |
| 6 to 18 Years | 78 (47.0%) | 69 (41.6%) |
| 19 to 25 Years | 0 (0.0%) | 31 (81.6%) |
| 25 to 34 Years | 0 (0.0%) | 109 (100.0%) |
| 35 to 44 Years | 48 (34.8%) | 76 (55.1%) |
| 45 to 54 Years | 12 (8.2%) | 124 (84.4%) |
| 55 to 64 Years | 23 (13.4%) | 139 (80.8%) |
| 65 to 74 Years | 223 (100.0%) | 97 (43.5%) |
| 75 Years and over | 243 (100.0%) | 41 (16.9%) |
| Total | 627 (50.0%) | 705 (56.2%) |
Disability Status by Sex by Age in Brookfield Center
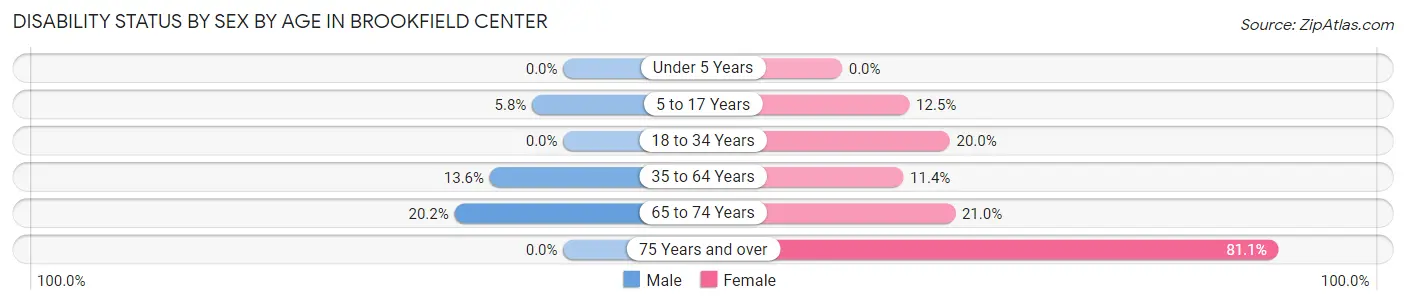
| Age Bracket | Male | Female |
| Under 5 Years | 0 (0.0%) | 0 (0.0%) |
| 5 to 17 Years | 7 (5.8%) | 7 (12.5%) |
| 18 to 34 Years | 0 (0.0%) | 14 (20.0%) |
| 35 to 64 Years | 30 (13.6%) | 27 (11.4%) |
| 65 to 74 Years | 21 (20.2%) | 25 (21.0%) |
| 75 Years and over | 0 (0.0%) | 154 (81.0%) |
Disability Class by Sex by Age in Brookfield Center
Disability Class: Hearing Difficulty
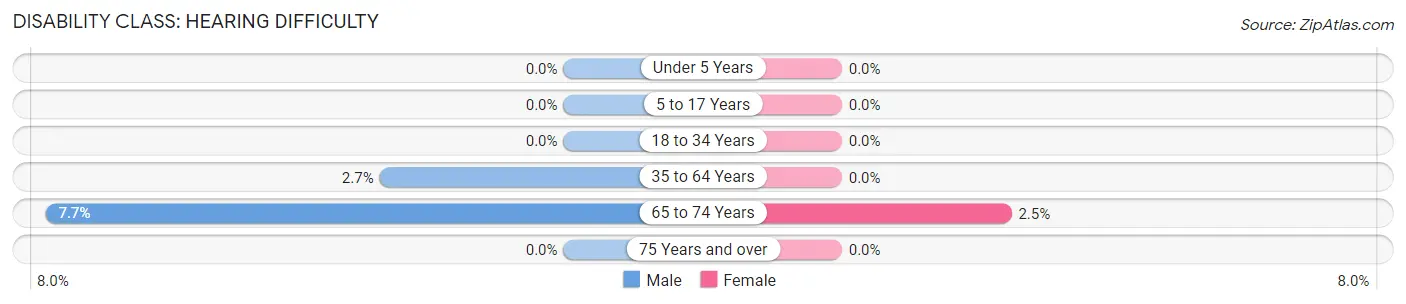
| Age Bracket | Male | Female |
| Under 5 Years | 0 (0.0%) | 0 (0.0%) |
| 5 to 17 Years | 0 (0.0%) | 0 (0.0%) |
| 18 to 34 Years | 0 (0.0%) | 0 (0.0%) |
| 35 to 64 Years | 6 (2.7%) | 0 (0.0%) |
| 65 to 74 Years | 8 (7.7%) | 3 (2.5%) |
| 75 Years and over | 0 (0.0%) | 0 (0.0%) |
Disability Class: Vision Difficulty
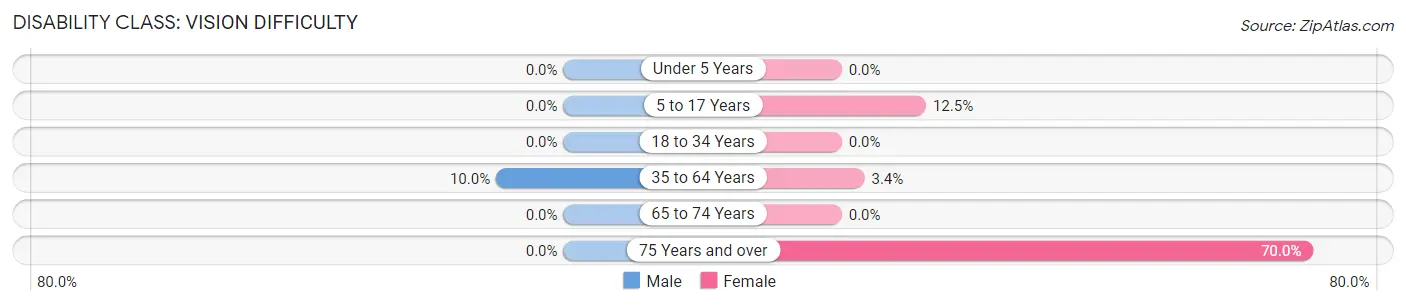
| Age Bracket | Male | Female |
| Under 5 Years | 0 (0.0%) | 0 (0.0%) |
| 5 to 17 Years | 0 (0.0%) | 7 (12.5%) |
| 18 to 34 Years | 0 (0.0%) | 0 (0.0%) |
| 35 to 64 Years | 22 (10.0%) | 8 (3.4%) |
| 65 to 74 Years | 0 (0.0%) | 0 (0.0%) |
| 75 Years and over | 0 (0.0%) | 133 (70.0%) |
Disability Class: Cognitive Difficulty
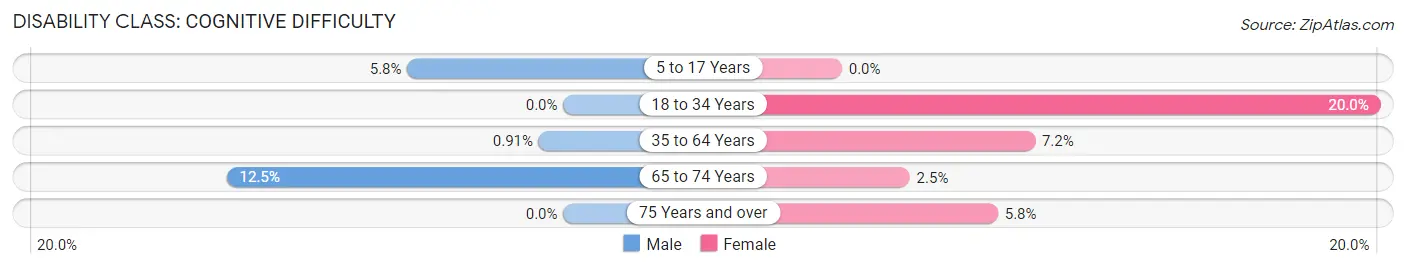
| Age Bracket | Male | Female |
| 5 to 17 Years | 7 (5.8%) | 0 (0.0%) |
| 18 to 34 Years | 0 (0.0%) | 14 (20.0%) |
| 35 to 64 Years | 2 (0.9%) | 17 (7.2%) |
| 65 to 74 Years | 13 (12.5%) | 3 (2.5%) |
| 75 Years and over | 0 (0.0%) | 11 (5.8%) |
Disability Class: Ambulatory Difficulty
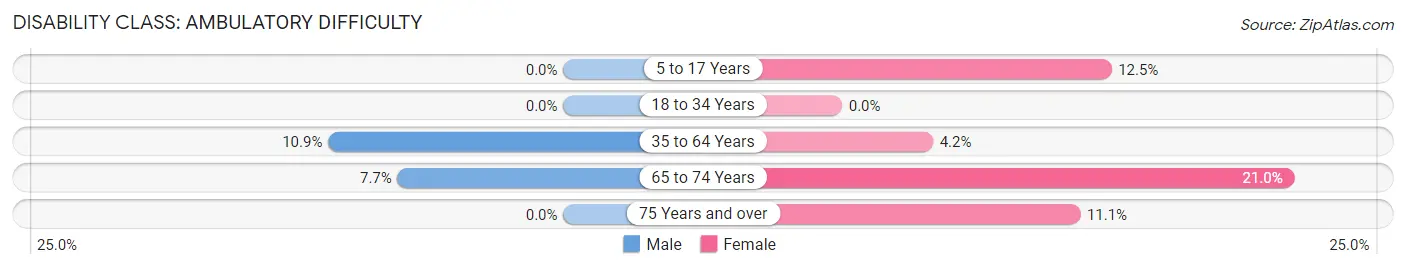
| Age Bracket | Male | Female |
| 5 to 17 Years | 0 (0.0%) | 7 (12.5%) |
| 18 to 34 Years | 0 (0.0%) | 0 (0.0%) |
| 35 to 64 Years | 24 (10.9%) | 10 (4.2%) |
| 65 to 74 Years | 8 (7.7%) | 25 (21.0%) |
| 75 Years and over | 0 (0.0%) | 21 (11.1%) |
Disability Class: Self-Care Difficulty
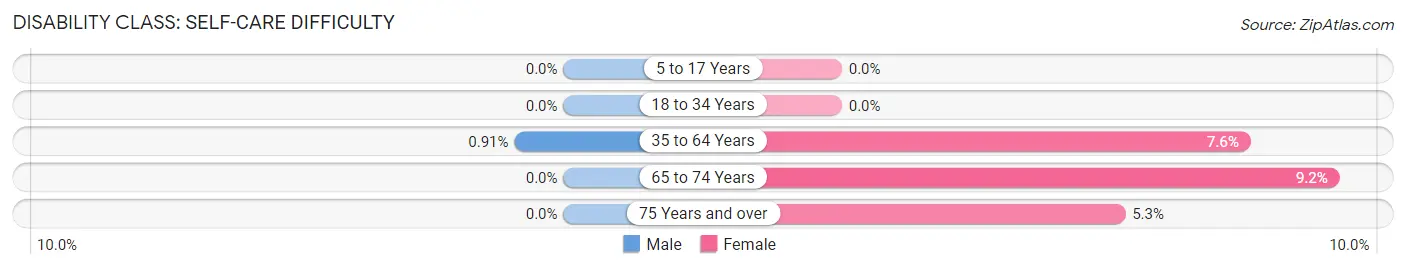
| Age Bracket | Male | Female |
| 5 to 17 Years | 0 (0.0%) | 0 (0.0%) |
| 18 to 34 Years | 0 (0.0%) | 0 (0.0%) |
| 35 to 64 Years | 2 (0.9%) | 18 (7.6%) |
| 65 to 74 Years | 0 (0.0%) | 11 (9.2%) |
| 75 Years and over | 0 (0.0%) | 10 (5.3%) |
Technology Access in Brookfield Center
Computing Device Access in Brookfield Center
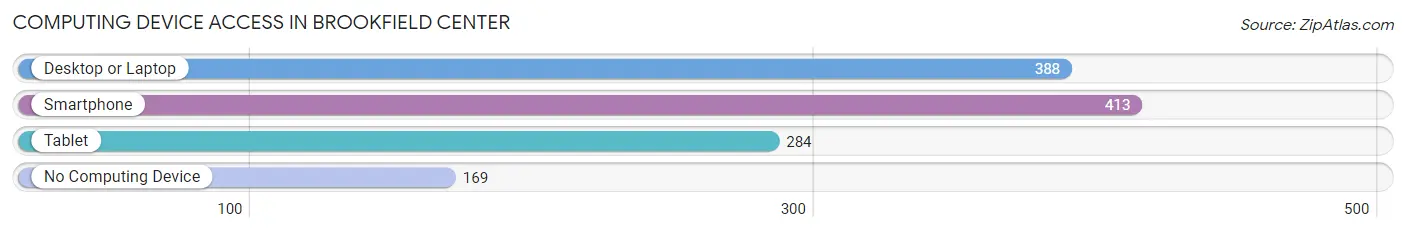
| Device Type | # Households | % Households |
| Desktop or Laptop | 388 | 61.3% |
| Smartphone | 413 | 65.2% |
| Tablet | 284 | 44.9% |
| No Computing Device | 169 | 26.7% |
| Total | 633 | 100.0% |
Internet Access in Brookfield Center
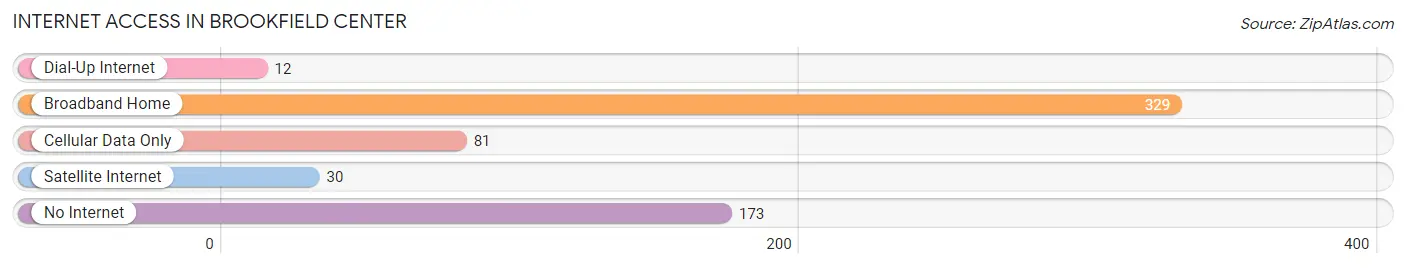
| Internet Type | # Households | % Households |
| Dial-Up Internet | 12 | 1.9% |
| Broadband Home | 329 | 52.0% |
| Cellular Data Only | 81 | 12.8% |
| Satellite Internet | 30 | 4.7% |
| No Internet | 173 | 27.3% |
| Total | 633 | 100.0% |
Brookfield Center Summary
Brookfield Center is a small village located in Trumbull County, Ohio. It is situated in the northeast corner of the county, just south of the city of Warren. The village has a population of approximately 1,000 people and is part of the larger Brookfield Township.
History
The area that is now Brookfield Center was first settled in 1802 by a group of settlers from Connecticut. The village was originally known as “Brookfield” and was incorporated in 1837. The name was changed to “Brookfield Center” in 1845.
The village was a small farming community for many years, but in the late 19th century, it began to develop into a manufacturing center. The first industry to locate in the village was the Brookfield Iron Works, which opened in 1876. This was followed by the opening of the Brookfield Glass Company in 1883.
The village continued to grow and prosper throughout the 20th century. In the 1950s, the village was home to several factories, including the Brookfield Steel Company, the Brookfield Machine Company, and the Brookfield Foundry.
Geography
Brookfield Center is located in the northeast corner of Trumbull County, Ohio. It is situated on the western edge of the Mahoning River Valley, just south of the city of Warren. The village is bordered by the townships of Brookfield, Liberty, and Vienna.
The village is located at an elevation of 890 feet above sea level. The terrain is mostly flat, with some rolling hills in the surrounding area. The climate is humid continental, with hot summers and cold winters.
Economy
The economy of Brookfield Center is largely based on manufacturing. The village is home to several factories, including the Brookfield Steel Company, the Brookfield Machine Company, and the Brookfield Foundry. These factories produce a variety of products, including steel, machine parts, and castings.
The village also has several small businesses, including restaurants, retail stores, and service providers. The village is also home to a branch of the Trumbull County Library.
Demographics
As of the 2010 census, the population of Brookfield Center was 1,000. The racial makeup of the village was 97.2% White, 0.7% African American, 0.3% Native American, 0.3% Asian, and 1.5% from two or more races.
The median household income in the village was $41,250, and the median family income was $50,000. The per capita income was $20,000. About 8.3% of the population was below the poverty line.
Conclusion
Brookfield Center is a small village located in Trumbull County, Ohio. It has a population of approximately 1,000 people and is part of the larger Brookfield Township. The village has a long history of manufacturing and is home to several factories. The economy of the village is largely based on manufacturing, and the median household income is $41,250. The racial makeup of the village is 97.2% White, 0.7% African American, 0.3% Native American, 0.3% Asian, and 1.5% from two or more races.
Common Questions
What is the Total Population of Brookfield Center?
Total Population of Brookfield Center is 1,255.
What is the Total Male Population of Brookfield Center?
Total Male Population of Brookfield Center is 583.
What is the Total Female Population of Brookfield Center?
Total Female Population of Brookfield Center is 672.
What is the Ratio of Males per 100 Females in Brookfield Center?
There are 86.76 Males per 100 Females in Brookfield Center.
What is the Ratio of Females per 100 Males in Brookfield Center?
There are 115.27 Females per 100 Males in Brookfield Center.
What is the Median Population Age in Brookfield Center?
Median Population Age in Brookfield Center is 55.6 Years.
What is the Average Family Size in Brookfield Center
Average Family Size in Brookfield Center is 2.8 People.
What is the Average Household Size in Brookfield Center
Average Household Size in Brookfield Center is 2.0 People.
What is Per Capita Income in Brookfield Center?
Per Capita income in Brookfield Center is $34,285.
What is the Median Family Income in Brookfield Center?
Median Family Income in Brookfield Center is $79,444.
What is the Median Household income in Brookfield Center?
Median Household Income in Brookfield Center is $51,534.
What is Income or Wage Gap in Brookfield Center?
Income or Wage Gap in Brookfield Center is 48.2%.
Women in Brookfield Center earn 51.8 cents for every dollar earned by a man.
What is Inequality or Gini Index in Brookfield Center?
Inequality or Gini Index in Brookfield Center is 0.44.
How Large is the Labor Force in Brookfield Center?
There are 541 People in the Labor Forcein in Brookfield Center.
What is the Percentage of People in the Labor Force in Brookfield Center?
48.5% of People are in the Labor Force in Brookfield Center.
What is the Unemployment Rate in Brookfield Center?
Unemployment Rate in Brookfield Center is 2.8%.