Brookside, OH
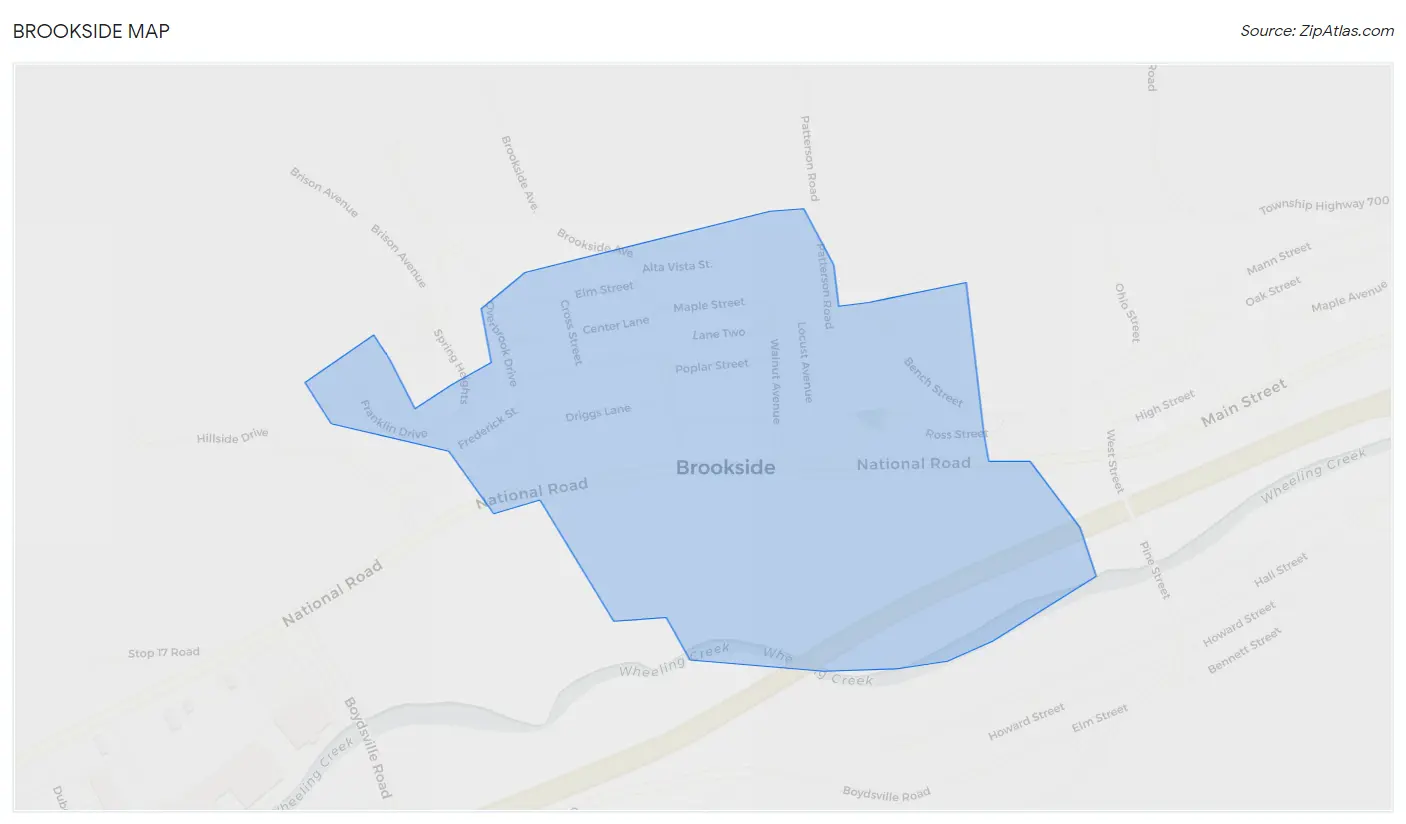
Brookside Map
Brookside Overview
665
TOTAL POPULATION
366
MALE POPULATION
299
FEMALE POPULATION
122.41
MALES / 100 FEMALES
81.69
FEMALES / 100 MALES
39.2
MEDIAN AGE
2.8
AVG FAMILY SIZE
2.4
AVG HOUSEHOLD SIZE
$37,212
PER CAPITA INCOME
$95,536
AVG FAMILY INCOME
$68,958
AVG HOUSEHOLD INCOME
5.9%
WAGE / INCOME GAP [ % ]
94.1¢/ $1
WAGE / INCOME GAP [ $ ]
0.41
INEQUALITY / GINI INDEX
398
LABOR FORCE [ PEOPLE ]
70.3%
PERCENT IN LABOR FORCE
3.0%
UNEMPLOYMENT RATE
Race in Brookside
The most populous races in Brookside are White / Caucasian (563 | 84.7%), Two or more Races (70 | 10.5%), and Black / African American (29 | 4.4%).
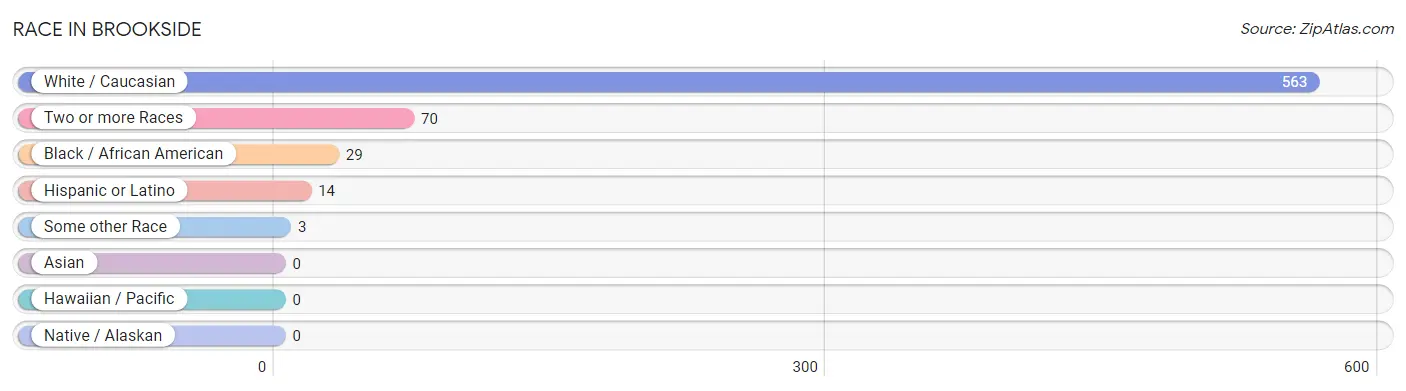
| Race | # Population | % Population |
| Asian | 0 | 0.0% |
| Black / African American | 29 | 4.4% |
| Hawaiian / Pacific | 0 | 0.0% |
| Hispanic or Latino | 14 | 2.1% |
| Native / Alaskan | 0 | 0.0% |
| White / Caucasian | 563 | 84.7% |
| Two or more Races | 70 | 10.5% |
| Some other Race | 3 | 0.4% |
| Total | 665 | 100.0% |
Ancestry in Brookside
The most populous ancestries reported in Brookside are German (164 | 24.7%), Irish (67 | 10.1%), Italian (64 | 9.6%), English (55 | 8.3%), and Polish (52 | 7.8%), together accounting for 60.5% of all Brookside residents.
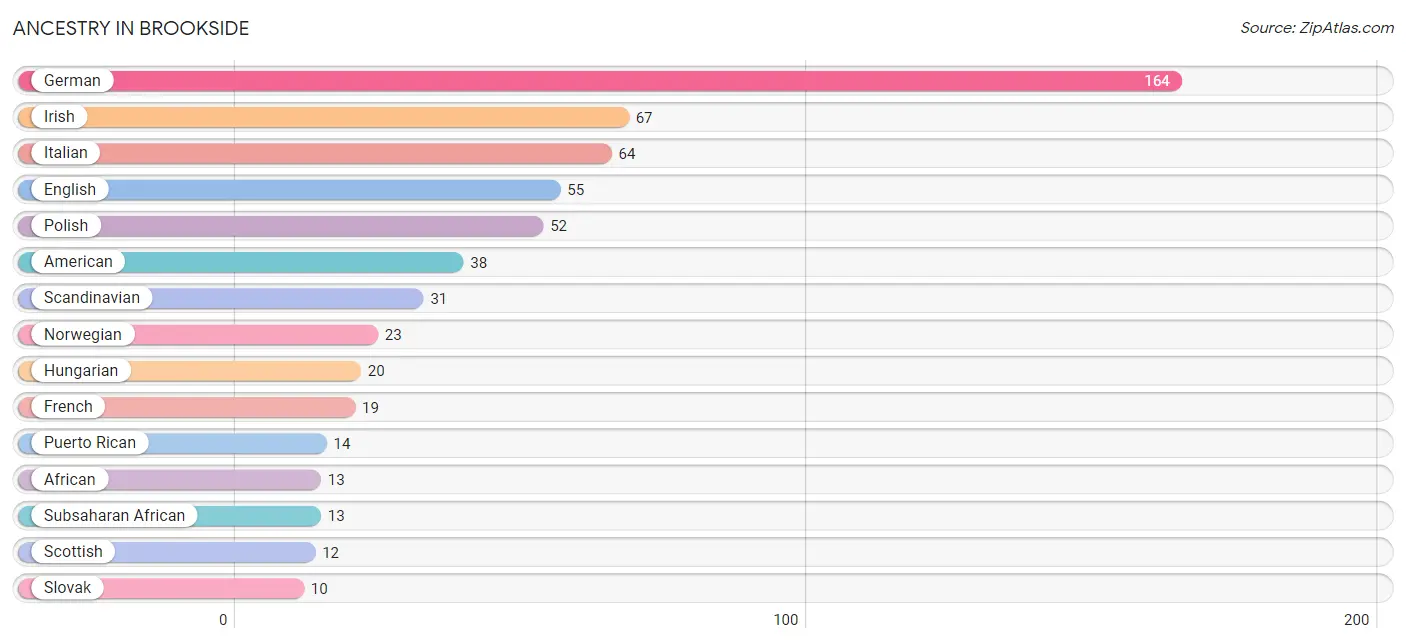
| Ancestry | # Population | % Population |
| African | 13 | 1.9% |
| American | 38 | 5.7% |
| Austrian | 1 | 0.2% |
| Belgian | 2 | 0.3% |
| Blackfeet | 2 | 0.3% |
| Burmese | 9 | 1.3% |
| Croatian | 5 | 0.7% |
| Czech | 2 | 0.3% |
| Czechoslovakian | 2 | 0.3% |
| Dutch | 4 | 0.6% |
| Eastern European | 8 | 1.2% |
| English | 55 | 8.3% |
| European | 9 | 1.3% |
| French | 19 | 2.9% |
| French Canadian | 2 | 0.3% |
| German | 164 | 24.7% |
| Greek | 7 | 1.1% |
| Hungarian | 20 | 3.0% |
| Irish | 67 | 10.1% |
| Italian | 64 | 9.6% |
| Norwegian | 23 | 3.5% |
| Polish | 52 | 7.8% |
| Puerto Rican | 14 | 2.1% |
| Scandinavian | 31 | 4.7% |
| Scotch-Irish | 5 | 0.7% |
| Scottish | 12 | 1.8% |
| Serbian | 9 | 1.3% |
| Slovak | 10 | 1.5% |
| Subsaharan African | 13 | 1.9% |
| Swedish | 5 | 0.7% |
| Swiss | 5 | 0.7% |
| Welsh | 3 | 0.4% |
| Yugoslavian | 2 | 0.3% | View All 33 Rows |
Immigrants in Brookside
The most numerous immigrant groups reported in Brookside came from , and Canada (2 | 0.3%), together accounting for 0.3% of all Brookside residents.

| Immigration Origin | # Population | % Population |
| Canada | 2 | 0.3% | View All 1 Rows |
Sex and Age in Brookside
Sex and Age in Brookside
The most populous age groups in Brookside are 15 to 19 Years (51 | 13.9%) for men and 55 to 59 Years (58 | 19.4%) for women.
| Age Bracket | Male | Female |
| Under 5 Years | 34 (9.3%) | 10 (3.3%) |
| 5 to 9 Years | 12 (3.3%) | 4 (1.3%) |
| 10 to 14 Years | 19 (5.2%) | 13 (4.3%) |
| 15 to 19 Years | 51 (13.9%) | 3 (1.0%) |
| 20 to 24 Years | 3 (0.8%) | 21 (7.0%) |
| 25 to 29 Years | 29 (7.9%) | 30 (10.0%) |
| 30 to 34 Years | 37 (10.1%) | 21 (7.0%) |
| 35 to 39 Years | 41 (11.2%) | 26 (8.7%) |
| 40 to 44 Years | 21 (5.7%) | 21 (7.0%) |
| 45 to 49 Years | 14 (3.8%) | 2 (0.7%) |
| 50 to 54 Years | 12 (3.3%) | 15 (5.0%) |
| 55 to 59 Years | 27 (7.4%) | 58 (19.4%) |
| 60 to 64 Years | 21 (5.7%) | 17 (5.7%) |
| 65 to 69 Years | 16 (4.4%) | 19 (6.4%) |
| 70 to 74 Years | 15 (4.1%) | 18 (6.0%) |
| 75 to 79 Years | 9 (2.5%) | 12 (4.0%) |
| 80 to 84 Years | 3 (0.8%) | 4 (1.3%) |
| 85 Years and over | 2 (0.5%) | 5 (1.7%) |
| Total | 366 (100.0%) | 299 (100.0%) |
Families and Households in Brookside
Median Family Size in Brookside
The median family size in Brookside is 2.81 persons per family, with single female/mother families (30 | 15.2%) accounting for the largest median family size of 3.27 persons per family. On the other hand, married-couple families (151 | 76.6%) represent the smallest median family size with 2.72 persons per family.
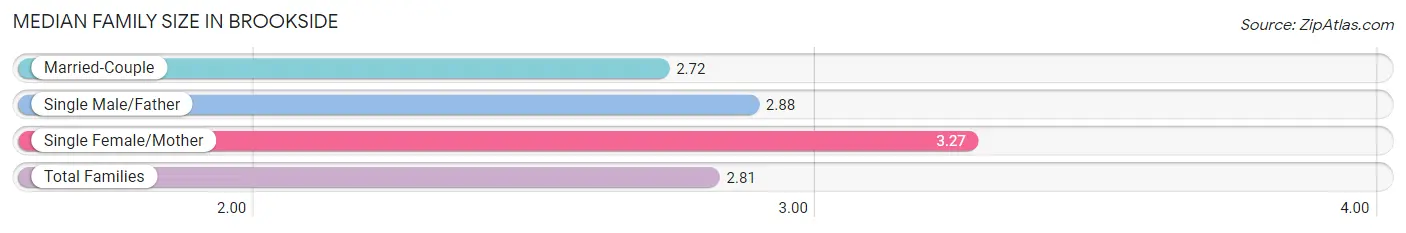
| Family Type | # Families | Family Size |
| Married-Couple | 151 (76.6%) | 2.72 |
| Single Male/Father | 16 (8.1%) | 2.88 |
| Single Female/Mother | 30 (15.2%) | 3.27 |
| Total Families | 197 (100.0%) | 2.81 |
Median Household Size in Brookside
The median household size in Brookside is 2.40 persons per household, with single female/mother households (30 | 10.8%) accounting for the largest median household size of 3.6 persons per household. non-family households (80 | 28.9%) represent the smallest median household size with 1.23 persons per household.
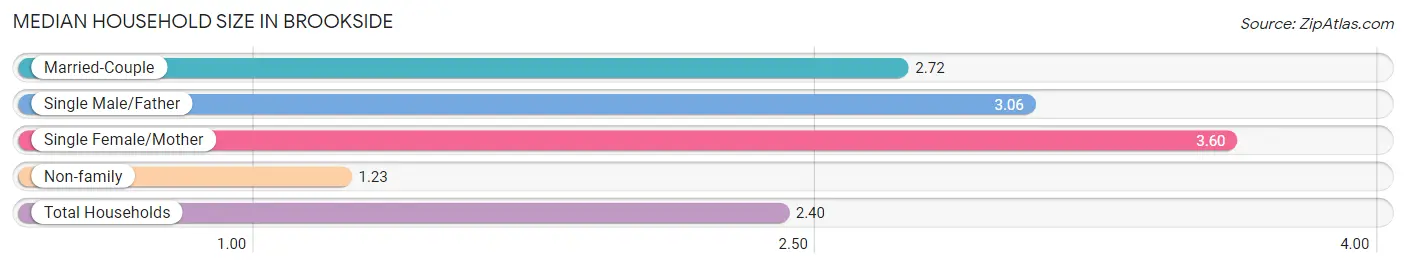
| Household Type | # Households | Household Size |
| Married-Couple | 151 (54.5%) | 2.72 |
| Single Male/Father | 16 (5.8%) | 3.06 |
| Single Female/Mother | 30 (10.8%) | 3.60 |
| Non-family | 80 (28.9%) | 1.23 |
| Total Households | 277 (100.0%) | 2.40 |
Household Size by Marriage Status in Brookside
Out of a total of 277 households in Brookside, 197 (71.1%) are family households, while 80 (28.9%) are nonfamily households. The most numerous type of family households are 2-person households, comprising 105, and the most common type of nonfamily households are 1-person households, comprising 65.
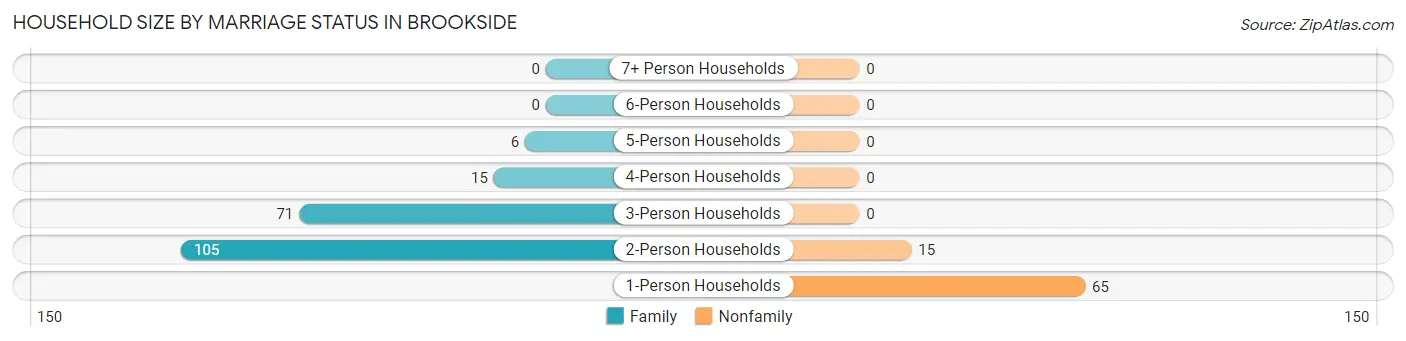
| Household Size | Family Households | Nonfamily Households |
| 1-Person Households | - | 65 (23.5%) |
| 2-Person Households | 105 (37.9%) | 15 (5.4%) |
| 3-Person Households | 71 (25.6%) | 0 (0.0%) |
| 4-Person Households | 15 (5.4%) | 0 (0.0%) |
| 5-Person Households | 6 (2.2%) | 0 (0.0%) |
| 6-Person Households | 0 (0.0%) | 0 (0.0%) |
| 7+ Person Households | 0 (0.0%) | 0 (0.0%) |
| Total | 197 (71.1%) | 80 (28.9%) |
Female Fertility in Brookside
Fertility by Age in Brookside
Average fertility rate in Brookside is 40.0 births per 1,000 women. Women in the age bracket of 20 to 34 years have the highest fertility rate with 69.0 births per 1,000 women. Women in the age bracket of 20 to 34 years acount for 100.0% of all women with births.
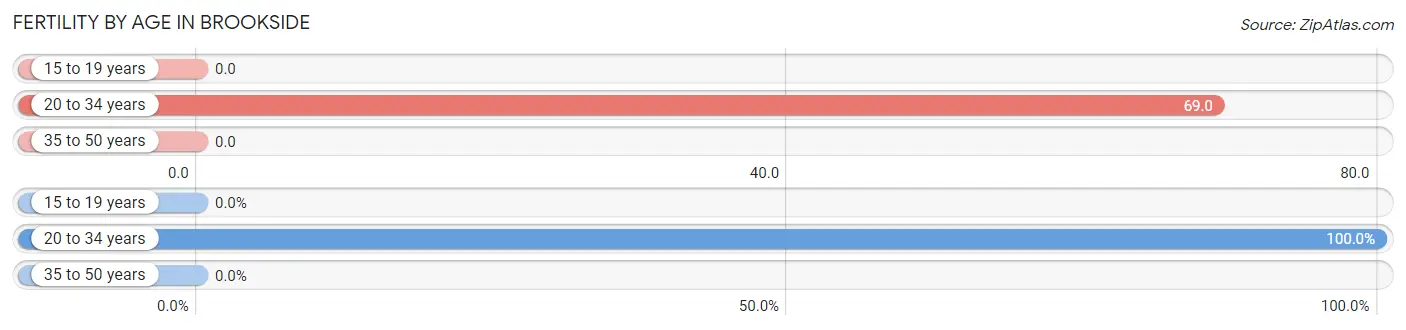
| Age Bracket | Women with Births | Births / 1,000 Women |
| 15 to 19 years | 0 (0.0%) | 0.0 |
| 20 to 34 years | 5 (100.0%) | 69.0 |
| 35 to 50 years | 0 (0.0%) | 0.0 |
| Total | 5 (100.0%) | 40.0 |
Fertility by Age by Marriage Status in Brookside
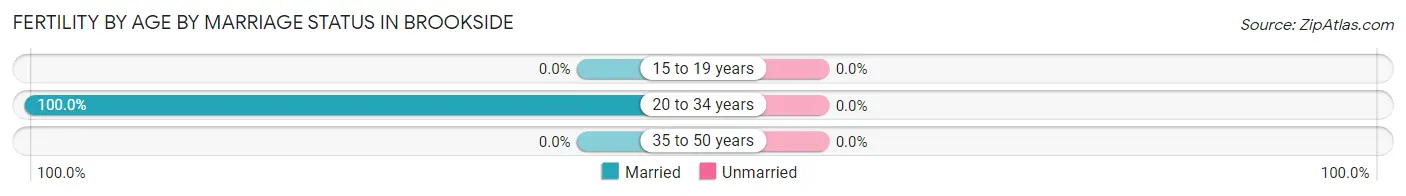
| Age Bracket | Married | Unmarried |
| 15 to 19 years | 0 (0.0%) | 0 (0.0%) |
| 20 to 34 years | 5 (100.0%) | 0 (0.0%) |
| 35 to 50 years | 0 (0.0%) | 0 (0.0%) |
| Total | 5 (100.0%) | 0 (0.0%) |
Fertility by Education in Brookside
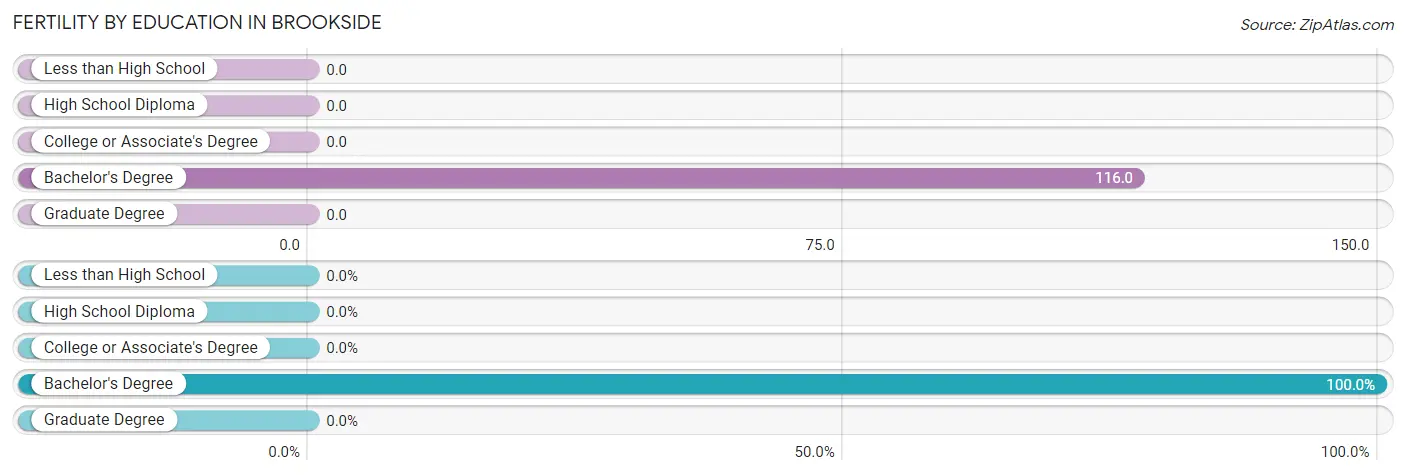
| Educational Attainment | Women with Births | Births / 1,000 Women |
| Less than High School | 0 (0.0%) | 0.0 |
| High School Diploma | 0 (0.0%) | 0.0 |
| College or Associate's Degree | 0 (0.0%) | 0.0 |
| Bachelor's Degree | 5 (100.0%) | 116.0 |
| Graduate Degree | 0 (0.0%) | 0.0 |
| Total | 5 (100.0%) | 40.0 |
Fertility by Education by Marriage Status in Brookside
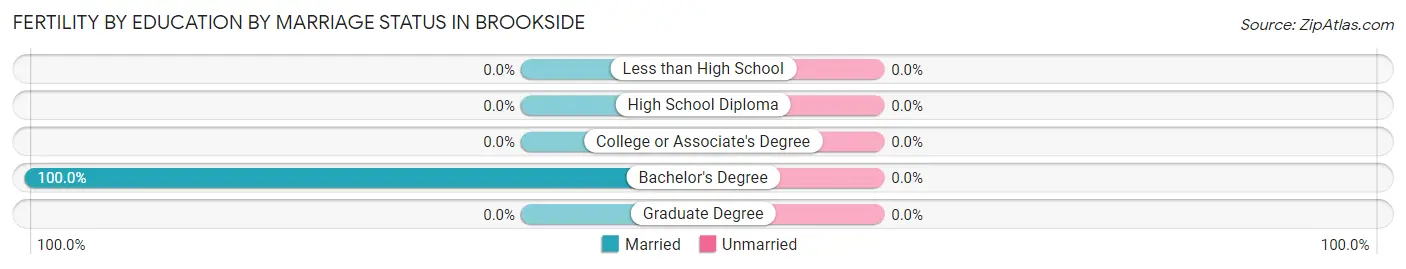
| Educational Attainment | Married | Unmarried |
| Less than High School | 0 (0.0%) | 0 (0.0%) |
| High School Diploma | 0 (0.0%) | 0 (0.0%) |
| College or Associate's Degree | 0 (0.0%) | 0 (0.0%) |
| Bachelor's Degree | 5 (100.0%) | 0 (0.0%) |
| Graduate Degree | 0 (0.0%) | 0 (0.0%) |
| Total | 5 (100.0%) | 0 (0.0%) |
Income in Brookside
Income Overview in Brookside
Per Capita Income in Brookside is $37,212, while median incomes of families and households are $95,536 and $68,958 respectively.
| Characteristic | Number | Measure |
| Per Capita Income | 665 | $37,212 |
| Median Family Income | 197 | $95,536 |
| Mean Family Income | 197 | $93,371 |
| Median Household Income | 277 | $68,958 |
| Mean Household Income | 277 | $87,711 |
| Income Deficit | 197 | $0 |
| Wage / Income Gap (%) | 665 | 5.94% |
| Wage / Income Gap ($) | 665 | 94.06¢ per $1 |
| Gini / Inequality Index | 665 | 0.41 |
Earnings by Sex in Brookside
Average Earnings in Brookside are $41,304, $40,395 for men and $42,946 for women, a difference of 5.9%.
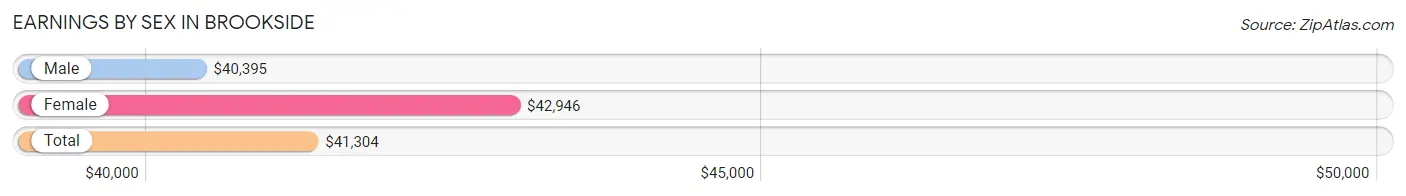
| Sex | Number | Average Earnings |
| Male | 250 (57.3%) | $40,395 |
| Female | 186 (42.7%) | $42,946 |
| Total | 436 (100.0%) | $41,304 |
Earnings by Sex by Income Bracket in Brookside
The most common earnings brackets in Brookside are $7,500 to $9,999 for men (33 | 13.2%) and $40,000 to $44,999 for women (32 | 17.2%).
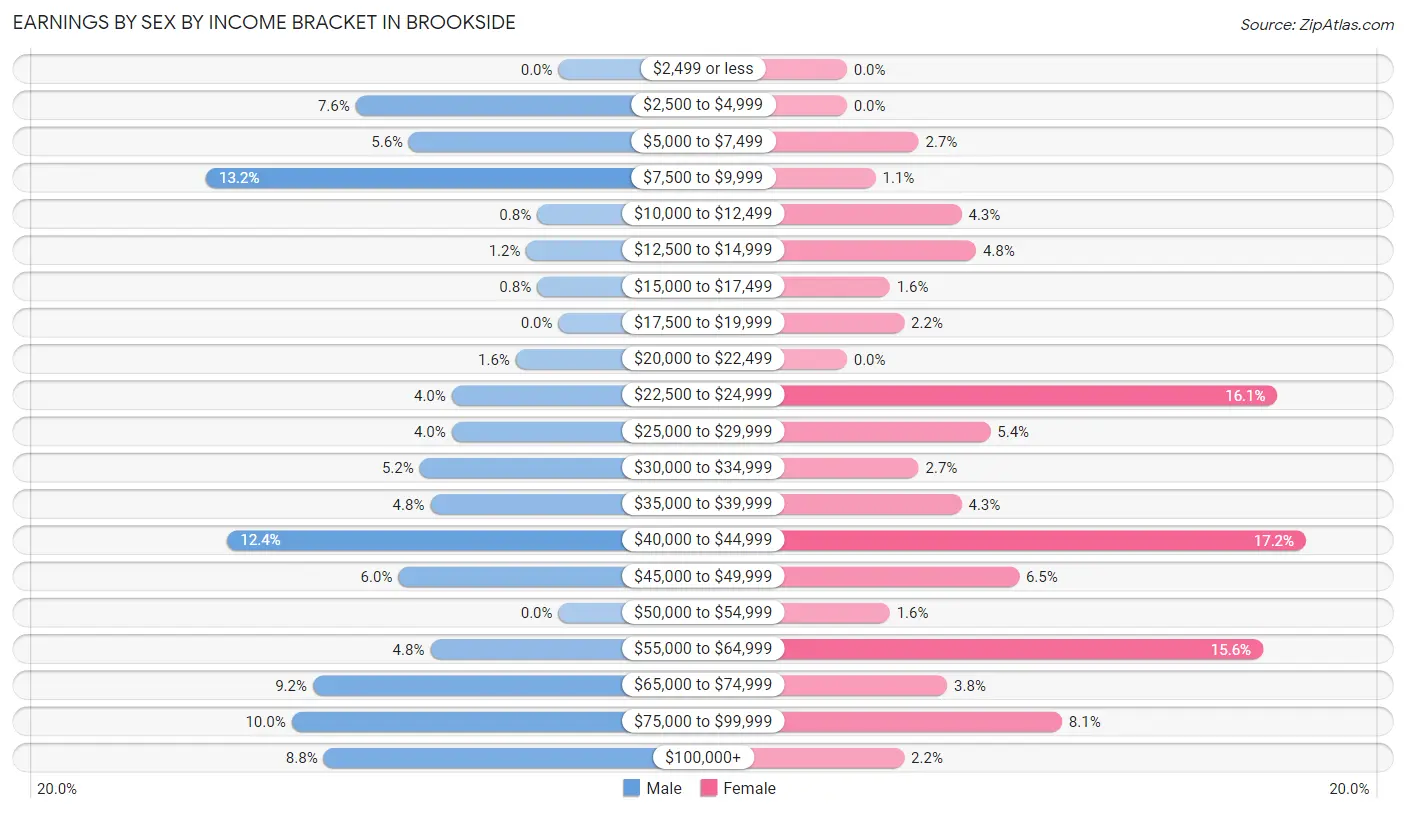
| Income | Male | Female |
| $2,499 or less | 0 (0.0%) | 0 (0.0%) |
| $2,500 to $4,999 | 19 (7.6%) | 0 (0.0%) |
| $5,000 to $7,499 | 14 (5.6%) | 5 (2.7%) |
| $7,500 to $9,999 | 33 (13.2%) | 2 (1.1%) |
| $10,000 to $12,499 | 2 (0.8%) | 8 (4.3%) |
| $12,500 to $14,999 | 3 (1.2%) | 9 (4.8%) |
| $15,000 to $17,499 | 2 (0.8%) | 3 (1.6%) |
| $17,500 to $19,999 | 0 (0.0%) | 4 (2.1%) |
| $20,000 to $22,499 | 4 (1.6%) | 0 (0.0%) |
| $22,500 to $24,999 | 10 (4.0%) | 30 (16.1%) |
| $25,000 to $29,999 | 10 (4.0%) | 10 (5.4%) |
| $30,000 to $34,999 | 13 (5.2%) | 5 (2.7%) |
| $35,000 to $39,999 | 12 (4.8%) | 8 (4.3%) |
| $40,000 to $44,999 | 31 (12.4%) | 32 (17.2%) |
| $45,000 to $49,999 | 15 (6.0%) | 12 (6.5%) |
| $50,000 to $54,999 | 0 (0.0%) | 3 (1.6%) |
| $55,000 to $64,999 | 12 (4.8%) | 29 (15.6%) |
| $65,000 to $74,999 | 23 (9.2%) | 7 (3.8%) |
| $75,000 to $99,999 | 25 (10.0%) | 15 (8.1%) |
| $100,000+ | 22 (8.8%) | 4 (2.1%) |
| Total | 250 (100.0%) | 186 (100.0%) |
Earnings by Sex by Educational Attainment in Brookside
Average earnings in Brookside are $43,646 for men and $43,929 for women, a difference of 0.6%. Men with an educational attainment of college or associate's degree enjoy the highest average annual earnings of $68,750, while those with bachelor's degree education earn the least with $33,750. Women with an educational attainment of bachelor's degree earn the most with the average annual earnings of $55,192, while those with high school diploma education have the smallest earnings of $42,708.
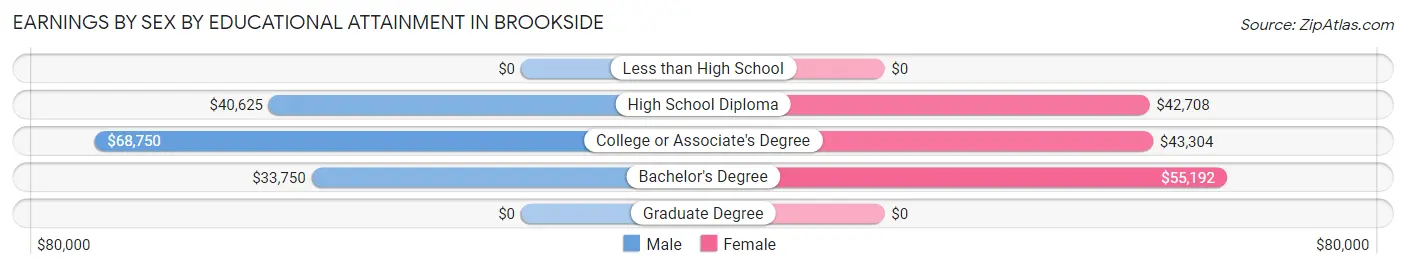
| Educational Attainment | Male Income | Female Income |
| Less than High School | - | - |
| High School Diploma | $40,625 | $42,708 |
| College or Associate's Degree | $68,750 | $43,304 |
| Bachelor's Degree | $33,750 | $55,192 |
| Graduate Degree | - | - |
| Total | $43,646 | $43,929 |
Family Income in Brookside
Family Income Brackets in Brookside
According to the Brookside family income data, there are 66 families falling into the $100,000 to $149,999 income range, which is the most common income bracket and makes up 33.5% of all families.
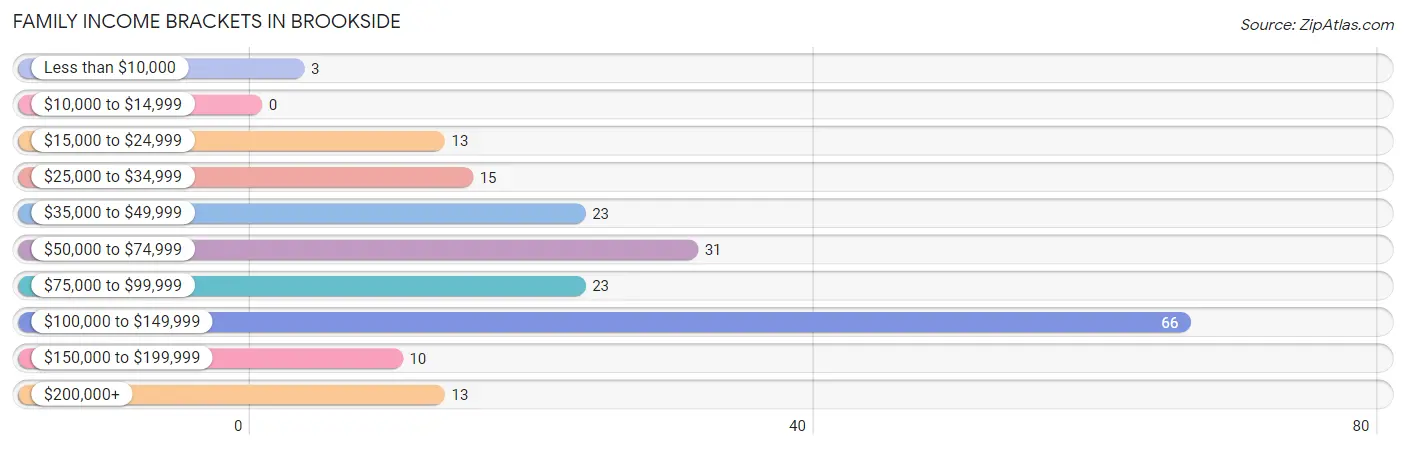
| Income Bracket | # Families | % Families |
| Less than $10,000 | 3 | 1.5% |
| $10,000 to $14,999 | 0 | 0.0% |
| $15,000 to $24,999 | 13 | 6.6% |
| $25,000 to $34,999 | 15 | 7.6% |
| $35,000 to $49,999 | 23 | 11.7% |
| $50,000 to $74,999 | 31 | 15.7% |
| $75,000 to $99,999 | 23 | 11.7% |
| $100,000 to $149,999 | 66 | 33.5% |
| $150,000 to $199,999 | 10 | 5.1% |
| $200,000+ | 13 | 6.6% |
Family Income by Famaliy Size in Brookside
3-person families (80 | 40.6%) account for the highest median family income in Brookside with $115,500 per family, while 3-person families (80 | 40.6%) have the highest median income of $38,500 per family member.
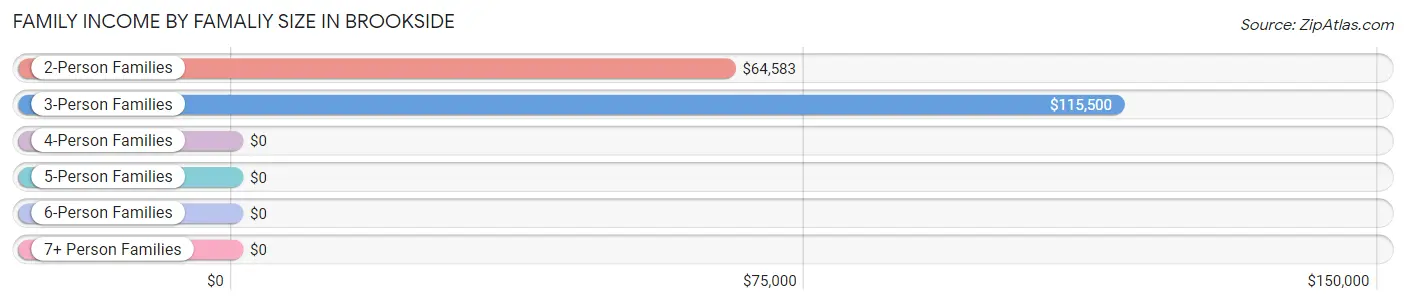
| Income Bracket | # Families | Median Income |
| 2-Person Families | 105 (53.3%) | $64,583 |
| 3-Person Families | 80 (40.6%) | $115,500 |
| 4-Person Families | 6 (3.0%) | $0 |
| 5-Person Families | 6 (3.0%) | $0 |
| 6-Person Families | 0 (0.0%) | $0 |
| 7+ Person Families | 0 (0.0%) | $0 |
| Total | 197 (100.0%) | $95,536 |
Family Income by Number of Earners in Brookside
The median family income in Brookside is $95,536, with families comprising 3+ earners (30) having the highest median family income of $130,714, while families with 1 earner (50) have the lowest median family income of $41,250, accounting for 15.2% and 25.4% of families, respectively.
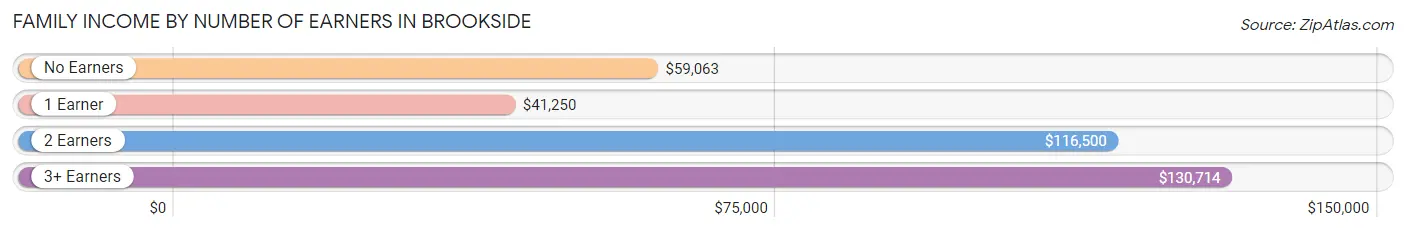
| Number of Earners | # Families | Median Income |
| No Earners | 21 (10.7%) | $59,063 |
| 1 Earner | 50 (25.4%) | $41,250 |
| 2 Earners | 96 (48.7%) | $116,500 |
| 3+ Earners | 30 (15.2%) | $130,714 |
| Total | 197 (100.0%) | $95,536 |
Household Income in Brookside
Household Income Brackets in Brookside
With 63 households falling in the category, the $100,000 to $149,999 income range is the most frequent in Brookside, accounting for 22.7% of all households. In contrast, only 3 households (1.1%) fall into the less than $10,000 income bracket, making it the least populous group.
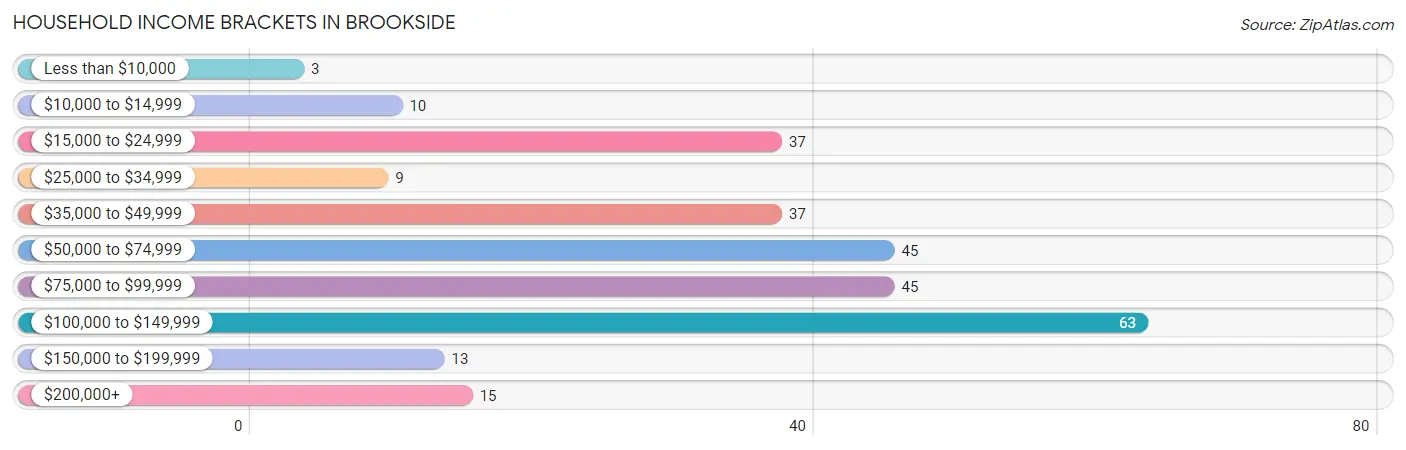
| Income Bracket | # Households | % Households |
| Less than $10,000 | 3 | 1.1% |
| $10,000 to $14,999 | 10 | 3.6% |
| $15,000 to $24,999 | 37 | 13.4% |
| $25,000 to $34,999 | 9 | 3.2% |
| $35,000 to $49,999 | 37 | 13.4% |
| $50,000 to $74,999 | 45 | 16.2% |
| $75,000 to $99,999 | 45 | 16.2% |
| $100,000 to $149,999 | 63 | 22.7% |
| $150,000 to $199,999 | 13 | 4.7% |
| $200,000+ | 15 | 5.4% |
Household Income by Householder Age in Brookside
The median household income in Brookside is $68,958, with the highest median household income of $86,146 found in the 25 to 44 years age bracket for the primary householder. A total of 113 households (40.8%) fall into this category. Meanwhile, the 15 to 24 years age bracket for the primary householder has the lowest median household income of $0, with 3 households (1.1%) in this group.
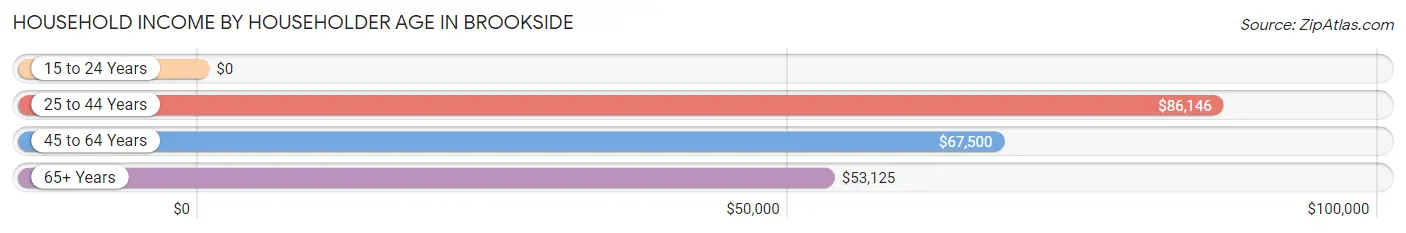
| Income Bracket | # Households | Median Income |
| 15 to 24 Years | 3 (1.1%) | $0 |
| 25 to 44 Years | 113 (40.8%) | $86,146 |
| 45 to 64 Years | 100 (36.1%) | $67,500 |
| 65+ Years | 61 (22.0%) | $53,125 |
| Total | 277 (100.0%) | $68,958 |
Poverty in Brookside
Income Below Poverty by Sex and Age in Brookside
With 9.8% poverty level for males and 9.0% for females among the residents of Brookside, 15 year old males and under 5 year old females are the most vulnerable to poverty, with 5 males (100.0%) and 10 females (100.0%) in their respective age groups living below the poverty level.
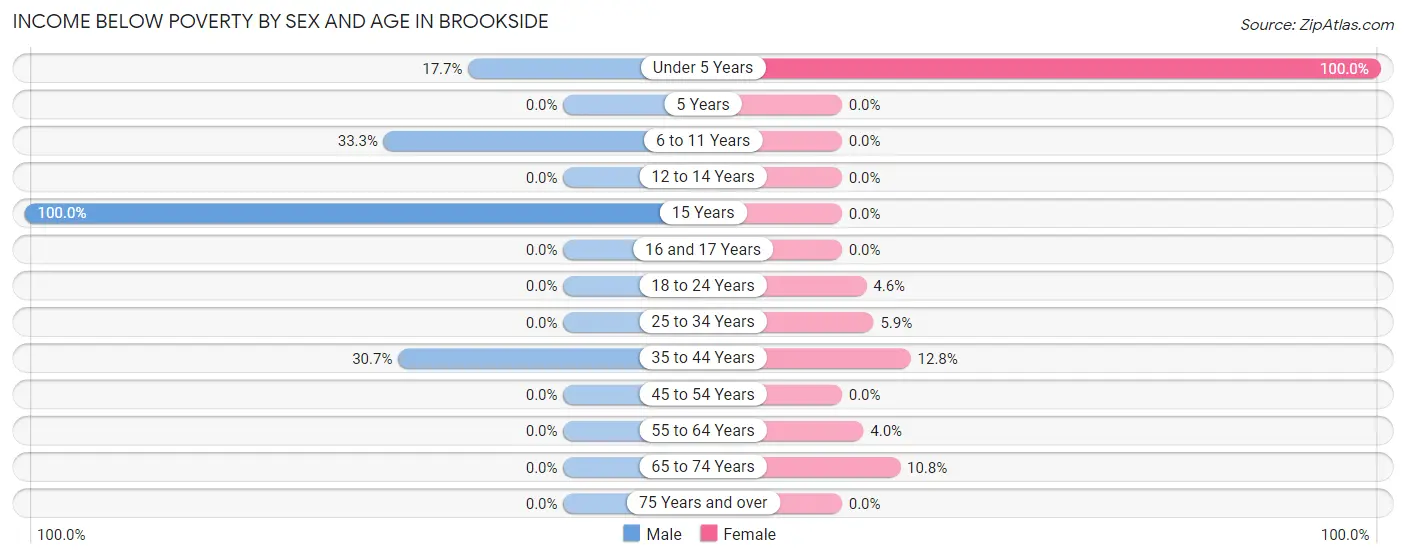
| Age Bracket | Male | Female |
| Under 5 Years | 6 (17.6%) | 10 (100.0%) |
| 5 Years | 0 (0.0%) | 0 (0.0%) |
| 6 to 11 Years | 6 (33.3%) | 0 (0.0%) |
| 12 to 14 Years | 0 (0.0%) | 0 (0.0%) |
| 15 Years | 5 (100.0%) | 0 (0.0%) |
| 16 and 17 Years | 0 (0.0%) | 0 (0.0%) |
| 18 to 24 Years | 0 (0.0%) | 1 (4.5%) |
| 25 to 34 Years | 0 (0.0%) | 3 (5.9%) |
| 35 to 44 Years | 19 (30.6%) | 6 (12.8%) |
| 45 to 54 Years | 0 (0.0%) | 0 (0.0%) |
| 55 to 64 Years | 0 (0.0%) | 3 (4.0%) |
| 65 to 74 Years | 0 (0.0%) | 4 (10.8%) |
| 75 Years and over | 0 (0.0%) | 0 (0.0%) |
| Total | 36 (9.8%) | 27 (9.0%) |
Income Above Poverty by Sex and Age in Brookside
According to the poverty statistics in Brookside, males aged 5 years and females aged 6 to 11 years are the age groups that are most secure financially, with 100.0% of males and 100.0% of females in these age groups living above the poverty line.
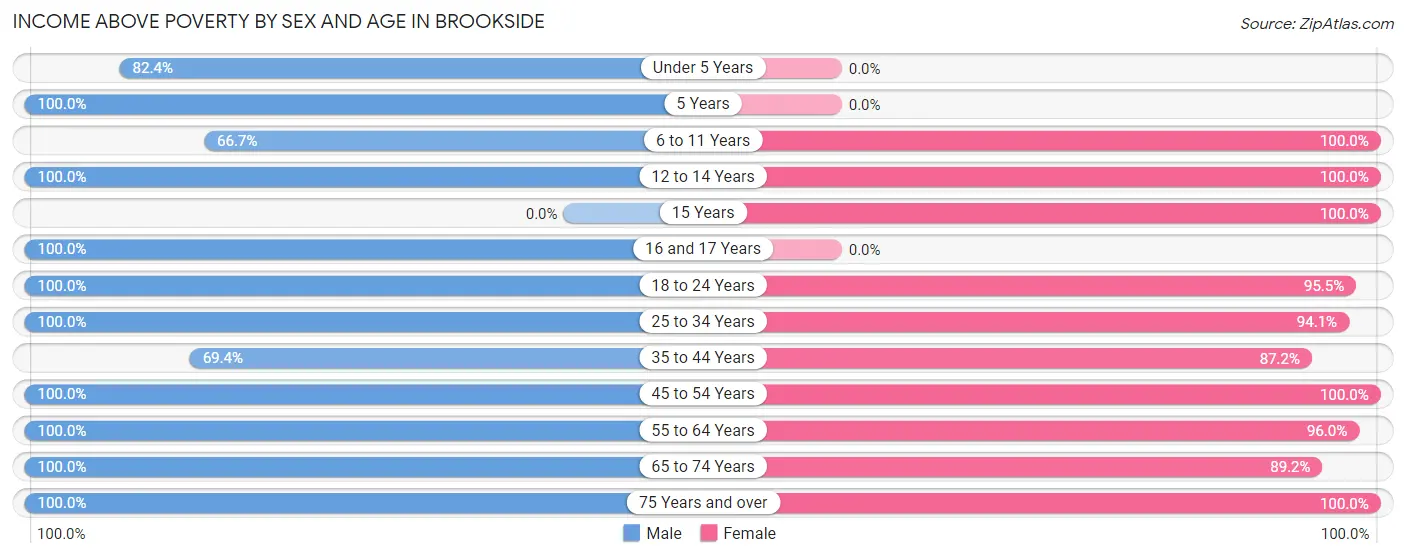
| Age Bracket | Male | Female |
| Under 5 Years | 28 (82.4%) | 0 (0.0%) |
| 5 Years | 3 (100.0%) | 0 (0.0%) |
| 6 to 11 Years | 12 (66.7%) | 13 (100.0%) |
| 12 to 14 Years | 10 (100.0%) | 4 (100.0%) |
| 15 Years | 0 (0.0%) | 2 (100.0%) |
| 16 and 17 Years | 5 (100.0%) | 0 (0.0%) |
| 18 to 24 Years | 44 (100.0%) | 21 (95.5%) |
| 25 to 34 Years | 66 (100.0%) | 48 (94.1%) |
| 35 to 44 Years | 43 (69.4%) | 41 (87.2%) |
| 45 to 54 Years | 26 (100.0%) | 17 (100.0%) |
| 55 to 64 Years | 48 (100.0%) | 72 (96.0%) |
| 65 to 74 Years | 31 (100.0%) | 33 (89.2%) |
| 75 Years and over | 14 (100.0%) | 21 (100.0%) |
| Total | 330 (90.2%) | 272 (91.0%) |
Income Below Poverty Among Married-Couple Families in Brookside
The poverty statistics for married-couple families in Brookside show that 6.0% or 9 of the total 151 families live below the poverty line. Families with 3 or 4 children have the highest poverty rate of 100.0%, comprising of 6 families. On the other hand, families with no children have the lowest poverty rate of 0.0%, which includes 0 families.
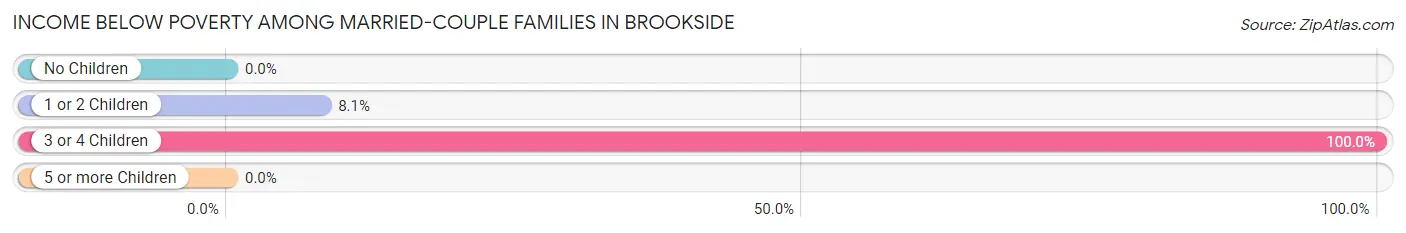
| Children | Above Poverty | Below Poverty |
| No Children | 108 (100.0%) | 0 (0.0%) |
| 1 or 2 Children | 34 (91.9%) | 3 (8.1%) |
| 3 or 4 Children | 0 (0.0%) | 6 (100.0%) |
| 5 or more Children | 0 (0.0%) | 0 (0.0%) |
| Total | 142 (94.0%) | 9 (6.0%) |
Income Below Poverty Among Single-Parent Households in Brookside
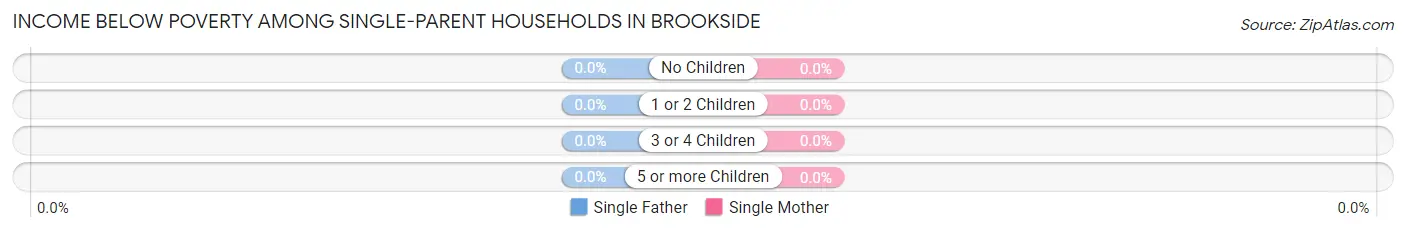
| Children | Single Father | Single Mother |
| No Children | 0 (0.0%) | 0 (0.0%) |
| 1 or 2 Children | 0 (0.0%) | 0 (0.0%) |
| 3 or 4 Children | 0 (0.0%) | 0 (0.0%) |
| 5 or more Children | 0 (0.0%) | 0 (0.0%) |
| Total | 0 (0.0%) | 0 (0.0%) |
Income Below Poverty Among Married-Couple vs Single-Parent Households in Brookside
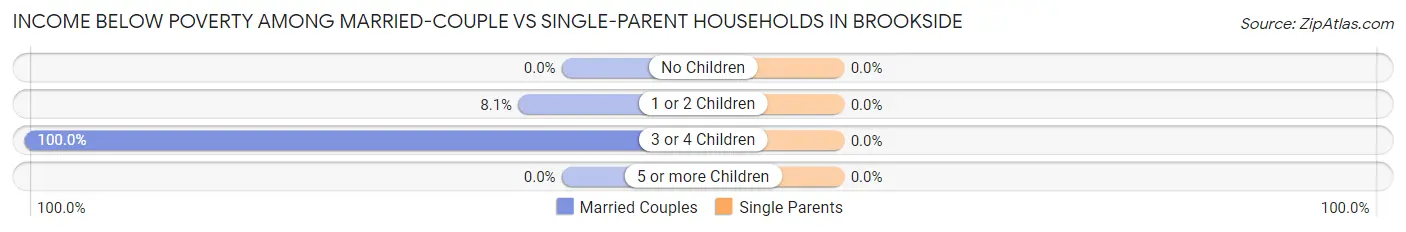
| Children | Married-Couple Families | Single-Parent Households |
| No Children | 0 (0.0%) | 0 (0.0%) |
| 1 or 2 Children | 3 (8.1%) | 0 (0.0%) |
| 3 or 4 Children | 6 (100.0%) | 0 (0.0%) |
| 5 or more Children | 0 (0.0%) | 0 (0.0%) |
| Total | 9 (6.0%) | 0 (0.0%) |
Employment Characteristics in Brookside
Employment by Class of Employer in Brookside
Among the 380 employed individuals in Brookside, private company employees (302 | 79.5%), local government employees (25 | 6.6%), and state government employees (22 | 5.8%) make up the most common classes of employment.
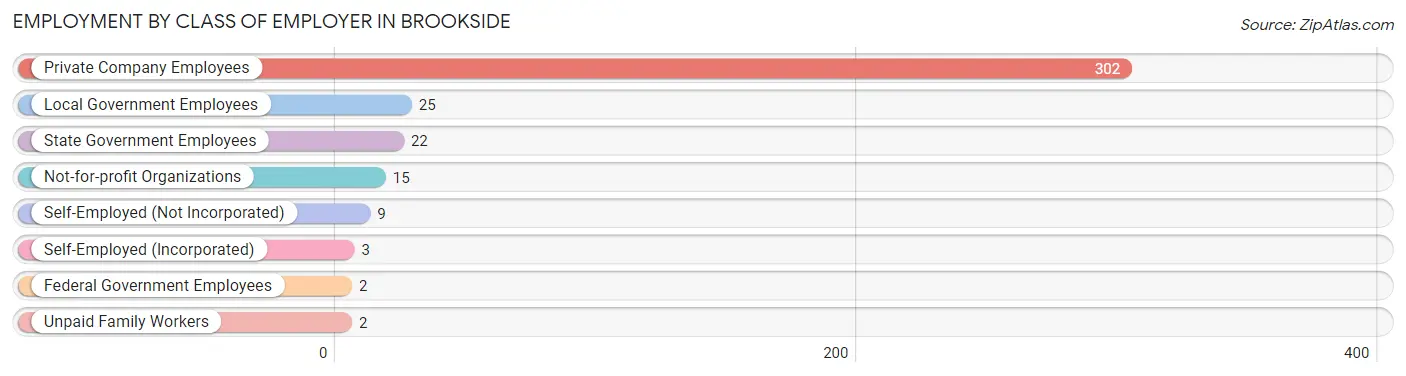
| Employer Class | # Employees | % Employees |
| Private Company Employees | 302 | 79.5% |
| Self-Employed (Incorporated) | 3 | 0.8% |
| Self-Employed (Not Incorporated) | 9 | 2.4% |
| Not-for-profit Organizations | 15 | 4.0% |
| Local Government Employees | 25 | 6.6% |
| State Government Employees | 22 | 5.8% |
| Federal Government Employees | 2 | 0.5% |
| Unpaid Family Workers | 2 | 0.5% |
| Total | 380 | 100.0% |
Employment Status by Age in Brookside
According to the labor force statistics for Brookside, out of the total population over 16 years of age (566), 70.3% or 398 individuals are in the labor force, with 3.0% or 12 of them unemployed. The age group with the highest labor force participation rate is 35 to 44 years, with 98.2% or 107 individuals in the labor force. Within the labor force, the 35 to 44 years age range has the highest percentage of unemployed individuals, with 8.4% or 9 of them being unemployed.
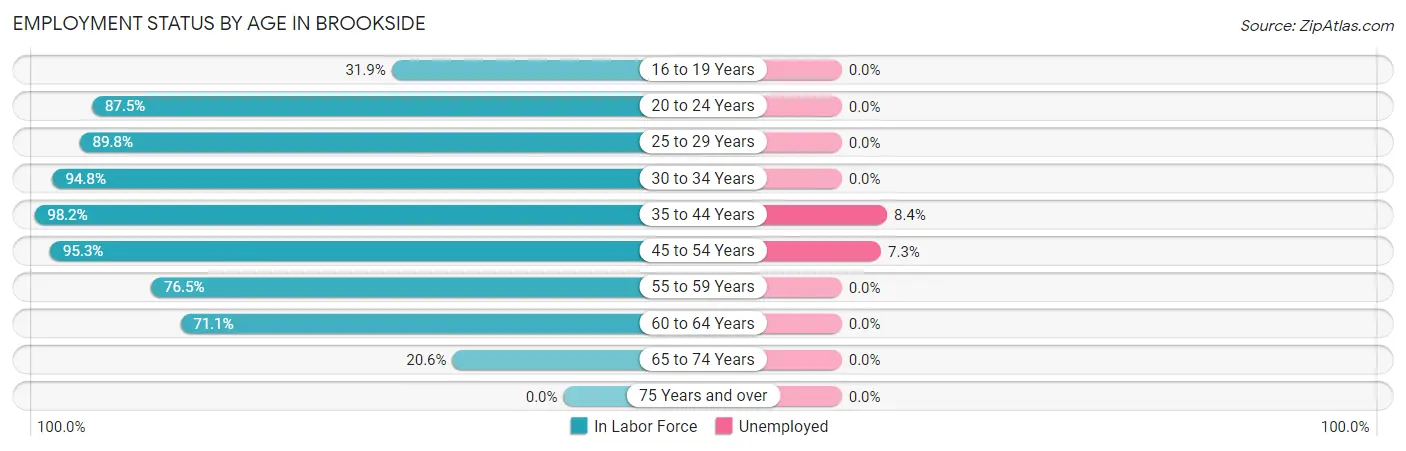
| Age Bracket | In Labor Force | Unemployed |
| 16 to 19 Years | 15 (31.9%) | 0 (0.0%) |
| 20 to 24 Years | 21 (87.5%) | 0 (0.0%) |
| 25 to 29 Years | 53 (89.8%) | 0 (0.0%) |
| 30 to 34 Years | 55 (94.8%) | 0 (0.0%) |
| 35 to 44 Years | 107 (98.2%) | 9 (8.4%) |
| 45 to 54 Years | 41 (95.3%) | 3 (7.3%) |
| 55 to 59 Years | 65 (76.5%) | 0 (0.0%) |
| 60 to 64 Years | 27 (71.1%) | 0 (0.0%) |
| 65 to 74 Years | 14 (20.6%) | 0 (0.0%) |
| 75 Years and over | 0 (0.0%) | 0 (0.0%) |
| Total | 398 (70.3%) | 12 (3.0%) |
Employment Status by Educational Attainment in Brookside
According to labor force statistics for Brookside, 88.8% of individuals (348) out of the total population between 25 and 64 years of age (392) are in the labor force, with 3.4% or 12 of them being unemployed. The group with the highest labor force participation rate are those with the educational attainment of bachelor's degree or higher, with 92.2% or 83 individuals in the labor force. Within the labor force, individuals with bachelor's degree or higher education have the highest percentage of unemployment, with 10.8% or 9 of them being unemployed.
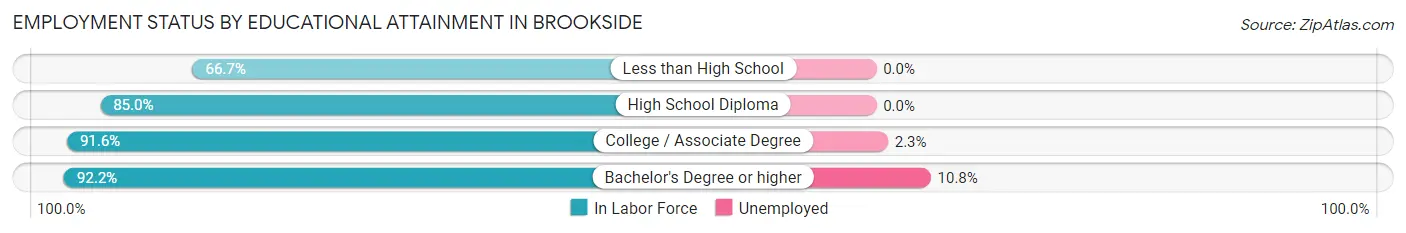
| Educational Attainment | In Labor Force | Unemployed |
| Less than High School | 4 (66.7%) | 0 (0.0%) |
| High School Diploma | 130 (85.0%) | 0 (0.0%) |
| College / Associate Degree | 131 (91.6%) | 3 (2.3%) |
| Bachelor's Degree or higher | 83 (92.2%) | 10 (10.8%) |
| Total | 348 (88.8%) | 13 (3.4%) |
Employment Occupations by Sex in Brookside
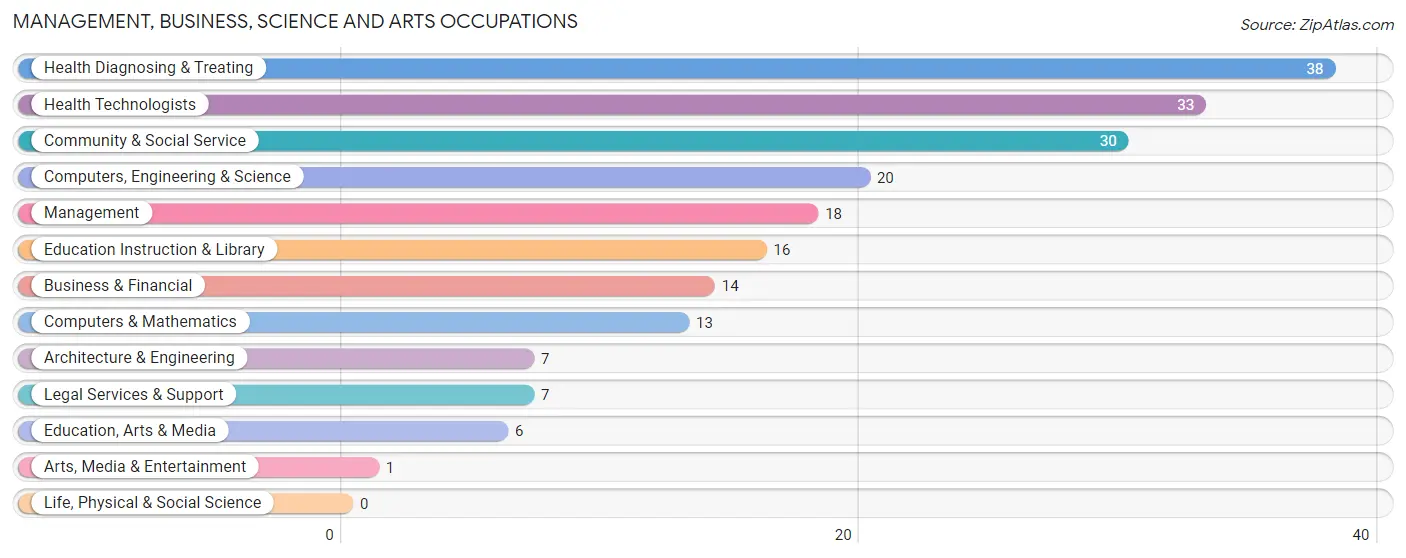
Management, Business, Science and Arts Occupations
The most common Management, Business, Science and Arts occupations in Brookside are Health Diagnosing & Treating (38 | 9.8%), Health Technologists (33 | 8.6%), Community & Social Service (30 | 7.8%), Computers, Engineering & Science (20 | 5.2%), and Management (18 | 4.7%).
Management, Business, Science and Arts Occupations by Sex
Within the Management, Business, Science and Arts occupations in Brookside, the most male-oriented occupations are Business & Financial (100.0%), Architecture & Engineering (100.0%), and Education, Arts & Media (100.0%), while the most female-oriented occupations are Legal Services & Support (100.0%), Arts, Media & Entertainment (100.0%), and Health Diagnosing & Treating (86.8%).
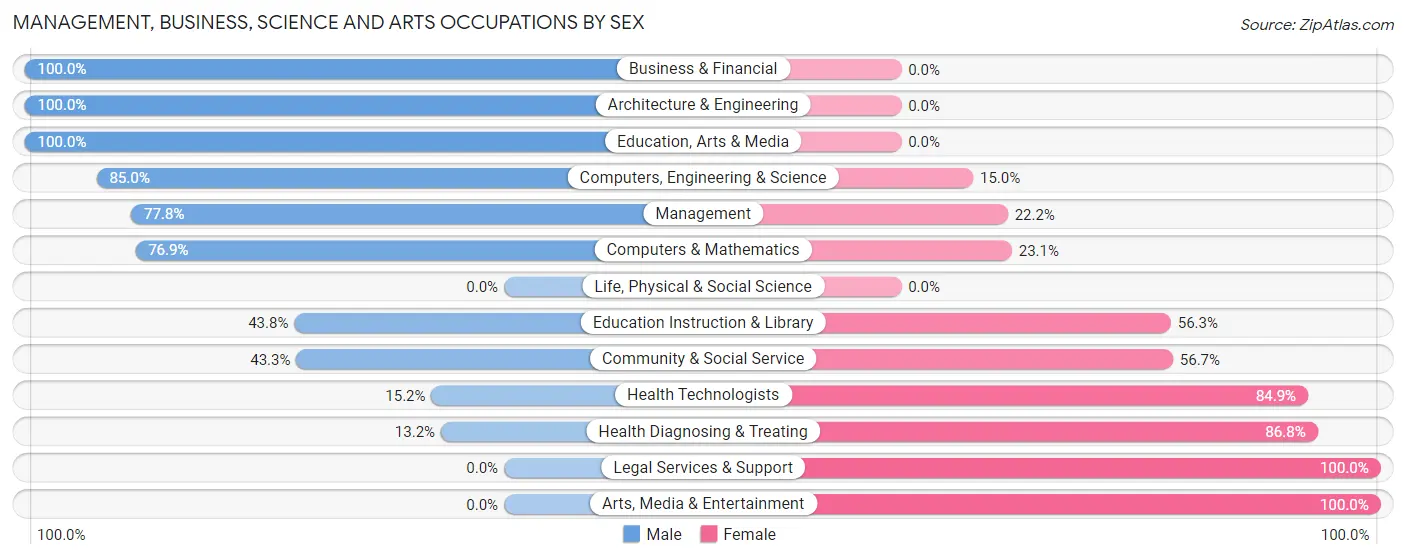
| Occupation | Male | Female |
| Management | 14 (77.8%) | 4 (22.2%) |
| Business & Financial | 14 (100.0%) | 0 (0.0%) |
| Computers, Engineering & Science | 17 (85.0%) | 3 (15.0%) |
| Computers & Mathematics | 10 (76.9%) | 3 (23.1%) |
| Architecture & Engineering | 7 (100.0%) | 0 (0.0%) |
| Life, Physical & Social Science | 0 (0.0%) | 0 (0.0%) |
| Community & Social Service | 13 (43.3%) | 17 (56.7%) |
| Education, Arts & Media | 6 (100.0%) | 0 (0.0%) |
| Legal Services & Support | 0 (0.0%) | 7 (100.0%) |
| Education Instruction & Library | 7 (43.8%) | 9 (56.2%) |
| Arts, Media & Entertainment | 0 (0.0%) | 1 (100.0%) |
| Health Diagnosing & Treating | 5 (13.2%) | 33 (86.8%) |
| Health Technologists | 5 (15.1%) | 28 (84.9%) |
| Total (Category) | 63 (52.5%) | 57 (47.5%) |
| Total (Overall) | 217 (56.2%) | 169 (43.8%) |
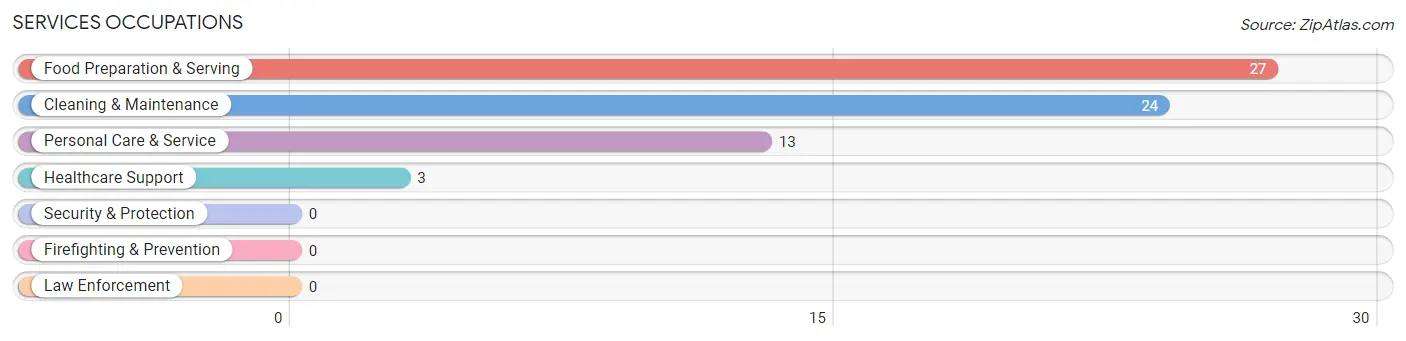
Services Occupations
The most common Services occupations in Brookside are Food Preparation & Serving (27 | 7.0%), Cleaning & Maintenance (24 | 6.2%), Personal Care & Service (13 | 3.4%), and Healthcare Support (3 | 0.8%).
Services Occupations by Sex
Within the Services occupations in Brookside, the most male-oriented occupations are Food Preparation & Serving (85.2%), and Cleaning & Maintenance (58.3%), while the most female-oriented occupations are Healthcare Support (100.0%), Personal Care & Service (100.0%), and Cleaning & Maintenance (41.7%).
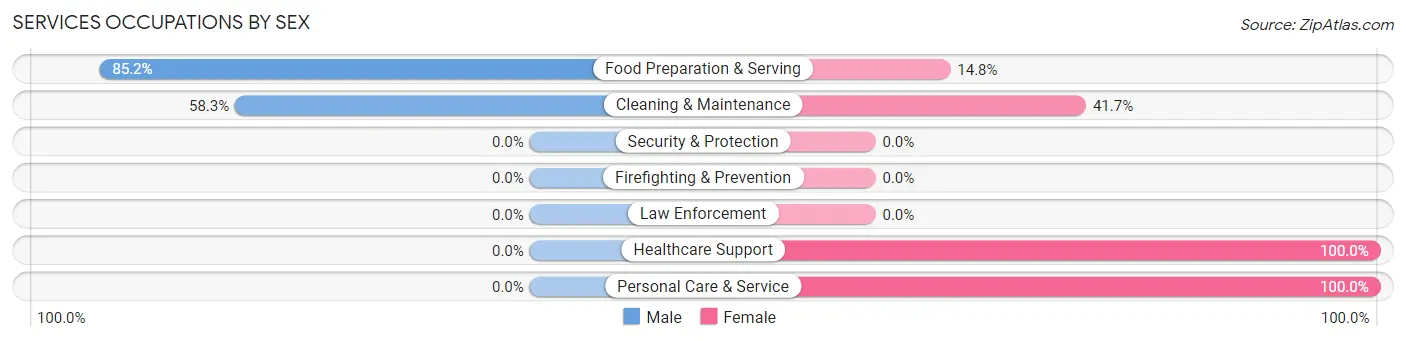
| Occupation | Male | Female |
| Healthcare Support | 0 (0.0%) | 3 (100.0%) |
| Security & Protection | 0 (0.0%) | 0 (0.0%) |
| Firefighting & Prevention | 0 (0.0%) | 0 (0.0%) |
| Law Enforcement | 0 (0.0%) | 0 (0.0%) |
| Food Preparation & Serving | 23 (85.2%) | 4 (14.8%) |
| Cleaning & Maintenance | 14 (58.3%) | 10 (41.7%) |
| Personal Care & Service | 0 (0.0%) | 13 (100.0%) |
| Total (Category) | 37 (55.2%) | 30 (44.8%) |
| Total (Overall) | 217 (56.2%) | 169 (43.8%) |
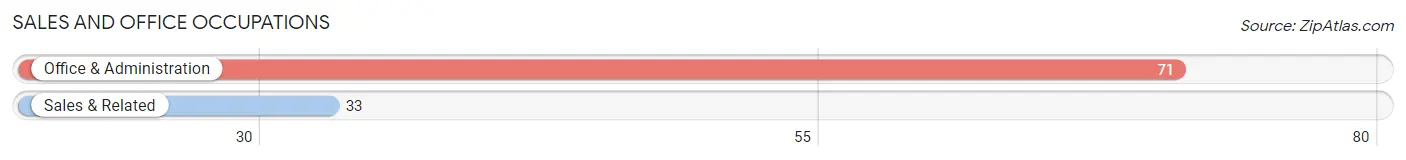
Sales and Office Occupations
The most common Sales and Office occupations in Brookside are Office & Administration (71 | 18.4%), and Sales & Related (33 | 8.6%).
Sales and Office Occupations by Sex
| Occupation | Male | Female |
| Sales & Related | 19 (57.6%) | 14 (42.4%) |
| Office & Administration | 9 (12.7%) | 62 (87.3%) |
| Total (Category) | 28 (26.9%) | 76 (73.1%) |
| Total (Overall) | 217 (56.2%) | 169 (43.8%) |
Natural Resources, Construction and Maintenance Occupations
The most common Natural Resources, Construction and Maintenance occupations in Brookside are Installation, Maintenance & Repair (21 | 5.4%), and Construction & Extraction (17 | 4.4%).
Natural Resources, Construction and Maintenance Occupations by Sex
| Occupation | Male | Female |
| Farming, Fishing & Forestry | 0 (0.0%) | 0 (0.0%) |
| Construction & Extraction | 17 (100.0%) | 0 (0.0%) |
| Installation, Maintenance & Repair | 21 (100.0%) | 0 (0.0%) |
| Total (Category) | 38 (100.0%) | 0 (0.0%) |
| Total (Overall) | 217 (56.2%) | 169 (43.8%) |
Production, Transportation and Moving Occupations
The most common Production, Transportation and Moving occupations in Brookside are Production (20 | 5.2%), Material Moving (20 | 5.2%), and Transportation (17 | 4.4%).
Production, Transportation and Moving Occupations by Sex
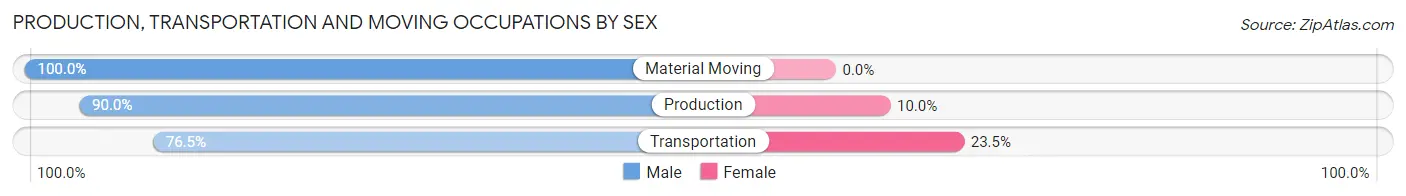
| Occupation | Male | Female |
| Production | 18 (90.0%) | 2 (10.0%) |
| Transportation | 13 (76.5%) | 4 (23.5%) |
| Material Moving | 20 (100.0%) | 0 (0.0%) |
| Total (Category) | 51 (89.5%) | 6 (10.5%) |
| Total (Overall) | 217 (56.2%) | 169 (43.8%) |
Employment Industries by Sex in Brookside
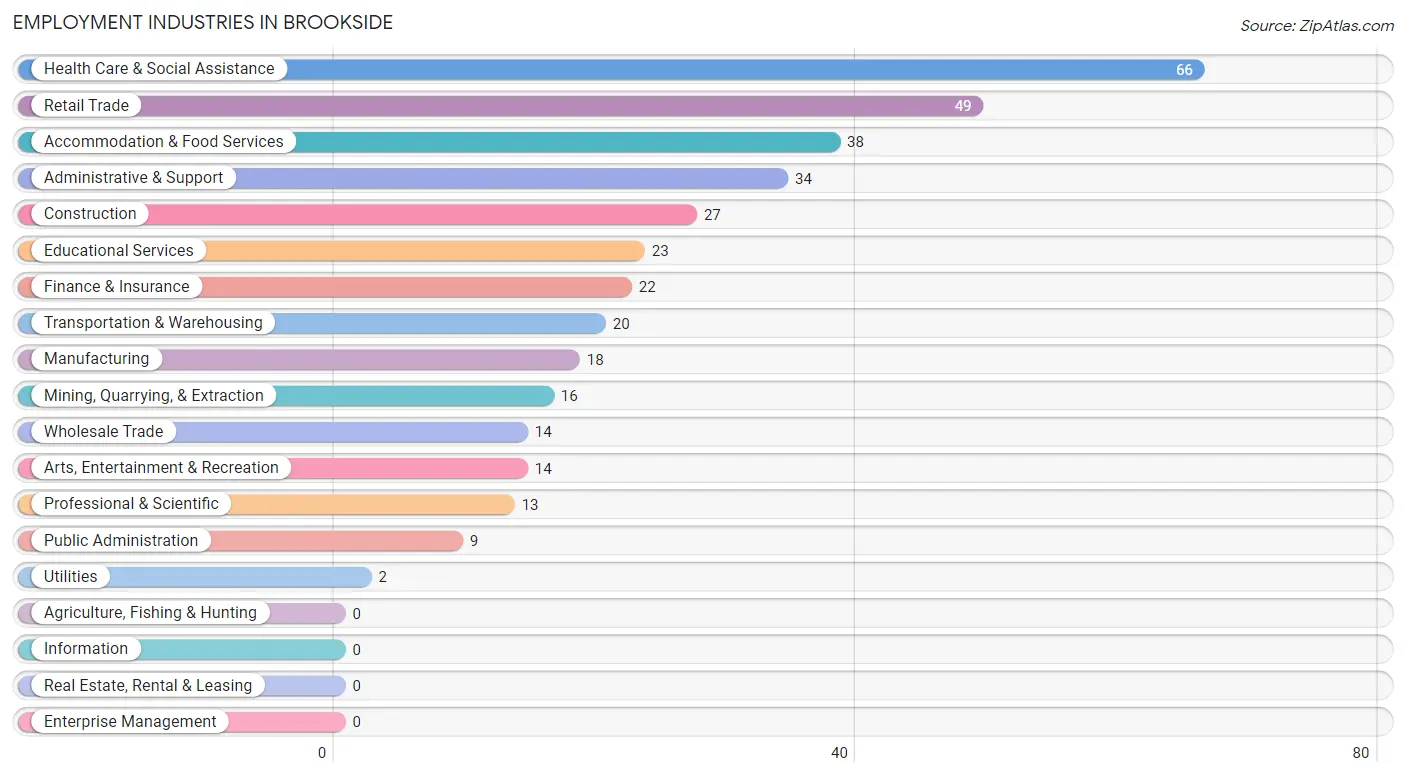
Employment Industries in Brookside
The major employment industries in Brookside include Health Care & Social Assistance (66 | 17.1%), Retail Trade (49 | 12.7%), Accommodation & Food Services (38 | 9.8%), Administrative & Support (34 | 8.8%), and Construction (27 | 7.0%).
Employment Industries by Sex in Brookside
The Brookside industries that see more men than women are Wholesale Trade (100.0%), Utilities (100.0%), and Construction (96.3%), whereas the industries that tend to have a higher number of women are Finance & Insurance (100.0%), Professional & Scientific (100.0%), and Health Care & Social Assistance (78.8%).
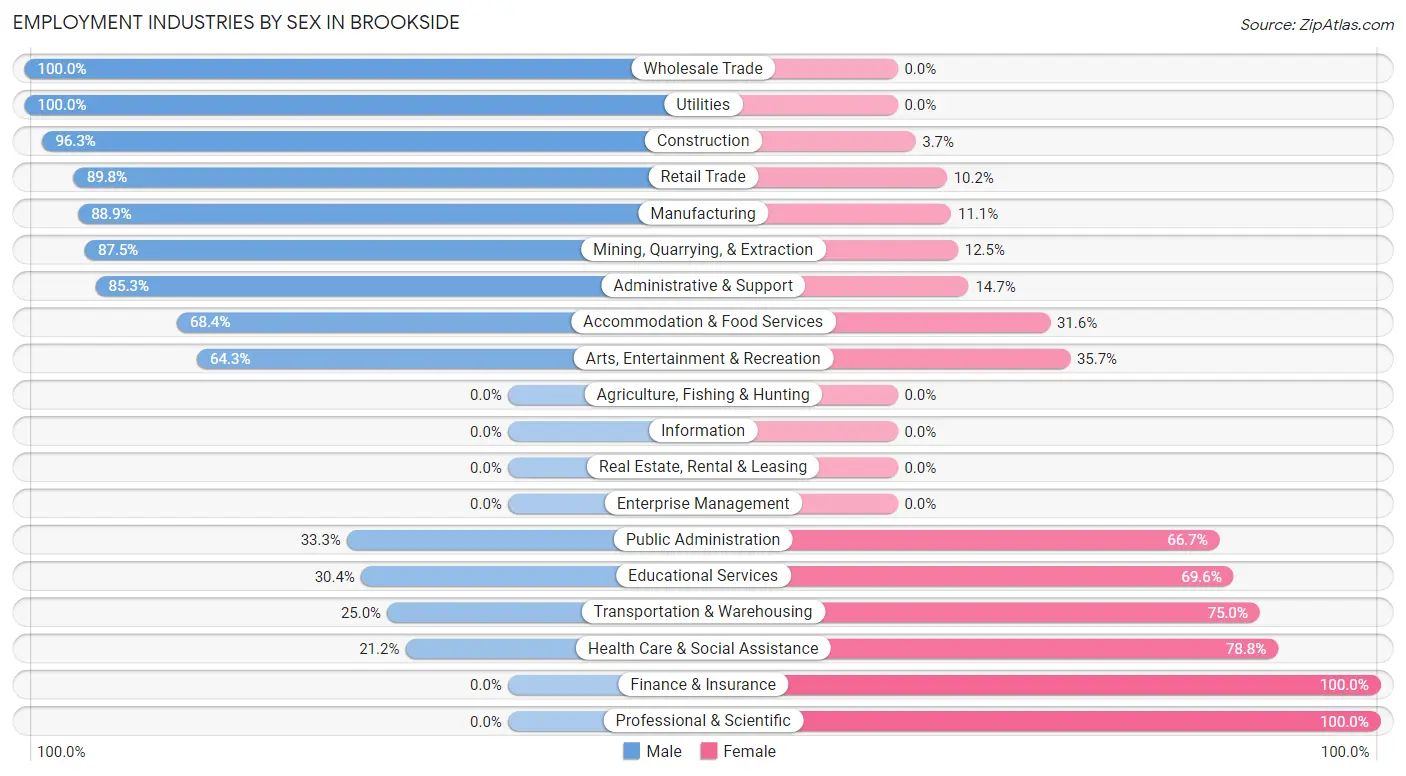
| Industry | Male | Female |
| Agriculture, Fishing & Hunting | 0 (0.0%) | 0 (0.0%) |
| Mining, Quarrying, & Extraction | 14 (87.5%) | 2 (12.5%) |
| Construction | 26 (96.3%) | 1 (3.7%) |
| Manufacturing | 16 (88.9%) | 2 (11.1%) |
| Wholesale Trade | 14 (100.0%) | 0 (0.0%) |
| Retail Trade | 44 (89.8%) | 5 (10.2%) |
| Transportation & Warehousing | 5 (25.0%) | 15 (75.0%) |
| Utilities | 2 (100.0%) | 0 (0.0%) |
| Information | 0 (0.0%) | 0 (0.0%) |
| Finance & Insurance | 0 (0.0%) | 22 (100.0%) |
| Real Estate, Rental & Leasing | 0 (0.0%) | 0 (0.0%) |
| Professional & Scientific | 0 (0.0%) | 13 (100.0%) |
| Enterprise Management | 0 (0.0%) | 0 (0.0%) |
| Administrative & Support | 29 (85.3%) | 5 (14.7%) |
| Educational Services | 7 (30.4%) | 16 (69.6%) |
| Health Care & Social Assistance | 14 (21.2%) | 52 (78.8%) |
| Arts, Entertainment & Recreation | 9 (64.3%) | 5 (35.7%) |
| Accommodation & Food Services | 26 (68.4%) | 12 (31.6%) |
| Public Administration | 3 (33.3%) | 6 (66.7%) |
| Total | 217 (56.2%) | 169 (43.8%) |
Education in Brookside
School Enrollment in Brookside
The most common levels of schooling among the 114 students in Brookside are college / undergraduate (41 | 36.0%), middle school (26 | 22.8%), and elementary school (15 | 13.2%).
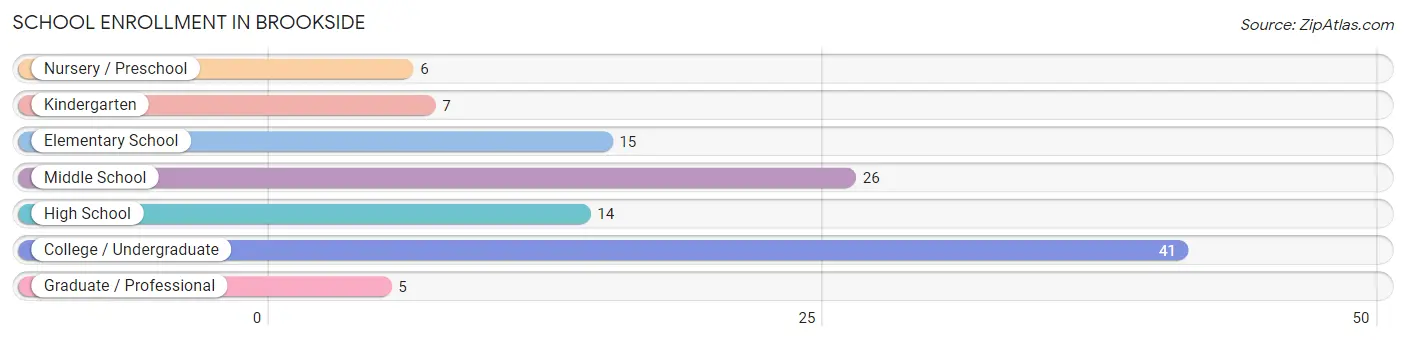
| School Level | # Students | % Students |
| Nursery / Preschool | 6 | 5.3% |
| Kindergarten | 7 | 6.1% |
| Elementary School | 15 | 13.2% |
| Middle School | 26 | 22.8% |
| High School | 14 | 12.3% |
| College / Undergraduate | 41 | 36.0% |
| Graduate / Professional | 5 | 4.4% |
| Total | 114 | 100.0% |
School Enrollment by Age by Funding Source in Brookside
Out of a total of 114 students who are enrolled in schools in Brookside, 35 (30.7%) attend a private institution, while the remaining 79 (69.3%) are enrolled in public schools. The age group of 25 to 34 year olds has the highest likelihood of being enrolled in private schools, with 2 (100.0% in the age bracket) enrolled. Conversely, the age group of 3 to 4 year olds has the lowest likelihood of being enrolled in a private school, with 6 (100.0% in the age bracket) attending a public institution.
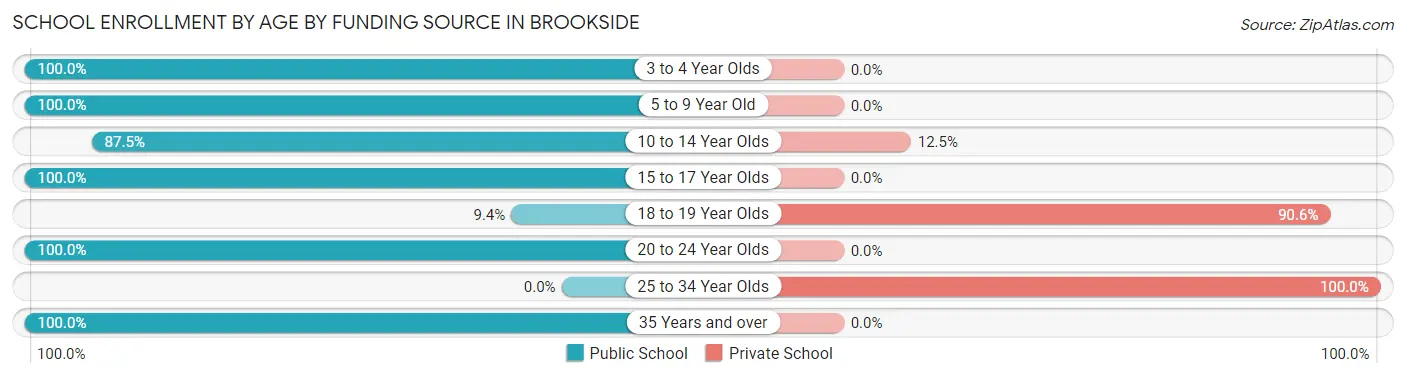
| Age Bracket | Public School | Private School |
| 3 to 4 Year Olds | 6 (100.0%) | 0 (0.0%) |
| 5 to 9 Year Old | 16 (100.0%) | 0 (0.0%) |
| 10 to 14 Year Olds | 28 (87.5%) | 4 (12.5%) |
| 15 to 17 Year Olds | 12 (100.0%) | 0 (0.0%) |
| 18 to 19 Year Olds | 3 (9.4%) | 29 (90.6%) |
| 20 to 24 Year Olds | 9 (100.0%) | 0 (0.0%) |
| 25 to 34 Year Olds | 0 (0.0%) | 2 (100.0%) |
| 35 Years and over | 5 (100.0%) | 0 (0.0%) |
| Total | 79 (69.3%) | 35 (30.7%) |
Educational Attainment by Field of Study in Brookside
Education (37 | 32.2%), business (16 | 13.9%), science & technology (12 | 10.4%), liberal arts & history (10 | 8.7%), and arts & humanities (10 | 8.7%) are the most common fields of study among 115 individuals in Brookside who have obtained a bachelor's degree or higher.
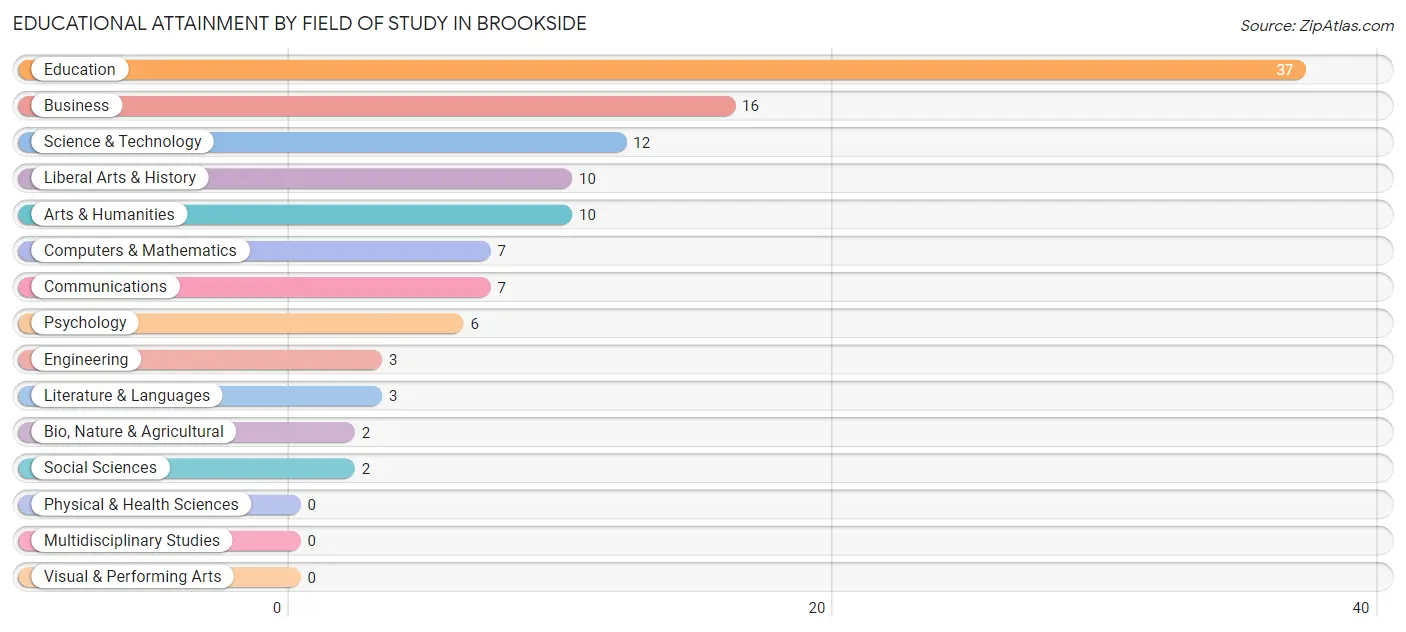
| Field of Study | # Graduates | % Graduates |
| Computers & Mathematics | 7 | 6.1% |
| Bio, Nature & Agricultural | 2 | 1.7% |
| Physical & Health Sciences | 0 | 0.0% |
| Psychology | 6 | 5.2% |
| Social Sciences | 2 | 1.7% |
| Engineering | 3 | 2.6% |
| Multidisciplinary Studies | 0 | 0.0% |
| Science & Technology | 12 | 10.4% |
| Business | 16 | 13.9% |
| Education | 37 | 32.2% |
| Literature & Languages | 3 | 2.6% |
| Liberal Arts & History | 10 | 8.7% |
| Visual & Performing Arts | 0 | 0.0% |
| Communications | 7 | 6.1% |
| Arts & Humanities | 10 | 8.7% |
| Total | 115 | 100.0% |
Transportation & Commute in Brookside
Vehicle Availability by Sex in Brookside
The most prevalent vehicle ownership categories in Brookside are males with 2 vehicles (91, accounting for 43.1%) and females with 2 vehicles (73, making up 53.8%).
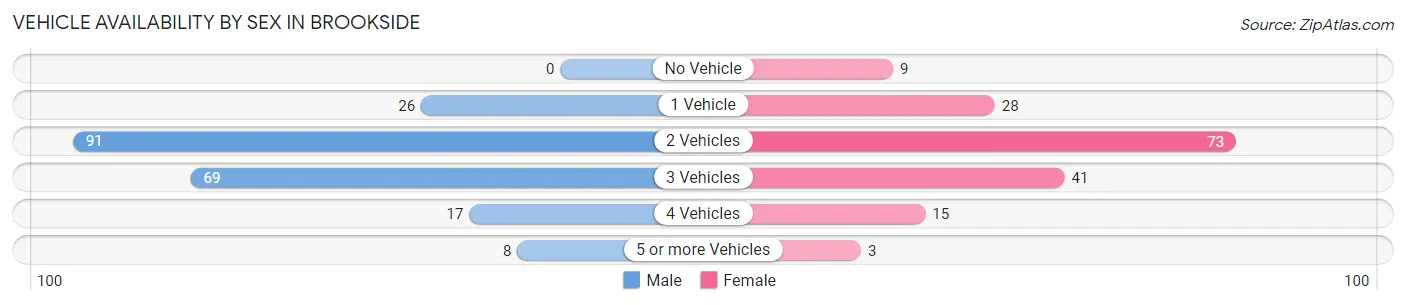
| Vehicles Available | Male | Female |
| No Vehicle | 0 (0.0%) | 9 (5.3%) |
| 1 Vehicle | 26 (12.3%) | 28 (16.6%) |
| 2 Vehicles | 91 (43.1%) | 73 (43.2%) |
| 3 Vehicles | 69 (32.7%) | 41 (24.3%) |
| 4 Vehicles | 17 (8.1%) | 15 (8.9%) |
| 5 or more Vehicles | 8 (3.8%) | 3 (1.8%) |
| Total | 211 (100.0%) | 169 (100.0%) |
Commute Time in Brookside
The most frequently occuring commute durations in Brookside are 20 to 24 minutes (93 commuters, 27.2%), 15 to 19 minutes (82 commuters, 24.0%), and 10 to 14 minutes (73 commuters, 21.3%).
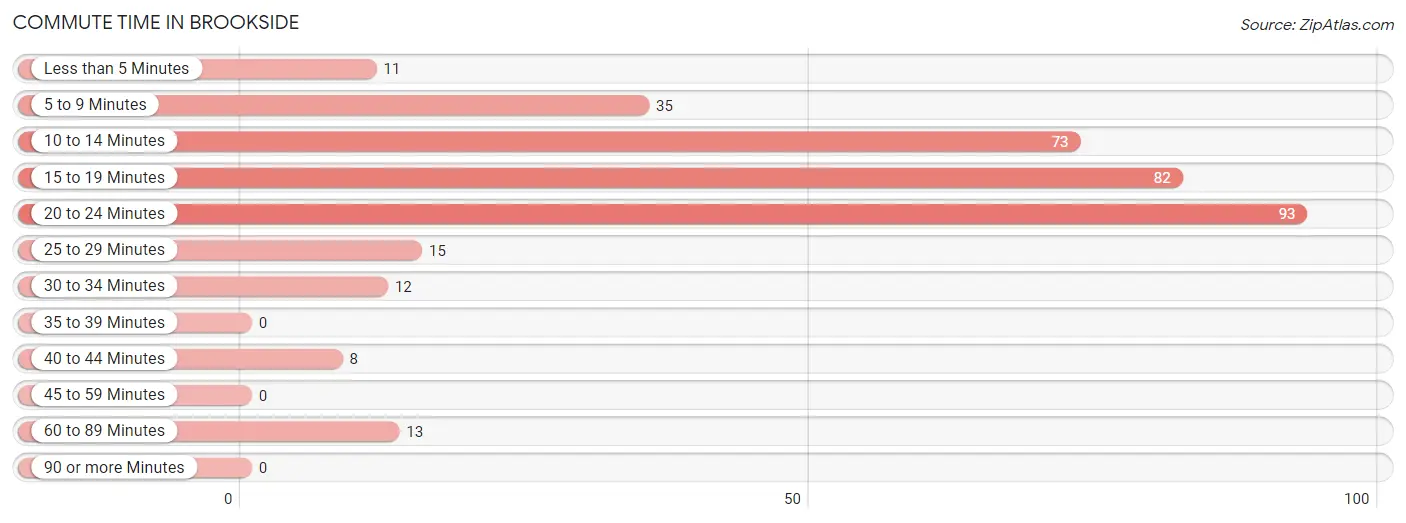
| Commute Time | # Commuters | % Commuters |
| Less than 5 Minutes | 11 | 3.2% |
| 5 to 9 Minutes | 35 | 10.2% |
| 10 to 14 Minutes | 73 | 21.3% |
| 15 to 19 Minutes | 82 | 24.0% |
| 20 to 24 Minutes | 93 | 27.2% |
| 25 to 29 Minutes | 15 | 4.4% |
| 30 to 34 Minutes | 12 | 3.5% |
| 35 to 39 Minutes | 0 | 0.0% |
| 40 to 44 Minutes | 8 | 2.3% |
| 45 to 59 Minutes | 0 | 0.0% |
| 60 to 89 Minutes | 13 | 3.8% |
| 90 or more Minutes | 0 | 0.0% |
Commute Time by Sex in Brookside
The most common commute times in Brookside are 15 to 19 minutes (57 commuters, 28.8%) for males and 20 to 24 minutes (54 commuters, 37.5%) for females.
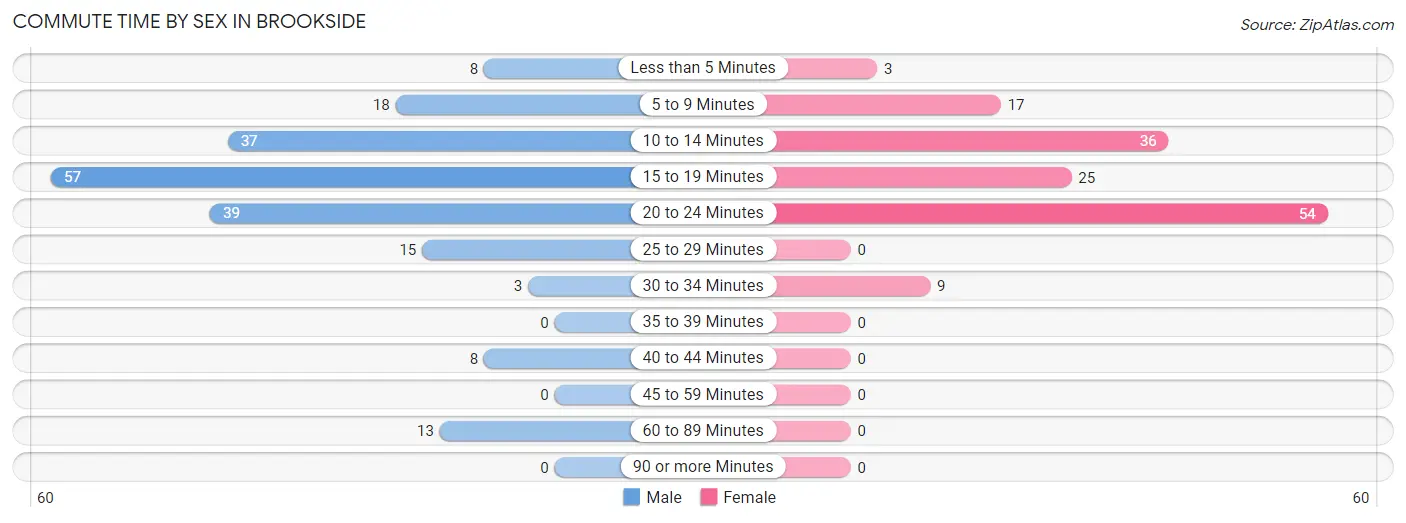
| Commute Time | Male | Female |
| Less than 5 Minutes | 8 (4.0%) | 3 (2.1%) |
| 5 to 9 Minutes | 18 (9.1%) | 17 (11.8%) |
| 10 to 14 Minutes | 37 (18.7%) | 36 (25.0%) |
| 15 to 19 Minutes | 57 (28.8%) | 25 (17.4%) |
| 20 to 24 Minutes | 39 (19.7%) | 54 (37.5%) |
| 25 to 29 Minutes | 15 (7.6%) | 0 (0.0%) |
| 30 to 34 Minutes | 3 (1.5%) | 9 (6.2%) |
| 35 to 39 Minutes | 0 (0.0%) | 0 (0.0%) |
| 40 to 44 Minutes | 8 (4.0%) | 0 (0.0%) |
| 45 to 59 Minutes | 0 (0.0%) | 0 (0.0%) |
| 60 to 89 Minutes | 13 (6.6%) | 0 (0.0%) |
| 90 or more Minutes | 0 (0.0%) | 0 (0.0%) |
Time of Departure to Work by Sex in Brookside
The most frequent times of departure to work in Brookside are 12:00 PM to 3:59 PM (35, 17.7%) for males and 7:00 AM to 7:29 AM (30, 20.8%) for females.
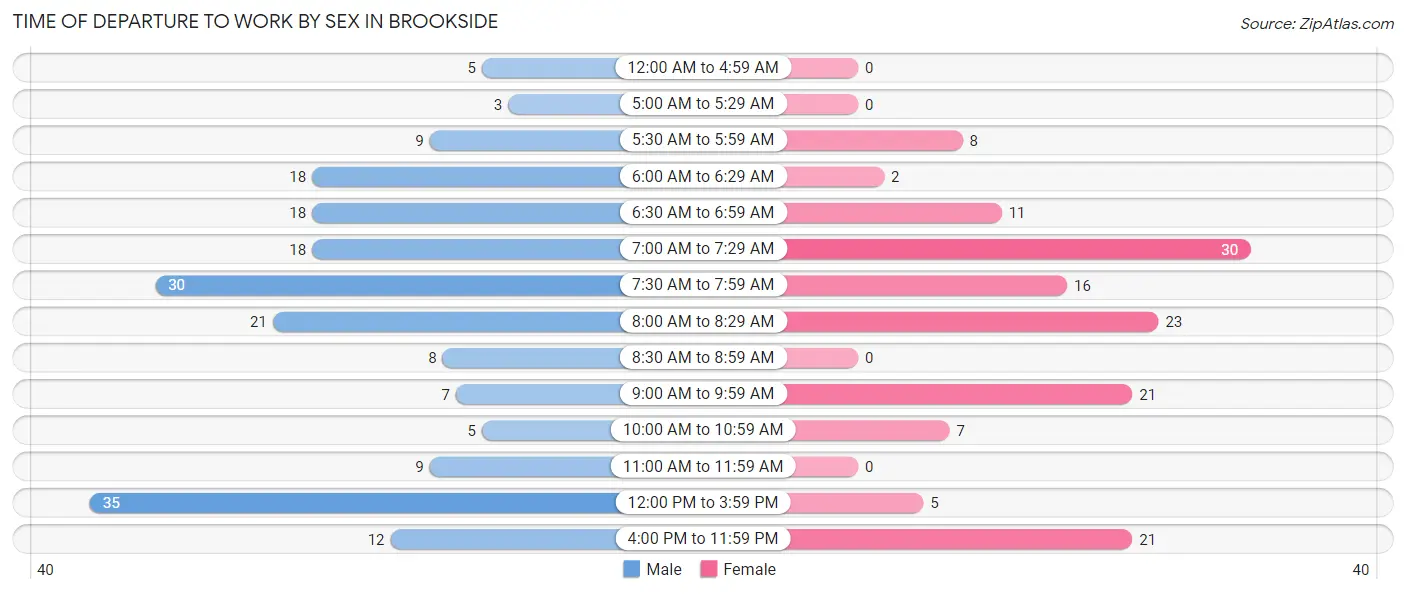
| Time of Departure | Male | Female |
| 12:00 AM to 4:59 AM | 5 (2.5%) | 0 (0.0%) |
| 5:00 AM to 5:29 AM | 3 (1.5%) | 0 (0.0%) |
| 5:30 AM to 5:59 AM | 9 (4.5%) | 8 (5.6%) |
| 6:00 AM to 6:29 AM | 18 (9.1%) | 2 (1.4%) |
| 6:30 AM to 6:59 AM | 18 (9.1%) | 11 (7.6%) |
| 7:00 AM to 7:29 AM | 18 (9.1%) | 30 (20.8%) |
| 7:30 AM to 7:59 AM | 30 (15.1%) | 16 (11.1%) |
| 8:00 AM to 8:29 AM | 21 (10.6%) | 23 (16.0%) |
| 8:30 AM to 8:59 AM | 8 (4.0%) | 0 (0.0%) |
| 9:00 AM to 9:59 AM | 7 (3.5%) | 21 (14.6%) |
| 10:00 AM to 10:59 AM | 5 (2.5%) | 7 (4.9%) |
| 11:00 AM to 11:59 AM | 9 (4.5%) | 0 (0.0%) |
| 12:00 PM to 3:59 PM | 35 (17.7%) | 5 (3.5%) |
| 4:00 PM to 11:59 PM | 12 (6.1%) | 21 (14.6%) |
| Total | 198 (100.0%) | 144 (100.0%) |
Housing Occupancy in Brookside
Occupancy by Ownership in Brookside
Of the total 277 dwellings in Brookside, owner-occupied units account for 229 (82.7%), while renter-occupied units make up 48 (17.3%).
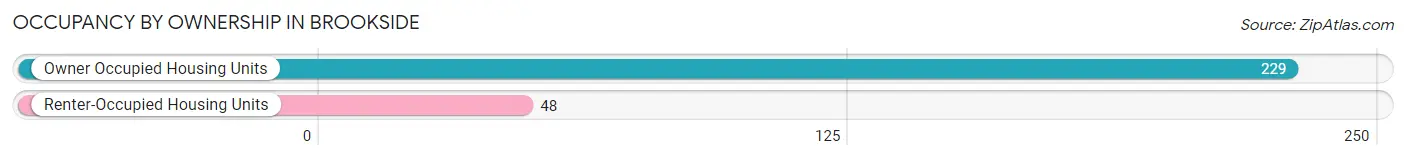
| Occupancy | # Housing Units | % Housing Units |
| Owner Occupied Housing Units | 229 | 82.7% |
| Renter-Occupied Housing Units | 48 | 17.3% |
| Total Occupied Housing Units | 277 | 100.0% |
Occupancy by Household Size in Brookside
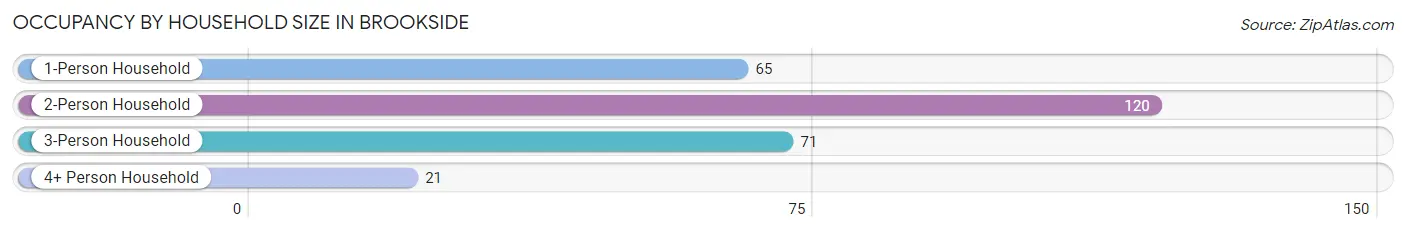
| Household Size | # Housing Units | % Housing Units |
| 1-Person Household | 65 | 23.5% |
| 2-Person Household | 120 | 43.3% |
| 3-Person Household | 71 | 25.6% |
| 4+ Person Household | 21 | 7.6% |
| Total Housing Units | 277 | 100.0% |
Occupancy by Ownership by Household Size in Brookside
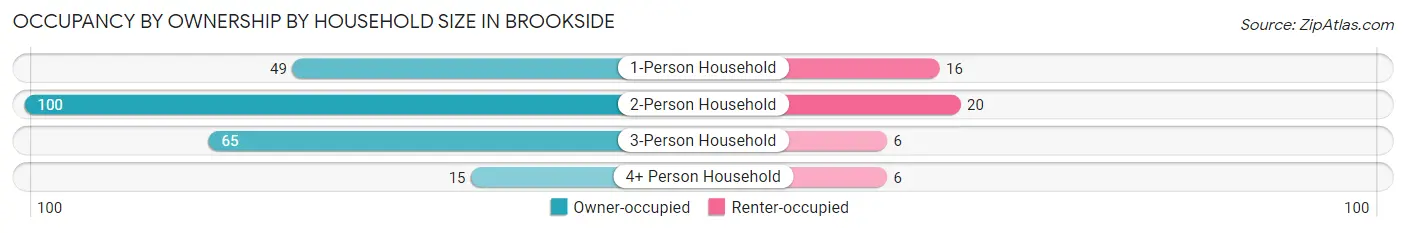
| Household Size | Owner-occupied | Renter-occupied |
| 1-Person Household | 49 (75.4%) | 16 (24.6%) |
| 2-Person Household | 100 (83.3%) | 20 (16.7%) |
| 3-Person Household | 65 (91.5%) | 6 (8.5%) |
| 4+ Person Household | 15 (71.4%) | 6 (28.6%) |
| Total Housing Units | 229 (82.7%) | 48 (17.3%) |
Occupancy by Educational Attainment in Brookside
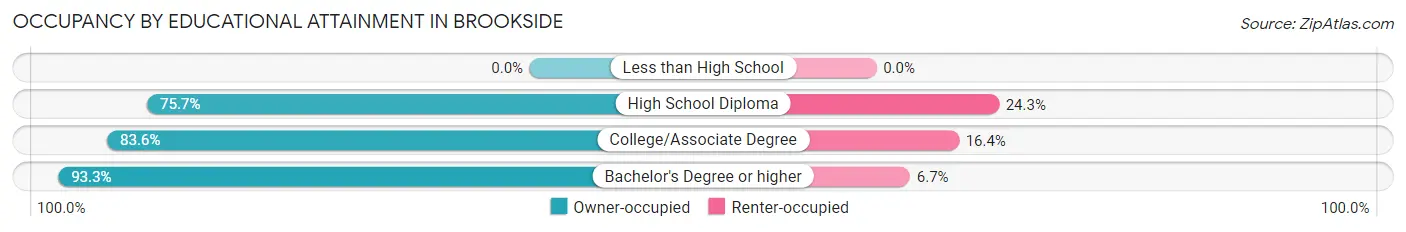
| Household Size | Owner-occupied | Renter-occupied |
| Less than High School | 0 (0.0%) | 0 (0.0%) |
| High School Diploma | 81 (75.7%) | 26 (24.3%) |
| College/Associate Degree | 92 (83.6%) | 18 (16.4%) |
| Bachelor's Degree or higher | 56 (93.3%) | 4 (6.7%) |
Occupancy by Age of Householder in Brookside
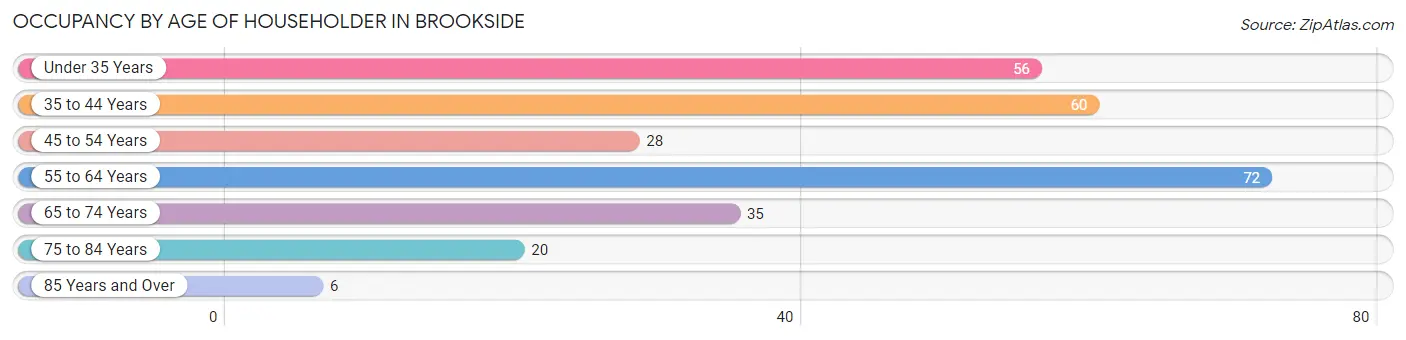
| Age Bracket | # Households | % Households |
| Under 35 Years | 56 | 20.2% |
| 35 to 44 Years | 60 | 21.7% |
| 45 to 54 Years | 28 | 10.1% |
| 55 to 64 Years | 72 | 26.0% |
| 65 to 74 Years | 35 | 12.6% |
| 75 to 84 Years | 20 | 7.2% |
| 85 Years and Over | 6 | 2.2% |
| Total | 277 | 100.0% |
Housing Finances in Brookside
Median Income by Occupancy in Brookside
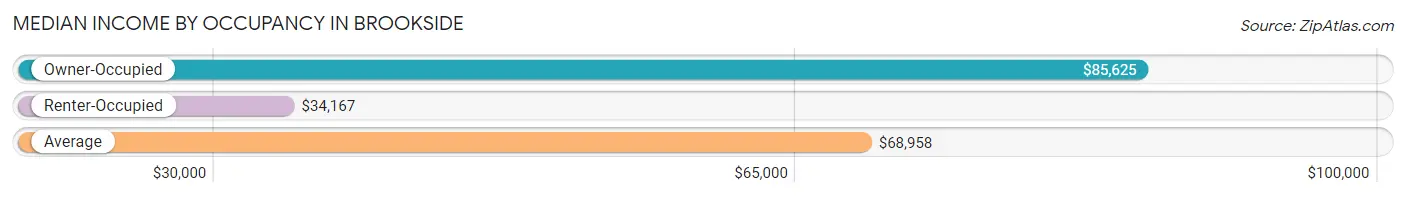
| Occupancy Type | # Households | Median Income |
| Owner-Occupied | 229 (82.7%) | $85,625 |
| Renter-Occupied | 48 (17.3%) | $34,167 |
| Average | 277 (100.0%) | $68,958 |
Occupancy by Householder Income Bracket in Brookside
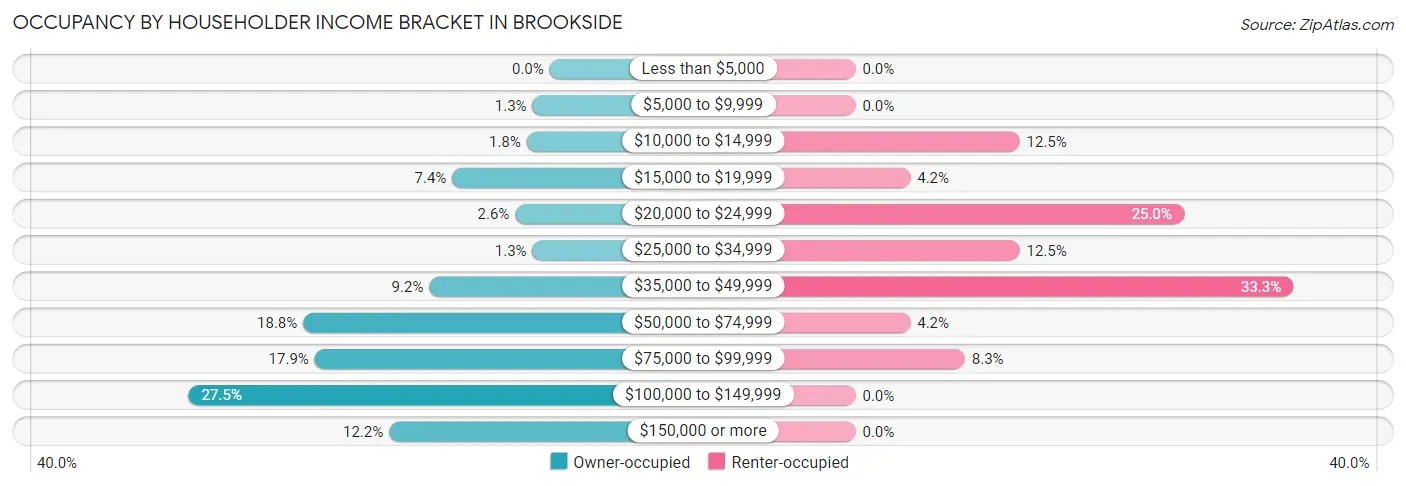
| Income Bracket | Owner-occupied | Renter-occupied |
| Less than $5,000 | 0 (0.0%) | 0 (0.0%) |
| $5,000 to $9,999 | 3 (1.3%) | 0 (0.0%) |
| $10,000 to $14,999 | 4 (1.8%) | 6 (12.5%) |
| $15,000 to $19,999 | 17 (7.4%) | 2 (4.2%) |
| $20,000 to $24,999 | 6 (2.6%) | 12 (25.0%) |
| $25,000 to $34,999 | 3 (1.3%) | 6 (12.5%) |
| $35,000 to $49,999 | 21 (9.2%) | 16 (33.3%) |
| $50,000 to $74,999 | 43 (18.8%) | 2 (4.2%) |
| $75,000 to $99,999 | 41 (17.9%) | 4 (8.3%) |
| $100,000 to $149,999 | 63 (27.5%) | 0 (0.0%) |
| $150,000 or more | 28 (12.2%) | 0 (0.0%) |
| Total | 229 (100.0%) | 48 (100.0%) |
Monthly Housing Cost Tiers in Brookside
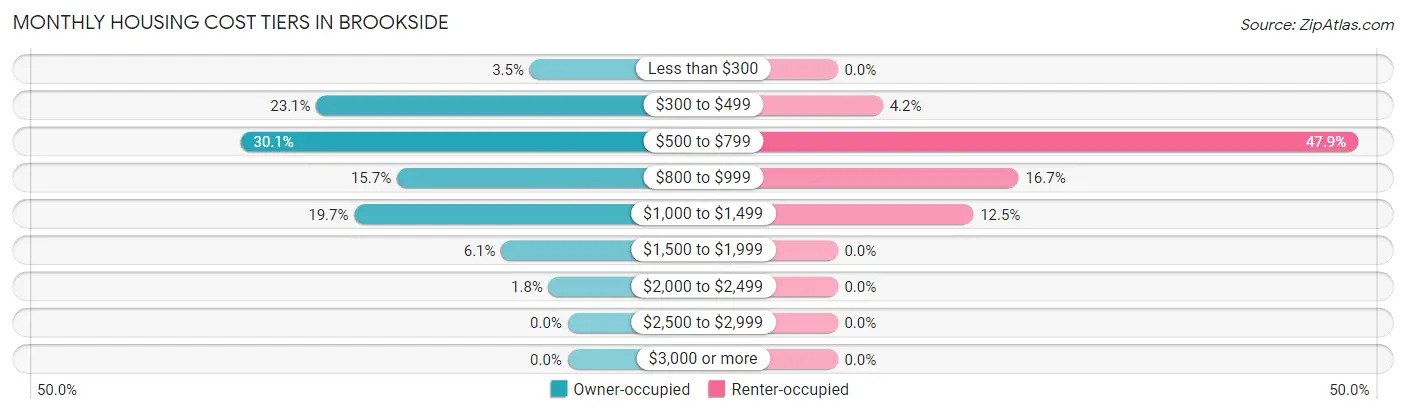
| Monthly Cost | Owner-occupied | Renter-occupied |
| Less than $300 | 8 (3.5%) | 0 (0.0%) |
| $300 to $499 | 53 (23.1%) | 2 (4.2%) |
| $500 to $799 | 69 (30.1%) | 23 (47.9%) |
| $800 to $999 | 36 (15.7%) | 8 (16.7%) |
| $1,000 to $1,499 | 45 (19.7%) | 6 (12.5%) |
| $1,500 to $1,999 | 14 (6.1%) | 0 (0.0%) |
| $2,000 to $2,499 | 4 (1.8%) | 0 (0.0%) |
| $2,500 to $2,999 | 0 (0.0%) | 0 (0.0%) |
| $3,000 or more | 0 (0.0%) | 0 (0.0%) |
| Total | 229 (100.0%) | 48 (100.0%) |
Physical Housing Characteristics in Brookside
Housing Structures in Brookside
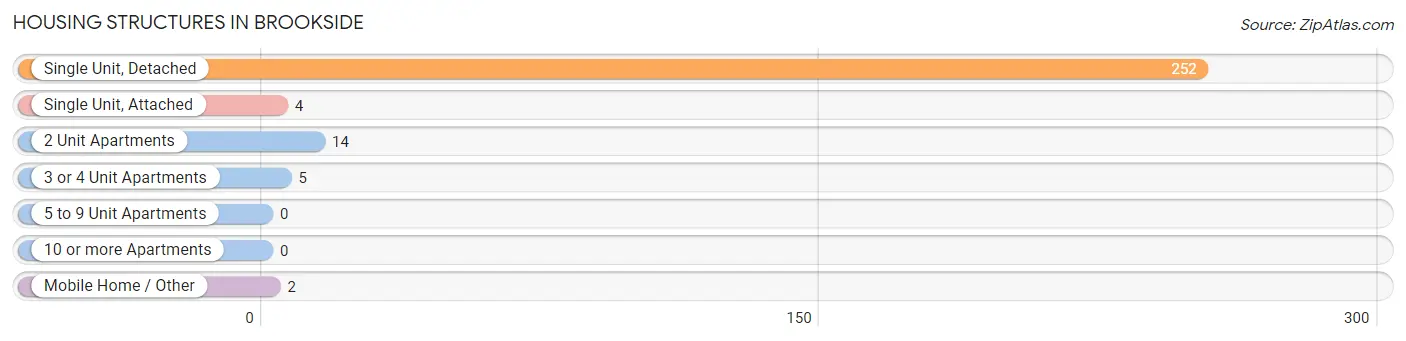
| Structure Type | # Housing Units | % Housing Units |
| Single Unit, Detached | 252 | 91.0% |
| Single Unit, Attached | 4 | 1.4% |
| 2 Unit Apartments | 14 | 5.1% |
| 3 or 4 Unit Apartments | 5 | 1.8% |
| 5 to 9 Unit Apartments | 0 | 0.0% |
| 10 or more Apartments | 0 | 0.0% |
| Mobile Home / Other | 2 | 0.7% |
| Total | 277 | 100.0% |
Housing Structures by Occupancy in Brookside
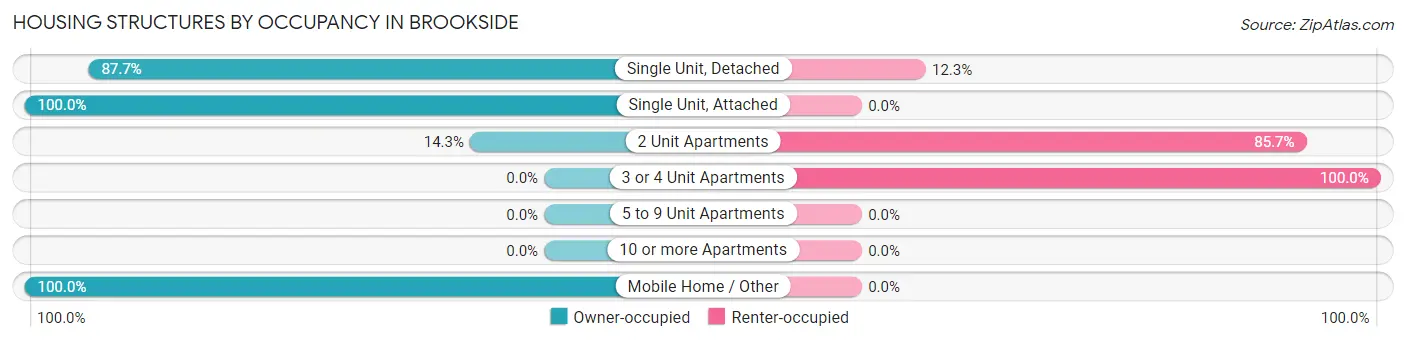
| Structure Type | Owner-occupied | Renter-occupied |
| Single Unit, Detached | 221 (87.7%) | 31 (12.3%) |
| Single Unit, Attached | 4 (100.0%) | 0 (0.0%) |
| 2 Unit Apartments | 2 (14.3%) | 12 (85.7%) |
| 3 or 4 Unit Apartments | 0 (0.0%) | 5 (100.0%) |
| 5 to 9 Unit Apartments | 0 (0.0%) | 0 (0.0%) |
| 10 or more Apartments | 0 (0.0%) | 0 (0.0%) |
| Mobile Home / Other | 2 (100.0%) | 0 (0.0%) |
| Total | 229 (82.7%) | 48 (17.3%) |
Housing Structures by Number of Rooms in Brookside
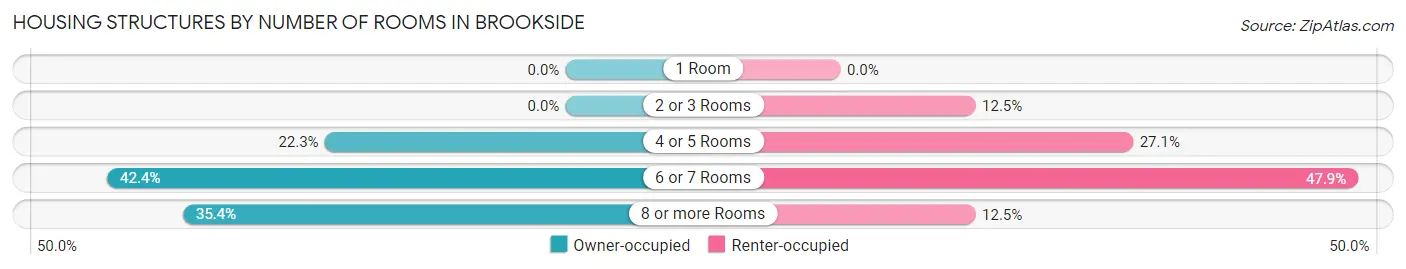
| Number of Rooms | Owner-occupied | Renter-occupied |
| 1 Room | 0 (0.0%) | 0 (0.0%) |
| 2 or 3 Rooms | 0 (0.0%) | 6 (12.5%) |
| 4 or 5 Rooms | 51 (22.3%) | 13 (27.1%) |
| 6 or 7 Rooms | 97 (42.4%) | 23 (47.9%) |
| 8 or more Rooms | 81 (35.4%) | 6 (12.5%) |
| Total | 229 (100.0%) | 48 (100.0%) |
Housing Structure by Heating Type in Brookside
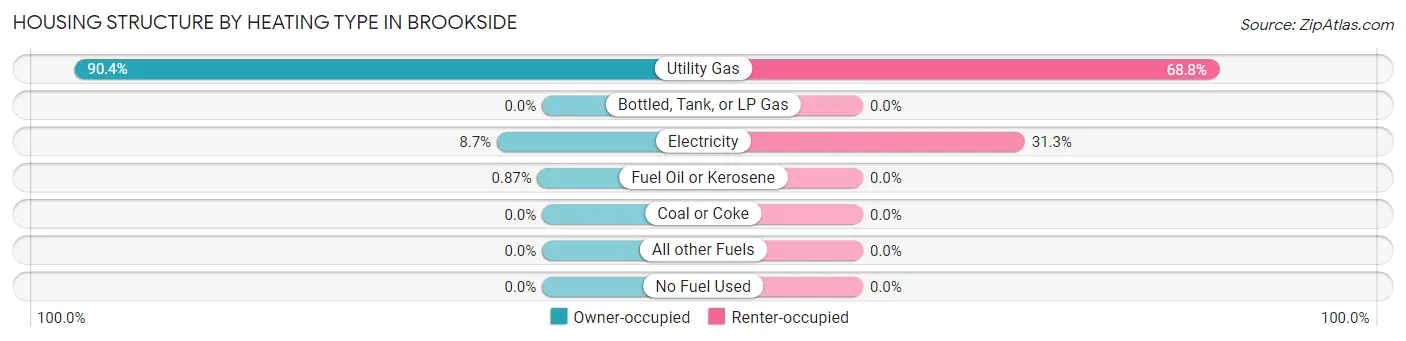
| Heating Type | Owner-occupied | Renter-occupied |
| Utility Gas | 207 (90.4%) | 33 (68.8%) |
| Bottled, Tank, or LP Gas | 0 (0.0%) | 0 (0.0%) |
| Electricity | 20 (8.7%) | 15 (31.2%) |
| Fuel Oil or Kerosene | 2 (0.9%) | 0 (0.0%) |
| Coal or Coke | 0 (0.0%) | 0 (0.0%) |
| All other Fuels | 0 (0.0%) | 0 (0.0%) |
| No Fuel Used | 0 (0.0%) | 0 (0.0%) |
| Total | 229 (100.0%) | 48 (100.0%) |
Household Vehicle Usage in Brookside
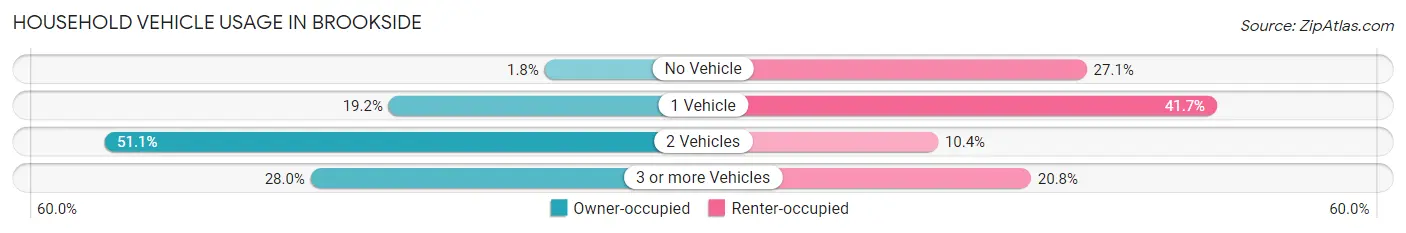
| Vehicles per Household | Owner-occupied | Renter-occupied |
| No Vehicle | 4 (1.8%) | 13 (27.1%) |
| 1 Vehicle | 44 (19.2%) | 20 (41.7%) |
| 2 Vehicles | 117 (51.1%) | 5 (10.4%) |
| 3 or more Vehicles | 64 (28.0%) | 10 (20.8%) |
| Total | 229 (100.0%) | 48 (100.0%) |
Real Estate & Mortgages in Brookside
Real Estate and Mortgage Overview in Brookside
| Characteristic | Without Mortgage | With Mortgage |
| Housing Units | 87 | 142 |
| Median Property Value | $122,900 | $94,200 |
| Median Household Income | $66,042 | $22 |
| Monthly Housing Costs | $409 | $0 |
| Real Estate Taxes | $1,390 | $3 |
Property Value by Mortgage Status in Brookside
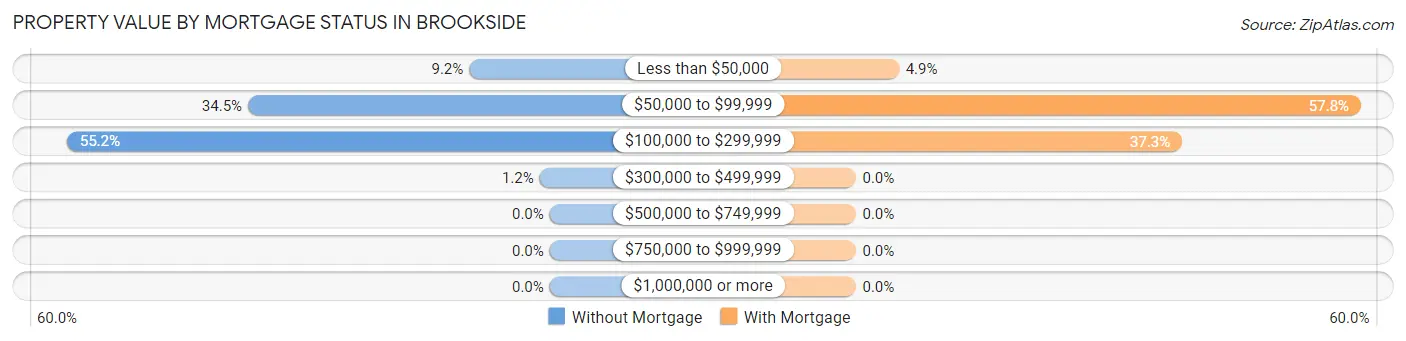
| Property Value | Without Mortgage | With Mortgage |
| Less than $50,000 | 8 (9.2%) | 7 (4.9%) |
| $50,000 to $99,999 | 30 (34.5%) | 82 (57.8%) |
| $100,000 to $299,999 | 48 (55.2%) | 53 (37.3%) |
| $300,000 to $499,999 | 1 (1.1%) | 0 (0.0%) |
| $500,000 to $749,999 | 0 (0.0%) | 0 (0.0%) |
| $750,000 to $999,999 | 0 (0.0%) | 0 (0.0%) |
| $1,000,000 or more | 0 (0.0%) | 0 (0.0%) |
| Total | 87 (100.0%) | 142 (100.0%) |
Household Income by Mortgage Status in Brookside
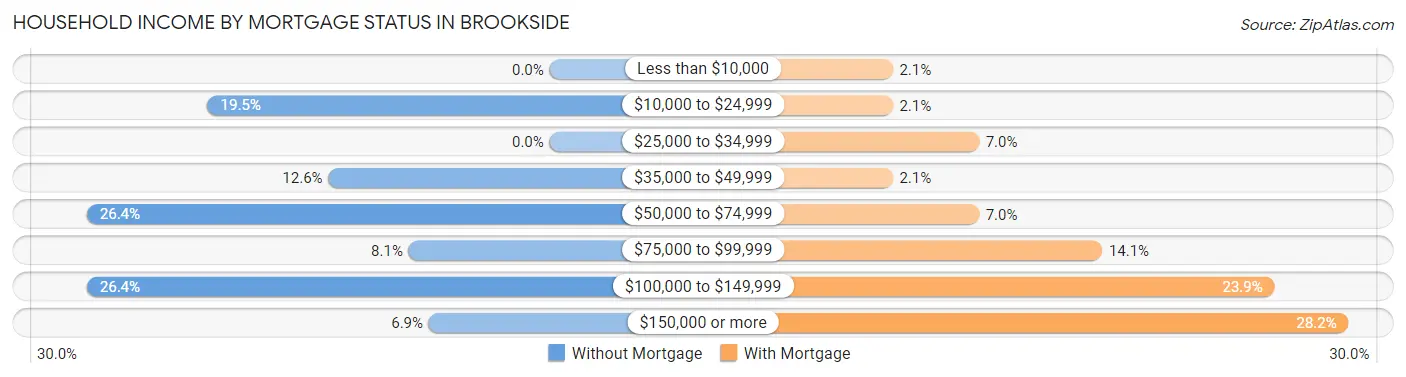
| Household Income | Without Mortgage | With Mortgage |
| Less than $10,000 | 0 (0.0%) | 3 (2.1%) |
| $10,000 to $24,999 | 17 (19.5%) | 3 (2.1%) |
| $25,000 to $34,999 | 0 (0.0%) | 10 (7.0%) |
| $35,000 to $49,999 | 11 (12.6%) | 3 (2.1%) |
| $50,000 to $74,999 | 23 (26.4%) | 10 (7.0%) |
| $75,000 to $99,999 | 7 (8.1%) | 20 (14.1%) |
| $100,000 to $149,999 | 23 (26.4%) | 34 (23.9%) |
| $150,000 or more | 6 (6.9%) | 40 (28.2%) |
| Total | 87 (100.0%) | 142 (100.0%) |
Property Value to Household Income Ratio in Brookside
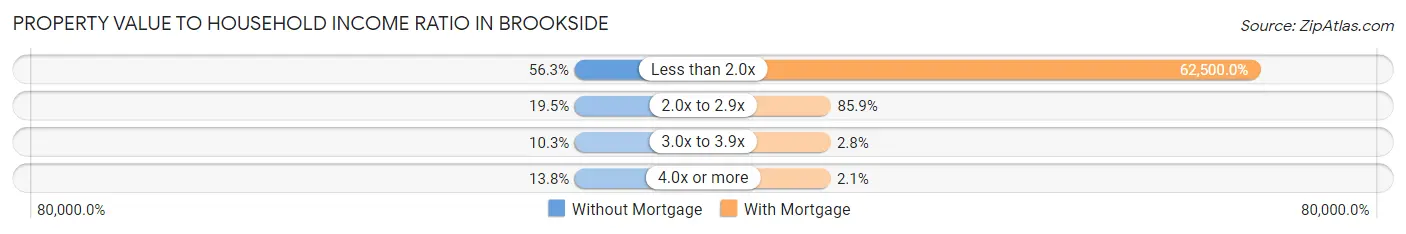
| Value-to-Income Ratio | Without Mortgage | With Mortgage |
| Less than 2.0x | 49 (56.3%) | 88,750 (62,500.0%) |
| 2.0x to 2.9x | 17 (19.5%) | 122 (85.9%) |
| 3.0x to 3.9x | 9 (10.3%) | 4 (2.8%) |
| 4.0x or more | 12 (13.8%) | 3 (2.1%) |
| Total | 87 (100.0%) | 142 (100.0%) |
Real Estate Taxes by Mortgage Status in Brookside
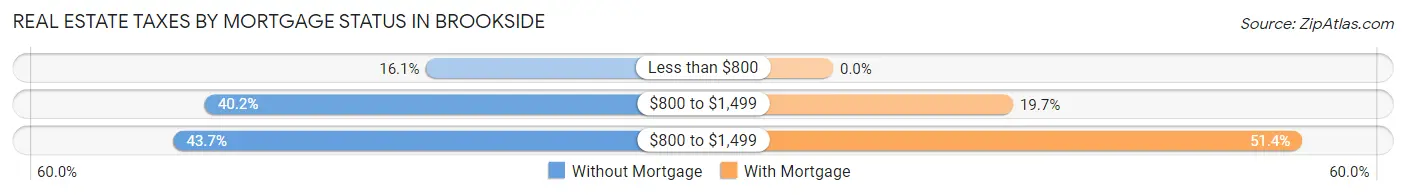
| Property Taxes | Without Mortgage | With Mortgage |
| Less than $800 | 14 (16.1%) | 0 (0.0%) |
| $800 to $1,499 | 35 (40.2%) | 28 (19.7%) |
| $800 to $1,499 | 38 (43.7%) | 73 (51.4%) |
| Total | 87 (100.0%) | 142 (100.0%) |
Health & Disability in Brookside
Health Insurance Coverage by Age in Brookside
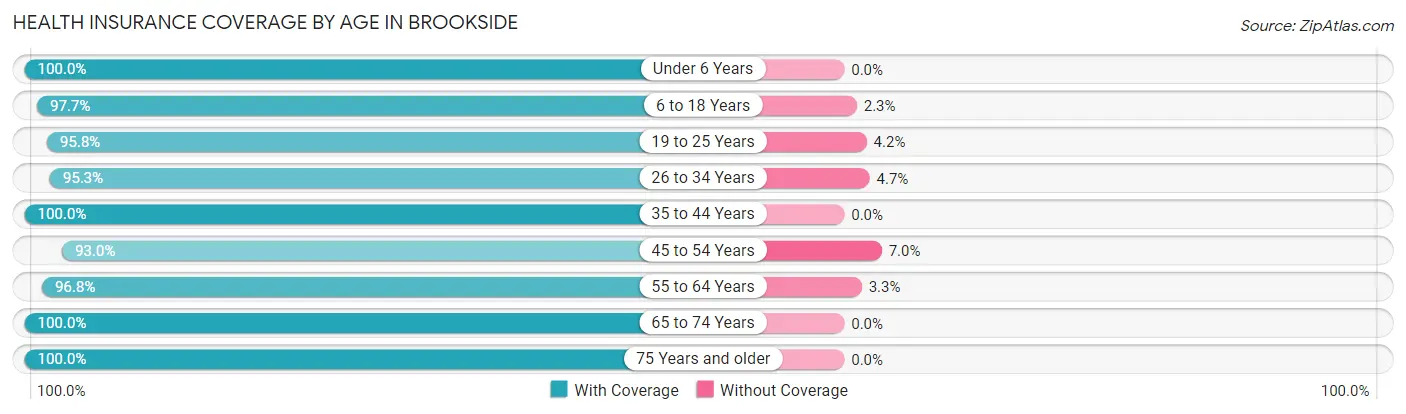
| Age Bracket | With Coverage | Without Coverage |
| Under 6 Years | 47 (100.0%) | 0 (0.0%) |
| 6 to 18 Years | 84 (97.7%) | 2 (2.3%) |
| 19 to 25 Years | 46 (95.8%) | 2 (4.2%) |
| 26 to 34 Years | 101 (95.3%) | 5 (4.7%) |
| 35 to 44 Years | 109 (100.0%) | 0 (0.0%) |
| 45 to 54 Years | 40 (93.0%) | 3 (7.0%) |
| 55 to 64 Years | 119 (96.8%) | 4 (3.3%) |
| 65 to 74 Years | 68 (100.0%) | 0 (0.0%) |
| 75 Years and older | 35 (100.0%) | 0 (0.0%) |
| Total | 649 (97.6%) | 16 (2.4%) |
Health Insurance Coverage by Citizenship Status in Brookside
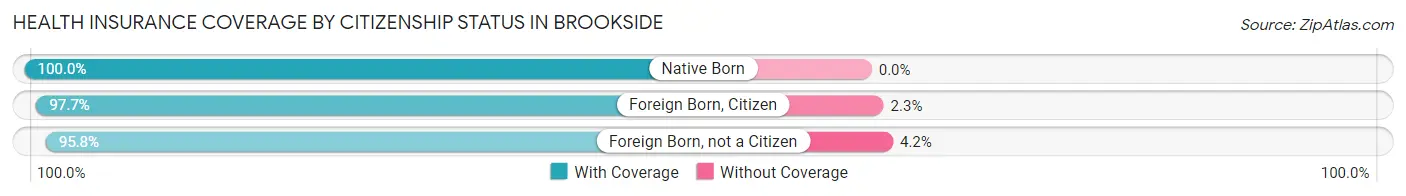
| Citizenship Status | With Coverage | Without Coverage |
| Native Born | 47 (100.0%) | 0 (0.0%) |
| Foreign Born, Citizen | 84 (97.7%) | 2 (2.3%) |
| Foreign Born, not a Citizen | 46 (95.8%) | 2 (4.2%) |
Health Insurance Coverage by Household Income in Brookside
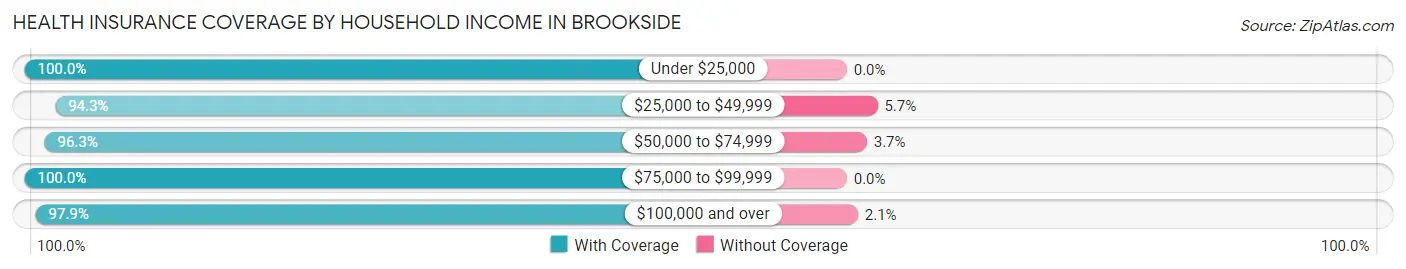
| Household Income | With Coverage | Without Coverage |
| Under $25,000 | 92 (100.0%) | 0 (0.0%) |
| $25,000 to $49,999 | 115 (94.3%) | 7 (5.7%) |
| $50,000 to $74,999 | 103 (96.3%) | 4 (3.7%) |
| $75,000 to $99,999 | 103 (100.0%) | 0 (0.0%) |
| $100,000 and over | 236 (97.9%) | 5 (2.1%) |
Public vs Private Health Insurance Coverage by Age in Brookside
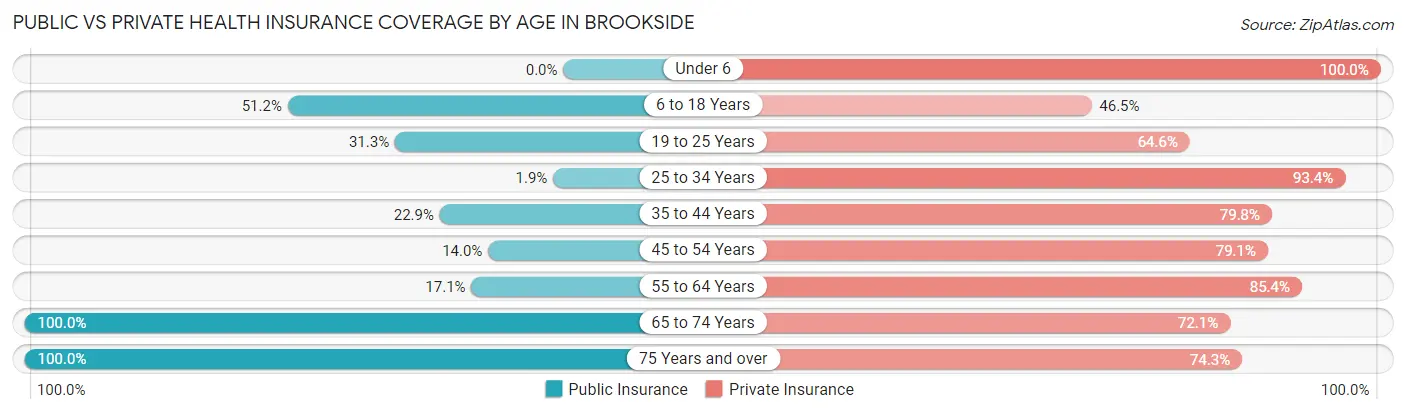
| Age Bracket | Public Insurance | Private Insurance |
| Under 6 | 0 (0.0%) | 47 (100.0%) |
| 6 to 18 Years | 44 (51.2%) | 40 (46.5%) |
| 19 to 25 Years | 15 (31.2%) | 31 (64.6%) |
| 25 to 34 Years | 2 (1.9%) | 99 (93.4%) |
| 35 to 44 Years | 25 (22.9%) | 87 (79.8%) |
| 45 to 54 Years | 6 (14.0%) | 34 (79.1%) |
| 55 to 64 Years | 21 (17.1%) | 105 (85.4%) |
| 65 to 74 Years | 68 (100.0%) | 49 (72.1%) |
| 75 Years and over | 35 (100.0%) | 26 (74.3%) |
| Total | 216 (32.5%) | 518 (77.9%) |
Disability Status by Sex by Age in Brookside
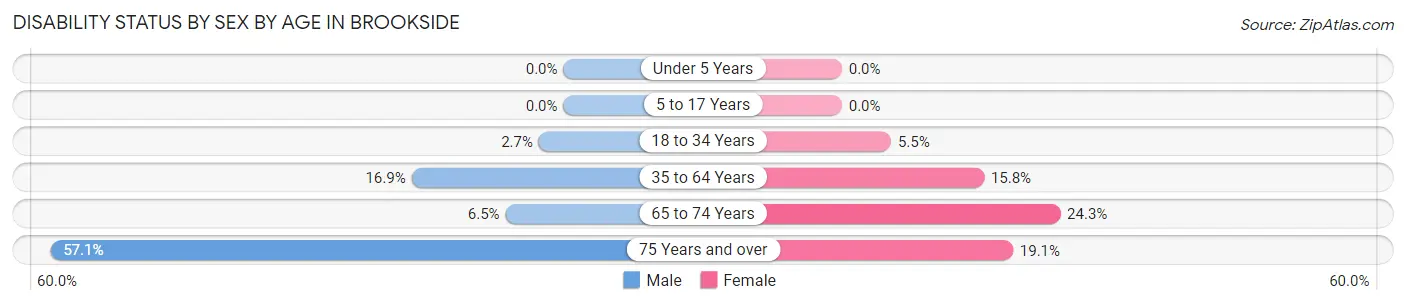
| Age Bracket | Male | Female |
| Under 5 Years | 0 (0.0%) | 0 (0.0%) |
| 5 to 17 Years | 0 (0.0%) | 0 (0.0%) |
| 18 to 34 Years | 3 (2.7%) | 4 (5.5%) |
| 35 to 64 Years | 23 (16.9%) | 22 (15.8%) |
| 65 to 74 Years | 2 (6.5%) | 9 (24.3%) |
| 75 Years and over | 8 (57.1%) | 4 (19.1%) |
Disability Class by Sex by Age in Brookside
Disability Class: Hearing Difficulty
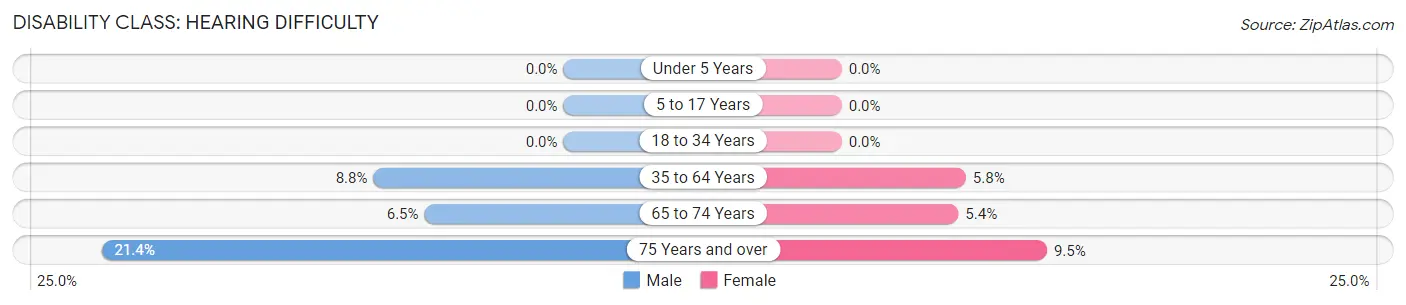
| Age Bracket | Male | Female |
| Under 5 Years | 0 (0.0%) | 0 (0.0%) |
| 5 to 17 Years | 0 (0.0%) | 0 (0.0%) |
| 18 to 34 Years | 0 (0.0%) | 0 (0.0%) |
| 35 to 64 Years | 12 (8.8%) | 8 (5.8%) |
| 65 to 74 Years | 2 (6.5%) | 2 (5.4%) |
| 75 Years and over | 3 (21.4%) | 2 (9.5%) |
Disability Class: Vision Difficulty
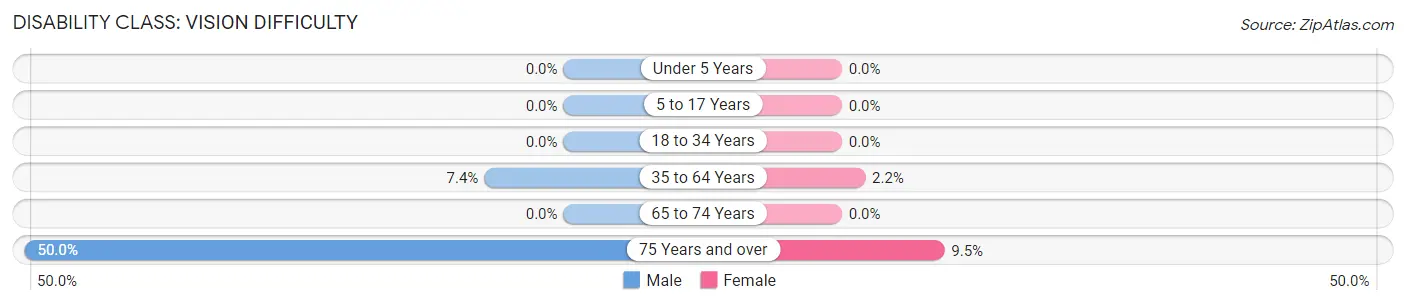
| Age Bracket | Male | Female |
| Under 5 Years | 0 (0.0%) | 0 (0.0%) |
| 5 to 17 Years | 0 (0.0%) | 0 (0.0%) |
| 18 to 34 Years | 0 (0.0%) | 0 (0.0%) |
| 35 to 64 Years | 10 (7.3%) | 3 (2.2%) |
| 65 to 74 Years | 0 (0.0%) | 0 (0.0%) |
| 75 Years and over | 7 (50.0%) | 2 (9.5%) |
Disability Class: Cognitive Difficulty
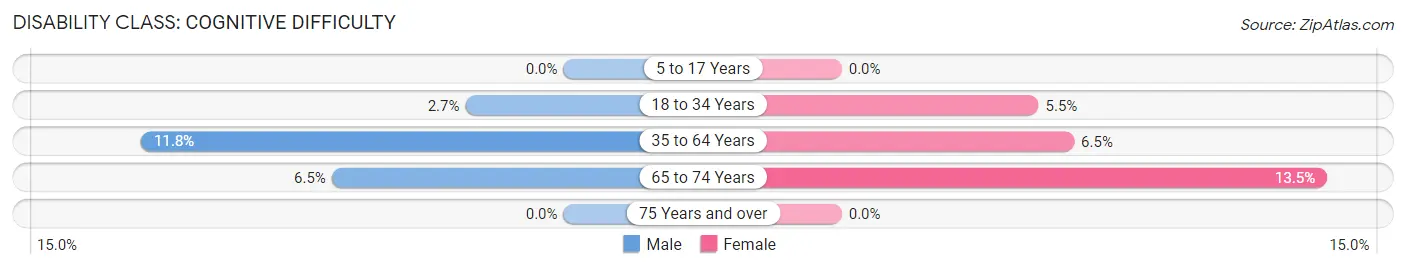
| Age Bracket | Male | Female |
| 5 to 17 Years | 0 (0.0%) | 0 (0.0%) |
| 18 to 34 Years | 3 (2.7%) | 4 (5.5%) |
| 35 to 64 Years | 16 (11.8%) | 9 (6.5%) |
| 65 to 74 Years | 2 (6.5%) | 5 (13.5%) |
| 75 Years and over | 0 (0.0%) | 0 (0.0%) |
Disability Class: Ambulatory Difficulty
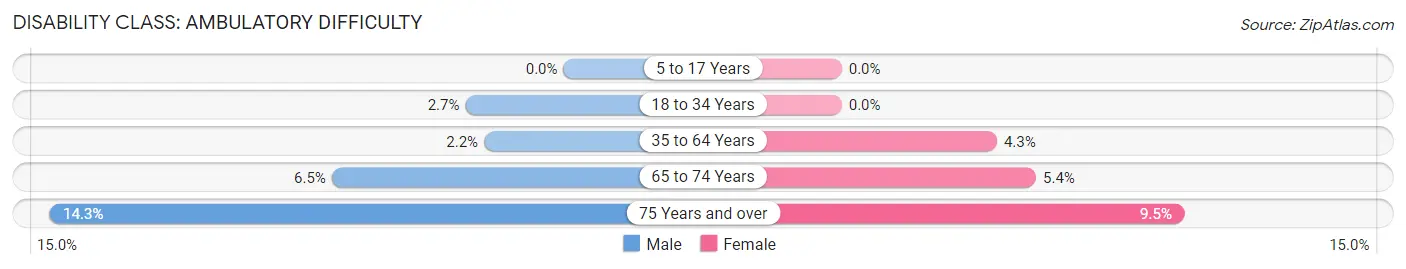
| Age Bracket | Male | Female |
| 5 to 17 Years | 0 (0.0%) | 0 (0.0%) |
| 18 to 34 Years | 3 (2.7%) | 0 (0.0%) |
| 35 to 64 Years | 3 (2.2%) | 6 (4.3%) |
| 65 to 74 Years | 2 (6.5%) | 2 (5.4%) |
| 75 Years and over | 2 (14.3%) | 2 (9.5%) |
Disability Class: Self-Care Difficulty
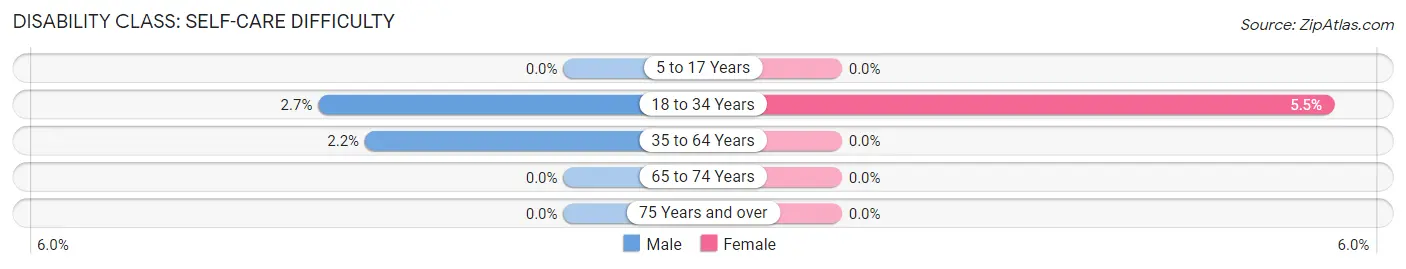
| Age Bracket | Male | Female |
| 5 to 17 Years | 0 (0.0%) | 0 (0.0%) |
| 18 to 34 Years | 3 (2.7%) | 4 (5.5%) |
| 35 to 64 Years | 3 (2.2%) | 0 (0.0%) |
| 65 to 74 Years | 0 (0.0%) | 0 (0.0%) |
| 75 Years and over | 0 (0.0%) | 0 (0.0%) |
Technology Access in Brookside
Computing Device Access in Brookside
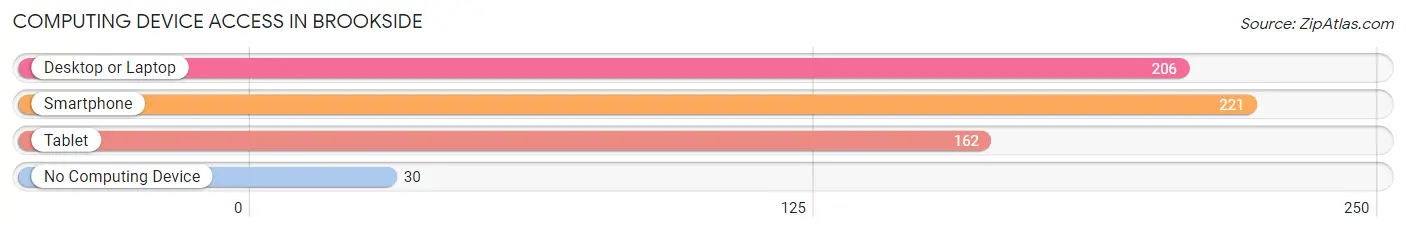
| Device Type | # Households | % Households |
| Desktop or Laptop | 206 | 74.4% |
| Smartphone | 221 | 79.8% |
| Tablet | 162 | 58.5% |
| No Computing Device | 30 | 10.8% |
| Total | 277 | 100.0% |
Internet Access in Brookside
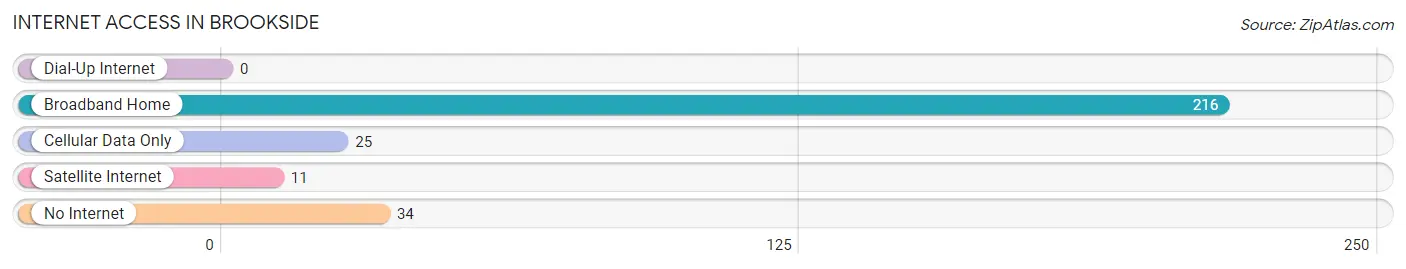
| Internet Type | # Households | % Households |
| Dial-Up Internet | 0 | 0.0% |
| Broadband Home | 216 | 78.0% |
| Cellular Data Only | 25 | 9.0% |
| Satellite Internet | 11 | 4.0% |
| No Internet | 34 | 12.3% |
| Total | 277 | 100.0% |
Brookside Summary
Brookside, Ohio is a small village located in the northeastern part of the state, in Trumbull County. It is situated on the banks of the Mahoning River, and is part of the Youngstown-Warren-Boardman metropolitan area. The village has a population of approximately 1,400 people, and is home to a variety of businesses, including a grocery store, a gas station, a post office, and a few restaurants.
History
The area that is now Brookside was first settled in the early 1800s by a group of settlers from Connecticut. The village was originally known as “Brookside Station”, and was a stop on the Cleveland and Pittsburgh Railroad. The village was officially incorporated in 1891, and the name was changed to Brookside.
Geography
Brookside is located in the northeastern part of Ohio, in Trumbull County. It is situated on the banks of the Mahoning River, and is part of the Youngstown-Warren-Boardman metropolitan area. The village has a total area of 0.7 square miles, all of which is land. The village is located approximately 25 miles northwest of Youngstown, and about 50 miles southeast of Cleveland.
Economy
The economy of Brookside is largely based on small businesses. The village is home to a grocery store, a gas station, a post office, and a few restaurants. There are also a few small manufacturing companies located in the village. The village also has a few small parks and recreational areas, which attract visitors from the surrounding area.
Demographics
As of the 2010 census, the population of Brookside was 1,400. The racial makeup of the village was 97.3% White, 0.9% African American, 0.3% Native American, 0.3% Asian, and 0.9% from two or more races. The median household income was $37,500, and the median family income was $45,000. The per capita income was $18,000.
Conclusion
Brookside, Ohio is a small village located in the northeastern part of the state, in Trumbull County. It is situated on the banks of the Mahoning River, and is part of the Youngstown-Warren-Boardman metropolitan area. The village has a population of approximately 1,400 people, and is home to a variety of businesses, including a grocery store, a gas station, a post office, and a few restaurants. The economy of Brookside is largely based on small businesses, and the village has a few small parks and recreational areas. The population of Brookside is predominantly White, with a median household income of $37,500 and a median family income of $45,000.
Common Questions
What is the Total Population of Brookside?
Total Population of Brookside is 665.
What is the Total Male Population of Brookside?
Total Male Population of Brookside is 366.
What is the Total Female Population of Brookside?
Total Female Population of Brookside is 299.
What is the Ratio of Males per 100 Females in Brookside?
There are 122.41 Males per 100 Females in Brookside.
What is the Ratio of Females per 100 Males in Brookside?
There are 81.69 Females per 100 Males in Brookside.
What is the Median Population Age in Brookside?
Median Population Age in Brookside is 39.2 Years.
What is the Average Family Size in Brookside
Average Family Size in Brookside is 2.8 People.
What is the Average Household Size in Brookside
Average Household Size in Brookside is 2.4 People.
What is Per Capita Income in Brookside?
Per Capita income in Brookside is $37,212.
What is the Median Family Income in Brookside?
Median Family Income in Brookside is $95,536.
What is the Median Household income in Brookside?
Median Household Income in Brookside is $68,958.
What is Income or Wage Gap in Brookside?
Income or Wage Gap in Brookside is 5.9%.
Women in Brookside earn 94.1 cents for every dollar earned by a man.
What is Inequality or Gini Index in Brookside?
Inequality or Gini Index in Brookside is 0.41.
How Large is the Labor Force in Brookside?
There are 398 People in the Labor Forcein in Brookside.
What is the Percentage of People in the Labor Force in Brookside?
70.3% of People are in the Labor Force in Brookside.
What is the Unemployment Rate in Brookside?
Unemployment Rate in Brookside is 3.0%.