Pleasant Run, OH
Pleasant Run Map
Pleasant Run Overview
5,258
TOTAL POPULATION
2,296
MALE POPULATION
2,962
FEMALE POPULATION
77.52
MALES / 100 FEMALES
129.01
FEMALES / 100 MALES
37.5
MEDIAN AGE
3.0
AVG FAMILY SIZE
2.7
AVG HOUSEHOLD SIZE
$35,755
PER CAPITA INCOME
$85,063
AVG FAMILY INCOME
$73,583
AVG HOUSEHOLD INCOME
4.8%
WAGE / INCOME GAP [ % ]
95.2¢/ $1
WAGE / INCOME GAP [ $ ]
0.37
INEQUALITY / GINI INDEX
2,955
LABOR FORCE [ PEOPLE ]
70.0%
PERCENT IN LABOR FORCE
6.7%
UNEMPLOYMENT RATE
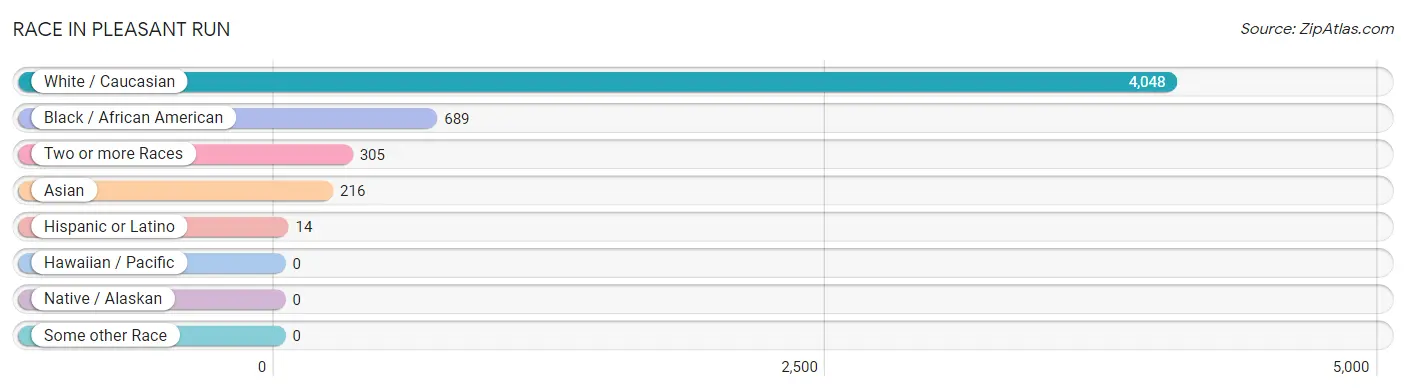
Race in Pleasant Run
The most populous races in Pleasant Run are White / Caucasian (4,048 | 77.0%), Black / African American (689 | 13.1%), and Two or more Races (305 | 5.8%).
| Race | # Population | % Population |
| Asian | 216 | 4.1% |
| Black / African American | 689 | 13.1% |
| Hawaiian / Pacific | 0 | 0.0% |
| Hispanic or Latino | 14 | 0.3% |
| Native / Alaskan | 0 | 0.0% |
| White / Caucasian | 4,048 | 77.0% |
| Two or more Races | 305 | 5.8% |
| Some other Race | 0 | 0.0% |
| Total | 5,258 | 100.0% |
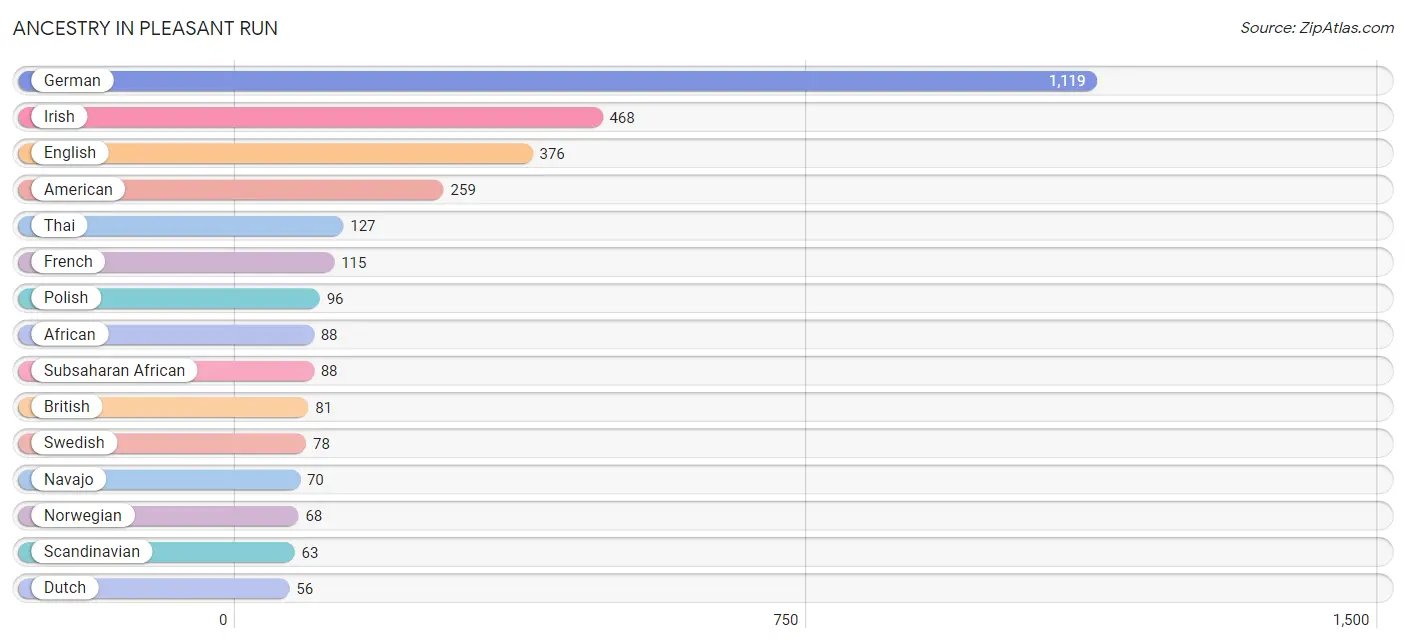
Ancestry in Pleasant Run
The most populous ancestries reported in Pleasant Run are German (1,119 | 21.3%), Irish (468 | 8.9%), English (376 | 7.1%), American (259 | 4.9%), and Thai (127 | 2.4%), together accounting for 44.7% of all Pleasant Run residents.
| Ancestry | # Population | % Population |
| African | 88 | 1.7% |
| American | 259 | 4.9% |
| Armenian | 36 | 0.7% |
| British | 81 | 1.5% |
| Croatian | 32 | 0.6% |
| Cuban | 14 | 0.3% |
| Dutch | 56 | 1.1% |
| English | 376 | 7.1% |
| European | 47 | 0.9% |
| French | 115 | 2.2% |
| German | 1,119 | 21.3% |
| Hungarian | 13 | 0.3% |
| Indian (Asian) | 1 | 0.0% |
| Irish | 468 | 8.9% |
| Italian | 40 | 0.8% |
| Korean | 8 | 0.2% |
| Navajo | 70 | 1.3% |
| Norwegian | 68 | 1.3% |
| Polish | 96 | 1.8% |
| Scandinavian | 63 | 1.2% |
| Scotch-Irish | 23 | 0.4% |
| Scottish | 20 | 0.4% |
| Slovak | 36 | 0.7% |
| Slovene | 9 | 0.2% |
| Subsaharan African | 88 | 1.7% |
| Swedish | 78 | 1.5% |
| Thai | 127 | 2.4% |
| Welsh | 21 | 0.4% | View All 28 Rows |
Immigrants in Pleasant Run
The most numerous immigrant groups reported in Pleasant Run came from Asia (109 | 2.1%), South Central Asia (100 | 1.9%), Africa (67 | 1.3%), Western Africa (34 | 0.6%), and Eastern Africa (33 | 0.6%), together accounting for 6.5% of all Pleasant Run residents.

| Immigration Origin | # Population | % Population |
| Africa | 67 | 1.3% |
| Asia | 109 | 2.1% |
| Eastern Africa | 33 | 0.6% |
| Europe | 15 | 0.3% |
| Germany | 9 | 0.2% |
| India | 26 | 0.5% |
| Italy | 6 | 0.1% |
| Kenya | 33 | 0.6% |
| Nepal | 12 | 0.2% |
| Nigeria | 10 | 0.2% |
| Philippines | 9 | 0.2% |
| Senegal | 24 | 0.5% |
| South Central Asia | 100 | 1.9% |
| South Eastern Asia | 9 | 0.2% |
| Southern Europe | 6 | 0.1% |
| Sri Lanka | 1 | 0.0% |
| Western Africa | 34 | 0.6% |
| Western Europe | 9 | 0.2% | View All 18 Rows |
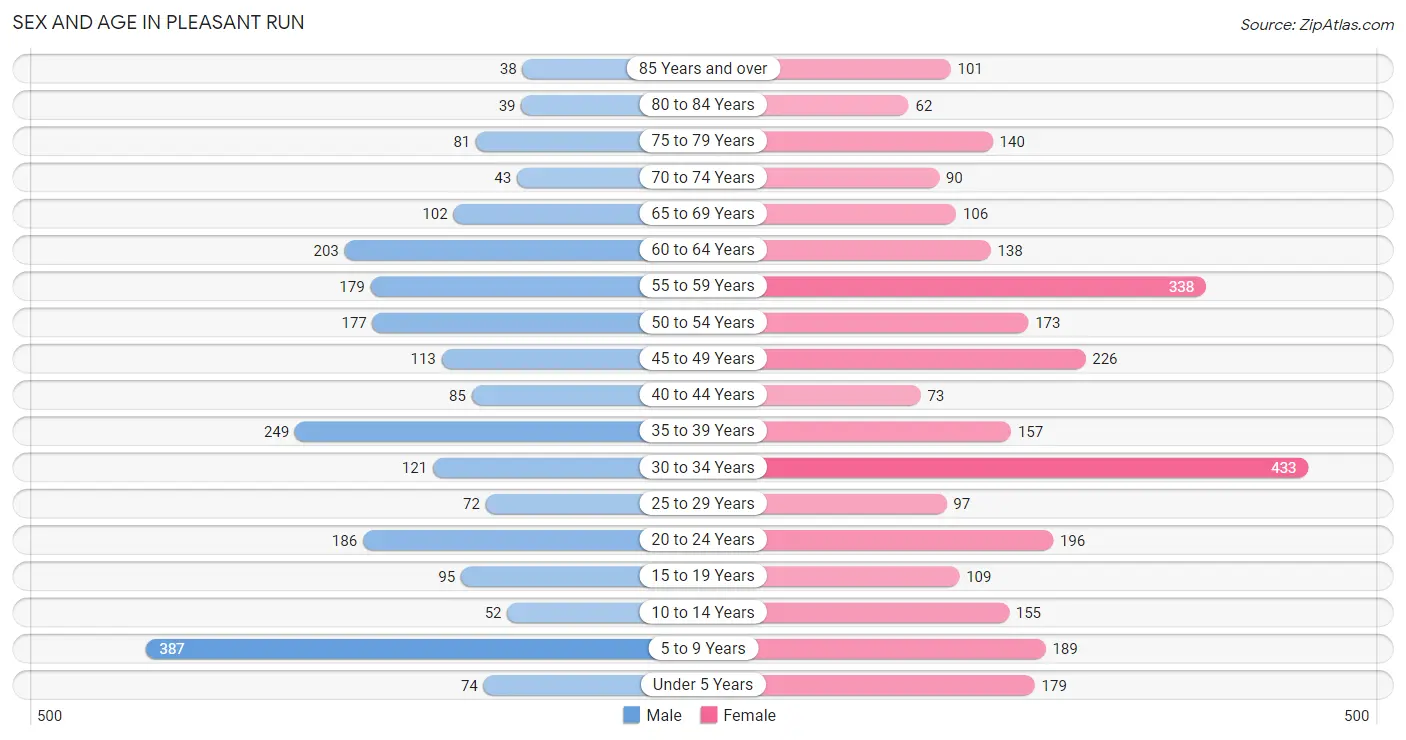
Sex and Age in Pleasant Run
Sex and Age in Pleasant Run
The most populous age groups in Pleasant Run are 5 to 9 Years (387 | 16.9%) for men and 30 to 34 Years (433 | 14.6%) for women.
| Age Bracket | Male | Female |
| Under 5 Years | 74 (3.2%) | 179 (6.0%) |
| 5 to 9 Years | 387 (16.9%) | 189 (6.4%) |
| 10 to 14 Years | 52 (2.3%) | 155 (5.2%) |
| 15 to 19 Years | 95 (4.1%) | 109 (3.7%) |
| 20 to 24 Years | 186 (8.1%) | 196 (6.6%) |
| 25 to 29 Years | 72 (3.1%) | 97 (3.3%) |
| 30 to 34 Years | 121 (5.3%) | 433 (14.6%) |
| 35 to 39 Years | 249 (10.8%) | 157 (5.3%) |
| 40 to 44 Years | 85 (3.7%) | 73 (2.5%) |
| 45 to 49 Years | 113 (4.9%) | 226 (7.6%) |
| 50 to 54 Years | 177 (7.7%) | 173 (5.8%) |
| 55 to 59 Years | 179 (7.8%) | 338 (11.4%) |
| 60 to 64 Years | 203 (8.8%) | 138 (4.7%) |
| 65 to 69 Years | 102 (4.4%) | 106 (3.6%) |
| 70 to 74 Years | 43 (1.9%) | 90 (3.0%) |
| 75 to 79 Years | 81 (3.5%) | 140 (4.7%) |
| 80 to 84 Years | 39 (1.7%) | 62 (2.1%) |
| 85 Years and over | 38 (1.7%) | 101 (3.4%) |
| Total | 2,296 (100.0%) | 2,962 (100.0%) |
Families and Households in Pleasant Run
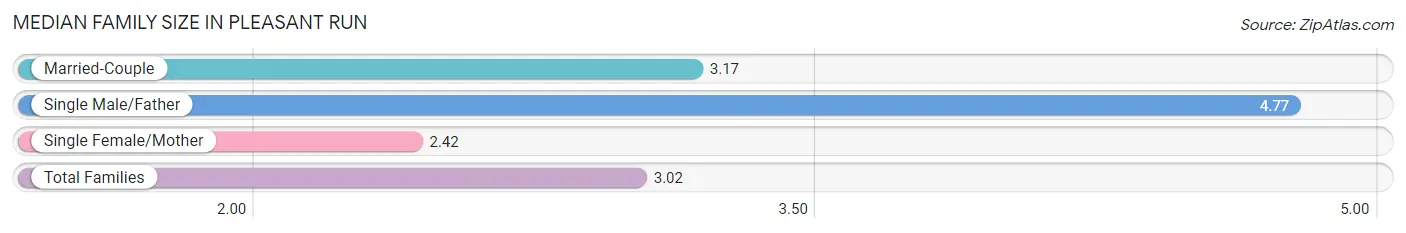
Median Family Size in Pleasant Run
The median family size in Pleasant Run is 3.02 persons per family, with single male/father families (60 | 4.3%) accounting for the largest median family size of 4.77 persons per family. On the other hand, single female/mother families (421 | 29.9%) represent the smallest median family size with 2.42 persons per family.
| Family Type | # Families | Family Size |
| Married-Couple | 928 (65.9%) | 3.17 |
| Single Male/Father | 60 (4.3%) | 4.77 |
| Single Female/Mother | 421 (29.9%) | 2.42 |
| Total Families | 1,409 (100.0%) | 3.02 |
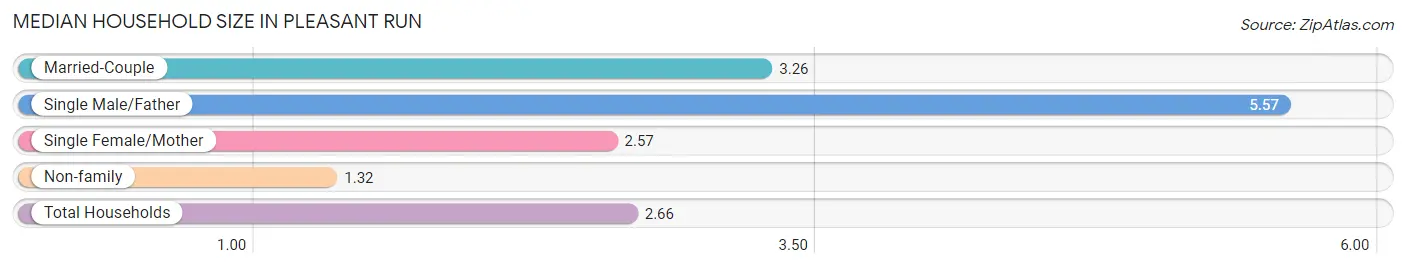
Median Household Size in Pleasant Run
The median household size in Pleasant Run is 2.66 persons per household, with single male/father households (60 | 3.1%) accounting for the largest median household size of 5.57 persons per household. non-family households (524 | 27.1%) represent the smallest median household size with 1.32 persons per household.
| Household Type | # Households | Household Size |
| Married-Couple | 928 (48.0%) | 3.26 |
| Single Male/Father | 60 (3.1%) | 5.57 |
| Single Female/Mother | 421 (21.8%) | 2.57 |
| Non-family | 524 (27.1%) | 1.32 |
| Total Households | 1,933 (100.0%) | 2.66 |
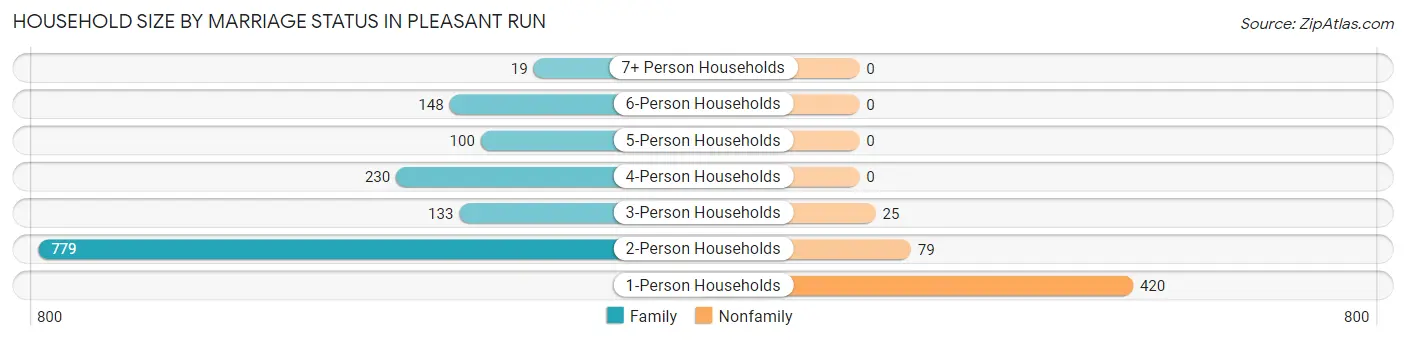
Household Size by Marriage Status in Pleasant Run
Out of a total of 1,933 households in Pleasant Run, 1,409 (72.9%) are family households, while 524 (27.1%) are nonfamily households. The most numerous type of family households are 2-person households, comprising 779, and the most common type of nonfamily households are 1-person households, comprising 420.
| Household Size | Family Households | Nonfamily Households |
| 1-Person Households | - | 420 (21.7%) |
| 2-Person Households | 779 (40.3%) | 79 (4.1%) |
| 3-Person Households | 133 (6.9%) | 25 (1.3%) |
| 4-Person Households | 230 (11.9%) | 0 (0.0%) |
| 5-Person Households | 100 (5.2%) | 0 (0.0%) |
| 6-Person Households | 148 (7.7%) | 0 (0.0%) |
| 7+ Person Households | 19 (1.0%) | 0 (0.0%) |
| Total | 1,409 (72.9%) | 524 (27.1%) |
Female Fertility in Pleasant Run
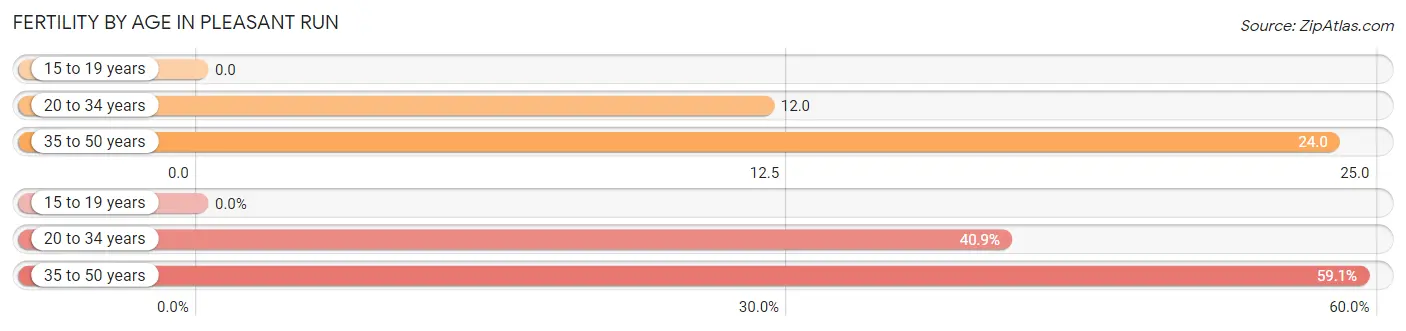
Fertility by Age in Pleasant Run
Average fertility rate in Pleasant Run is 16.0 births per 1,000 women. Women in the age bracket of 35 to 50 years have the highest fertility rate with 24.0 births per 1,000 women. Women in the age bracket of 35 to 50 years acount for 59.1% of all women with births.
| Age Bracket | Women with Births | Births / 1,000 Women |
| 15 to 19 years | 0 (0.0%) | 0.0 |
| 20 to 34 years | 9 (40.9%) | 12.0 |
| 35 to 50 years | 13 (59.1%) | 24.0 |
| Total | 22 (100.0%) | 16.0 |
Fertility by Age by Marriage Status in Pleasant Run
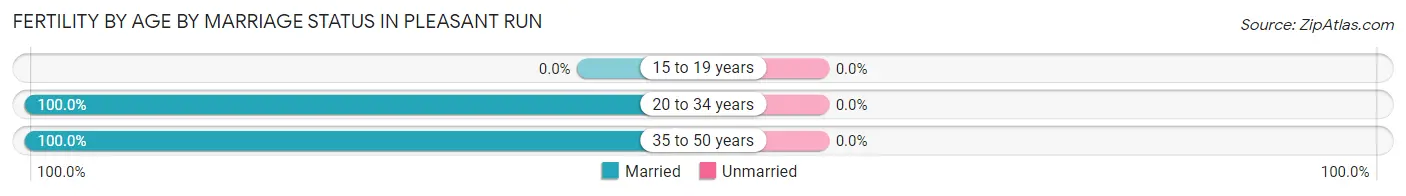
| Age Bracket | Married | Unmarried |
| 15 to 19 years | 0 (0.0%) | 0 (0.0%) |
| 20 to 34 years | 9 (100.0%) | 0 (0.0%) |
| 35 to 50 years | 13 (100.0%) | 0 (0.0%) |
| Total | 22 (100.0%) | 0 (0.0%) |
Fertility by Education in Pleasant Run
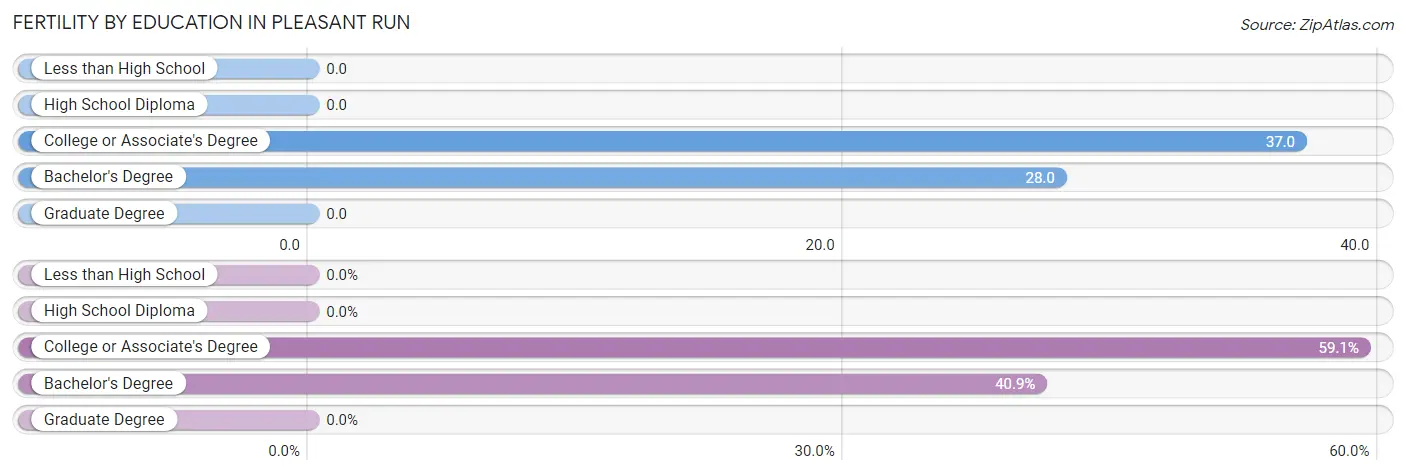
| Educational Attainment | Women with Births | Births / 1,000 Women |
| Less than High School | 0 (0.0%) | 0.0 |
| High School Diploma | 0 (0.0%) | 0.0 |
| College or Associate's Degree | 13 (59.1%) | 37.0 |
| Bachelor's Degree | 9 (40.9%) | 28.0 |
| Graduate Degree | 0 (0.0%) | 0.0 |
| Total | 22 (100.0%) | 16.0 |
Fertility by Education by Marriage Status in Pleasant Run
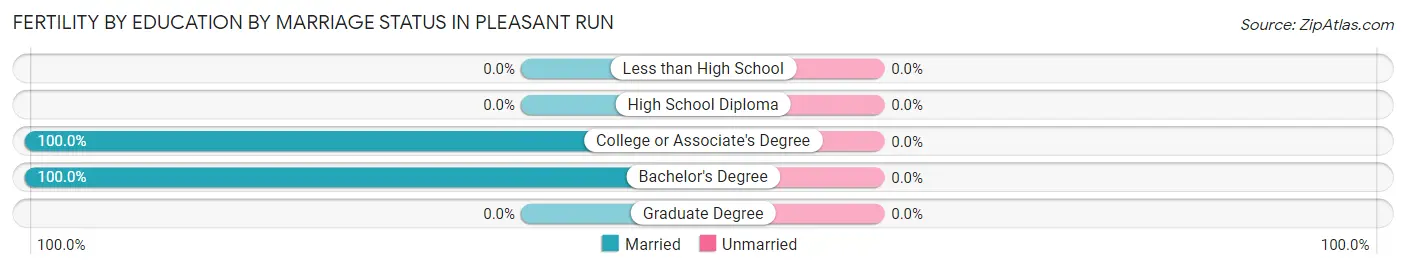
| Educational Attainment | Married | Unmarried |
| Less than High School | 0 (0.0%) | 0 (0.0%) |
| High School Diploma | 0 (0.0%) | 0 (0.0%) |
| College or Associate's Degree | 13 (100.0%) | 0 (0.0%) |
| Bachelor's Degree | 9 (100.0%) | 0 (0.0%) |
| Graduate Degree | 0 (0.0%) | 0 (0.0%) |
| Total | 22 (100.0%) | 0 (0.0%) |
Income in Pleasant Run
Income Overview in Pleasant Run
Per Capita Income in Pleasant Run is $35,755, while median incomes of families and households are $85,063 and $73,583 respectively.
| Characteristic | Number | Measure |
| Per Capita Income | 5,258 | $35,755 |
| Median Family Income | 1,409 | $85,063 |
| Mean Family Income | 1,409 | $106,803 |
| Median Household Income | 1,933 | $73,583 |
| Mean Household Income | 1,933 | $95,468 |
| Income Deficit | 1,409 | $0 |
| Wage / Income Gap (%) | 5,258 | 4.78% |
| Wage / Income Gap ($) | 5,258 | 95.22¢ per $1 |
| Gini / Inequality Index | 5,258 | 0.37 |
Earnings by Sex in Pleasant Run
Average Earnings in Pleasant Run are $43,899, $45,764 for men and $43,577 for women, a difference of 4.8%.
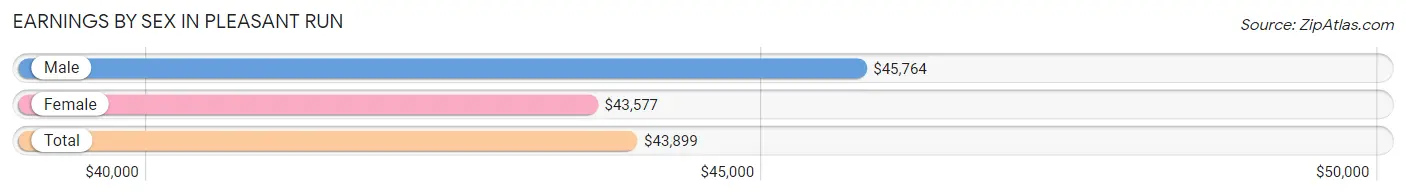
| Sex | Number | Average Earnings |
| Male | 1,194 (39.4%) | $45,764 |
| Female | 1,834 (60.6%) | $43,577 |
| Total | 3,028 (100.0%) | $43,899 |
Earnings by Sex by Income Bracket in Pleasant Run
The most common earnings brackets in Pleasant Run are $55,000 to $64,999 for men (170 | 14.2%) and $40,000 to $44,999 for women (385 | 21.0%).
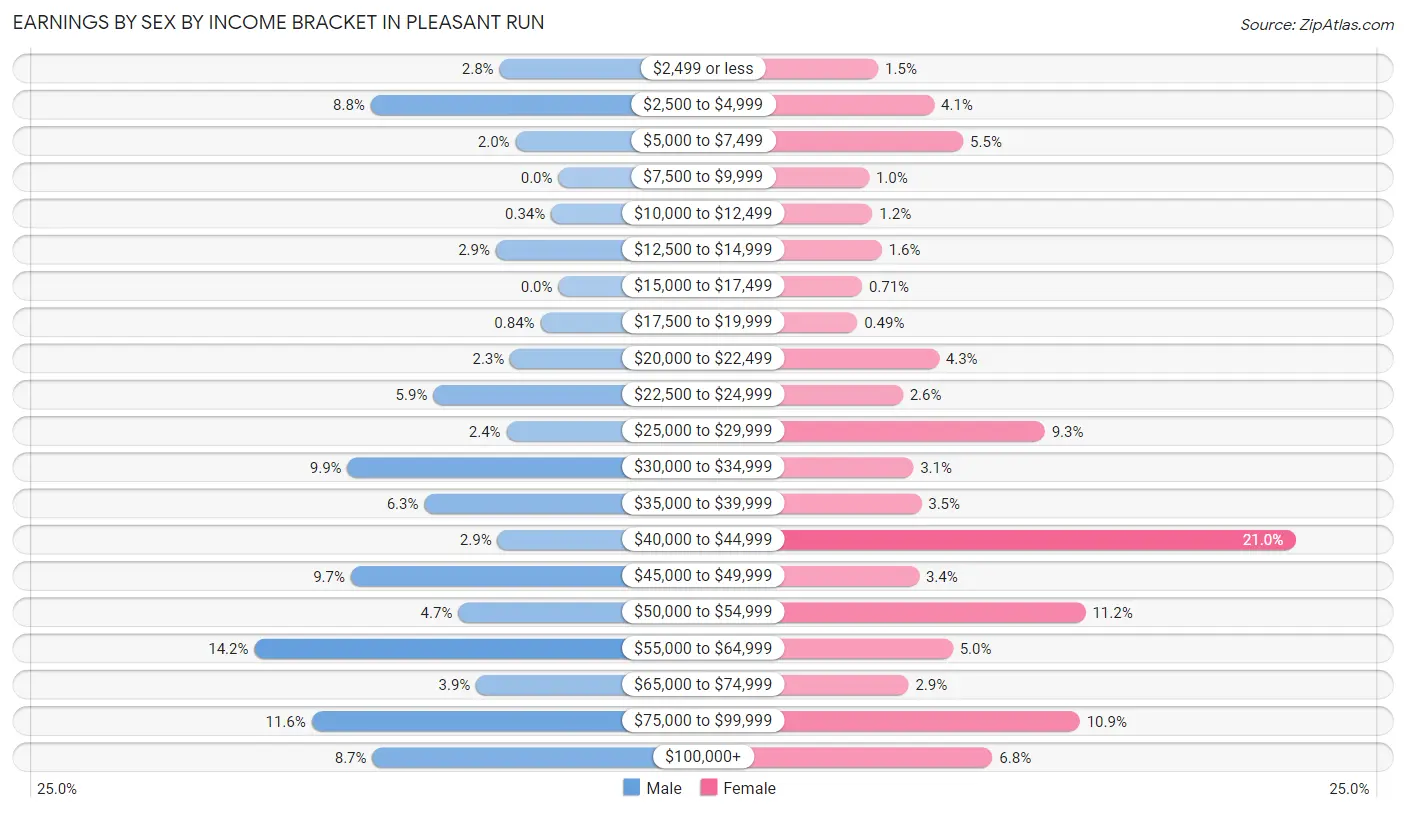
| Income | Male | Female |
| $2,499 or less | 33 (2.8%) | 27 (1.5%) |
| $2,500 to $4,999 | 105 (8.8%) | 75 (4.1%) |
| $5,000 to $7,499 | 24 (2.0%) | 100 (5.4%) |
| $7,500 to $9,999 | 0 (0.0%) | 19 (1.0%) |
| $10,000 to $12,499 | 4 (0.3%) | 22 (1.2%) |
| $12,500 to $14,999 | 35 (2.9%) | 30 (1.6%) |
| $15,000 to $17,499 | 0 (0.0%) | 13 (0.7%) |
| $17,500 to $19,999 | 10 (0.8%) | 9 (0.5%) |
| $20,000 to $22,499 | 27 (2.3%) | 79 (4.3%) |
| $22,500 to $24,999 | 70 (5.9%) | 48 (2.6%) |
| $25,000 to $29,999 | 29 (2.4%) | 170 (9.3%) |
| $30,000 to $34,999 | 118 (9.9%) | 57 (3.1%) |
| $35,000 to $39,999 | 75 (6.3%) | 64 (3.5%) |
| $40,000 to $44,999 | 34 (2.9%) | 385 (21.0%) |
| $45,000 to $49,999 | 116 (9.7%) | 62 (3.4%) |
| $50,000 to $54,999 | 56 (4.7%) | 205 (11.2%) |
| $55,000 to $64,999 | 170 (14.2%) | 91 (5.0%) |
| $65,000 to $74,999 | 46 (3.8%) | 53 (2.9%) |
| $75,000 to $99,999 | 138 (11.6%) | 200 (10.9%) |
| $100,000+ | 104 (8.7%) | 125 (6.8%) |
| Total | 1,194 (100.0%) | 1,834 (100.0%) |
Earnings by Sex by Educational Attainment in Pleasant Run
Average earnings in Pleasant Run are $52,292 for men and $43,860 for women, a difference of 16.1%. Men with an educational attainment of graduate degree enjoy the highest average annual earnings of $111,211, while those with high school diploma education earn the least with $45,694. Women with an educational attainment of graduate degree earn the most with the average annual earnings of $95,509, while those with less than high school education have the smallest earnings of $28,936.

| Educational Attainment | Male Income | Female Income |
| Less than High School | $58,422 | $28,936 |
| High School Diploma | $45,694 | $43,063 |
| College or Associate's Degree | $46,806 | $42,008 |
| Bachelor's Degree | - | - |
| Graduate Degree | $111,211 | $95,509 |
| Total | $52,292 | $43,860 |
Family Income in Pleasant Run
Family Income Brackets in Pleasant Run
According to the Pleasant Run family income data, there are 328 families falling into the $50,000 to $74,999 income range, which is the most common income bracket and makes up 23.3% of all families.
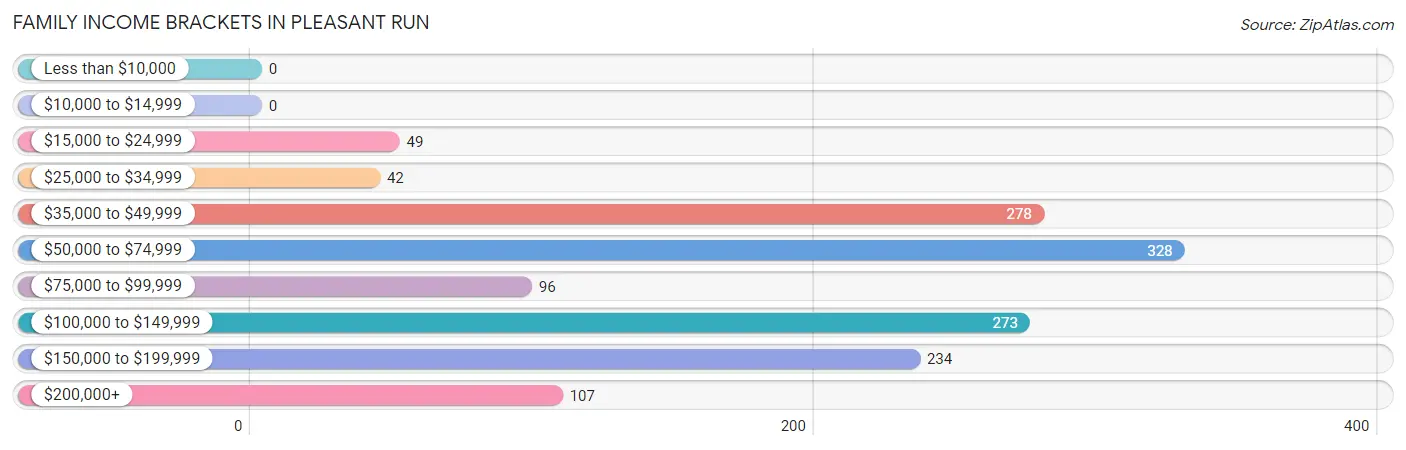
| Income Bracket | # Families | % Families |
| Less than $10,000 | 0 | 0.0% |
| $10,000 to $14,999 | 0 | 0.0% |
| $15,000 to $24,999 | 49 | 3.5% |
| $25,000 to $34,999 | 42 | 3.0% |
| $35,000 to $49,999 | 278 | 19.7% |
| $50,000 to $74,999 | 328 | 23.3% |
| $75,000 to $99,999 | 96 | 6.8% |
| $100,000 to $149,999 | 273 | 19.4% |
| $150,000 to $199,999 | 234 | 16.6% |
| $200,000+ | 107 | 7.6% |
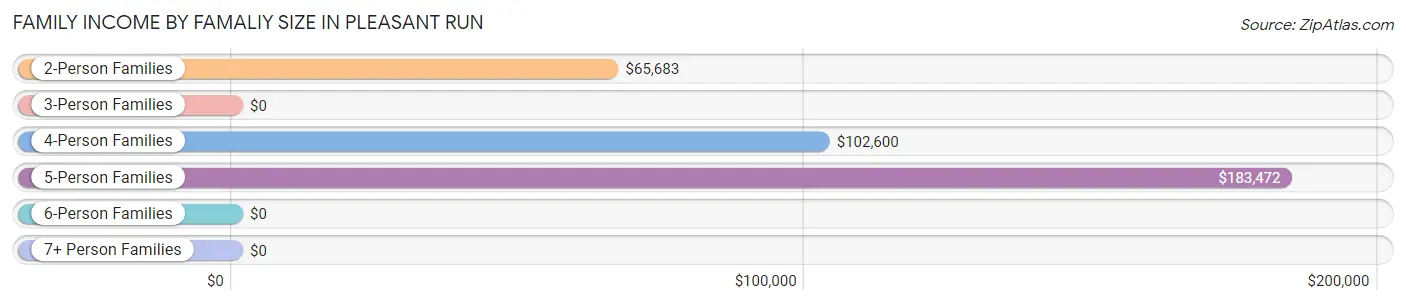
Family Income by Famaliy Size in Pleasant Run
5-person families (75 | 5.3%) account for the highest median family income in Pleasant Run with $183,472 per family, while 5-person families (75 | 5.3%) have the highest median income of $36,694 per family member.
| Income Bracket | # Families | Median Income |
| 2-Person Families | 779 (55.3%) | $65,683 |
| 3-Person Families | 235 (16.7%) | $0 |
| 4-Person Families | 188 (13.3%) | $102,600 |
| 5-Person Families | 75 (5.3%) | $183,472 |
| 6-Person Families | 113 (8.0%) | $0 |
| 7+ Person Families | 19 (1.3%) | $0 |
| Total | 1,409 (100.0%) | $85,063 |
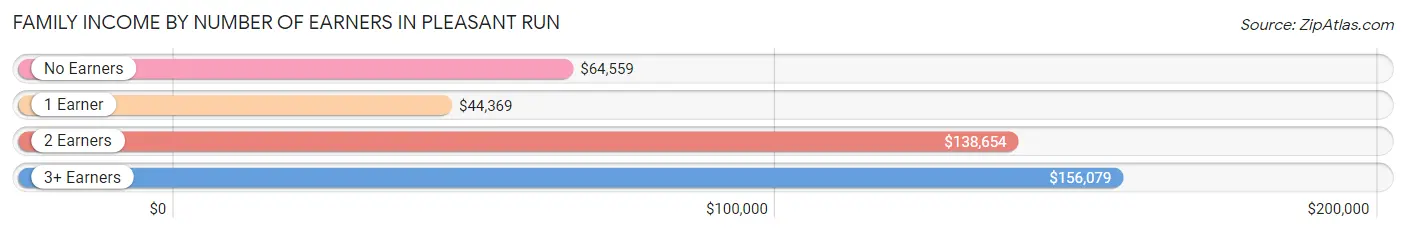
Family Income by Number of Earners in Pleasant Run
The median family income in Pleasant Run is $85,063, with families comprising 3+ earners (256) having the highest median family income of $156,079, while families with 1 earner (509) have the lowest median family income of $44,369, accounting for 18.2% and 36.1% of families, respectively.
| Number of Earners | # Families | Median Income |
| No Earners | 190 (13.5%) | $64,559 |
| 1 Earner | 509 (36.1%) | $44,369 |
| 2 Earners | 454 (32.2%) | $138,654 |
| 3+ Earners | 256 (18.2%) | $156,079 |
| Total | 1,409 (100.0%) | $85,063 |
Household Income in Pleasant Run
Household Income Brackets in Pleasant Run
With 456 households falling in the category, the $50,000 to $74,999 income range is the most frequent in Pleasant Run, accounting for 23.6% of all households.
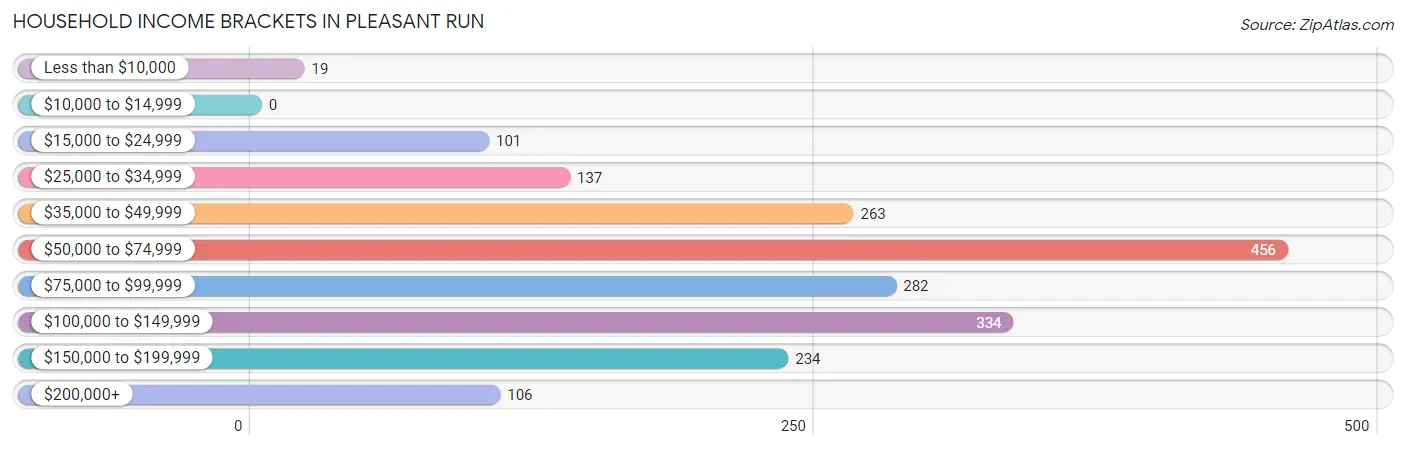
| Income Bracket | # Households | % Households |
| Less than $10,000 | 19 | 1.0% |
| $10,000 to $14,999 | 0 | 0.0% |
| $15,000 to $24,999 | 101 | 5.2% |
| $25,000 to $34,999 | 137 | 7.1% |
| $35,000 to $49,999 | 263 | 13.6% |
| $50,000 to $74,999 | 456 | 23.6% |
| $75,000 to $99,999 | 282 | 14.6% |
| $100,000 to $149,999 | 334 | 17.3% |
| $150,000 to $199,999 | 234 | 12.1% |
| $200,000+ | 106 | 5.5% |
Household Income by Householder Age in Pleasant Run
The median household income in Pleasant Run is $73,583, with the highest median household income of $89,828 found in the 45 to 64 years age bracket for the primary householder. A total of 760 households (39.3%) fall into this category. Meanwhile, the 15 to 24 years age bracket for the primary householder has the lowest median household income of $0, with 47 households (2.4%) in this group.
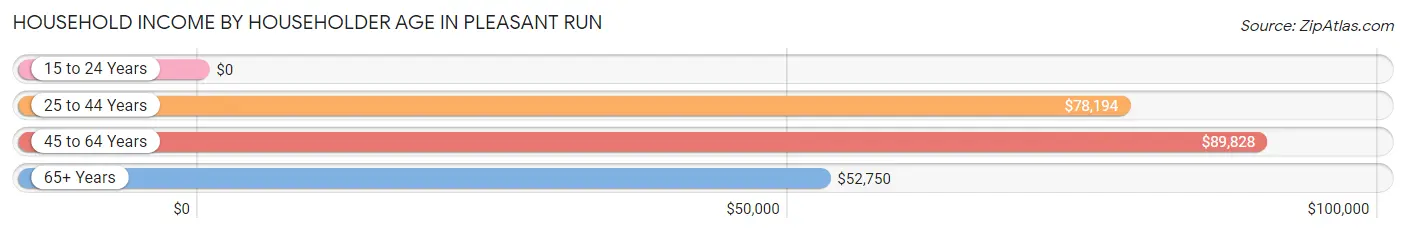
| Income Bracket | # Households | Median Income |
| 15 to 24 Years | 47 (2.4%) | $0 |
| 25 to 44 Years | 674 (34.9%) | $78,194 |
| 45 to 64 Years | 760 (39.3%) | $89,828 |
| 65+ Years | 452 (23.4%) | $52,750 |
| Total | 1,933 (100.0%) | $73,583 |
Poverty in Pleasant Run
Income Below Poverty by Sex and Age in Pleasant Run
With 6.7% poverty level for males and 5.6% for females among the residents of Pleasant Run, 16 and 17 year old males and 16 and 17 year old females are the most vulnerable to poverty, with 34 males (100.0%) and 26 females (28.3%) in their respective age groups living below the poverty level.
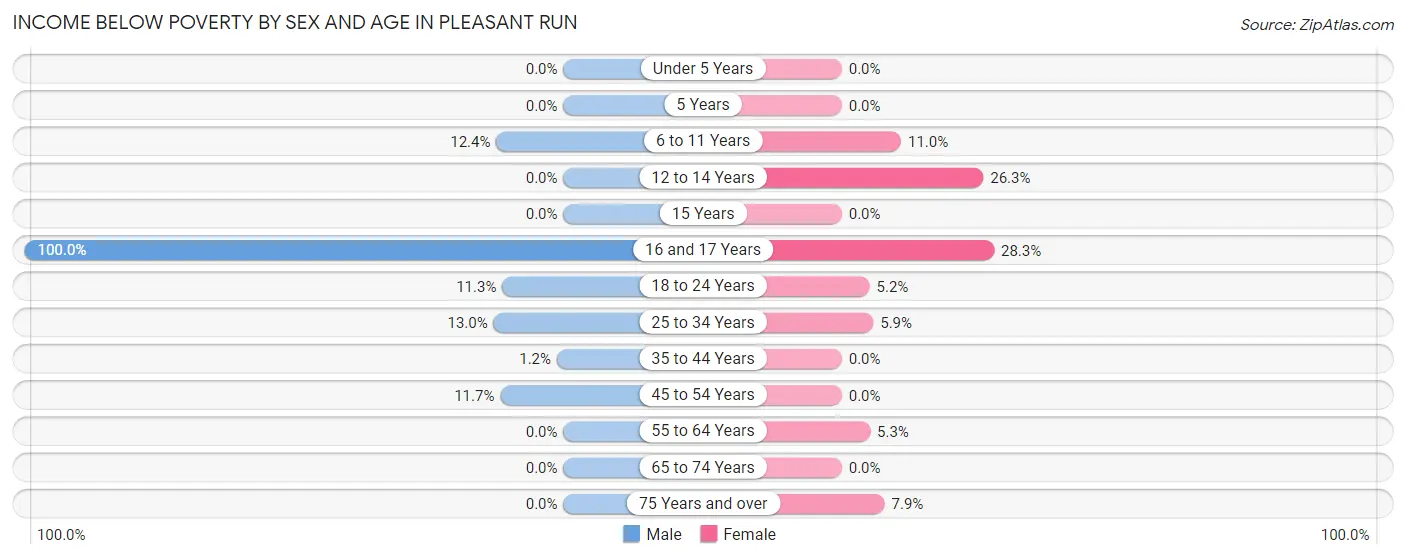
| Age Bracket | Male | Female |
| Under 5 Years | 0 (0.0%) | 0 (0.0%) |
| 5 Years | 0 (0.0%) | 0 (0.0%) |
| 6 to 11 Years | 24 (12.4%) | 23 (11.0%) |
| 12 to 14 Years | 0 (0.0%) | 26 (26.3%) |
| 15 Years | 0 (0.0%) | 0 (0.0%) |
| 16 and 17 Years | 34 (100.0%) | 26 (28.3%) |
| 18 to 24 Years | 28 (11.3%) | 11 (5.2%) |
| 25 to 34 Years | 25 (13.0%) | 31 (5.9%) |
| 35 to 44 Years | 4 (1.2%) | 0 (0.0%) |
| 45 to 54 Years | 34 (11.7%) | 0 (0.0%) |
| 55 to 64 Years | 0 (0.0%) | 25 (5.2%) |
| 65 to 74 Years | 0 (0.0%) | 0 (0.0%) |
| 75 Years and over | 0 (0.0%) | 20 (7.9%) |
| Total | 149 (6.7%) | 162 (5.6%) |
Income Above Poverty by Sex and Age in Pleasant Run
According to the poverty statistics in Pleasant Run, males aged under 5 years and females aged under 5 years are the age groups that are most secure financially, with 100.0% of males and 100.0% of females in these age groups living above the poverty line.
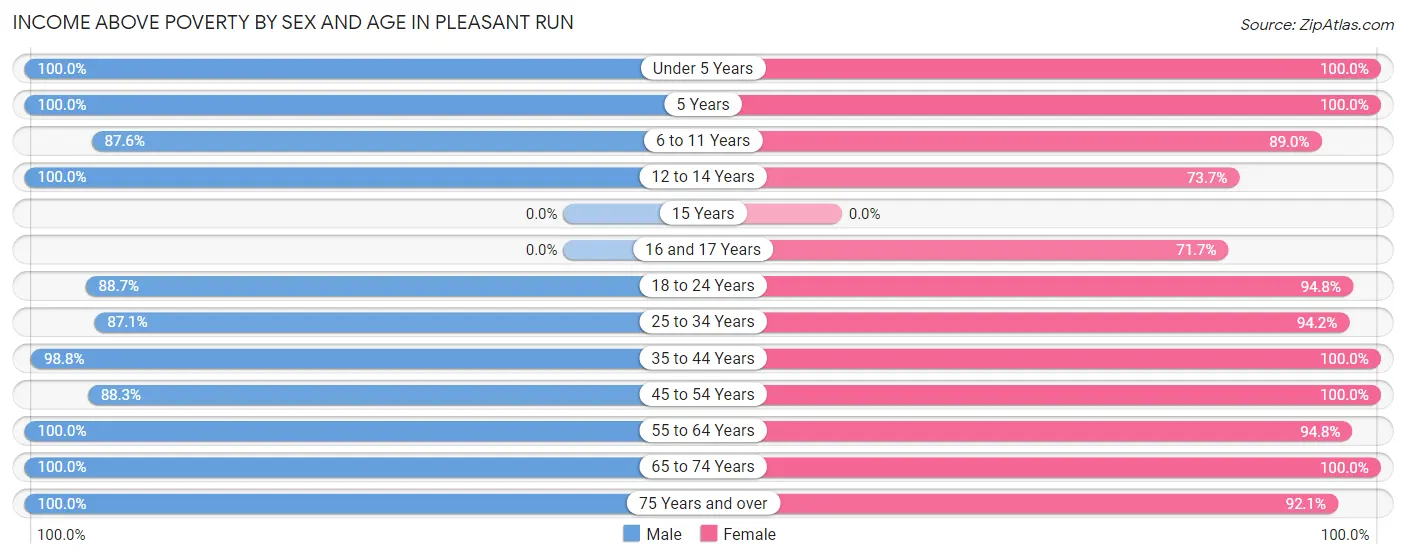
| Age Bracket | Male | Female |
| Under 5 Years | 74 (100.0%) | 179 (100.0%) |
| 5 Years | 194 (100.0%) | 36 (100.0%) |
| 6 to 11 Years | 169 (87.6%) | 186 (89.0%) |
| 12 to 14 Years | 26 (100.0%) | 73 (73.7%) |
| 15 Years | 0 (0.0%) | 0 (0.0%) |
| 16 and 17 Years | 0 (0.0%) | 66 (71.7%) |
| 18 to 24 Years | 219 (88.7%) | 202 (94.8%) |
| 25 to 34 Years | 168 (87.1%) | 499 (94.2%) |
| 35 to 44 Years | 330 (98.8%) | 230 (100.0%) |
| 45 to 54 Years | 256 (88.3%) | 399 (100.0%) |
| 55 to 64 Years | 379 (100.0%) | 451 (94.8%) |
| 65 to 74 Years | 137 (100.0%) | 181 (100.0%) |
| 75 Years and over | 128 (100.0%) | 232 (92.1%) |
| Total | 2,080 (93.3%) | 2,734 (94.4%) |
Income Below Poverty Among Married-Couple Families in Pleasant Run
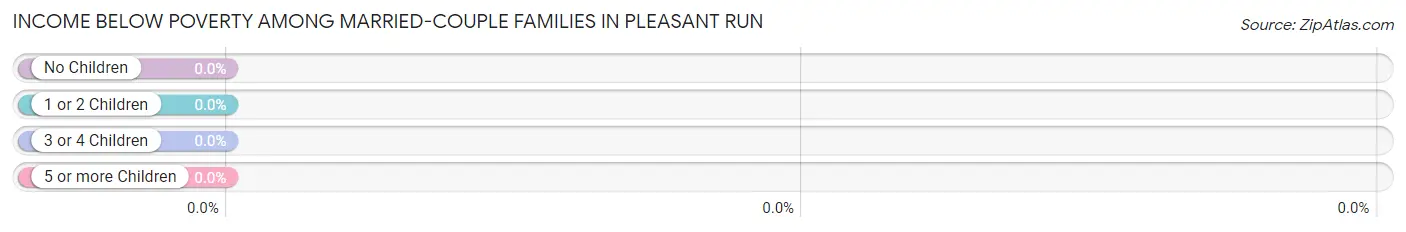
| Children | Above Poverty | Below Poverty |
| No Children | 618 (100.0%) | 0 (0.0%) |
| 1 or 2 Children | 247 (100.0%) | 0 (0.0%) |
| 3 or 4 Children | 54 (100.0%) | 0 (0.0%) |
| 5 or more Children | 9 (100.0%) | 0 (0.0%) |
| Total | 928 (100.0%) | 0 (0.0%) |
Income Below Poverty Among Single-Parent Households in Pleasant Run
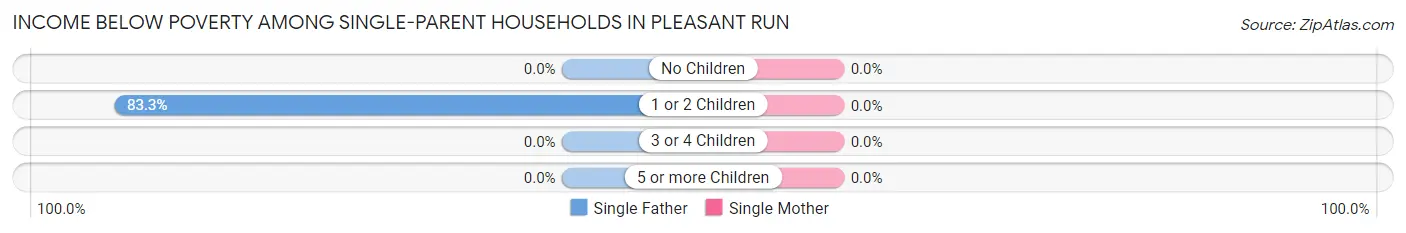
| Children | Single Father | Single Mother |
| No Children | 0 (0.0%) | 0 (0.0%) |
| 1 or 2 Children | 50 (83.3%) | 0 (0.0%) |
| 3 or 4 Children | 0 (0.0%) | 0 (0.0%) |
| 5 or more Children | 0 (0.0%) | 0 (0.0%) |
| Total | 50 (83.3%) | 0 (0.0%) |
Income Below Poverty Among Married-Couple vs Single-Parent Households in Pleasant Run
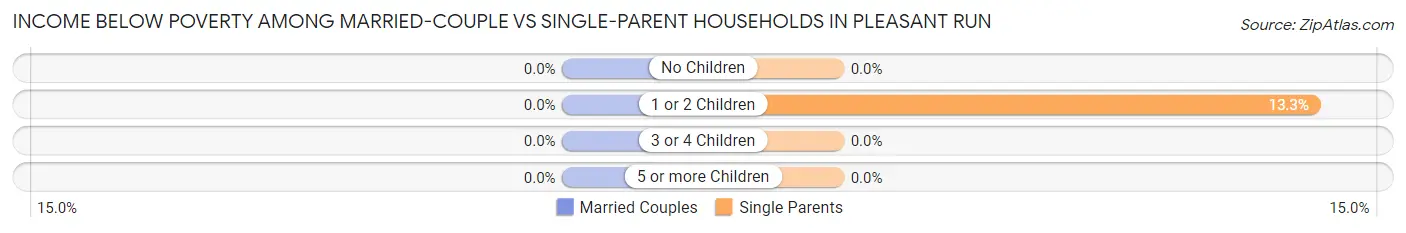
| Children | Married-Couple Families | Single-Parent Households |
| No Children | 0 (0.0%) | 0 (0.0%) |
| 1 or 2 Children | 0 (0.0%) | 50 (13.3%) |
| 3 or 4 Children | 0 (0.0%) | 0 (0.0%) |
| 5 or more Children | 0 (0.0%) | 0 (0.0%) |
| Total | 0 (0.0%) | 50 (10.4%) |
Employment Characteristics in Pleasant Run
Employment by Class of Employer in Pleasant Run
Among the 2,724 employed individuals in Pleasant Run, private company employees (1,769 | 64.9%), local government employees (474 | 17.4%), and not-for-profit organizations (210 | 7.7%) make up the most common classes of employment.
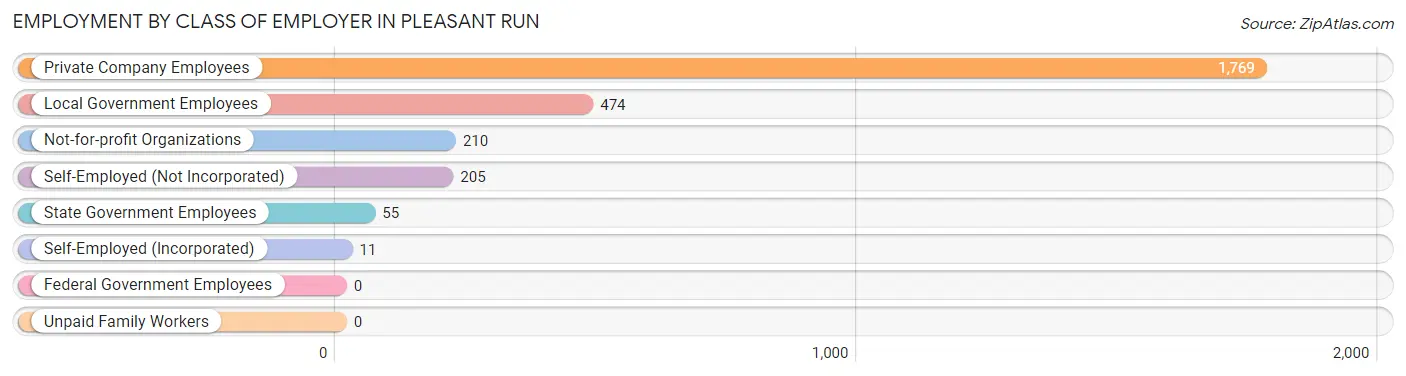
| Employer Class | # Employees | % Employees |
| Private Company Employees | 1,769 | 64.9% |
| Self-Employed (Incorporated) | 11 | 0.4% |
| Self-Employed (Not Incorporated) | 205 | 7.5% |
| Not-for-profit Organizations | 210 | 7.7% |
| Local Government Employees | 474 | 17.4% |
| State Government Employees | 55 | 2.0% |
| Federal Government Employees | 0 | 0.0% |
| Unpaid Family Workers | 0 | 0.0% |
| Total | 2,724 | 100.0% |
Employment Status by Age in Pleasant Run
According to the labor force statistics for Pleasant Run, out of the total population over 16 years of age (4,222), 70.0% or 2,955 individuals are in the labor force, with 6.7% or 198 of them unemployed. The age group with the highest labor force participation rate is 25 to 29 years, with 95.3% or 161 individuals in the labor force. Within the labor force, the 20 to 24 years age range has the highest percentage of unemployed individuals, with 41.0% or 148 of them being unemployed.
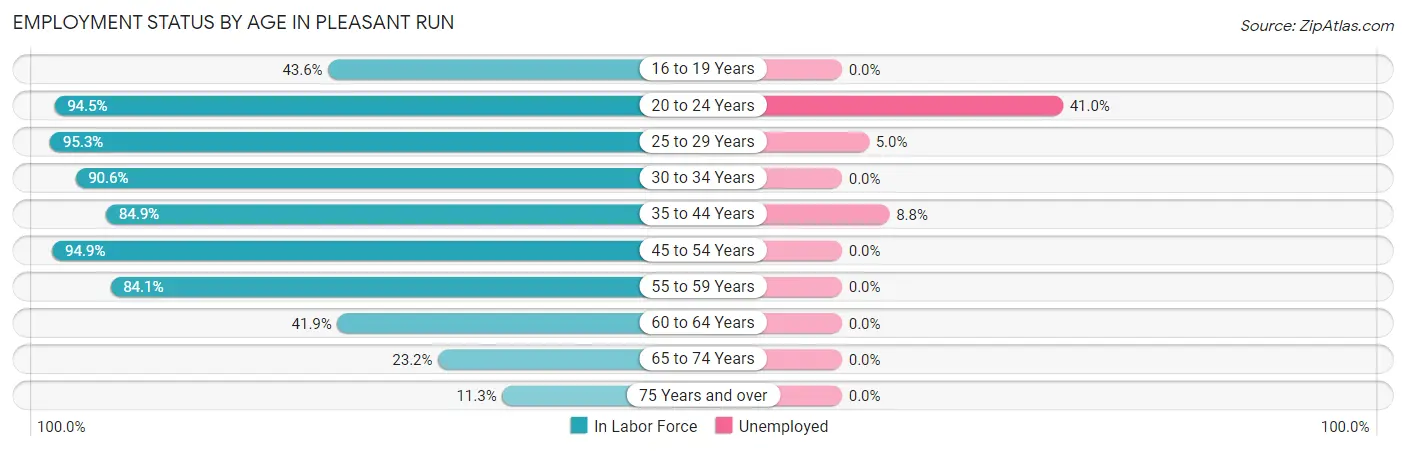
| Age Bracket | In Labor Force | Unemployed |
| 16 to 19 Years | 89 (43.6%) | 0 (0.0%) |
| 20 to 24 Years | 361 (94.5%) | 148 (41.0%) |
| 25 to 29 Years | 161 (95.3%) | 8 (5.0%) |
| 30 to 34 Years | 502 (90.6%) | 0 (0.0%) |
| 35 to 44 Years | 479 (84.9%) | 42 (8.8%) |
| 45 to 54 Years | 654 (94.9%) | 0 (0.0%) |
| 55 to 59 Years | 435 (84.1%) | 0 (0.0%) |
| 60 to 64 Years | 143 (41.9%) | 0 (0.0%) |
| 65 to 74 Years | 79 (23.2%) | 0 (0.0%) |
| 75 Years and over | 52 (11.3%) | 0 (0.0%) |
| Total | 2,955 (70.0%) | 198 (6.7%) |
Employment Status by Educational Attainment in Pleasant Run
According to labor force statistics for Pleasant Run, 83.8% of individuals (2,375) out of the total population between 25 and 64 years of age (2,834) are in the labor force, with 2.1% or 50 of them being unemployed. The group with the highest labor force participation rate are those with the educational attainment of bachelor's degree or higher, with 87.9% or 573 individuals in the labor force. Within the labor force, individuals with high school diploma education have the highest percentage of unemployment, with 4.1% or 38 of them being unemployed.
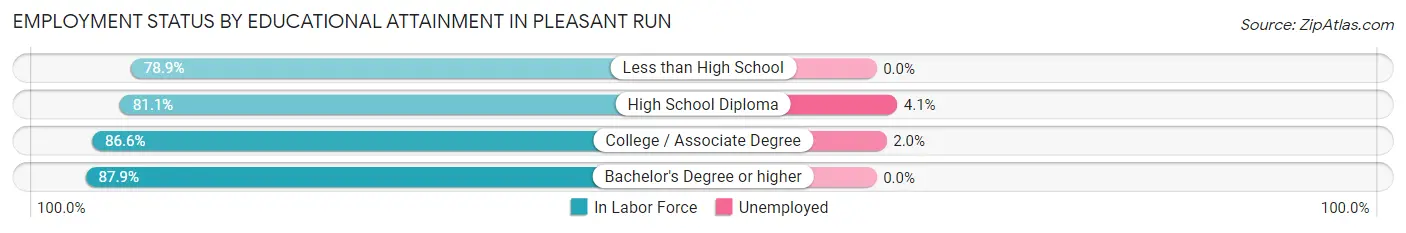
| Educational Attainment | In Labor Force | Unemployed |
| Less than High School | 254 (78.9%) | 0 (0.0%) |
| High School Diploma | 935 (81.1%) | 47 (4.1%) |
| College / Associate Degree | 612 (86.6%) | 14 (2.0%) |
| Bachelor's Degree or higher | 573 (87.9%) | 0 (0.0%) |
| Total | 2,375 (83.8%) | 60 (2.1%) |
Employment Occupations by Sex in Pleasant Run
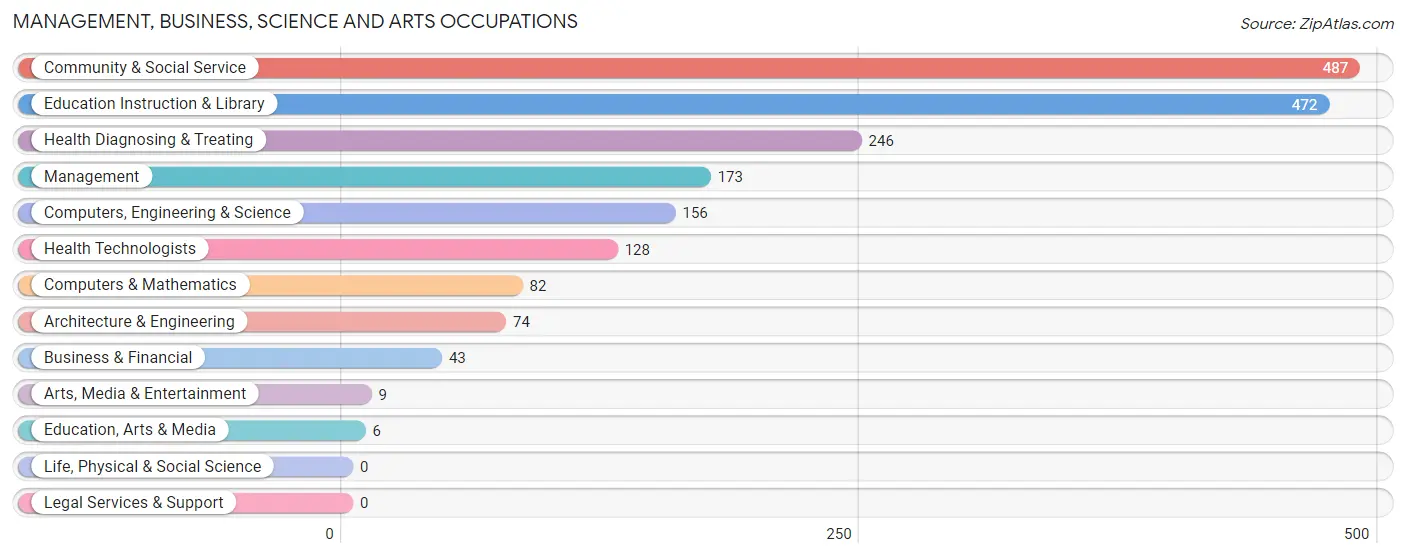
Management, Business, Science and Arts Occupations
The most common Management, Business, Science and Arts occupations in Pleasant Run are Community & Social Service (487 | 17.7%), Education Instruction & Library (472 | 17.1%), Health Diagnosing & Treating (246 | 8.9%), Management (173 | 6.3%), and Computers, Engineering & Science (156 | 5.7%).
Management, Business, Science and Arts Occupations by Sex
Within the Management, Business, Science and Arts occupations in Pleasant Run, the most male-oriented occupations are Architecture & Engineering (64.9%), Computers, Engineering & Science (56.4%), and Management (50.3%), while the most female-oriented occupations are Education, Arts & Media (100.0%), Arts, Media & Entertainment (100.0%), and Community & Social Service (87.1%).
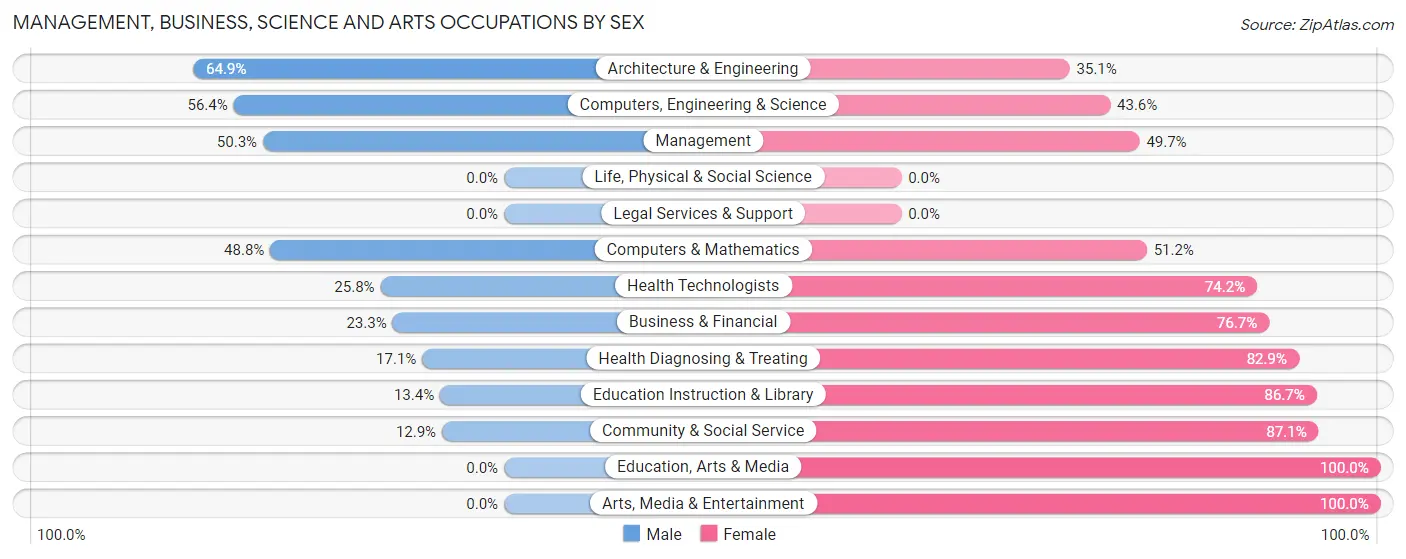
| Occupation | Male | Female |
| Management | 87 (50.3%) | 86 (49.7%) |
| Business & Financial | 10 (23.3%) | 33 (76.7%) |
| Computers, Engineering & Science | 88 (56.4%) | 68 (43.6%) |
| Computers & Mathematics | 40 (48.8%) | 42 (51.2%) |
| Architecture & Engineering | 48 (64.9%) | 26 (35.1%) |
| Life, Physical & Social Science | 0 (0.0%) | 0 (0.0%) |
| Community & Social Service | 63 (12.9%) | 424 (87.1%) |
| Education, Arts & Media | 0 (0.0%) | 6 (100.0%) |
| Legal Services & Support | 0 (0.0%) | 0 (0.0%) |
| Education Instruction & Library | 63 (13.4%) | 409 (86.7%) |
| Arts, Media & Entertainment | 0 (0.0%) | 9 (100.0%) |
| Health Diagnosing & Treating | 42 (17.1%) | 204 (82.9%) |
| Health Technologists | 33 (25.8%) | 95 (74.2%) |
| Total (Category) | 290 (26.2%) | 815 (73.8%) |
| Total (Overall) | 1,084 (39.3%) | 1,673 (60.7%) |
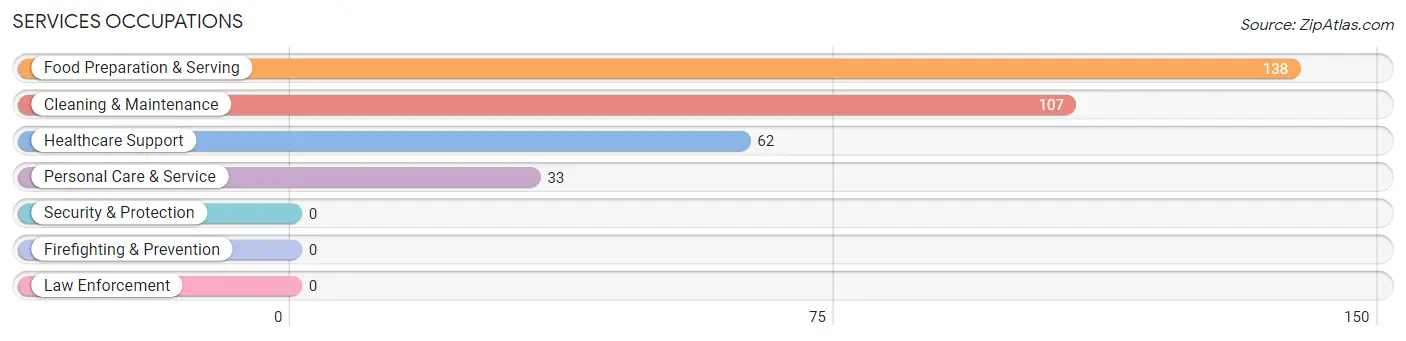
Services Occupations
The most common Services occupations in Pleasant Run are Food Preparation & Serving (138 | 5.0%), Cleaning & Maintenance (107 | 3.9%), Healthcare Support (62 | 2.2%), and Personal Care & Service (33 | 1.2%).
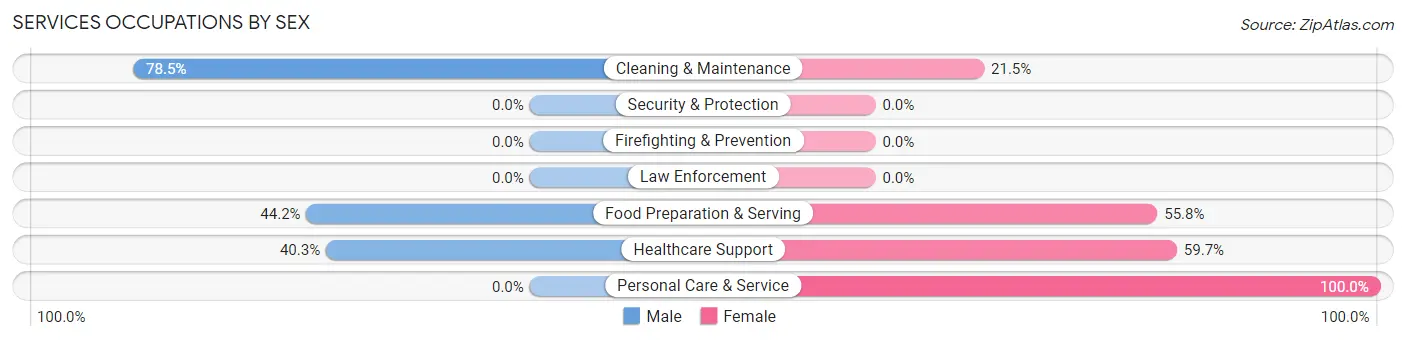
Services Occupations by Sex
Within the Services occupations in Pleasant Run, the most male-oriented occupations are Cleaning & Maintenance (78.5%), Food Preparation & Serving (44.2%), and Healthcare Support (40.3%), while the most female-oriented occupations are Personal Care & Service (100.0%), Healthcare Support (59.7%), and Food Preparation & Serving (55.8%).
| Occupation | Male | Female |
| Healthcare Support | 25 (40.3%) | 37 (59.7%) |
| Security & Protection | 0 (0.0%) | 0 (0.0%) |
| Firefighting & Prevention | 0 (0.0%) | 0 (0.0%) |
| Law Enforcement | 0 (0.0%) | 0 (0.0%) |
| Food Preparation & Serving | 61 (44.2%) | 77 (55.8%) |
| Cleaning & Maintenance | 84 (78.5%) | 23 (21.5%) |
| Personal Care & Service | 0 (0.0%) | 33 (100.0%) |
| Total (Category) | 170 (50.0%) | 170 (50.0%) |
| Total (Overall) | 1,084 (39.3%) | 1,673 (60.7%) |
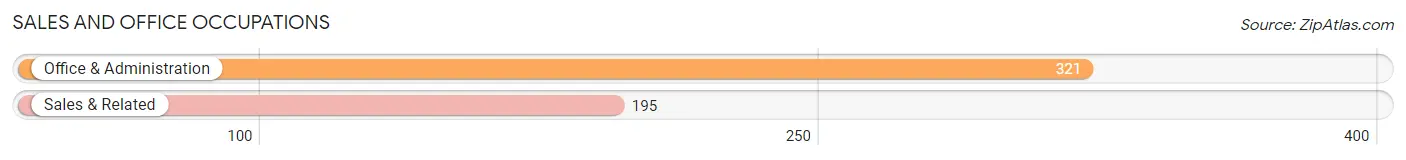
Sales and Office Occupations
The most common Sales and Office occupations in Pleasant Run are Office & Administration (321 | 11.6%), and Sales & Related (195 | 7.1%).
Sales and Office Occupations by Sex

| Occupation | Male | Female |
| Sales & Related | 43 (22.1%) | 152 (77.9%) |
| Office & Administration | 18 (5.6%) | 303 (94.4%) |
| Total (Category) | 61 (11.8%) | 455 (88.2%) |
| Total (Overall) | 1,084 (39.3%) | 1,673 (60.7%) |
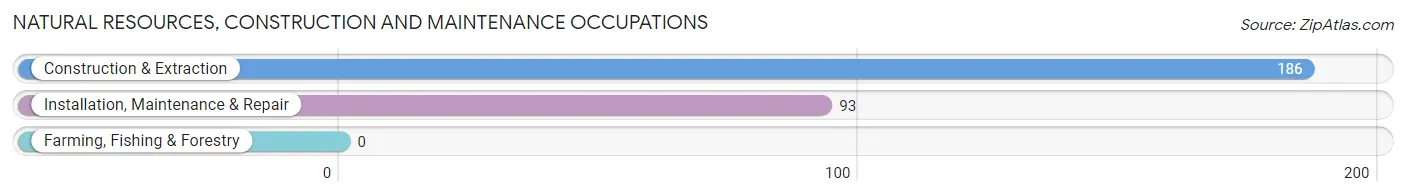
Natural Resources, Construction and Maintenance Occupations
The most common Natural Resources, Construction and Maintenance occupations in Pleasant Run are Construction & Extraction (186 | 6.8%), and Installation, Maintenance & Repair (93 | 3.4%).
Natural Resources, Construction and Maintenance Occupations by Sex
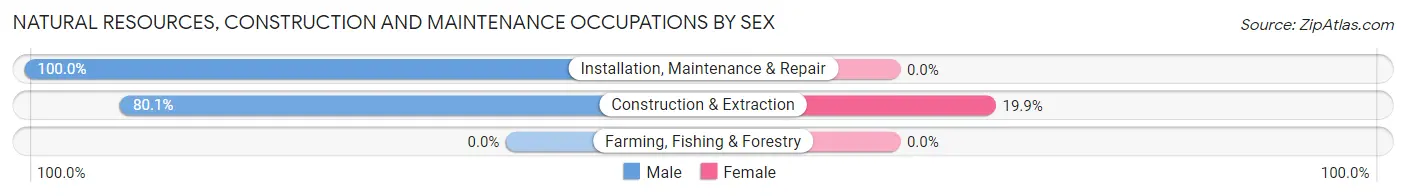
| Occupation | Male | Female |
| Farming, Fishing & Forestry | 0 (0.0%) | 0 (0.0%) |
| Construction & Extraction | 149 (80.1%) | 37 (19.9%) |
| Installation, Maintenance & Repair | 93 (100.0%) | 0 (0.0%) |
| Total (Category) | 242 (86.7%) | 37 (13.3%) |
| Total (Overall) | 1,084 (39.3%) | 1,673 (60.7%) |
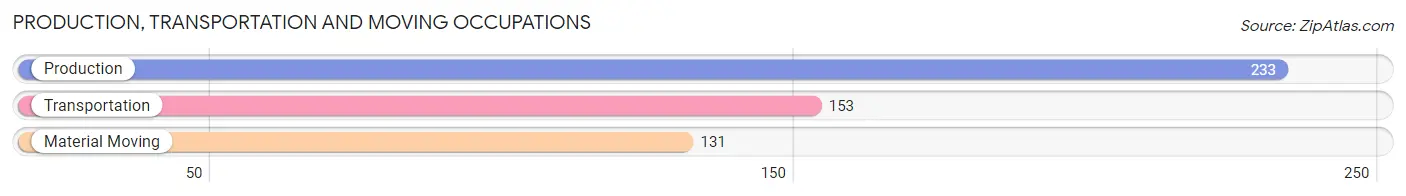
Production, Transportation and Moving Occupations
The most common Production, Transportation and Moving occupations in Pleasant Run are Production (233 | 8.5%), Transportation (153 | 5.6%), and Material Moving (131 | 4.8%).
Production, Transportation and Moving Occupations by Sex
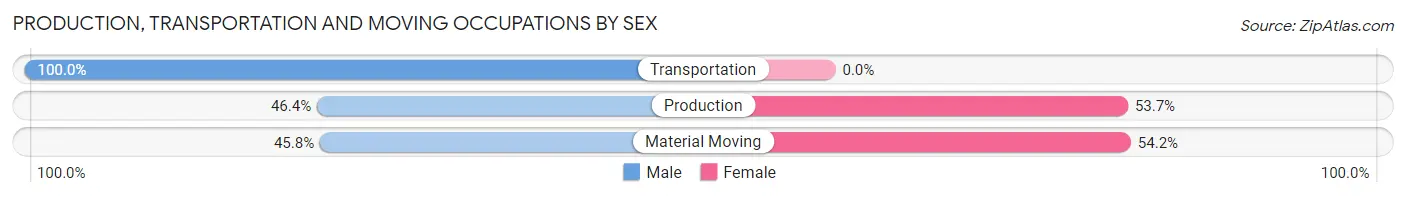
| Occupation | Male | Female |
| Production | 108 (46.4%) | 125 (53.6%) |
| Transportation | 153 (100.0%) | 0 (0.0%) |
| Material Moving | 60 (45.8%) | 71 (54.2%) |
| Total (Category) | 321 (62.1%) | 196 (37.9%) |
| Total (Overall) | 1,084 (39.3%) | 1,673 (60.7%) |
Employment Industries by Sex in Pleasant Run
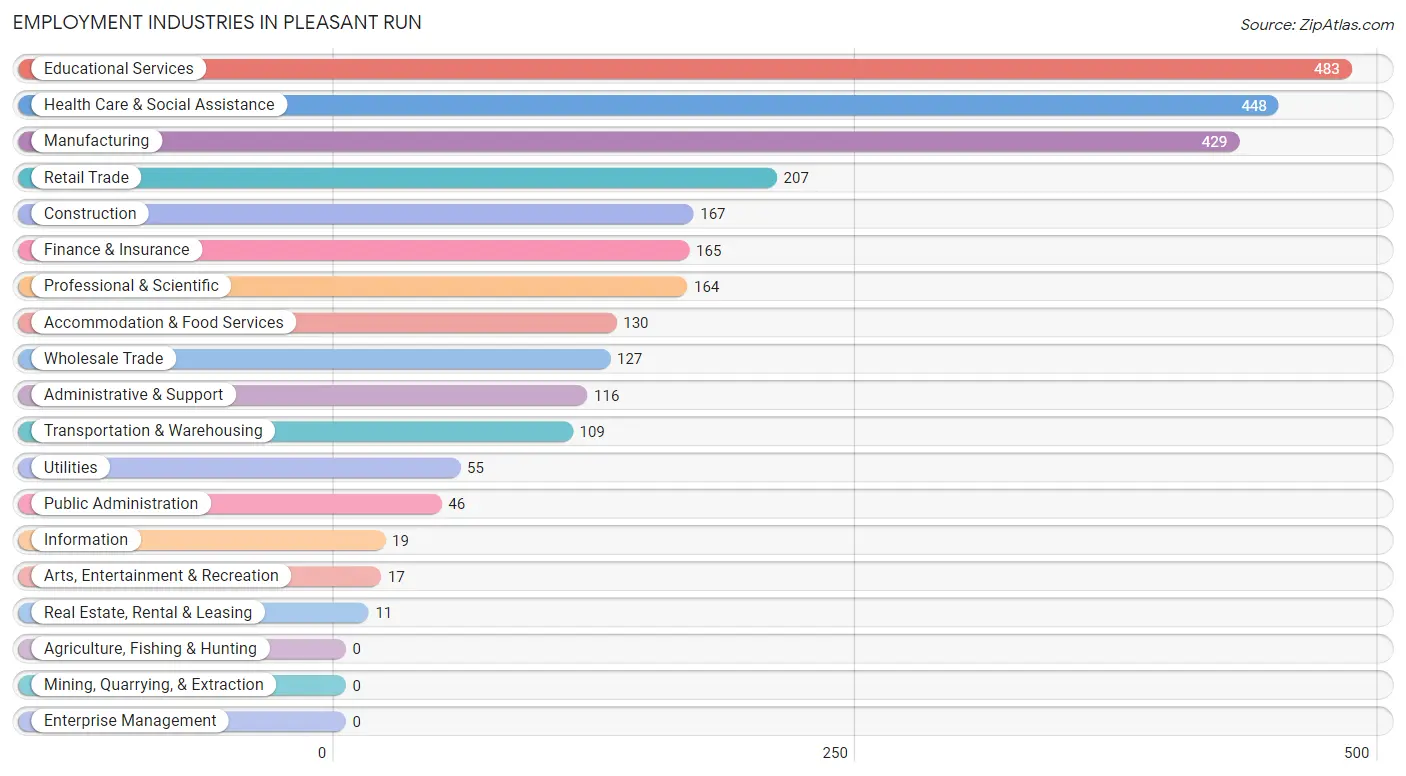
Employment Industries in Pleasant Run
The major employment industries in Pleasant Run include Educational Services (483 | 17.5%), Health Care & Social Assistance (448 | 16.3%), Manufacturing (429 | 15.6%), Retail Trade (207 | 7.5%), and Construction (167 | 6.1%).
Employment Industries by Sex in Pleasant Run
The Pleasant Run industries that see more men than women are Utilities (100.0%), Real Estate, Rental & Leasing (100.0%), and Transportation & Warehousing (89.0%), whereas the industries that tend to have a higher number of women are Information (100.0%), Arts, Entertainment & Recreation (100.0%), and Finance & Insurance (94.6%).
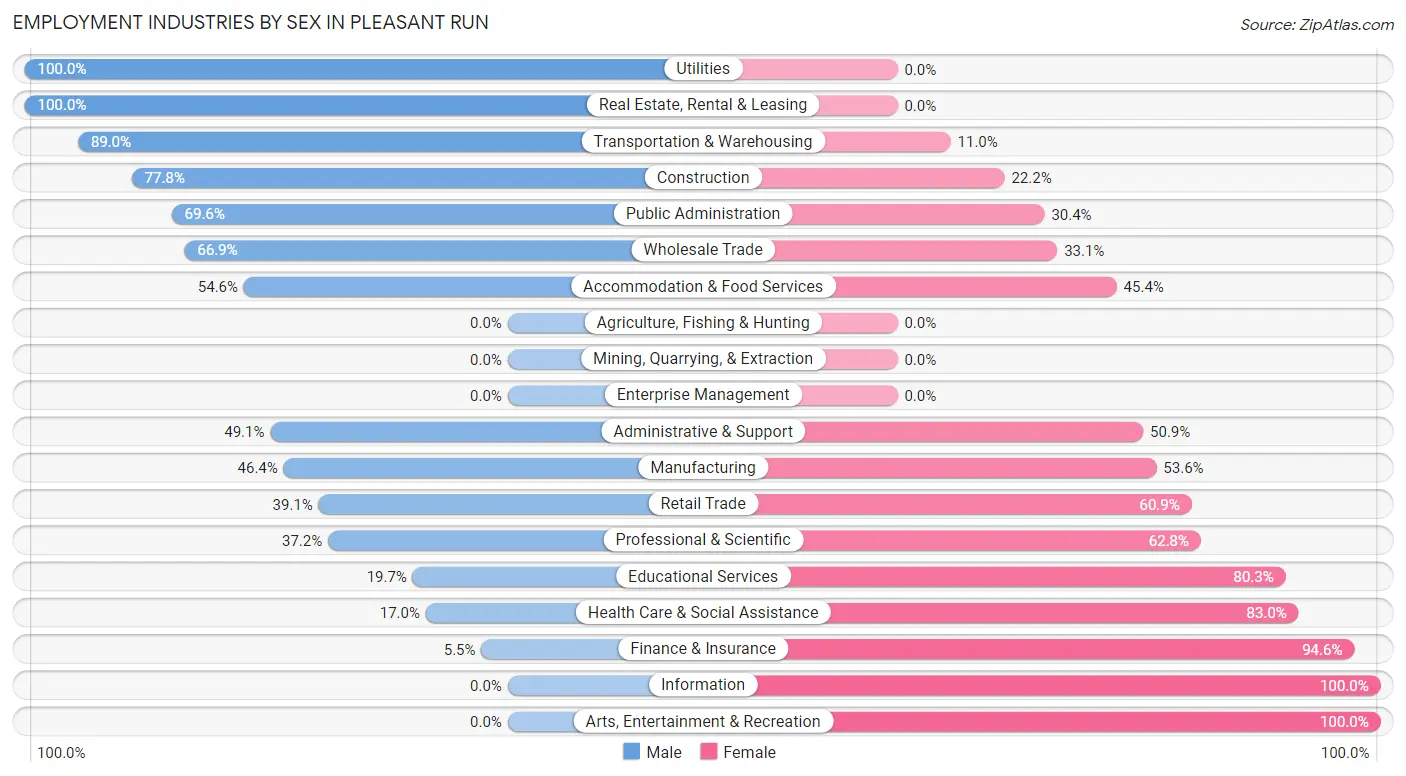
| Industry | Male | Female |
| Agriculture, Fishing & Hunting | 0 (0.0%) | 0 (0.0%) |
| Mining, Quarrying, & Extraction | 0 (0.0%) | 0 (0.0%) |
| Construction | 130 (77.8%) | 37 (22.2%) |
| Manufacturing | 199 (46.4%) | 230 (53.6%) |
| Wholesale Trade | 85 (66.9%) | 42 (33.1%) |
| Retail Trade | 81 (39.1%) | 126 (60.9%) |
| Transportation & Warehousing | 97 (89.0%) | 12 (11.0%) |
| Utilities | 55 (100.0%) | 0 (0.0%) |
| Information | 0 (0.0%) | 19 (100.0%) |
| Finance & Insurance | 9 (5.4%) | 156 (94.6%) |
| Real Estate, Rental & Leasing | 11 (100.0%) | 0 (0.0%) |
| Professional & Scientific | 61 (37.2%) | 103 (62.8%) |
| Enterprise Management | 0 (0.0%) | 0 (0.0%) |
| Administrative & Support | 57 (49.1%) | 59 (50.9%) |
| Educational Services | 95 (19.7%) | 388 (80.3%) |
| Health Care & Social Assistance | 76 (17.0%) | 372 (83.0%) |
| Arts, Entertainment & Recreation | 0 (0.0%) | 17 (100.0%) |
| Accommodation & Food Services | 71 (54.6%) | 59 (45.4%) |
| Public Administration | 32 (69.6%) | 14 (30.4%) |
| Total | 1,084 (39.3%) | 1,673 (60.7%) |
Education in Pleasant Run
School Enrollment in Pleasant Run
The most common levels of schooling among the 1,159 students in Pleasant Run are elementary school (314 | 27.1%), kindergarten (222 | 19.2%), and high school (211 | 18.2%).
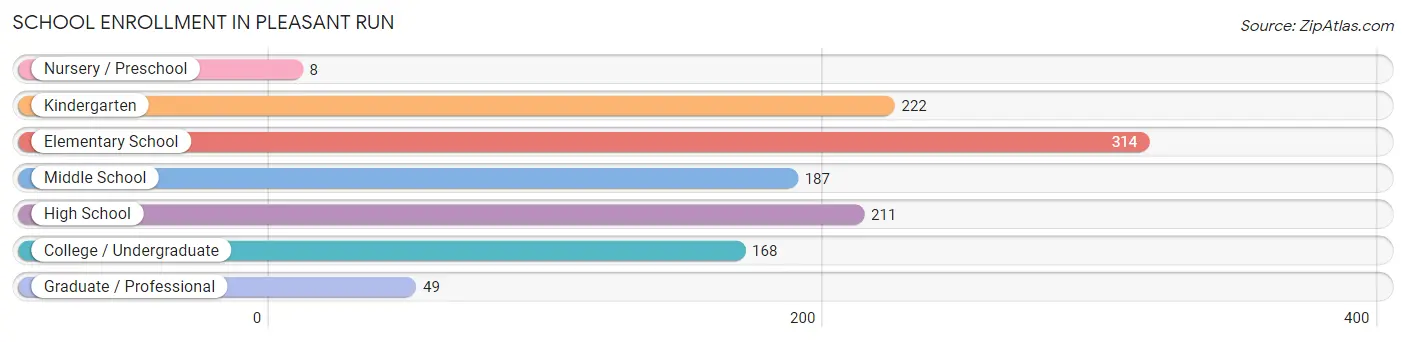
| School Level | # Students | % Students |
| Nursery / Preschool | 8 | 0.7% |
| Kindergarten | 222 | 19.2% |
| Elementary School | 314 | 27.1% |
| Middle School | 187 | 16.1% |
| High School | 211 | 18.2% |
| College / Undergraduate | 168 | 14.5% |
| Graduate / Professional | 49 | 4.2% |
| Total | 1,159 | 100.0% |
School Enrollment by Age by Funding Source in Pleasant Run
Out of a total of 1,159 students who are enrolled in schools in Pleasant Run, 389 (33.6%) attend a private institution, while the remaining 770 (66.4%) are enrolled in public schools. The age group of 25 to 34 year olds has the highest likelihood of being enrolled in private schools, with 56 (100.0% in the age bracket) enrolled. Conversely, the age group of 15 to 17 year olds has the lowest likelihood of being enrolled in a private school, with 126 (100.0% in the age bracket) attending a public institution.
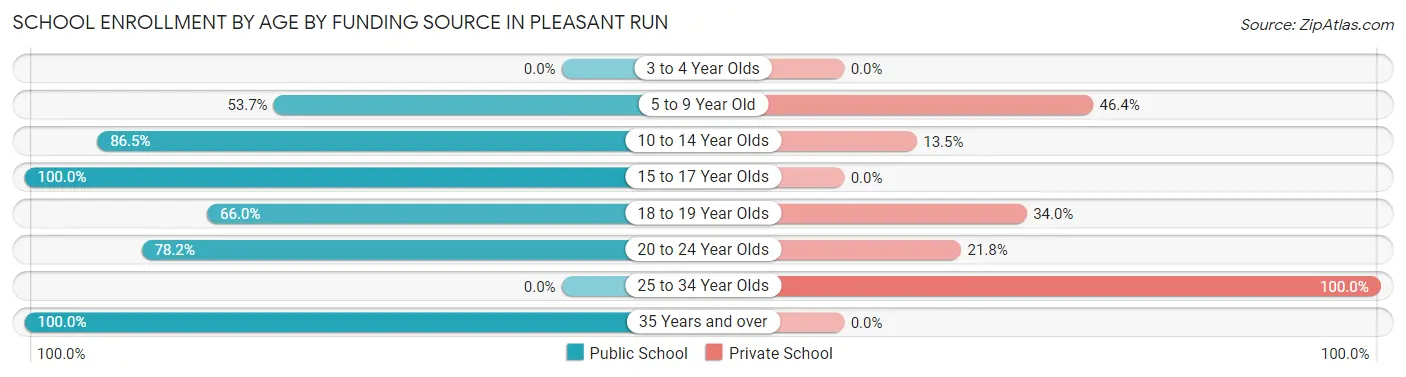
| Age Bracket | Public School | Private School |
| 3 to 4 Year Olds | 0 (0.0%) | 0 (0.0%) |
| 5 to 9 Year Old | 309 (53.6%) | 267 (46.4%) |
| 10 to 14 Year Olds | 179 (86.5%) | 28 (13.5%) |
| 15 to 17 Year Olds | 126 (100.0%) | 0 (0.0%) |
| 18 to 19 Year Olds | 33 (66.0%) | 17 (34.0%) |
| 20 to 24 Year Olds | 79 (78.2%) | 22 (21.8%) |
| 25 to 34 Year Olds | 0 (0.0%) | 56 (100.0%) |
| 35 Years and over | 43 (100.0%) | 0 (0.0%) |
| Total | 770 (66.4%) | 389 (33.6%) |
Educational Attainment by Field of Study in Pleasant Run
Education (208 | 26.4%), science & technology (125 | 15.9%), computers & mathematics (118 | 15.0%), business (102 | 12.9%), and engineering (51 | 6.5%) are the most common fields of study among 788 individuals in Pleasant Run who have obtained a bachelor's degree or higher.
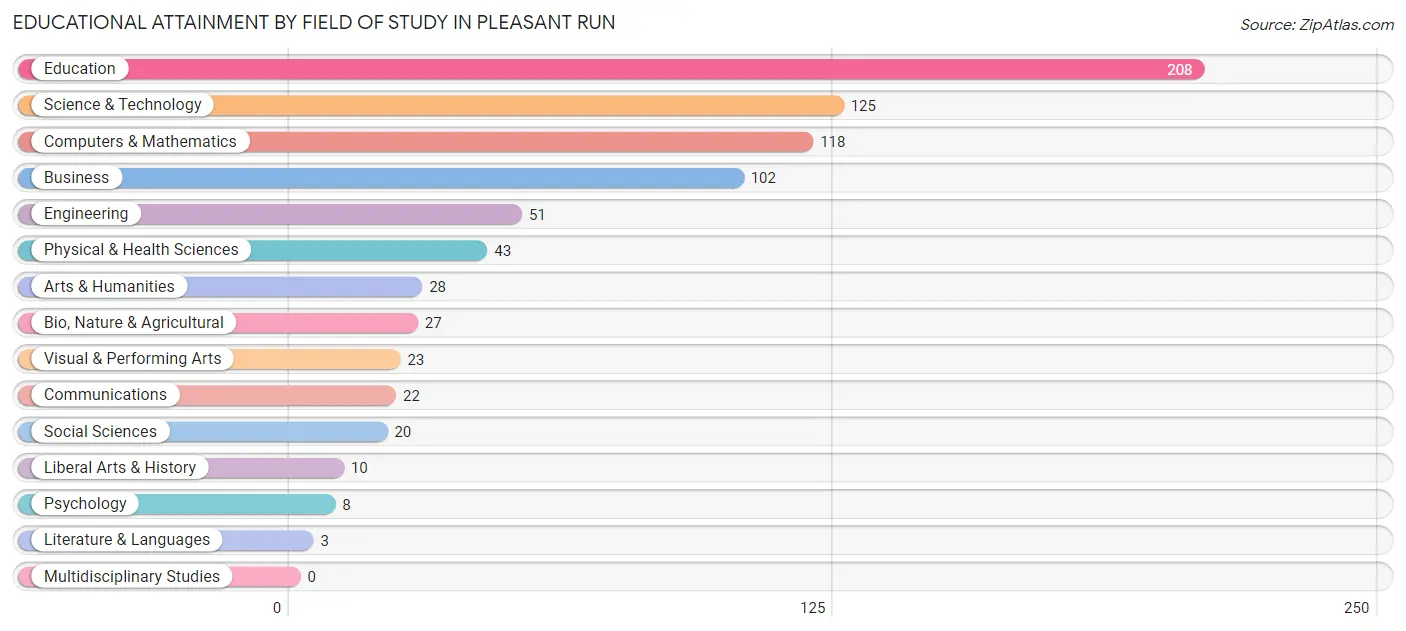
| Field of Study | # Graduates | % Graduates |
| Computers & Mathematics | 118 | 15.0% |
| Bio, Nature & Agricultural | 27 | 3.4% |
| Physical & Health Sciences | 43 | 5.5% |
| Psychology | 8 | 1.0% |
| Social Sciences | 20 | 2.5% |
| Engineering | 51 | 6.5% |
| Multidisciplinary Studies | 0 | 0.0% |
| Science & Technology | 125 | 15.9% |
| Business | 102 | 12.9% |
| Education | 208 | 26.4% |
| Literature & Languages | 3 | 0.4% |
| Liberal Arts & History | 10 | 1.3% |
| Visual & Performing Arts | 23 | 2.9% |
| Communications | 22 | 2.8% |
| Arts & Humanities | 28 | 3.5% |
| Total | 788 | 100.0% |
Transportation & Commute in Pleasant Run
Vehicle Availability by Sex in Pleasant Run
The most prevalent vehicle ownership categories in Pleasant Run are males with 2 vehicles (622, accounting for 58.0%) and females with 2 vehicles (746, making up 37.7%).
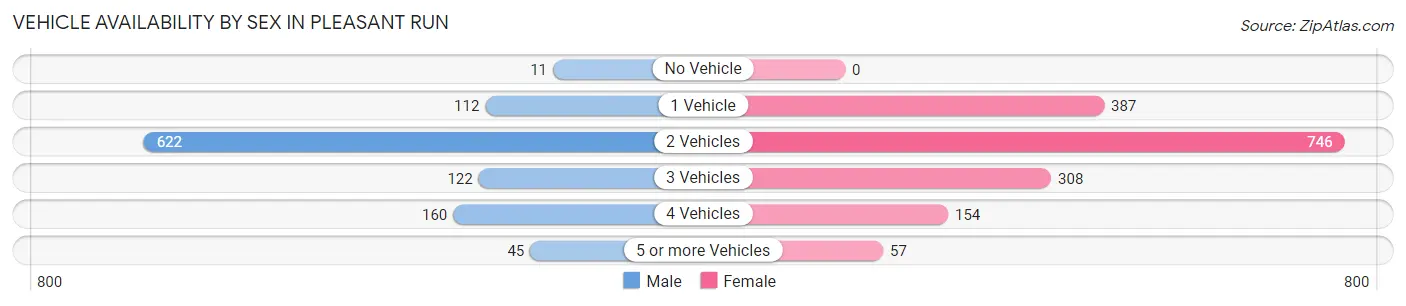
| Vehicles Available | Male | Female |
| No Vehicle | 11 (1.0%) | 0 (0.0%) |
| 1 Vehicle | 112 (10.4%) | 387 (23.4%) |
| 2 Vehicles | 622 (58.0%) | 746 (45.2%) |
| 3 Vehicles | 122 (11.4%) | 308 (18.6%) |
| 4 Vehicles | 160 (14.9%) | 154 (9.3%) |
| 5 or more Vehicles | 45 (4.2%) | 57 (3.5%) |
| Total | 1,072 (100.0%) | 1,652 (100.0%) |
Commute Time in Pleasant Run
The most frequently occuring commute durations in Pleasant Run are 20 to 24 minutes (444 commuters, 21.0%), 15 to 19 minutes (427 commuters, 20.3%), and 30 to 34 minutes (333 commuters, 15.8%).
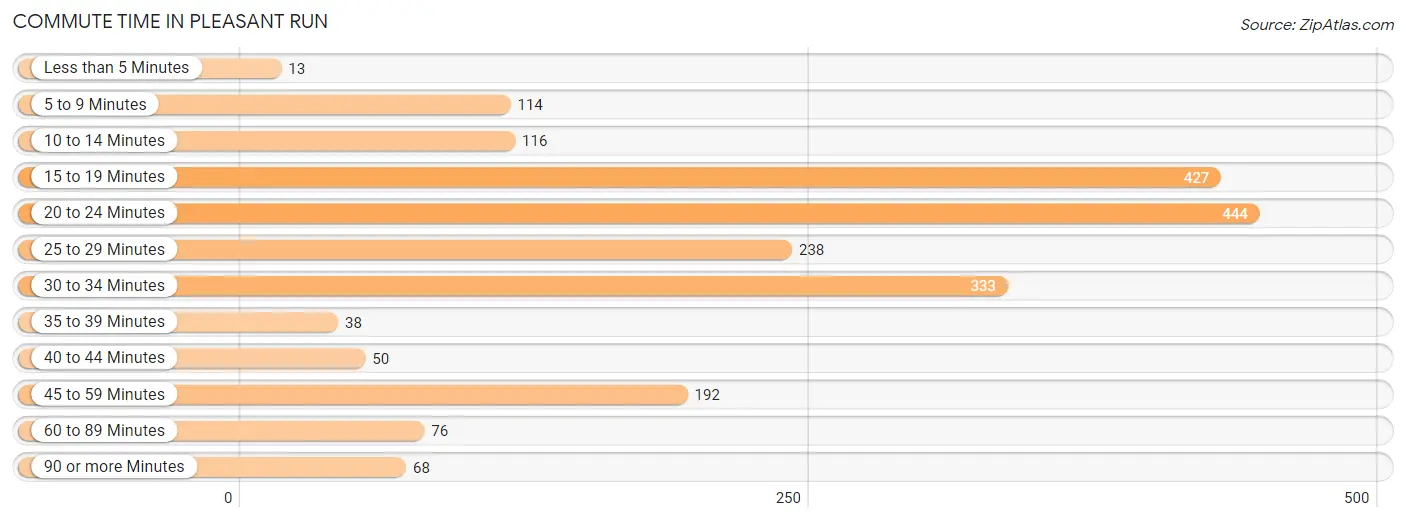
| Commute Time | # Commuters | % Commuters |
| Less than 5 Minutes | 13 | 0.6% |
| 5 to 9 Minutes | 114 | 5.4% |
| 10 to 14 Minutes | 116 | 5.5% |
| 15 to 19 Minutes | 427 | 20.3% |
| 20 to 24 Minutes | 444 | 21.0% |
| 25 to 29 Minutes | 238 | 11.3% |
| 30 to 34 Minutes | 333 | 15.8% |
| 35 to 39 Minutes | 38 | 1.8% |
| 40 to 44 Minutes | 50 | 2.4% |
| 45 to 59 Minutes | 192 | 9.1% |
| 60 to 89 Minutes | 76 | 3.6% |
| 90 or more Minutes | 68 | 3.2% |
Commute Time by Sex in Pleasant Run
The most common commute times in Pleasant Run are 30 to 34 minutes (206 commuters, 22.1%) for males and 15 to 19 minutes (333 commuters, 28.3%) for females.
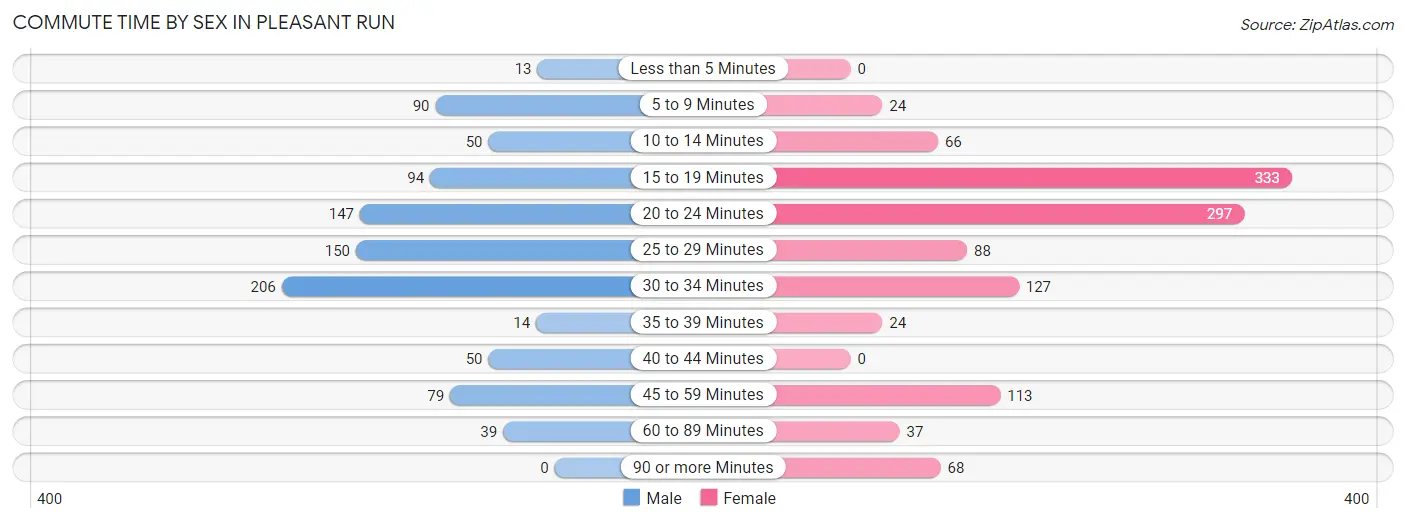
| Commute Time | Male | Female |
| Less than 5 Minutes | 13 (1.4%) | 0 (0.0%) |
| 5 to 9 Minutes | 90 (9.7%) | 24 (2.0%) |
| 10 to 14 Minutes | 50 (5.4%) | 66 (5.6%) |
| 15 to 19 Minutes | 94 (10.1%) | 333 (28.3%) |
| 20 to 24 Minutes | 147 (15.8%) | 297 (25.2%) |
| 25 to 29 Minutes | 150 (16.1%) | 88 (7.5%) |
| 30 to 34 Minutes | 206 (22.1%) | 127 (10.8%) |
| 35 to 39 Minutes | 14 (1.5%) | 24 (2.0%) |
| 40 to 44 Minutes | 50 (5.4%) | 0 (0.0%) |
| 45 to 59 Minutes | 79 (8.5%) | 113 (9.6%) |
| 60 to 89 Minutes | 39 (4.2%) | 37 (3.1%) |
| 90 or more Minutes | 0 (0.0%) | 68 (5.8%) |
Time of Departure to Work by Sex in Pleasant Run
The most frequent times of departure to work in Pleasant Run are 12:00 PM to 3:59 PM (170, 18.2%) for males and 7:30 AM to 7:59 AM (301, 25.6%) for females.
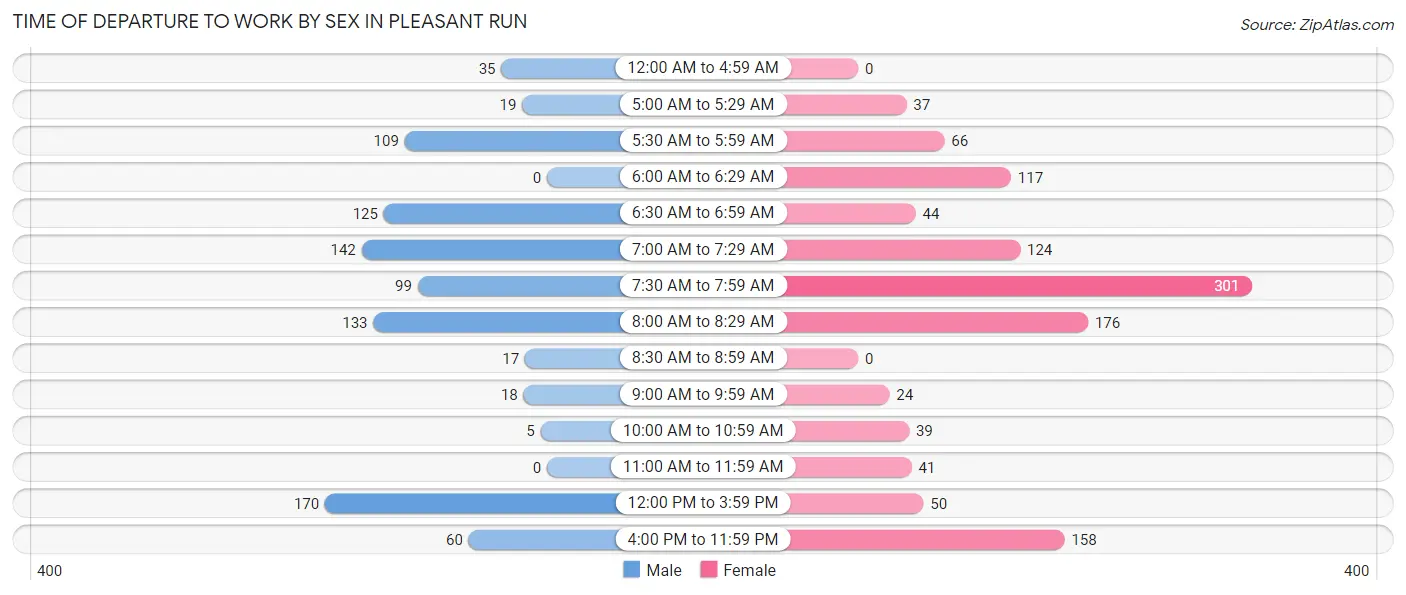
| Time of Departure | Male | Female |
| 12:00 AM to 4:59 AM | 35 (3.8%) | 0 (0.0%) |
| 5:00 AM to 5:29 AM | 19 (2.0%) | 37 (3.1%) |
| 5:30 AM to 5:59 AM | 109 (11.7%) | 66 (5.6%) |
| 6:00 AM to 6:29 AM | 0 (0.0%) | 117 (9.9%) |
| 6:30 AM to 6:59 AM | 125 (13.4%) | 44 (3.7%) |
| 7:00 AM to 7:29 AM | 142 (15.2%) | 124 (10.5%) |
| 7:30 AM to 7:59 AM | 99 (10.6%) | 301 (25.6%) |
| 8:00 AM to 8:29 AM | 133 (14.3%) | 176 (14.9%) |
| 8:30 AM to 8:59 AM | 17 (1.8%) | 0 (0.0%) |
| 9:00 AM to 9:59 AM | 18 (1.9%) | 24 (2.0%) |
| 10:00 AM to 10:59 AM | 5 (0.5%) | 39 (3.3%) |
| 11:00 AM to 11:59 AM | 0 (0.0%) | 41 (3.5%) |
| 12:00 PM to 3:59 PM | 170 (18.2%) | 50 (4.3%) |
| 4:00 PM to 11:59 PM | 60 (6.4%) | 158 (13.4%) |
| Total | 932 (100.0%) | 1,177 (100.0%) |
Housing Occupancy in Pleasant Run
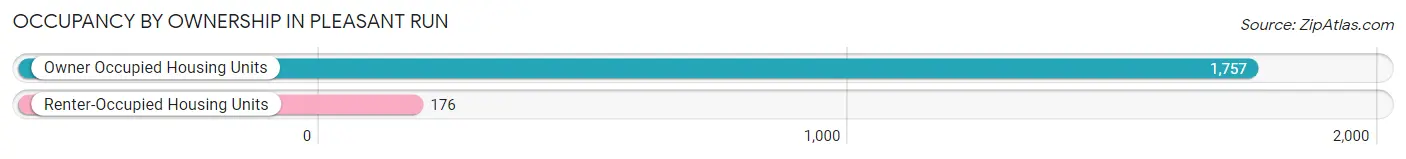
Occupancy by Ownership in Pleasant Run
Of the total 1,933 dwellings in Pleasant Run, owner-occupied units account for 1,757 (90.9%), while renter-occupied units make up 176 (9.1%).
| Occupancy | # Housing Units | % Housing Units |
| Owner Occupied Housing Units | 1,757 | 90.9% |
| Renter-Occupied Housing Units | 176 | 9.1% |
| Total Occupied Housing Units | 1,933 | 100.0% |
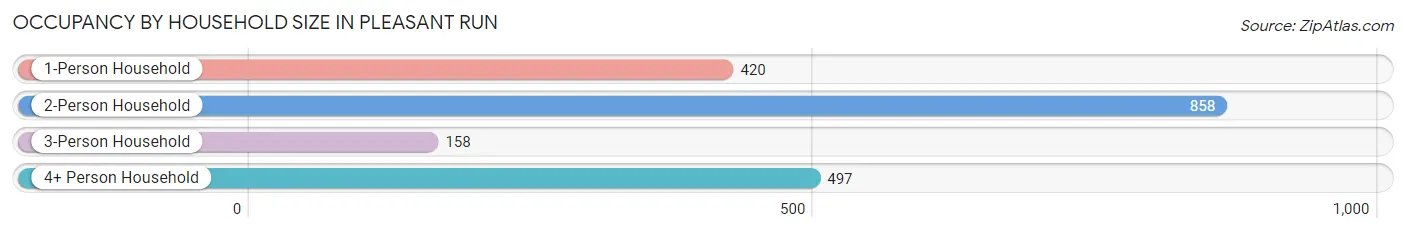
Occupancy by Household Size in Pleasant Run
| Household Size | # Housing Units | % Housing Units |
| 1-Person Household | 420 | 21.7% |
| 2-Person Household | 858 | 44.4% |
| 3-Person Household | 158 | 8.2% |
| 4+ Person Household | 497 | 25.7% |
| Total Housing Units | 1,933 | 100.0% |
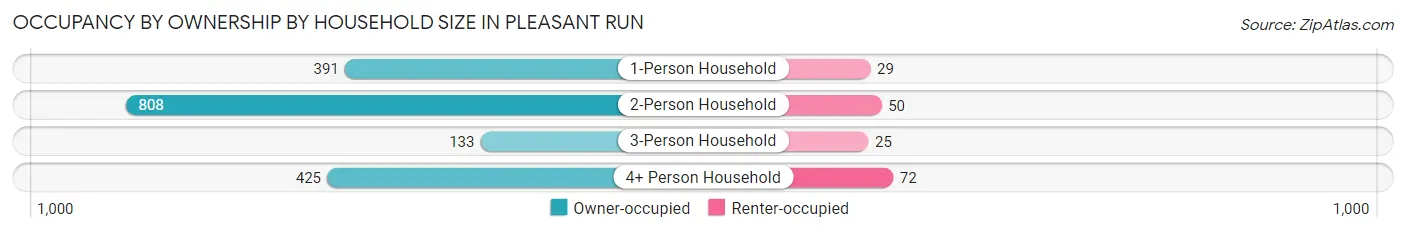
Occupancy by Ownership by Household Size in Pleasant Run
| Household Size | Owner-occupied | Renter-occupied |
| 1-Person Household | 391 (93.1%) | 29 (6.9%) |
| 2-Person Household | 808 (94.2%) | 50 (5.8%) |
| 3-Person Household | 133 (84.2%) | 25 (15.8%) |
| 4+ Person Household | 425 (85.5%) | 72 (14.5%) |
| Total Housing Units | 1,757 (90.9%) | 176 (9.1%) |
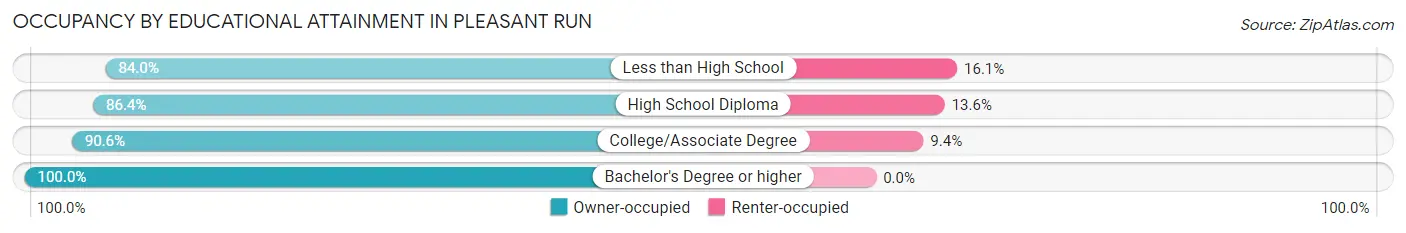
Occupancy by Educational Attainment in Pleasant Run
| Household Size | Owner-occupied | Renter-occupied |
| Less than High School | 136 (84.0%) | 26 (16.1%) |
| High School Diploma | 674 (86.4%) | 106 (13.6%) |
| College/Associate Degree | 426 (90.6%) | 44 (9.4%) |
| Bachelor's Degree or higher | 521 (100.0%) | 0 (0.0%) |
Occupancy by Age of Householder in Pleasant Run
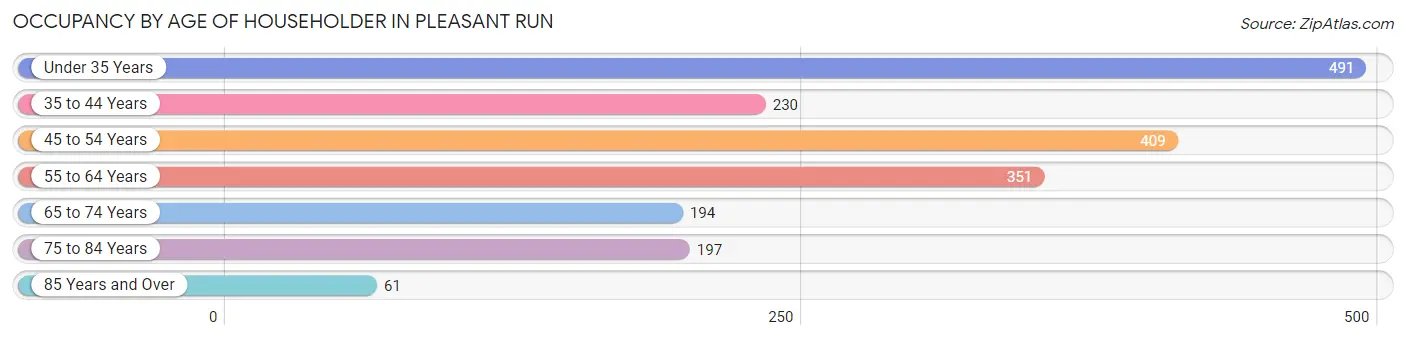
| Age Bracket | # Households | % Households |
| Under 35 Years | 491 | 25.4% |
| 35 to 44 Years | 230 | 11.9% |
| 45 to 54 Years | 409 | 21.2% |
| 55 to 64 Years | 351 | 18.2% |
| 65 to 74 Years | 194 | 10.0% |
| 75 to 84 Years | 197 | 10.2% |
| 85 Years and Over | 61 | 3.2% |
| Total | 1,933 | 100.0% |
Housing Finances in Pleasant Run
Median Income by Occupancy in Pleasant Run
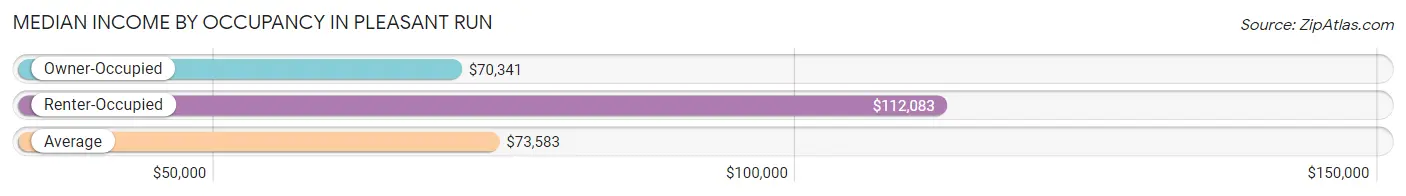
| Occupancy Type | # Households | Median Income |
| Owner-Occupied | 1,757 (90.9%) | $70,341 |
| Renter-Occupied | 176 (9.1%) | $112,083 |
| Average | 1,933 (100.0%) | $73,583 |
Occupancy by Householder Income Bracket in Pleasant Run
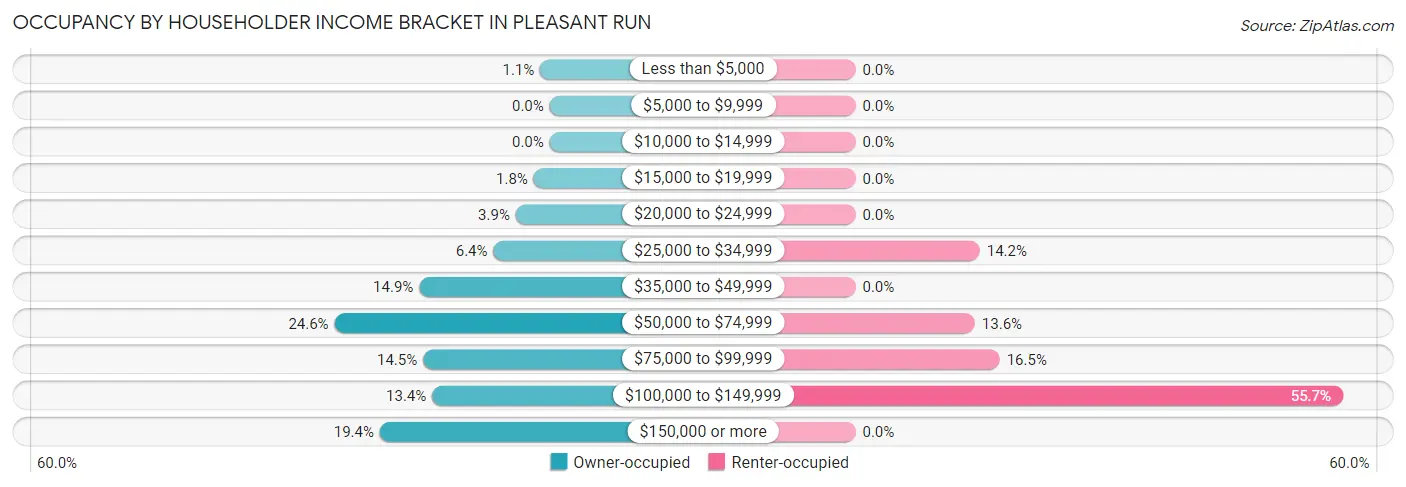
| Income Bracket | Owner-occupied | Renter-occupied |
| Less than $5,000 | 19 (1.1%) | 0 (0.0%) |
| $5,000 to $9,999 | 0 (0.0%) | 0 (0.0%) |
| $10,000 to $14,999 | 0 (0.0%) | 0 (0.0%) |
| $15,000 to $19,999 | 32 (1.8%) | 0 (0.0%) |
| $20,000 to $24,999 | 68 (3.9%) | 0 (0.0%) |
| $25,000 to $34,999 | 113 (6.4%) | 25 (14.2%) |
| $35,000 to $49,999 | 262 (14.9%) | 0 (0.0%) |
| $50,000 to $74,999 | 432 (24.6%) | 24 (13.6%) |
| $75,000 to $99,999 | 254 (14.5%) | 29 (16.5%) |
| $100,000 to $149,999 | 236 (13.4%) | 98 (55.7%) |
| $150,000 or more | 341 (19.4%) | 0 (0.0%) |
| Total | 1,757 (100.0%) | 176 (100.0%) |
Monthly Housing Cost Tiers in Pleasant Run
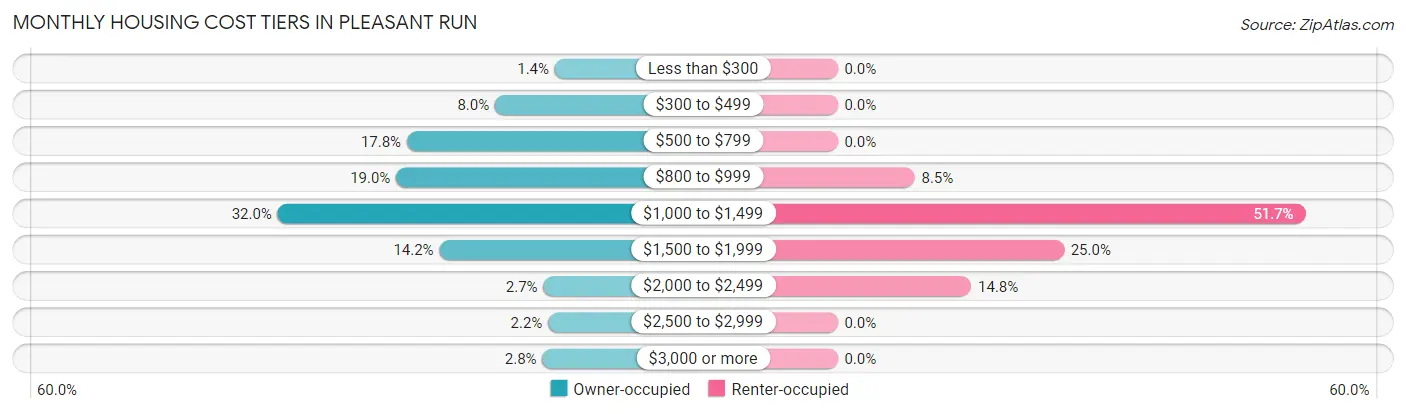
| Monthly Cost | Owner-occupied | Renter-occupied |
| Less than $300 | 25 (1.4%) | 0 (0.0%) |
| $300 to $499 | 141 (8.0%) | 0 (0.0%) |
| $500 to $799 | 312 (17.8%) | 0 (0.0%) |
| $800 to $999 | 333 (19.0%) | 15 (8.5%) |
| $1,000 to $1,499 | 563 (32.0%) | 91 (51.7%) |
| $1,500 to $1,999 | 249 (14.2%) | 44 (25.0%) |
| $2,000 to $2,499 | 47 (2.7%) | 26 (14.8%) |
| $2,500 to $2,999 | 38 (2.2%) | 0 (0.0%) |
| $3,000 or more | 49 (2.8%) | 0 (0.0%) |
| Total | 1,757 (100.0%) | 176 (100.0%) |
Physical Housing Characteristics in Pleasant Run
Housing Structures in Pleasant Run
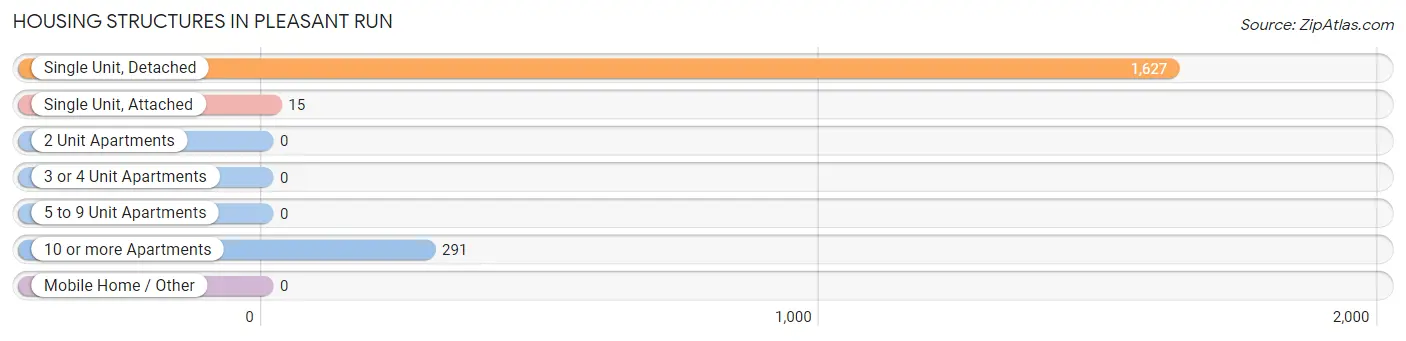
| Structure Type | # Housing Units | % Housing Units |
| Single Unit, Detached | 1,627 | 84.2% |
| Single Unit, Attached | 15 | 0.8% |
| 2 Unit Apartments | 0 | 0.0% |
| 3 or 4 Unit Apartments | 0 | 0.0% |
| 5 to 9 Unit Apartments | 0 | 0.0% |
| 10 or more Apartments | 291 | 15.0% |
| Mobile Home / Other | 0 | 0.0% |
| Total | 1,933 | 100.0% |
Housing Structures by Occupancy in Pleasant Run
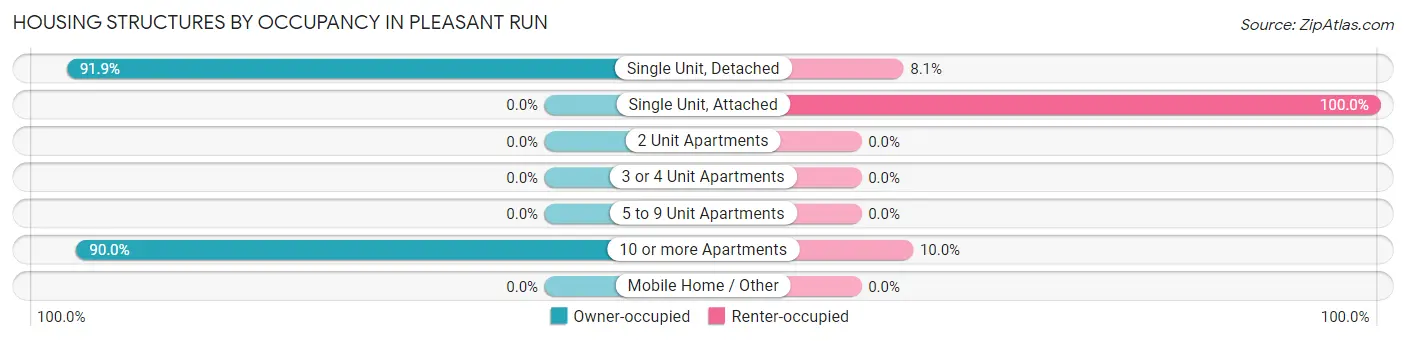
| Structure Type | Owner-occupied | Renter-occupied |
| Single Unit, Detached | 1,495 (91.9%) | 132 (8.1%) |
| Single Unit, Attached | 0 (0.0%) | 15 (100.0%) |
| 2 Unit Apartments | 0 (0.0%) | 0 (0.0%) |
| 3 or 4 Unit Apartments | 0 (0.0%) | 0 (0.0%) |
| 5 to 9 Unit Apartments | 0 (0.0%) | 0 (0.0%) |
| 10 or more Apartments | 262 (90.0%) | 29 (10.0%) |
| Mobile Home / Other | 0 (0.0%) | 0 (0.0%) |
| Total | 1,757 (90.9%) | 176 (9.1%) |
Housing Structures by Number of Rooms in Pleasant Run
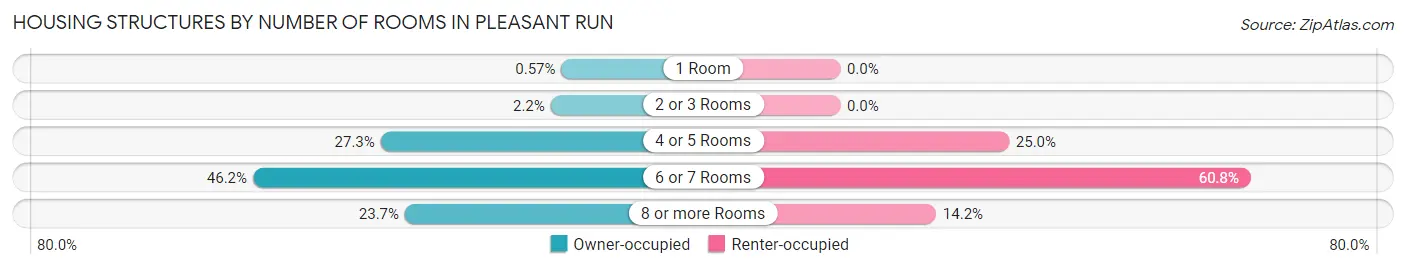
| Number of Rooms | Owner-occupied | Renter-occupied |
| 1 Room | 10 (0.6%) | 0 (0.0%) |
| 2 or 3 Rooms | 38 (2.2%) | 0 (0.0%) |
| 4 or 5 Rooms | 480 (27.3%) | 44 (25.0%) |
| 6 or 7 Rooms | 812 (46.2%) | 107 (60.8%) |
| 8 or more Rooms | 417 (23.7%) | 25 (14.2%) |
| Total | 1,757 (100.0%) | 176 (100.0%) |
Housing Structure by Heating Type in Pleasant Run
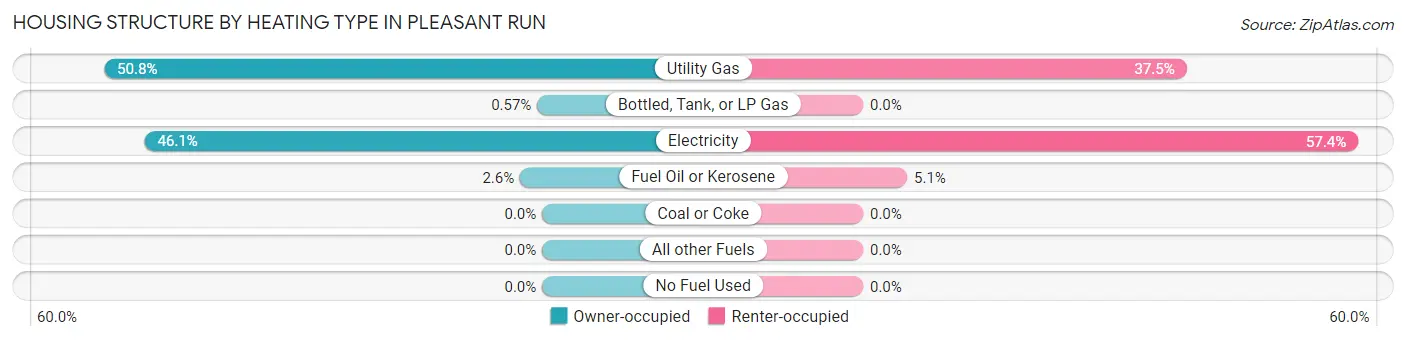
| Heating Type | Owner-occupied | Renter-occupied |
| Utility Gas | 892 (50.8%) | 66 (37.5%) |
| Bottled, Tank, or LP Gas | 10 (0.6%) | 0 (0.0%) |
| Electricity | 810 (46.1%) | 101 (57.4%) |
| Fuel Oil or Kerosene | 45 (2.6%) | 9 (5.1%) |
| Coal or Coke | 0 (0.0%) | 0 (0.0%) |
| All other Fuels | 0 (0.0%) | 0 (0.0%) |
| No Fuel Used | 0 (0.0%) | 0 (0.0%) |
| Total | 1,757 (100.0%) | 176 (100.0%) |
Household Vehicle Usage in Pleasant Run
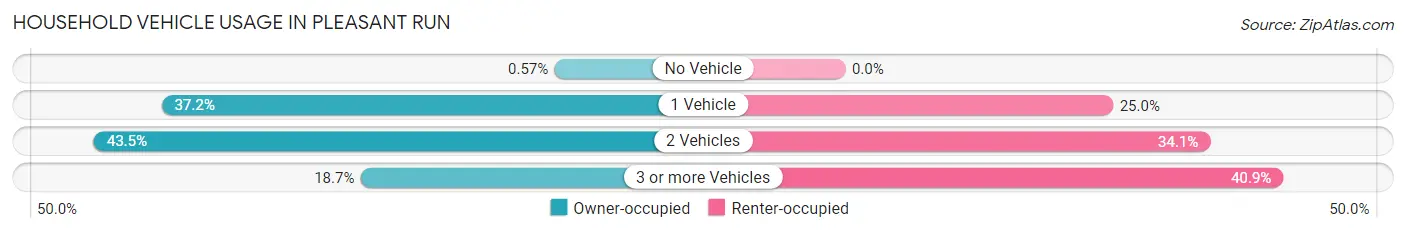
| Vehicles per Household | Owner-occupied | Renter-occupied |
| No Vehicle | 10 (0.6%) | 0 (0.0%) |
| 1 Vehicle | 654 (37.2%) | 44 (25.0%) |
| 2 Vehicles | 765 (43.5%) | 60 (34.1%) |
| 3 or more Vehicles | 328 (18.7%) | 72 (40.9%) |
| Total | 1,757 (100.0%) | 176 (100.0%) |
Real Estate & Mortgages in Pleasant Run
Real Estate and Mortgage Overview in Pleasant Run
| Characteristic | Without Mortgage | With Mortgage |
| Housing Units | 415 | 1,342 |
| Median Property Value | $190,000 | $154,900 |
| Median Household Income | $65,266 | $289 |
| Monthly Housing Costs | $571 | $27 |
| Real Estate Taxes | $2,768 | $0 |
Property Value by Mortgage Status in Pleasant Run
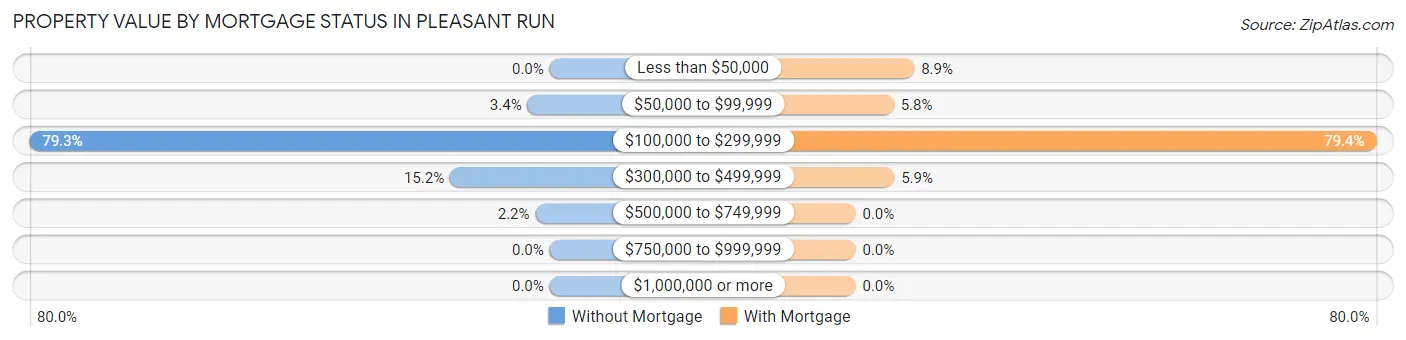
| Property Value | Without Mortgage | With Mortgage |
| Less than $50,000 | 0 (0.0%) | 120 (8.9%) |
| $50,000 to $99,999 | 14 (3.4%) | 78 (5.8%) |
| $100,000 to $299,999 | 329 (79.3%) | 1,065 (79.4%) |
| $300,000 to $499,999 | 63 (15.2%) | 79 (5.9%) |
| $500,000 to $749,999 | 9 (2.2%) | 0 (0.0%) |
| $750,000 to $999,999 | 0 (0.0%) | 0 (0.0%) |
| $1,000,000 or more | 0 (0.0%) | 0 (0.0%) |
| Total | 415 (100.0%) | 1,342 (100.0%) |
Household Income by Mortgage Status in Pleasant Run
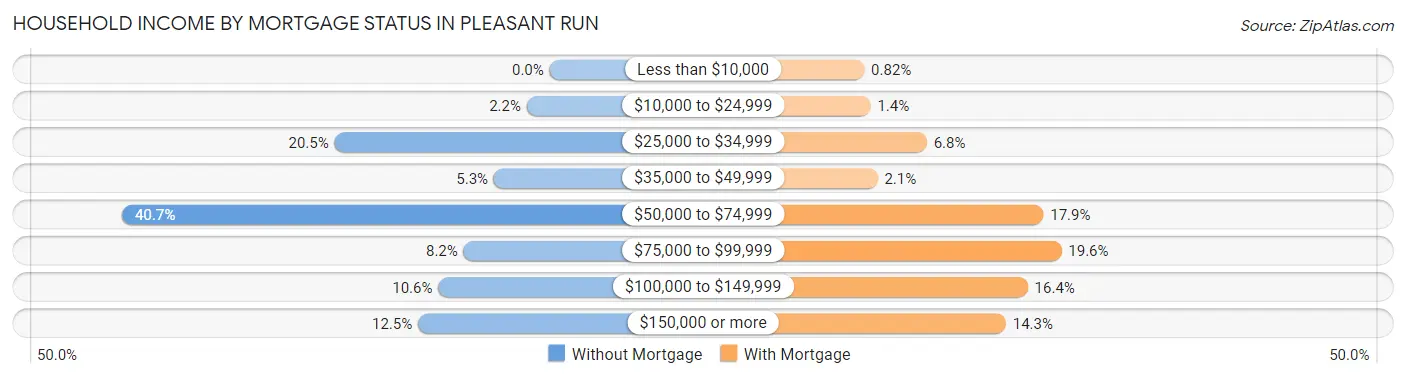
| Household Income | Without Mortgage | With Mortgage |
| Less than $10,000 | 0 (0.0%) | 11 (0.8%) |
| $10,000 to $24,999 | 9 (2.2%) | 19 (1.4%) |
| $25,000 to $34,999 | 85 (20.5%) | 91 (6.8%) |
| $35,000 to $49,999 | 22 (5.3%) | 28 (2.1%) |
| $50,000 to $74,999 | 169 (40.7%) | 240 (17.9%) |
| $75,000 to $99,999 | 34 (8.2%) | 263 (19.6%) |
| $100,000 to $149,999 | 44 (10.6%) | 220 (16.4%) |
| $150,000 or more | 52 (12.5%) | 192 (14.3%) |
| Total | 415 (100.0%) | 1,342 (100.0%) |
Property Value to Household Income Ratio in Pleasant Run
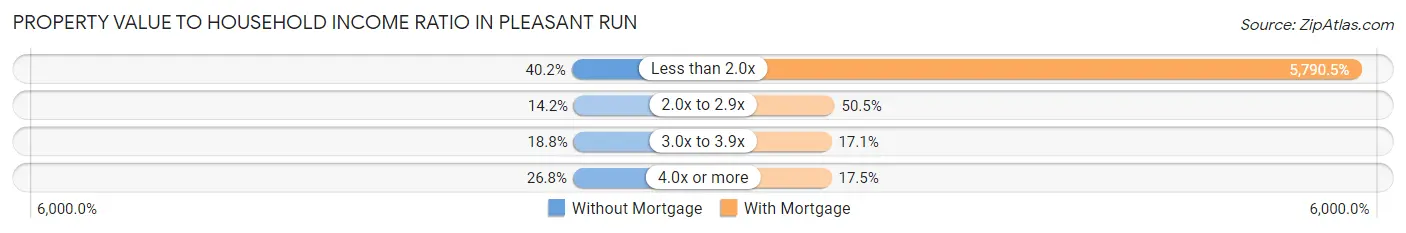
| Value-to-Income Ratio | Without Mortgage | With Mortgage |
| Less than 2.0x | 167 (40.2%) | 77,708 (5,790.5%) |
| 2.0x to 2.9x | 59 (14.2%) | 678 (50.5%) |
| 3.0x to 3.9x | 78 (18.8%) | 229 (17.1%) |
| 4.0x or more | 111 (26.8%) | 235 (17.5%) |
| Total | 415 (100.0%) | 1,342 (100.0%) |
Real Estate Taxes by Mortgage Status in Pleasant Run
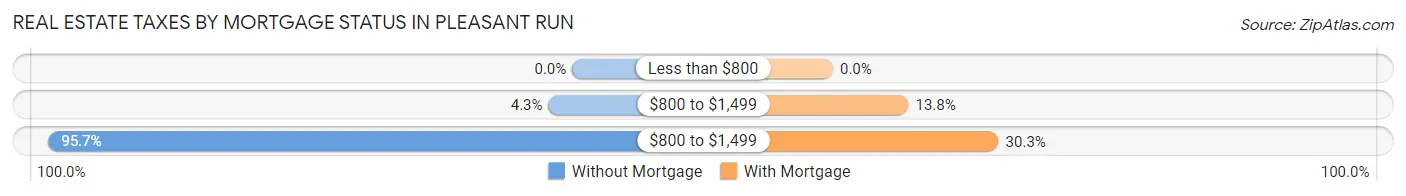
| Property Taxes | Without Mortgage | With Mortgage |
| Less than $800 | 0 (0.0%) | 0 (0.0%) |
| $800 to $1,499 | 18 (4.3%) | 185 (13.8%) |
| $800 to $1,499 | 397 (95.7%) | 406 (30.2%) |
| Total | 415 (100.0%) | 1,342 (100.0%) |
Health & Disability in Pleasant Run
Health Insurance Coverage by Age in Pleasant Run
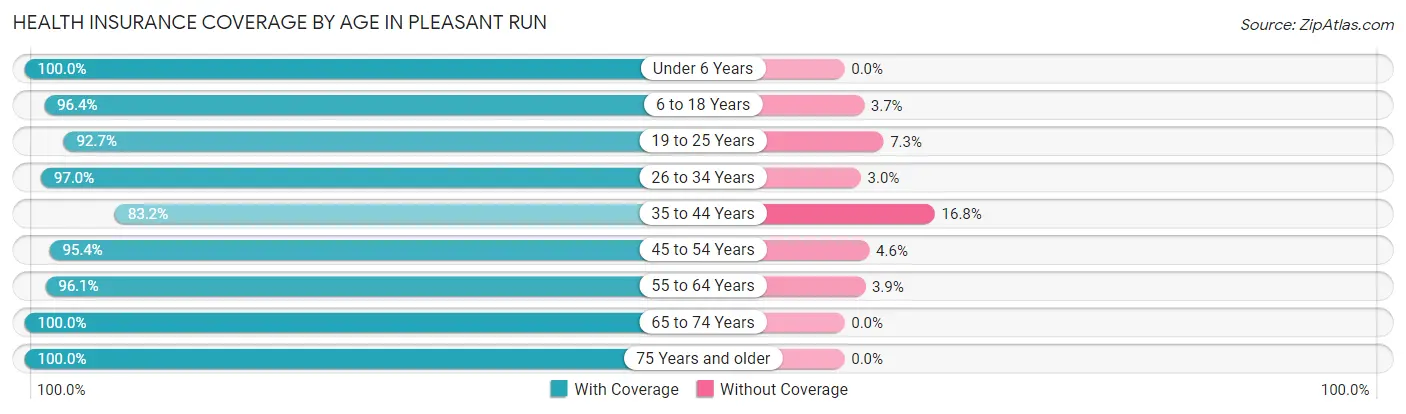
| Age Bracket | With Coverage | Without Coverage |
| Under 6 Years | 483 (100.0%) | 0 (0.0%) |
| 6 to 18 Years | 686 (96.4%) | 26 (3.6%) |
| 19 to 25 Years | 396 (92.7%) | 31 (7.3%) |
| 26 to 34 Years | 701 (97.0%) | 22 (3.0%) |
| 35 to 44 Years | 469 (83.2%) | 95 (16.8%) |
| 45 to 54 Years | 657 (95.4%) | 32 (4.6%) |
| 55 to 64 Years | 822 (96.1%) | 33 (3.9%) |
| 65 to 74 Years | 318 (100.0%) | 0 (0.0%) |
| 75 Years and older | 380 (100.0%) | 0 (0.0%) |
| Total | 4,912 (95.4%) | 239 (4.6%) |
Health Insurance Coverage by Citizenship Status in Pleasant Run
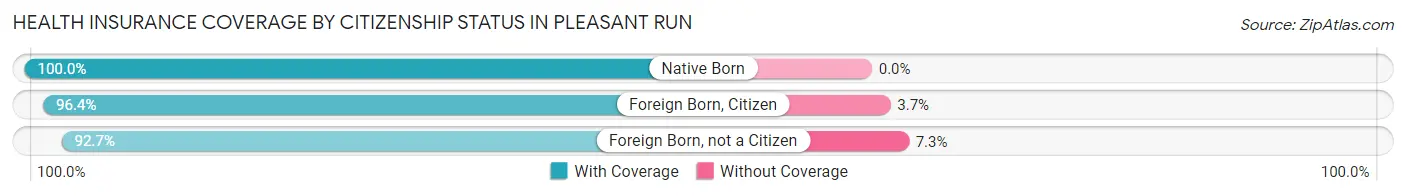
| Citizenship Status | With Coverage | Without Coverage |
| Native Born | 483 (100.0%) | 0 (0.0%) |
| Foreign Born, Citizen | 686 (96.4%) | 26 (3.6%) |
| Foreign Born, not a Citizen | 396 (92.7%) | 31 (7.3%) |
Health Insurance Coverage by Household Income in Pleasant Run
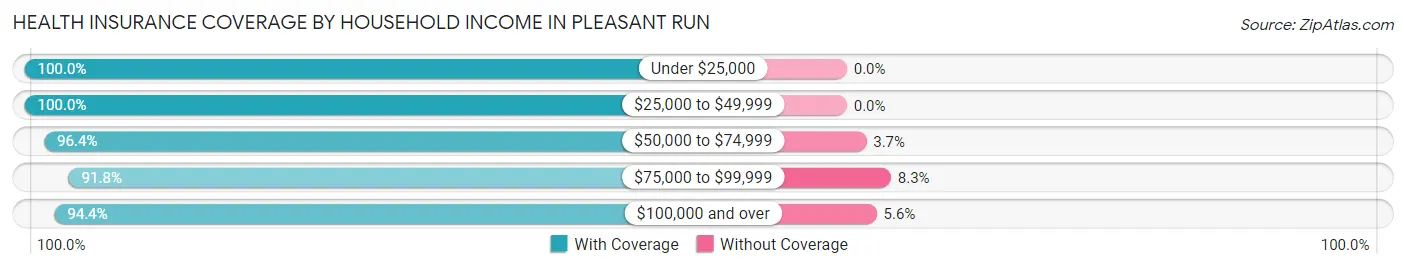
| Household Income | With Coverage | Without Coverage |
| Under $25,000 | 119 (100.0%) | 0 (0.0%) |
| $25,000 to $49,999 | 840 (100.0%) | 0 (0.0%) |
| $50,000 to $74,999 | 818 (96.4%) | 31 (3.6%) |
| $75,000 to $99,999 | 634 (91.7%) | 57 (8.3%) |
| $100,000 and over | 2,487 (94.4%) | 147 (5.6%) |
Public vs Private Health Insurance Coverage by Age in Pleasant Run
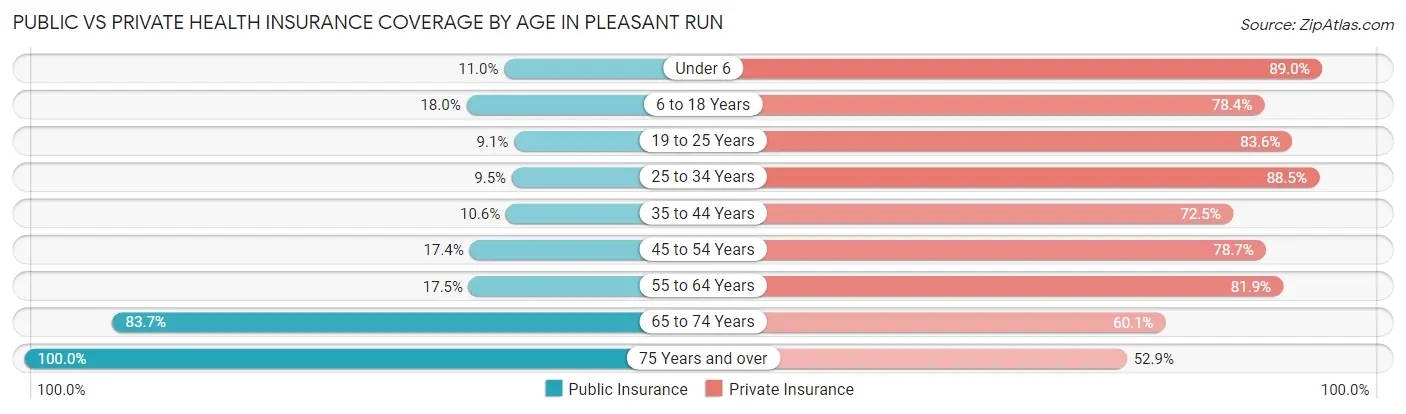
| Age Bracket | Public Insurance | Private Insurance |
| Under 6 | 53 (11.0%) | 430 (89.0%) |
| 6 to 18 Years | 128 (18.0%) | 558 (78.4%) |
| 19 to 25 Years | 39 (9.1%) | 357 (83.6%) |
| 25 to 34 Years | 69 (9.5%) | 640 (88.5%) |
| 35 to 44 Years | 60 (10.6%) | 409 (72.5%) |
| 45 to 54 Years | 120 (17.4%) | 542 (78.7%) |
| 55 to 64 Years | 150 (17.5%) | 700 (81.9%) |
| 65 to 74 Years | 266 (83.7%) | 191 (60.1%) |
| 75 Years and over | 380 (100.0%) | 201 (52.9%) |
| Total | 1,265 (24.6%) | 4,028 (78.2%) |
Disability Status by Sex by Age in Pleasant Run
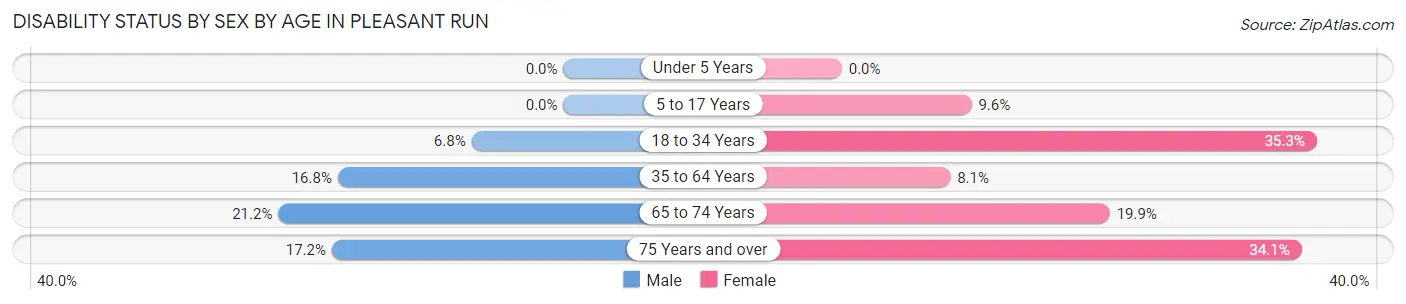
| Age Bracket | Male | Female |
| Under 5 Years | 0 (0.0%) | 0 (0.0%) |
| 5 to 17 Years | 0 (0.0%) | 42 (9.6%) |
| 18 to 34 Years | 30 (6.8%) | 262 (35.3%) |
| 35 to 64 Years | 168 (16.8%) | 89 (8.1%) |
| 65 to 74 Years | 29 (21.2%) | 36 (19.9%) |
| 75 Years and over | 22 (17.2%) | 86 (34.1%) |
Disability Class by Sex by Age in Pleasant Run
Disability Class: Hearing Difficulty
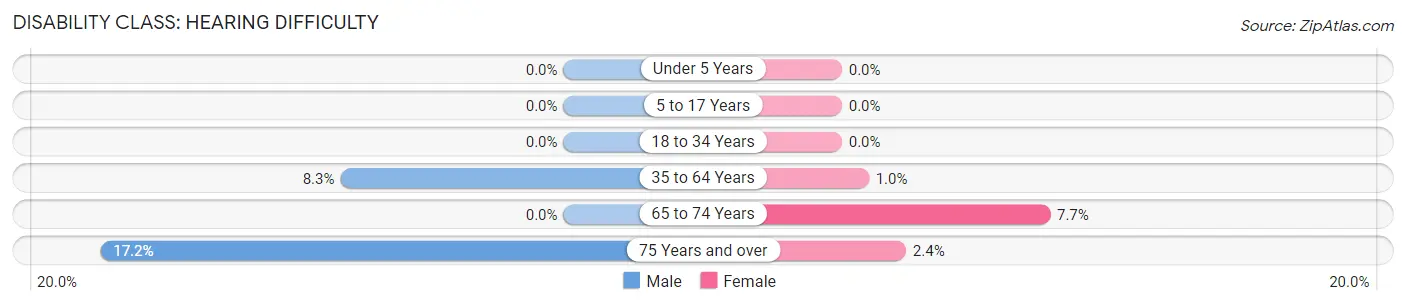
| Age Bracket | Male | Female |
| Under 5 Years | 0 (0.0%) | 0 (0.0%) |
| 5 to 17 Years | 0 (0.0%) | 0 (0.0%) |
| 18 to 34 Years | 0 (0.0%) | 0 (0.0%) |
| 35 to 64 Years | 83 (8.3%) | 11 (1.0%) |
| 65 to 74 Years | 0 (0.0%) | 14 (7.7%) |
| 75 Years and over | 22 (17.2%) | 6 (2.4%) |
Disability Class: Vision Difficulty
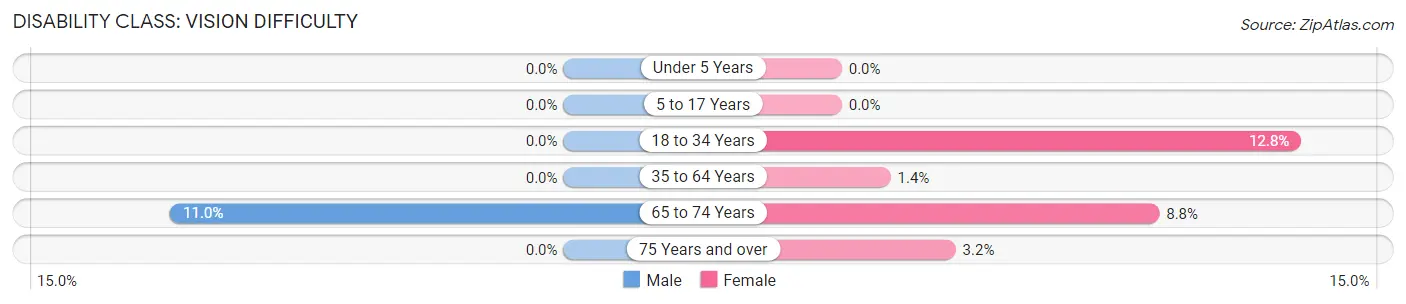
| Age Bracket | Male | Female |
| Under 5 Years | 0 (0.0%) | 0 (0.0%) |
| 5 to 17 Years | 0 (0.0%) | 0 (0.0%) |
| 18 to 34 Years | 0 (0.0%) | 95 (12.8%) |
| 35 to 64 Years | 0 (0.0%) | 15 (1.4%) |
| 65 to 74 Years | 15 (11.0%) | 16 (8.8%) |
| 75 Years and over | 0 (0.0%) | 8 (3.2%) |
Disability Class: Cognitive Difficulty
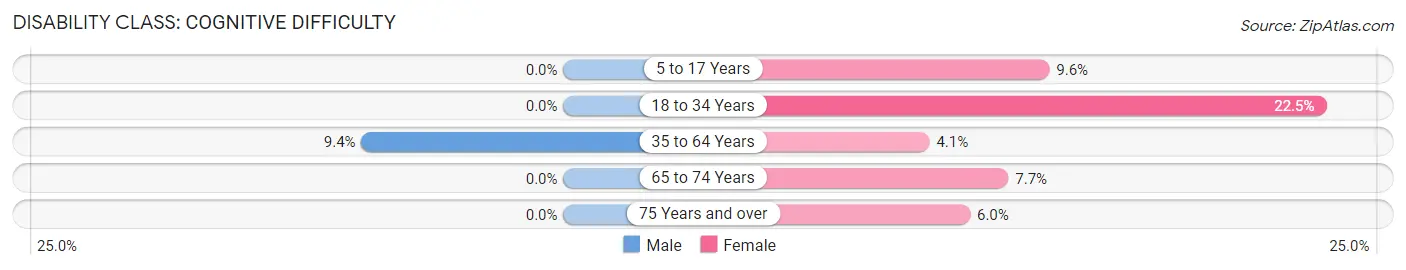
| Age Bracket | Male | Female |
| 5 to 17 Years | 0 (0.0%) | 42 (9.6%) |
| 18 to 34 Years | 0 (0.0%) | 167 (22.5%) |
| 35 to 64 Years | 94 (9.4%) | 45 (4.1%) |
| 65 to 74 Years | 0 (0.0%) | 14 (7.7%) |
| 75 Years and over | 0 (0.0%) | 15 (5.9%) |
Disability Class: Ambulatory Difficulty
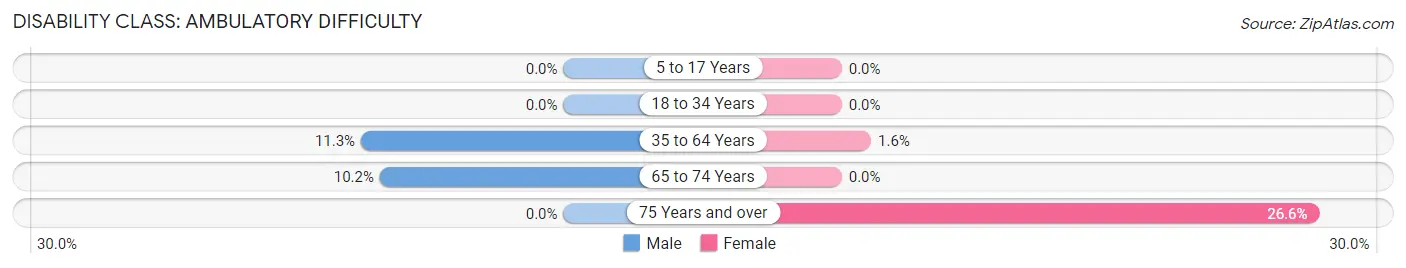
| Age Bracket | Male | Female |
| 5 to 17 Years | 0 (0.0%) | 0 (0.0%) |
| 18 to 34 Years | 0 (0.0%) | 0 (0.0%) |
| 35 to 64 Years | 113 (11.3%) | 18 (1.6%) |
| 65 to 74 Years | 14 (10.2%) | 0 (0.0%) |
| 75 Years and over | 0 (0.0%) | 67 (26.6%) |
Disability Class: Self-Care Difficulty

| Age Bracket | Male | Female |
| 5 to 17 Years | 0 (0.0%) | 0 (0.0%) |
| 18 to 34 Years | 0 (0.0%) | 0 (0.0%) |
| 35 to 64 Years | 44 (4.4%) | 0 (0.0%) |
| 65 to 74 Years | 14 (10.2%) | 6 (3.3%) |
| 75 Years and over | 0 (0.0%) | 27 (10.7%) |
Technology Access in Pleasant Run
Computing Device Access in Pleasant Run
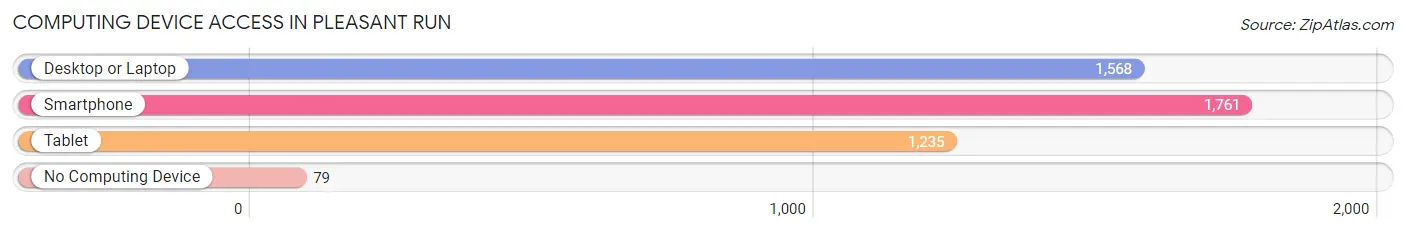
| Device Type | # Households | % Households |
| Desktop or Laptop | 1,568 | 81.1% |
| Smartphone | 1,761 | 91.1% |
| Tablet | 1,235 | 63.9% |
| No Computing Device | 79 | 4.1% |
| Total | 1,933 | 100.0% |
Internet Access in Pleasant Run
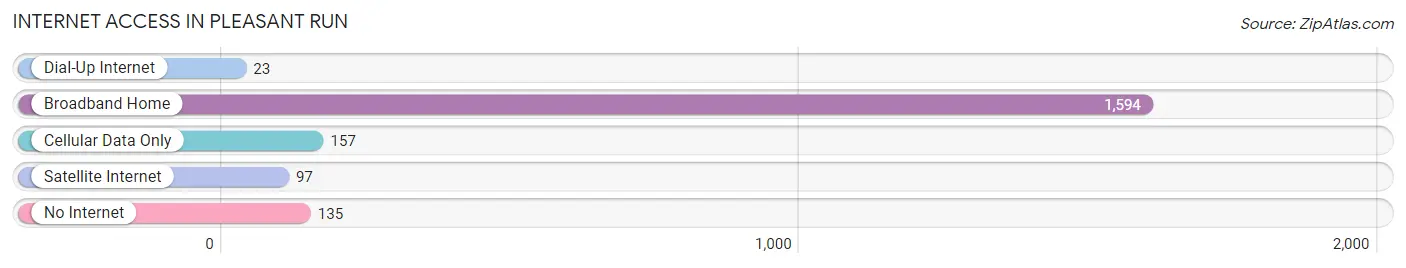
| Internet Type | # Households | % Households |
| Dial-Up Internet | 23 | 1.2% |
| Broadband Home | 1,594 | 82.5% |
| Cellular Data Only | 157 | 8.1% |
| Satellite Internet | 97 | 5.0% |
| No Internet | 135 | 7.0% |
| Total | 1,933 | 100.0% |
Pleasant Run Summary
Pleasant Run is a small unincorporated community located in the southeastern corner of Butler County, Ohio. It is situated along the banks of the Great Miami River, approximately 10 miles east of Hamilton and 25 miles north of Cincinnati. The community is home to a population of approximately 1,000 people, and is part of the Hamilton-Middletown Metropolitan Statistical Area.
History
The area that is now Pleasant Run was first settled in the early 1800s by a group of German immigrants. The community was originally known as “Germantown”, and was home to a number of small farms and businesses. In 1845, the community was renamed “Pleasant Run” after the nearby creek of the same name.
The community grew steadily throughout the 19th century, and by the early 20th century, it had become a thriving agricultural center. The Great Miami River provided a convenient means of transportation for the farmers, and the area was home to a number of mills and other businesses.
In the 1950s, the community began to decline as many of the businesses and farms closed or moved away. The population of Pleasant Run decreased steadily throughout the latter half of the 20th century, and by the 2000 census, the population had dropped to just over 1,000 people.
Geography
Pleasant Run is located in the southeastern corner of Butler County, Ohio. It is situated along the banks of the Great Miami River, approximately 10 miles east of Hamilton and 25 miles north of Cincinnati. The community is part of the Hamilton-Middletown Metropolitan Statistical Area.
The terrain of Pleasant Run is mostly flat, with some rolling hills in the surrounding area. The climate is humid continental, with hot summers and cold winters. The average annual temperature is around 50 degrees Fahrenheit, and the average annual precipitation is around 40 inches.
Economy
The economy of Pleasant Run is largely based on agriculture. The area is home to a number of small farms, and the Great Miami River provides a convenient means of transportation for the farmers. The community is also home to a number of small businesses, including a few restaurants, a grocery store, and a hardware store.
Demographics
According to the 2000 census, the population of Pleasant Run was 1,039 people. The racial makeup of the community was 97.3% White, 0.9% African American, 0.3% Native American, 0.3% Asian, and 0.2% from other races. The median household income was $37,500, and the median family income was $41,250.
Conclusion
Pleasant Run is a small unincorporated community located in the southeastern corner of Butler County, Ohio. It is situated along the banks of the Great Miami River, approximately 10 miles east of Hamilton and 25 miles north of Cincinnati. The community is home to a population of approximately 1,000 people, and is part of the Hamilton-Middletown Metropolitan Statistical Area. The economy of Pleasant Run is largely based on agriculture, and the area is home to a number of small businesses. According to the 2000 census, the population of Pleasant Run was 1,039 people, and the median household income was $37,500.
Common Questions
What is the Total Population of Pleasant Run?
Total Population of Pleasant Run is 5,258.
What is the Total Male Population of Pleasant Run?
Total Male Population of Pleasant Run is 2,296.
What is the Total Female Population of Pleasant Run?
Total Female Population of Pleasant Run is 2,962.
What is the Ratio of Males per 100 Females in Pleasant Run?
There are 77.52 Males per 100 Females in Pleasant Run.
What is the Ratio of Females per 100 Males in Pleasant Run?
There are 129.01 Females per 100 Males in Pleasant Run.
What is the Median Population Age in Pleasant Run?
Median Population Age in Pleasant Run is 37.5 Years.
What is the Average Family Size in Pleasant Run
Average Family Size in Pleasant Run is 3.0 People.
What is the Average Household Size in Pleasant Run
Average Household Size in Pleasant Run is 2.7 People.
What is Per Capita Income in Pleasant Run?
Per Capita income in Pleasant Run is $35,755.
What is the Median Family Income in Pleasant Run?
Median Family Income in Pleasant Run is $85,063.
What is the Median Household income in Pleasant Run?
Median Household Income in Pleasant Run is $73,583.
What is Income or Wage Gap in Pleasant Run?
Income or Wage Gap in Pleasant Run is 4.8%.
Women in Pleasant Run earn 95.2 cents for every dollar earned by a man.
What is Inequality or Gini Index in Pleasant Run?
Inequality or Gini Index in Pleasant Run is 0.37.
How Large is the Labor Force in Pleasant Run?
There are 2,955 People in the Labor Forcein in Pleasant Run.
What is the Percentage of People in the Labor Force in Pleasant Run?
70.0% of People are in the Labor Force in Pleasant Run.
What is the Unemployment Rate in Pleasant Run?
Unemployment Rate in Pleasant Run is 6.7%.