Seabrook Farms, NJ
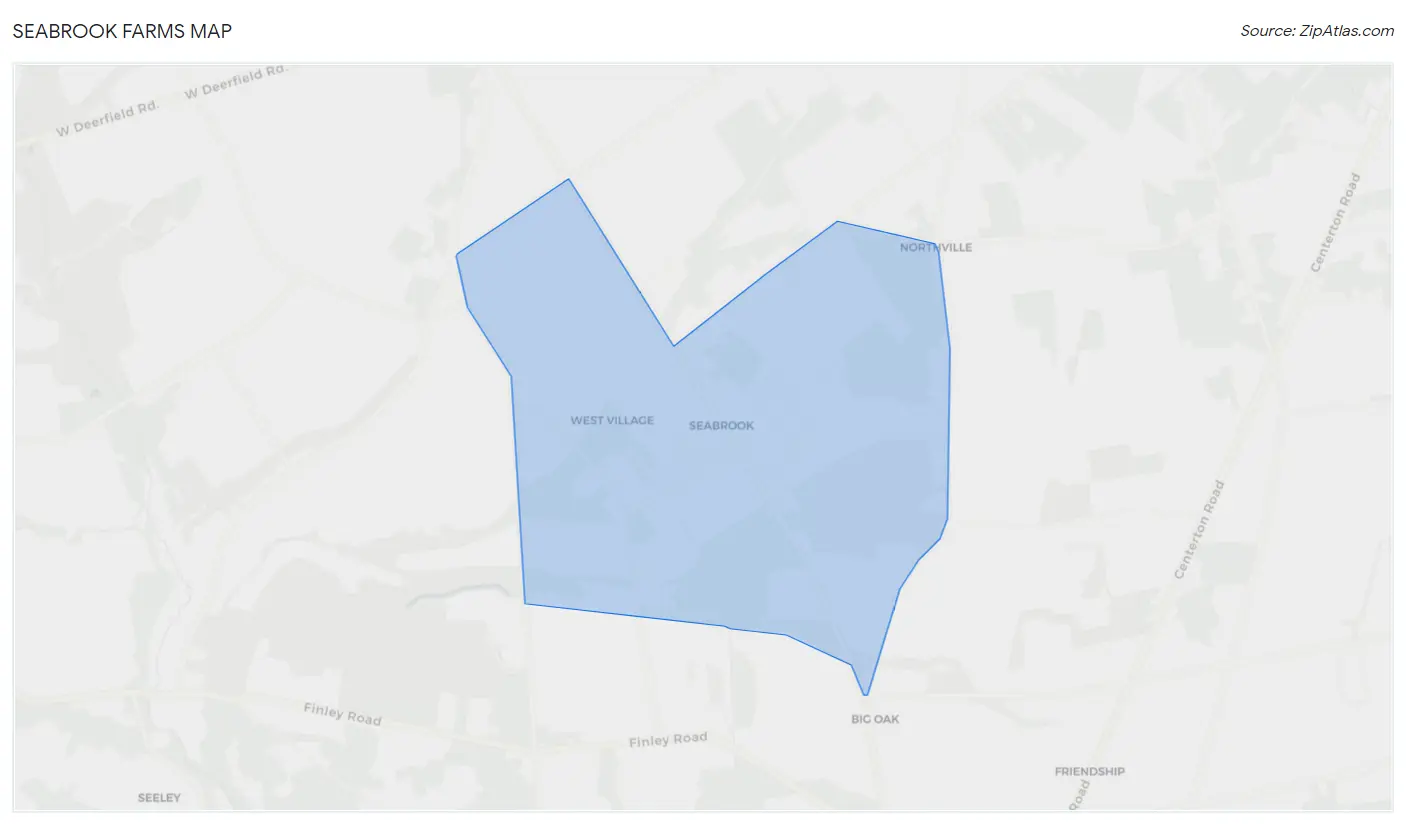
Seabrook Farms Map
Seabrook Farms Overview
1,447
TOTAL POPULATION
798
MALE POPULATION
649
FEMALE POPULATION
122.96
MALES / 100 FEMALES
81.33
FEMALES / 100 MALES
32.3
MEDIAN AGE
2.9
AVG FAMILY SIZE
2.5
AVG HOUSEHOLD SIZE
$18,925
PER CAPITA INCOME
$45,917
AVG FAMILY INCOME
$43,869
AVG HOUSEHOLD INCOME
17.1%
WAGE / INCOME GAP [ % ]
82.9¢/ $1
WAGE / INCOME GAP [ $ ]
0.51
INEQUALITY / GINI INDEX
663
LABOR FORCE [ PEOPLE ]
60.2%
PERCENT IN LABOR FORCE
21.7%
UNEMPLOYMENT RATE
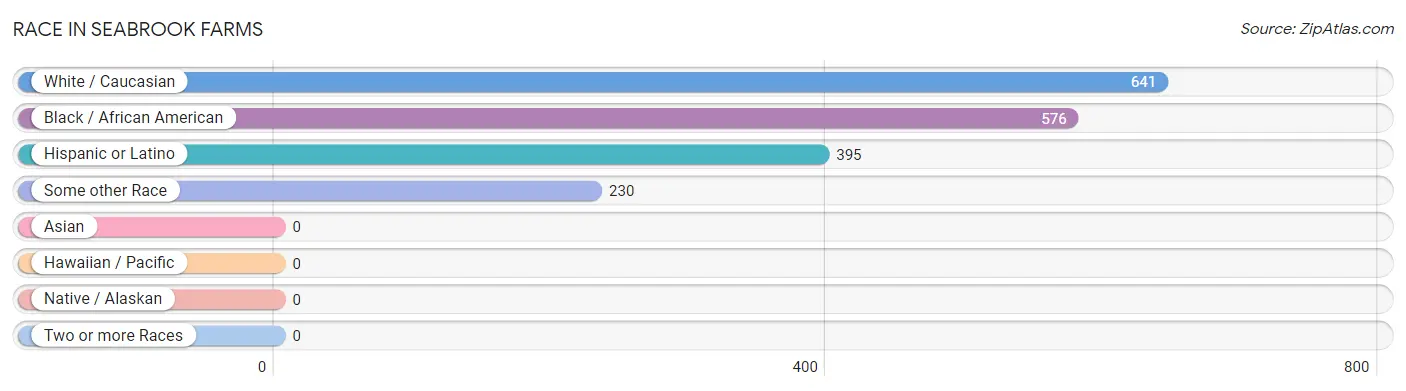
Race in Seabrook Farms
The most populous races in Seabrook Farms are White / Caucasian (641 | 44.3%), Black / African American (576 | 39.8%), and Hispanic or Latino (395 | 27.3%).
| Race | # Population | % Population |
| Asian | 0 | 0.0% |
| Black / African American | 576 | 39.8% |
| Hawaiian / Pacific | 0 | 0.0% |
| Hispanic or Latino | 395 | 27.3% |
| Native / Alaskan | 0 | 0.0% |
| White / Caucasian | 641 | 44.3% |
| Two or more Races | 0 | 0.0% |
| Some other Race | 230 | 15.9% |
| Total | 1,447 | 100.0% |
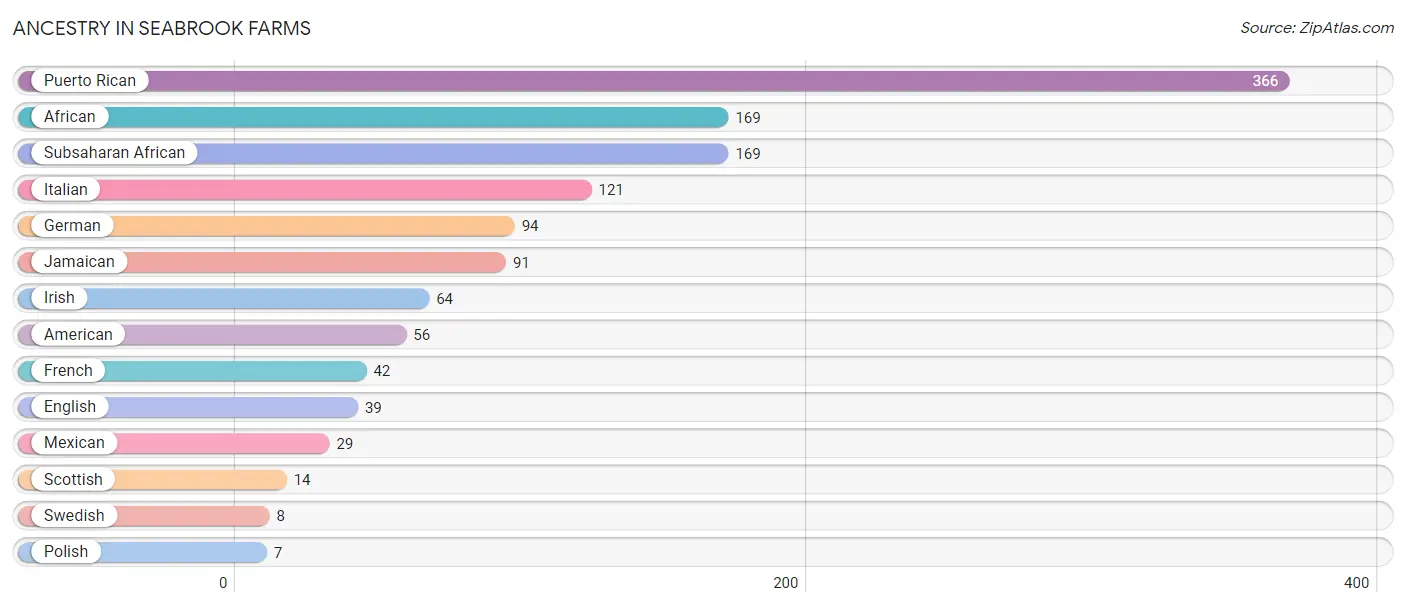
Ancestry in Seabrook Farms
The most populous ancestries reported in Seabrook Farms are Puerto Rican (366 | 25.3%), African (169 | 11.7%), Subsaharan African (169 | 11.7%), Italian (121 | 8.4%), and German (94 | 6.5%), together accounting for 63.5% of all Seabrook Farms residents.
| Ancestry | # Population | % Population |
| African | 169 | 11.7% |
| American | 56 | 3.9% |
| English | 39 | 2.7% |
| French | 42 | 2.9% |
| German | 94 | 6.5% |
| Irish | 64 | 4.4% |
| Italian | 121 | 8.4% |
| Jamaican | 91 | 6.3% |
| Mexican | 29 | 2.0% |
| Polish | 7 | 0.5% |
| Puerto Rican | 366 | 25.3% |
| Scottish | 14 | 1.0% |
| Subsaharan African | 169 | 11.7% |
| Swedish | 8 | 0.5% | View All 14 Rows |
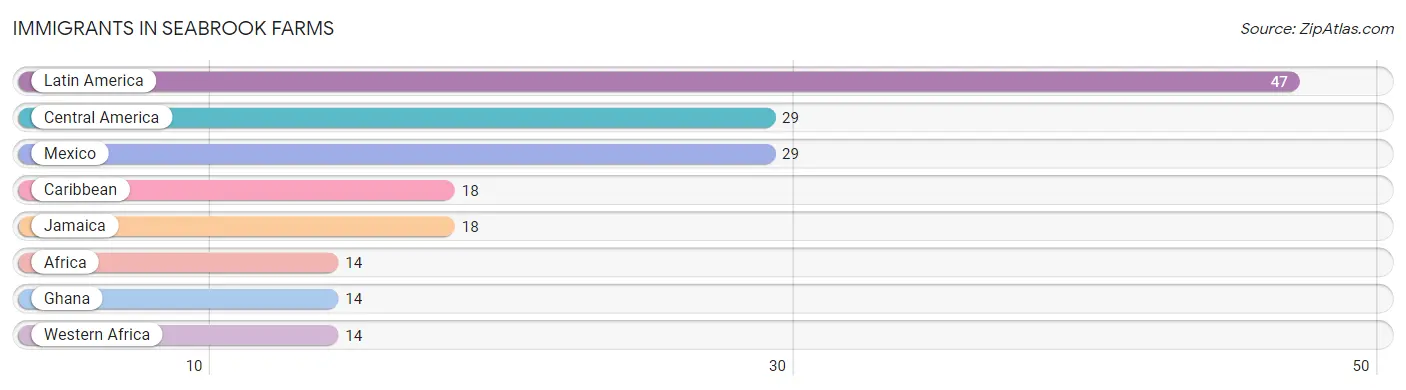
Immigrants in Seabrook Farms
The most numerous immigrant groups reported in Seabrook Farms came from Latin America (47 | 3.3%), Central America (29 | 2.0%), Mexico (29 | 2.0%), Caribbean (18 | 1.2%), and Jamaica (18 | 1.2%), together accounting for 9.7% of all Seabrook Farms residents.
| Immigration Origin | # Population | % Population |
| Africa | 14 | 1.0% |
| Caribbean | 18 | 1.2% |
| Central America | 29 | 2.0% |
| Ghana | 14 | 1.0% |
| Jamaica | 18 | 1.2% |
| Latin America | 47 | 3.3% |
| Mexico | 29 | 2.0% |
| Western Africa | 14 | 1.0% | View All 8 Rows |
Sex and Age in Seabrook Farms
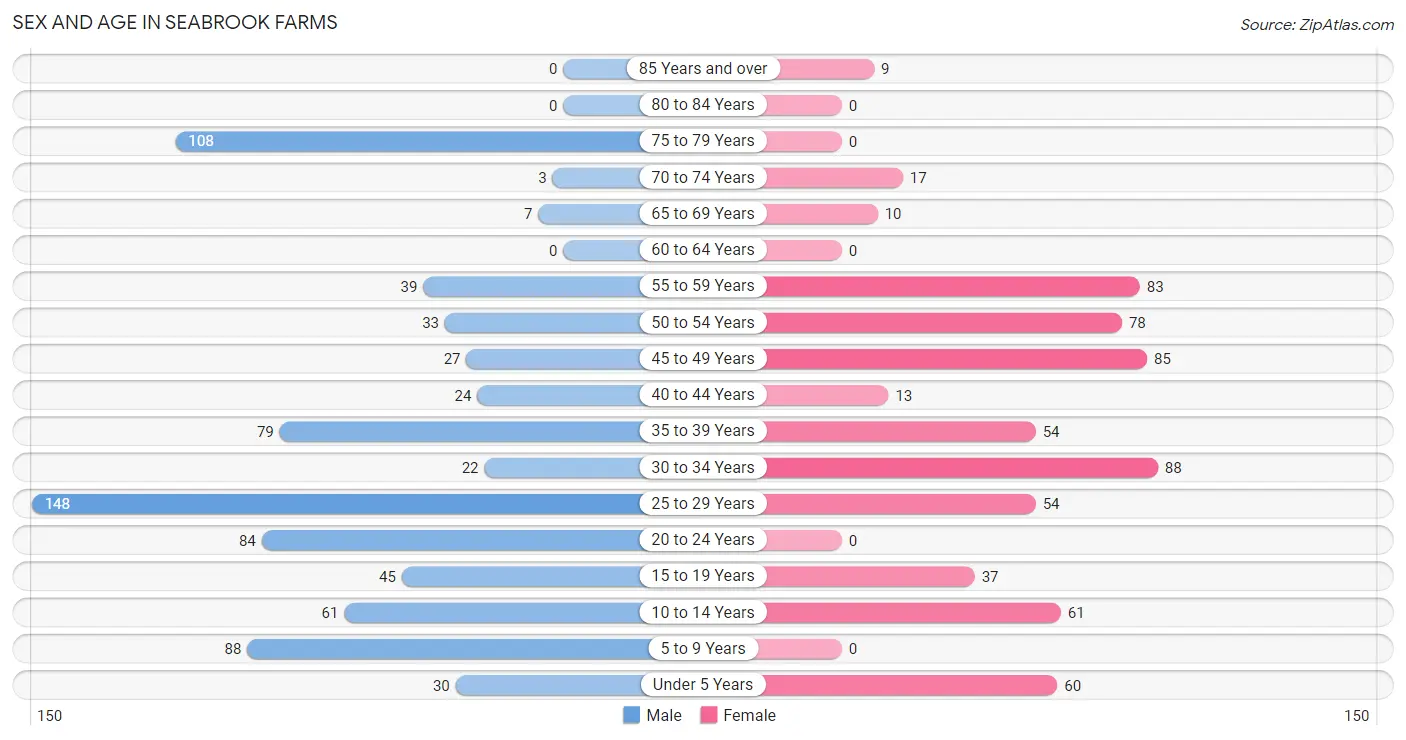
Sex and Age in Seabrook Farms
The most populous age groups in Seabrook Farms are 25 to 29 Years (148 | 18.5%) for men and 30 to 34 Years (88 | 13.6%) for women.
| Age Bracket | Male | Female |
| Under 5 Years | 30 (3.8%) | 60 (9.2%) |
| 5 to 9 Years | 88 (11.0%) | 0 (0.0%) |
| 10 to 14 Years | 61 (7.6%) | 61 (9.4%) |
| 15 to 19 Years | 45 (5.6%) | 37 (5.7%) |
| 20 to 24 Years | 84 (10.5%) | 0 (0.0%) |
| 25 to 29 Years | 148 (18.5%) | 54 (8.3%) |
| 30 to 34 Years | 22 (2.8%) | 88 (13.6%) |
| 35 to 39 Years | 79 (9.9%) | 54 (8.3%) |
| 40 to 44 Years | 24 (3.0%) | 13 (2.0%) |
| 45 to 49 Years | 27 (3.4%) | 85 (13.1%) |
| 50 to 54 Years | 33 (4.1%) | 78 (12.0%) |
| 55 to 59 Years | 39 (4.9%) | 83 (12.8%) |
| 60 to 64 Years | 0 (0.0%) | 0 (0.0%) |
| 65 to 69 Years | 7 (0.9%) | 10 (1.5%) |
| 70 to 74 Years | 3 (0.4%) | 17 (2.6%) |
| 75 to 79 Years | 108 (13.5%) | 0 (0.0%) |
| 80 to 84 Years | 0 (0.0%) | 0 (0.0%) |
| 85 Years and over | 0 (0.0%) | 9 (1.4%) |
| Total | 798 (100.0%) | 649 (100.0%) |
Families and Households in Seabrook Farms
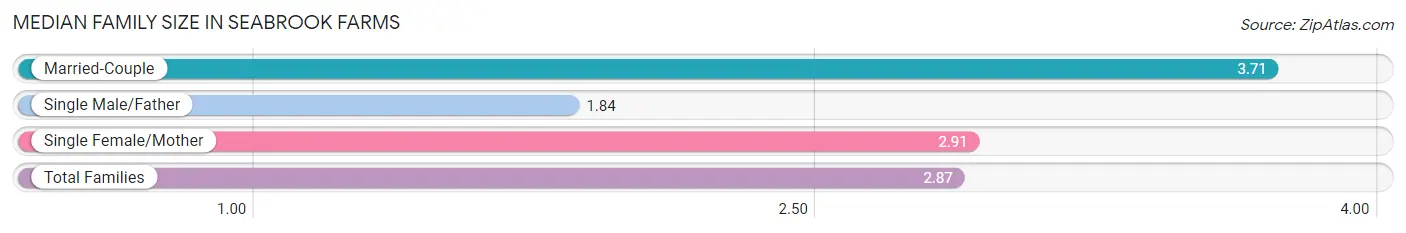
Median Family Size in Seabrook Farms
The median family size in Seabrook Farms is 2.87 persons per family, with married-couple families (153 | 35.7%) accounting for the largest median family size of 3.71 persons per family. On the other hand, single male/father families (131 | 30.5%) represent the smallest median family size with 1.84 persons per family.
| Family Type | # Families | Family Size |
| Married-Couple | 153 (35.7%) | 3.71 |
| Single Male/Father | 131 (30.5%) | 1.84 |
| Single Female/Mother | 145 (33.8%) | 2.91 |
| Total Families | 429 (100.0%) | 2.87 |
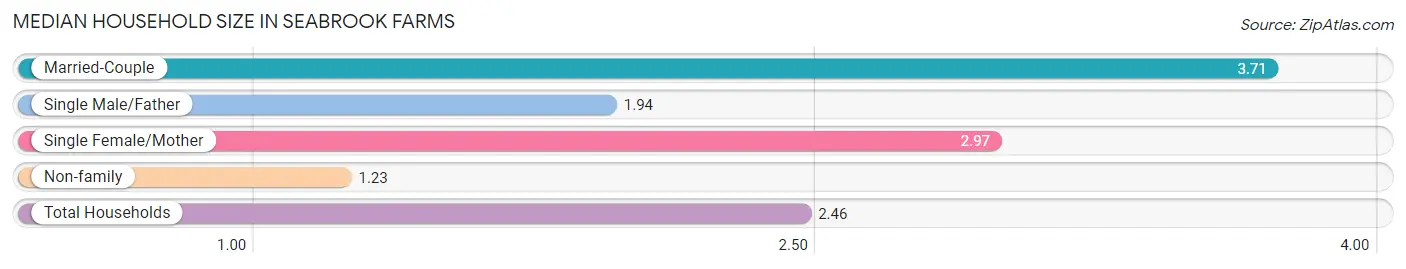
Median Household Size in Seabrook Farms
The median household size in Seabrook Farms is 2.46 persons per household, with married-couple households (153 | 26.0%) accounting for the largest median household size of 3.71 persons per household. non-family households (159 | 27.0%) represent the smallest median household size with 1.23 persons per household.
| Household Type | # Households | Household Size |
| Married-Couple | 153 (26.0%) | 3.71 |
| Single Male/Father | 131 (22.3%) | 1.94 |
| Single Female/Mother | 145 (24.7%) | 2.97 |
| Non-family | 159 (27.0%) | 1.23 |
| Total Households | 588 (100.0%) | 2.46 |
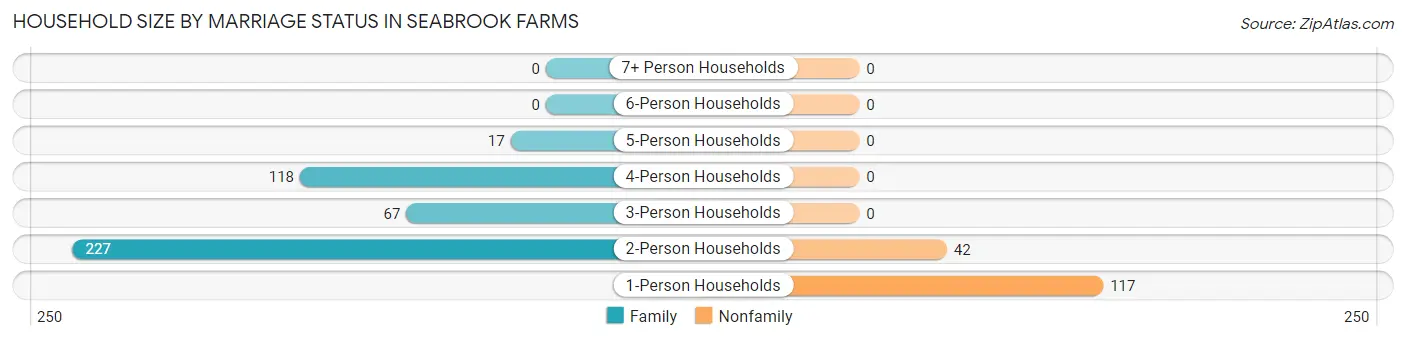
Household Size by Marriage Status in Seabrook Farms
Out of a total of 588 households in Seabrook Farms, 429 (73.0%) are family households, while 159 (27.0%) are nonfamily households. The most numerous type of family households are 2-person households, comprising 227, and the most common type of nonfamily households are 1-person households, comprising 117.
| Household Size | Family Households | Nonfamily Households |
| 1-Person Households | - | 117 (19.9%) |
| 2-Person Households | 227 (38.6%) | 42 (7.1%) |
| 3-Person Households | 67 (11.4%) | 0 (0.0%) |
| 4-Person Households | 118 (20.1%) | 0 (0.0%) |
| 5-Person Households | 17 (2.9%) | 0 (0.0%) |
| 6-Person Households | 0 (0.0%) | 0 (0.0%) |
| 7+ Person Households | 0 (0.0%) | 0 (0.0%) |
| Total | 429 (73.0%) | 159 (27.0%) |
Female Fertility in Seabrook Farms
Fertility by Age in Seabrook Farms
| Age Bracket | Women with Births | Births / 1,000 Women |
| 15 to 19 years | 0 (0.0%) | 0.0 |
| 20 to 34 years | 0 (0.0%) | 0.0 |
| 35 to 50 years | 0 (0.0%) | 0.0 |
| Total | 0 (0.0%) | 0.0 |
Fertility by Age by Marriage Status in Seabrook Farms
| Age Bracket | Married | Unmarried |
| 15 to 19 years | 0 (0.0%) | 0 (0.0%) |
| 20 to 34 years | 0 (0.0%) | 0 (0.0%) |
| 35 to 50 years | 0 (0.0%) | 0 (0.0%) |
| Total | 0 (0.0%) | 0 (0.0%) |
Fertility by Education in Seabrook Farms
| Educational Attainment | Women with Births | Births / 1,000 Women |
| Less than High School | 0 (0.0%) | 0.0 |
| High School Diploma | 0 (0.0%) | 0.0 |
| College or Associate's Degree | 0 (0.0%) | 0.0 |
| Bachelor's Degree | 0 (0.0%) | 0.0 |
| Graduate Degree | 0 (0.0%) | 0.0 |
| Total | 0 (0.0%) | 0.0 |
Fertility by Education by Marriage Status in Seabrook Farms
| Educational Attainment | Married | Unmarried |
| Less than High School | 0 (0.0%) | 0 (0.0%) |
| High School Diploma | 0 (0.0%) | 0 (0.0%) |
| College or Associate's Degree | 0 (0.0%) | 0 (0.0%) |
| Bachelor's Degree | 0 (0.0%) | 0 (0.0%) |
| Graduate Degree | 0 (0.0%) | 0 (0.0%) |
| Total | 0 (0.0%) | 0 (0.0%) |
Income in Seabrook Farms
Income Overview in Seabrook Farms
Per Capita Income in Seabrook Farms is $18,925, while median incomes of families and households are $45,917 and $43,869 respectively.
| Characteristic | Number | Measure |
| Per Capita Income | 1,447 | $18,925 |
| Median Family Income | 429 | $45,917 |
| Mean Family Income | 429 | $55,626 |
| Median Household Income | 588 | $43,869 |
| Mean Household Income | 588 | $46,712 |
| Income Deficit | 429 | $0 |
| Wage / Income Gap (%) | 1,447 | 17.14% |
| Wage / Income Gap ($) | 1,447 | 82.86¢ per $1 |
| Gini / Inequality Index | 1,447 | 0.51 |
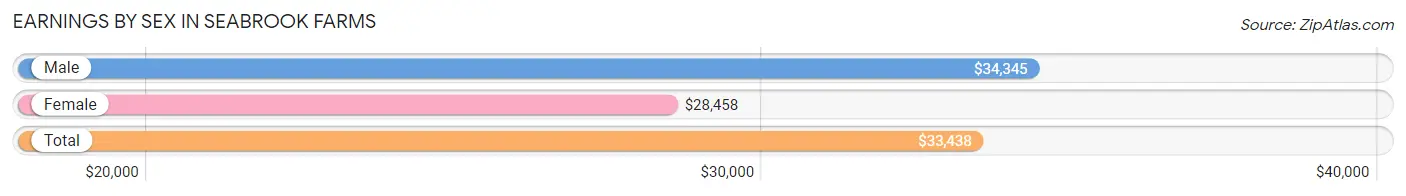
Earnings by Sex in Seabrook Farms
Average Earnings in Seabrook Farms are $33,438, $34,345 for men and $28,458 for women, a difference of 17.1%.
| Sex | Number | Average Earnings |
| Male | 260 (47.2%) | $34,345 |
| Female | 291 (52.8%) | $28,458 |
| Total | 551 (100.0%) | $33,438 |
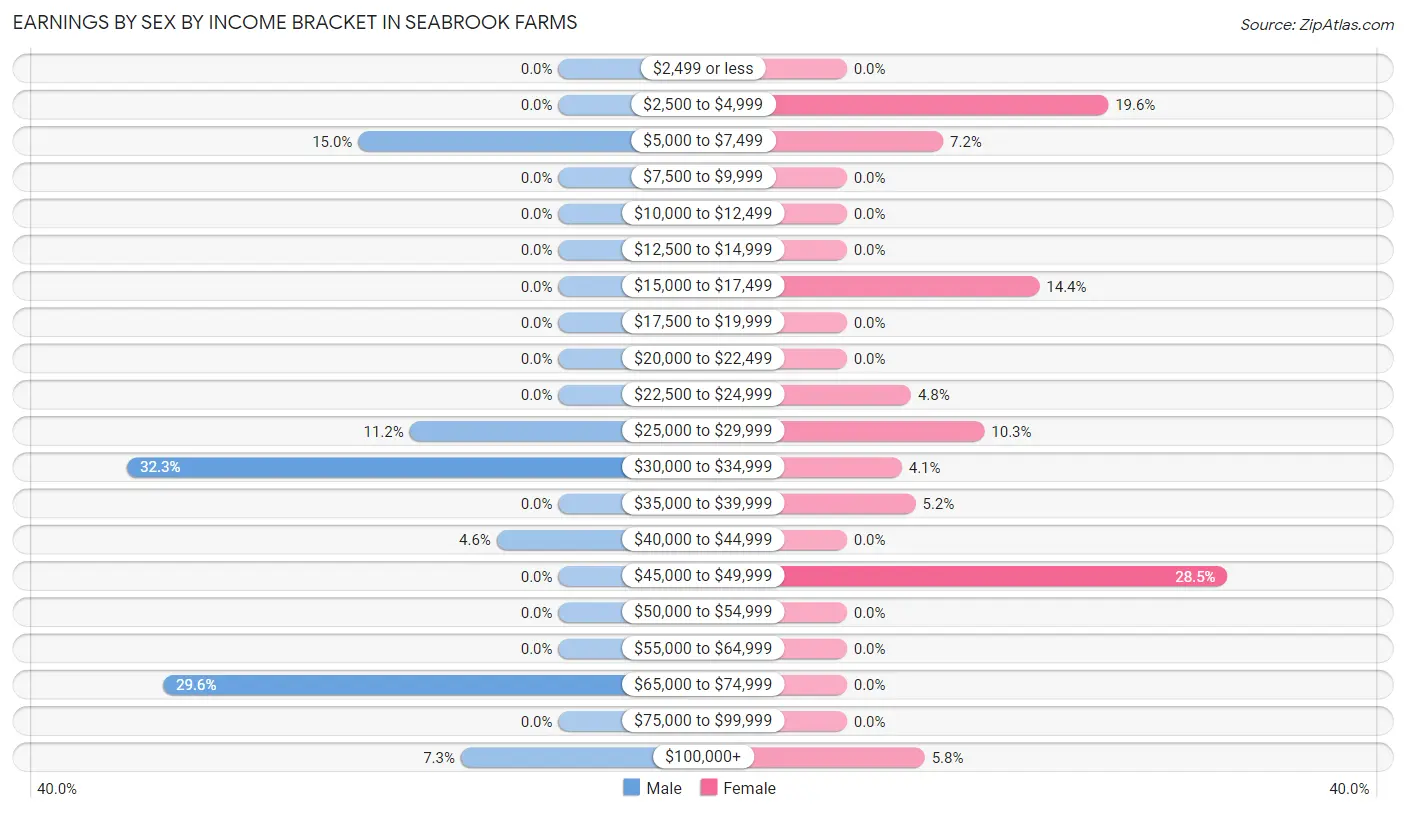
Earnings by Sex by Income Bracket in Seabrook Farms
The most common earnings brackets in Seabrook Farms are $30,000 to $34,999 for men (84 | 32.3%) and $45,000 to $49,999 for women (83 | 28.5%).
| Income | Male | Female |
| $2,499 or less | 0 (0.0%) | 0 (0.0%) |
| $2,500 to $4,999 | 0 (0.0%) | 57 (19.6%) |
| $5,000 to $7,499 | 39 (15.0%) | 21 (7.2%) |
| $7,500 to $9,999 | 0 (0.0%) | 0 (0.0%) |
| $10,000 to $12,499 | 0 (0.0%) | 0 (0.0%) |
| $12,500 to $14,999 | 0 (0.0%) | 0 (0.0%) |
| $15,000 to $17,499 | 0 (0.0%) | 42 (14.4%) |
| $17,500 to $19,999 | 0 (0.0%) | 0 (0.0%) |
| $20,000 to $22,499 | 0 (0.0%) | 0 (0.0%) |
| $22,500 to $24,999 | 0 (0.0%) | 14 (4.8%) |
| $25,000 to $29,999 | 29 (11.2%) | 30 (10.3%) |
| $30,000 to $34,999 | 84 (32.3%) | 12 (4.1%) |
| $35,000 to $39,999 | 0 (0.0%) | 15 (5.1%) |
| $40,000 to $44,999 | 12 (4.6%) | 0 (0.0%) |
| $45,000 to $49,999 | 0 (0.0%) | 83 (28.5%) |
| $50,000 to $54,999 | 0 (0.0%) | 0 (0.0%) |
| $55,000 to $64,999 | 0 (0.0%) | 0 (0.0%) |
| $65,000 to $74,999 | 77 (29.6%) | 0 (0.0%) |
| $75,000 to $99,999 | 0 (0.0%) | 0 (0.0%) |
| $100,000+ | 19 (7.3%) | 17 (5.8%) |
| Total | 260 (100.0%) | 291 (100.0%) |
Earnings by Sex by Educational Attainment in Seabrook Farms
| Educational Attainment | Male Income | Female Income |
| Less than High School | - | - |
| High School Diploma | - | - |
| College or Associate's Degree | - | - |
| Bachelor's Degree | - | - |
| Graduate Degree | - | - |
| Total | $65,339 | $29,333 |
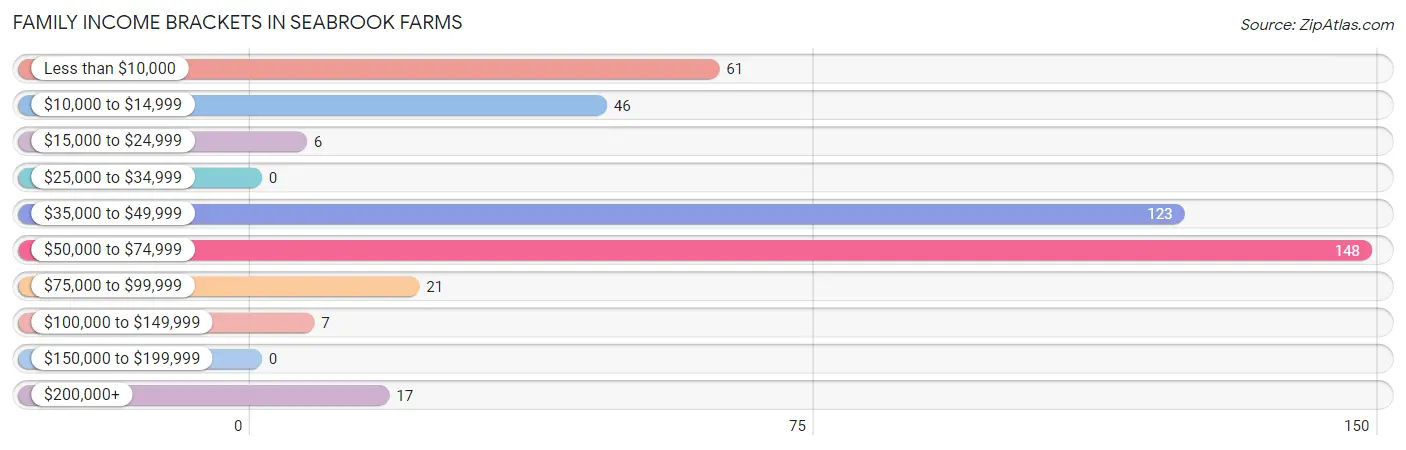
Family Income in Seabrook Farms
Family Income Brackets in Seabrook Farms
According to the Seabrook Farms family income data, there are 148 families falling into the $50,000 to $74,999 income range, which is the most common income bracket and makes up 34.5% of all families.
| Income Bracket | # Families | % Families |
| Less than $10,000 | 61 | 14.2% |
| $10,000 to $14,999 | 46 | 10.7% |
| $15,000 to $24,999 | 6 | 1.4% |
| $25,000 to $34,999 | 0 | 0.0% |
| $35,000 to $49,999 | 123 | 28.7% |
| $50,000 to $74,999 | 148 | 34.5% |
| $75,000 to $99,999 | 21 | 4.9% |
| $100,000 to $149,999 | 7 | 1.6% |
| $150,000 to $199,999 | 0 | 0.0% |
| $200,000+ | 17 | 4.0% |
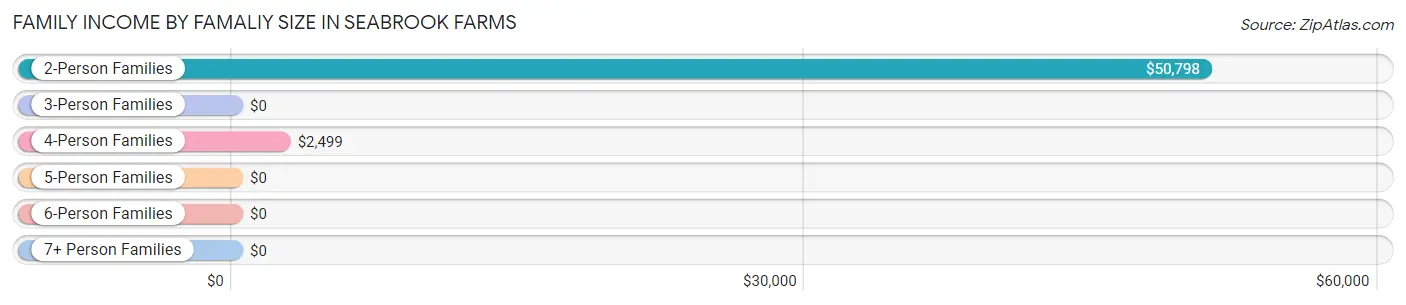
Family Income by Famaliy Size in Seabrook Farms
2-person families (233 | 54.3%) account for the highest median family income in Seabrook Farms with $50,798 per family, while 2-person families (233 | 54.3%) have the highest median income of $25,399 per family member.
| Income Bracket | # Families | Median Income |
| 2-Person Families | 233 (54.3%) | $50,798 |
| 3-Person Families | 73 (17.0%) | $0 |
| 4-Person Families | 106 (24.7%) | $2,499 |
| 5-Person Families | 17 (4.0%) | $0 |
| 6-Person Families | 0 (0.0%) | $0 |
| 7+ Person Families | 0 (0.0%) | $0 |
| Total | 429 (100.0%) | $45,917 |
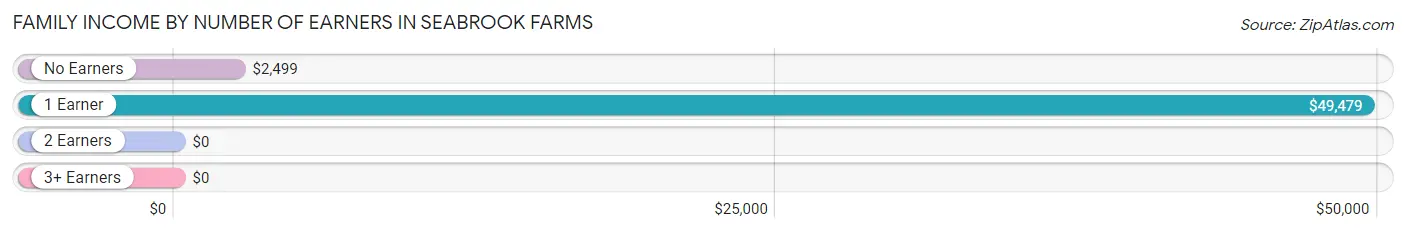
Family Income by Number of Earners in Seabrook Farms
| Number of Earners | # Families | Median Income |
| No Earners | 77 (17.9%) | $2,499 |
| 1 Earner | 241 (56.2%) | $49,479 |
| 2 Earners | 94 (21.9%) | $0 |
| 3+ Earners | 17 (4.0%) | $0 |
| Total | 429 (100.0%) | $45,917 |
Household Income in Seabrook Farms
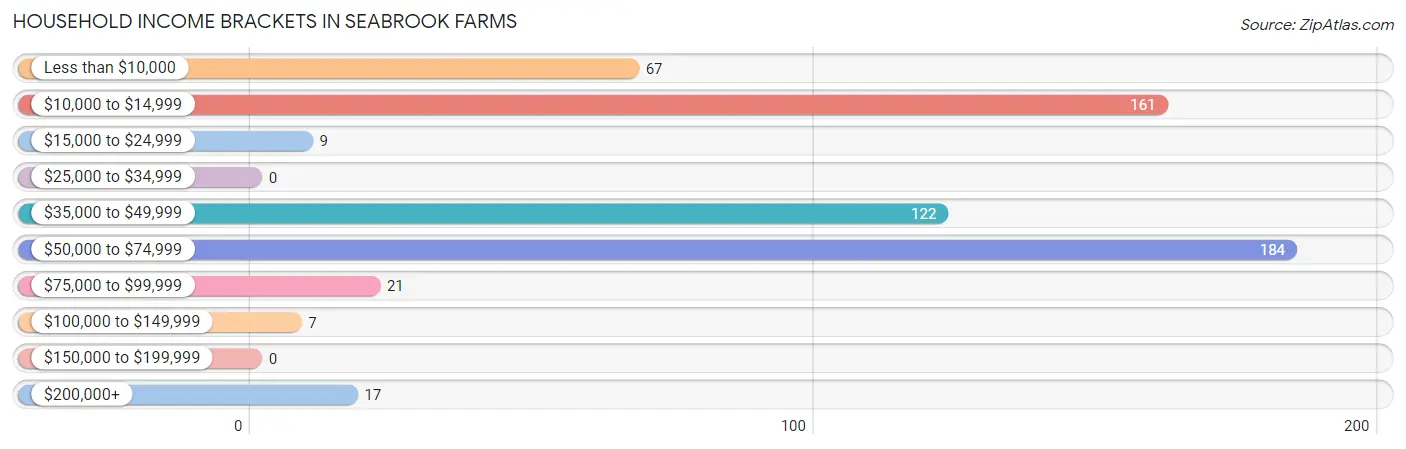
Household Income Brackets in Seabrook Farms
With 184 households falling in the category, the $50,000 to $74,999 income range is the most frequent in Seabrook Farms, accounting for 31.3% of all households.
| Income Bracket | # Households | % Households |
| Less than $10,000 | 67 | 11.4% |
| $10,000 to $14,999 | 161 | 27.4% |
| $15,000 to $24,999 | 9 | 1.5% |
| $25,000 to $34,999 | 0 | 0.0% |
| $35,000 to $49,999 | 122 | 20.7% |
| $50,000 to $74,999 | 184 | 31.3% |
| $75,000 to $99,999 | 21 | 3.6% |
| $100,000 to $149,999 | 7 | 1.2% |
| $150,000 to $199,999 | 0 | 0.0% |
| $200,000+ | 17 | 2.9% |
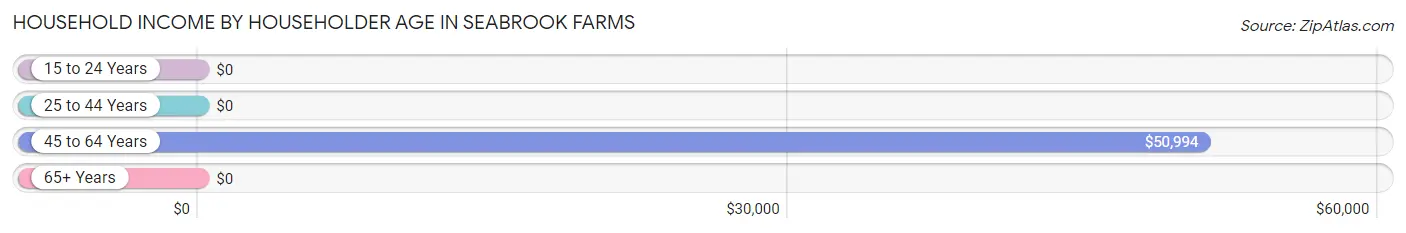
Household Income by Householder Age in Seabrook Farms
The median household income in Seabrook Farms is $43,869, with the highest median household income of $50,994 found in the 45 to 64 years age bracket for the primary householder. A total of 158 households (26.9%) fall into this category. Meanwhile, the 15 to 24 years age bracket for the primary householder has the lowest median household income of $0, with 84 households (14.3%) in this group.
| Income Bracket | # Households | Median Income |
| 15 to 24 Years | 84 (14.3%) | $0 |
| 25 to 44 Years | 202 (34.4%) | $0 |
| 45 to 64 Years | 158 (26.9%) | $50,994 |
| 65+ Years | 144 (24.5%) | $0 |
| Total | 588 (100.0%) | $43,869 |
Poverty in Seabrook Farms
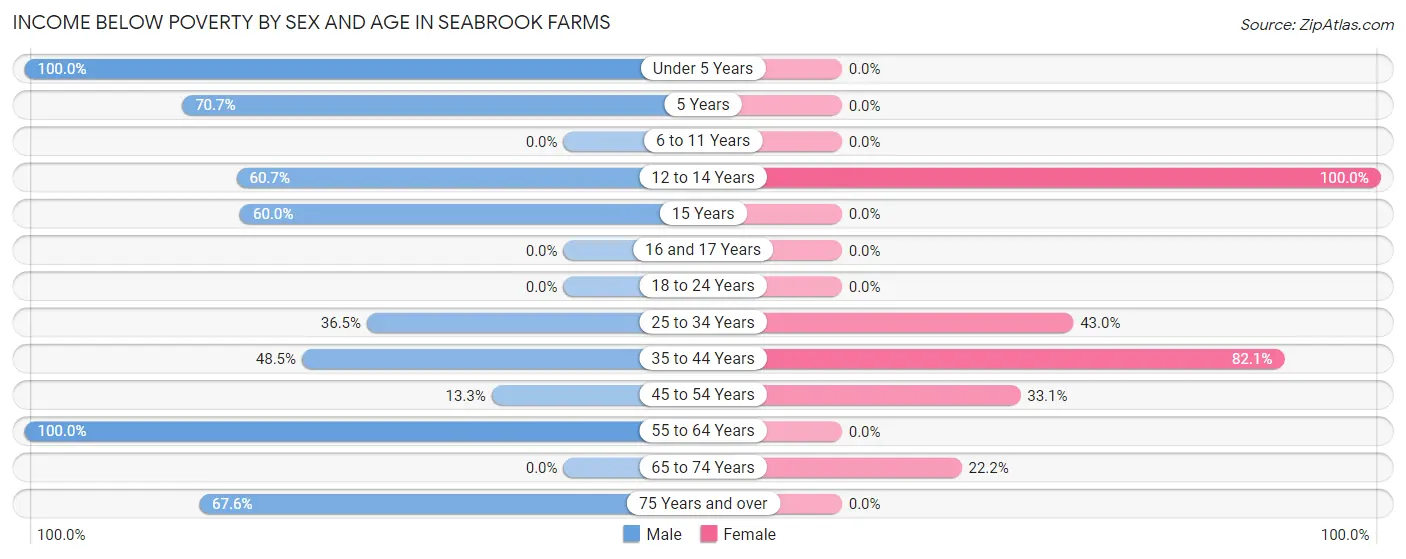
Income Below Poverty by Sex and Age in Seabrook Farms
With 44.5% poverty level for males and 31.1% for females among the residents of Seabrook Farms, under 5 year old males and 12 to 14 year old females are the most vulnerable to poverty, with 30 males (100.0%) and 26 females (100.0%) in their respective age groups living below the poverty level.
| Age Bracket | Male | Female |
| Under 5 Years | 30 (100.0%) | 0 (0.0%) |
| 5 Years | 29 (70.7%) | 0 (0.0%) |
| 6 to 11 Years | 0 (0.0%) | 0 (0.0%) |
| 12 to 14 Years | 37 (60.7%) | 26 (100.0%) |
| 15 Years | 27 (60.0%) | 0 (0.0%) |
| 16 and 17 Years | 0 (0.0%) | 0 (0.0%) |
| 18 to 24 Years | 0 (0.0%) | 0 (0.0%) |
| 25 to 34 Years | 62 (36.5%) | 61 (43.0%) |
| 35 to 44 Years | 50 (48.5%) | 55 (82.1%) |
| 45 to 54 Years | 8 (13.3%) | 54 (33.1%) |
| 55 to 64 Years | 39 (100.0%) | 0 (0.0%) |
| 65 to 74 Years | 0 (0.0%) | 6 (22.2%) |
| 75 Years and over | 73 (67.6%) | 0 (0.0%) |
| Total | 355 (44.5%) | 202 (31.1%) |
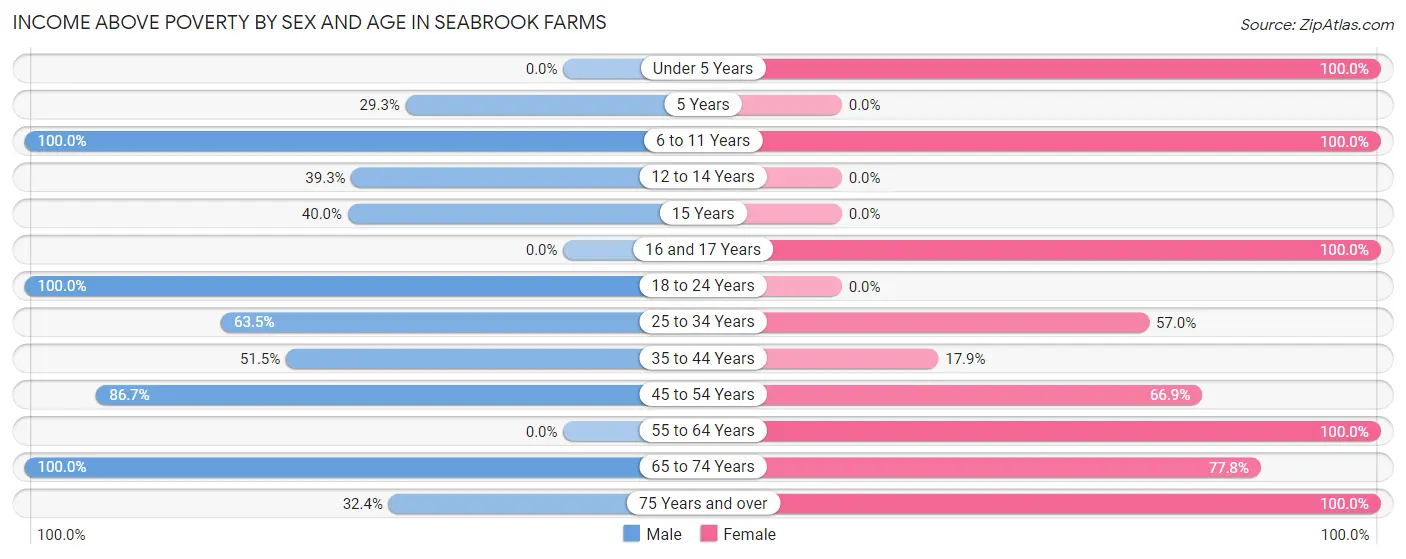
Income Above Poverty by Sex and Age in Seabrook Farms
According to the poverty statistics in Seabrook Farms, males aged 6 to 11 years and females aged under 5 years are the age groups that are most secure financially, with 100.0% of males and 100.0% of females in these age groups living above the poverty line.
| Age Bracket | Male | Female |
| Under 5 Years | 0 (0.0%) | 60 (100.0%) |
| 5 Years | 12 (29.3%) | 0 (0.0%) |
| 6 to 11 Years | 47 (100.0%) | 35 (100.0%) |
| 12 to 14 Years | 24 (39.3%) | 0 (0.0%) |
| 15 Years | 18 (40.0%) | 0 (0.0%) |
| 16 and 17 Years | 0 (0.0%) | 37 (100.0%) |
| 18 to 24 Years | 84 (100.0%) | 0 (0.0%) |
| 25 to 34 Years | 108 (63.5%) | 81 (57.0%) |
| 35 to 44 Years | 53 (51.5%) | 12 (17.9%) |
| 45 to 54 Years | 52 (86.7%) | 109 (66.9%) |
| 55 to 64 Years | 0 (0.0%) | 83 (100.0%) |
| 65 to 74 Years | 10 (100.0%) | 21 (77.8%) |
| 75 Years and over | 35 (32.4%) | 9 (100.0%) |
| Total | 443 (55.5%) | 447 (68.9%) |
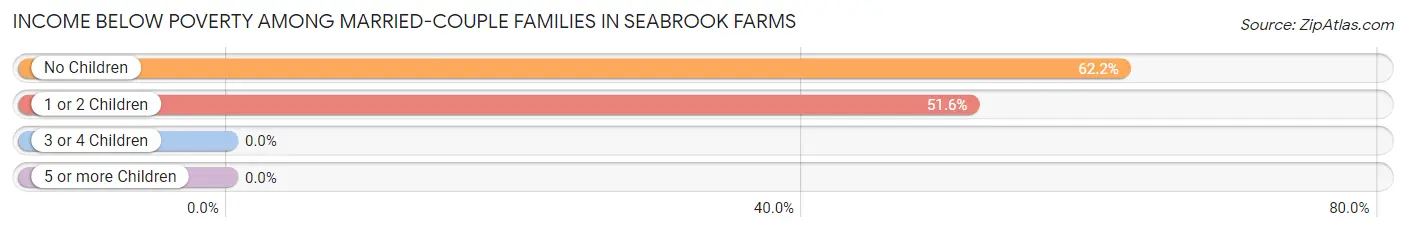
Income Below Poverty Among Married-Couple Families in Seabrook Farms
The poverty statistics for married-couple families in Seabrook Farms show that 51.0% or 78 of the total 153 families live below the poverty line. Families with no children have the highest poverty rate of 62.2%, comprising of 46 families. On the other hand, families with 3 or 4 children have the lowest poverty rate of 0.0%, which includes 0 families.
| Children | Above Poverty | Below Poverty |
| No Children | 28 (37.8%) | 46 (62.2%) |
| 1 or 2 Children | 30 (48.4%) | 32 (51.6%) |
| 3 or 4 Children | 17 (100.0%) | 0 (0.0%) |
| 5 or more Children | 0 (0.0%) | 0 (0.0%) |
| Total | 75 (49.0%) | 78 (51.0%) |
Income Below Poverty Among Single-Parent Households in Seabrook Farms
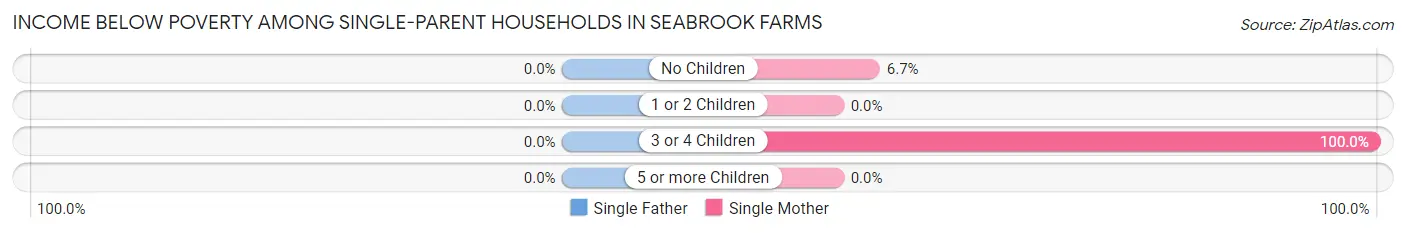
| Children | Single Father | Single Mother |
| No Children | 0 (0.0%) | 6 (6.7%) |
| 1 or 2 Children | 0 (0.0%) | 0 (0.0%) |
| 3 or 4 Children | 0 (0.0%) | 29 (100.0%) |
| 5 or more Children | 0 (0.0%) | 0 (0.0%) |
| Total | 0 (0.0%) | 35 (24.1%) |
Income Below Poverty Among Married-Couple vs Single-Parent Households in Seabrook Farms
The poverty data for Seabrook Farms shows that 78 of the married-couple family households (51.0%) and 35 of the single-parent households (12.7%) are living below the poverty level. Within the married-couple family households, those with no children have the highest poverty rate, with 46 households (62.2%) falling below the poverty line. Among the single-parent households, those with 3 or 4 children have the highest poverty rate, with 29 household (100.0%) living below poverty.
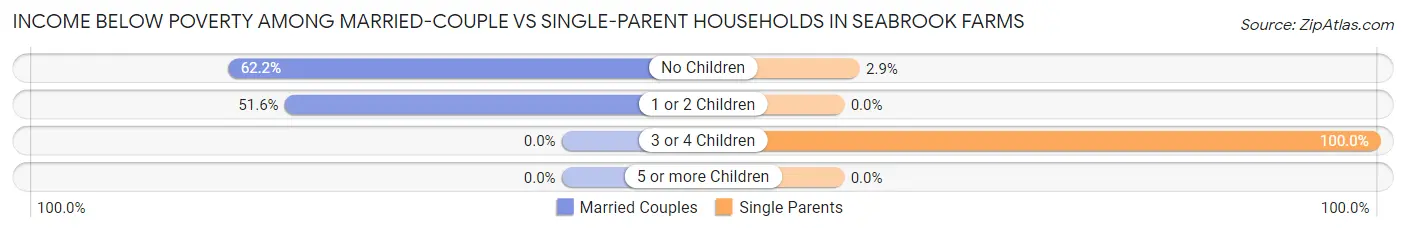
| Children | Married-Couple Families | Single-Parent Households |
| No Children | 46 (62.2%) | 6 (2.9%) |
| 1 or 2 Children | 32 (51.6%) | 0 (0.0%) |
| 3 or 4 Children | 0 (0.0%) | 29 (100.0%) |
| 5 or more Children | 0 (0.0%) | 0 (0.0%) |
| Total | 78 (51.0%) | 35 (12.7%) |
Employment Characteristics in Seabrook Farms
Employment by Class of Employer in Seabrook Farms
Among the 519 employed individuals in Seabrook Farms, private company employees (453 | 87.3%), state government employees (30 | 5.8%), and local government employees (19 | 3.7%) make up the most common classes of employment.
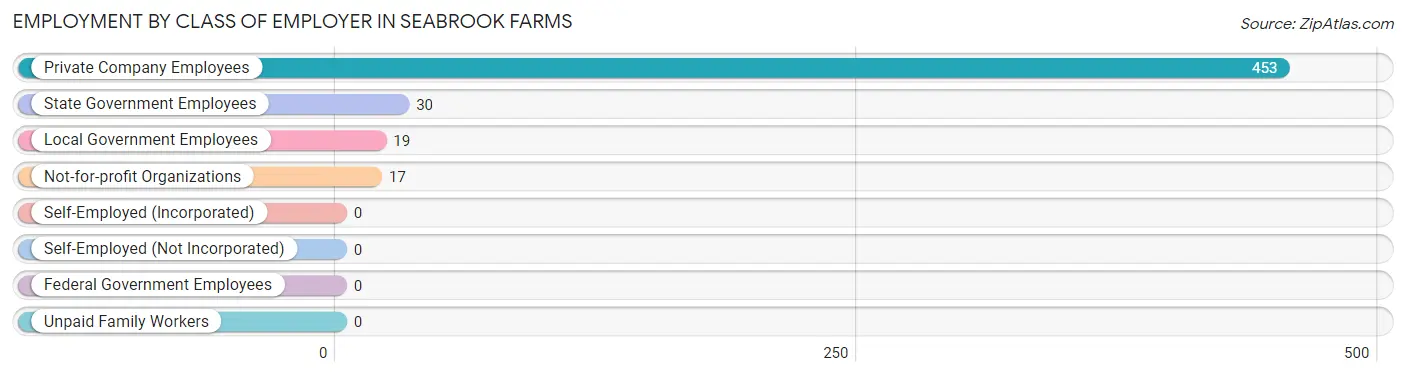
| Employer Class | # Employees | % Employees |
| Private Company Employees | 453 | 87.3% |
| Self-Employed (Incorporated) | 0 | 0.0% |
| Self-Employed (Not Incorporated) | 0 | 0.0% |
| Not-for-profit Organizations | 17 | 3.3% |
| Local Government Employees | 19 | 3.7% |
| State Government Employees | 30 | 5.8% |
| Federal Government Employees | 0 | 0.0% |
| Unpaid Family Workers | 0 | 0.0% |
| Total | 519 | 100.0% |
Employment Status by Age in Seabrook Farms
According to the labor force statistics for Seabrook Farms, out of the total population over 16 years of age (1,102), 60.2% or 663 individuals are in the labor force, with 21.7% or 144 of them unemployed. The age group with the highest labor force participation rate is 20 to 24 years, with 100.0% or 84 individuals in the labor force. Within the labor force, the 25 to 29 years age range has the highest percentage of unemployed individuals, with 100.0% or 94 of them being unemployed.
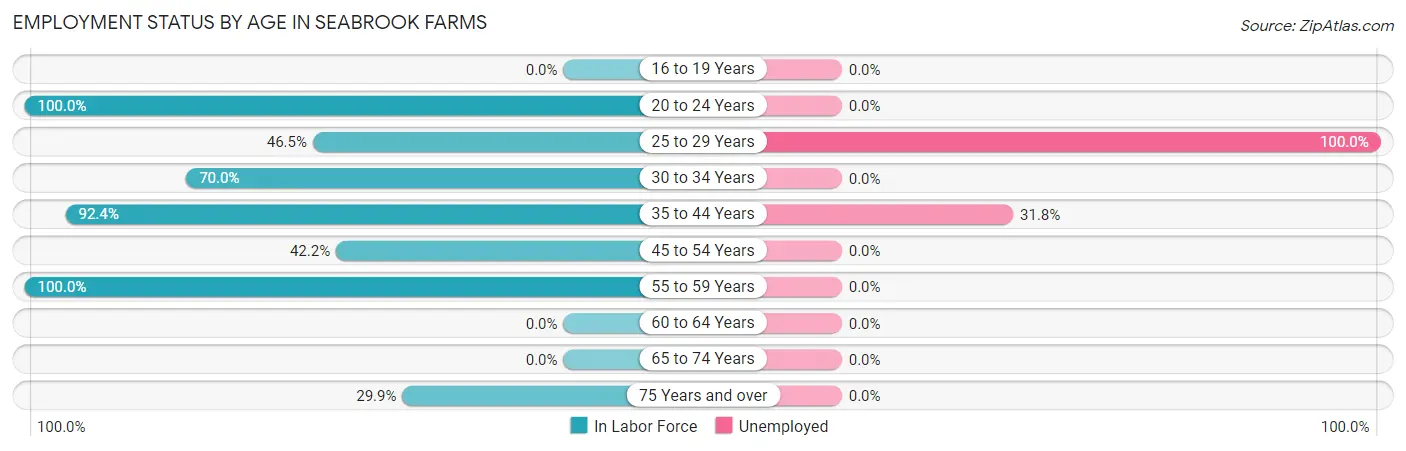
| Age Bracket | In Labor Force | Unemployed |
| 16 to 19 Years | 0 (0.0%) | 0 (0.0%) |
| 20 to 24 Years | 84 (100.0%) | 0 (0.0%) |
| 25 to 29 Years | 94 (46.5%) | 94 (100.0%) |
| 30 to 34 Years | 77 (70.0%) | 0 (0.0%) |
| 35 to 44 Years | 157 (92.4%) | 50 (31.8%) |
| 45 to 54 Years | 94 (42.2%) | 0 (0.0%) |
| 55 to 59 Years | 122 (100.0%) | 0 (0.0%) |
| 60 to 64 Years | 0 (0.0%) | 0 (0.0%) |
| 65 to 74 Years | 0 (0.0%) | 0 (0.0%) |
| 75 Years and over | 35 (29.9%) | 0 (0.0%) |
| Total | 663 (60.2%) | 144 (21.7%) |
Employment Status by Educational Attainment in Seabrook Farms
According to labor force statistics for Seabrook Farms, 65.8% of individuals (544) out of the total population between 25 and 64 years of age (827) are in the labor force, with 26.5% or 144 of them being unemployed. The group with the highest labor force participation rate are those with the educational attainment of less than high school, with 100.0% or 200 individuals in the labor force. Within the labor force, individuals with high school diploma education have the highest percentage of unemployment, with 53.2% or 108 of them being unemployed.
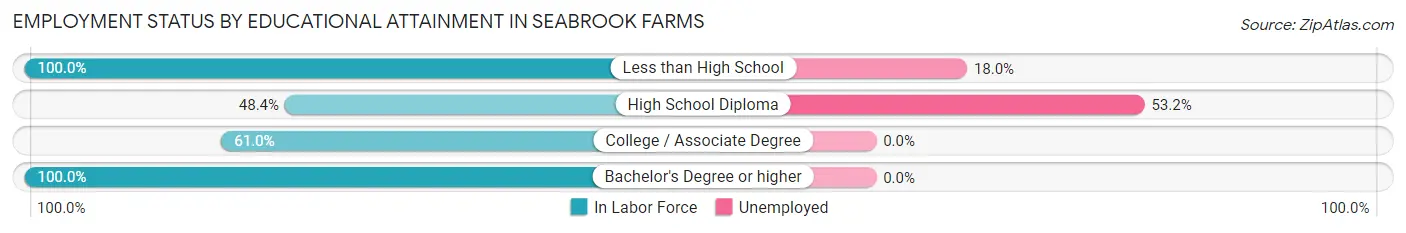
| Educational Attainment | In Labor Force | Unemployed |
| Less than High School | 200 (100.0%) | 36 (18.0%) |
| High School Diploma | 203 (48.4%) | 223 (53.2%) |
| College / Associate Degree | 105 (61.0%) | 0 (0.0%) |
| Bachelor's Degree or higher | 36 (100.0%) | 0 (0.0%) |
| Total | 544 (65.8%) | 219 (26.5%) |
Employment Occupations by Sex in Seabrook Farms
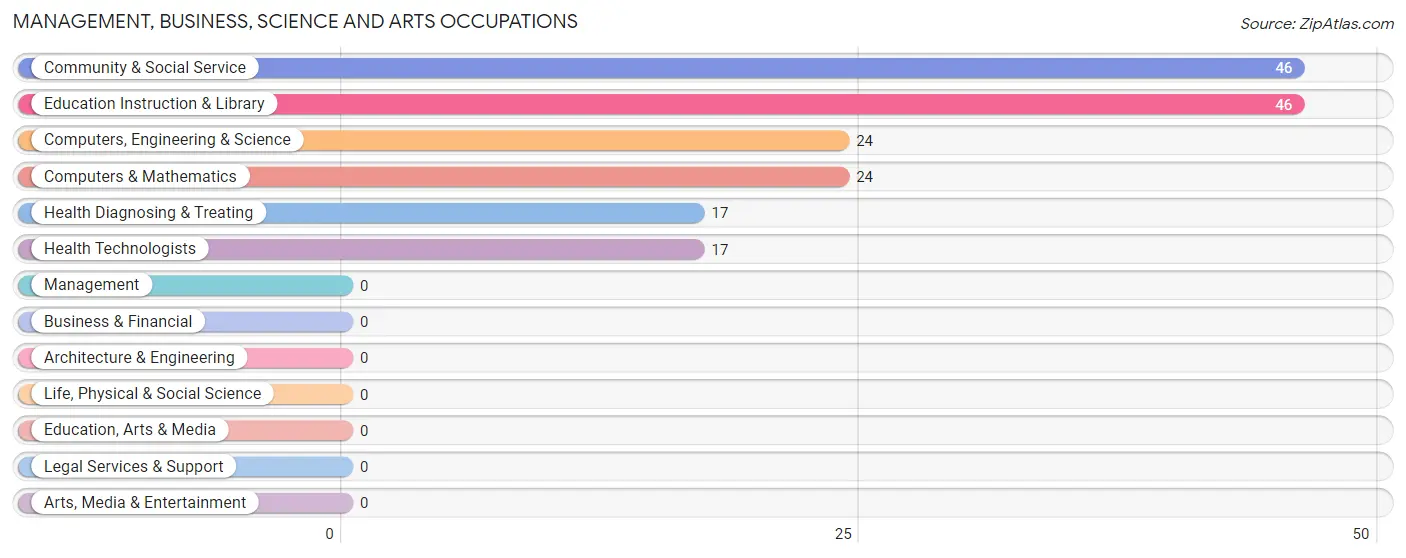
Management, Business, Science and Arts Occupations
The most common Management, Business, Science and Arts occupations in Seabrook Farms are Community & Social Service (46 | 8.9%), Education Instruction & Library (46 | 8.9%), Computers, Engineering & Science (24 | 4.6%), Computers & Mathematics (24 | 4.6%), and Health Diagnosing & Treating (17 | 3.3%).
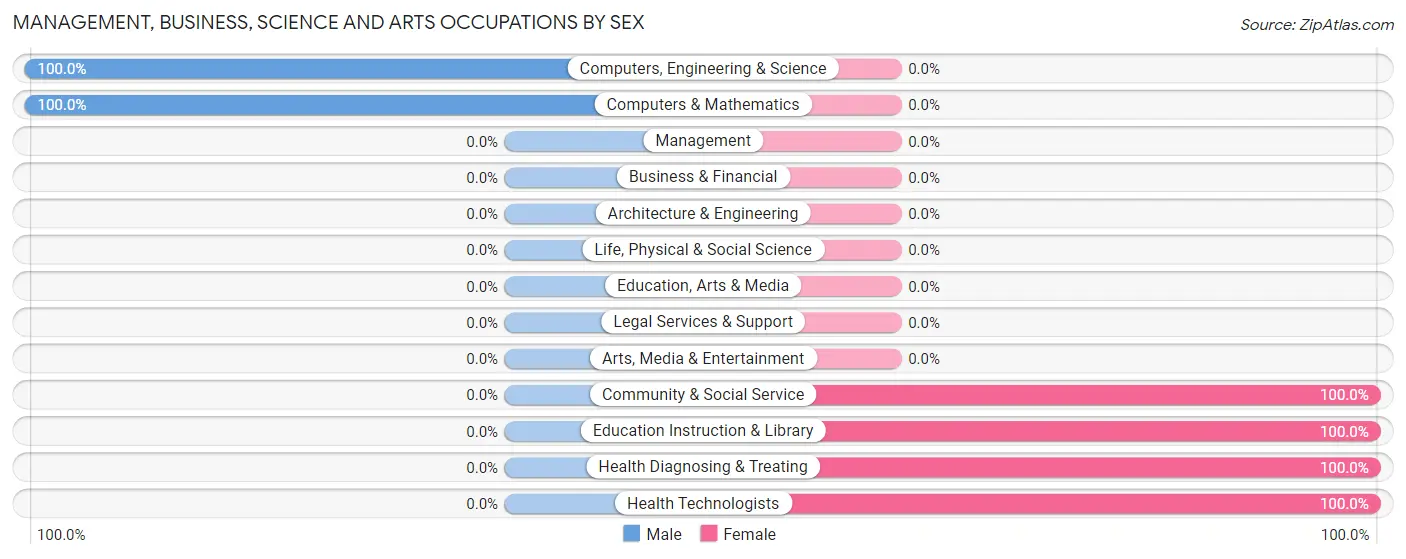
Management, Business, Science and Arts Occupations by Sex
Within the Management, Business, Science and Arts occupations in Seabrook Farms, the most male-oriented occupations are Computers, Engineering & Science (100.0%), and Computers & Mathematics (100.0%), while the most female-oriented occupations are Community & Social Service (100.0%), Education Instruction & Library (100.0%), and Health Diagnosing & Treating (100.0%).
| Occupation | Male | Female |
| Management | 0 (0.0%) | 0 (0.0%) |
| Business & Financial | 0 (0.0%) | 0 (0.0%) |
| Computers, Engineering & Science | 24 (100.0%) | 0 (0.0%) |
| Computers & Mathematics | 24 (100.0%) | 0 (0.0%) |
| Architecture & Engineering | 0 (0.0%) | 0 (0.0%) |
| Life, Physical & Social Science | 0 (0.0%) | 0 (0.0%) |
| Community & Social Service | 0 (0.0%) | 46 (100.0%) |
| Education, Arts & Media | 0 (0.0%) | 0 (0.0%) |
| Legal Services & Support | 0 (0.0%) | 0 (0.0%) |
| Education Instruction & Library | 0 (0.0%) | 46 (100.0%) |
| Arts, Media & Entertainment | 0 (0.0%) | 0 (0.0%) |
| Health Diagnosing & Treating | 0 (0.0%) | 17 (100.0%) |
| Health Technologists | 0 (0.0%) | 17 (100.0%) |
| Total (Category) | 24 (27.6%) | 63 (72.4%) |
| Total (Overall) | 260 (50.1%) | 259 (49.9%) |
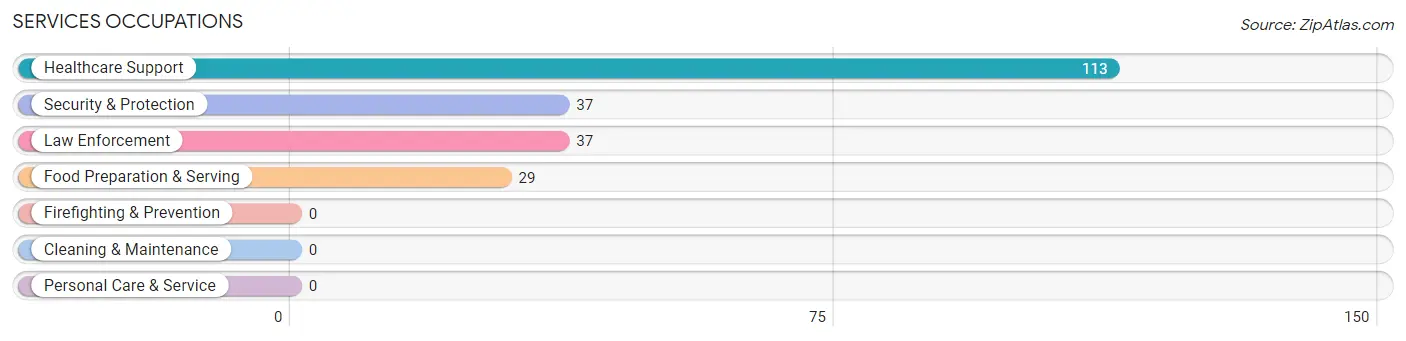
Services Occupations
The most common Services occupations in Seabrook Farms are Healthcare Support (113 | 21.8%), Security & Protection (37 | 7.1%), Law Enforcement (37 | 7.1%), and Food Preparation & Serving (29 | 5.6%).
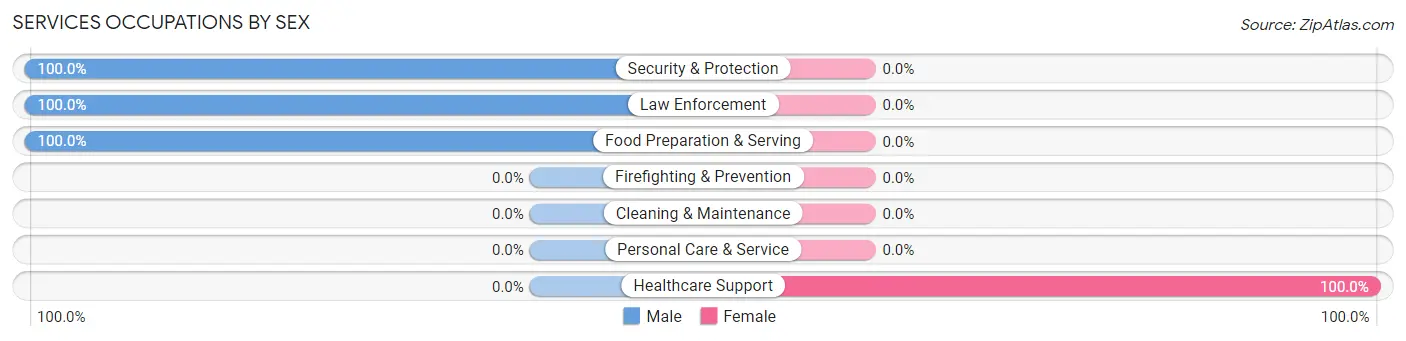
Services Occupations by Sex
| Occupation | Male | Female |
| Healthcare Support | 0 (0.0%) | 113 (100.0%) |
| Security & Protection | 37 (100.0%) | 0 (0.0%) |
| Firefighting & Prevention | 0 (0.0%) | 0 (0.0%) |
| Law Enforcement | 37 (100.0%) | 0 (0.0%) |
| Food Preparation & Serving | 29 (100.0%) | 0 (0.0%) |
| Cleaning & Maintenance | 0 (0.0%) | 0 (0.0%) |
| Personal Care & Service | 0 (0.0%) | 0 (0.0%) |
| Total (Category) | 66 (36.9%) | 113 (63.1%) |
| Total (Overall) | 260 (50.1%) | 259 (49.9%) |
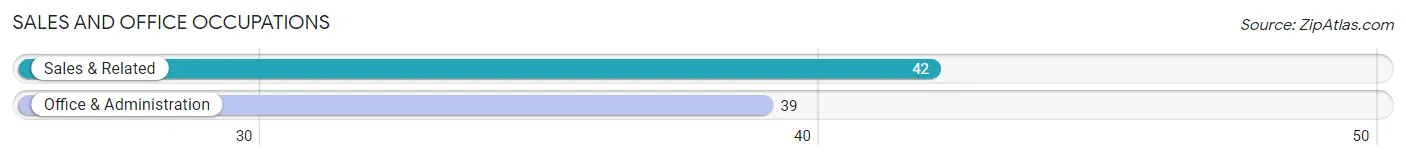
Sales and Office Occupations
The most common Sales and Office occupations in Seabrook Farms are Sales & Related (42 | 8.1%), and Office & Administration (39 | 7.5%).
Sales and Office Occupations by Sex
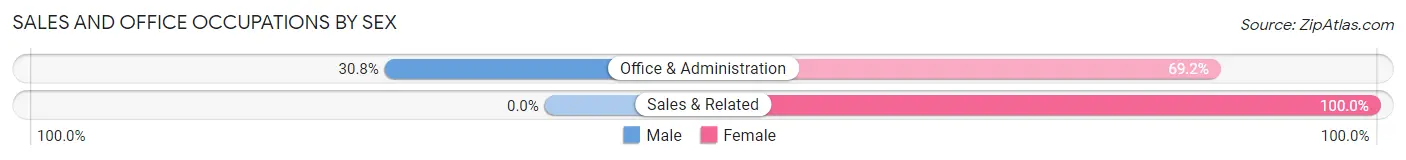
| Occupation | Male | Female |
| Sales & Related | 0 (0.0%) | 42 (100.0%) |
| Office & Administration | 12 (30.8%) | 27 (69.2%) |
| Total (Category) | 12 (14.8%) | 69 (85.2%) |
| Total (Overall) | 260 (50.1%) | 259 (49.9%) |
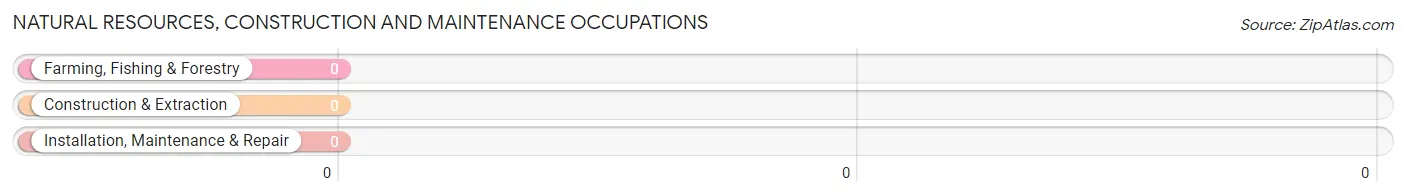
Natural Resources, Construction and Maintenance Occupations
Natural Resources, Construction and Maintenance Occupations by Sex
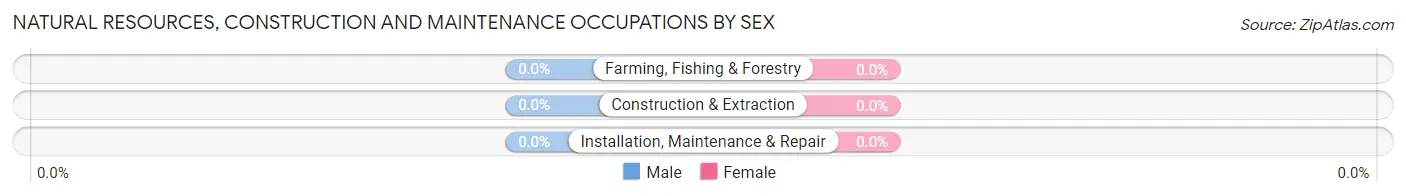
| Occupation | Male | Female |
| Farming, Fishing & Forestry | 0 (0.0%) | 0 (0.0%) |
| Construction & Extraction | 0 (0.0%) | 0 (0.0%) |
| Installation, Maintenance & Repair | 0 (0.0%) | 0 (0.0%) |
| Total (Category) | 0 (0.0%) | 0 (0.0%) |
| Total (Overall) | 260 (50.1%) | 259 (49.9%) |
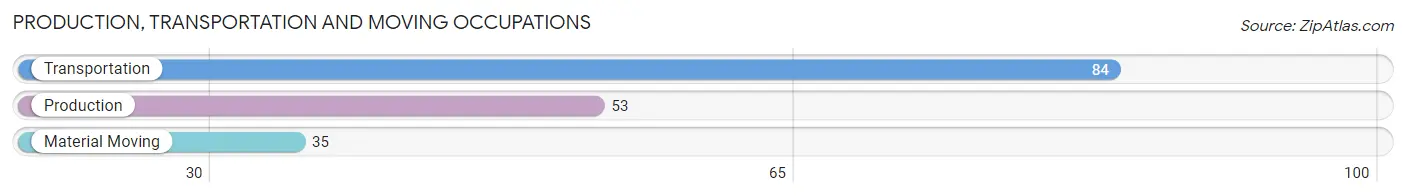
Production, Transportation and Moving Occupations
The most common Production, Transportation and Moving occupations in Seabrook Farms are Transportation (84 | 16.2%), Production (53 | 10.2%), and Material Moving (35 | 6.7%).
Production, Transportation and Moving Occupations by Sex
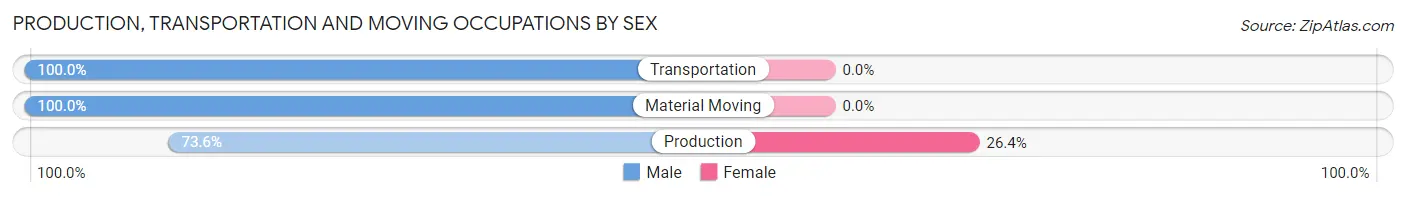
| Occupation | Male | Female |
| Production | 39 (73.6%) | 14 (26.4%) |
| Transportation | 84 (100.0%) | 0 (0.0%) |
| Material Moving | 35 (100.0%) | 0 (0.0%) |
| Total (Category) | 158 (91.9%) | 14 (8.1%) |
| Total (Overall) | 260 (50.1%) | 259 (49.9%) |
Employment Industries by Sex in Seabrook Farms
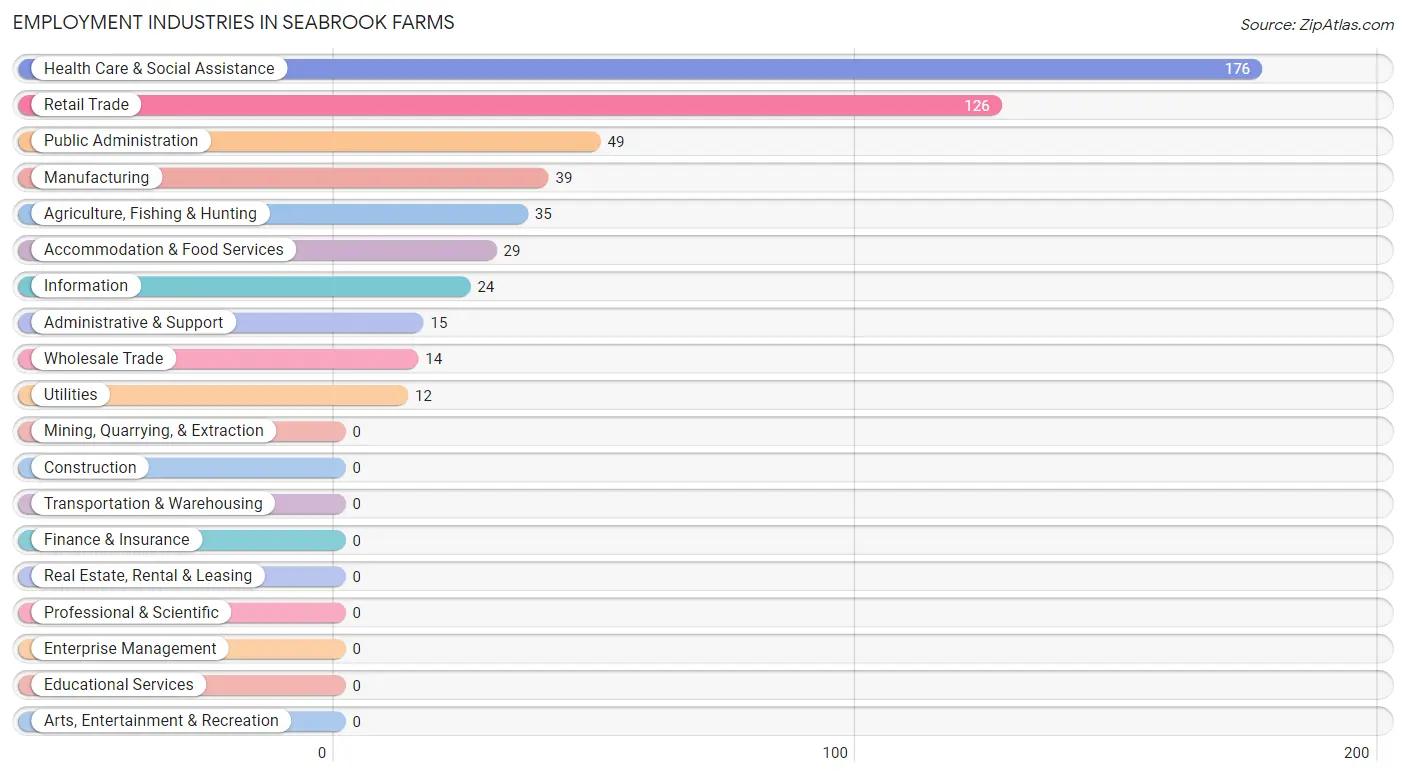
Employment Industries in Seabrook Farms
The major employment industries in Seabrook Farms include Health Care & Social Assistance (176 | 33.9%), Retail Trade (126 | 24.3%), Public Administration (49 | 9.4%), Manufacturing (39 | 7.5%), and Agriculture, Fishing & Hunting (35 | 6.7%).
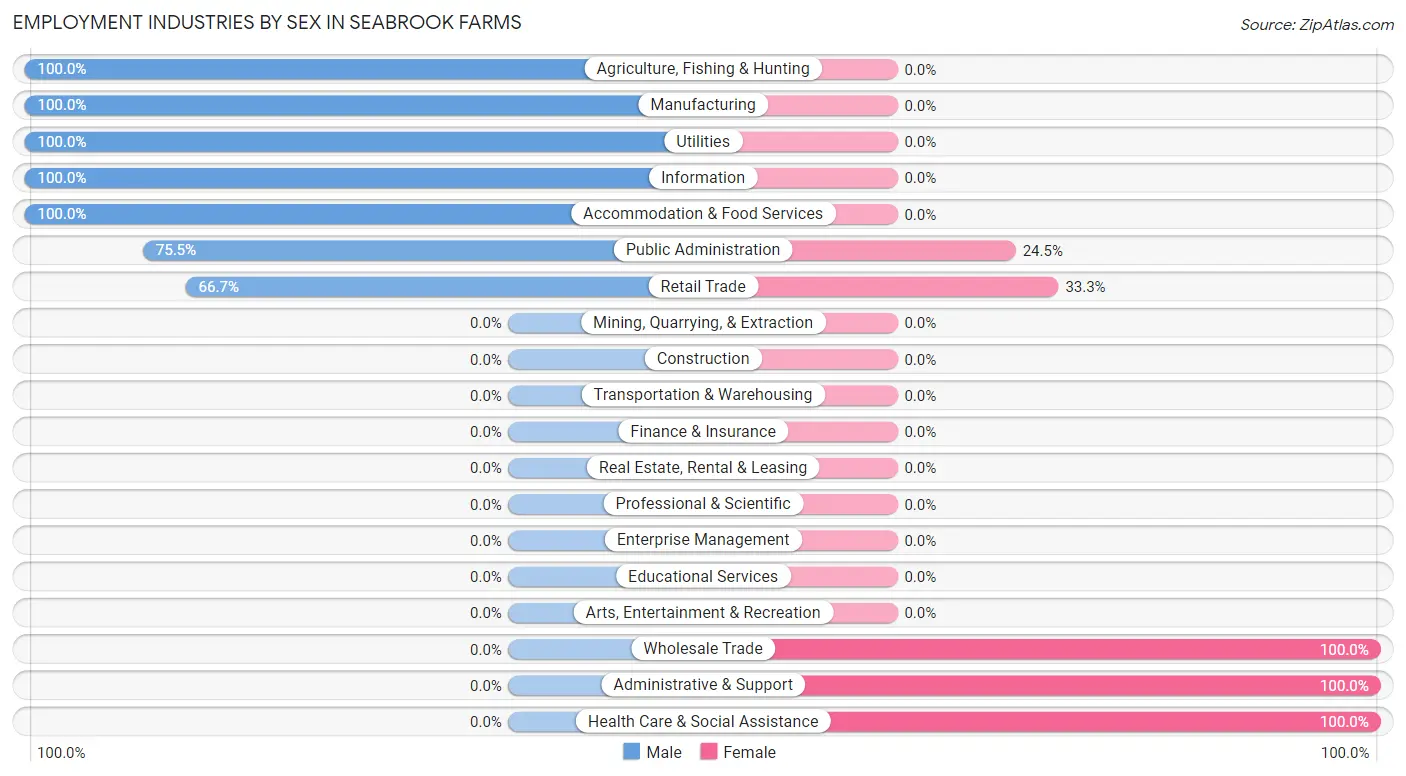
Employment Industries by Sex in Seabrook Farms
The Seabrook Farms industries that see more men than women are Agriculture, Fishing & Hunting (100.0%), Manufacturing (100.0%), and Utilities (100.0%), whereas the industries that tend to have a higher number of women are Wholesale Trade (100.0%), Administrative & Support (100.0%), and Health Care & Social Assistance (100.0%).
| Industry | Male | Female |
| Agriculture, Fishing & Hunting | 35 (100.0%) | 0 (0.0%) |
| Mining, Quarrying, & Extraction | 0 (0.0%) | 0 (0.0%) |
| Construction | 0 (0.0%) | 0 (0.0%) |
| Manufacturing | 39 (100.0%) | 0 (0.0%) |
| Wholesale Trade | 0 (0.0%) | 14 (100.0%) |
| Retail Trade | 84 (66.7%) | 42 (33.3%) |
| Transportation & Warehousing | 0 (0.0%) | 0 (0.0%) |
| Utilities | 12 (100.0%) | 0 (0.0%) |
| Information | 24 (100.0%) | 0 (0.0%) |
| Finance & Insurance | 0 (0.0%) | 0 (0.0%) |
| Real Estate, Rental & Leasing | 0 (0.0%) | 0 (0.0%) |
| Professional & Scientific | 0 (0.0%) | 0 (0.0%) |
| Enterprise Management | 0 (0.0%) | 0 (0.0%) |
| Administrative & Support | 0 (0.0%) | 15 (100.0%) |
| Educational Services | 0 (0.0%) | 0 (0.0%) |
| Health Care & Social Assistance | 0 (0.0%) | 176 (100.0%) |
| Arts, Entertainment & Recreation | 0 (0.0%) | 0 (0.0%) |
| Accommodation & Food Services | 29 (100.0%) | 0 (0.0%) |
| Public Administration | 37 (75.5%) | 12 (24.5%) |
| Total | 260 (50.1%) | 259 (49.9%) |
Education in Seabrook Farms
School Enrollment in Seabrook Farms
The most common levels of schooling among the 430 students in Seabrook Farms are high school (124 | 28.8%), middle school (106 | 24.6%), and nursery / preschool (101 | 23.5%).
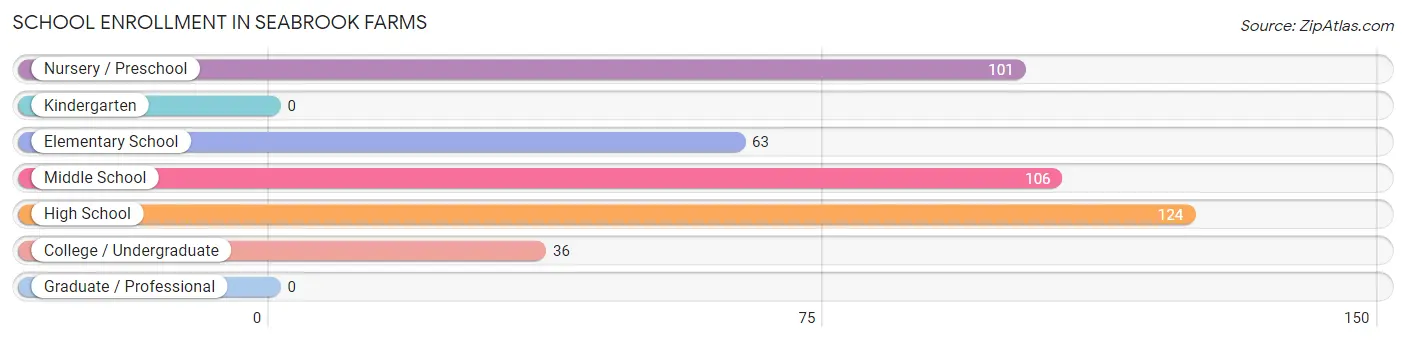
| School Level | # Students | % Students |
| Nursery / Preschool | 101 | 23.5% |
| Kindergarten | 0 | 0.0% |
| Elementary School | 63 | 14.6% |
| Middle School | 106 | 24.6% |
| High School | 124 | 28.8% |
| College / Undergraduate | 36 | 8.4% |
| Graduate / Professional | 0 | 0.0% |
| Total | 430 | 100.0% |
School Enrollment by Age by Funding Source in Seabrook Farms
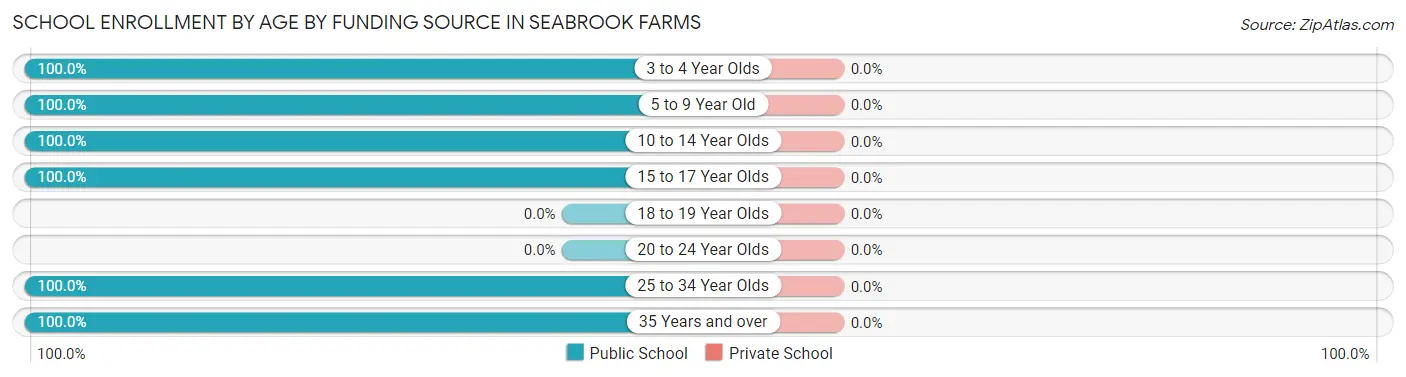
| Age Bracket | Public School | Private School |
| 3 to 4 Year Olds | 60 (100.0%) | 0 (0.0%) |
| 5 to 9 Year Old | 88 (100.0%) | 0 (0.0%) |
| 10 to 14 Year Olds | 122 (100.0%) | 0 (0.0%) |
| 15 to 17 Year Olds | 82 (100.0%) | 0 (0.0%) |
| 18 to 19 Year Olds | 0 (0.0%) | 0 (0.0%) |
| 20 to 24 Year Olds | 0 (0.0%) | 0 (0.0%) |
| 25 to 34 Year Olds | 36 (100.0%) | 0 (0.0%) |
| 35 Years and over | 42 (100.0%) | 0 (0.0%) |
| Total | 430 (100.0%) | 0 (0.0%) |
Educational Attainment by Field of Study in Seabrook Farms
Social sciences (19 | 33.3%), science & technology (17 | 29.8%), business (11 | 19.3%), and education (10 | 17.5%) are the most common fields of study among 57 individuals in Seabrook Farms who have obtained a bachelor's degree or higher.
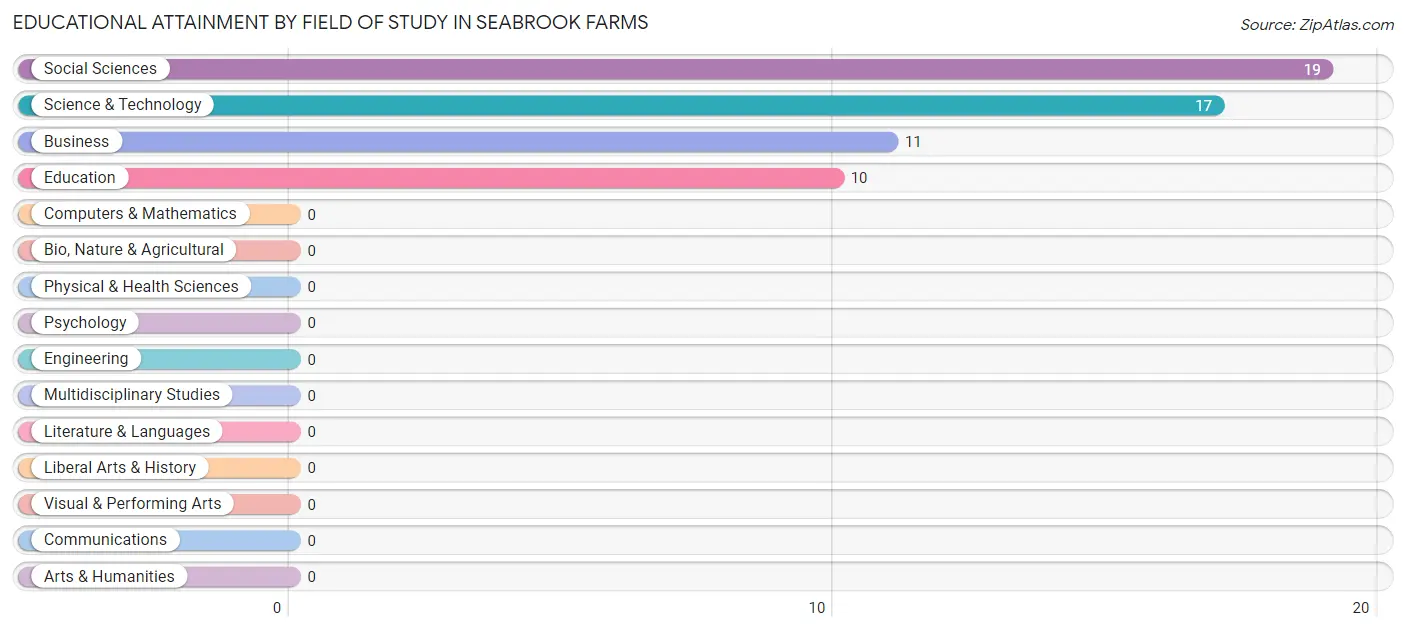
| Field of Study | # Graduates | % Graduates |
| Computers & Mathematics | 0 | 0.0% |
| Bio, Nature & Agricultural | 0 | 0.0% |
| Physical & Health Sciences | 0 | 0.0% |
| Psychology | 0 | 0.0% |
| Social Sciences | 19 | 33.3% |
| Engineering | 0 | 0.0% |
| Multidisciplinary Studies | 0 | 0.0% |
| Science & Technology | 17 | 29.8% |
| Business | 11 | 19.3% |
| Education | 10 | 17.5% |
| Literature & Languages | 0 | 0.0% |
| Liberal Arts & History | 0 | 0.0% |
| Visual & Performing Arts | 0 | 0.0% |
| Communications | 0 | 0.0% |
| Arts & Humanities | 0 | 0.0% |
| Total | 57 | 100.0% |
Transportation & Commute in Seabrook Farms
Vehicle Availability by Sex in Seabrook Farms
The most prevalent vehicle ownership categories in Seabrook Farms are males with 1 vehicle (211, accounting for 81.1%) and females with 1 vehicle (103, making up 81.5%).
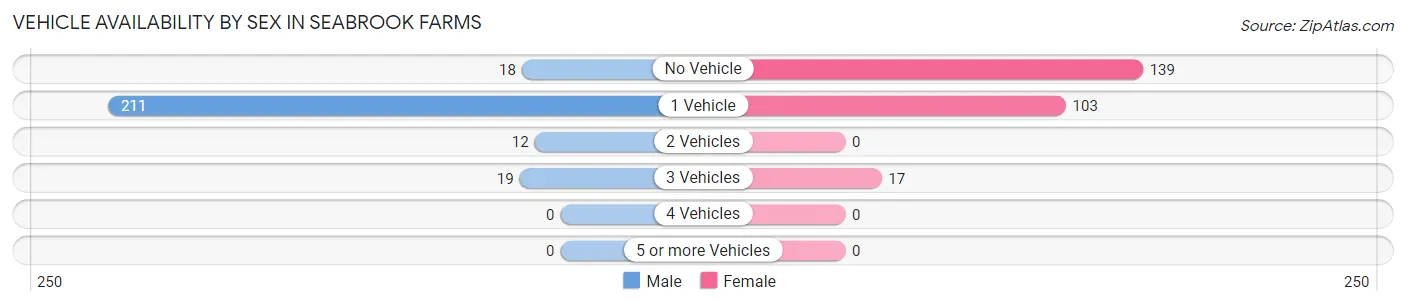
| Vehicles Available | Male | Female |
| No Vehicle | 18 (6.9%) | 139 (53.7%) |
| 1 Vehicle | 211 (81.1%) | 103 (39.8%) |
| 2 Vehicles | 12 (4.6%) | 0 (0.0%) |
| 3 Vehicles | 19 (7.3%) | 17 (6.6%) |
| 4 Vehicles | 0 (0.0%) | 0 (0.0%) |
| 5 or more Vehicles | 0 (0.0%) | 0 (0.0%) |
| Total | 260 (100.0%) | 259 (100.0%) |
Commute Time in Seabrook Farms
The most frequently occuring commute durations in Seabrook Farms are 25 to 29 minutes (162 commuters, 32.1%), 10 to 14 minutes (103 commuters, 20.4%), and 15 to 19 minutes (97 commuters, 19.3%).
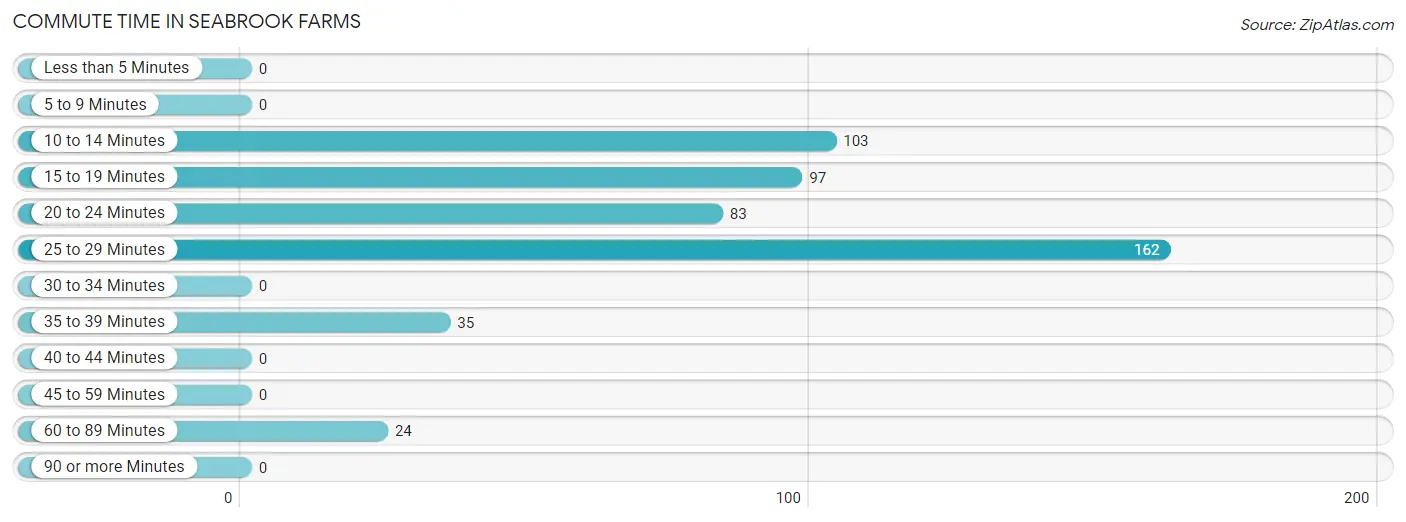
| Commute Time | # Commuters | % Commuters |
| Less than 5 Minutes | 0 | 0.0% |
| 5 to 9 Minutes | 0 | 0.0% |
| 10 to 14 Minutes | 103 | 20.4% |
| 15 to 19 Minutes | 97 | 19.3% |
| 20 to 24 Minutes | 83 | 16.5% |
| 25 to 29 Minutes | 162 | 32.1% |
| 30 to 34 Minutes | 0 | 0.0% |
| 35 to 39 Minutes | 35 | 6.9% |
| 40 to 44 Minutes | 0 | 0.0% |
| 45 to 59 Minutes | 0 | 0.0% |
| 60 to 89 Minutes | 24 | 4.8% |
| 90 or more Minutes | 0 | 0.0% |
Commute Time by Sex in Seabrook Farms
The most common commute times in Seabrook Farms are 25 to 29 minutes (132 commuters, 50.8%) for males and 20 to 24 minutes (83 commuters, 34.0%) for females.
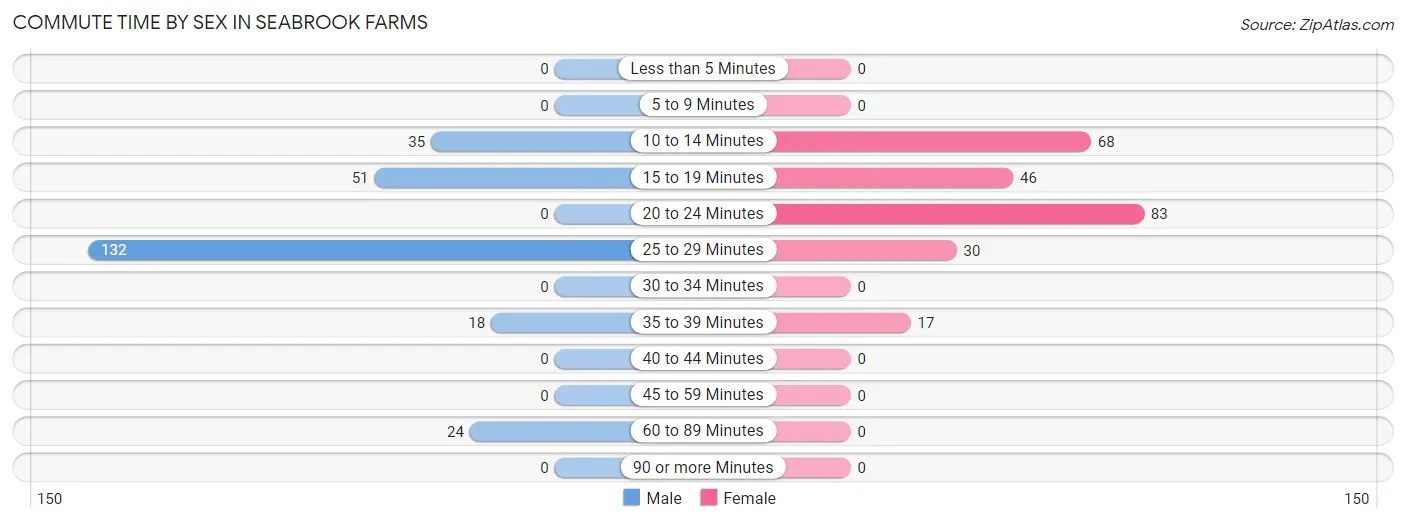
| Commute Time | Male | Female |
| Less than 5 Minutes | 0 (0.0%) | 0 (0.0%) |
| 5 to 9 Minutes | 0 (0.0%) | 0 (0.0%) |
| 10 to 14 Minutes | 35 (13.5%) | 68 (27.9%) |
| 15 to 19 Minutes | 51 (19.6%) | 46 (18.9%) |
| 20 to 24 Minutes | 0 (0.0%) | 83 (34.0%) |
| 25 to 29 Minutes | 132 (50.8%) | 30 (12.3%) |
| 30 to 34 Minutes | 0 (0.0%) | 0 (0.0%) |
| 35 to 39 Minutes | 18 (6.9%) | 17 (7.0%) |
| 40 to 44 Minutes | 0 (0.0%) | 0 (0.0%) |
| 45 to 59 Minutes | 0 (0.0%) | 0 (0.0%) |
| 60 to 89 Minutes | 24 (9.2%) | 0 (0.0%) |
| 90 or more Minutes | 0 (0.0%) | 0 (0.0%) |
Time of Departure to Work by Sex in Seabrook Farms
The most frequent times of departure to work in Seabrook Farms are 7:00 AM to 7:29 AM (108, 41.5%) for males and 10:00 AM to 10:59 AM (83, 34.0%) for females.
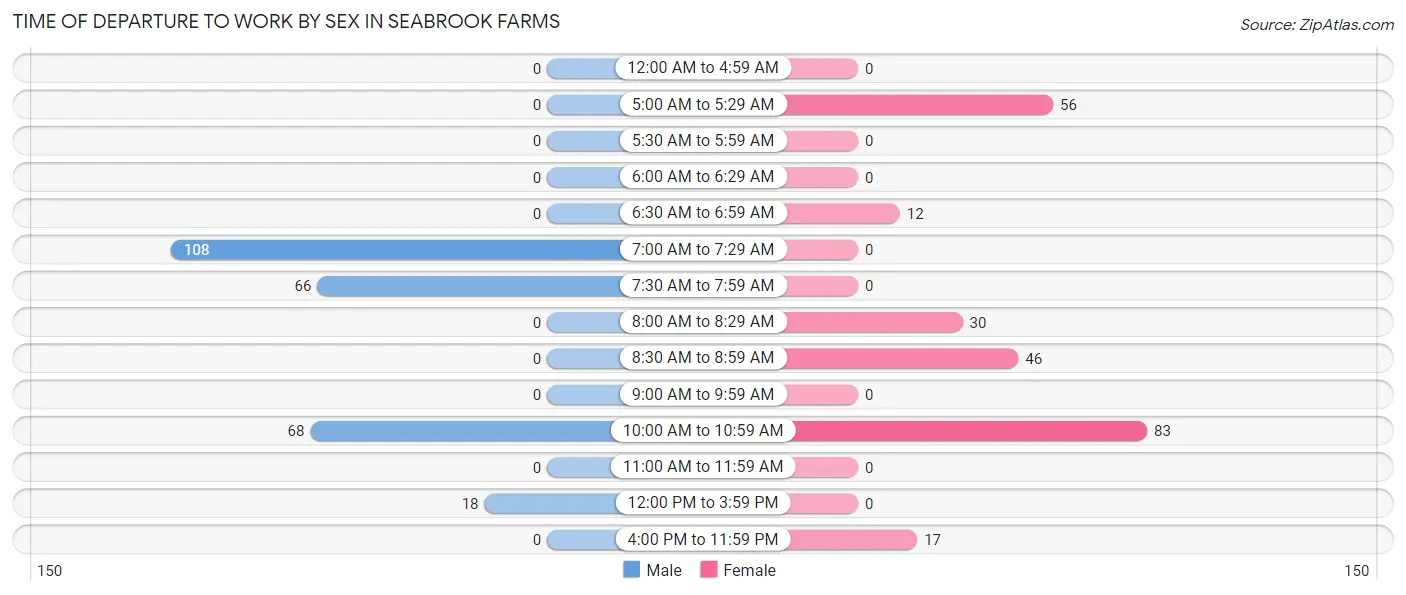
| Time of Departure | Male | Female |
| 12:00 AM to 4:59 AM | 0 (0.0%) | 0 (0.0%) |
| 5:00 AM to 5:29 AM | 0 (0.0%) | 56 (23.0%) |
| 5:30 AM to 5:59 AM | 0 (0.0%) | 0 (0.0%) |
| 6:00 AM to 6:29 AM | 0 (0.0%) | 0 (0.0%) |
| 6:30 AM to 6:59 AM | 0 (0.0%) | 12 (4.9%) |
| 7:00 AM to 7:29 AM | 108 (41.5%) | 0 (0.0%) |
| 7:30 AM to 7:59 AM | 66 (25.4%) | 0 (0.0%) |
| 8:00 AM to 8:29 AM | 0 (0.0%) | 30 (12.3%) |
| 8:30 AM to 8:59 AM | 0 (0.0%) | 46 (18.9%) |
| 9:00 AM to 9:59 AM | 0 (0.0%) | 0 (0.0%) |
| 10:00 AM to 10:59 AM | 68 (26.2%) | 83 (34.0%) |
| 11:00 AM to 11:59 AM | 0 (0.0%) | 0 (0.0%) |
| 12:00 PM to 3:59 PM | 18 (6.9%) | 0 (0.0%) |
| 4:00 PM to 11:59 PM | 0 (0.0%) | 17 (7.0%) |
| Total | 260 (100.0%) | 244 (100.0%) |
Housing Occupancy in Seabrook Farms
Occupancy by Ownership in Seabrook Farms
Of the total 588 dwellings in Seabrook Farms, owner-occupied units account for 89 (15.1%), while renter-occupied units make up 499 (84.9%).
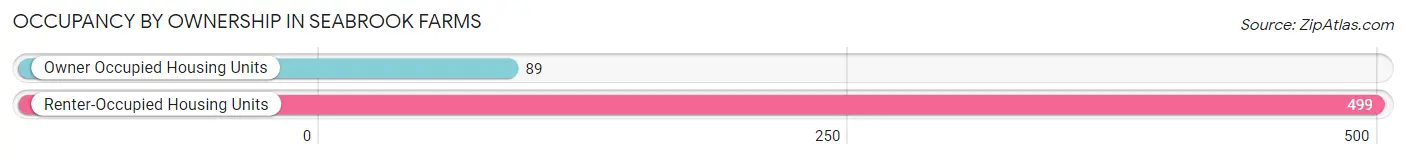
| Occupancy | # Housing Units | % Housing Units |
| Owner Occupied Housing Units | 89 | 15.1% |
| Renter-Occupied Housing Units | 499 | 84.9% |
| Total Occupied Housing Units | 588 | 100.0% |
Occupancy by Household Size in Seabrook Farms
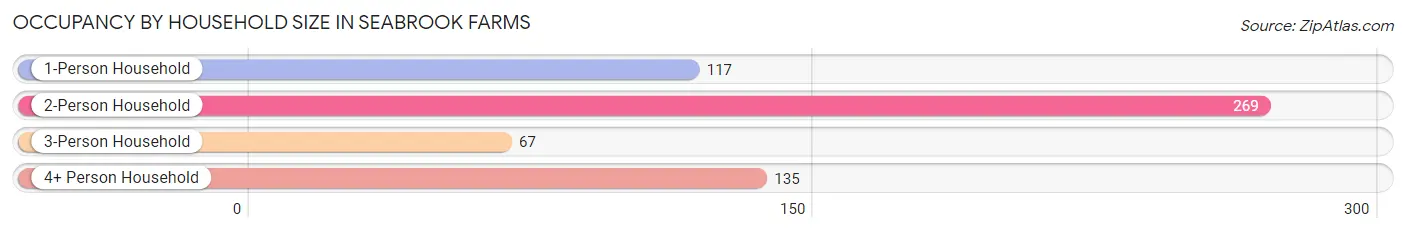
| Household Size | # Housing Units | % Housing Units |
| 1-Person Household | 117 | 19.9% |
| 2-Person Household | 269 | 45.8% |
| 3-Person Household | 67 | 11.4% |
| 4+ Person Household | 135 | 23.0% |
| Total Housing Units | 588 | 100.0% |
Occupancy by Ownership by Household Size in Seabrook Farms
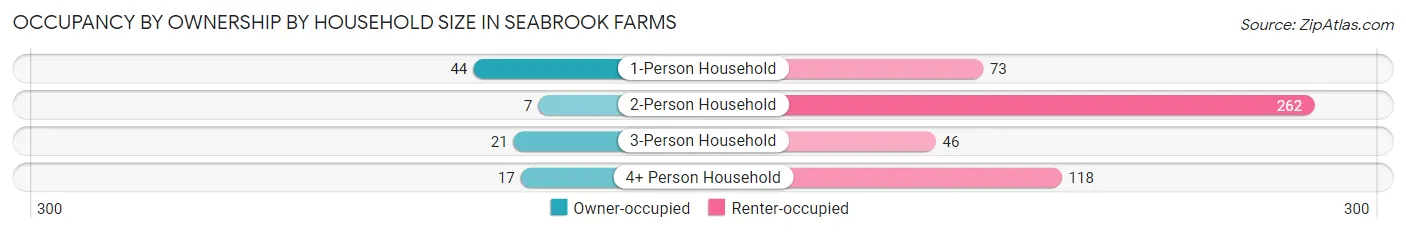
| Household Size | Owner-occupied | Renter-occupied |
| 1-Person Household | 44 (37.6%) | 73 (62.4%) |
| 2-Person Household | 7 (2.6%) | 262 (97.4%) |
| 3-Person Household | 21 (31.3%) | 46 (68.7%) |
| 4+ Person Household | 17 (12.6%) | 118 (87.4%) |
| Total Housing Units | 89 (15.1%) | 499 (84.9%) |
Occupancy by Educational Attainment in Seabrook Farms
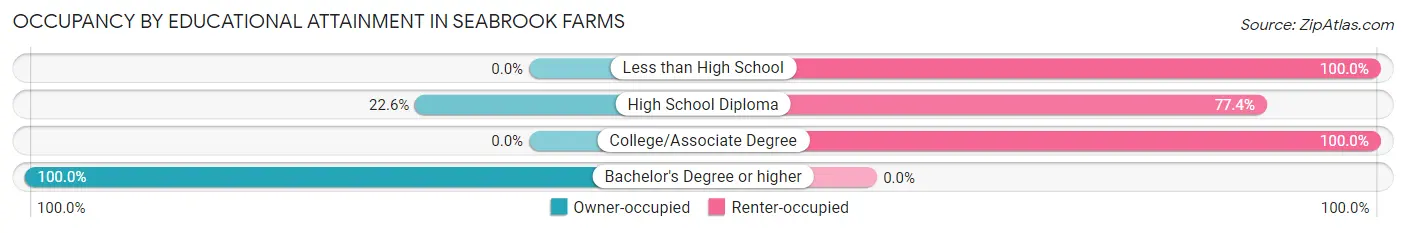
| Household Size | Owner-occupied | Renter-occupied |
| Less than High School | 0 (0.0%) | 233 (100.0%) |
| High School Diploma | 51 (22.6%) | 175 (77.4%) |
| College/Associate Degree | 0 (0.0%) | 91 (100.0%) |
| Bachelor's Degree or higher | 38 (100.0%) | 0 (0.0%) |
Occupancy by Age of Householder in Seabrook Farms
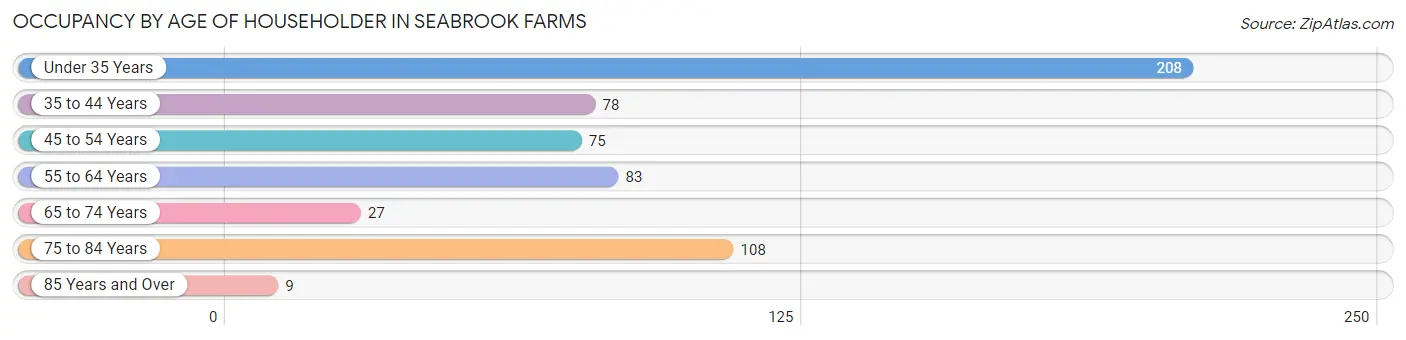
| Age Bracket | # Households | % Households |
| Under 35 Years | 208 | 35.4% |
| 35 to 44 Years | 78 | 13.3% |
| 45 to 54 Years | 75 | 12.8% |
| 55 to 64 Years | 83 | 14.1% |
| 65 to 74 Years | 27 | 4.6% |
| 75 to 84 Years | 108 | 18.4% |
| 85 Years and Over | 9 | 1.5% |
| Total | 588 | 100.0% |
Housing Finances in Seabrook Farms
Median Income by Occupancy in Seabrook Farms
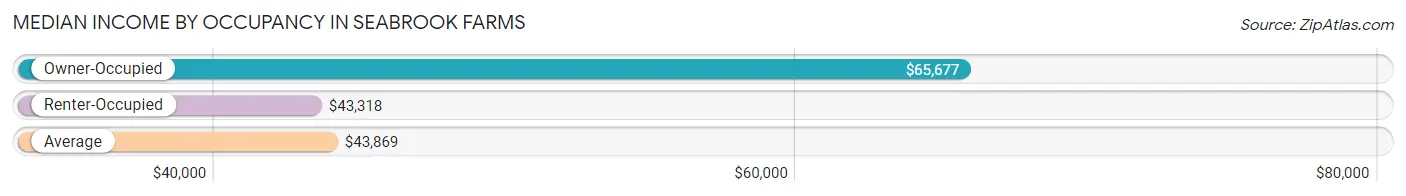
| Occupancy Type | # Households | Median Income |
| Owner-Occupied | 89 (15.1%) | $65,677 |
| Renter-Occupied | 499 (84.9%) | $43,318 |
| Average | 588 (100.0%) | $43,869 |
Occupancy by Householder Income Bracket in Seabrook Farms
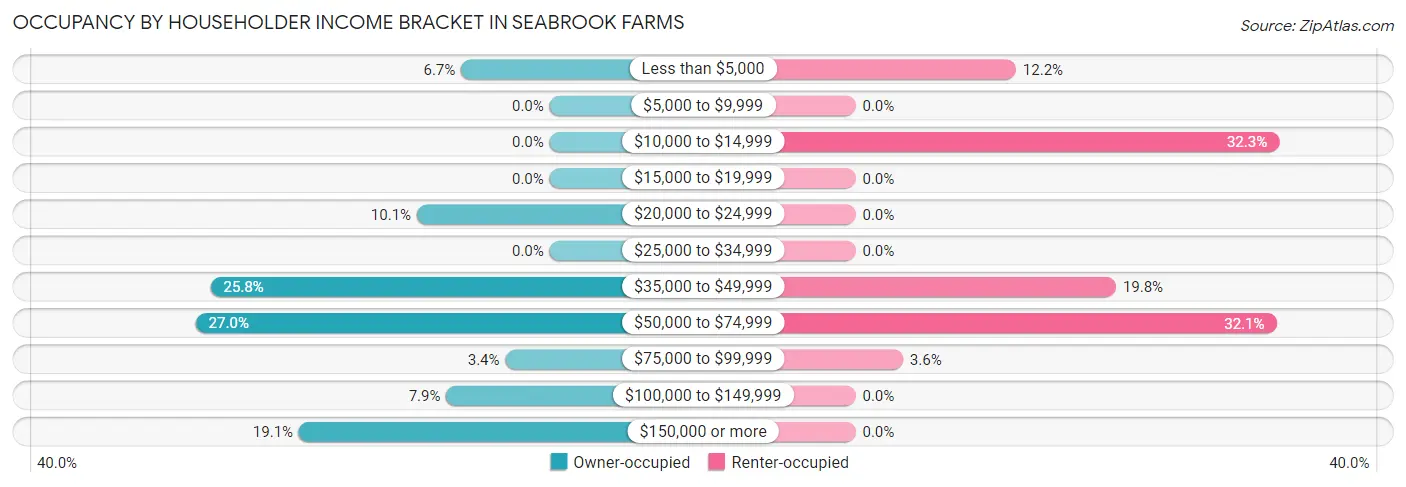
| Income Bracket | Owner-occupied | Renter-occupied |
| Less than $5,000 | 6 (6.7%) | 61 (12.2%) |
| $5,000 to $9,999 | 0 (0.0%) | 0 (0.0%) |
| $10,000 to $14,999 | 0 (0.0%) | 161 (32.3%) |
| $15,000 to $19,999 | 0 (0.0%) | 0 (0.0%) |
| $20,000 to $24,999 | 9 (10.1%) | 0 (0.0%) |
| $25,000 to $34,999 | 0 (0.0%) | 0 (0.0%) |
| $35,000 to $49,999 | 23 (25.8%) | 99 (19.8%) |
| $50,000 to $74,999 | 24 (27.0%) | 160 (32.1%) |
| $75,000 to $99,999 | 3 (3.4%) | 18 (3.6%) |
| $100,000 to $149,999 | 7 (7.9%) | 0 (0.0%) |
| $150,000 or more | 17 (19.1%) | 0 (0.0%) |
| Total | 89 (100.0%) | 499 (100.0%) |
Monthly Housing Cost Tiers in Seabrook Farms
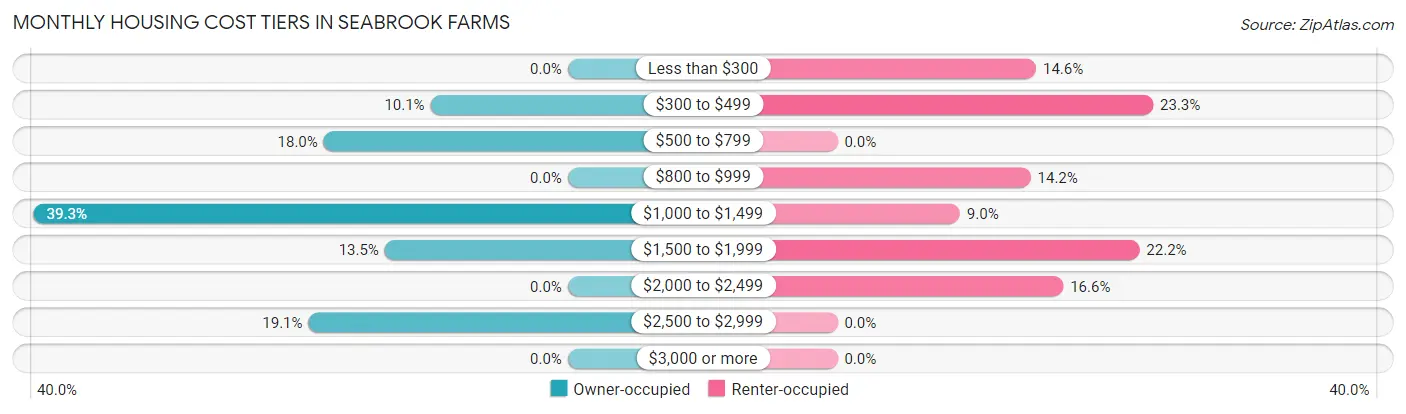
| Monthly Cost | Owner-occupied | Renter-occupied |
| Less than $300 | 0 (0.0%) | 73 (14.6%) |
| $300 to $499 | 9 (10.1%) | 116 (23.3%) |
| $500 to $799 | 16 (18.0%) | 0 (0.0%) |
| $800 to $999 | 0 (0.0%) | 71 (14.2%) |
| $1,000 to $1,499 | 35 (39.3%) | 45 (9.0%) |
| $1,500 to $1,999 | 12 (13.5%) | 111 (22.2%) |
| $2,000 to $2,499 | 0 (0.0%) | 83 (16.6%) |
| $2,500 to $2,999 | 17 (19.1%) | 0 (0.0%) |
| $3,000 or more | 0 (0.0%) | 0 (0.0%) |
| Total | 89 (100.0%) | 499 (100.0%) |
Physical Housing Characteristics in Seabrook Farms
Housing Structures in Seabrook Farms
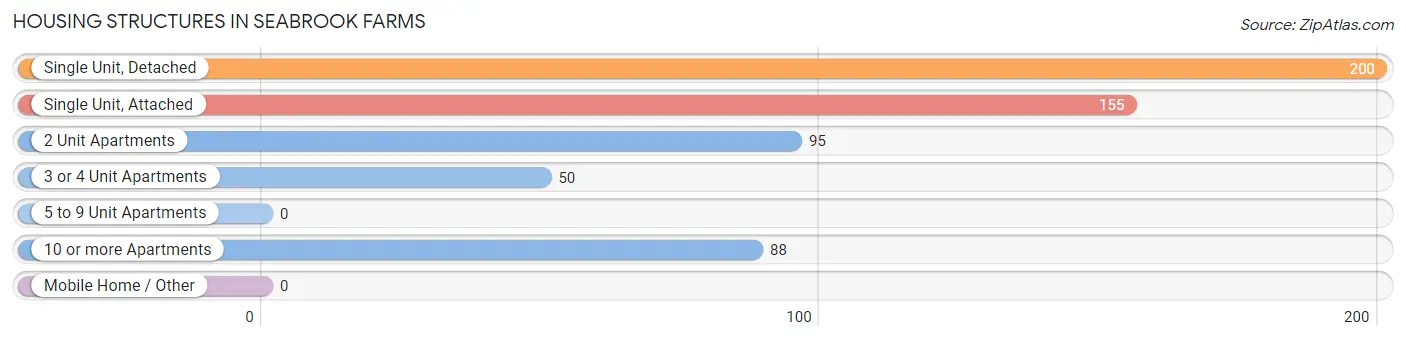
| Structure Type | # Housing Units | % Housing Units |
| Single Unit, Detached | 200 | 34.0% |
| Single Unit, Attached | 155 | 26.4% |
| 2 Unit Apartments | 95 | 16.2% |
| 3 or 4 Unit Apartments | 50 | 8.5% |
| 5 to 9 Unit Apartments | 0 | 0.0% |
| 10 or more Apartments | 88 | 15.0% |
| Mobile Home / Other | 0 | 0.0% |
| Total | 588 | 100.0% |
Housing Structures by Occupancy in Seabrook Farms
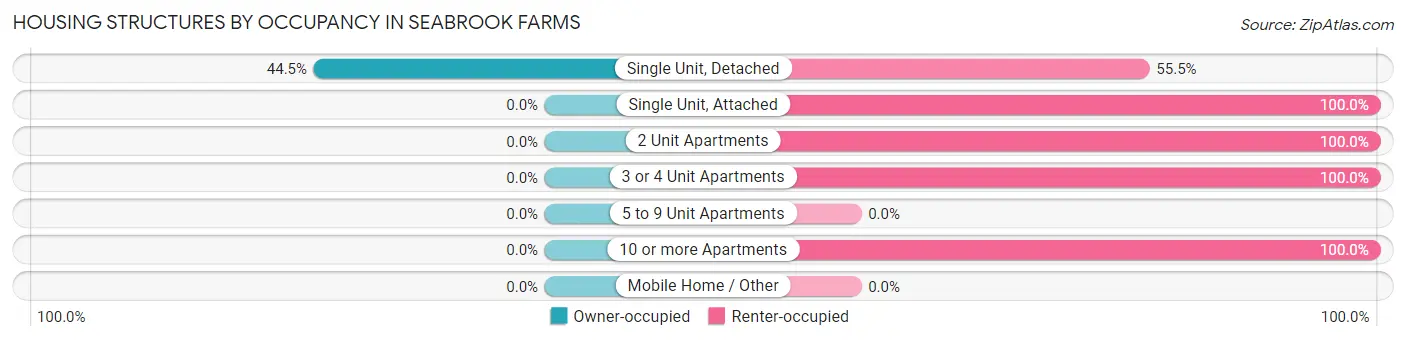
| Structure Type | Owner-occupied | Renter-occupied |
| Single Unit, Detached | 89 (44.5%) | 111 (55.5%) |
| Single Unit, Attached | 0 (0.0%) | 155 (100.0%) |
| 2 Unit Apartments | 0 (0.0%) | 95 (100.0%) |
| 3 or 4 Unit Apartments | 0 (0.0%) | 50 (100.0%) |
| 5 to 9 Unit Apartments | 0 (0.0%) | 0 (0.0%) |
| 10 or more Apartments | 0 (0.0%) | 88 (100.0%) |
| Mobile Home / Other | 0 (0.0%) | 0 (0.0%) |
| Total | 89 (15.1%) | 499 (84.9%) |
Housing Structures by Number of Rooms in Seabrook Farms
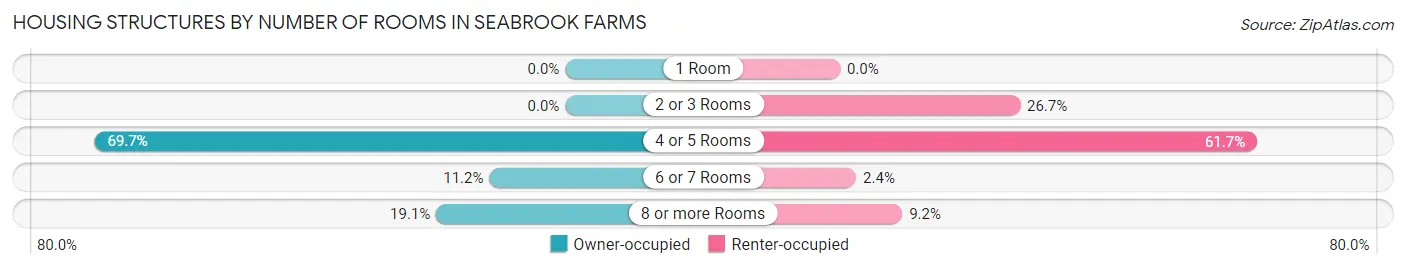
| Number of Rooms | Owner-occupied | Renter-occupied |
| 1 Room | 0 (0.0%) | 0 (0.0%) |
| 2 or 3 Rooms | 0 (0.0%) | 133 (26.7%) |
| 4 or 5 Rooms | 62 (69.7%) | 308 (61.7%) |
| 6 or 7 Rooms | 10 (11.2%) | 12 (2.4%) |
| 8 or more Rooms | 17 (19.1%) | 46 (9.2%) |
| Total | 89 (100.0%) | 499 (100.0%) |
Housing Structure by Heating Type in Seabrook Farms
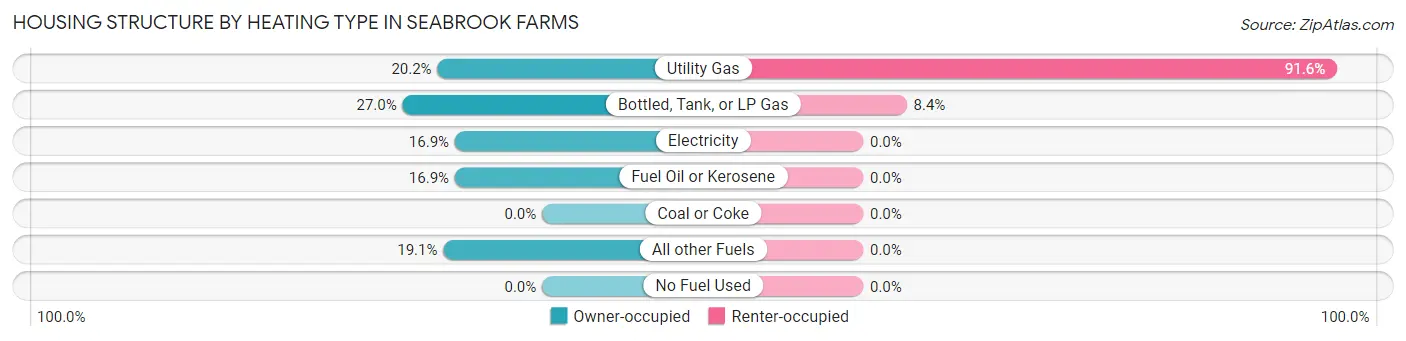
| Heating Type | Owner-occupied | Renter-occupied |
| Utility Gas | 18 (20.2%) | 457 (91.6%) |
| Bottled, Tank, or LP Gas | 24 (27.0%) | 42 (8.4%) |
| Electricity | 15 (16.9%) | 0 (0.0%) |
| Fuel Oil or Kerosene | 15 (16.9%) | 0 (0.0%) |
| Coal or Coke | 0 (0.0%) | 0 (0.0%) |
| All other Fuels | 17 (19.1%) | 0 (0.0%) |
| No Fuel Used | 0 (0.0%) | 0 (0.0%) |
| Total | 89 (100.0%) | 499 (100.0%) |
Household Vehicle Usage in Seabrook Farms
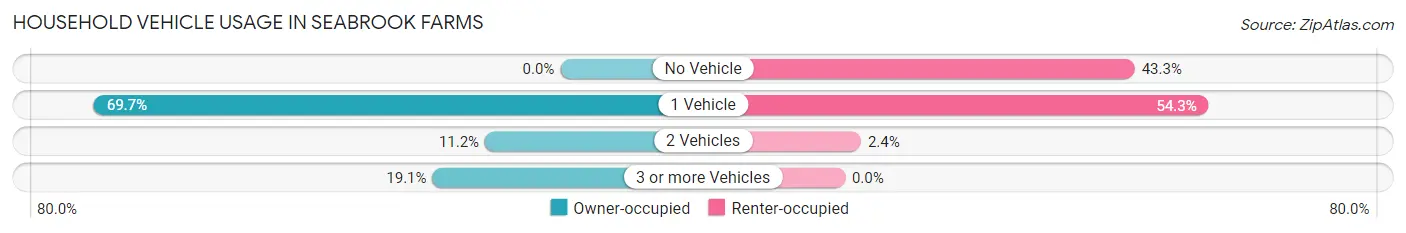
| Vehicles per Household | Owner-occupied | Renter-occupied |
| No Vehicle | 0 (0.0%) | 216 (43.3%) |
| 1 Vehicle | 62 (69.7%) | 271 (54.3%) |
| 2 Vehicles | 10 (11.2%) | 12 (2.4%) |
| 3 or more Vehicles | 17 (19.1%) | 0 (0.0%) |
| Total | 89 (100.0%) | 499 (100.0%) |
Real Estate & Mortgages in Seabrook Farms
Real Estate and Mortgage Overview in Seabrook Farms
| Characteristic | Without Mortgage | With Mortgage |
| Housing Units | 25 | 64 |
| Median Property Value | $180,500 | $268,800 |
| Median Household Income | - | - |
| Monthly Housing Costs | $722 | $0 |
| Real Estate Taxes | $5,781 | $0 |
Property Value by Mortgage Status in Seabrook Farms
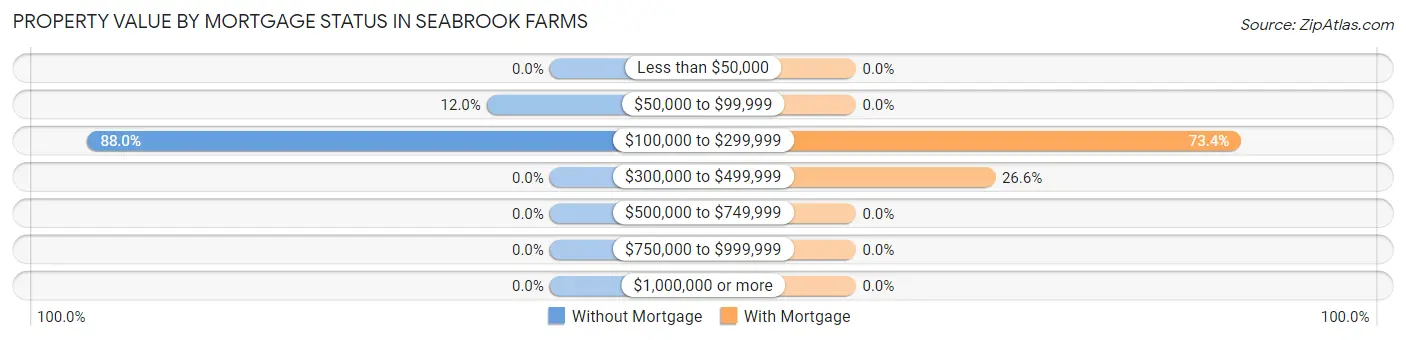
| Property Value | Without Mortgage | With Mortgage |
| Less than $50,000 | 0 (0.0%) | 0 (0.0%) |
| $50,000 to $99,999 | 3 (12.0%) | 0 (0.0%) |
| $100,000 to $299,999 | 22 (88.0%) | 47 (73.4%) |
| $300,000 to $499,999 | 0 (0.0%) | 17 (26.6%) |
| $500,000 to $749,999 | 0 (0.0%) | 0 (0.0%) |
| $750,000 to $999,999 | 0 (0.0%) | 0 (0.0%) |
| $1,000,000 or more | 0 (0.0%) | 0 (0.0%) |
| Total | 25 (100.0%) | 64 (100.0%) |
Household Income by Mortgage Status in Seabrook Farms
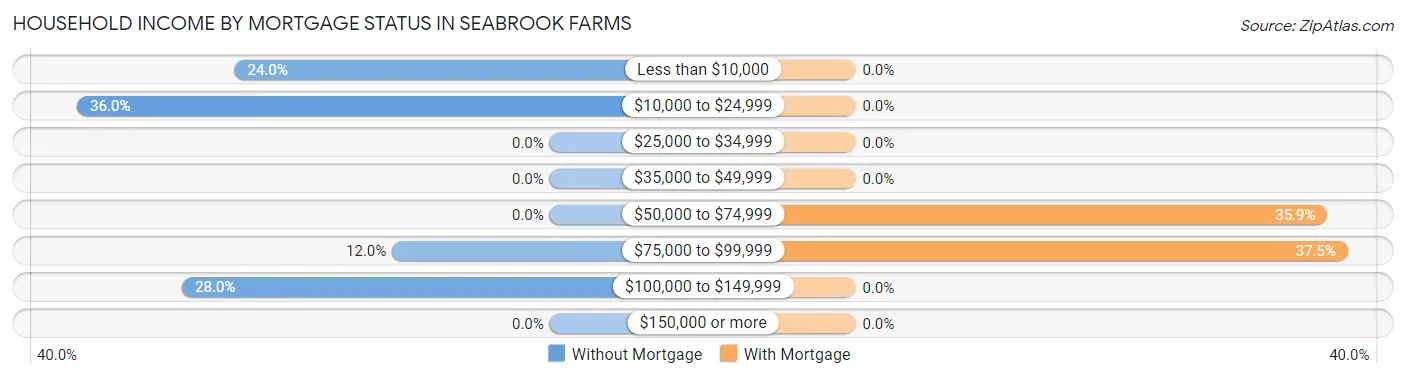
| Household Income | Without Mortgage | With Mortgage |
| Less than $10,000 | 6 (24.0%) | 0 (0.0%) |
| $10,000 to $24,999 | 9 (36.0%) | 0 (0.0%) |
| $25,000 to $34,999 | 0 (0.0%) | 0 (0.0%) |
| $35,000 to $49,999 | 0 (0.0%) | 0 (0.0%) |
| $50,000 to $74,999 | 0 (0.0%) | 23 (35.9%) |
| $75,000 to $99,999 | 3 (12.0%) | 24 (37.5%) |
| $100,000 to $149,999 | 7 (28.0%) | 0 (0.0%) |
| $150,000 or more | 0 (0.0%) | 0 (0.0%) |
| Total | 25 (100.0%) | 64 (100.0%) |
Property Value to Household Income Ratio in Seabrook Farms
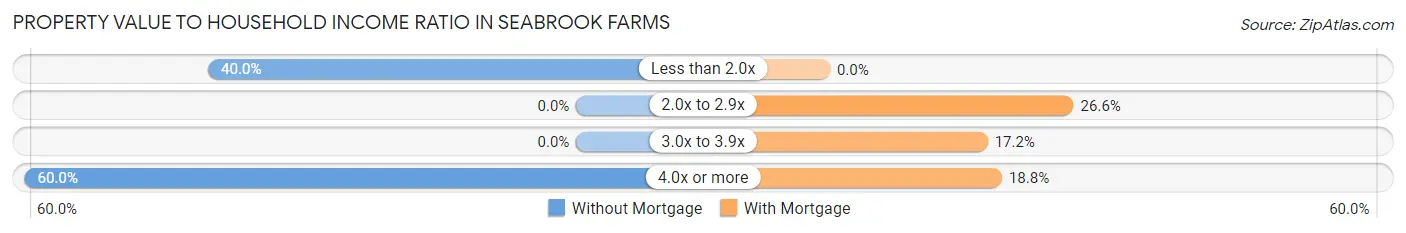
| Value-to-Income Ratio | Without Mortgage | With Mortgage |
| Less than 2.0x | 10 (40.0%) | 0 (0.0%) |
| 2.0x to 2.9x | 0 (0.0%) | 17 (26.6%) |
| 3.0x to 3.9x | 0 (0.0%) | 11 (17.2%) |
| 4.0x or more | 15 (60.0%) | 12 (18.8%) |
| Total | 25 (100.0%) | 64 (100.0%) |
Real Estate Taxes by Mortgage Status in Seabrook Farms
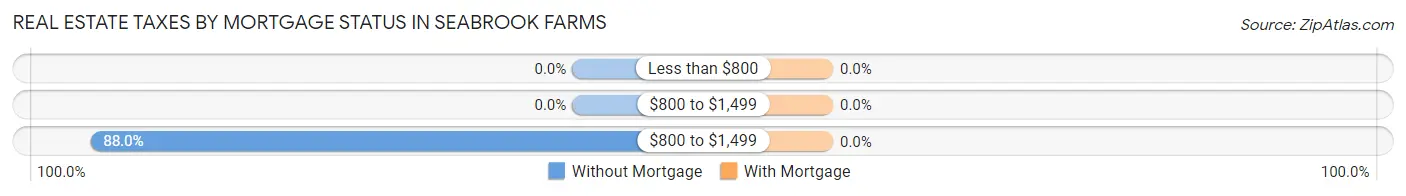
| Property Taxes | Without Mortgage | With Mortgage |
| Less than $800 | 0 (0.0%) | 0 (0.0%) |
| $800 to $1,499 | 0 (0.0%) | 0 (0.0%) |
| $800 to $1,499 | 22 (88.0%) | 0 (0.0%) |
| Total | 25 (100.0%) | 64 (100.0%) |
Health & Disability in Seabrook Farms
Health Insurance Coverage by Age in Seabrook Farms
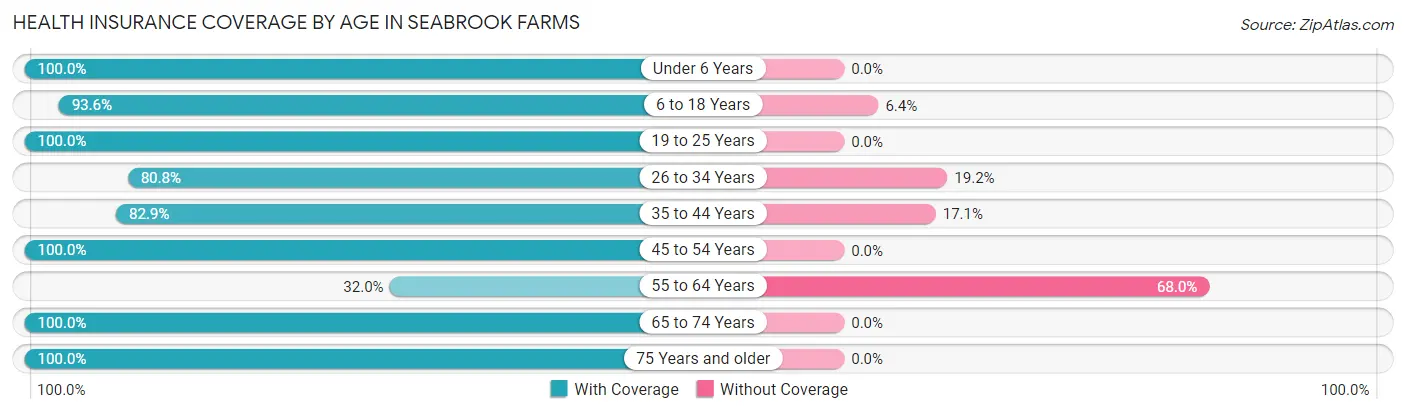
| Age Bracket | With Coverage | Without Coverage |
| Under 6 Years | 131 (100.0%) | 0 (0.0%) |
| 6 to 18 Years | 235 (93.6%) | 16 (6.4%) |
| 19 to 25 Years | 110 (100.0%) | 0 (0.0%) |
| 26 to 34 Years | 231 (80.8%) | 55 (19.2%) |
| 35 to 44 Years | 141 (82.9%) | 29 (17.1%) |
| 45 to 54 Years | 223 (100.0%) | 0 (0.0%) |
| 55 to 64 Years | 39 (32.0%) | 83 (68.0%) |
| 65 to 74 Years | 37 (100.0%) | 0 (0.0%) |
| 75 Years and older | 117 (100.0%) | 0 (0.0%) |
| Total | 1,264 (87.4%) | 183 (12.7%) |
Health Insurance Coverage by Citizenship Status in Seabrook Farms
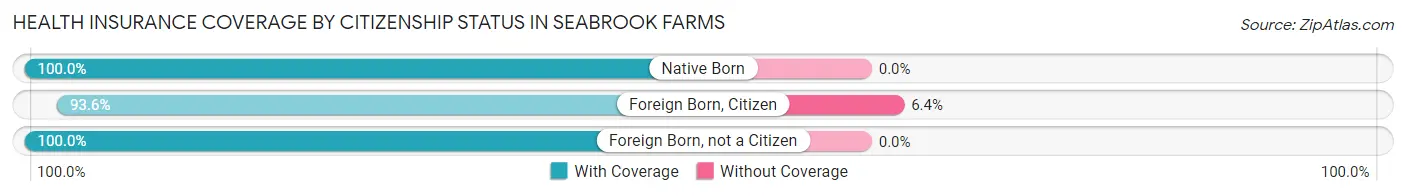
| Citizenship Status | With Coverage | Without Coverage |
| Native Born | 131 (100.0%) | 0 (0.0%) |
| Foreign Born, Citizen | 235 (93.6%) | 16 (6.4%) |
| Foreign Born, not a Citizen | 110 (100.0%) | 0 (0.0%) |
Health Insurance Coverage by Household Income in Seabrook Farms
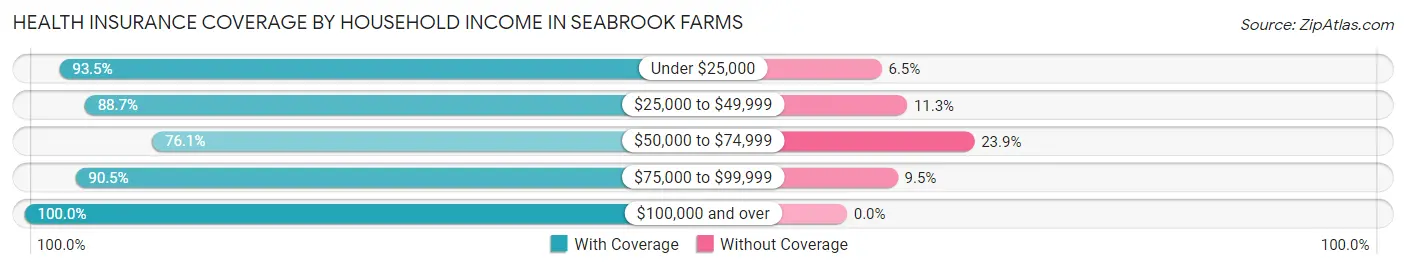
| Household Income | With Coverage | Without Coverage |
| Under $25,000 | 517 (93.5%) | 36 (6.5%) |
| $25,000 to $49,999 | 244 (88.7%) | 31 (11.3%) |
| $50,000 to $74,999 | 357 (76.1%) | 112 (23.9%) |
| $75,000 to $99,999 | 38 (90.5%) | 4 (9.5%) |
| $100,000 and over | 108 (100.0%) | 0 (0.0%) |
Public vs Private Health Insurance Coverage by Age in Seabrook Farms
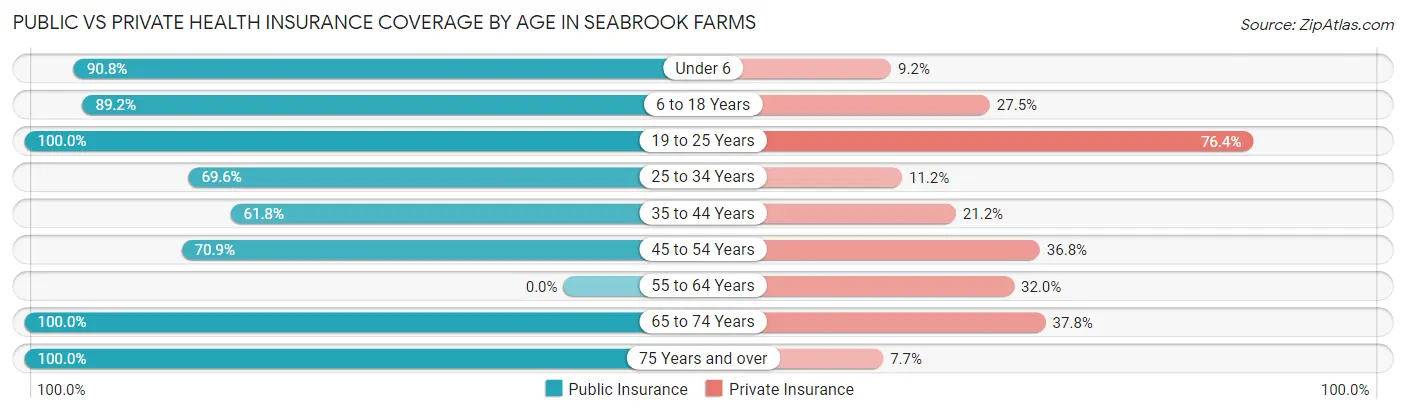
| Age Bracket | Public Insurance | Private Insurance |
| Under 6 | 119 (90.8%) | 12 (9.2%) |
| 6 to 18 Years | 224 (89.2%) | 69 (27.5%) |
| 19 to 25 Years | 110 (100.0%) | 84 (76.4%) |
| 25 to 34 Years | 199 (69.6%) | 32 (11.2%) |
| 35 to 44 Years | 105 (61.8%) | 36 (21.2%) |
| 45 to 54 Years | 158 (70.9%) | 82 (36.8%) |
| 55 to 64 Years | 0 (0.0%) | 39 (32.0%) |
| 65 to 74 Years | 37 (100.0%) | 14 (37.8%) |
| 75 Years and over | 117 (100.0%) | 9 (7.7%) |
| Total | 1,069 (73.9%) | 377 (26.1%) |
Disability Status by Sex by Age in Seabrook Farms
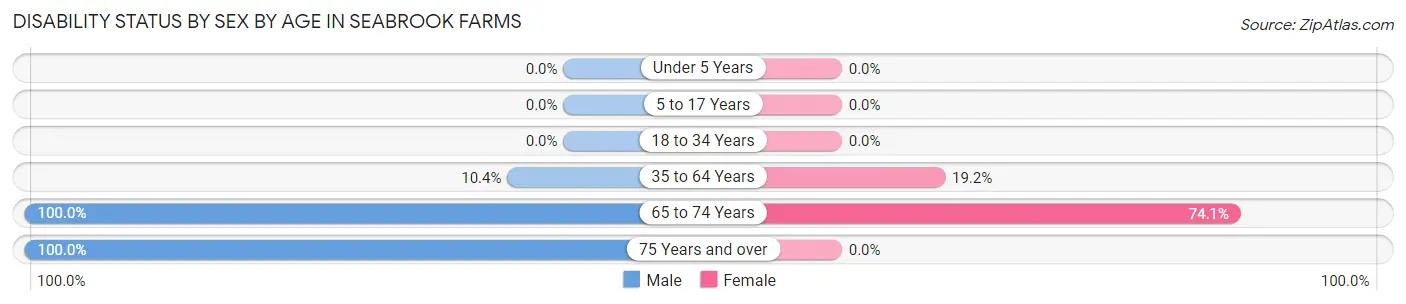
| Age Bracket | Male | Female |
| Under 5 Years | 0 (0.0%) | 0 (0.0%) |
| 5 to 17 Years | 0 (0.0%) | 0 (0.0%) |
| 18 to 34 Years | 0 (0.0%) | 0 (0.0%) |
| 35 to 64 Years | 21 (10.4%) | 60 (19.2%) |
| 65 to 74 Years | 10 (100.0%) | 20 (74.1%) |
| 75 Years and over | 108 (100.0%) | 0 (0.0%) |
Disability Class by Sex by Age in Seabrook Farms
Disability Class: Hearing Difficulty
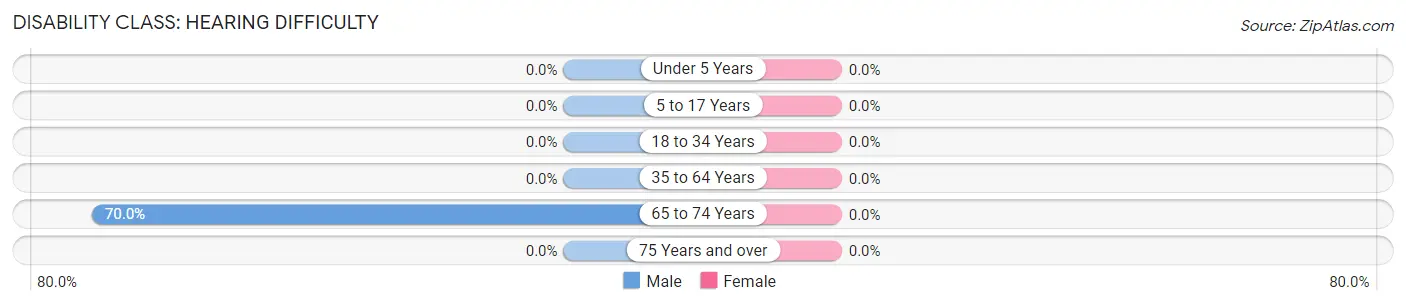
| Age Bracket | Male | Female |
| Under 5 Years | 0 (0.0%) | 0 (0.0%) |
| 5 to 17 Years | 0 (0.0%) | 0 (0.0%) |
| 18 to 34 Years | 0 (0.0%) | 0 (0.0%) |
| 35 to 64 Years | 0 (0.0%) | 0 (0.0%) |
| 65 to 74 Years | 7 (70.0%) | 0 (0.0%) |
| 75 Years and over | 0 (0.0%) | 0 (0.0%) |
Disability Class: Vision Difficulty
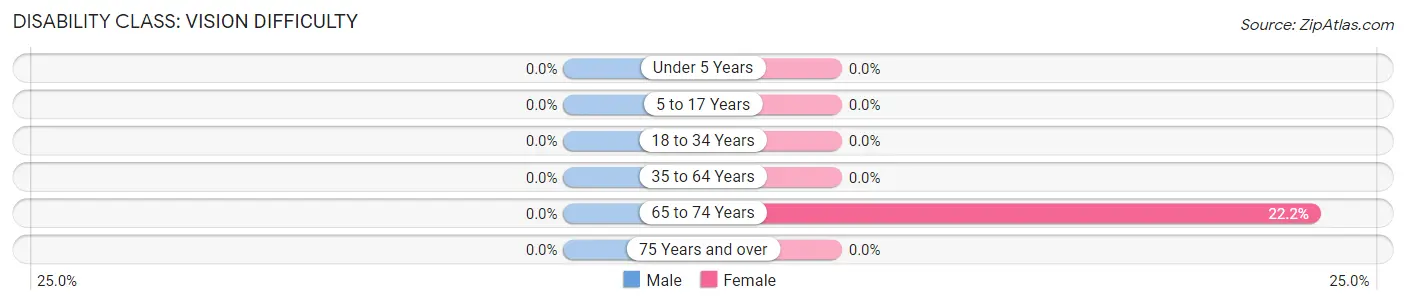
| Age Bracket | Male | Female |
| Under 5 Years | 0 (0.0%) | 0 (0.0%) |
| 5 to 17 Years | 0 (0.0%) | 0 (0.0%) |
| 18 to 34 Years | 0 (0.0%) | 0 (0.0%) |
| 35 to 64 Years | 0 (0.0%) | 0 (0.0%) |
| 65 to 74 Years | 0 (0.0%) | 6 (22.2%) |
| 75 Years and over | 0 (0.0%) | 0 (0.0%) |
Disability Class: Cognitive Difficulty
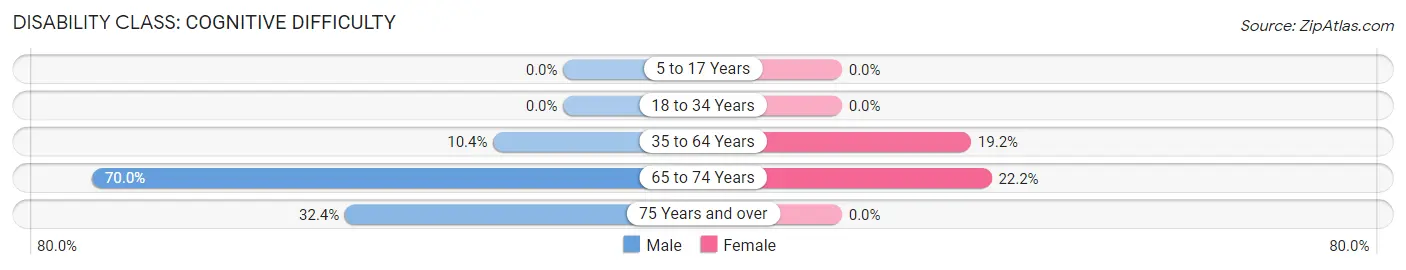
| Age Bracket | Male | Female |
| 5 to 17 Years | 0 (0.0%) | 0 (0.0%) |
| 18 to 34 Years | 0 (0.0%) | 0 (0.0%) |
| 35 to 64 Years | 21 (10.4%) | 60 (19.2%) |
| 65 to 74 Years | 7 (70.0%) | 6 (22.2%) |
| 75 Years and over | 35 (32.4%) | 0 (0.0%) |
Disability Class: Ambulatory Difficulty
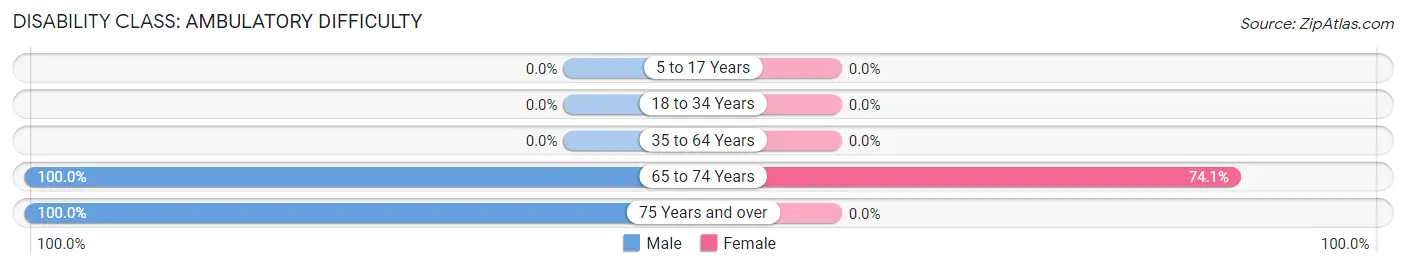
| Age Bracket | Male | Female |
| 5 to 17 Years | 0 (0.0%) | 0 (0.0%) |
| 18 to 34 Years | 0 (0.0%) | 0 (0.0%) |
| 35 to 64 Years | 0 (0.0%) | 0 (0.0%) |
| 65 to 74 Years | 10 (100.0%) | 20 (74.1%) |
| 75 Years and over | 108 (100.0%) | 0 (0.0%) |
Disability Class: Self-Care Difficulty
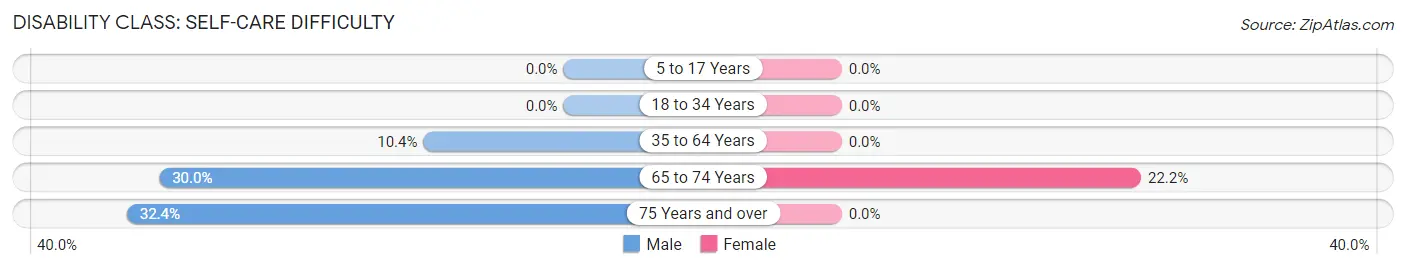
| Age Bracket | Male | Female |
| 5 to 17 Years | 0 (0.0%) | 0 (0.0%) |
| 18 to 34 Years | 0 (0.0%) | 0 (0.0%) |
| 35 to 64 Years | 21 (10.4%) | 0 (0.0%) |
| 65 to 74 Years | 3 (30.0%) | 6 (22.2%) |
| 75 Years and over | 35 (32.4%) | 0 (0.0%) |
Technology Access in Seabrook Farms
Computing Device Access in Seabrook Farms
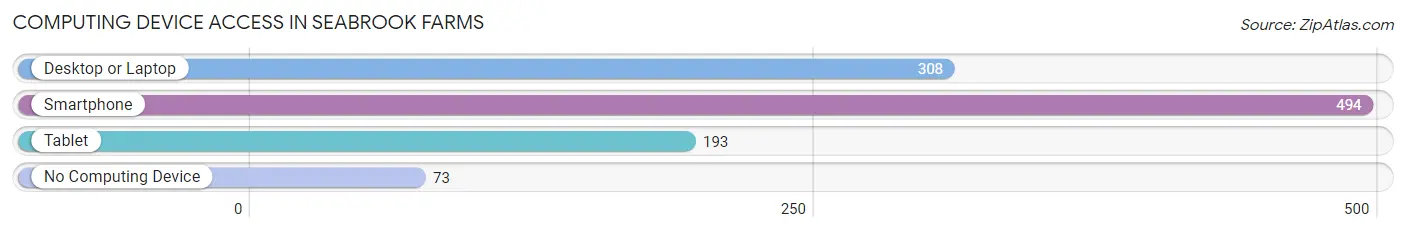
| Device Type | # Households | % Households |
| Desktop or Laptop | 308 | 52.4% |
| Smartphone | 494 | 84.0% |
| Tablet | 193 | 32.8% |
| No Computing Device | 73 | 12.4% |
| Total | 588 | 100.0% |
Internet Access in Seabrook Farms
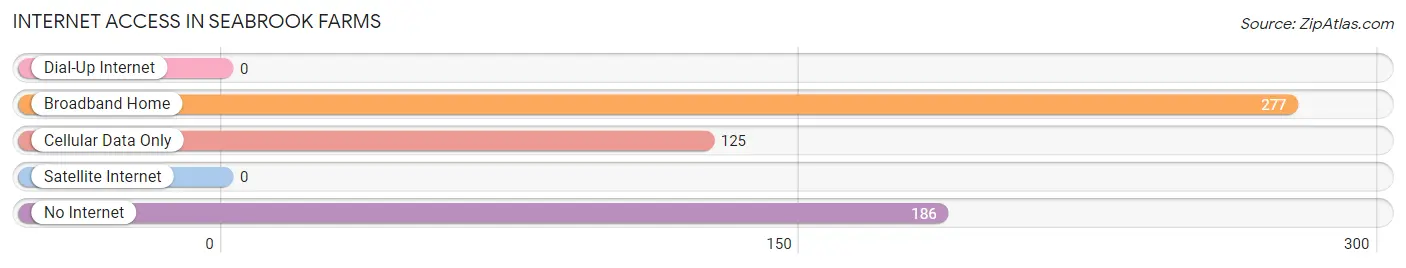
| Internet Type | # Households | % Households |
| Dial-Up Internet | 0 | 0.0% |
| Broadband Home | 277 | 47.1% |
| Cellular Data Only | 125 | 21.3% |
| Satellite Internet | 0 | 0.0% |
| No Internet | 186 | 31.6% |
| Total | 588 | 100.0% |
Seabrook Farms Summary
Seabrook Farms is a small unincorporated community located in Cumberland County, New Jersey. It is situated in the southwestern corner of the state, approximately 10 miles from the Delaware Bay. The area is known for its rich agricultural history, and is home to a variety of farms, including vegetable, dairy, and poultry farms.
History
Seabrook Farms was founded in the early 1900s by the Seabrook family, who were originally from England. The family purchased a large tract of land in the area and began to develop it into a farming community. The Seabrook family built a large canning factory, which was used to process and can the vegetables grown on the farms. The factory was the first of its kind in the area, and it quickly became a major employer in the community.
In the 1930s, the Seabrook family began to recruit Japanese-Americans to work in the canning factory. This was part of a larger effort to bring in workers from other countries to help with the labor shortage in the area. The Japanese-Americans were welcomed into the community and quickly became an integral part of the local economy.
Geography
Seabrook Farms is located in the southwestern corner of Cumberland County, New Jersey. It is situated approximately 10 miles from the Delaware Bay. The area is characterized by rolling hills and flat plains, with the majority of the land being used for agricultural purposes. The area is also home to a variety of wildlife, including deer, foxes, and other small animals.
Economy
Seabrook Farms is primarily an agricultural community, with the majority of the land being used for farming. The area is home to a variety of farms, including vegetable, dairy, and poultry farms. The Seabrook family’s canning factory is still in operation, and is a major employer in the area. In addition, there are a number of small businesses in the area, including restaurants, convenience stores, and other retail establishments.
Demographics
As of the 2010 census, the population of Seabrook Farms was 1,845. The racial makeup of the community was 94.3% White, 2.2% African American, 0.7% Asian, and 2.8% from other races. The median household income was $50,977, and the median age was 41.7 years. The majority of the population (90.3%) was born in the United States, with the remaining 9.7% being foreign-born.
Seabrook Farms is a small, rural community with a rich agricultural history. The area is home to a variety of farms, and the Seabrook family’s canning factory is still in operation. The population is primarily White, with a small percentage of African Americans and Asians. The median household income is slightly above the national average, and the median age is slightly below the national average. The area is a popular destination for tourists, and is known for its scenic beauty and rural charm.
Common Questions
What is the Total Population of Seabrook Farms?
Total Population of Seabrook Farms is 1,447.
What is the Total Male Population of Seabrook Farms?
Total Male Population of Seabrook Farms is 798.
What is the Total Female Population of Seabrook Farms?
Total Female Population of Seabrook Farms is 649.
What is the Ratio of Males per 100 Females in Seabrook Farms?
There are 122.96 Males per 100 Females in Seabrook Farms.
What is the Ratio of Females per 100 Males in Seabrook Farms?
There are 81.33 Females per 100 Males in Seabrook Farms.
What is the Median Population Age in Seabrook Farms?
Median Population Age in Seabrook Farms is 32.3 Years.
What is the Average Family Size in Seabrook Farms
Average Family Size in Seabrook Farms is 2.9 People.
What is the Average Household Size in Seabrook Farms
Average Household Size in Seabrook Farms is 2.5 People.
What is Per Capita Income in Seabrook Farms?
Per Capita income in Seabrook Farms is $18,925.
What is the Median Family Income in Seabrook Farms?
Median Family Income in Seabrook Farms is $45,917.
What is the Median Household income in Seabrook Farms?
Median Household Income in Seabrook Farms is $43,869.
What is Income or Wage Gap in Seabrook Farms?
Income or Wage Gap in Seabrook Farms is 17.1%.
Women in Seabrook Farms earn 82.9 cents for every dollar earned by a man.
What is Inequality or Gini Index in Seabrook Farms?
Inequality or Gini Index in Seabrook Farms is 0.51.
How Large is the Labor Force in Seabrook Farms?
There are 663 People in the Labor Forcein in Seabrook Farms.
What is the Percentage of People in the Labor Force in Seabrook Farms?
60.2% of People are in the Labor Force in Seabrook Farms.
What is the Unemployment Rate in Seabrook Farms?
Unemployment Rate in Seabrook Farms is 21.7%.