Bradley Beach borough, NJ
Bradley Beach borough Overview
4,268
TOTAL POPULATION
2,319
MALE POPULATION
1,949
FEMALE POPULATION
118.98
MALES / 100 FEMALES
84.04
FEMALES / 100 MALES
41.3
MEDIAN AGE
2.9
AVG FAMILY SIZE
2.1
AVG HOUSEHOLD SIZE
$53,872
PER CAPITA INCOME
$101,635
AVG FAMILY INCOME
$89,967
AVG HOUSEHOLD INCOME
6.8%
WAGE / INCOME GAP [ % ]
93.2¢/ $1
WAGE / INCOME GAP [ $ ]
0.47
INEQUALITY / GINI INDEX
2,289
LABOR FORCE [ PEOPLE ]
61.1%
PERCENT IN LABOR FORCE
3.4%
UNEMPLOYMENT RATE
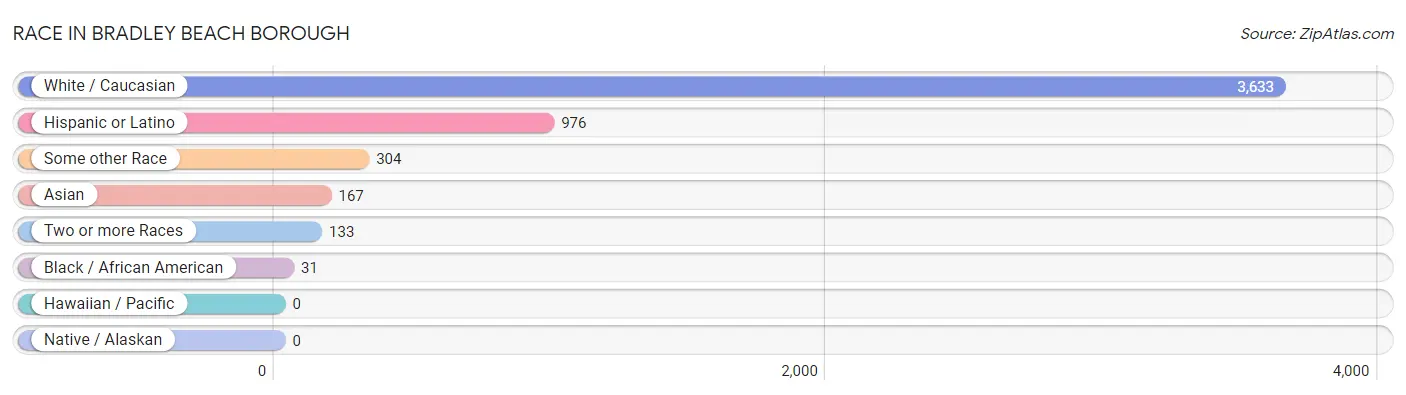
Race in Bradley Beach borough
The most populous races in Bradley Beach borough are White / Caucasian (3,633 | 85.1%), Hispanic or Latino (976 | 22.9%), and Some other Race (304 | 7.1%).
| Race | # Population | % Population |
| Asian | 167 | 3.9% |
| Black / African American | 31 | 0.7% |
| Hawaiian / Pacific | 0 | 0.0% |
| Hispanic or Latino | 976 | 22.9% |
| Native / Alaskan | 0 | 0.0% |
| White / Caucasian | 3,633 | 85.1% |
| Two or more Races | 133 | 3.1% |
| Some other Race | 304 | 7.1% |
| Total | 4,268 | 100.0% |
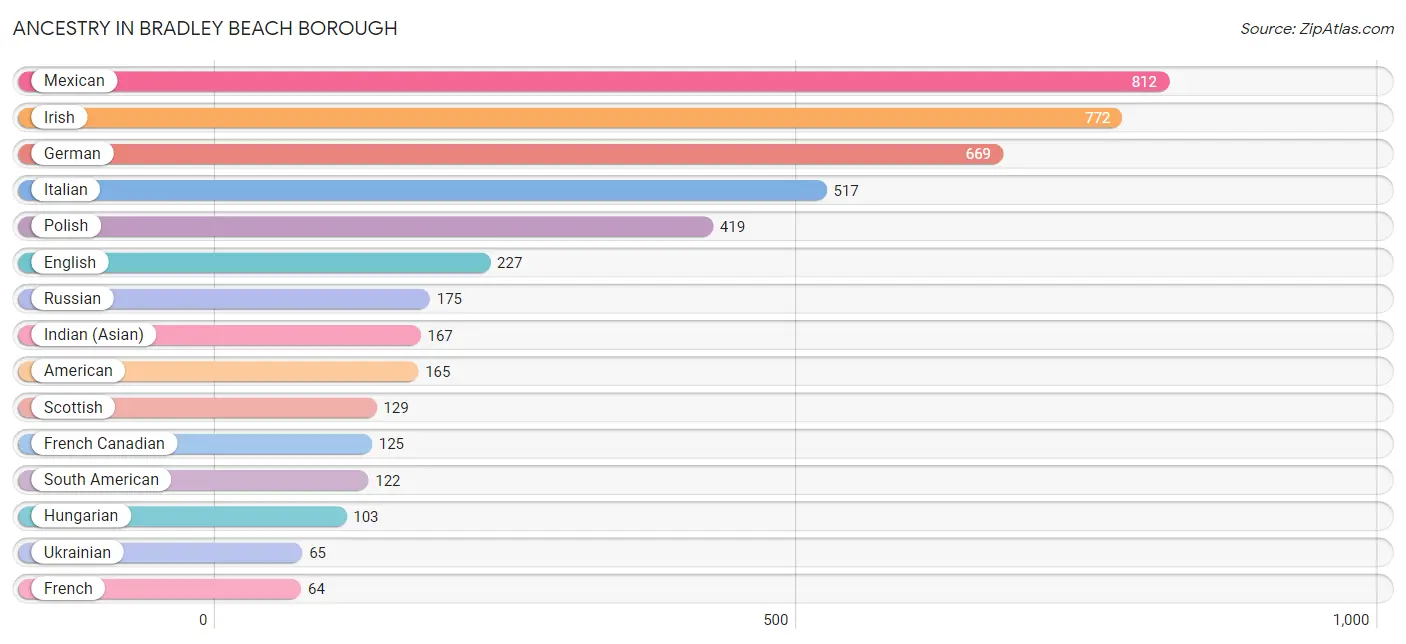
Ancestry in Bradley Beach borough
The most populous ancestries reported in Bradley Beach borough are Mexican (812 | 19.0%), Irish (772 | 18.1%), German (669 | 15.7%), Italian (517 | 12.1%), and Polish (419 | 9.8%), together accounting for 74.7% of all Bradley Beach borough residents.
| Ancestry | # Population | % Population |
| American | 165 | 3.9% |
| Argentinean | 62 | 1.5% |
| Austrian | 45 | 1.1% |
| British | 15 | 0.4% |
| Central American | 14 | 0.3% |
| Croatian | 12 | 0.3% |
| Czech | 6 | 0.1% |
| Czechoslovakian | 10 | 0.2% |
| Dutch | 15 | 0.4% |
| Eastern European | 62 | 1.5% |
| English | 227 | 5.3% |
| European | 42 | 1.0% |
| French | 64 | 1.5% |
| French Canadian | 125 | 2.9% |
| German | 669 | 15.7% |
| Guatemalan | 14 | 0.3% |
| Hungarian | 103 | 2.4% |
| Indian (Asian) | 167 | 3.9% |
| Irish | 772 | 18.1% |
| Israeli | 12 | 0.3% |
| Italian | 517 | 12.1% |
| Jamaican | 4 | 0.1% |
| Lithuanian | 39 | 0.9% |
| Mexican | 812 | 19.0% |
| Norwegian | 12 | 0.3% |
| Peruvian | 60 | 1.4% |
| Polish | 419 | 9.8% |
| Puerto Rican | 15 | 0.4% |
| Romanian | 28 | 0.7% |
| Russian | 175 | 4.1% |
| Scottish | 129 | 3.0% |
| Slovak | 10 | 0.2% |
| South American | 122 | 2.9% |
| Spaniard | 11 | 0.3% |
| Turkish | 5 | 0.1% |
| Ukrainian | 65 | 1.5% | View All 36 Rows |
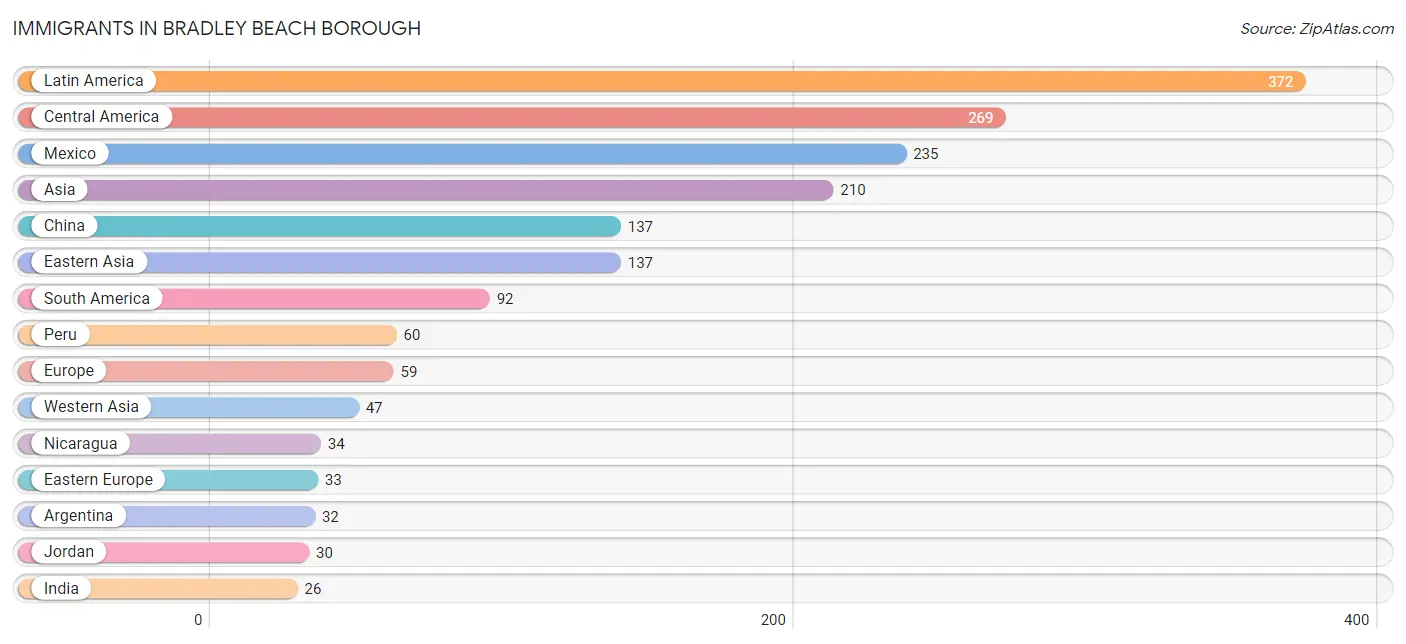
Immigrants in Bradley Beach borough
The most numerous immigrant groups reported in Bradley Beach borough came from Latin America (372 | 8.7%), Central America (269 | 6.3%), Mexico (235 | 5.5%), Asia (210 | 4.9%), and China (137 | 3.2%), together accounting for 28.7% of all Bradley Beach borough residents.
| Immigration Origin | # Population | % Population |
| Argentina | 32 | 0.7% |
| Asia | 210 | 4.9% |
| Caribbean | 11 | 0.3% |
| Central America | 269 | 6.3% |
| China | 137 | 3.2% |
| Eastern Asia | 137 | 3.2% |
| Eastern Europe | 33 | 0.8% |
| Europe | 59 | 1.4% |
| France | 10 | 0.2% |
| Germany | 11 | 0.3% |
| Haiti | 7 | 0.2% |
| Hungary | 12 | 0.3% |
| India | 26 | 0.6% |
| Italy | 5 | 0.1% |
| Jamaica | 4 | 0.1% |
| Jordan | 30 | 0.7% |
| Latin America | 372 | 8.7% |
| Lithuania | 21 | 0.5% |
| Mexico | 235 | 5.5% |
| Nicaragua | 34 | 0.8% |
| Peru | 60 | 1.4% |
| South America | 92 | 2.2% |
| South Central Asia | 26 | 0.6% |
| Southern Europe | 5 | 0.1% |
| Syria | 12 | 0.3% |
| Turkey | 5 | 0.1% |
| Western Asia | 47 | 1.1% |
| Western Europe | 21 | 0.5% | View All 28 Rows |
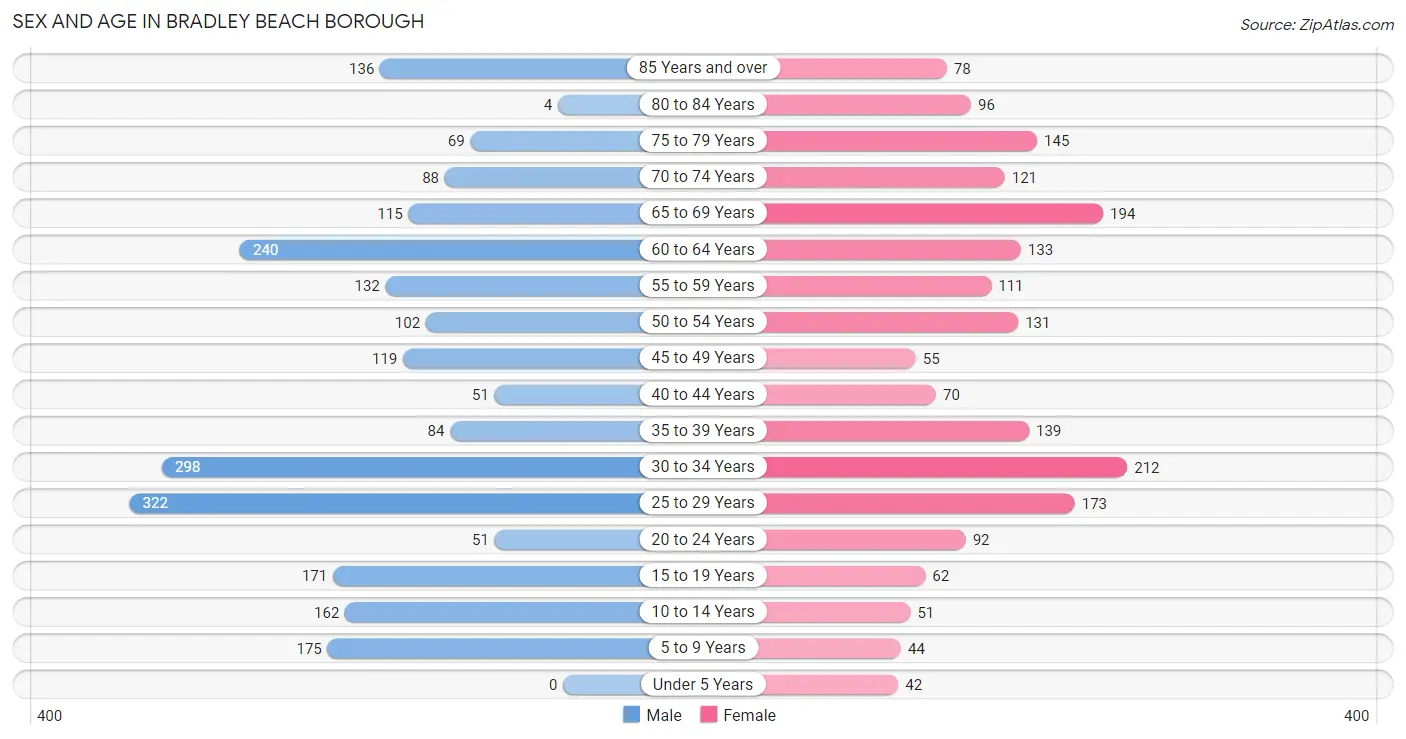
Sex and Age in Bradley Beach borough
Sex and Age in Bradley Beach borough
The most populous age groups in Bradley Beach borough are 25 to 29 Years (322 | 13.9%) for men and 30 to 34 Years (212 | 10.9%) for women.
| Age Bracket | Male | Female |
| Under 5 Years | 0 (0.0%) | 42 (2.1%) |
| 5 to 9 Years | 175 (7.5%) | 44 (2.3%) |
| 10 to 14 Years | 162 (7.0%) | 51 (2.6%) |
| 15 to 19 Years | 171 (7.4%) | 62 (3.2%) |
| 20 to 24 Years | 51 (2.2%) | 92 (4.7%) |
| 25 to 29 Years | 322 (13.9%) | 173 (8.9%) |
| 30 to 34 Years | 298 (12.9%) | 212 (10.9%) |
| 35 to 39 Years | 84 (3.6%) | 139 (7.1%) |
| 40 to 44 Years | 51 (2.2%) | 70 (3.6%) |
| 45 to 49 Years | 119 (5.1%) | 55 (2.8%) |
| 50 to 54 Years | 102 (4.4%) | 131 (6.7%) |
| 55 to 59 Years | 132 (5.7%) | 111 (5.7%) |
| 60 to 64 Years | 240 (10.3%) | 133 (6.8%) |
| 65 to 69 Years | 115 (5.0%) | 194 (10.0%) |
| 70 to 74 Years | 88 (3.8%) | 121 (6.2%) |
| 75 to 79 Years | 69 (3.0%) | 145 (7.4%) |
| 80 to 84 Years | 4 (0.2%) | 96 (4.9%) |
| 85 Years and over | 136 (5.9%) | 78 (4.0%) |
| Total | 2,319 (100.0%) | 1,949 (100.0%) |
Families and Households in Bradley Beach borough
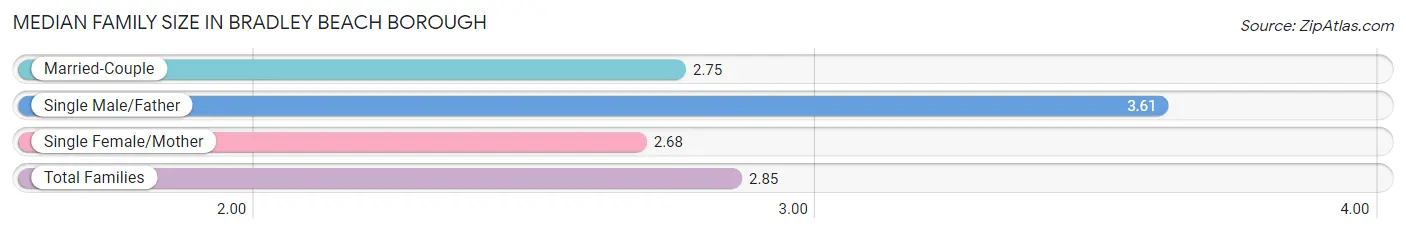
Median Family Size in Bradley Beach borough
The median family size in Bradley Beach borough is 2.85 persons per family, with single male/father families (98 | 11.7%) accounting for the largest median family size of 3.61 persons per family. On the other hand, single female/mother families (50 | 6.0%) represent the smallest median family size with 2.68 persons per family.
| Family Type | # Families | Family Size |
| Married-Couple | 686 (82.3%) | 2.75 |
| Single Male/Father | 98 (11.7%) | 3.61 |
| Single Female/Mother | 50 (6.0%) | 2.68 |
| Total Families | 834 (100.0%) | 2.85 |
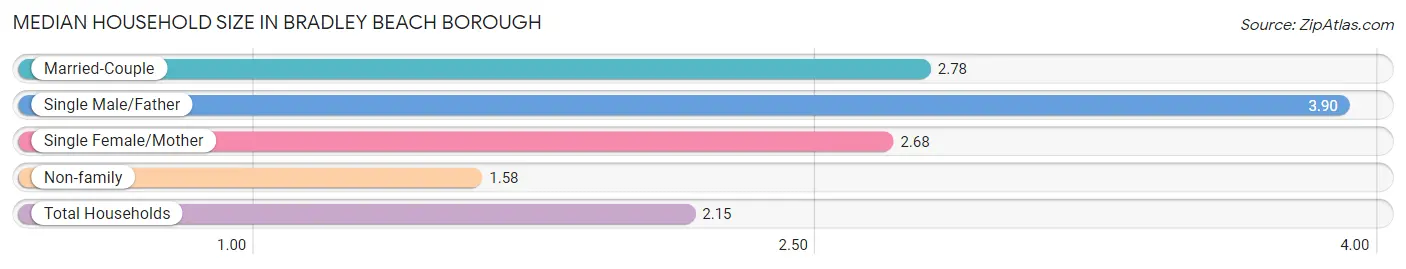
Median Household Size in Bradley Beach borough
The median household size in Bradley Beach borough is 2.15 persons per household, with single male/father households (98 | 5.1%) accounting for the largest median household size of 3.9 persons per household. non-family households (1,089 | 56.6%) represent the smallest median household size with 1.58 persons per household.
| Household Type | # Households | Household Size |
| Married-Couple | 686 (35.7%) | 2.78 |
| Single Male/Father | 98 (5.1%) | 3.90 |
| Single Female/Mother | 50 (2.6%) | 2.68 |
| Non-family | 1,089 (56.6%) | 1.58 |
| Total Households | 1,923 (100.0%) | 2.15 |
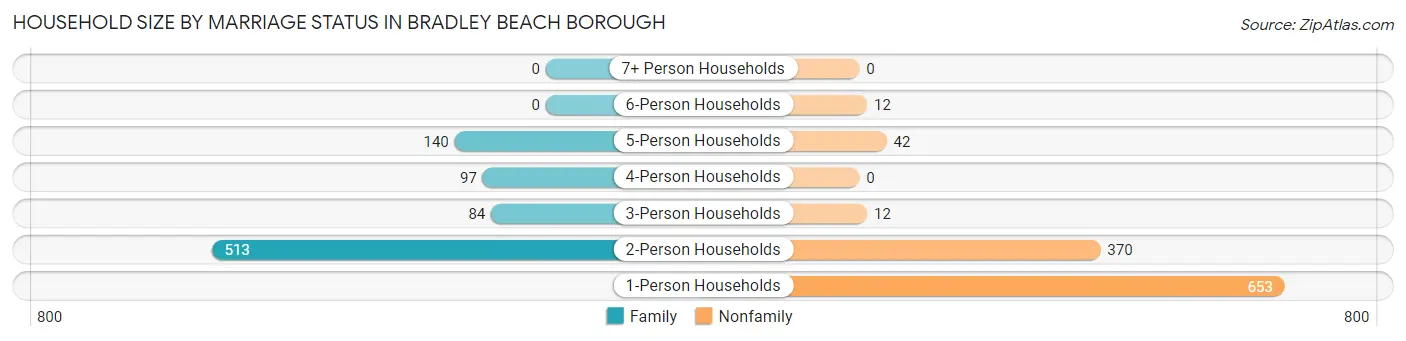
Household Size by Marriage Status in Bradley Beach borough
Out of a total of 1,923 households in Bradley Beach borough, 834 (43.4%) are family households, while 1,089 (56.6%) are nonfamily households. The most numerous type of family households are 2-person households, comprising 513, and the most common type of nonfamily households are 1-person households, comprising 653.
| Household Size | Family Households | Nonfamily Households |
| 1-Person Households | - | 653 (34.0%) |
| 2-Person Households | 513 (26.7%) | 370 (19.2%) |
| 3-Person Households | 84 (4.4%) | 12 (0.6%) |
| 4-Person Households | 97 (5.0%) | 0 (0.0%) |
| 5-Person Households | 140 (7.3%) | 42 (2.2%) |
| 6-Person Households | 0 (0.0%) | 12 (0.6%) |
| 7+ Person Households | 0 (0.0%) | 0 (0.0%) |
| Total | 834 (43.4%) | 1,089 (56.6%) |
Female Fertility in Bradley Beach borough
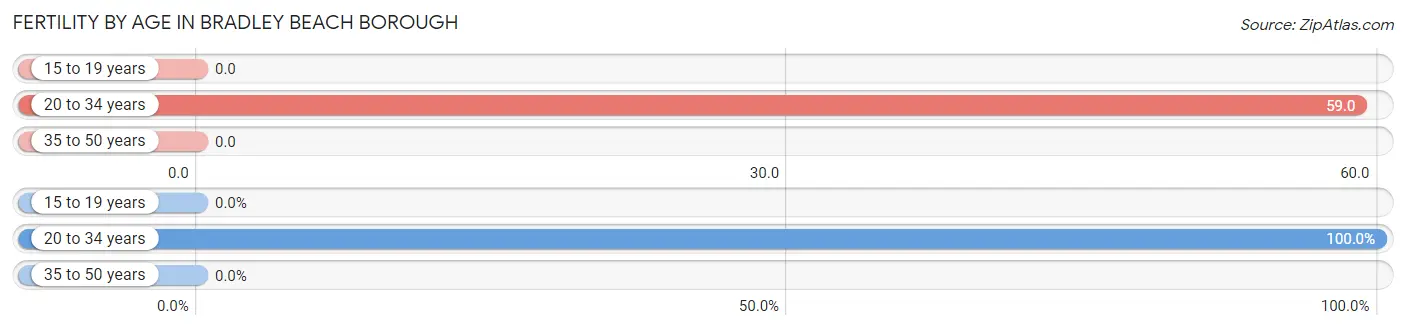
Fertility by Age in Bradley Beach borough
Average fertility rate in Bradley Beach borough is 32.0 births per 1,000 women. Women in the age bracket of 20 to 34 years have the highest fertility rate with 59.0 births per 1,000 women. Women in the age bracket of 20 to 34 years acount for 100.0% of all women with births.
| Age Bracket | Women with Births | Births / 1,000 Women |
| 15 to 19 years | 0 (0.0%) | 0.0 |
| 20 to 34 years | 28 (100.0%) | 59.0 |
| 35 to 50 years | 0 (0.0%) | 0.0 |
| Total | 28 (100.0%) | 32.0 |
Fertility by Age by Marriage Status in Bradley Beach borough
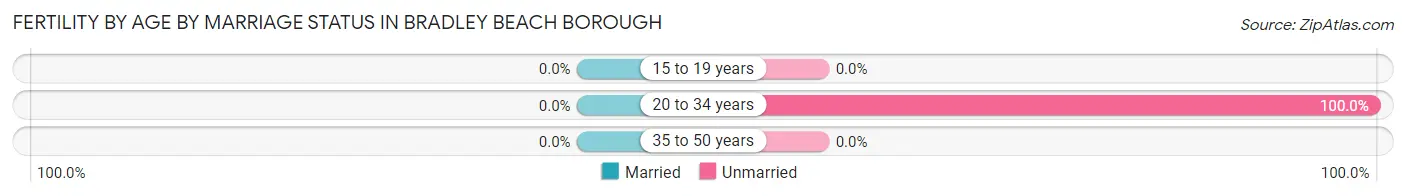
| Age Bracket | Married | Unmarried |
| 15 to 19 years | 0 (0.0%) | 0 (0.0%) |
| 20 to 34 years | 0 (0.0%) | 28 (100.0%) |
| 35 to 50 years | 0 (0.0%) | 0 (0.0%) |
| Total | 0 (0.0%) | 28 (100.0%) |
Fertility by Education in Bradley Beach borough
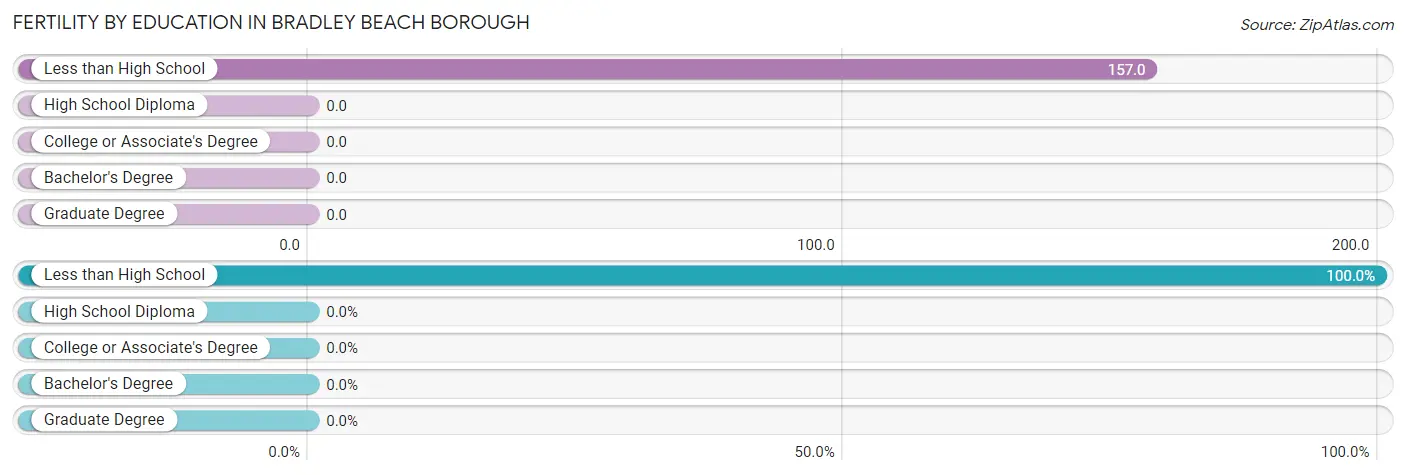
| Educational Attainment | Women with Births | Births / 1,000 Women |
| Less than High School | 28 (100.0%) | 157.0 |
| High School Diploma | 0 (0.0%) | 0.0 |
| College or Associate's Degree | 0 (0.0%) | 0.0 |
| Bachelor's Degree | 0 (0.0%) | 0.0 |
| Graduate Degree | 0 (0.0%) | 0.0 |
| Total | 28 (100.0%) | 32.0 |
Fertility by Education by Marriage Status in Bradley Beach borough
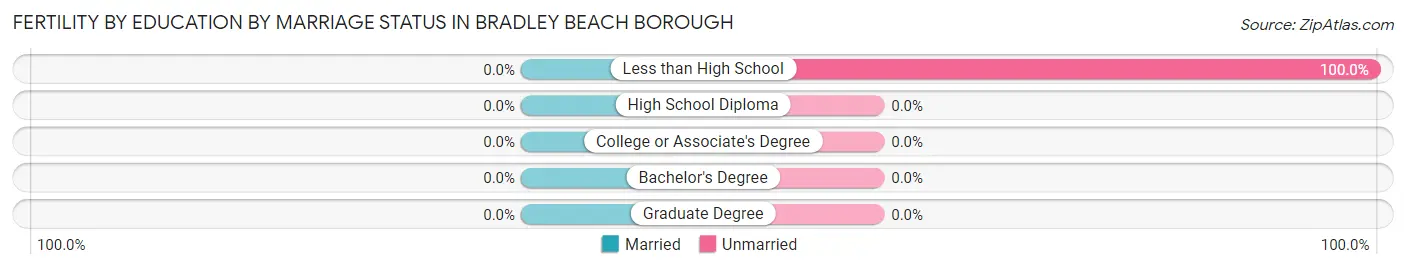
| Educational Attainment | Married | Unmarried |
| Less than High School | 0 (0.0%) | 28 (100.0%) |
| High School Diploma | 0 (0.0%) | 0 (0.0%) |
| College or Associate's Degree | 0 (0.0%) | 0 (0.0%) |
| Bachelor's Degree | 0 (0.0%) | 0 (0.0%) |
| Graduate Degree | 0 (0.0%) | 0 (0.0%) |
| Total | 0 (0.0%) | 28 (100.0%) |
Income in Bradley Beach borough
Income Overview in Bradley Beach borough
Per Capita Income in Bradley Beach borough is $53,872, while median incomes of families and households are $101,635 and $89,967 respectively.
| Characteristic | Number | Measure |
| Per Capita Income | 4,268 | $53,872 |
| Median Family Income | 834 | $101,635 |
| Mean Family Income | 834 | $152,600 |
| Median Household Income | 1,923 | $89,967 |
| Mean Household Income | 1,923 | $116,131 |
| Income Deficit | 834 | $0 |
| Wage / Income Gap (%) | 4,268 | 6.81% |
| Wage / Income Gap ($) | 4,268 | 93.19¢ per $1 |
| Gini / Inequality Index | 4,268 | 0.47 |
Earnings by Sex in Bradley Beach borough
Average Earnings in Bradley Beach borough are $46,819, $47,090 for men and $43,882 for women, a difference of 6.8%.
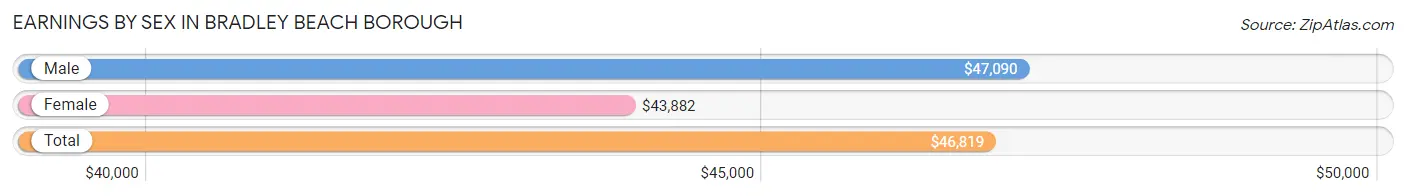
| Sex | Number | Average Earnings |
| Male | 1,489 (60.0%) | $47,090 |
| Female | 993 (40.0%) | $43,882 |
| Total | 2,482 (100.0%) | $46,819 |
Earnings by Sex by Income Bracket in Bradley Beach borough
The most common earnings brackets in Bradley Beach borough are $100,000+ for men (221 | 14.8%) and $100,000+ for women (175 | 17.6%).
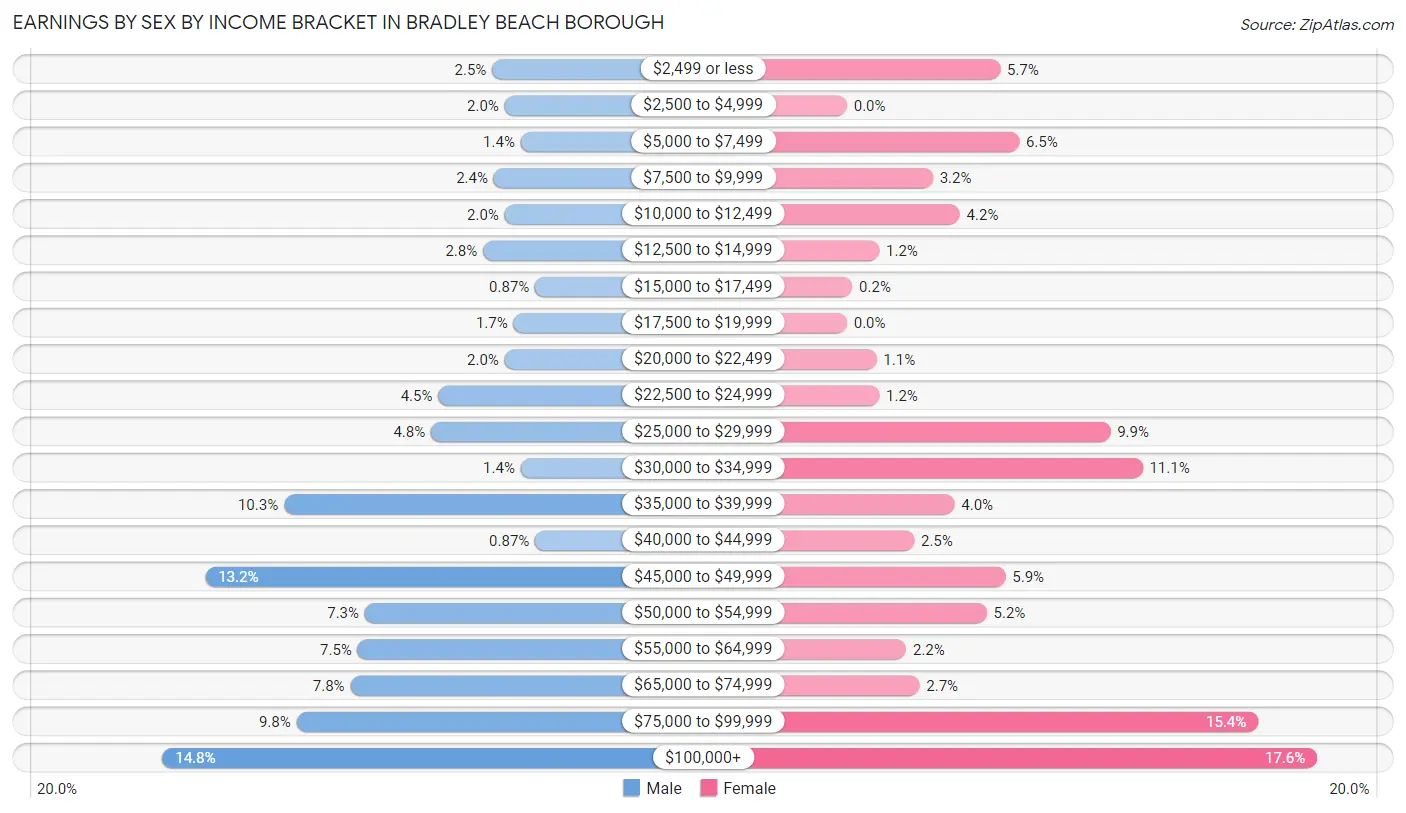
| Income | Male | Female |
| $2,499 or less | 37 (2.5%) | 57 (5.7%) |
| $2,500 to $4,999 | 30 (2.0%) | 0 (0.0%) |
| $5,000 to $7,499 | 21 (1.4%) | 64 (6.5%) |
| $7,500 to $9,999 | 36 (2.4%) | 32 (3.2%) |
| $10,000 to $12,499 | 30 (2.0%) | 42 (4.2%) |
| $12,500 to $14,999 | 42 (2.8%) | 12 (1.2%) |
| $15,000 to $17,499 | 13 (0.9%) | 2 (0.2%) |
| $17,500 to $19,999 | 25 (1.7%) | 0 (0.0%) |
| $20,000 to $22,499 | 30 (2.0%) | 11 (1.1%) |
| $22,500 to $24,999 | 67 (4.5%) | 12 (1.2%) |
| $25,000 to $29,999 | 71 (4.8%) | 98 (9.9%) |
| $30,000 to $34,999 | 21 (1.4%) | 110 (11.1%) |
| $35,000 to $39,999 | 153 (10.3%) | 40 (4.0%) |
| $40,000 to $44,999 | 13 (0.9%) | 25 (2.5%) |
| $45,000 to $49,999 | 197 (13.2%) | 59 (5.9%) |
| $50,000 to $54,999 | 108 (7.2%) | 52 (5.2%) |
| $55,000 to $64,999 | 112 (7.5%) | 22 (2.2%) |
| $65,000 to $74,999 | 116 (7.8%) | 27 (2.7%) |
| $75,000 to $99,999 | 146 (9.8%) | 153 (15.4%) |
| $100,000+ | 221 (14.8%) | 175 (17.6%) |
| Total | 1,489 (100.0%) | 993 (100.0%) |
Earnings by Sex by Educational Attainment in Bradley Beach borough
Average earnings in Bradley Beach borough are $50,532 for men and $44,671 for women, a difference of 11.6%. Men with an educational attainment of graduate degree enjoy the highest average annual earnings of $72,411, while those with college or associate's degree education earn the least with $33,095. Women with an educational attainment of graduate degree earn the most with the average annual earnings of $87,759, while those with bachelor's degree education have the smallest earnings of $40,833.
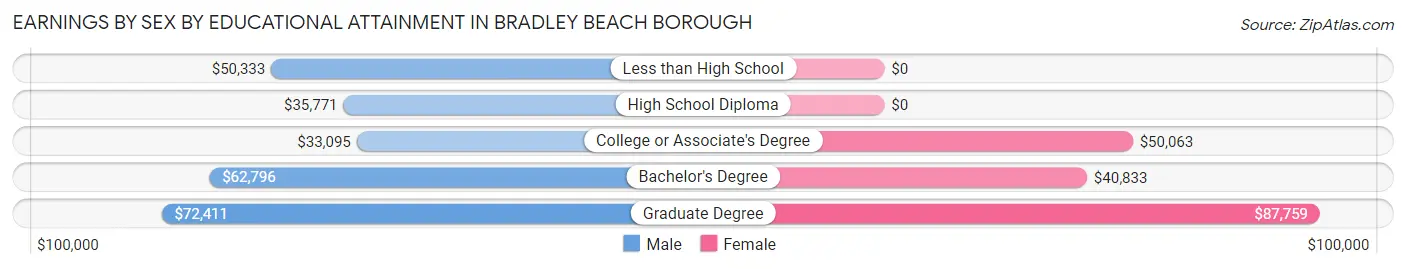
| Educational Attainment | Male Income | Female Income |
| Less than High School | $50,333 | $0 |
| High School Diploma | $35,771 | $0 |
| College or Associate's Degree | $33,095 | $50,063 |
| Bachelor's Degree | $62,796 | $40,833 |
| Graduate Degree | $72,411 | $87,759 |
| Total | $50,532 | $44,671 |
Family Income in Bradley Beach borough
Family Income Brackets in Bradley Beach borough
According to the Bradley Beach borough family income data, there are 166 families falling into the $100,000 to $149,999 income range, which is the most common income bracket and makes up 19.9% of all families.
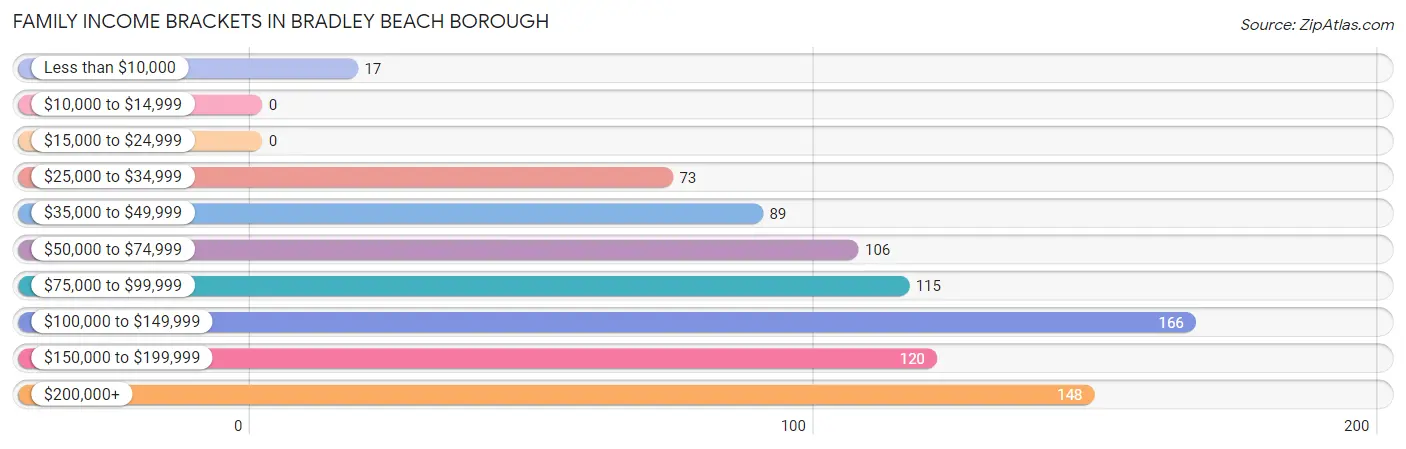
| Income Bracket | # Families | % Families |
| Less than $10,000 | 17 | 2.0% |
| $10,000 to $14,999 | 0 | 0.0% |
| $15,000 to $24,999 | 0 | 0.0% |
| $25,000 to $34,999 | 73 | 8.8% |
| $35,000 to $49,999 | 89 | 10.7% |
| $50,000 to $74,999 | 106 | 12.7% |
| $75,000 to $99,999 | 115 | 13.8% |
| $100,000 to $149,999 | 166 | 19.9% |
| $150,000 to $199,999 | 120 | 14.4% |
| $200,000+ | 148 | 17.7% |
Family Income by Famaliy Size in Bradley Beach borough
2-person families (518 | 62.1%) account for the highest median family income in Bradley Beach borough with $120,714 per family, while 2-person families (518 | 62.1%) have the highest median income of $60,357 per family member.
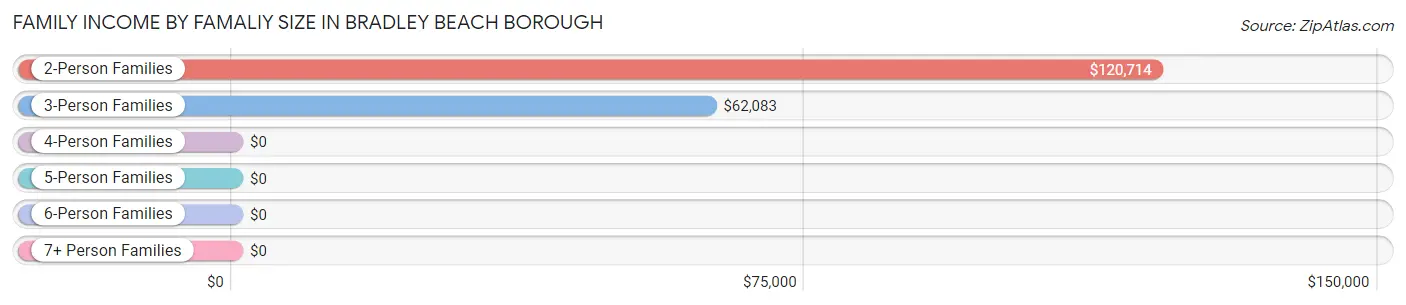
| Income Bracket | # Families | Median Income |
| 2-Person Families | 518 (62.1%) | $120,714 |
| 3-Person Families | 84 (10.1%) | $62,083 |
| 4-Person Families | 127 (15.2%) | $0 |
| 5-Person Families | 105 (12.6%) | $0 |
| 6-Person Families | 0 (0.0%) | $0 |
| 7+ Person Families | 0 (0.0%) | $0 |
| Total | 834 (100.0%) | $101,635 |
Family Income by Number of Earners in Bradley Beach borough
The median family income in Bradley Beach borough is $101,635, with families comprising 3+ earners (62) having the highest median family income of $250,001, while families with 1 earner (349) have the lowest median family income of $82,067, accounting for 7.4% and 41.8% of families, respectively.
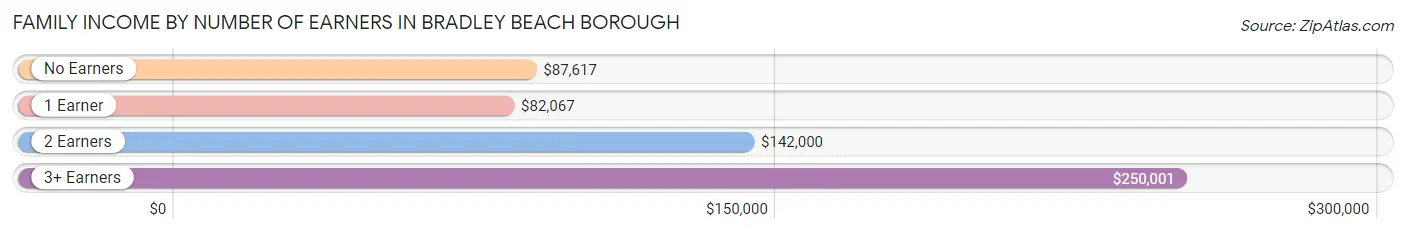
| Number of Earners | # Families | Median Income |
| No Earners | 191 (22.9%) | $87,617 |
| 1 Earner | 349 (41.8%) | $82,067 |
| 2 Earners | 232 (27.8%) | $142,000 |
| 3+ Earners | 62 (7.4%) | $250,001 |
| Total | 834 (100.0%) | $101,635 |
Household Income in Bradley Beach borough
Household Income Brackets in Bradley Beach borough
With 454 households falling in the category, the $100,000 to $149,999 income range is the most frequent in Bradley Beach borough, accounting for 23.6% of all households. In contrast, only 52 households (2.7%) fall into the $10,000 to $14,999 income bracket, making it the least populous group.
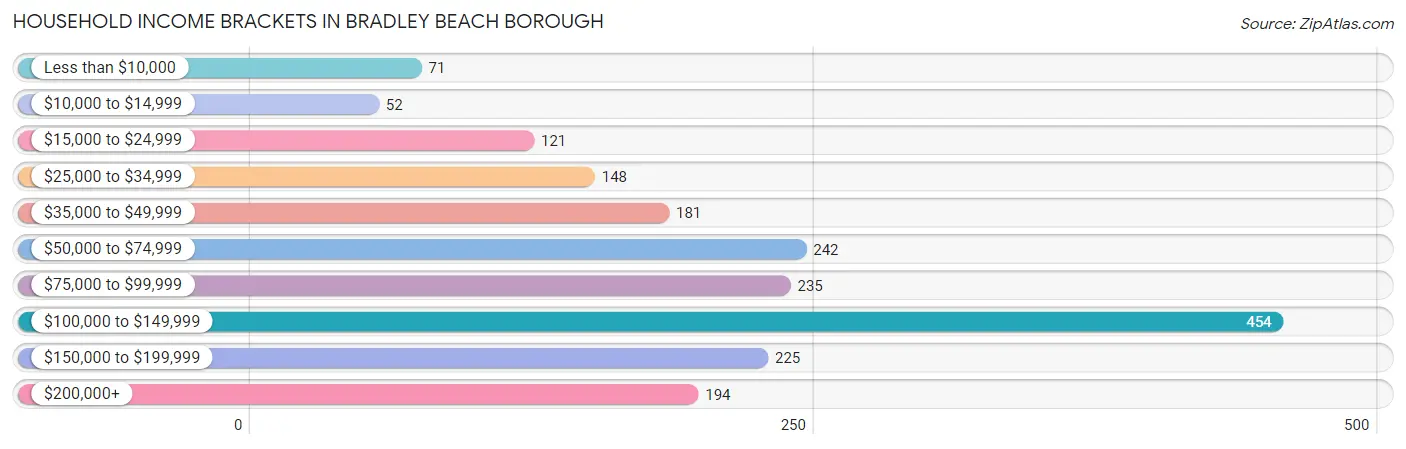
| Income Bracket | # Households | % Households |
| Less than $10,000 | 71 | 3.7% |
| $10,000 to $14,999 | 52 | 2.7% |
| $15,000 to $24,999 | 121 | 6.3% |
| $25,000 to $34,999 | 148 | 7.7% |
| $35,000 to $49,999 | 181 | 9.4% |
| $50,000 to $74,999 | 242 | 12.6% |
| $75,000 to $99,999 | 235 | 12.2% |
| $100,000 to $149,999 | 454 | 23.6% |
| $150,000 to $199,999 | 225 | 11.7% |
| $200,000+ | 194 | 10.1% |
Household Income by Householder Age in Bradley Beach borough
The median household income in Bradley Beach borough is $89,967, with the highest median household income of $98,696 found in the 25 to 44 years age bracket for the primary householder. A total of 690 households (35.9%) fall into this category.
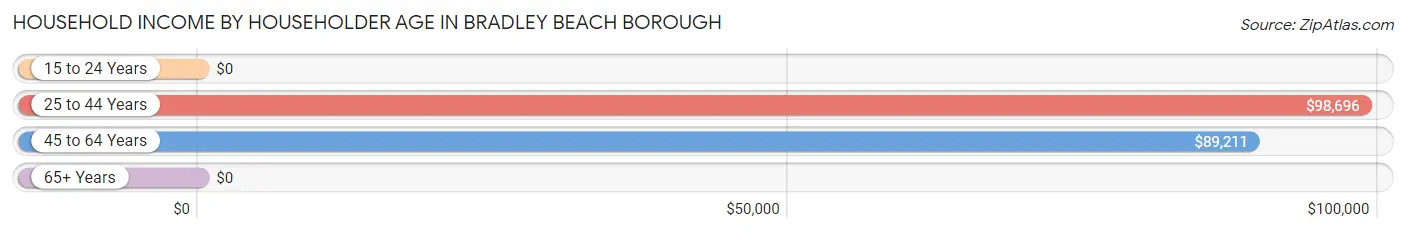
| Income Bracket | # Households | Median Income |
| 15 to 24 Years | 0 (0.0%) | $0 |
| 25 to 44 Years | 690 (35.9%) | $98,696 |
| 45 to 64 Years | 638 (33.2%) | $89,211 |
| 65+ Years | 595 (30.9%) | $0 |
| Total | 1,923 (100.0%) | $89,967 |
Poverty in Bradley Beach borough
Income Below Poverty by Sex and Age in Bradley Beach borough
With 5.6% poverty level for males and 4.7% for females among the residents of Bradley Beach borough, 12 to 14 year old males and 55 to 64 year old females are the most vulnerable to poverty, with 22 males (21.1%) and 35 females (14.3%) in their respective age groups living below the poverty level.
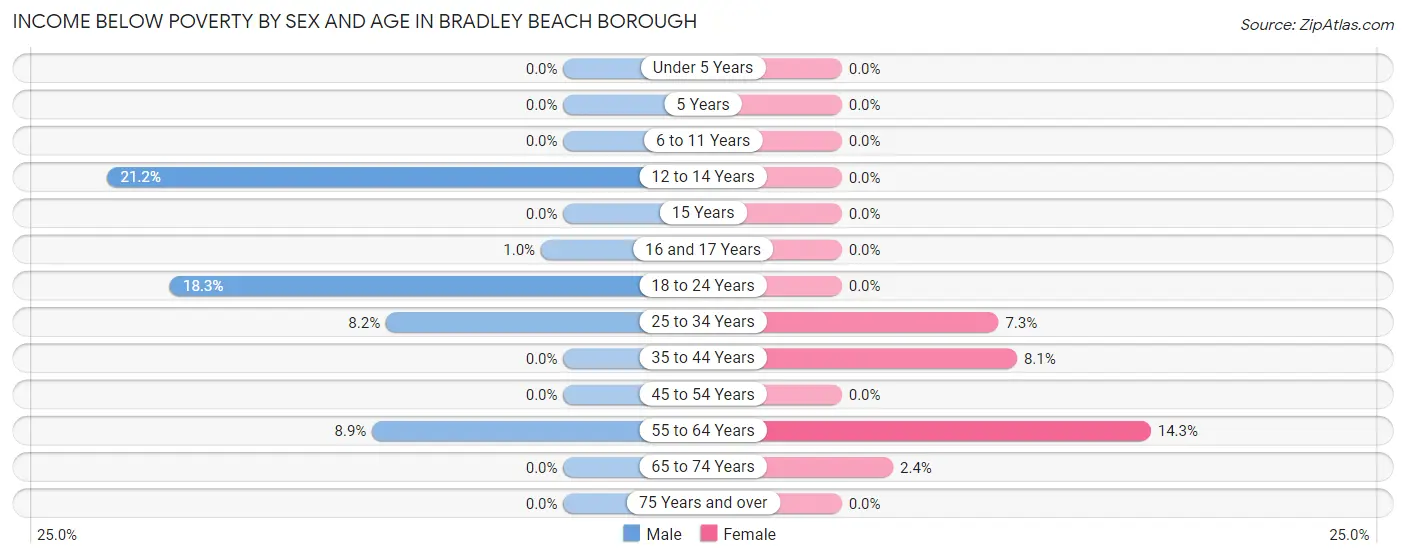
| Age Bracket | Male | Female |
| Under 5 Years | 0 (0.0%) | 0 (0.0%) |
| 5 Years | 0 (0.0%) | 0 (0.0%) |
| 6 to 11 Years | 0 (0.0%) | 0 (0.0%) |
| 12 to 14 Years | 22 (21.1%) | 0 (0.0%) |
| 15 Years | 0 (0.0%) | 0 (0.0%) |
| 16 and 17 Years | 1 (1.0%) | 0 (0.0%) |
| 18 to 24 Years | 23 (18.2%) | 0 (0.0%) |
| 25 to 34 Years | 51 (8.2%) | 28 (7.3%) |
| 35 to 44 Years | 0 (0.0%) | 17 (8.1%) |
| 45 to 54 Years | 0 (0.0%) | 0 (0.0%) |
| 55 to 64 Years | 33 (8.9%) | 35 (14.3%) |
| 65 to 74 Years | 0 (0.0%) | 7 (2.4%) |
| 75 Years and over | 0 (0.0%) | 0 (0.0%) |
| Total | 130 (5.6%) | 87 (4.7%) |
Income Above Poverty by Sex and Age in Bradley Beach borough
According to the poverty statistics in Bradley Beach borough, males aged 6 to 11 years and females aged under 5 years are the age groups that are most secure financially, with 100.0% of males and 100.0% of females in these age groups living above the poverty line.
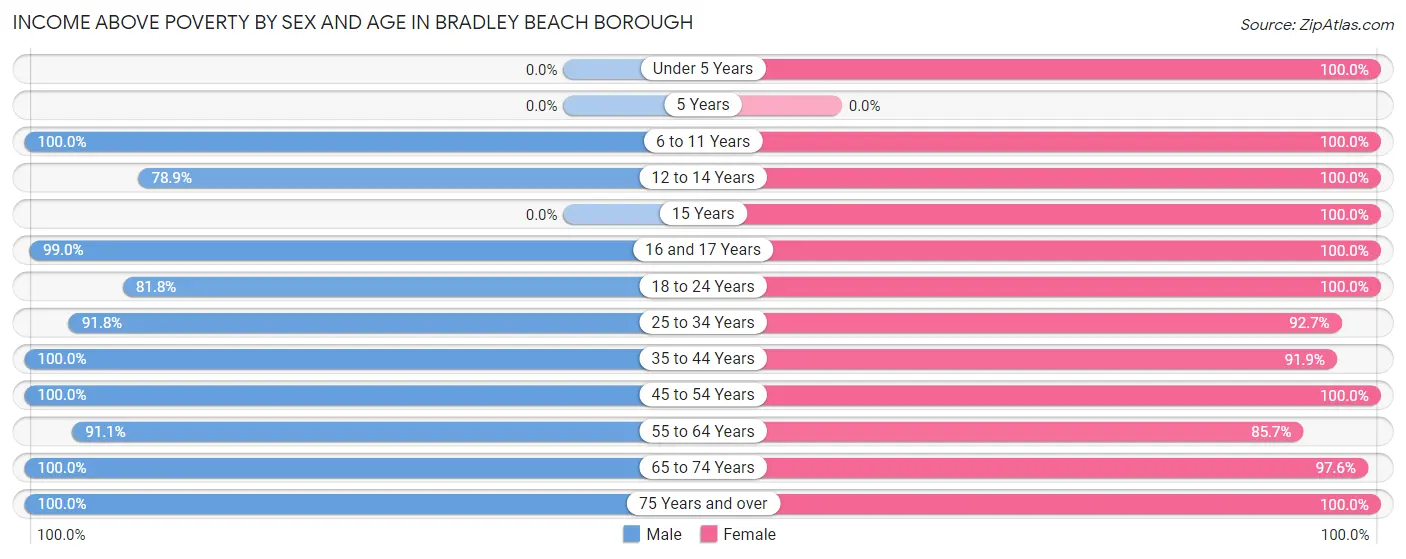
| Age Bracket | Male | Female |
| Under 5 Years | 0 (0.0%) | 42 (100.0%) |
| 5 Years | 0 (0.0%) | 0 (0.0%) |
| 6 to 11 Years | 233 (100.0%) | 60 (100.0%) |
| 12 to 14 Years | 82 (78.8%) | 35 (100.0%) |
| 15 Years | 0 (0.0%) | 48 (100.0%) |
| 16 and 17 Years | 95 (99.0%) | 14 (100.0%) |
| 18 to 24 Years | 103 (81.8%) | 92 (100.0%) |
| 25 to 34 Years | 569 (91.8%) | 357 (92.7%) |
| 35 to 44 Years | 135 (100.0%) | 192 (91.9%) |
| 45 to 54 Years | 221 (100.0%) | 177 (100.0%) |
| 55 to 64 Years | 339 (91.1%) | 209 (85.7%) |
| 65 to 74 Years | 203 (100.0%) | 287 (97.6%) |
| 75 Years and over | 195 (100.0%) | 246 (100.0%) |
| Total | 2,175 (94.4%) | 1,759 (95.3%) |
Income Below Poverty Among Married-Couple Families in Bradley Beach borough
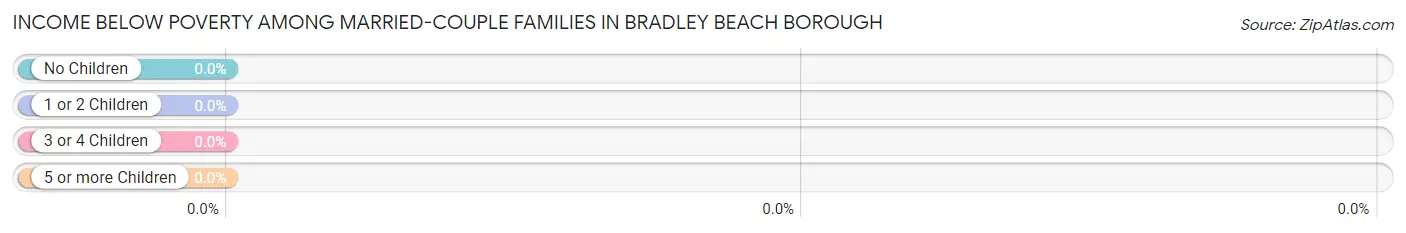
| Children | Above Poverty | Below Poverty |
| No Children | 491 (100.0%) | 0 (0.0%) |
| 1 or 2 Children | 135 (100.0%) | 0 (0.0%) |
| 3 or 4 Children | 60 (100.0%) | 0 (0.0%) |
| 5 or more Children | 0 (0.0%) | 0 (0.0%) |
| Total | 686 (100.0%) | 0 (0.0%) |
Income Below Poverty Among Single-Parent Households in Bradley Beach borough
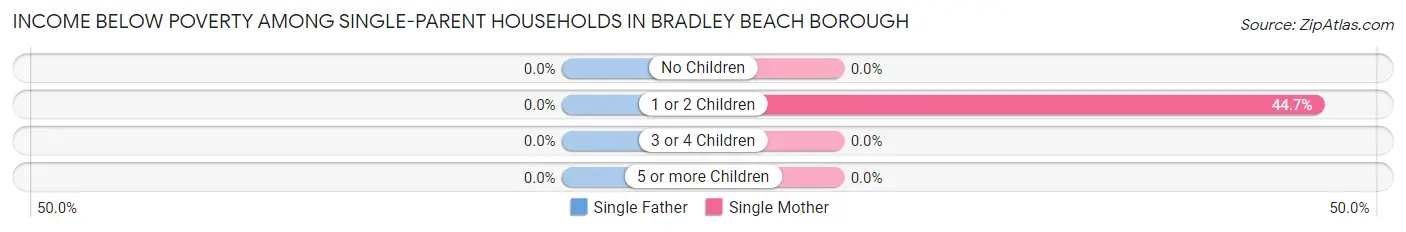
| Children | Single Father | Single Mother |
| No Children | 0 (0.0%) | 0 (0.0%) |
| 1 or 2 Children | 0 (0.0%) | 17 (44.7%) |
| 3 or 4 Children | 0 (0.0%) | 0 (0.0%) |
| 5 or more Children | 0 (0.0%) | 0 (0.0%) |
| Total | 0 (0.0%) | 17 (34.0%) |
Income Below Poverty Among Married-Couple vs Single-Parent Households in Bradley Beach borough
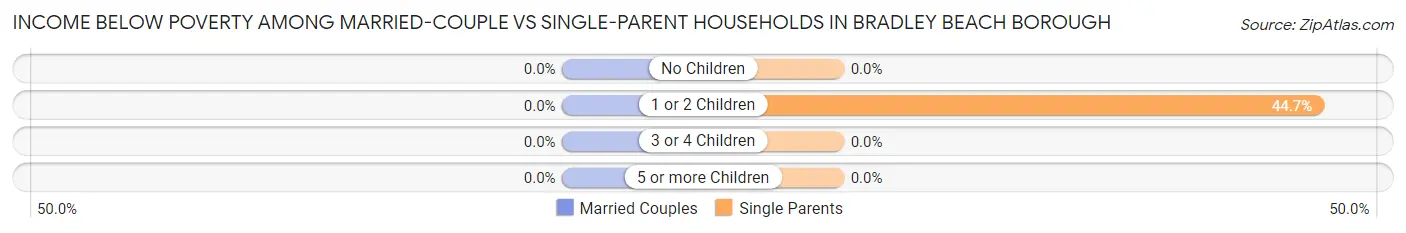
| Children | Married-Couple Families | Single-Parent Households |
| No Children | 0 (0.0%) | 0 (0.0%) |
| 1 or 2 Children | 0 (0.0%) | 17 (44.7%) |
| 3 or 4 Children | 0 (0.0%) | 0 (0.0%) |
| 5 or more Children | 0 (0.0%) | 0 (0.0%) |
| Total | 0 (0.0%) | 17 (11.5%) |
Employment Characteristics in Bradley Beach borough
Employment by Class of Employer in Bradley Beach borough
Among the 2,190 employed individuals in Bradley Beach borough, private company employees (1,522 | 69.5%), not-for-profit organizations (183 | 8.4%), and local government employees (160 | 7.3%) make up the most common classes of employment.
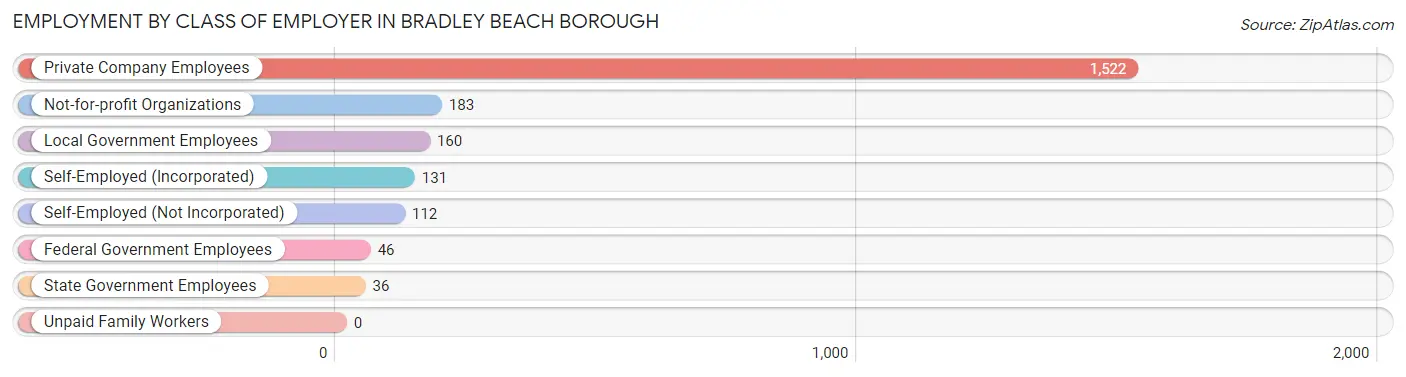
| Employer Class | # Employees | % Employees |
| Private Company Employees | 1,522 | 69.5% |
| Self-Employed (Incorporated) | 131 | 6.0% |
| Self-Employed (Not Incorporated) | 112 | 5.1% |
| Not-for-profit Organizations | 183 | 8.4% |
| Local Government Employees | 160 | 7.3% |
| State Government Employees | 36 | 1.6% |
| Federal Government Employees | 46 | 2.1% |
| Unpaid Family Workers | 0 | 0.0% |
| Total | 2,190 | 100.0% |
Employment Status by Age in Bradley Beach borough
According to the labor force statistics for Bradley Beach borough, out of the total population over 16 years of age (3,746), 61.1% or 2,289 individuals are in the labor force, with 3.4% or 78 of them unemployed. The age group with the highest labor force participation rate is 25 to 29 years, with 94.7% or 469 individuals in the labor force. Within the labor force, the 16 to 19 years age range has the highest percentage of unemployed individuals, with 60.5% or 23 of them being unemployed.
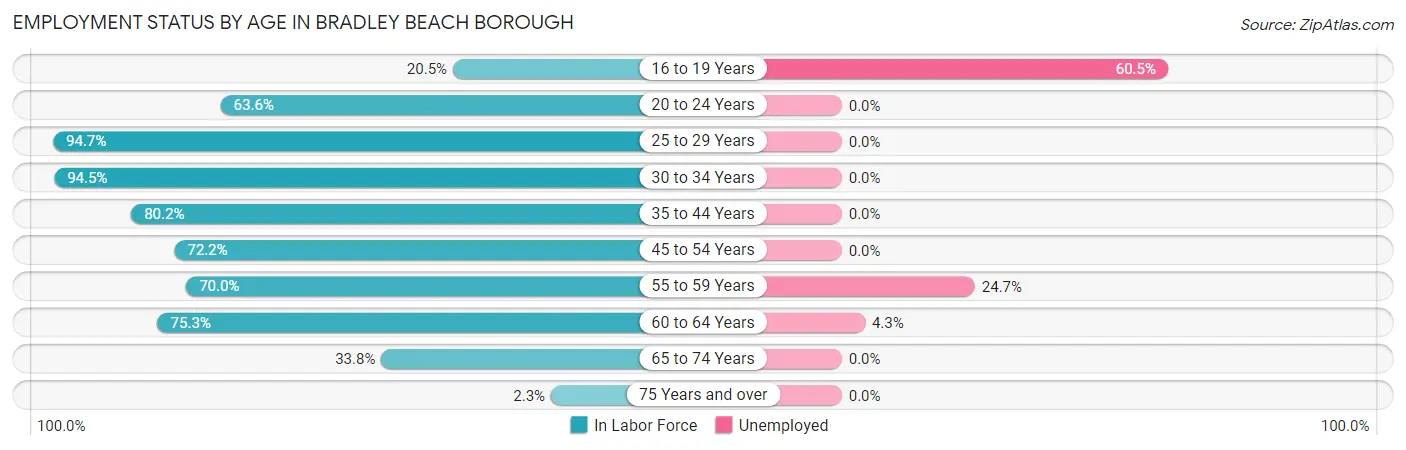
| Age Bracket | In Labor Force | Unemployed |
| 16 to 19 Years | 38 (20.5%) | 23 (60.5%) |
| 20 to 24 Years | 91 (63.6%) | 0 (0.0%) |
| 25 to 29 Years | 469 (94.7%) | 0 (0.0%) |
| 30 to 34 Years | 482 (94.5%) | 0 (0.0%) |
| 35 to 44 Years | 276 (80.2%) | 0 (0.0%) |
| 45 to 54 Years | 294 (72.2%) | 0 (0.0%) |
| 55 to 59 Years | 170 (70.0%) | 42 (24.7%) |
| 60 to 64 Years | 281 (75.3%) | 12 (4.3%) |
| 65 to 74 Years | 175 (33.8%) | 0 (0.0%) |
| 75 Years and over | 12 (2.3%) | 0 (0.0%) |
| Total | 2,289 (61.1%) | 78 (3.4%) |
Employment Status by Educational Attainment in Bradley Beach borough
According to labor force statistics for Bradley Beach borough, 83.1% of individuals (1,971) out of the total population between 25 and 64 years of age (2,372) are in the labor force, with 2.7% or 53 of them being unemployed. The group with the highest labor force participation rate are those with the educational attainment of high school diploma, with 97.5% or 274 individuals in the labor force. Within the labor force, individuals with bachelor's degree or higher education have the highest percentage of unemployment, with 3.8% or 47 of them being unemployed.
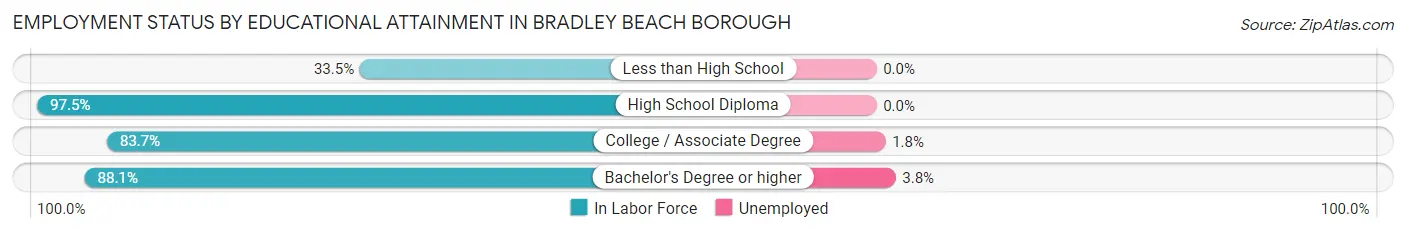
| Educational Attainment | In Labor Force | Unemployed |
| Less than High School | 76 (33.5%) | 0 (0.0%) |
| High School Diploma | 274 (97.5%) | 0 (0.0%) |
| College / Associate Degree | 390 (83.7%) | 8 (1.8%) |
| Bachelor's Degree or higher | 1,232 (88.1%) | 53 (3.8%) |
| Total | 1,971 (83.1%) | 64 (2.7%) |
Employment Occupations by Sex in Bradley Beach borough
Management, Business, Science and Arts Occupations
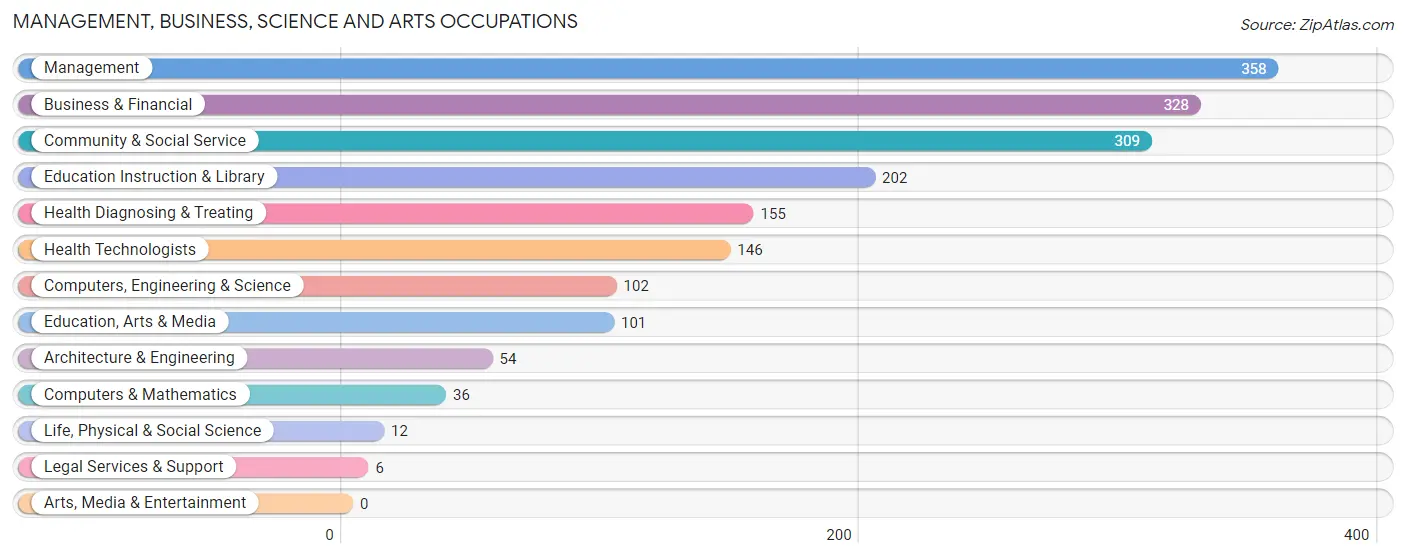
The most common Management, Business, Science and Arts occupations in Bradley Beach borough are Management (358 | 16.2%), Business & Financial (328 | 14.8%), Community & Social Service (309 | 14.0%), Education Instruction & Library (202 | 9.1%), and Health Diagnosing & Treating (155 | 7.0%).
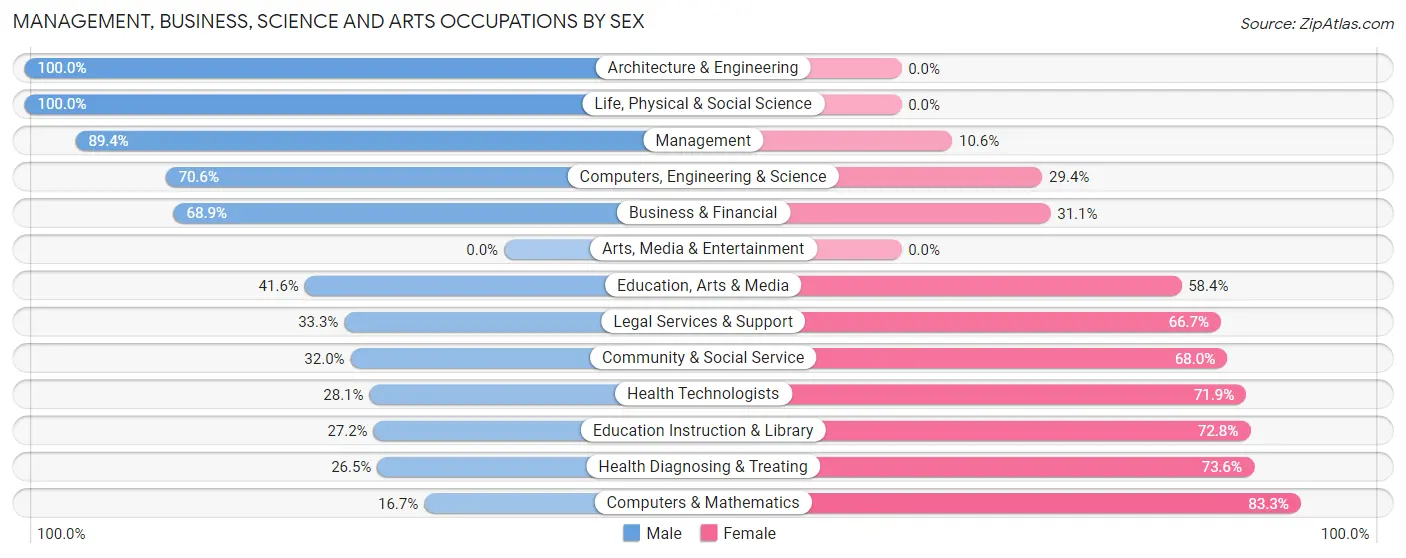
Management, Business, Science and Arts Occupations by Sex
Within the Management, Business, Science and Arts occupations in Bradley Beach borough, the most male-oriented occupations are Architecture & Engineering (100.0%), Life, Physical & Social Science (100.0%), and Management (89.4%), while the most female-oriented occupations are Computers & Mathematics (83.3%), Health Diagnosing & Treating (73.6%), and Education Instruction & Library (72.8%).
| Occupation | Male | Female |
| Management | 320 (89.4%) | 38 (10.6%) |
| Business & Financial | 226 (68.9%) | 102 (31.1%) |
| Computers, Engineering & Science | 72 (70.6%) | 30 (29.4%) |
| Computers & Mathematics | 6 (16.7%) | 30 (83.3%) |
| Architecture & Engineering | 54 (100.0%) | 0 (0.0%) |
| Life, Physical & Social Science | 12 (100.0%) | 0 (0.0%) |
| Community & Social Service | 99 (32.0%) | 210 (68.0%) |
| Education, Arts & Media | 42 (41.6%) | 59 (58.4%) |
| Legal Services & Support | 2 (33.3%) | 4 (66.7%) |
| Education Instruction & Library | 55 (27.2%) | 147 (72.8%) |
| Arts, Media & Entertainment | 0 (0.0%) | 0 (0.0%) |
| Health Diagnosing & Treating | 41 (26.5%) | 114 (73.6%) |
| Health Technologists | 41 (28.1%) | 105 (71.9%) |
| Total (Category) | 758 (60.5%) | 494 (39.5%) |
| Total (Overall) | 1,362 (61.6%) | 849 (38.4%) |
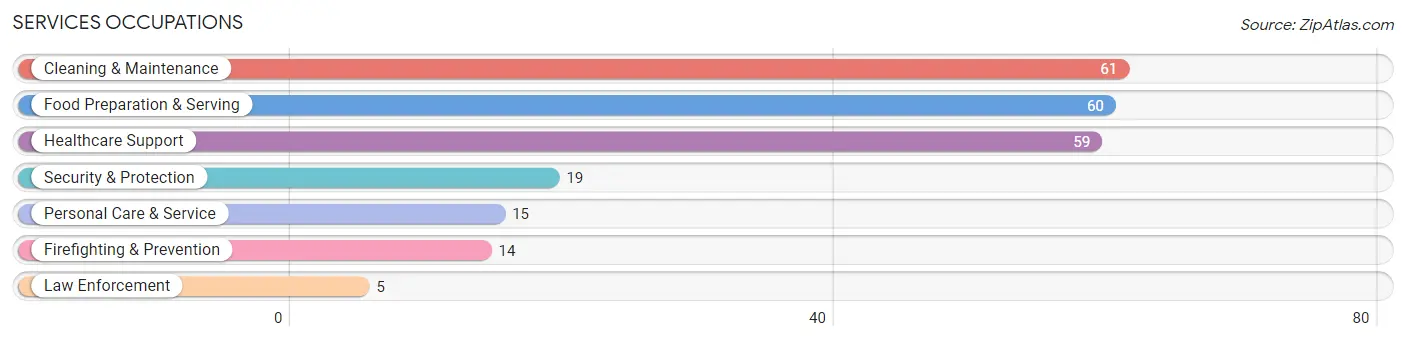
Services Occupations
The most common Services occupations in Bradley Beach borough are Cleaning & Maintenance (61 | 2.8%), Food Preparation & Serving (60 | 2.7%), Healthcare Support (59 | 2.7%), Security & Protection (19 | 0.9%), and Personal Care & Service (15 | 0.7%).
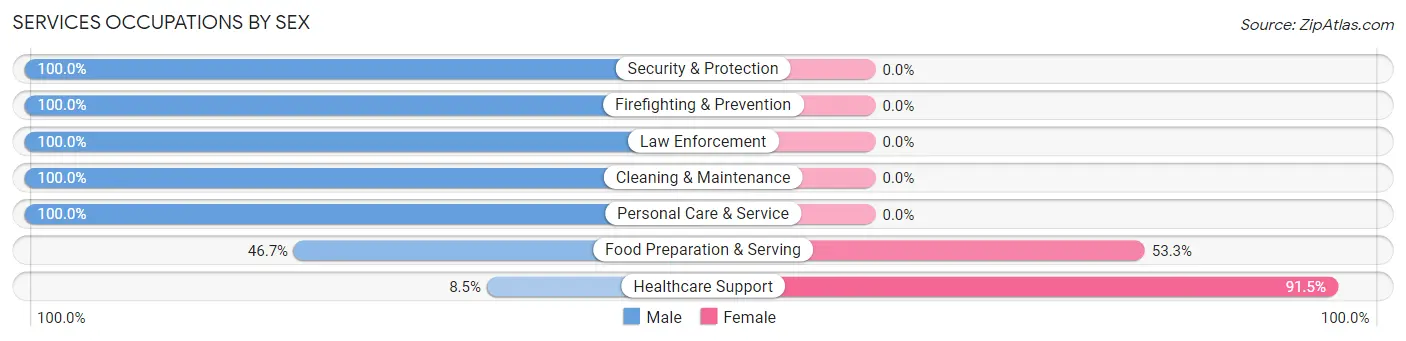
Services Occupations by Sex
Within the Services occupations in Bradley Beach borough, the most male-oriented occupations are Security & Protection (100.0%), Firefighting & Prevention (100.0%), and Law Enforcement (100.0%), while the most female-oriented occupations are Healthcare Support (91.5%), and Food Preparation & Serving (53.3%).
| Occupation | Male | Female |
| Healthcare Support | 5 (8.5%) | 54 (91.5%) |
| Security & Protection | 19 (100.0%) | 0 (0.0%) |
| Firefighting & Prevention | 14 (100.0%) | 0 (0.0%) |
| Law Enforcement | 5 (100.0%) | 0 (0.0%) |
| Food Preparation & Serving | 28 (46.7%) | 32 (53.3%) |
| Cleaning & Maintenance | 61 (100.0%) | 0 (0.0%) |
| Personal Care & Service | 15 (100.0%) | 0 (0.0%) |
| Total (Category) | 128 (59.8%) | 86 (40.2%) |
| Total (Overall) | 1,362 (61.6%) | 849 (38.4%) |
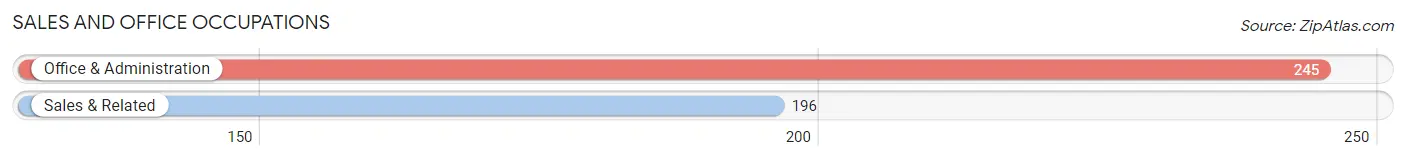
Sales and Office Occupations
The most common Sales and Office occupations in Bradley Beach borough are Office & Administration (245 | 11.1%), and Sales & Related (196 | 8.9%).
Sales and Office Occupations by Sex
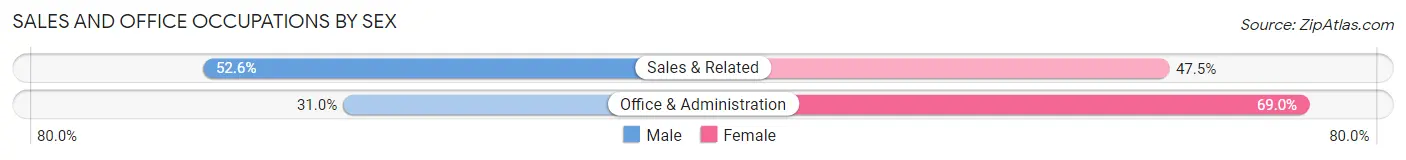
| Occupation | Male | Female |
| Sales & Related | 103 (52.5%) | 93 (47.4%) |
| Office & Administration | 76 (31.0%) | 169 (69.0%) |
| Total (Category) | 179 (40.6%) | 262 (59.4%) |
| Total (Overall) | 1,362 (61.6%) | 849 (38.4%) |
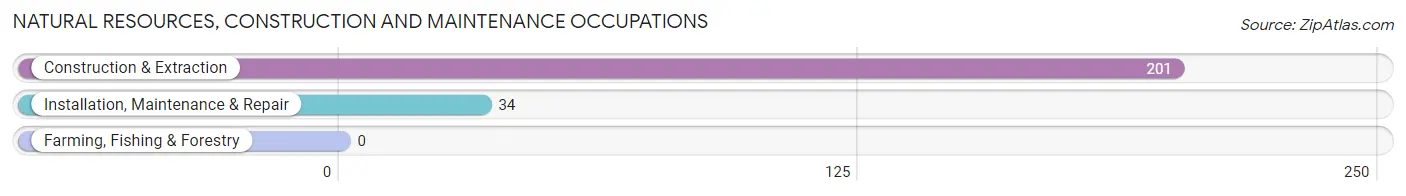
Natural Resources, Construction and Maintenance Occupations
The most common Natural Resources, Construction and Maintenance occupations in Bradley Beach borough are Construction & Extraction (201 | 9.1%), and Installation, Maintenance & Repair (34 | 1.5%).
Natural Resources, Construction and Maintenance Occupations by Sex
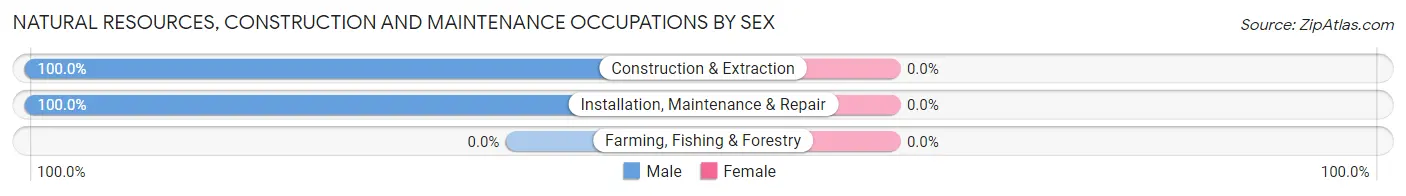
| Occupation | Male | Female |
| Farming, Fishing & Forestry | 0 (0.0%) | 0 (0.0%) |
| Construction & Extraction | 201 (100.0%) | 0 (0.0%) |
| Installation, Maintenance & Repair | 34 (100.0%) | 0 (0.0%) |
| Total (Category) | 235 (100.0%) | 0 (0.0%) |
| Total (Overall) | 1,362 (61.6%) | 849 (38.4%) |
Production, Transportation and Moving Occupations
The most common Production, Transportation and Moving occupations in Bradley Beach borough are Transportation (33 | 1.5%), Production (23 | 1.0%), and Material Moving (13 | 0.6%).
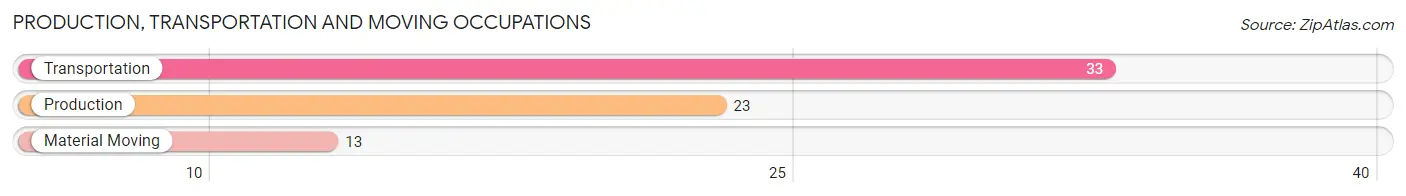
Production, Transportation and Moving Occupations by Sex
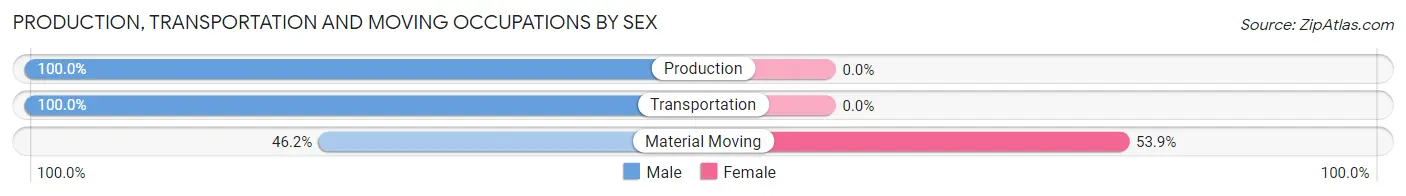
| Occupation | Male | Female |
| Production | 23 (100.0%) | 0 (0.0%) |
| Transportation | 33 (100.0%) | 0 (0.0%) |
| Material Moving | 6 (46.2%) | 7 (53.8%) |
| Total (Category) | 62 (89.9%) | 7 (10.1%) |
| Total (Overall) | 1,362 (61.6%) | 849 (38.4%) |
Employment Industries by Sex in Bradley Beach borough
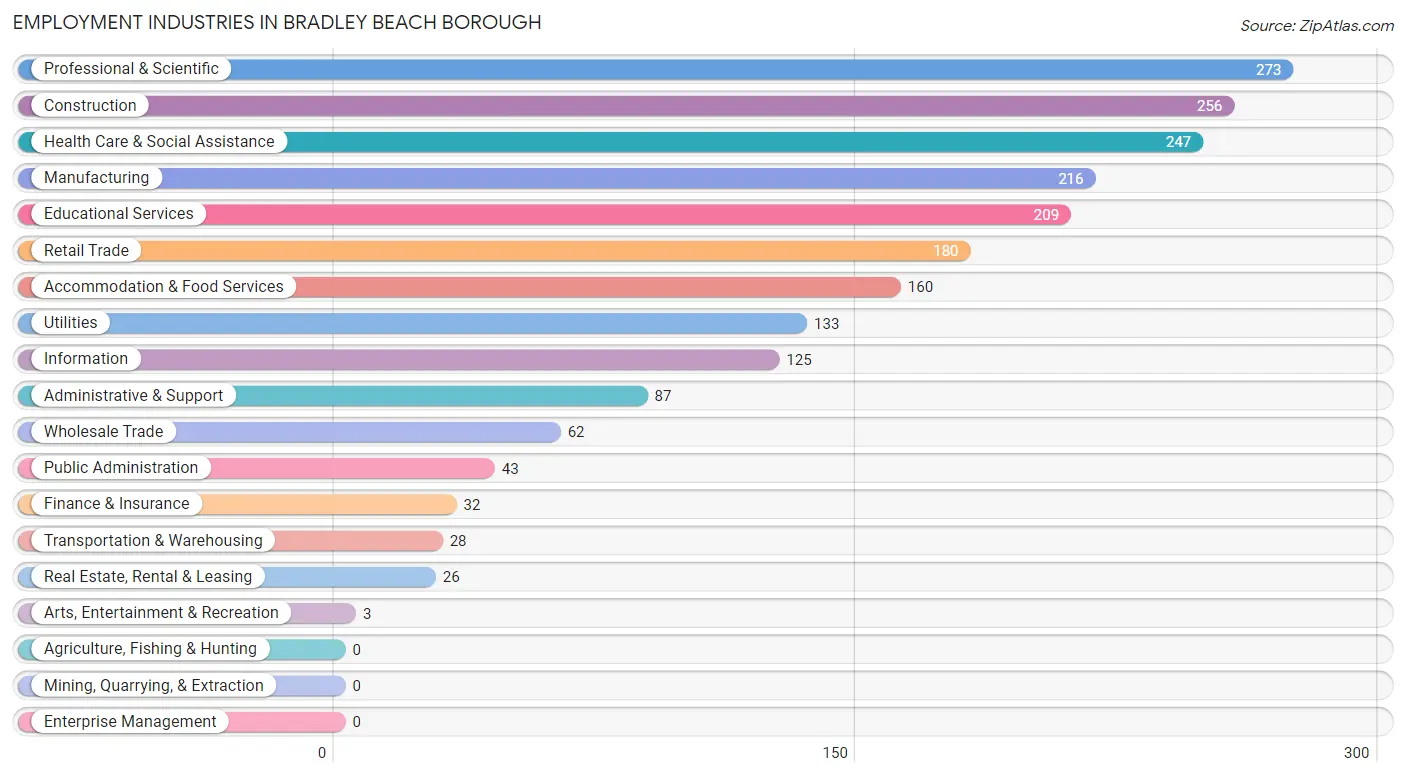
Employment Industries in Bradley Beach borough
The major employment industries in Bradley Beach borough include Professional & Scientific (273 | 12.3%), Construction (256 | 11.6%), Health Care & Social Assistance (247 | 11.2%), Manufacturing (216 | 9.8%), and Educational Services (209 | 9.5%).
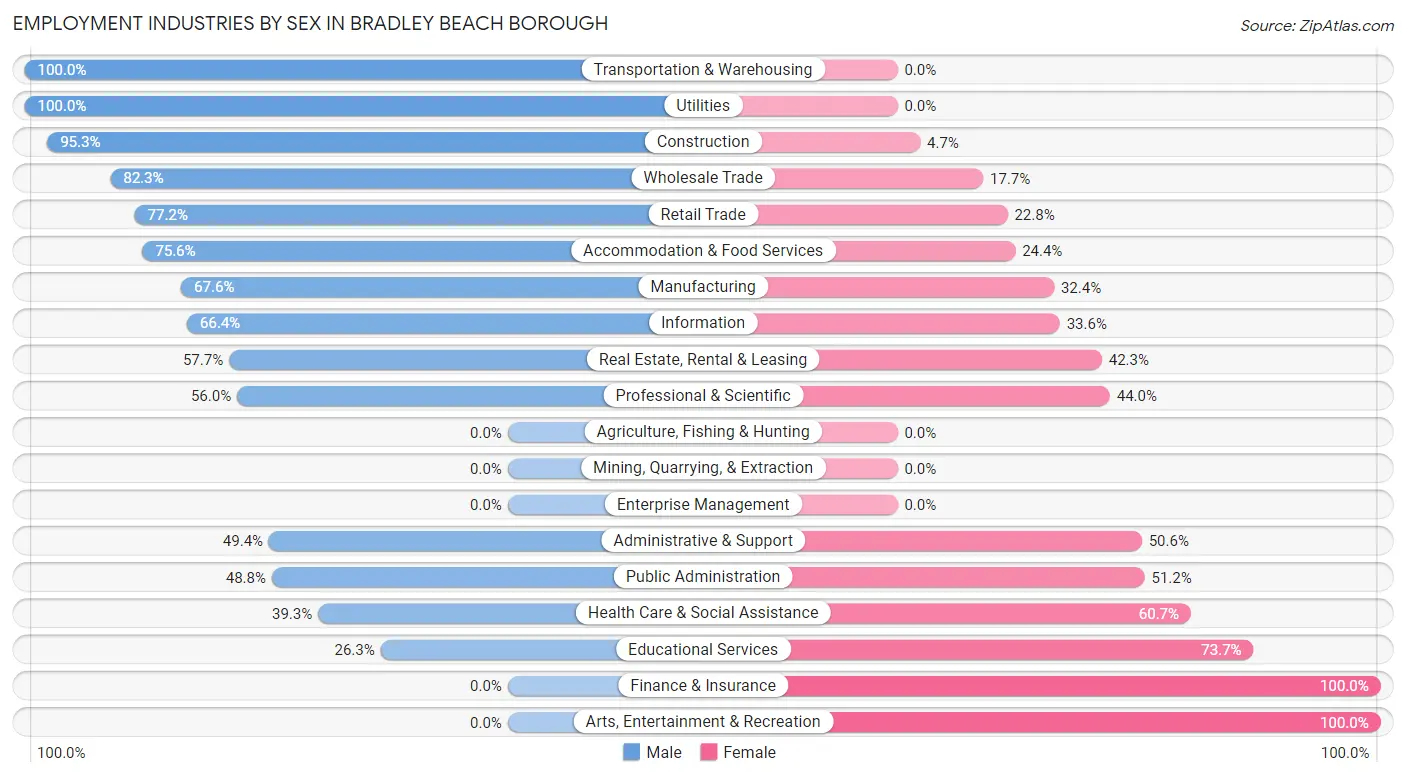
Employment Industries by Sex in Bradley Beach borough
The Bradley Beach borough industries that see more men than women are Transportation & Warehousing (100.0%), Utilities (100.0%), and Construction (95.3%), whereas the industries that tend to have a higher number of women are Finance & Insurance (100.0%), Arts, Entertainment & Recreation (100.0%), and Educational Services (73.7%).
| Industry | Male | Female |
| Agriculture, Fishing & Hunting | 0 (0.0%) | 0 (0.0%) |
| Mining, Quarrying, & Extraction | 0 (0.0%) | 0 (0.0%) |
| Construction | 244 (95.3%) | 12 (4.7%) |
| Manufacturing | 146 (67.6%) | 70 (32.4%) |
| Wholesale Trade | 51 (82.3%) | 11 (17.7%) |
| Retail Trade | 139 (77.2%) | 41 (22.8%) |
| Transportation & Warehousing | 28 (100.0%) | 0 (0.0%) |
| Utilities | 133 (100.0%) | 0 (0.0%) |
| Information | 83 (66.4%) | 42 (33.6%) |
| Finance & Insurance | 0 (0.0%) | 32 (100.0%) |
| Real Estate, Rental & Leasing | 15 (57.7%) | 11 (42.3%) |
| Professional & Scientific | 153 (56.0%) | 120 (44.0%) |
| Enterprise Management | 0 (0.0%) | 0 (0.0%) |
| Administrative & Support | 43 (49.4%) | 44 (50.6%) |
| Educational Services | 55 (26.3%) | 154 (73.7%) |
| Health Care & Social Assistance | 97 (39.3%) | 150 (60.7%) |
| Arts, Entertainment & Recreation | 0 (0.0%) | 3 (100.0%) |
| Accommodation & Food Services | 121 (75.6%) | 39 (24.4%) |
| Public Administration | 21 (48.8%) | 22 (51.2%) |
| Total | 1,362 (61.6%) | 849 (38.4%) |
Education in Bradley Beach borough
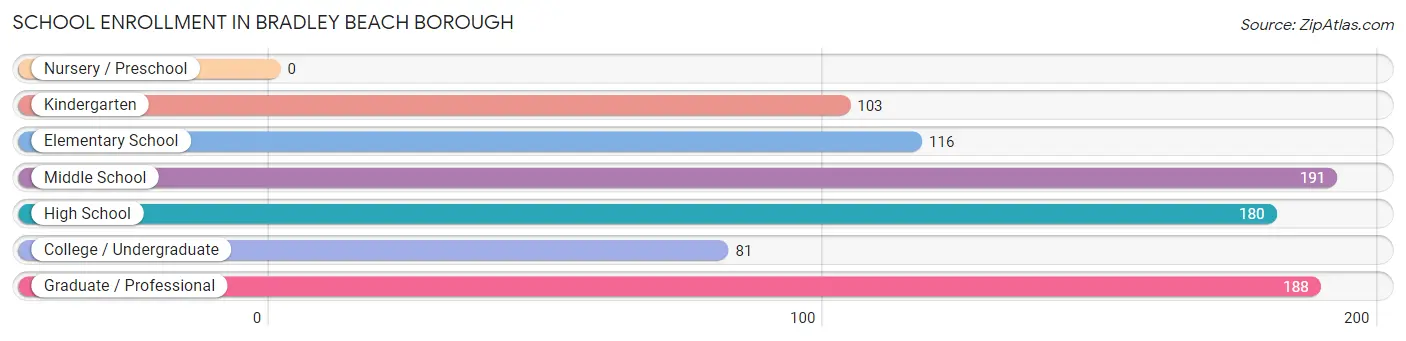
School Enrollment in Bradley Beach borough
The most common levels of schooling among the 859 students in Bradley Beach borough are middle school (191 | 22.2%), graduate / professional (188 | 21.9%), and high school (180 | 20.9%).
| School Level | # Students | % Students |
| Nursery / Preschool | 0 | 0.0% |
| Kindergarten | 103 | 12.0% |
| Elementary School | 116 | 13.5% |
| Middle School | 191 | 22.2% |
| High School | 180 | 20.9% |
| College / Undergraduate | 81 | 9.4% |
| Graduate / Professional | 188 | 21.9% |
| Total | 859 | 100.0% |
School Enrollment by Age by Funding Source in Bradley Beach borough
Out of a total of 859 students who are enrolled in schools in Bradley Beach borough, 207 (24.1%) attend a private institution, while the remaining 652 (75.9%) are enrolled in public schools. The age group of 35 years and over has the highest likelihood of being enrolled in private schools, with 31 (100.0% in the age bracket) enrolled. Conversely, the age group of 5 to 9 year old has the lowest likelihood of being enrolled in a private school, with 219 (100.0% in the age bracket) attending a public institution.
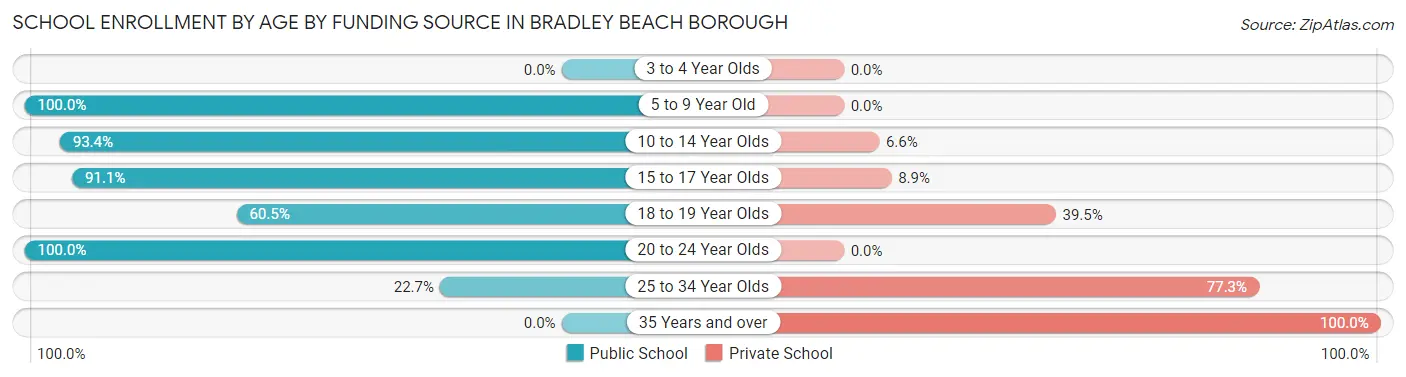
| Age Bracket | Public School | Private School |
| 3 to 4 Year Olds | 0 (0.0%) | 0 (0.0%) |
| 5 to 9 Year Old | 219 (100.0%) | 0 (0.0%) |
| 10 to 14 Year Olds | 199 (93.4%) | 14 (6.6%) |
| 15 to 17 Year Olds | 144 (91.1%) | 14 (8.9%) |
| 18 to 19 Year Olds | 23 (60.5%) | 15 (39.5%) |
| 20 to 24 Year Olds | 28 (100.0%) | 0 (0.0%) |
| 25 to 34 Year Olds | 39 (22.7%) | 133 (77.3%) |
| 35 Years and over | 0 (0.0%) | 31 (100.0%) |
| Total | 652 (75.9%) | 207 (24.1%) |
Educational Attainment by Field of Study in Bradley Beach borough
Business (426 | 17.9%), education (401 | 16.9%), science & technology (256 | 10.8%), social sciences (241 | 10.1%), and bio, nature & agricultural (206 | 8.7%) are the most common fields of study among 2,378 individuals in Bradley Beach borough who have obtained a bachelor's degree or higher.
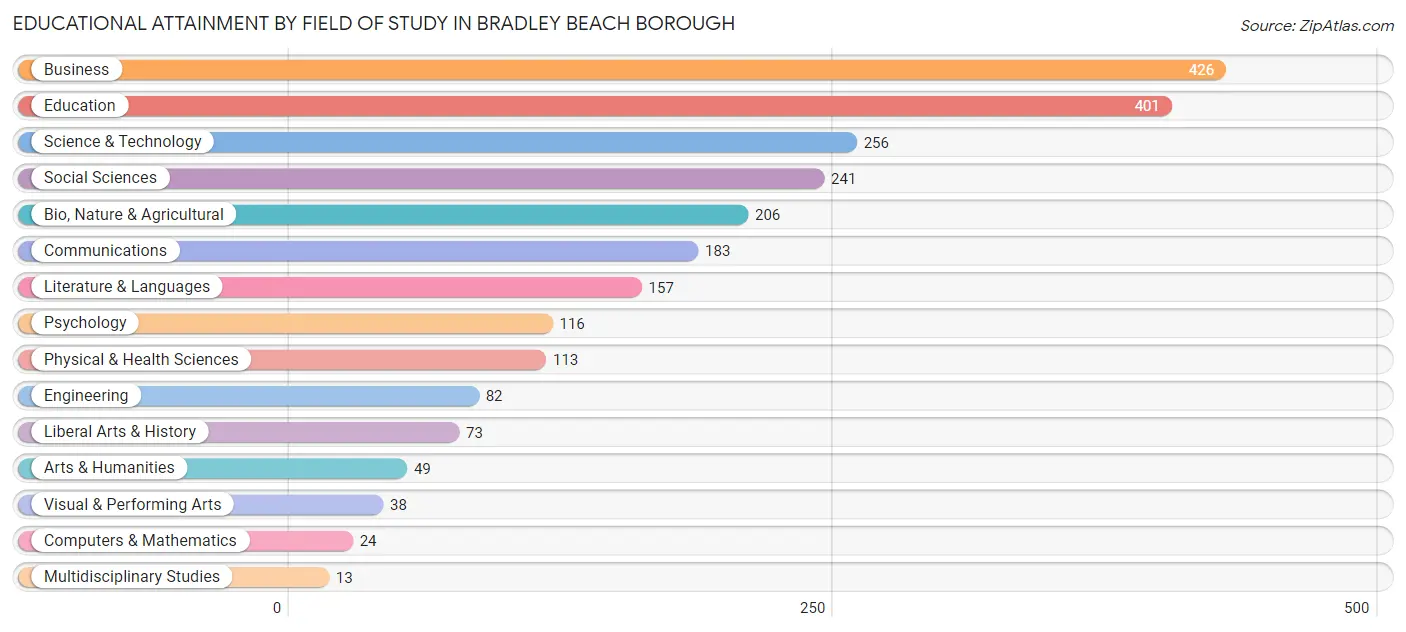
| Field of Study | # Graduates | % Graduates |
| Computers & Mathematics | 24 | 1.0% |
| Bio, Nature & Agricultural | 206 | 8.7% |
| Physical & Health Sciences | 113 | 4.8% |
| Psychology | 116 | 4.9% |
| Social Sciences | 241 | 10.1% |
| Engineering | 82 | 3.5% |
| Multidisciplinary Studies | 13 | 0.5% |
| Science & Technology | 256 | 10.8% |
| Business | 426 | 17.9% |
| Education | 401 | 16.9% |
| Literature & Languages | 157 | 6.6% |
| Liberal Arts & History | 73 | 3.1% |
| Visual & Performing Arts | 38 | 1.6% |
| Communications | 183 | 7.7% |
| Arts & Humanities | 49 | 2.1% |
| Total | 2,378 | 100.0% |
Transportation & Commute in Bradley Beach borough
Vehicle Availability by Sex in Bradley Beach borough
The most prevalent vehicle ownership categories in Bradley Beach borough are males with 2 vehicles (707, accounting for 52.7%) and females with 2 vehicles (368, making up 83.3%).
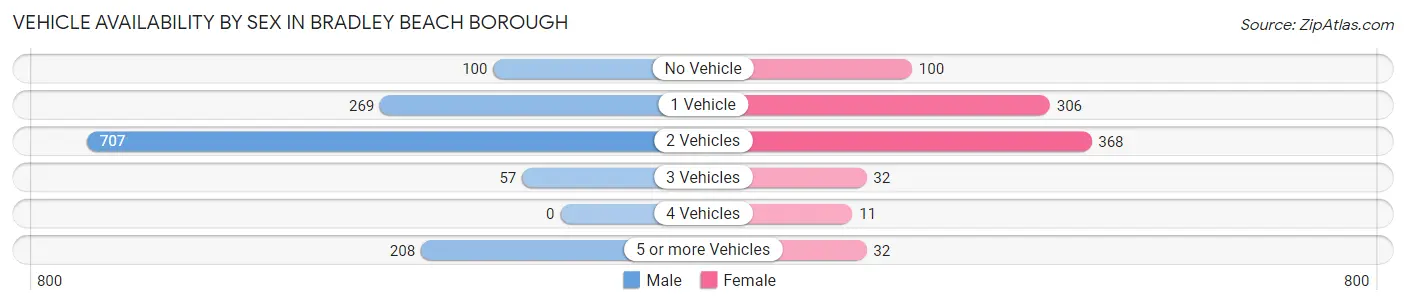
| Vehicles Available | Male | Female |
| No Vehicle | 100 (7.5%) | 100 (11.8%) |
| 1 Vehicle | 269 (20.1%) | 306 (36.0%) |
| 2 Vehicles | 707 (52.7%) | 368 (43.3%) |
| 3 Vehicles | 57 (4.3%) | 32 (3.8%) |
| 4 Vehicles | 0 (0.0%) | 11 (1.3%) |
| 5 or more Vehicles | 208 (15.5%) | 32 (3.8%) |
| Total | 1,341 (100.0%) | 849 (100.0%) |
Commute Time in Bradley Beach borough
The most frequently occuring commute durations in Bradley Beach borough are 15 to 19 minutes (339 commuters, 19.9%), less than 5 minutes (193 commuters, 11.3%), and 10 to 14 minutes (188 commuters, 11.0%).
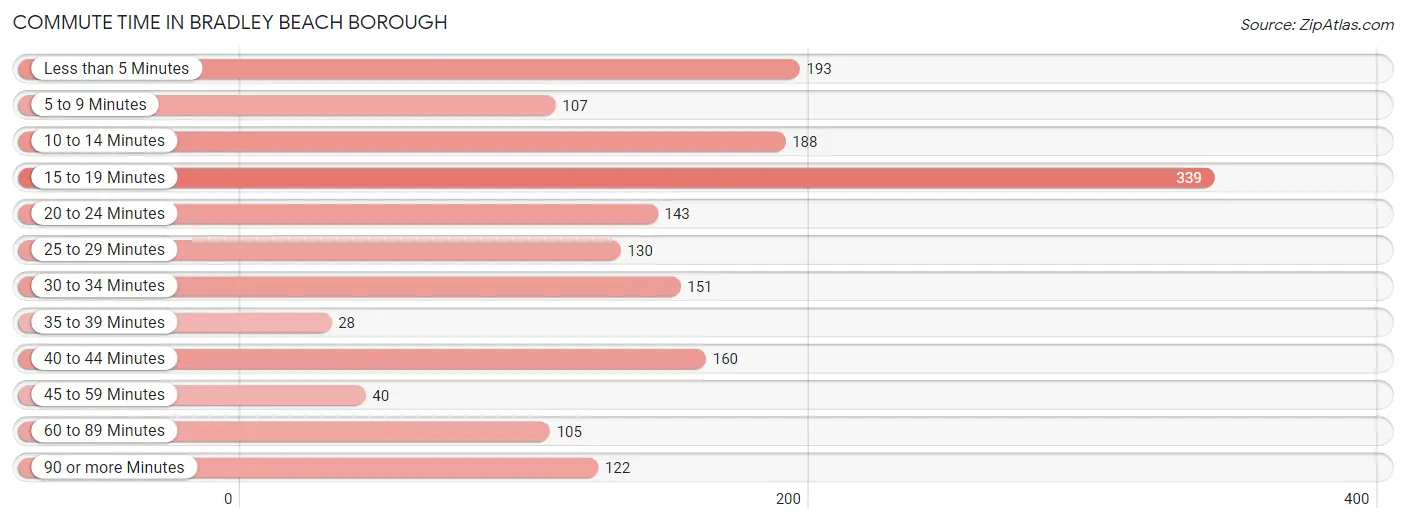
| Commute Time | # Commuters | % Commuters |
| Less than 5 Minutes | 193 | 11.3% |
| 5 to 9 Minutes | 107 | 6.3% |
| 10 to 14 Minutes | 188 | 11.0% |
| 15 to 19 Minutes | 339 | 19.9% |
| 20 to 24 Minutes | 143 | 8.4% |
| 25 to 29 Minutes | 130 | 7.6% |
| 30 to 34 Minutes | 151 | 8.8% |
| 35 to 39 Minutes | 28 | 1.6% |
| 40 to 44 Minutes | 160 | 9.4% |
| 45 to 59 Minutes | 40 | 2.3% |
| 60 to 89 Minutes | 105 | 6.1% |
| 90 or more Minutes | 122 | 7.1% |
Commute Time by Sex in Bradley Beach borough
The most common commute times in Bradley Beach borough are 15 to 19 minutes (206 commuters, 18.0%) for males and 15 to 19 minutes (133 commuters, 23.7%) for females.
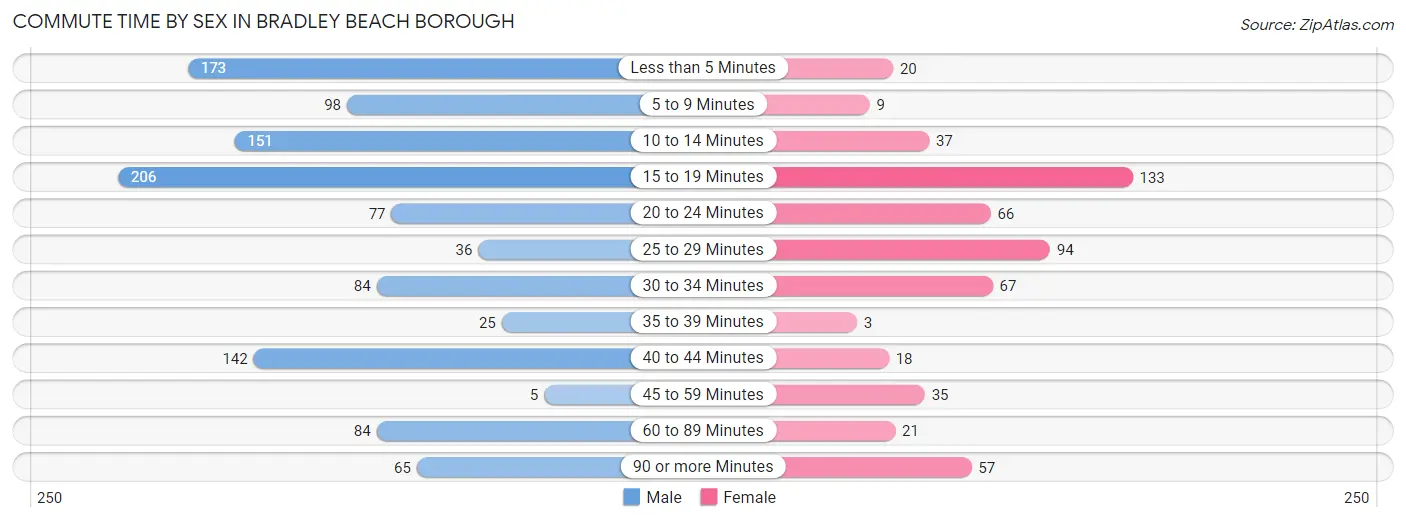
| Commute Time | Male | Female |
| Less than 5 Minutes | 173 (15.1%) | 20 (3.6%) |
| 5 to 9 Minutes | 98 (8.6%) | 9 (1.6%) |
| 10 to 14 Minutes | 151 (13.2%) | 37 (6.6%) |
| 15 to 19 Minutes | 206 (18.0%) | 133 (23.7%) |
| 20 to 24 Minutes | 77 (6.7%) | 66 (11.8%) |
| 25 to 29 Minutes | 36 (3.1%) | 94 (16.8%) |
| 30 to 34 Minutes | 84 (7.3%) | 67 (12.0%) |
| 35 to 39 Minutes | 25 (2.2%) | 3 (0.5%) |
| 40 to 44 Minutes | 142 (12.4%) | 18 (3.2%) |
| 45 to 59 Minutes | 5 (0.4%) | 35 (6.2%) |
| 60 to 89 Minutes | 84 (7.3%) | 21 (3.7%) |
| 90 or more Minutes | 65 (5.7%) | 57 (10.2%) |
Time of Departure to Work by Sex in Bradley Beach borough
The most frequent times of departure to work in Bradley Beach borough are 7:30 AM to 7:59 AM (232, 20.2%) for males and 7:30 AM to 7:59 AM (148, 26.4%) for females.
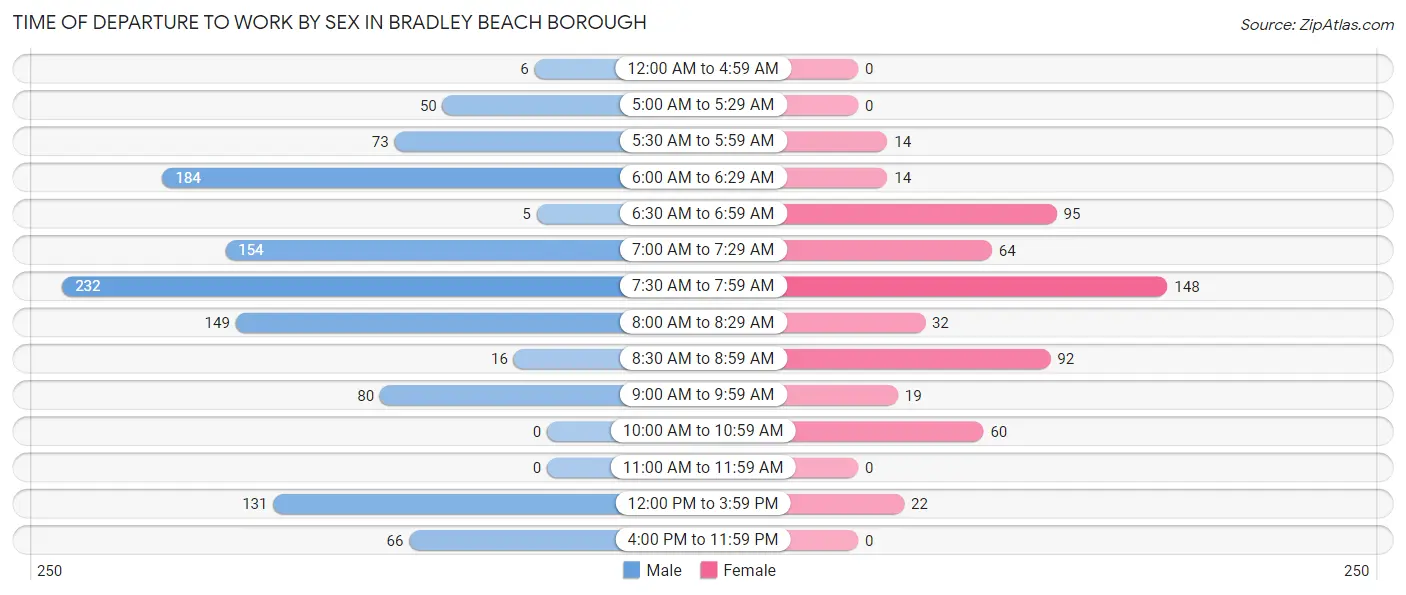
| Time of Departure | Male | Female |
| 12:00 AM to 4:59 AM | 6 (0.5%) | 0 (0.0%) |
| 5:00 AM to 5:29 AM | 50 (4.4%) | 0 (0.0%) |
| 5:30 AM to 5:59 AM | 73 (6.4%) | 14 (2.5%) |
| 6:00 AM to 6:29 AM | 184 (16.1%) | 14 (2.5%) |
| 6:30 AM to 6:59 AM | 5 (0.4%) | 95 (17.0%) |
| 7:00 AM to 7:29 AM | 154 (13.4%) | 64 (11.4%) |
| 7:30 AM to 7:59 AM | 232 (20.2%) | 148 (26.4%) |
| 8:00 AM to 8:29 AM | 149 (13.0%) | 32 (5.7%) |
| 8:30 AM to 8:59 AM | 16 (1.4%) | 92 (16.4%) |
| 9:00 AM to 9:59 AM | 80 (7.0%) | 19 (3.4%) |
| 10:00 AM to 10:59 AM | 0 (0.0%) | 60 (10.7%) |
| 11:00 AM to 11:59 AM | 0 (0.0%) | 0 (0.0%) |
| 12:00 PM to 3:59 PM | 131 (11.4%) | 22 (3.9%) |
| 4:00 PM to 11:59 PM | 66 (5.8%) | 0 (0.0%) |
| Total | 1,146 (100.0%) | 560 (100.0%) |
Housing Occupancy in Bradley Beach borough
Occupancy by Ownership in Bradley Beach borough
Of the total 1,923 dwellings in Bradley Beach borough, owner-occupied units account for 878 (45.7%), while renter-occupied units make up 1,045 (54.3%).
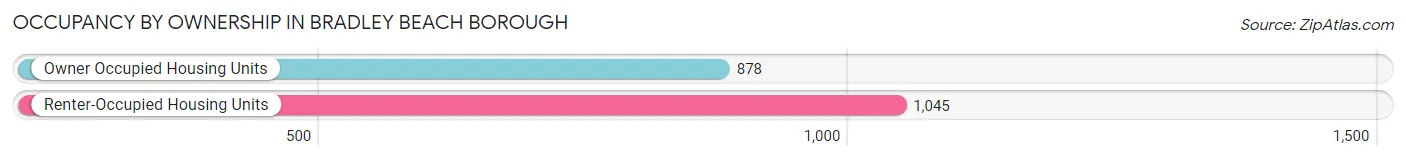
| Occupancy | # Housing Units | % Housing Units |
| Owner Occupied Housing Units | 878 | 45.7% |
| Renter-Occupied Housing Units | 1,045 | 54.3% |
| Total Occupied Housing Units | 1,923 | 100.0% |
Occupancy by Household Size in Bradley Beach borough
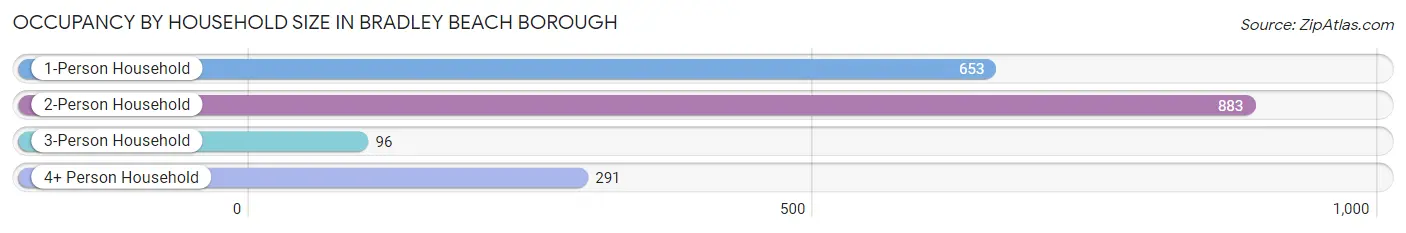
| Household Size | # Housing Units | % Housing Units |
| 1-Person Household | 653 | 34.0% |
| 2-Person Household | 883 | 45.9% |
| 3-Person Household | 96 | 5.0% |
| 4+ Person Household | 291 | 15.1% |
| Total Housing Units | 1,923 | 100.0% |
Occupancy by Ownership by Household Size in Bradley Beach borough
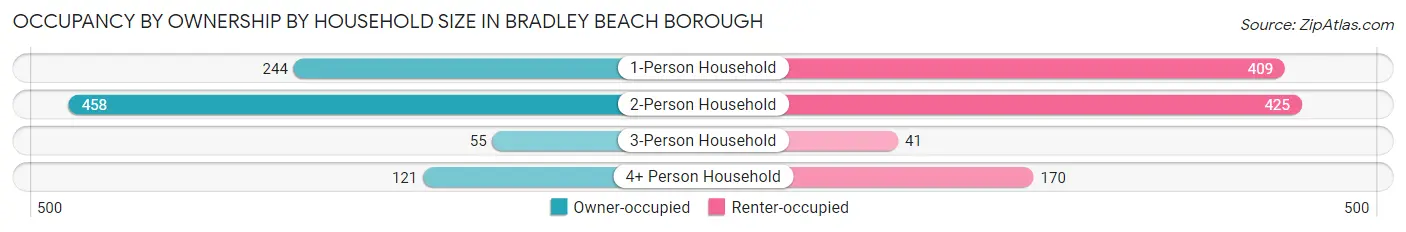
| Household Size | Owner-occupied | Renter-occupied |
| 1-Person Household | 244 (37.4%) | 409 (62.6%) |
| 2-Person Household | 458 (51.9%) | 425 (48.1%) |
| 3-Person Household | 55 (57.3%) | 41 (42.7%) |
| 4+ Person Household | 121 (41.6%) | 170 (58.4%) |
| Total Housing Units | 878 (45.7%) | 1,045 (54.3%) |
Occupancy by Educational Attainment in Bradley Beach borough
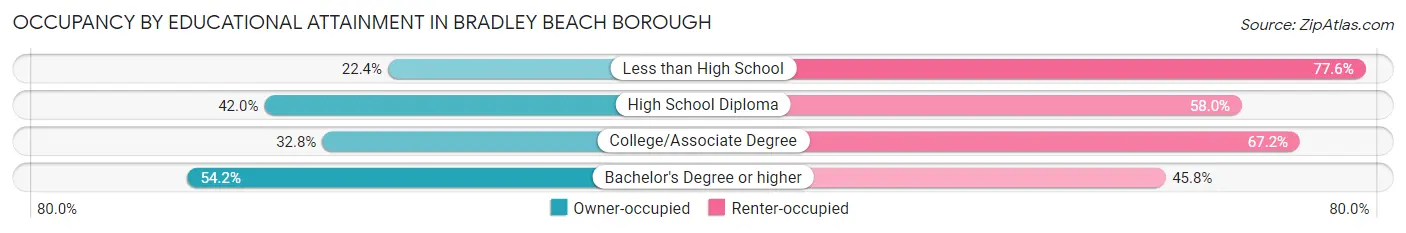
| Household Size | Owner-occupied | Renter-occupied |
| Less than High School | 32 (22.4%) | 111 (77.6%) |
| High School Diploma | 131 (42.0%) | 181 (58.0%) |
| College/Associate Degree | 123 (32.8%) | 252 (67.2%) |
| Bachelor's Degree or higher | 592 (54.2%) | 501 (45.8%) |
Occupancy by Age of Householder in Bradley Beach borough
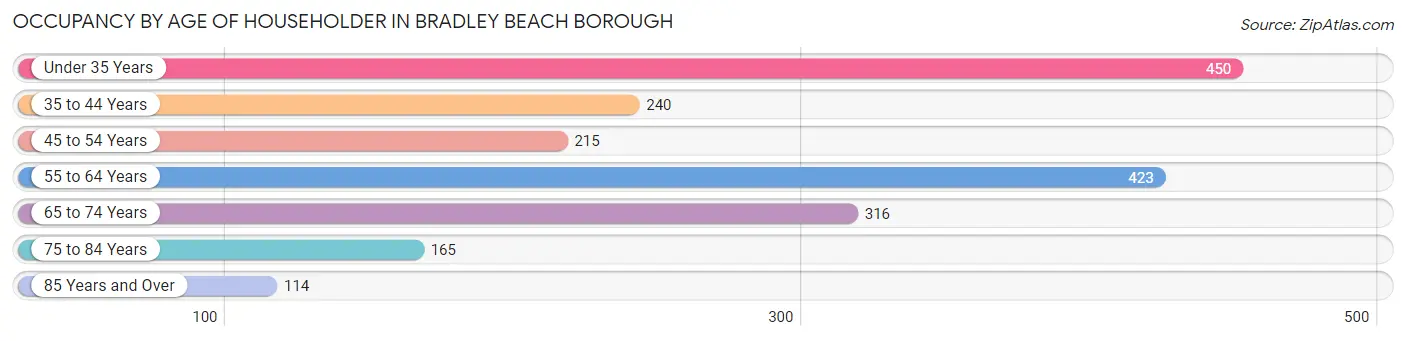
| Age Bracket | # Households | % Households |
| Under 35 Years | 450 | 23.4% |
| 35 to 44 Years | 240 | 12.5% |
| 45 to 54 Years | 215 | 11.2% |
| 55 to 64 Years | 423 | 22.0% |
| 65 to 74 Years | 316 | 16.4% |
| 75 to 84 Years | 165 | 8.6% |
| 85 Years and Over | 114 | 5.9% |
| Total | 1,923 | 100.0% |
Housing Finances in Bradley Beach borough
Median Income by Occupancy in Bradley Beach borough
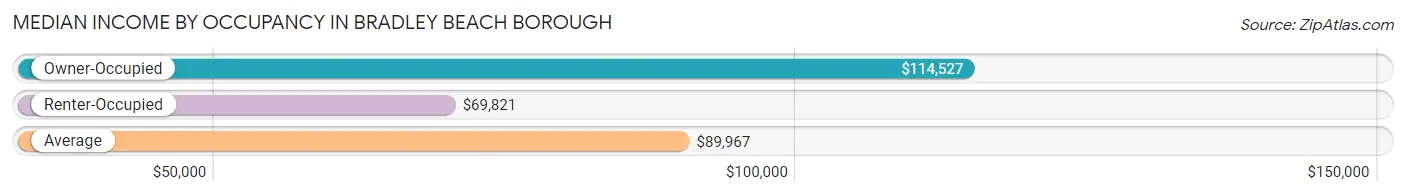
| Occupancy Type | # Households | Median Income |
| Owner-Occupied | 878 (45.7%) | $114,527 |
| Renter-Occupied | 1,045 (54.3%) | $69,821 |
| Average | 1,923 (100.0%) | $89,967 |
Occupancy by Householder Income Bracket in Bradley Beach borough
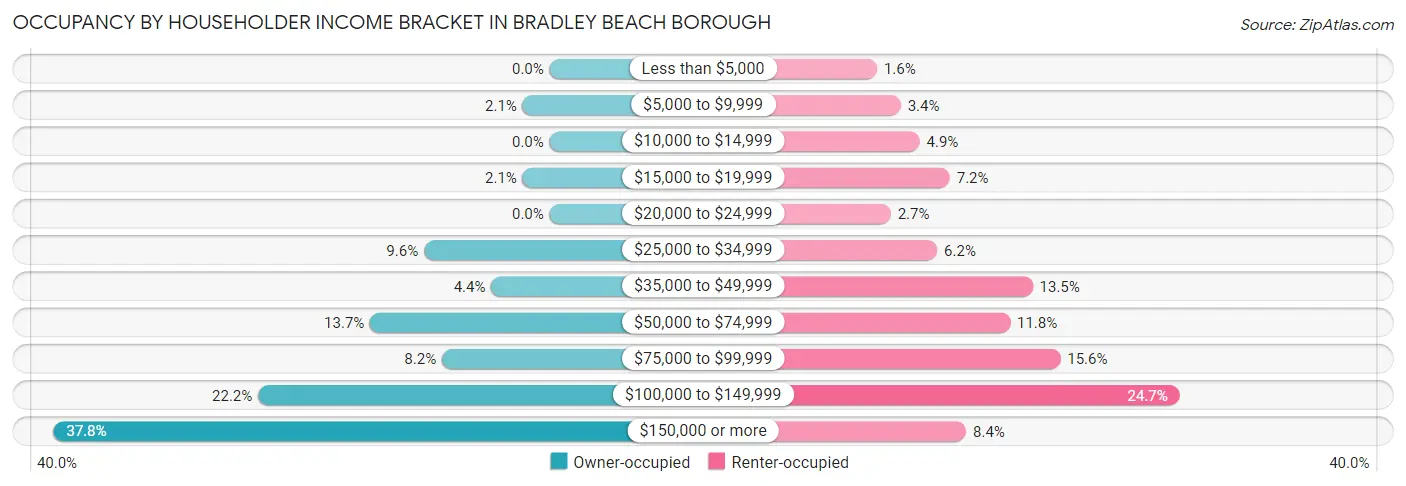
| Income Bracket | Owner-occupied | Renter-occupied |
| Less than $5,000 | 0 (0.0%) | 17 (1.6%) |
| $5,000 to $9,999 | 18 (2.1%) | 36 (3.4%) |
| $10,000 to $14,999 | 0 (0.0%) | 51 (4.9%) |
| $15,000 to $19,999 | 18 (2.1%) | 75 (7.2%) |
| $20,000 to $24,999 | 0 (0.0%) | 28 (2.7%) |
| $25,000 to $34,999 | 84 (9.6%) | 65 (6.2%) |
| $35,000 to $49,999 | 39 (4.4%) | 141 (13.5%) |
| $50,000 to $74,999 | 120 (13.7%) | 123 (11.8%) |
| $75,000 to $99,999 | 72 (8.2%) | 163 (15.6%) |
| $100,000 to $149,999 | 195 (22.2%) | 258 (24.7%) |
| $150,000 or more | 332 (37.8%) | 88 (8.4%) |
| Total | 878 (100.0%) | 1,045 (100.0%) |
Monthly Housing Cost Tiers in Bradley Beach borough
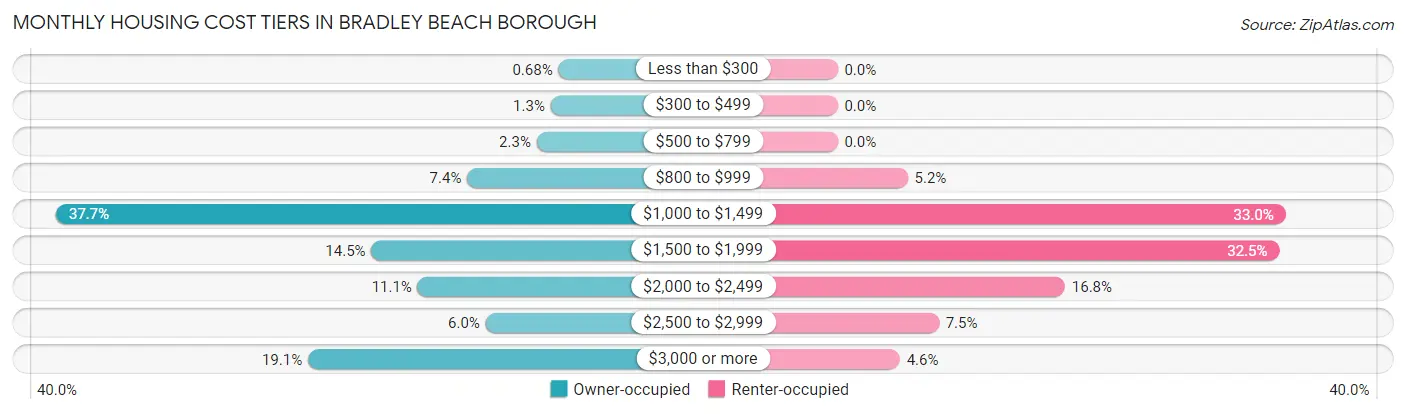
| Monthly Cost | Owner-occupied | Renter-occupied |
| Less than $300 | 6 (0.7%) | 0 (0.0%) |
| $300 to $499 | 11 (1.3%) | 0 (0.0%) |
| $500 to $799 | 20 (2.3%) | 0 (0.0%) |
| $800 to $999 | 65 (7.4%) | 54 (5.2%) |
| $1,000 to $1,499 | 331 (37.7%) | 345 (33.0%) |
| $1,500 to $1,999 | 127 (14.5%) | 340 (32.5%) |
| $2,000 to $2,499 | 97 (11.1%) | 175 (16.8%) |
| $2,500 to $2,999 | 53 (6.0%) | 78 (7.5%) |
| $3,000 or more | 168 (19.1%) | 48 (4.6%) |
| Total | 878 (100.0%) | 1,045 (100.0%) |
Physical Housing Characteristics in Bradley Beach borough
Housing Structures in Bradley Beach borough
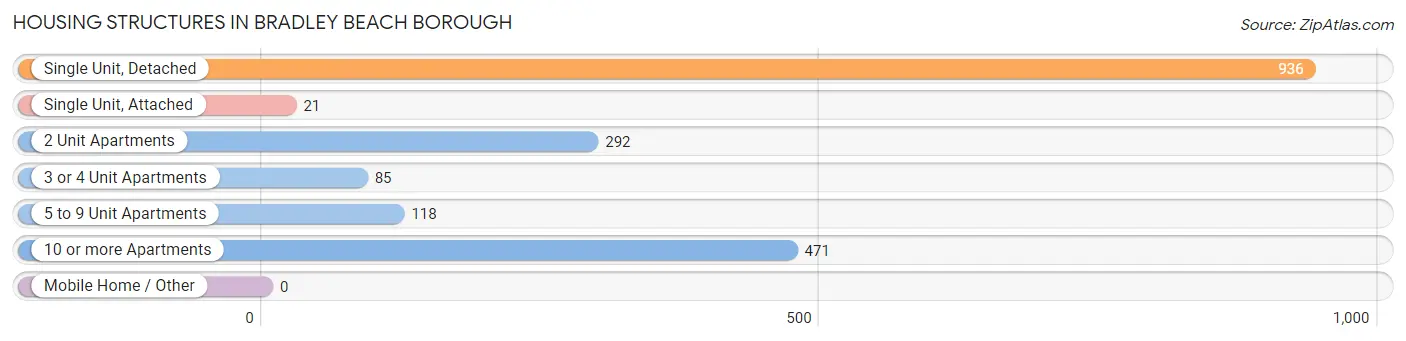
| Structure Type | # Housing Units | % Housing Units |
| Single Unit, Detached | 936 | 48.7% |
| Single Unit, Attached | 21 | 1.1% |
| 2 Unit Apartments | 292 | 15.2% |
| 3 or 4 Unit Apartments | 85 | 4.4% |
| 5 to 9 Unit Apartments | 118 | 6.1% |
| 10 or more Apartments | 471 | 24.5% |
| Mobile Home / Other | 0 | 0.0% |
| Total | 1,923 | 100.0% |
Housing Structures by Occupancy in Bradley Beach borough
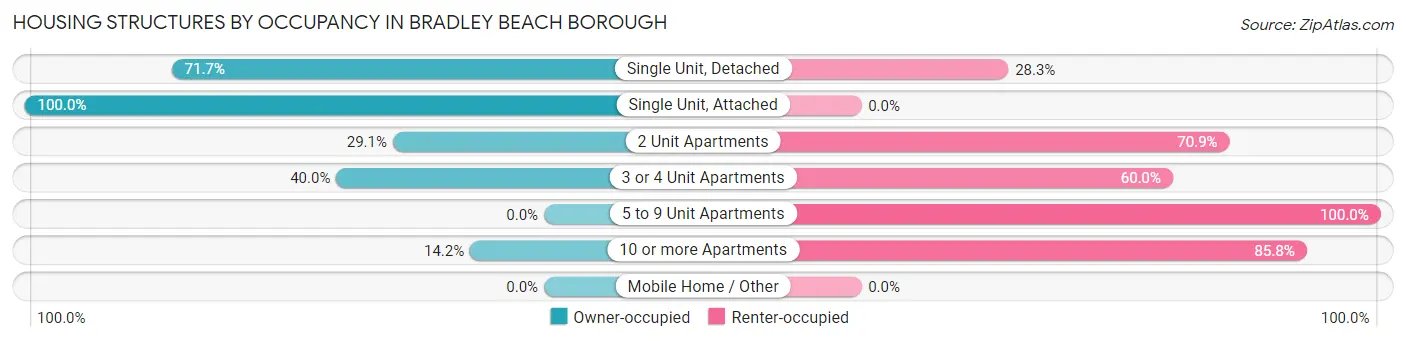
| Structure Type | Owner-occupied | Renter-occupied |
| Single Unit, Detached | 671 (71.7%) | 265 (28.3%) |
| Single Unit, Attached | 21 (100.0%) | 0 (0.0%) |
| 2 Unit Apartments | 85 (29.1%) | 207 (70.9%) |
| 3 or 4 Unit Apartments | 34 (40.0%) | 51 (60.0%) |
| 5 to 9 Unit Apartments | 0 (0.0%) | 118 (100.0%) |
| 10 or more Apartments | 67 (14.2%) | 404 (85.8%) |
| Mobile Home / Other | 0 (0.0%) | 0 (0.0%) |
| Total | 878 (45.7%) | 1,045 (54.3%) |
Housing Structures by Number of Rooms in Bradley Beach borough
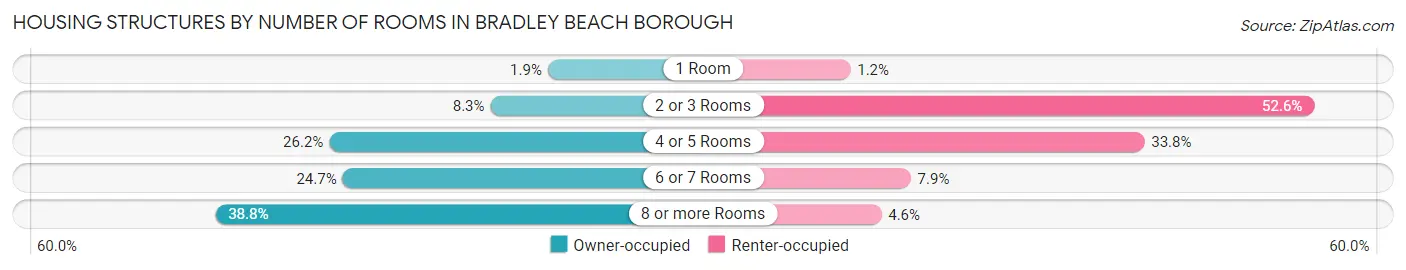
| Number of Rooms | Owner-occupied | Renter-occupied |
| 1 Room | 17 (1.9%) | 12 (1.1%) |
| 2 or 3 Rooms | 73 (8.3%) | 550 (52.6%) |
| 4 or 5 Rooms | 230 (26.2%) | 353 (33.8%) |
| 6 or 7 Rooms | 217 (24.7%) | 82 (7.9%) |
| 8 or more Rooms | 341 (38.8%) | 48 (4.6%) |
| Total | 878 (100.0%) | 1,045 (100.0%) |
Housing Structure by Heating Type in Bradley Beach borough
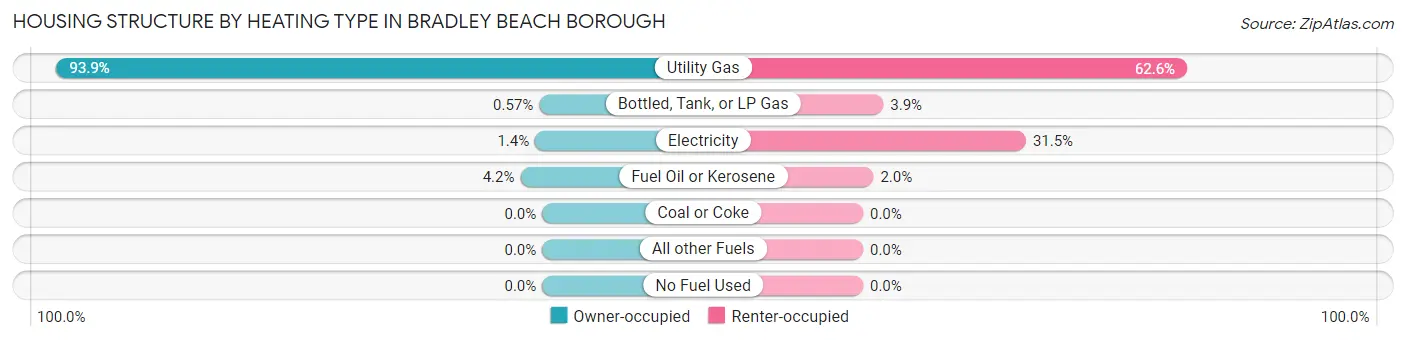
| Heating Type | Owner-occupied | Renter-occupied |
| Utility Gas | 824 (93.9%) | 654 (62.6%) |
| Bottled, Tank, or LP Gas | 5 (0.6%) | 41 (3.9%) |
| Electricity | 12 (1.4%) | 329 (31.5%) |
| Fuel Oil or Kerosene | 37 (4.2%) | 21 (2.0%) |
| Coal or Coke | 0 (0.0%) | 0 (0.0%) |
| All other Fuels | 0 (0.0%) | 0 (0.0%) |
| No Fuel Used | 0 (0.0%) | 0 (0.0%) |
| Total | 878 (100.0%) | 1,045 (100.0%) |
Household Vehicle Usage in Bradley Beach borough
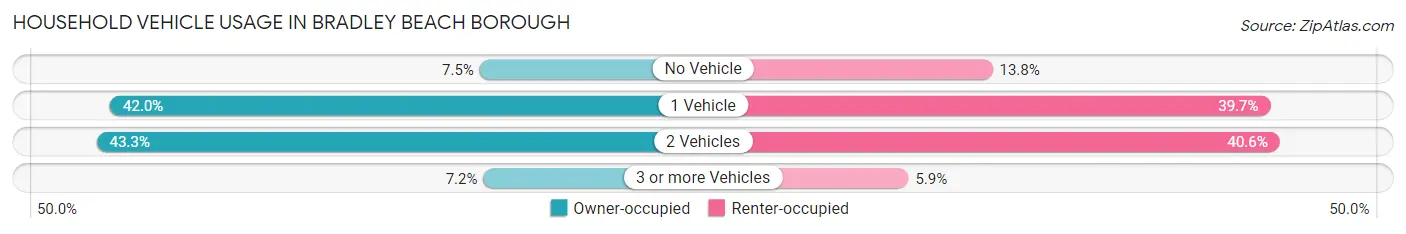
| Vehicles per Household | Owner-occupied | Renter-occupied |
| No Vehicle | 66 (7.5%) | 144 (13.8%) |
| 1 Vehicle | 369 (42.0%) | 415 (39.7%) |
| 2 Vehicles | 380 (43.3%) | 424 (40.6%) |
| 3 or more Vehicles | 63 (7.2%) | 62 (5.9%) |
| Total | 878 (100.0%) | 1,045 (100.0%) |
Real Estate & Mortgages in Bradley Beach borough
Real Estate and Mortgage Overview in Bradley Beach borough
| Characteristic | Without Mortgage | With Mortgage |
| Housing Units | 562 | 316 |
| Median Property Value | $822,600 | $878,200 |
| Median Household Income | $121,184 | $99 |
| Monthly Housing Costs | $1,193 | $168 |
| Real Estate Taxes | $10,001 | $1 |
Property Value by Mortgage Status in Bradley Beach borough
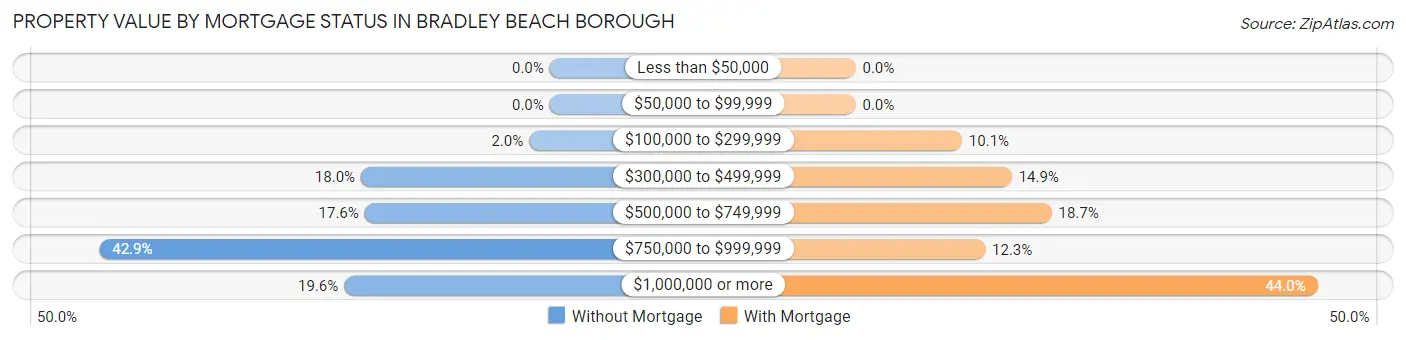
| Property Value | Without Mortgage | With Mortgage |
| Less than $50,000 | 0 (0.0%) | 0 (0.0%) |
| $50,000 to $99,999 | 0 (0.0%) | 0 (0.0%) |
| $100,000 to $299,999 | 11 (2.0%) | 32 (10.1%) |
| $300,000 to $499,999 | 101 (18.0%) | 47 (14.9%) |
| $500,000 to $749,999 | 99 (17.6%) | 59 (18.7%) |
| $750,000 to $999,999 | 241 (42.9%) | 39 (12.3%) |
| $1,000,000 or more | 110 (19.6%) | 139 (44.0%) |
| Total | 562 (100.0%) | 316 (100.0%) |
Household Income by Mortgage Status in Bradley Beach borough
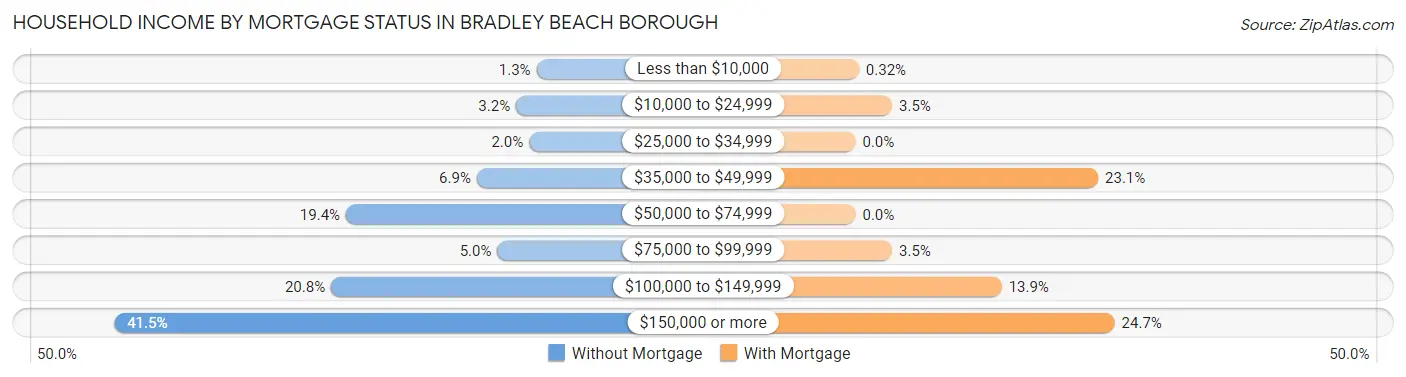
| Household Income | Without Mortgage | With Mortgage |
| Less than $10,000 | 7 (1.3%) | 1 (0.3%) |
| $10,000 to $24,999 | 18 (3.2%) | 11 (3.5%) |
| $25,000 to $34,999 | 11 (2.0%) | 0 (0.0%) |
| $35,000 to $49,999 | 39 (6.9%) | 73 (23.1%) |
| $50,000 to $74,999 | 109 (19.4%) | 0 (0.0%) |
| $75,000 to $99,999 | 28 (5.0%) | 11 (3.5%) |
| $100,000 to $149,999 | 117 (20.8%) | 44 (13.9%) |
| $150,000 or more | 233 (41.5%) | 78 (24.7%) |
| Total | 562 (100.0%) | 316 (100.0%) |
Property Value to Household Income Ratio in Bradley Beach borough
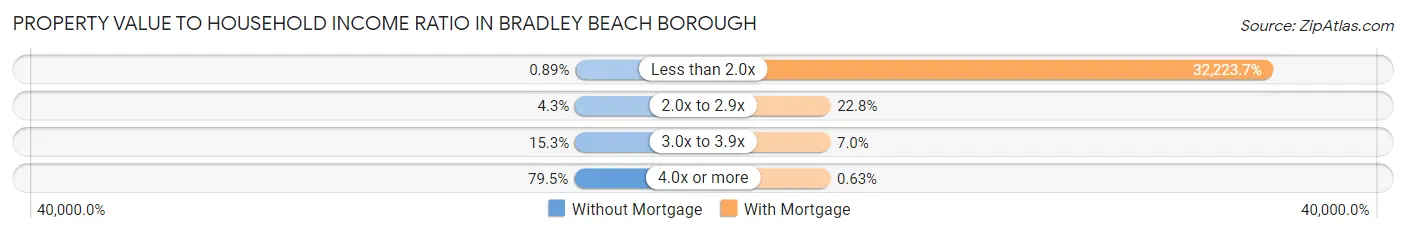
| Value-to-Income Ratio | Without Mortgage | With Mortgage |
| Less than 2.0x | 5 (0.9%) | 101,827 (32,223.7%) |
| 2.0x to 2.9x | 24 (4.3%) | 72 (22.8%) |
| 3.0x to 3.9x | 86 (15.3%) | 22 (7.0%) |
| 4.0x or more | 447 (79.5%) | 2 (0.6%) |
| Total | 562 (100.0%) | 316 (100.0%) |
Real Estate Taxes by Mortgage Status in Bradley Beach borough
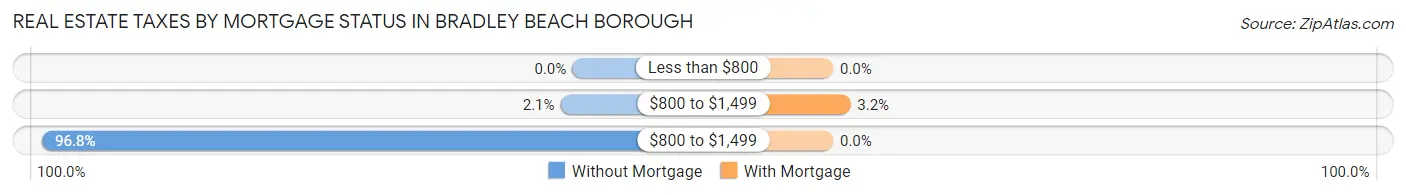
| Property Taxes | Without Mortgage | With Mortgage |
| Less than $800 | 0 (0.0%) | 0 (0.0%) |
| $800 to $1,499 | 12 (2.1%) | 10 (3.2%) |
| $800 to $1,499 | 544 (96.8%) | 0 (0.0%) |
| Total | 562 (100.0%) | 316 (100.0%) |
Health & Disability in Bradley Beach borough
Health Insurance Coverage by Age in Bradley Beach borough
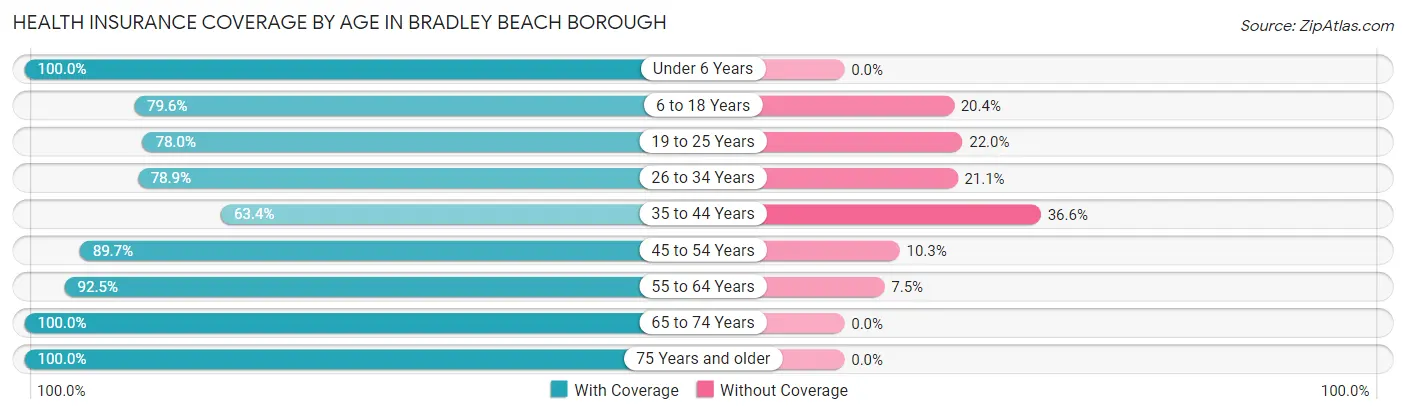
| Age Bracket | With Coverage | Without Coverage |
| Under 6 Years | 42 (100.0%) | 0 (0.0%) |
| 6 to 18 Years | 499 (79.6%) | 128 (20.4%) |
| 19 to 25 Years | 156 (78.0%) | 44 (22.0%) |
| 26 to 34 Years | 778 (78.9%) | 208 (21.1%) |
| 35 to 44 Years | 218 (63.4%) | 126 (36.6%) |
| 45 to 54 Years | 357 (89.7%) | 41 (10.3%) |
| 55 to 64 Years | 570 (92.5%) | 46 (7.5%) |
| 65 to 74 Years | 497 (100.0%) | 0 (0.0%) |
| 75 Years and older | 441 (100.0%) | 0 (0.0%) |
| Total | 3,558 (85.7%) | 593 (14.3%) |
Health Insurance Coverage by Citizenship Status in Bradley Beach borough
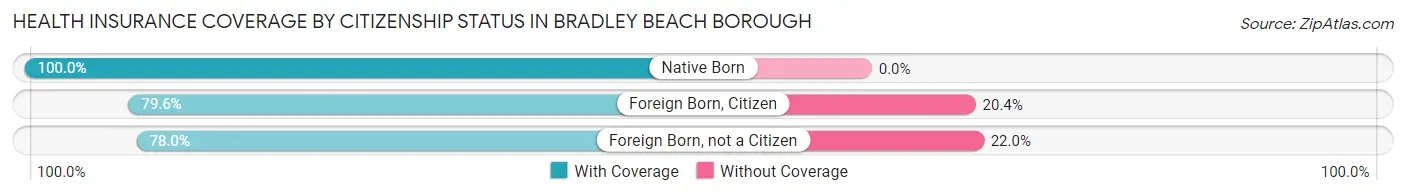
| Citizenship Status | With Coverage | Without Coverage |
| Native Born | 42 (100.0%) | 0 (0.0%) |
| Foreign Born, Citizen | 499 (79.6%) | 128 (20.4%) |
| Foreign Born, not a Citizen | 156 (78.0%) | 44 (22.0%) |
Health Insurance Coverage by Household Income in Bradley Beach borough
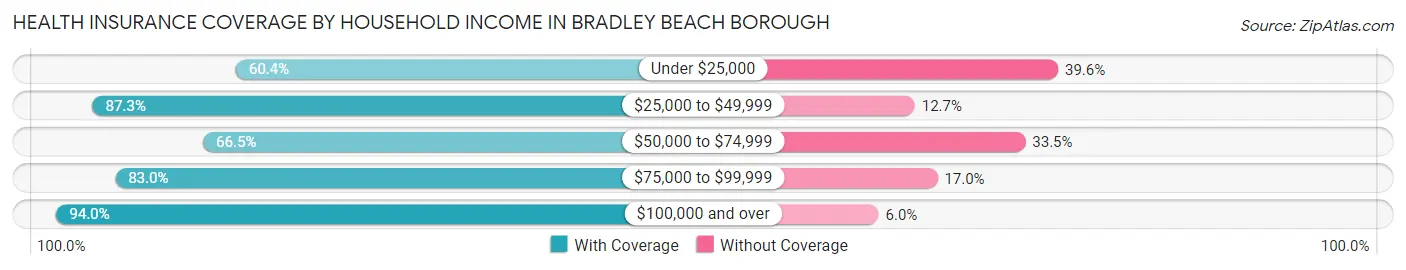
| Household Income | With Coverage | Without Coverage |
| Under $25,000 | 174 (60.4%) | 114 (39.6%) |
| $25,000 to $49,999 | 548 (87.3%) | 80 (12.7%) |
| $50,000 to $74,999 | 346 (66.5%) | 174 (33.5%) |
| $75,000 to $99,999 | 479 (83.0%) | 98 (17.0%) |
| $100,000 and over | 2,004 (94.0%) | 127 (6.0%) |
Public vs Private Health Insurance Coverage by Age in Bradley Beach borough
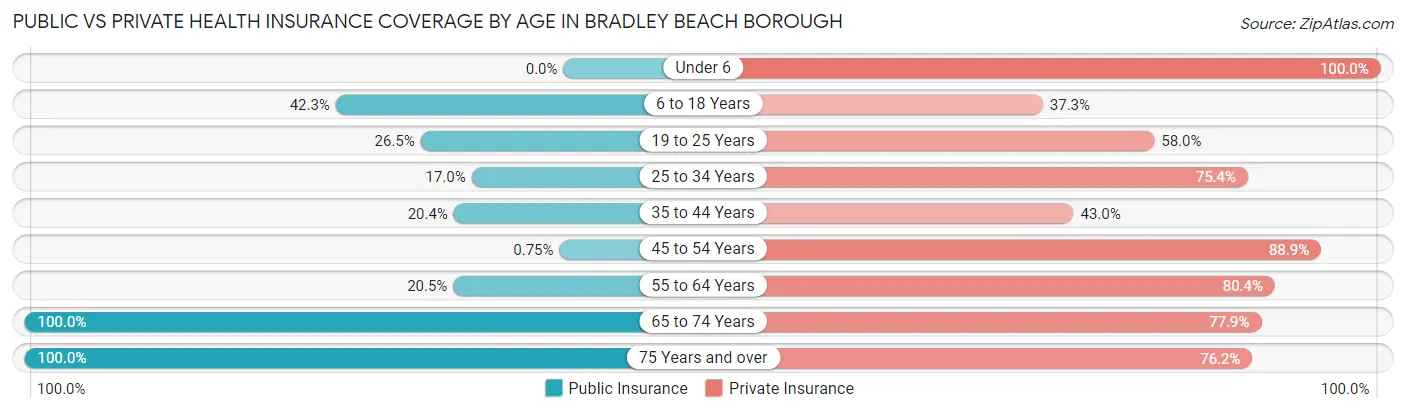
| Age Bracket | Public Insurance | Private Insurance |
| Under 6 | 0 (0.0%) | 42 (100.0%) |
| 6 to 18 Years | 265 (42.3%) | 234 (37.3%) |
| 19 to 25 Years | 53 (26.5%) | 116 (58.0%) |
| 25 to 34 Years | 168 (17.0%) | 743 (75.3%) |
| 35 to 44 Years | 70 (20.3%) | 148 (43.0%) |
| 45 to 54 Years | 3 (0.7%) | 354 (88.9%) |
| 55 to 64 Years | 126 (20.4%) | 495 (80.4%) |
| 65 to 74 Years | 497 (100.0%) | 387 (77.9%) |
| 75 Years and over | 441 (100.0%) | 336 (76.2%) |
| Total | 1,623 (39.1%) | 2,855 (68.8%) |
Disability Status by Sex by Age in Bradley Beach borough
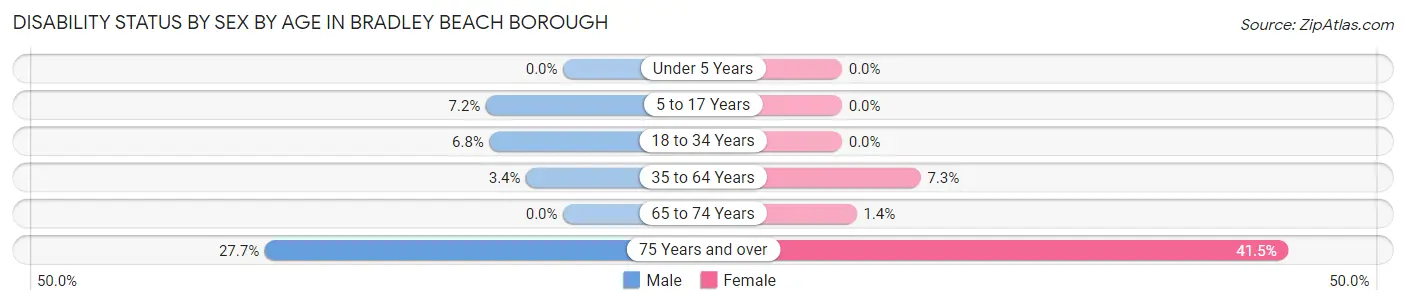
| Age Bracket | Male | Female |
| Under 5 Years | 0 (0.0%) | 0 (0.0%) |
| 5 to 17 Years | 31 (7.2%) | 0 (0.0%) |
| 18 to 34 Years | 51 (6.8%) | 0 (0.0%) |
| 35 to 64 Years | 25 (3.4%) | 46 (7.3%) |
| 65 to 74 Years | 0 (0.0%) | 4 (1.4%) |
| 75 Years and over | 54 (27.7%) | 102 (41.5%) |
Disability Class by Sex by Age in Bradley Beach borough
Disability Class: Hearing Difficulty
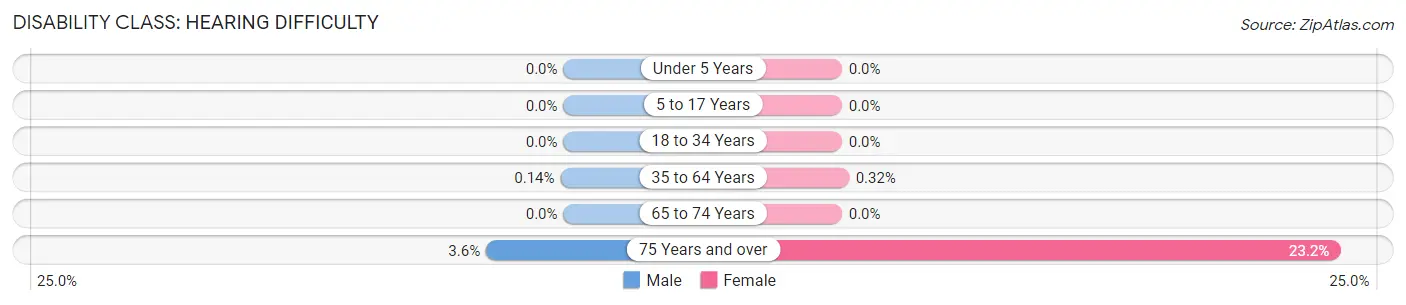
| Age Bracket | Male | Female |
| Under 5 Years | 0 (0.0%) | 0 (0.0%) |
| 5 to 17 Years | 0 (0.0%) | 0 (0.0%) |
| 18 to 34 Years | 0 (0.0%) | 0 (0.0%) |
| 35 to 64 Years | 1 (0.1%) | 2 (0.3%) |
| 65 to 74 Years | 0 (0.0%) | 0 (0.0%) |
| 75 Years and over | 7 (3.6%) | 57 (23.2%) |
Disability Class: Vision Difficulty
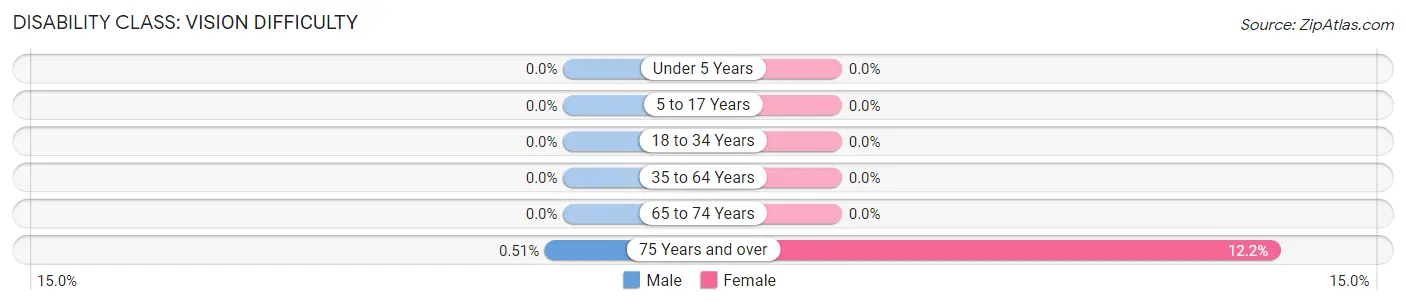
| Age Bracket | Male | Female |
| Under 5 Years | 0 (0.0%) | 0 (0.0%) |
| 5 to 17 Years | 0 (0.0%) | 0 (0.0%) |
| 18 to 34 Years | 0 (0.0%) | 0 (0.0%) |
| 35 to 64 Years | 0 (0.0%) | 0 (0.0%) |
| 65 to 74 Years | 0 (0.0%) | 0 (0.0%) |
| 75 Years and over | 1 (0.5%) | 30 (12.2%) |
Disability Class: Cognitive Difficulty
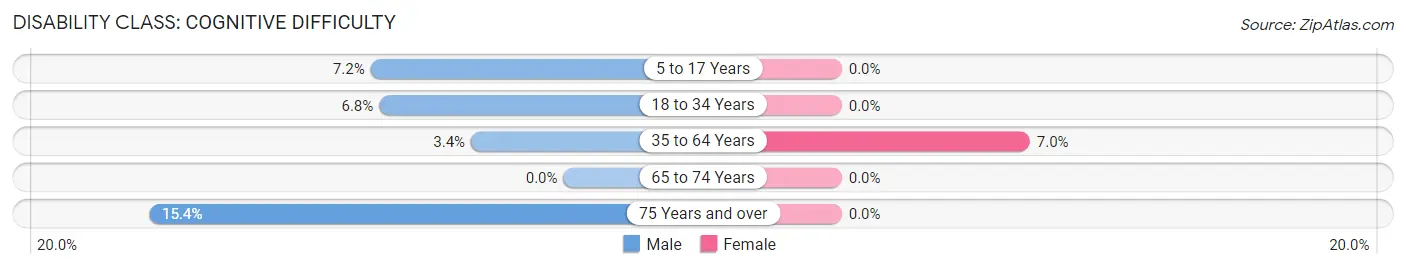
| Age Bracket | Male | Female |
| 5 to 17 Years | 31 (7.2%) | 0 (0.0%) |
| 18 to 34 Years | 51 (6.8%) | 0 (0.0%) |
| 35 to 64 Years | 25 (3.4%) | 44 (7.0%) |
| 65 to 74 Years | 0 (0.0%) | 0 (0.0%) |
| 75 Years and over | 30 (15.4%) | 0 (0.0%) |
Disability Class: Ambulatory Difficulty
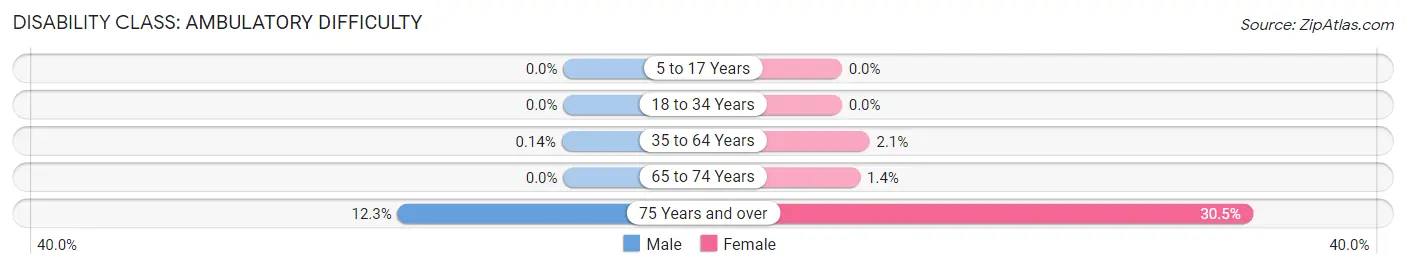
| Age Bracket | Male | Female |
| 5 to 17 Years | 0 (0.0%) | 0 (0.0%) |
| 18 to 34 Years | 0 (0.0%) | 0 (0.0%) |
| 35 to 64 Years | 1 (0.1%) | 13 (2.1%) |
| 65 to 74 Years | 0 (0.0%) | 4 (1.4%) |
| 75 Years and over | 24 (12.3%) | 75 (30.5%) |
Disability Class: Self-Care Difficulty
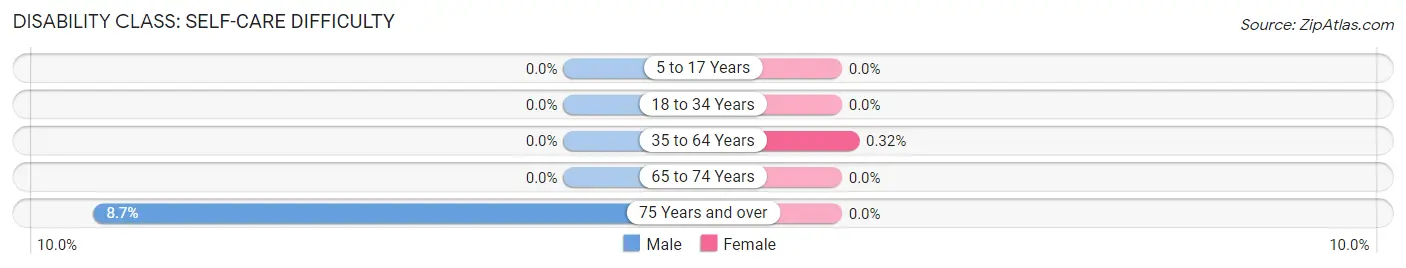
| Age Bracket | Male | Female |
| 5 to 17 Years | 0 (0.0%) | 0 (0.0%) |
| 18 to 34 Years | 0 (0.0%) | 0 (0.0%) |
| 35 to 64 Years | 0 (0.0%) | 2 (0.3%) |
| 65 to 74 Years | 0 (0.0%) | 0 (0.0%) |
| 75 Years and over | 17 (8.7%) | 0 (0.0%) |
Technology Access in Bradley Beach borough
Computing Device Access in Bradley Beach borough
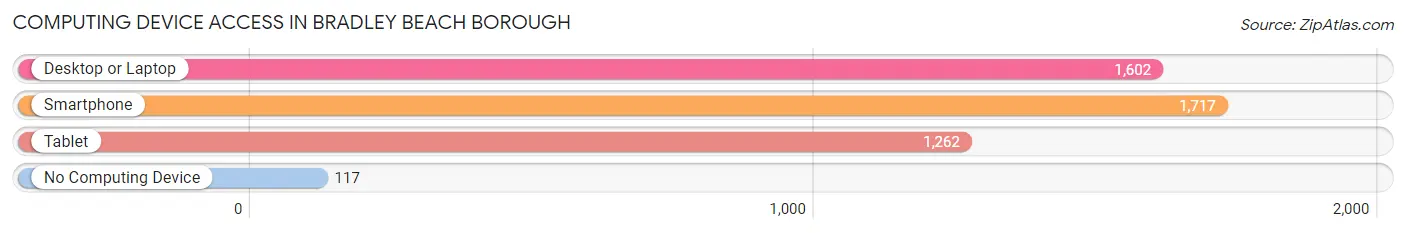
| Device Type | # Households | % Households |
| Desktop or Laptop | 1,602 | 83.3% |
| Smartphone | 1,717 | 89.3% |
| Tablet | 1,262 | 65.6% |
| No Computing Device | 117 | 6.1% |
| Total | 1,923 | 100.0% |
Internet Access in Bradley Beach borough
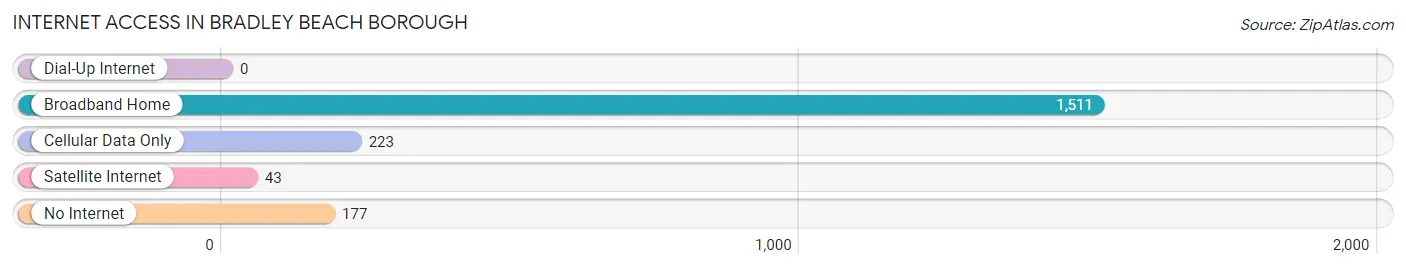
| Internet Type | # Households | % Households |
| Dial-Up Internet | 0 | 0.0% |
| Broadband Home | 1,511 | 78.6% |
| Cellular Data Only | 223 | 11.6% |
| Satellite Internet | 43 | 2.2% |
| No Internet | 177 | 9.2% |
| Total | 1,923 | 100.0% |
Bradley Beach borough Summary
Bradley Beach Borough is a small borough located in Monmouth County, New Jersey. It is situated on the Atlantic Ocean, just south of Asbury Park. The borough was incorporated in 1893 and is home to approximately 4,000 people.
History
The area that is now Bradley Beach was originally inhabited by the Lenape Native Americans. The first European settlers arrived in the area in the late 1600s. The area was originally known as Ocean Park, and was part of Ocean Township. In 1893, the area was incorporated as the Borough of Bradley Beach, named after James A. Bradley, the developer of the area.
In the early 1900s, Bradley Beach became a popular summer destination for people from New York City and Philadelphia. The town was known for its boardwalk, amusement park, and beach. The boardwalk was destroyed by a hurricane in 1944, but was rebuilt in the 1950s.
Geography
Bradley Beach is located in Monmouth County, New Jersey, on the Atlantic Ocean. It is bordered by Neptune Township to the north, Avon-by-the-Sea to the south, and Ocean Township to the west. The borough covers an area of 1.2 square miles, and is home to approximately 4,000 people.
The borough is located on the Atlantic Coastal Plain, and is characterized by flat terrain. The borough is located on a barrier island, and is surrounded by the Atlantic Ocean to the east and the Shark River to the west.
Economy
The economy of Bradley Beach is largely based on tourism. The borough is a popular summer destination, and is home to a number of hotels, restaurants, and other tourist attractions. The borough also has a number of small businesses, including retail stores, restaurants, and professional services.
Demographics
As of the 2010 census, Bradley Beach had a population of 4,298. The racial makeup of the borough was 94.3% White, 2.2% African American, 0.3% Native American, 0.9% Asian, 0.1% Pacific Islander, and 1.2% from other races. Hispanic or Latino of any race were 4.2% of the population.
The median household income in Bradley Beach was $62,813, and the median family income was $76,944. The per capita income was $31,945. About 4.3% of families and 6.2% of the population were below the poverty line, including 8.2% of those under age 18 and 4.2% of those age 65 or over.
Common Questions
What is the Total Population of Bradley Beach borough?
Total Population of Bradley Beach borough is 4,268.
What is the Total Male Population of Bradley Beach borough?
Total Male Population of Bradley Beach borough is 2,319.
What is the Total Female Population of Bradley Beach borough?
Total Female Population of Bradley Beach borough is 1,949.
What is the Ratio of Males per 100 Females in Bradley Beach borough?
There are 118.98 Males per 100 Females in Bradley Beach borough.
What is the Ratio of Females per 100 Males in Bradley Beach borough?
There are 84.04 Females per 100 Males in Bradley Beach borough.
What is the Median Population Age in Bradley Beach borough?
Median Population Age in Bradley Beach borough is 41.3 Years.
What is the Average Family Size in Bradley Beach borough
Average Family Size in Bradley Beach borough is 2.9 People.
What is the Average Household Size in Bradley Beach borough
Average Household Size in Bradley Beach borough is 2.1 People.
What is Per Capita Income in Bradley Beach borough?
Per Capita income in Bradley Beach borough is $53,872.
What is the Median Family Income in Bradley Beach borough?
Median Family Income in Bradley Beach borough is $101,635.
What is the Median Household income in Bradley Beach borough?
Median Household Income in Bradley Beach borough is $89,967.
What is Income or Wage Gap in Bradley Beach borough?
Income or Wage Gap in Bradley Beach borough is 6.8%.
Women in Bradley Beach borough earn 93.2 cents for every dollar earned by a man.
What is Inequality or Gini Index in Bradley Beach borough?
Inequality or Gini Index in Bradley Beach borough is 0.47.
How Large is the Labor Force in Bradley Beach borough?
There are 2,289 People in the Labor Forcein in Bradley Beach borough.
What is the Percentage of People in the Labor Force in Bradley Beach borough?
61.1% of People are in the Labor Force in Bradley Beach borough.
What is the Unemployment Rate in Bradley Beach borough?
Unemployment Rate in Bradley Beach borough is 3.4%.