Brielle borough, NJ
Brielle borough Overview
4,957
TOTAL POPULATION
2,273
MALE POPULATION
2,684
FEMALE POPULATION
84.69
MALES / 100 FEMALES
118.08
FEMALES / 100 MALES
46.7
MEDIAN AGE
3.4
AVG FAMILY SIZE
2.7
AVG HOUSEHOLD SIZE
$81,236
PER CAPITA INCOME
$169,676
AVG FAMILY INCOME
$160,845
AVG HOUSEHOLD INCOME
65.5%
WAGE / INCOME GAP [ % ]
34.5¢/ $1
WAGE / INCOME GAP [ $ ]
0.46
INEQUALITY / GINI INDEX
2,605
LABOR FORCE [ PEOPLE ]
68.0%
PERCENT IN LABOR FORCE
6.1%
UNEMPLOYMENT RATE
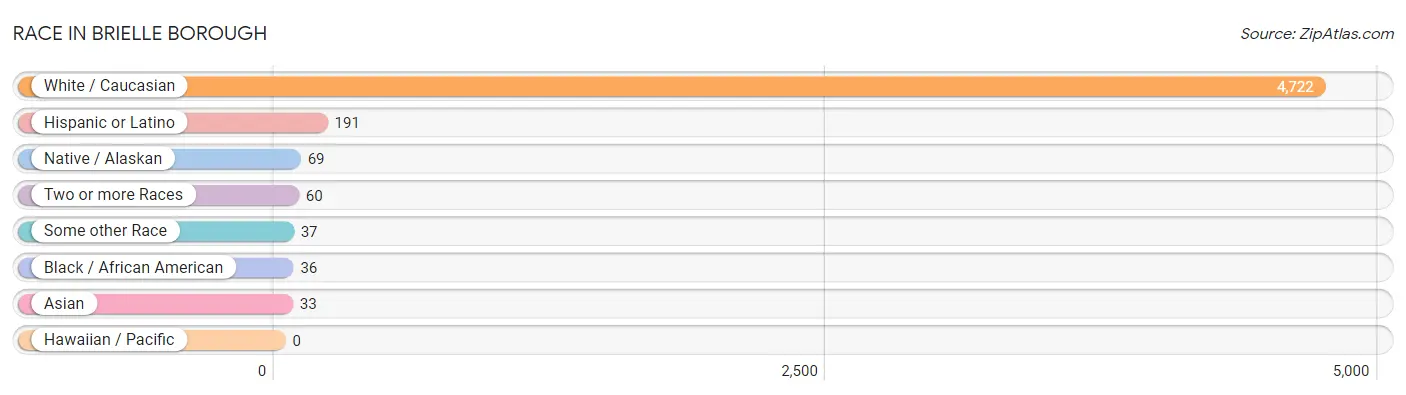
Race in Brielle borough
The most populous races in Brielle borough are White / Caucasian (4,722 | 95.3%), Hispanic or Latino (191 | 3.8%), and Native / Alaskan (69 | 1.4%).
| Race | # Population | % Population |
| Asian | 33 | 0.7% |
| Black / African American | 36 | 0.7% |
| Hawaiian / Pacific | 0 | 0.0% |
| Hispanic or Latino | 191 | 3.8% |
| Native / Alaskan | 69 | 1.4% |
| White / Caucasian | 4,722 | 95.3% |
| Two or more Races | 60 | 1.2% |
| Some other Race | 37 | 0.7% |
| Total | 4,957 | 100.0% |
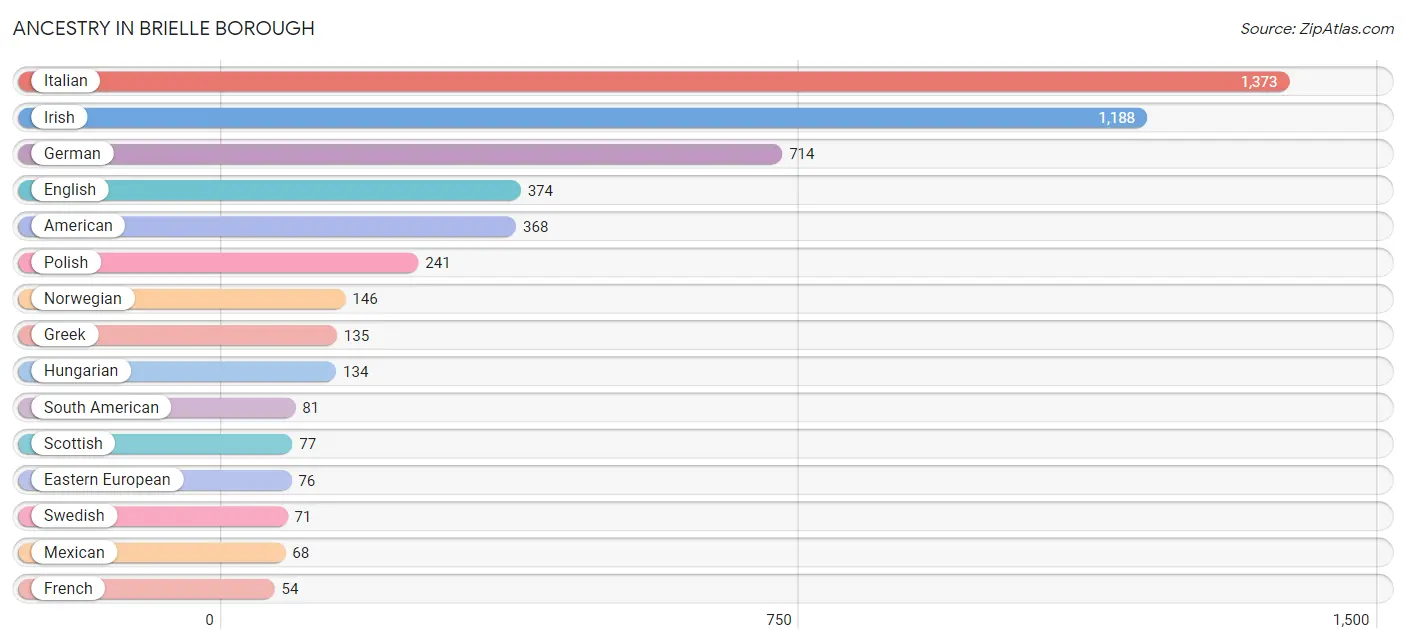
Ancestry in Brielle borough
The most populous ancestries reported in Brielle borough are Italian (1,373 | 27.7%), Irish (1,188 | 24.0%), German (714 | 14.4%), English (374 | 7.5%), and American (368 | 7.4%), together accounting for 81.0% of all Brielle borough residents.
| Ancestry | # Population | % Population |
| American | 368 | 7.4% |
| Arab | 14 | 0.3% |
| Armenian | 9 | 0.2% |
| Austrian | 8 | 0.2% |
| Canadian | 19 | 0.4% |
| Creek | 12 | 0.2% |
| Croatian | 19 | 0.4% |
| Cuban | 13 | 0.3% |
| Czech | 6 | 0.1% |
| Danish | 8 | 0.2% |
| Dutch | 50 | 1.0% |
| Eastern European | 76 | 1.5% |
| Ecuadorian | 34 | 0.7% |
| English | 374 | 7.5% |
| European | 22 | 0.4% |
| French | 54 | 1.1% |
| French Canadian | 26 | 0.5% |
| German | 714 | 14.4% |
| Greek | 135 | 2.7% |
| Hungarian | 134 | 2.7% |
| Indian (Asian) | 33 | 0.7% |
| Iranian | 10 | 0.2% |
| Irish | 1,188 | 24.0% |
| Italian | 1,373 | 27.7% |
| Lithuanian | 31 | 0.6% |
| Mexican | 68 | 1.4% |
| Northern European | 23 | 0.5% |
| Norwegian | 146 | 2.9% |
| Peruvian | 47 | 0.9% |
| Polish | 241 | 4.9% |
| Portuguese | 40 | 0.8% |
| Puerto Rican | 12 | 0.2% |
| Russian | 31 | 0.6% |
| Scotch-Irish | 17 | 0.3% |
| Scottish | 77 | 1.5% |
| Slovak | 9 | 0.2% |
| South American | 81 | 1.6% |
| South American Indian | 35 | 0.7% |
| Spaniard | 17 | 0.3% |
| Swedish | 71 | 1.4% |
| Swiss | 29 | 0.6% |
| Syrian | 14 | 0.3% | View All 42 Rows |
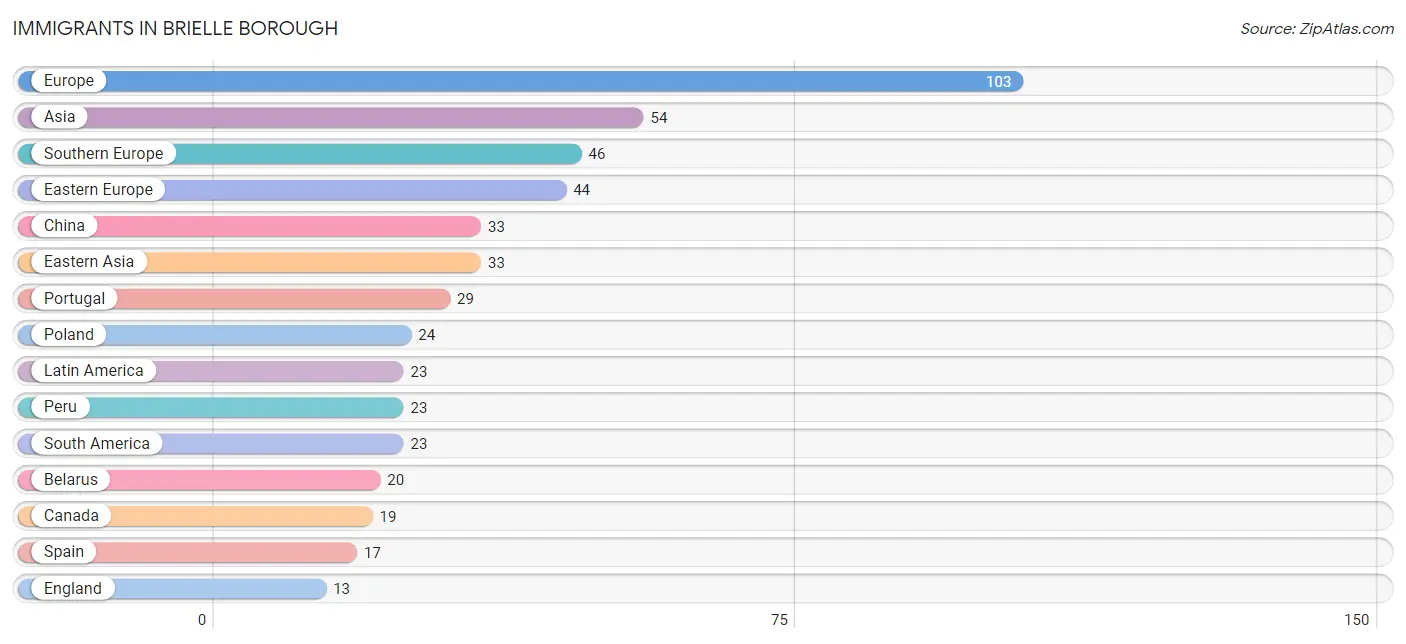
Immigrants in Brielle borough
The most numerous immigrant groups reported in Brielle borough came from Europe (103 | 2.1%), Asia (54 | 1.1%), Southern Europe (46 | 0.9%), Eastern Europe (44 | 0.9%), and China (33 | 0.7%), together accounting for 5.7% of all Brielle borough residents.
| Immigration Origin | # Population | % Population |
| Asia | 54 | 1.1% |
| Belarus | 20 | 0.4% |
| Canada | 19 | 0.4% |
| China | 33 | 0.7% |
| Eastern Asia | 33 | 0.7% |
| Eastern Europe | 44 | 0.9% |
| England | 13 | 0.3% |
| Europe | 103 | 2.1% |
| Iran | 10 | 0.2% |
| Latin America | 23 | 0.5% |
| Northern Europe | 13 | 0.3% |
| Peru | 23 | 0.5% |
| Poland | 24 | 0.5% |
| Portugal | 29 | 0.6% |
| South America | 23 | 0.5% |
| South Central Asia | 10 | 0.2% |
| Southern Europe | 46 | 0.9% |
| Spain | 17 | 0.3% |
| Turkey | 11 | 0.2% |
| Western Asia | 11 | 0.2% | View All 20 Rows |
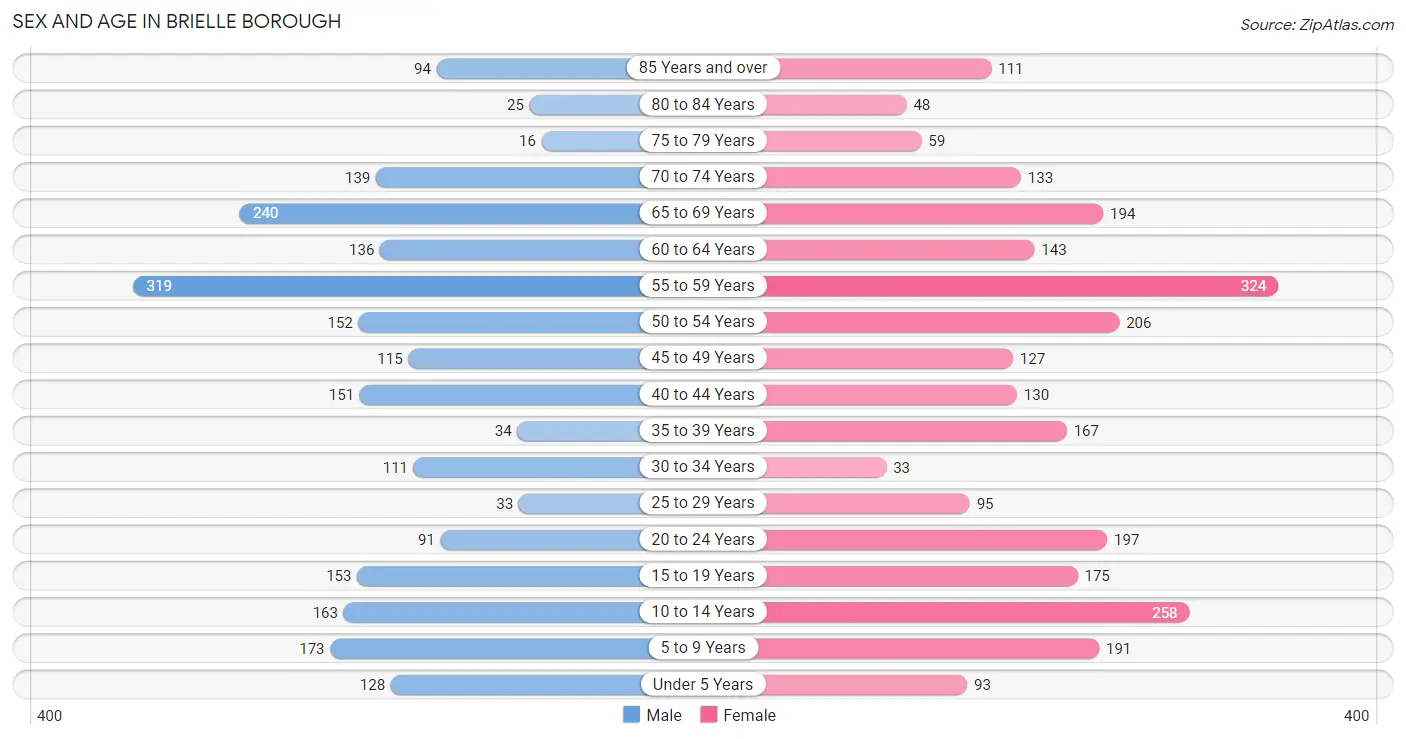
Sex and Age in Brielle borough
Sex and Age in Brielle borough
The most populous age groups in Brielle borough are 55 to 59 Years (319 | 14.0%) for men and 55 to 59 Years (324 | 12.1%) for women.
| Age Bracket | Male | Female |
| Under 5 Years | 128 (5.6%) | 93 (3.5%) |
| 5 to 9 Years | 173 (7.6%) | 191 (7.1%) |
| 10 to 14 Years | 163 (7.2%) | 258 (9.6%) |
| 15 to 19 Years | 153 (6.7%) | 175 (6.5%) |
| 20 to 24 Years | 91 (4.0%) | 197 (7.3%) |
| 25 to 29 Years | 33 (1.5%) | 95 (3.5%) |
| 30 to 34 Years | 111 (4.9%) | 33 (1.2%) |
| 35 to 39 Years | 34 (1.5%) | 167 (6.2%) |
| 40 to 44 Years | 151 (6.6%) | 130 (4.8%) |
| 45 to 49 Years | 115 (5.1%) | 127 (4.7%) |
| 50 to 54 Years | 152 (6.7%) | 206 (7.7%) |
| 55 to 59 Years | 319 (14.0%) | 324 (12.1%) |
| 60 to 64 Years | 136 (6.0%) | 143 (5.3%) |
| 65 to 69 Years | 240 (10.6%) | 194 (7.2%) |
| 70 to 74 Years | 139 (6.1%) | 133 (5.0%) |
| 75 to 79 Years | 16 (0.7%) | 59 (2.2%) |
| 80 to 84 Years | 25 (1.1%) | 48 (1.8%) |
| 85 Years and over | 94 (4.1%) | 111 (4.1%) |
| Total | 2,273 (100.0%) | 2,684 (100.0%) |
Families and Households in Brielle borough
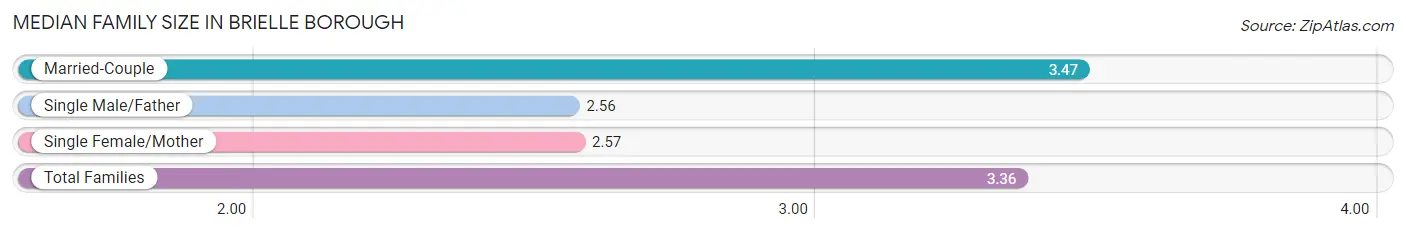
Median Family Size in Brielle borough
The median family size in Brielle borough is 3.36 persons per family, with married-couple families (1,136 | 87.7%) accounting for the largest median family size of 3.47 persons per family. On the other hand, single male/father families (52 | 4.0%) represent the smallest median family size with 2.56 persons per family.
| Family Type | # Families | Family Size |
| Married-Couple | 1,136 (87.7%) | 3.47 |
| Single Male/Father | 52 (4.0%) | 2.56 |
| Single Female/Mother | 107 (8.3%) | 2.57 |
| Total Families | 1,295 (100.0%) | 3.36 |
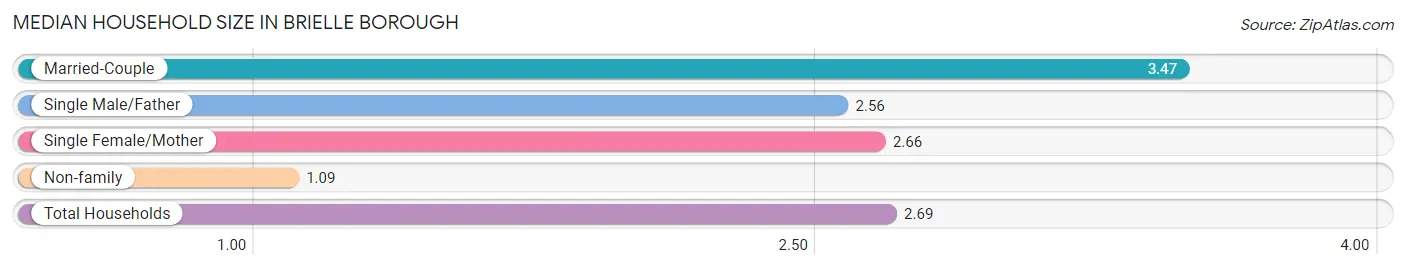
Median Household Size in Brielle borough
The median household size in Brielle borough is 2.69 persons per household, with married-couple households (1,136 | 61.5%) accounting for the largest median household size of 3.47 persons per household. non-family households (551 | 29.8%) represent the smallest median household size with 1.09 persons per household.
| Household Type | # Households | Household Size |
| Married-Couple | 1,136 (61.5%) | 3.47 |
| Single Male/Father | 52 (2.8%) | 2.56 |
| Single Female/Mother | 107 (5.8%) | 2.66 |
| Non-family | 551 (29.8%) | 1.09 |
| Total Households | 1,846 (100.0%) | 2.69 |
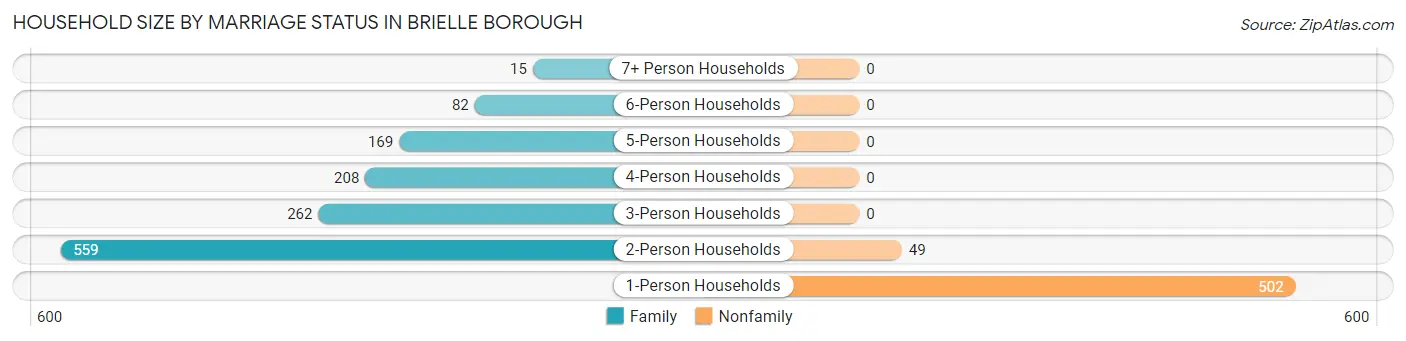
Household Size by Marriage Status in Brielle borough
Out of a total of 1,846 households in Brielle borough, 1,295 (70.2%) are family households, while 551 (29.8%) are nonfamily households. The most numerous type of family households are 2-person households, comprising 559, and the most common type of nonfamily households are 1-person households, comprising 502.
| Household Size | Family Households | Nonfamily Households |
| 1-Person Households | - | 502 (27.2%) |
| 2-Person Households | 559 (30.3%) | 49 (2.6%) |
| 3-Person Households | 262 (14.2%) | 0 (0.0%) |
| 4-Person Households | 208 (11.3%) | 0 (0.0%) |
| 5-Person Households | 169 (9.1%) | 0 (0.0%) |
| 6-Person Households | 82 (4.4%) | 0 (0.0%) |
| 7+ Person Households | 15 (0.8%) | 0 (0.0%) |
| Total | 1,295 (70.2%) | 551 (29.8%) |
Female Fertility in Brielle borough
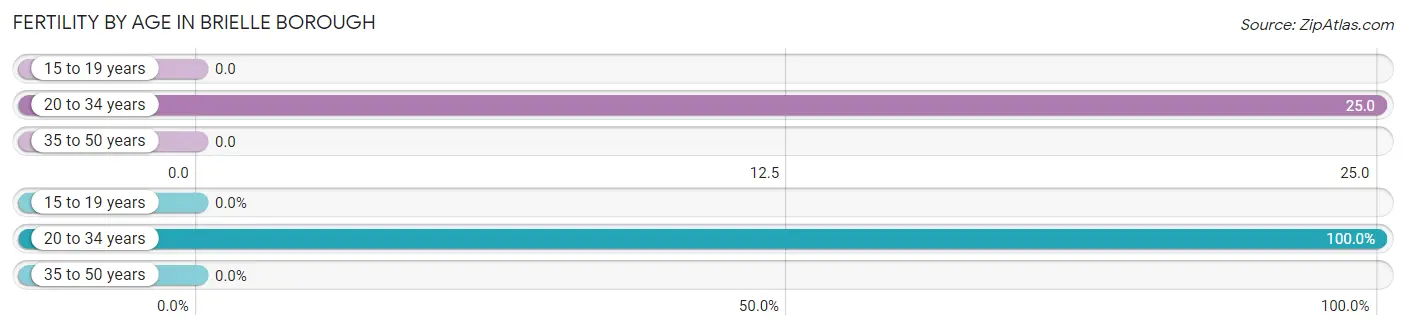
Fertility by Age in Brielle borough
Average fertility rate in Brielle borough is 8.0 births per 1,000 women. Women in the age bracket of 20 to 34 years have the highest fertility rate with 25.0 births per 1,000 women. Women in the age bracket of 20 to 34 years acount for 100.0% of all women with births.
| Age Bracket | Women with Births | Births / 1,000 Women |
| 15 to 19 years | 0 (0.0%) | 0.0 |
| 20 to 34 years | 8 (100.0%) | 25.0 |
| 35 to 50 years | 0 (0.0%) | 0.0 |
| Total | 8 (100.0%) | 8.0 |
Fertility by Age by Marriage Status in Brielle borough
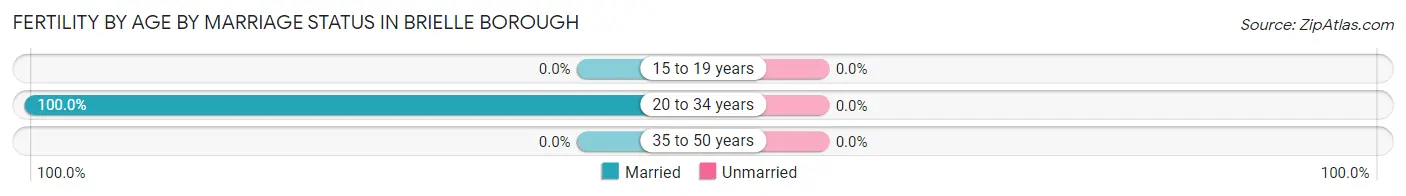
| Age Bracket | Married | Unmarried |
| 15 to 19 years | 0 (0.0%) | 0 (0.0%) |
| 20 to 34 years | 8 (100.0%) | 0 (0.0%) |
| 35 to 50 years | 0 (0.0%) | 0 (0.0%) |
| Total | 8 (100.0%) | 0 (0.0%) |
Fertility by Education in Brielle borough
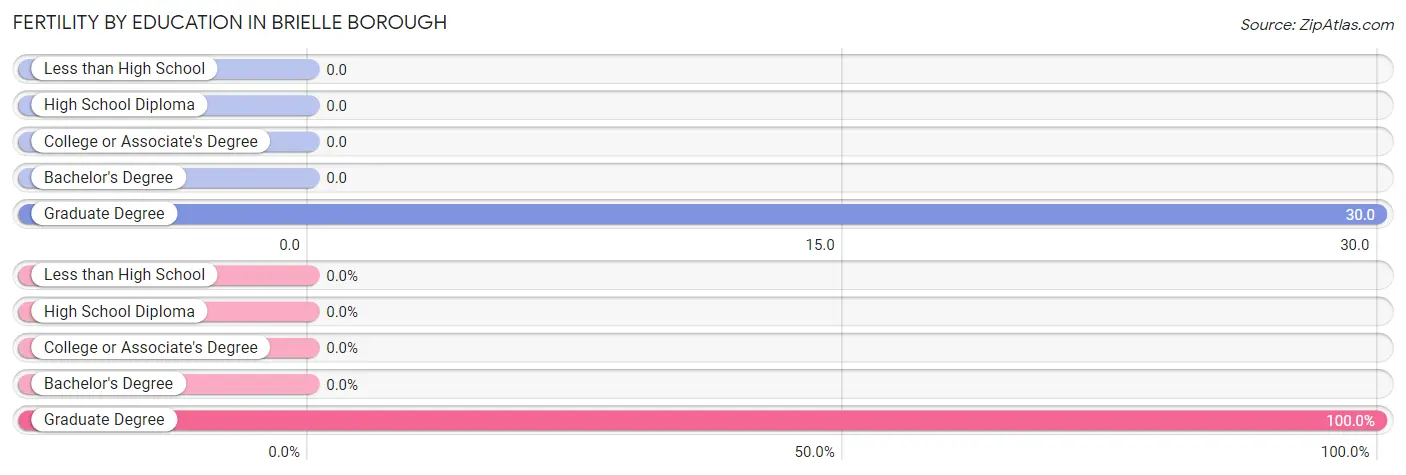
| Educational Attainment | Women with Births | Births / 1,000 Women |
| Less than High School | 0 (0.0%) | 0.0 |
| High School Diploma | 0 (0.0%) | 0.0 |
| College or Associate's Degree | 0 (0.0%) | 0.0 |
| Bachelor's Degree | 0 (0.0%) | 0.0 |
| Graduate Degree | 8 (100.0%) | 30.0 |
| Total | 8 (100.0%) | 8.0 |
Fertility by Education by Marriage Status in Brielle borough
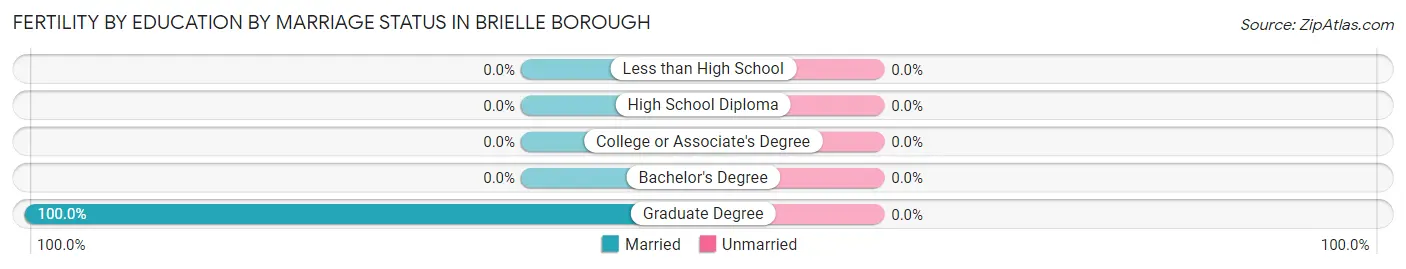
| Educational Attainment | Married | Unmarried |
| Less than High School | 0 (0.0%) | 0 (0.0%) |
| High School Diploma | 0 (0.0%) | 0 (0.0%) |
| College or Associate's Degree | 0 (0.0%) | 0 (0.0%) |
| Bachelor's Degree | 0 (0.0%) | 0 (0.0%) |
| Graduate Degree | 8 (100.0%) | 0 (0.0%) |
| Total | 8 (100.0%) | 0 (0.0%) |
Income in Brielle borough
Income Overview in Brielle borough
Per Capita Income in Brielle borough is $81,236, while median incomes of families and households are $169,676 and $160,845 respectively.
| Characteristic | Number | Measure |
| Per Capita Income | 4,957 | $81,236 |
| Median Family Income | 1,295 | $169,676 |
| Mean Family Income | 1,295 | $225,697 |
| Median Household Income | 1,846 | $160,845 |
| Mean Household Income | 1,846 | $214,917 |
| Income Deficit | 1,295 | $0 |
| Wage / Income Gap (%) | 4,957 | 65.45% |
| Wage / Income Gap ($) | 4,957 | 34.55¢ per $1 |
| Gini / Inequality Index | 4,957 | 0.46 |
Earnings by Sex in Brielle borough
Average Earnings in Brielle borough are $67,470, $99,773 for men and $34,471 for women, a difference of 65.4%.
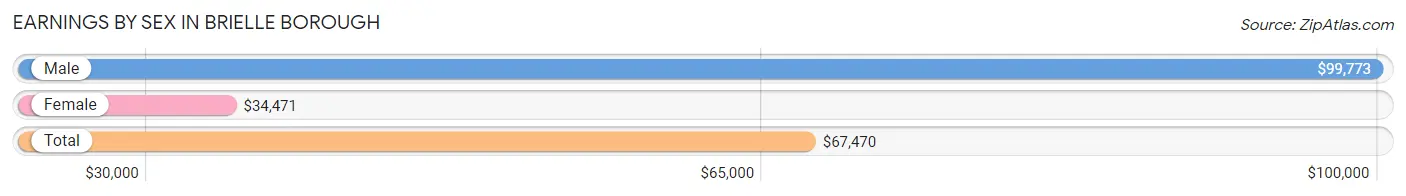
| Sex | Number | Average Earnings |
| Male | 1,392 (48.8%) | $99,773 |
| Female | 1,459 (51.2%) | $34,471 |
| Total | 2,851 (100.0%) | $67,470 |
Earnings by Sex by Income Bracket in Brielle borough
The most common earnings brackets in Brielle borough are $100,000+ for men (694 | 49.9%) and $100,000+ for women (250 | 17.1%).
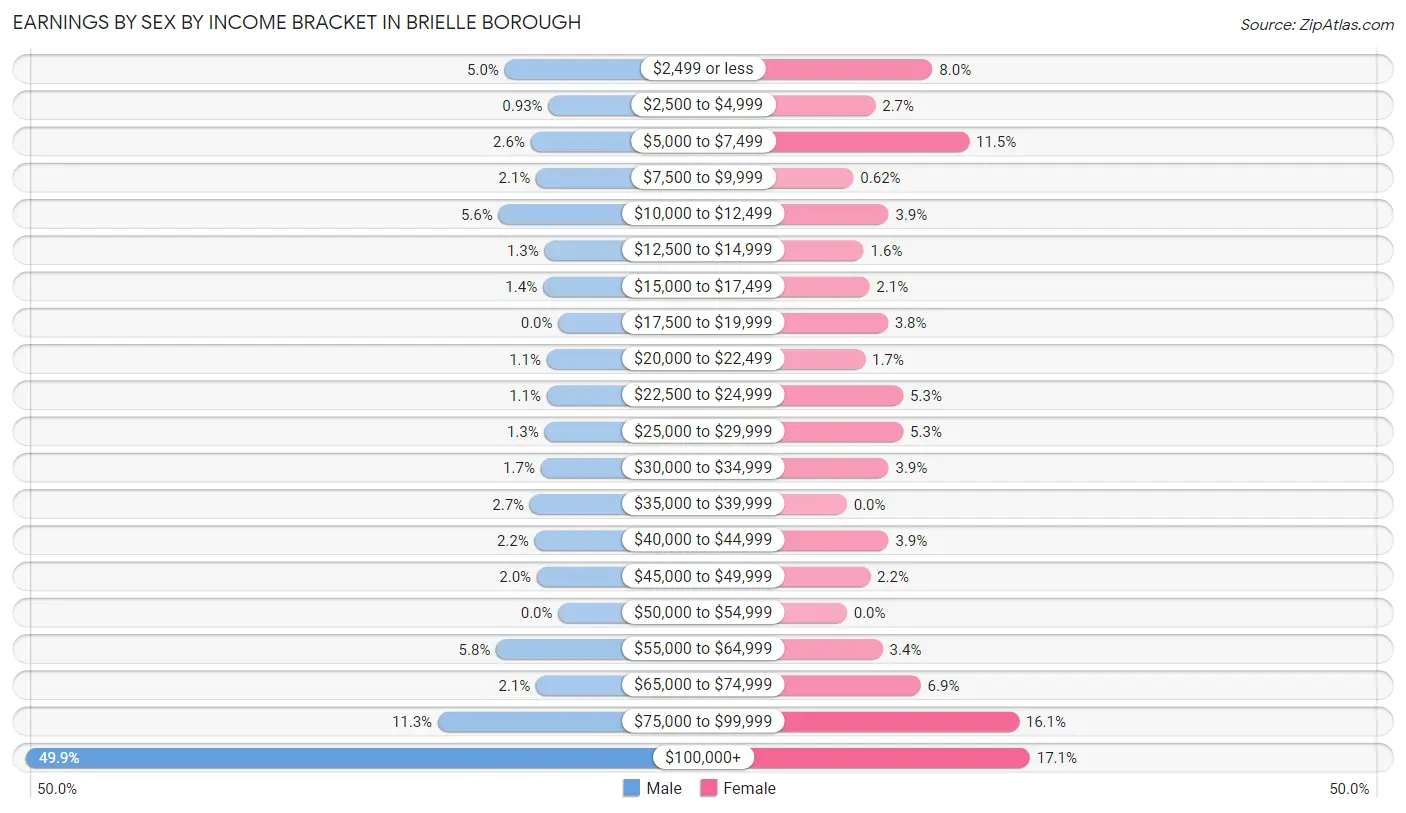
| Income | Male | Female |
| $2,499 or less | 70 (5.0%) | 117 (8.0%) |
| $2,500 to $4,999 | 13 (0.9%) | 39 (2.7%) |
| $5,000 to $7,499 | 36 (2.6%) | 167 (11.5%) |
| $7,500 to $9,999 | 29 (2.1%) | 9 (0.6%) |
| $10,000 to $12,499 | 78 (5.6%) | 57 (3.9%) |
| $12,500 to $14,999 | 18 (1.3%) | 23 (1.6%) |
| $15,000 to $17,499 | 20 (1.4%) | 31 (2.1%) |
| $17,500 to $19,999 | 0 (0.0%) | 56 (3.8%) |
| $20,000 to $22,499 | 15 (1.1%) | 25 (1.7%) |
| $22,500 to $24,999 | 15 (1.1%) | 77 (5.3%) |
| $25,000 to $29,999 | 18 (1.3%) | 77 (5.3%) |
| $30,000 to $34,999 | 23 (1.7%) | 57 (3.9%) |
| $35,000 to $39,999 | 37 (2.7%) | 0 (0.0%) |
| $40,000 to $44,999 | 31 (2.2%) | 57 (3.9%) |
| $45,000 to $49,999 | 28 (2.0%) | 32 (2.2%) |
| $50,000 to $54,999 | 0 (0.0%) | 0 (0.0%) |
| $55,000 to $64,999 | 81 (5.8%) | 49 (3.4%) |
| $65,000 to $74,999 | 29 (2.1%) | 101 (6.9%) |
| $75,000 to $99,999 | 157 (11.3%) | 235 (16.1%) |
| $100,000+ | 694 (49.9%) | 250 (17.1%) |
| Total | 1,392 (100.0%) | 1,459 (100.0%) |
Earnings by Sex by Educational Attainment in Brielle borough
Average earnings in Brielle borough are $113,397 for men and $59,444 for women, a difference of 47.6%. Men with an educational attainment of bachelor's degree enjoy the highest average annual earnings of $174,000, while those with high school diploma education earn the least with $98,750. Women with an educational attainment of graduate degree earn the most with the average annual earnings of $94,276, while those with college or associate's degree education have the smallest earnings of $24,295.
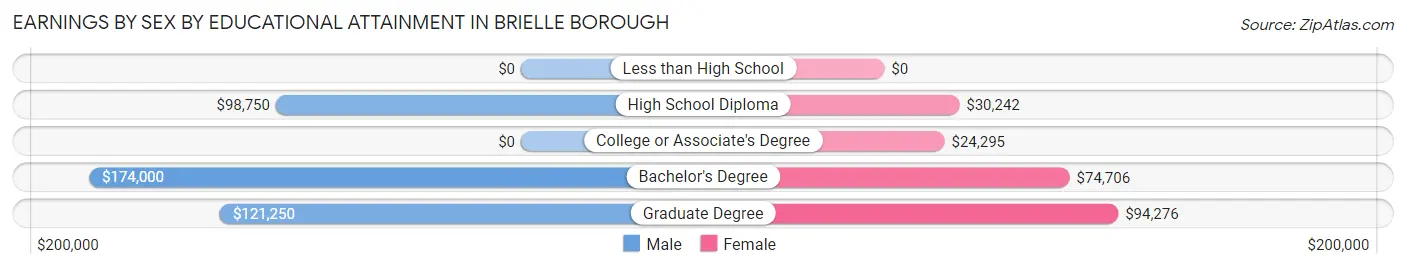
| Educational Attainment | Male Income | Female Income |
| Less than High School | - | - |
| High School Diploma | $98,750 | $30,242 |
| College or Associate's Degree | - | - |
| Bachelor's Degree | $174,000 | $74,706 |
| Graduate Degree | $121,250 | $94,276 |
| Total | $113,397 | $59,444 |
Family Income in Brielle borough
Family Income Brackets in Brielle borough
According to the Brielle borough family income data, there are 540 families falling into the $200,000+ income range, which is the most common income bracket and makes up 41.7% of all families.
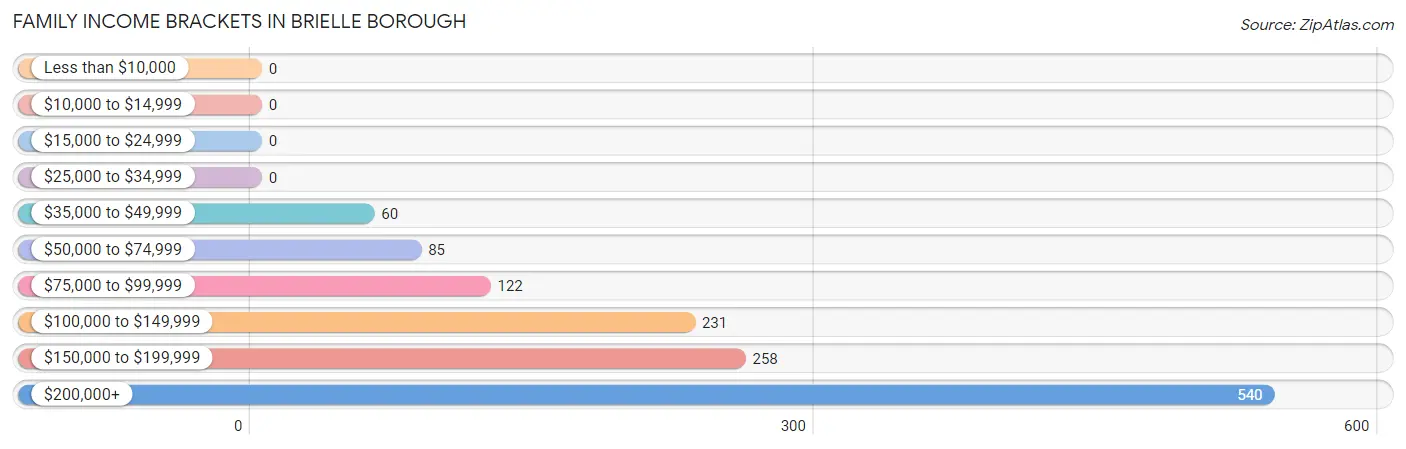
| Income Bracket | # Families | % Families |
| Less than $10,000 | 0 | 0.0% |
| $10,000 to $14,999 | 0 | 0.0% |
| $15,000 to $24,999 | 0 | 0.0% |
| $25,000 to $34,999 | 0 | 0.0% |
| $35,000 to $49,999 | 60 | 4.6% |
| $50,000 to $74,999 | 85 | 6.6% |
| $75,000 to $99,999 | 122 | 9.4% |
| $100,000 to $149,999 | 231 | 17.8% |
| $150,000 to $199,999 | 258 | 19.9% |
| $200,000+ | 540 | 41.7% |
Family Income by Famaliy Size in Brielle borough
4-person families (208 | 16.1%) account for the highest median family income in Brielle borough with $250,001 per family, while 2-person families (568 | 43.9%) have the highest median income of $73,828 per family member.
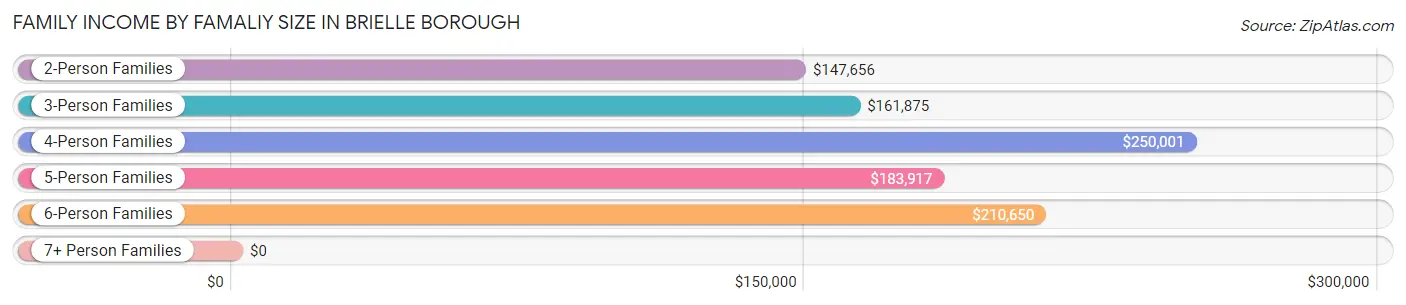
| Income Bracket | # Families | Median Income |
| 2-Person Families | 568 (43.9%) | $147,656 |
| 3-Person Families | 253 (19.5%) | $161,875 |
| 4-Person Families | 208 (16.1%) | $250,001 |
| 5-Person Families | 169 (13.1%) | $183,917 |
| 6-Person Families | 82 (6.3%) | $210,650 |
| 7+ Person Families | 15 (1.2%) | $0 |
| Total | 1,295 (100.0%) | $169,676 |
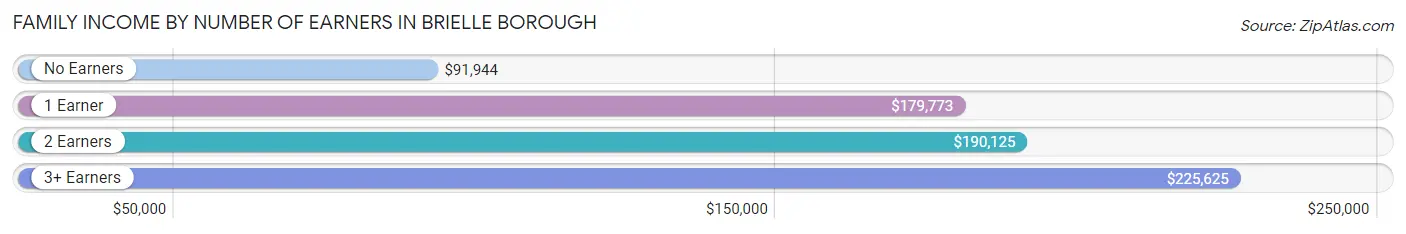
Family Income by Number of Earners in Brielle borough
The median family income in Brielle borough is $169,676, with families comprising 3+ earners (256) having the highest median family income of $225,625, while families with no earners (140) have the lowest median family income of $91,944, accounting for 19.8% and 10.8% of families, respectively.
| Number of Earners | # Families | Median Income |
| No Earners | 140 (10.8%) | $91,944 |
| 1 Earner | 268 (20.7%) | $179,773 |
| 2 Earners | 631 (48.7%) | $190,125 |
| 3+ Earners | 256 (19.8%) | $225,625 |
| Total | 1,295 (100.0%) | $169,676 |
Household Income in Brielle borough
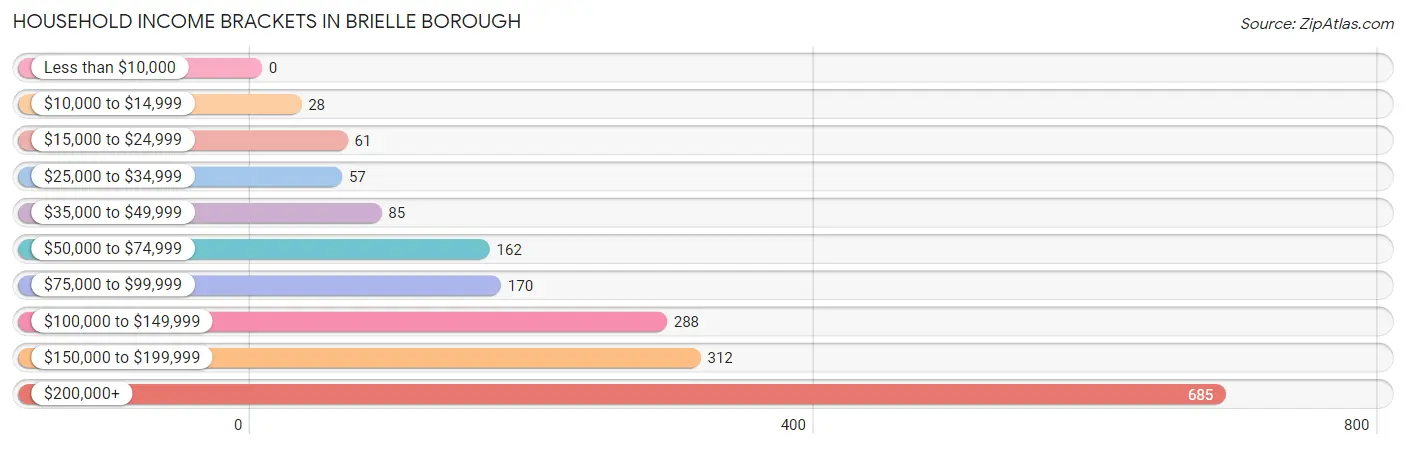
Household Income Brackets in Brielle borough
With 685 households falling in the category, the $200,000+ income range is the most frequent in Brielle borough, accounting for 37.1% of all households.
| Income Bracket | # Households | % Households |
| Less than $10,000 | 0 | 0.0% |
| $10,000 to $14,999 | 28 | 1.5% |
| $15,000 to $24,999 | 61 | 3.3% |
| $25,000 to $34,999 | 57 | 3.1% |
| $35,000 to $49,999 | 85 | 4.6% |
| $50,000 to $74,999 | 162 | 8.8% |
| $75,000 to $99,999 | 170 | 9.2% |
| $100,000 to $149,999 | 288 | 15.6% |
| $150,000 to $199,999 | 312 | 16.9% |
| $200,000+ | 685 | 37.1% |
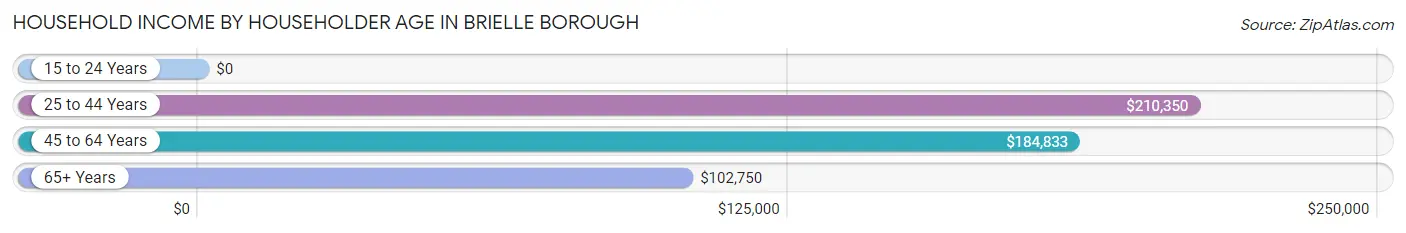
Household Income by Householder Age in Brielle borough
The median household income in Brielle borough is $160,845, with the highest median household income of $210,350 found in the 25 to 44 years age bracket for the primary householder. A total of 330 households (17.9%) fall into this category.
| Income Bracket | # Households | Median Income |
| 15 to 24 Years | 0 (0.0%) | $0 |
| 25 to 44 Years | 330 (17.9%) | $210,350 |
| 45 to 64 Years | 860 (46.6%) | $184,833 |
| 65+ Years | 656 (35.5%) | $102,750 |
| Total | 1,846 (100.0%) | $160,845 |
Poverty in Brielle borough
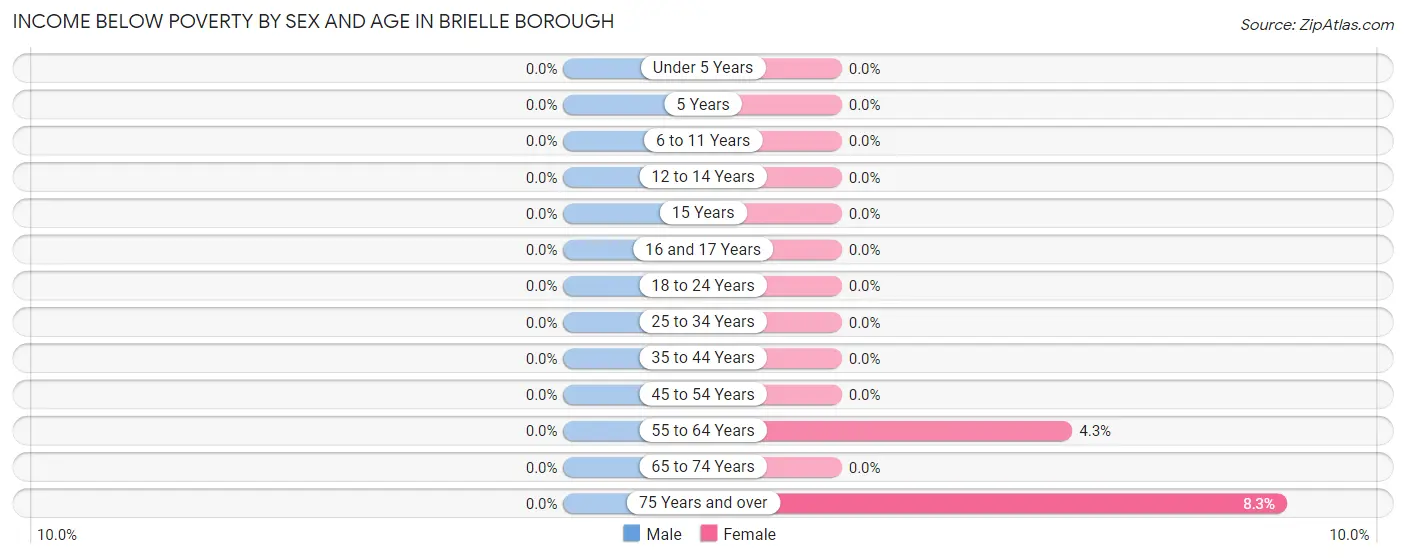
Income Below Poverty by Sex and Age in Brielle borough
| Age Bracket | Male | Female |
| Under 5 Years | 0 (0.0%) | 0 (0.0%) |
| 5 Years | 0 (0.0%) | 0 (0.0%) |
| 6 to 11 Years | 0 (0.0%) | 0 (0.0%) |
| 12 to 14 Years | 0 (0.0%) | 0 (0.0%) |
| 15 Years | 0 (0.0%) | 0 (0.0%) |
| 16 and 17 Years | 0 (0.0%) | 0 (0.0%) |
| 18 to 24 Years | 0 (0.0%) | 0 (0.0%) |
| 25 to 34 Years | 0 (0.0%) | 0 (0.0%) |
| 35 to 44 Years | 0 (0.0%) | 0 (0.0%) |
| 45 to 54 Years | 0 (0.0%) | 0 (0.0%) |
| 55 to 64 Years | 0 (0.0%) | 20 (4.3%) |
| 65 to 74 Years | 0 (0.0%) | 0 (0.0%) |
| 75 Years and over | 0 (0.0%) | 18 (8.3%) |
| Total | 0 (0.0%) | 38 (1.4%) |
Income Above Poverty by Sex and Age in Brielle borough
According to the poverty statistics in Brielle borough, males aged under 5 years and females aged under 5 years are the age groups that are most secure financially, with 100.0% of males and 100.0% of females in these age groups living above the poverty line.
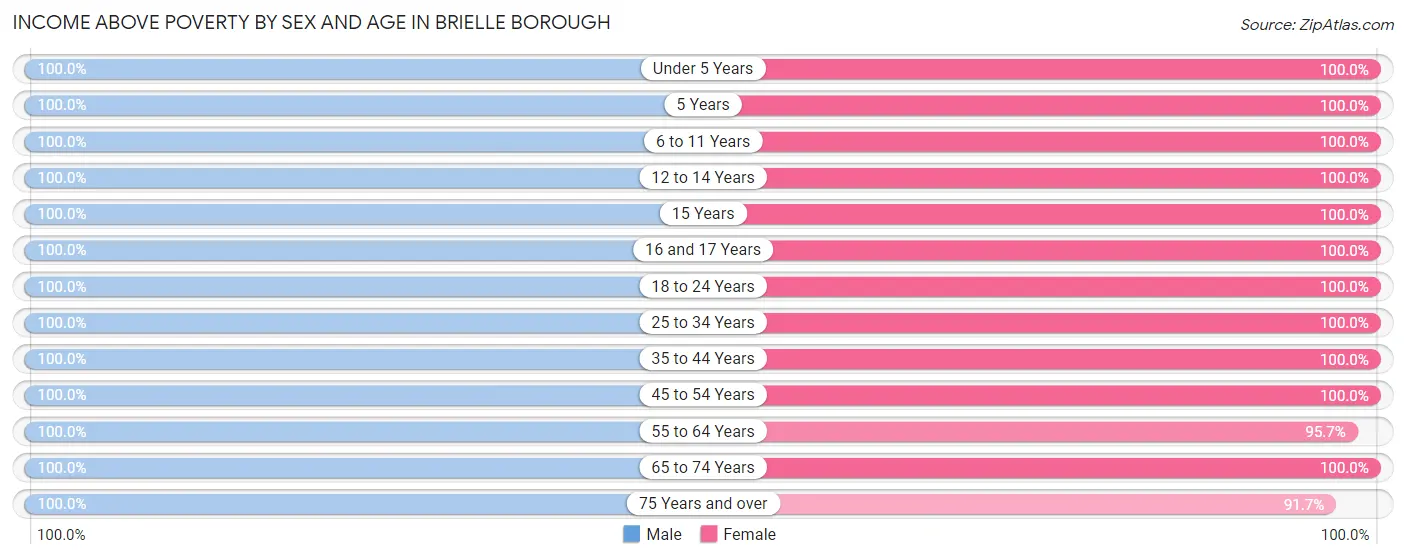
| Age Bracket | Male | Female |
| Under 5 Years | 128 (100.0%) | 93 (100.0%) |
| 5 Years | 81 (100.0%) | 8 (100.0%) |
| 6 to 11 Years | 195 (100.0%) | 289 (100.0%) |
| 12 to 14 Years | 60 (100.0%) | 152 (100.0%) |
| 15 Years | 66 (100.0%) | 54 (100.0%) |
| 16 and 17 Years | 48 (100.0%) | 38 (100.0%) |
| 18 to 24 Years | 130 (100.0%) | 280 (100.0%) |
| 25 to 34 Years | 144 (100.0%) | 128 (100.0%) |
| 35 to 44 Years | 185 (100.0%) | 297 (100.0%) |
| 45 to 54 Years | 267 (100.0%) | 333 (100.0%) |
| 55 to 64 Years | 455 (100.0%) | 447 (95.7%) |
| 65 to 74 Years | 379 (100.0%) | 327 (100.0%) |
| 75 Years and over | 135 (100.0%) | 200 (91.7%) |
| Total | 2,273 (100.0%) | 2,646 (98.6%) |
Income Below Poverty Among Married-Couple Families in Brielle borough
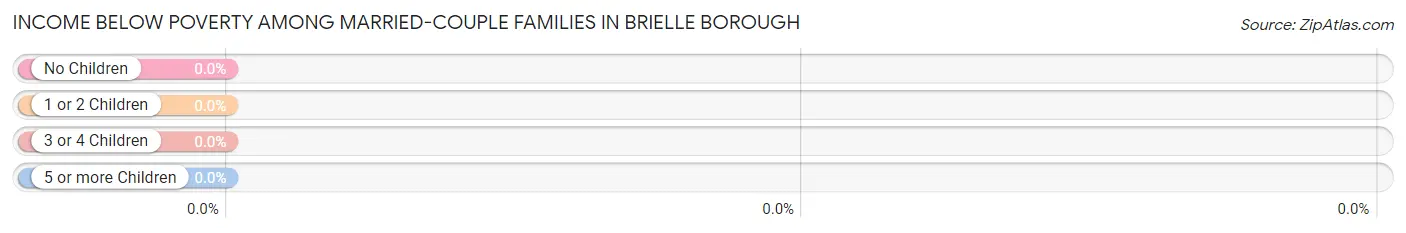
| Children | Above Poverty | Below Poverty |
| No Children | 652 (100.0%) | 0 (0.0%) |
| 1 or 2 Children | 329 (100.0%) | 0 (0.0%) |
| 3 or 4 Children | 140 (100.0%) | 0 (0.0%) |
| 5 or more Children | 15 (100.0%) | 0 (0.0%) |
| Total | 1,136 (100.0%) | 0 (0.0%) |
Income Below Poverty Among Single-Parent Households in Brielle borough
| Children | Single Father | Single Mother |
| No Children | 0 (0.0%) | 0 (0.0%) |
| 1 or 2 Children | 0 (0.0%) | 0 (0.0%) |
| 3 or 4 Children | 0 (0.0%) | 0 (0.0%) |
| 5 or more Children | 0 (0.0%) | 0 (0.0%) |
| Total | 0 (0.0%) | 0 (0.0%) |
Income Below Poverty Among Married-Couple vs Single-Parent Households in Brielle borough
| Children | Married-Couple Families | Single-Parent Households |
| No Children | 0 (0.0%) | 0 (0.0%) |
| 1 or 2 Children | 0 (0.0%) | 0 (0.0%) |
| 3 or 4 Children | 0 (0.0%) | 0 (0.0%) |
| 5 or more Children | 0 (0.0%) | 0 (0.0%) |
| Total | 0 (0.0%) | 0 (0.0%) |
Employment Characteristics in Brielle borough
Employment by Class of Employer in Brielle borough
Among the 2,372 employed individuals in Brielle borough, private company employees (1,255 | 52.9%), local government employees (387 | 16.3%), and not-for-profit organizations (321 | 13.5%) make up the most common classes of employment.
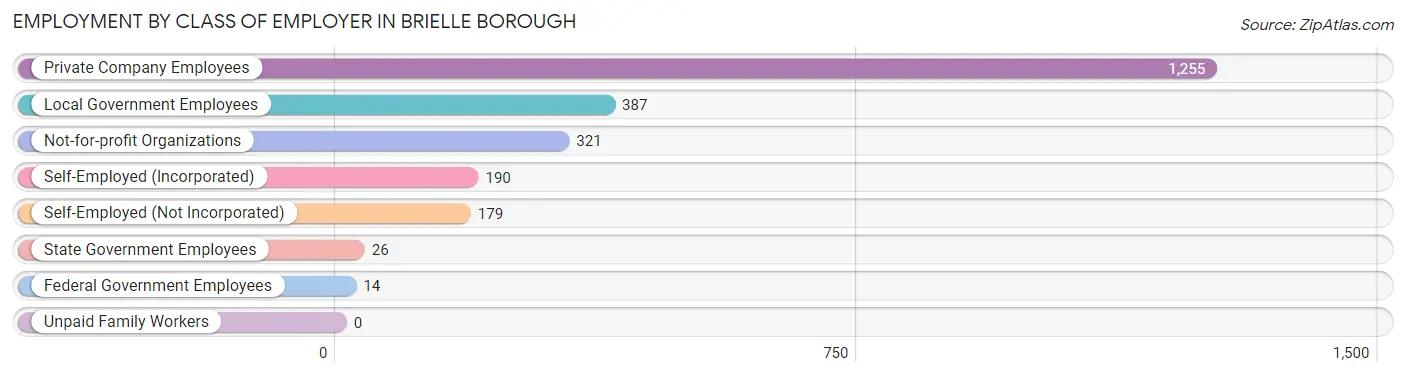
| Employer Class | # Employees | % Employees |
| Private Company Employees | 1,255 | 52.9% |
| Self-Employed (Incorporated) | 190 | 8.0% |
| Self-Employed (Not Incorporated) | 179 | 7.5% |
| Not-for-profit Organizations | 321 | 13.5% |
| Local Government Employees | 387 | 16.3% |
| State Government Employees | 26 | 1.1% |
| Federal Government Employees | 14 | 0.6% |
| Unpaid Family Workers | 0 | 0.0% |
| Total | 2,372 | 100.0% |
Employment Status by Age in Brielle borough
According to the labor force statistics for Brielle borough, out of the total population over 16 years of age (3,831), 68.0% or 2,605 individuals are in the labor force, with 6.1% or 159 of them unemployed. The age group with the highest labor force participation rate is 30 to 34 years, with 100.0% or 144 individuals in the labor force. Within the labor force, the 25 to 29 years age range has the highest percentage of unemployed individuals, with 28.9% or 35 of them being unemployed.
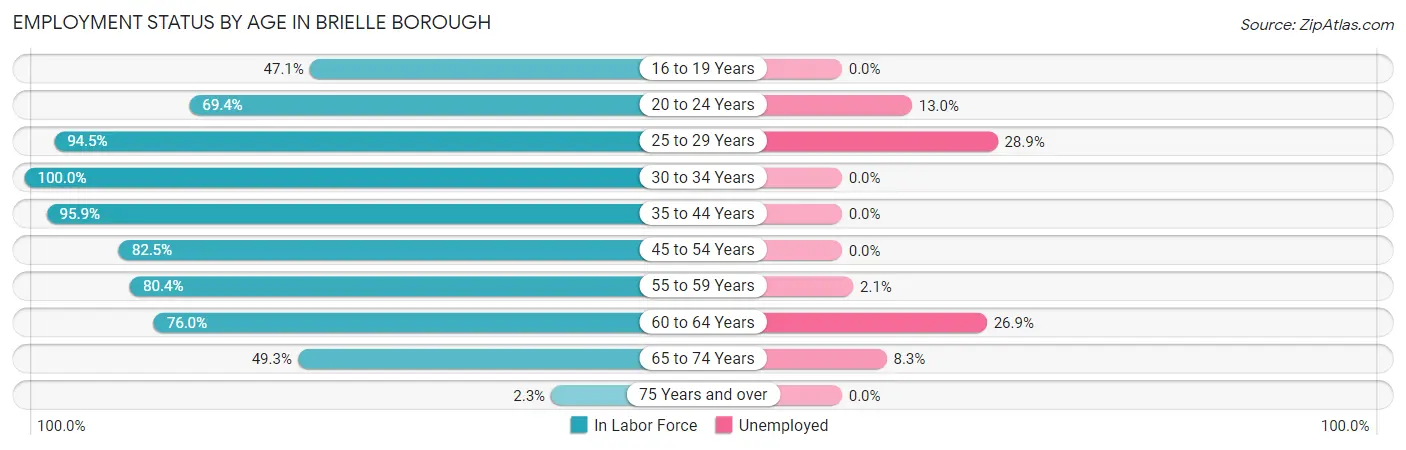
| Age Bracket | In Labor Force | Unemployed |
| 16 to 19 Years | 98 (47.1%) | 0 (0.0%) |
| 20 to 24 Years | 200 (69.4%) | 26 (13.0%) |
| 25 to 29 Years | 121 (94.5%) | 35 (28.9%) |
| 30 to 34 Years | 144 (100.0%) | 0 (0.0%) |
| 35 to 44 Years | 462 (95.9%) | 0 (0.0%) |
| 45 to 54 Years | 495 (82.5%) | 0 (0.0%) |
| 55 to 59 Years | 517 (80.4%) | 11 (2.1%) |
| 60 to 64 Years | 212 (76.0%) | 57 (26.9%) |
| 65 to 74 Years | 348 (49.3%) | 29 (8.3%) |
| 75 Years and over | 8 (2.3%) | 0 (0.0%) |
| Total | 2,605 (68.0%) | 159 (6.1%) |
Employment Status by Educational Attainment in Brielle borough
According to labor force statistics for Brielle borough, 85.7% of individuals (1,951) out of the total population between 25 and 64 years of age (2,276) are in the labor force, with 5.3% or 103 of them being unemployed. The group with the highest labor force participation rate are those with the educational attainment of college / associate degree, with 95.4% or 330 individuals in the labor force. Within the labor force, individuals with high school diploma education have the highest percentage of unemployment, with 19.0% or 37 of them being unemployed.
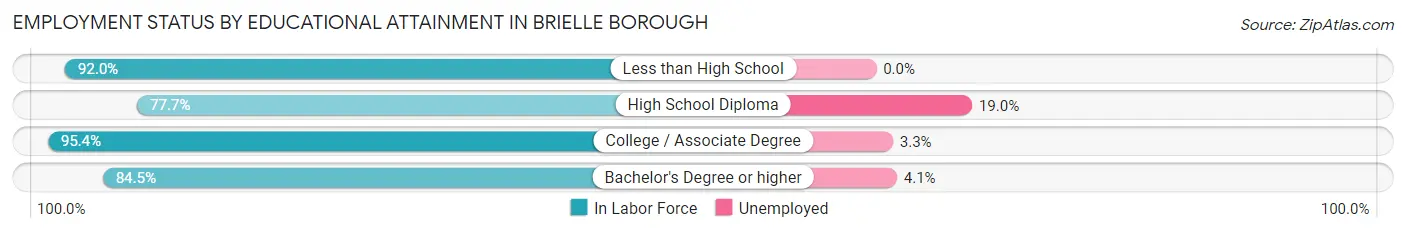
| Educational Attainment | In Labor Force | Unemployed |
| Less than High School | 80 (92.0%) | 0 (0.0%) |
| High School Diploma | 195 (77.7%) | 48 (19.0%) |
| College / Associate Degree | 330 (95.4%) | 11 (3.3%) |
| Bachelor's Degree or higher | 1,345 (84.5%) | 65 (4.1%) |
| Total | 1,951 (85.7%) | 121 (5.3%) |
Employment Occupations by Sex in Brielle borough
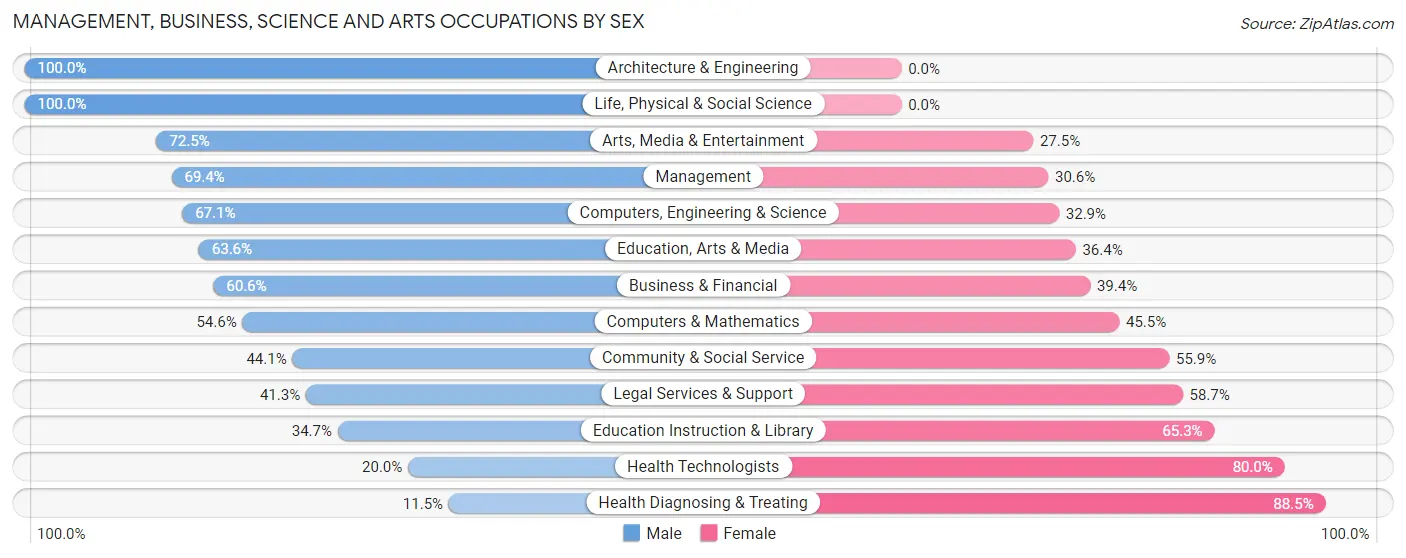
Management, Business, Science and Arts Occupations
The most common Management, Business, Science and Arts occupations in Brielle borough are Community & Social Service (646 | 26.4%), Education Instruction & Library (401 | 16.4%), Management (359 | 14.7%), Business & Financial (264 | 10.8%), and Arts, Media & Entertainment (120 | 4.9%).
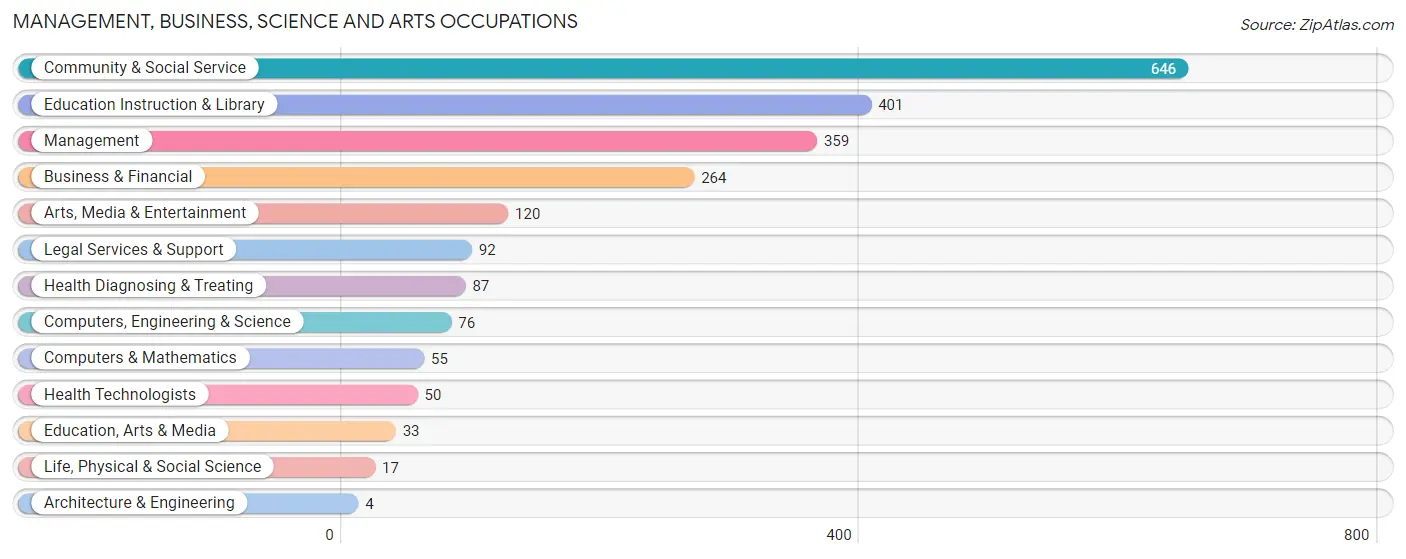
Management, Business, Science and Arts Occupations by Sex
Within the Management, Business, Science and Arts occupations in Brielle borough, the most male-oriented occupations are Architecture & Engineering (100.0%), Life, Physical & Social Science (100.0%), and Arts, Media & Entertainment (72.5%), while the most female-oriented occupations are Health Diagnosing & Treating (88.5%), Health Technologists (80.0%), and Education Instruction & Library (65.3%).
| Occupation | Male | Female |
| Management | 249 (69.4%) | 110 (30.6%) |
| Business & Financial | 160 (60.6%) | 104 (39.4%) |
| Computers, Engineering & Science | 51 (67.1%) | 25 (32.9%) |
| Computers & Mathematics | 30 (54.5%) | 25 (45.5%) |
| Architecture & Engineering | 4 (100.0%) | 0 (0.0%) |
| Life, Physical & Social Science | 17 (100.0%) | 0 (0.0%) |
| Community & Social Service | 285 (44.1%) | 361 (55.9%) |
| Education, Arts & Media | 21 (63.6%) | 12 (36.4%) |
| Legal Services & Support | 38 (41.3%) | 54 (58.7%) |
| Education Instruction & Library | 139 (34.7%) | 262 (65.3%) |
| Arts, Media & Entertainment | 87 (72.5%) | 33 (27.5%) |
| Health Diagnosing & Treating | 10 (11.5%) | 77 (88.5%) |
| Health Technologists | 10 (20.0%) | 40 (80.0%) |
| Total (Category) | 755 (52.7%) | 677 (47.3%) |
| Total (Overall) | 1,210 (49.4%) | 1,237 (50.5%) |
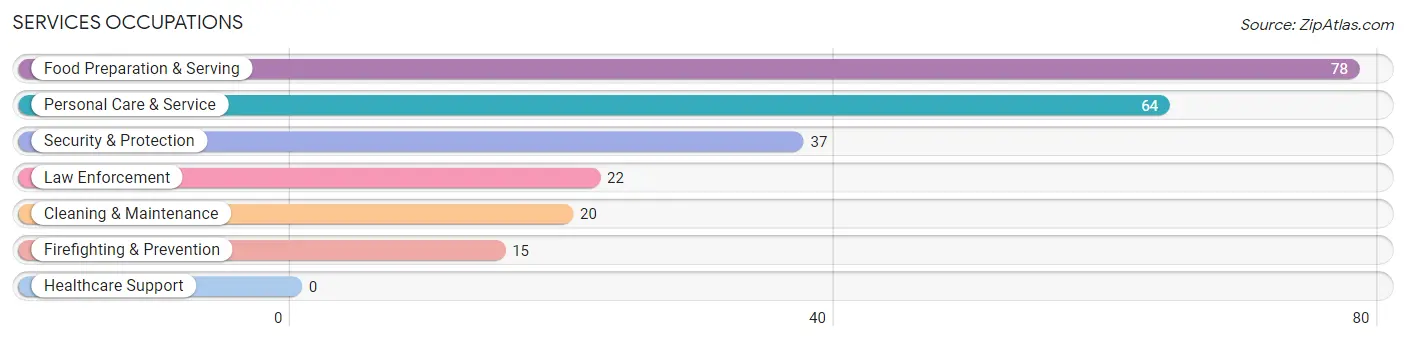
Services Occupations
The most common Services occupations in Brielle borough are Food Preparation & Serving (78 | 3.2%), Personal Care & Service (64 | 2.6%), Security & Protection (37 | 1.5%), Law Enforcement (22 | 0.9%), and Cleaning & Maintenance (20 | 0.8%).
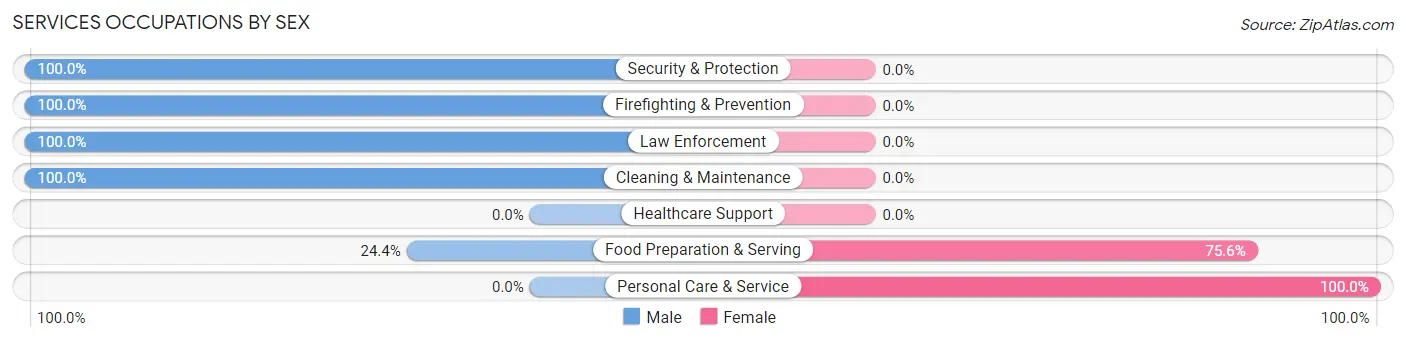
Services Occupations by Sex
Within the Services occupations in Brielle borough, the most male-oriented occupations are Security & Protection (100.0%), Firefighting & Prevention (100.0%), and Law Enforcement (100.0%), while the most female-oriented occupations are Personal Care & Service (100.0%), and Food Preparation & Serving (75.6%).
| Occupation | Male | Female |
| Healthcare Support | 0 (0.0%) | 0 (0.0%) |
| Security & Protection | 37 (100.0%) | 0 (0.0%) |
| Firefighting & Prevention | 15 (100.0%) | 0 (0.0%) |
| Law Enforcement | 22 (100.0%) | 0 (0.0%) |
| Food Preparation & Serving | 19 (24.4%) | 59 (75.6%) |
| Cleaning & Maintenance | 20 (100.0%) | 0 (0.0%) |
| Personal Care & Service | 0 (0.0%) | 64 (100.0%) |
| Total (Category) | 76 (38.2%) | 123 (61.8%) |
| Total (Overall) | 1,210 (49.4%) | 1,237 (50.5%) |
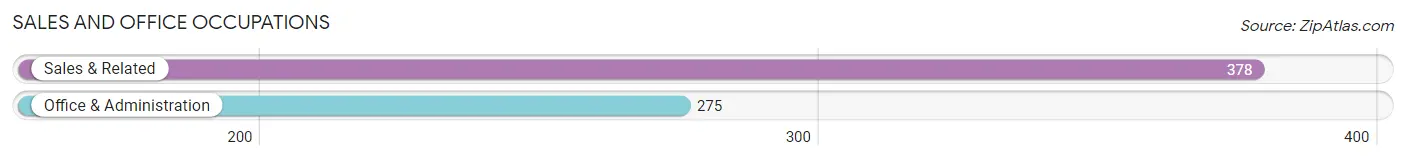
Sales and Office Occupations
The most common Sales and Office occupations in Brielle borough are Sales & Related (378 | 15.4%), and Office & Administration (275 | 11.2%).
Sales and Office Occupations by Sex
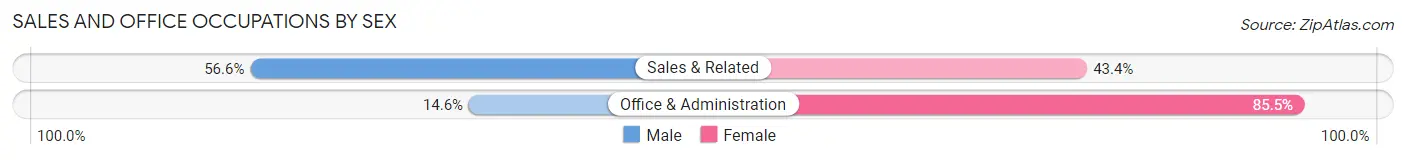
| Occupation | Male | Female |
| Sales & Related | 214 (56.6%) | 164 (43.4%) |
| Office & Administration | 40 (14.5%) | 235 (85.5%) |
| Total (Category) | 254 (38.9%) | 399 (61.1%) |
| Total (Overall) | 1,210 (49.4%) | 1,237 (50.5%) |
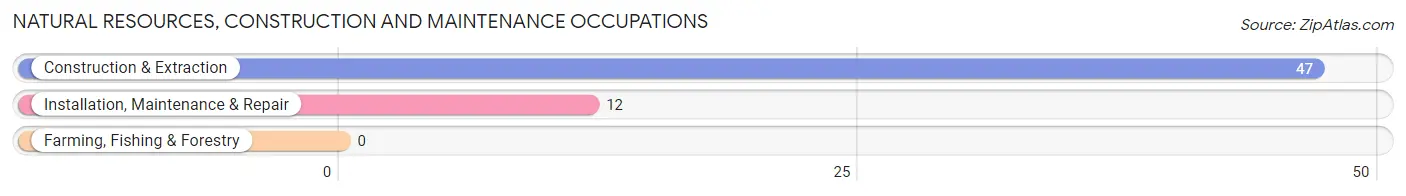
Natural Resources, Construction and Maintenance Occupations
The most common Natural Resources, Construction and Maintenance occupations in Brielle borough are Construction & Extraction (47 | 1.9%), and Installation, Maintenance & Repair (12 | 0.5%).
Natural Resources, Construction and Maintenance Occupations by Sex
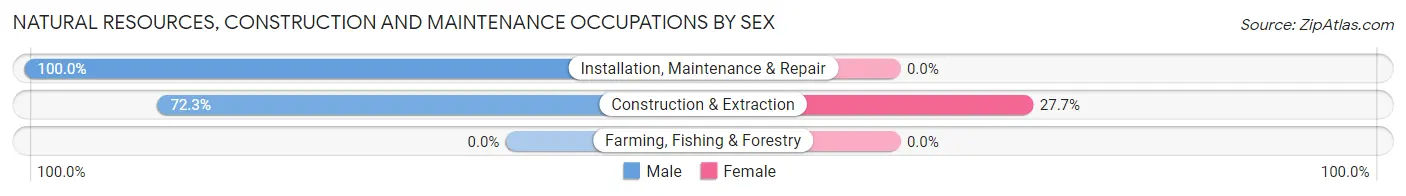
| Occupation | Male | Female |
| Farming, Fishing & Forestry | 0 (0.0%) | 0 (0.0%) |
| Construction & Extraction | 34 (72.3%) | 13 (27.7%) |
| Installation, Maintenance & Repair | 12 (100.0%) | 0 (0.0%) |
| Total (Category) | 46 (78.0%) | 13 (22.0%) |
| Total (Overall) | 1,210 (49.4%) | 1,237 (50.5%) |
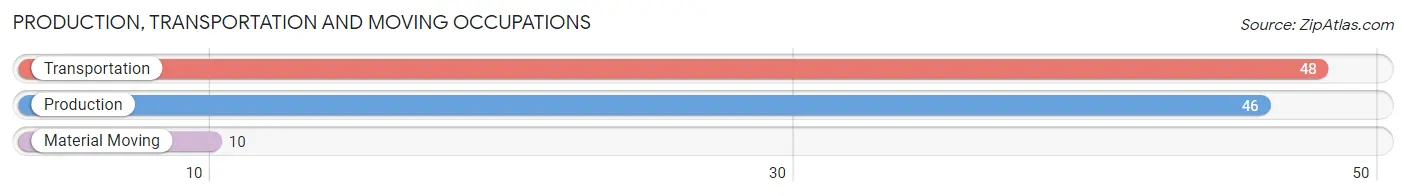
Production, Transportation and Moving Occupations
The most common Production, Transportation and Moving occupations in Brielle borough are Transportation (48 | 2.0%), Production (46 | 1.9%), and Material Moving (10 | 0.4%).
Production, Transportation and Moving Occupations by Sex
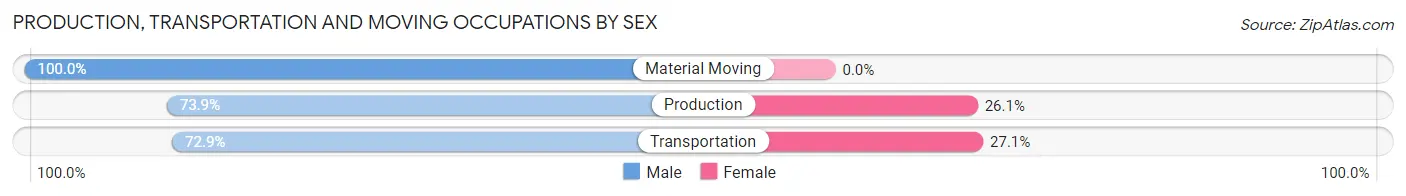
| Occupation | Male | Female |
| Production | 34 (73.9%) | 12 (26.1%) |
| Transportation | 35 (72.9%) | 13 (27.1%) |
| Material Moving | 10 (100.0%) | 0 (0.0%) |
| Total (Category) | 79 (76.0%) | 25 (24.0%) |
| Total (Overall) | 1,210 (49.4%) | 1,237 (50.5%) |
Employment Industries by Sex in Brielle borough
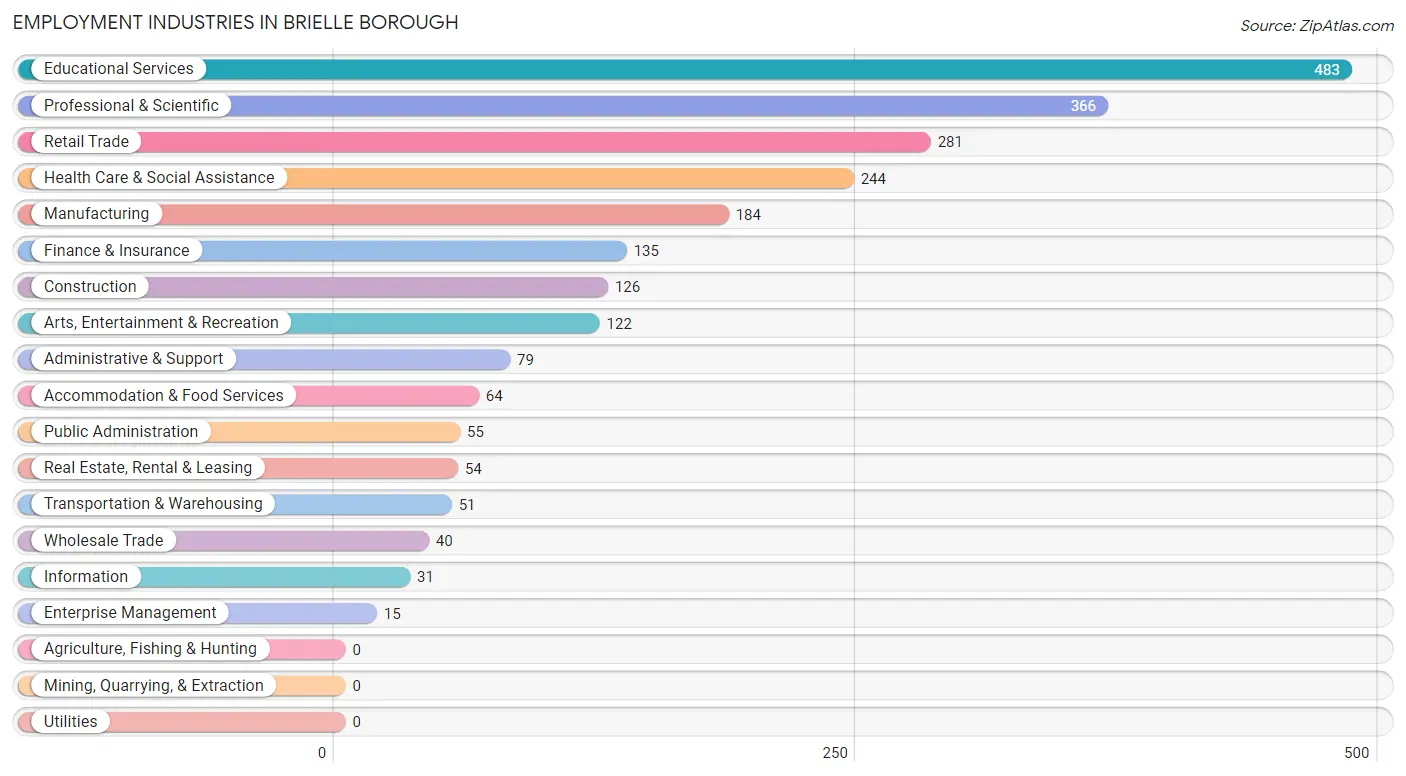
Employment Industries in Brielle borough
The major employment industries in Brielle borough include Educational Services (483 | 19.7%), Professional & Scientific (366 | 15.0%), Retail Trade (281 | 11.5%), Health Care & Social Assistance (244 | 10.0%), and Manufacturing (184 | 7.5%).
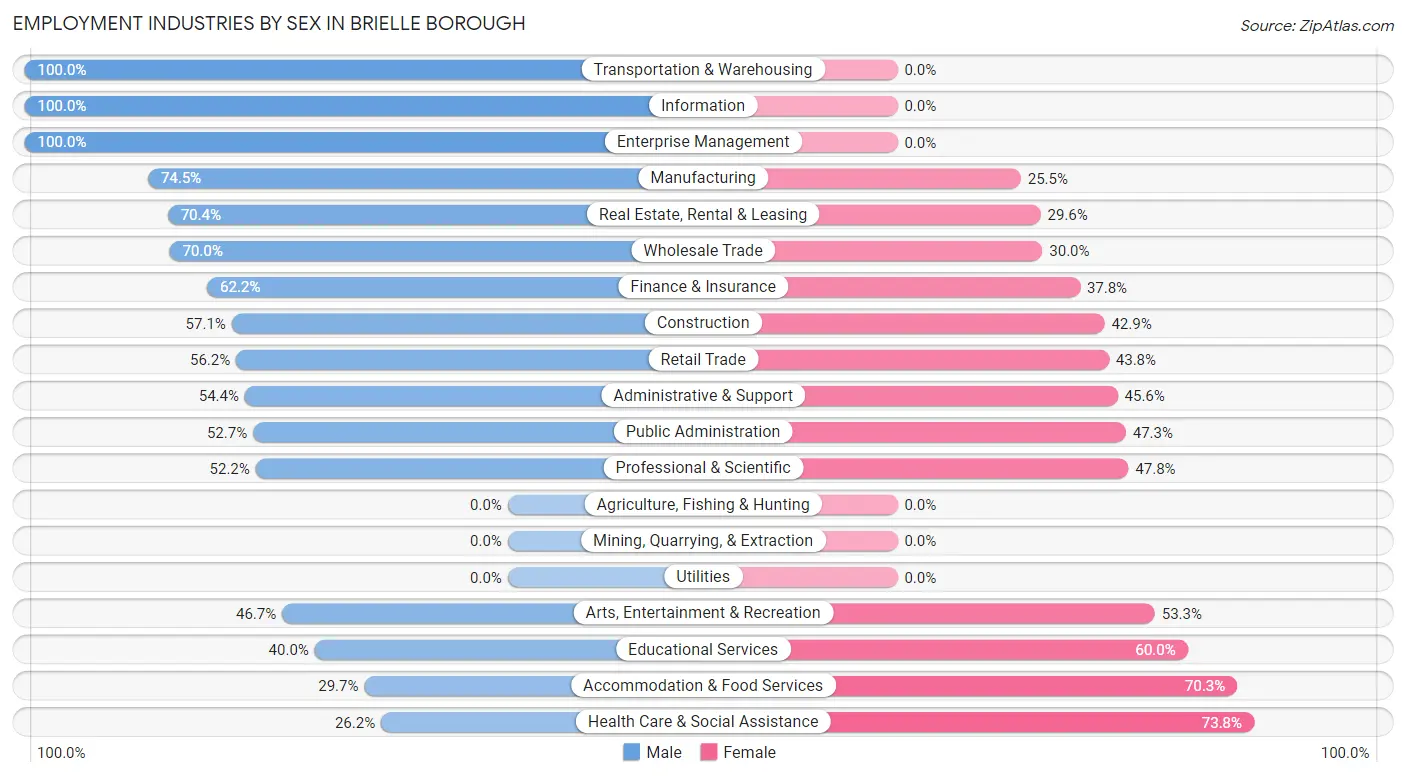
Employment Industries by Sex in Brielle borough
The Brielle borough industries that see more men than women are Transportation & Warehousing (100.0%), Information (100.0%), and Enterprise Management (100.0%), whereas the industries that tend to have a higher number of women are Health Care & Social Assistance (73.8%), Accommodation & Food Services (70.3%), and Educational Services (60.0%).
| Industry | Male | Female |
| Agriculture, Fishing & Hunting | 0 (0.0%) | 0 (0.0%) |
| Mining, Quarrying, & Extraction | 0 (0.0%) | 0 (0.0%) |
| Construction | 72 (57.1%) | 54 (42.9%) |
| Manufacturing | 137 (74.5%) | 47 (25.5%) |
| Wholesale Trade | 28 (70.0%) | 12 (30.0%) |
| Retail Trade | 158 (56.2%) | 123 (43.8%) |
| Transportation & Warehousing | 51 (100.0%) | 0 (0.0%) |
| Utilities | 0 (0.0%) | 0 (0.0%) |
| Information | 31 (100.0%) | 0 (0.0%) |
| Finance & Insurance | 84 (62.2%) | 51 (37.8%) |
| Real Estate, Rental & Leasing | 38 (70.4%) | 16 (29.6%) |
| Professional & Scientific | 191 (52.2%) | 175 (47.8%) |
| Enterprise Management | 15 (100.0%) | 0 (0.0%) |
| Administrative & Support | 43 (54.4%) | 36 (45.6%) |
| Educational Services | 193 (40.0%) | 290 (60.0%) |
| Health Care & Social Assistance | 64 (26.2%) | 180 (73.8%) |
| Arts, Entertainment & Recreation | 57 (46.7%) | 65 (53.3%) |
| Accommodation & Food Services | 19 (29.7%) | 45 (70.3%) |
| Public Administration | 29 (52.7%) | 26 (47.3%) |
| Total | 1,210 (49.4%) | 1,237 (50.5%) |
Education in Brielle borough
School Enrollment in Brielle borough
The most common levels of schooling among the 1,338 students in Brielle borough are middle school (373 | 27.9%), elementary school (274 | 20.5%), and high school (240 | 17.9%).
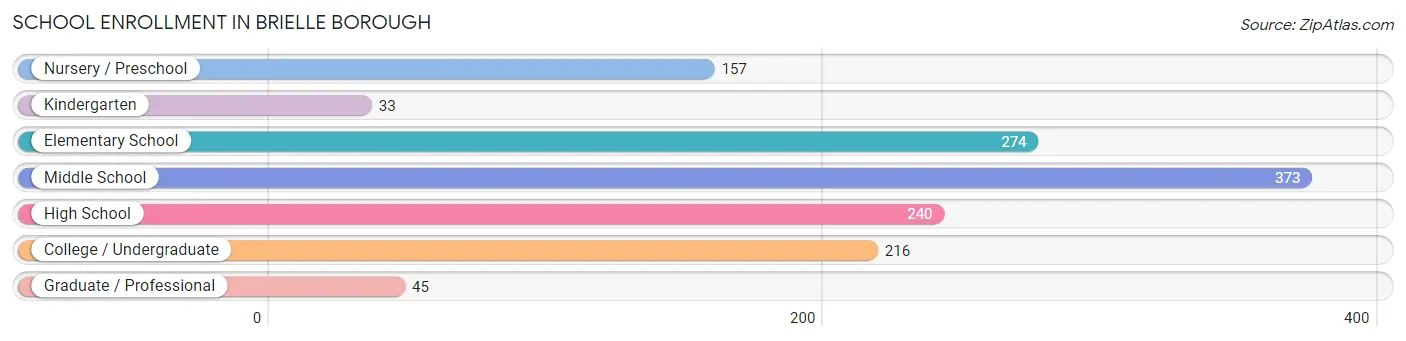
| School Level | # Students | % Students |
| Nursery / Preschool | 157 | 11.7% |
| Kindergarten | 33 | 2.5% |
| Elementary School | 274 | 20.5% |
| Middle School | 373 | 27.9% |
| High School | 240 | 17.9% |
| College / Undergraduate | 216 | 16.1% |
| Graduate / Professional | 45 | 3.4% |
| Total | 1,338 | 100.0% |
School Enrollment by Age by Funding Source in Brielle borough
Out of a total of 1,338 students who are enrolled in schools in Brielle borough, 217 (16.2%) attend a private institution, while the remaining 1,121 (83.8%) are enrolled in public schools. The age group of 3 to 4 year olds has the highest likelihood of being enrolled in private schools, with 41 (53.2% in the age bracket) enrolled. Conversely, the age group of 10 to 14 year olds has the lowest likelihood of being enrolled in a private school, with 421 (100.0% in the age bracket) attending a public institution.
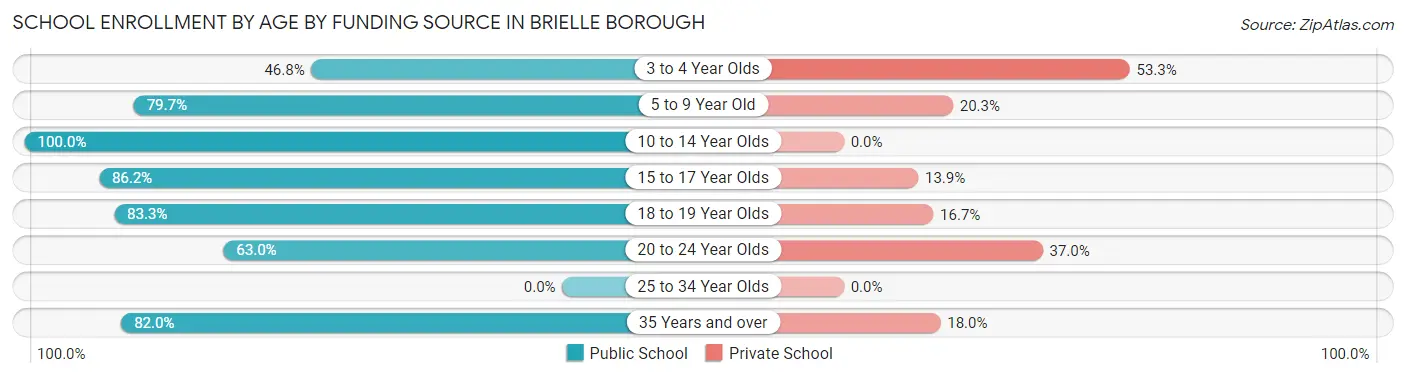
| Age Bracket | Public School | Private School |
| 3 to 4 Year Olds | 36 (46.8%) | 41 (53.2%) |
| 5 to 9 Year Old | 290 (79.7%) | 74 (20.3%) |
| 10 to 14 Year Olds | 421 (100.0%) | 0 (0.0%) |
| 15 to 17 Year Olds | 168 (86.2%) | 27 (13.9%) |
| 18 to 19 Year Olds | 80 (83.3%) | 16 (16.7%) |
| 20 to 24 Year Olds | 85 (63.0%) | 50 (37.0%) |
| 25 to 34 Year Olds | 0 (0.0%) | 0 (0.0%) |
| 35 Years and over | 41 (82.0%) | 9 (18.0%) |
| Total | 1,121 (83.8%) | 217 (16.2%) |
Educational Attainment by Field of Study in Brielle borough
Education (482 | 20.3%), business (419 | 17.6%), social sciences (251 | 10.6%), engineering (197 | 8.3%), and psychology (175 | 7.4%) are the most common fields of study among 2,376 individuals in Brielle borough who have obtained a bachelor's degree or higher.
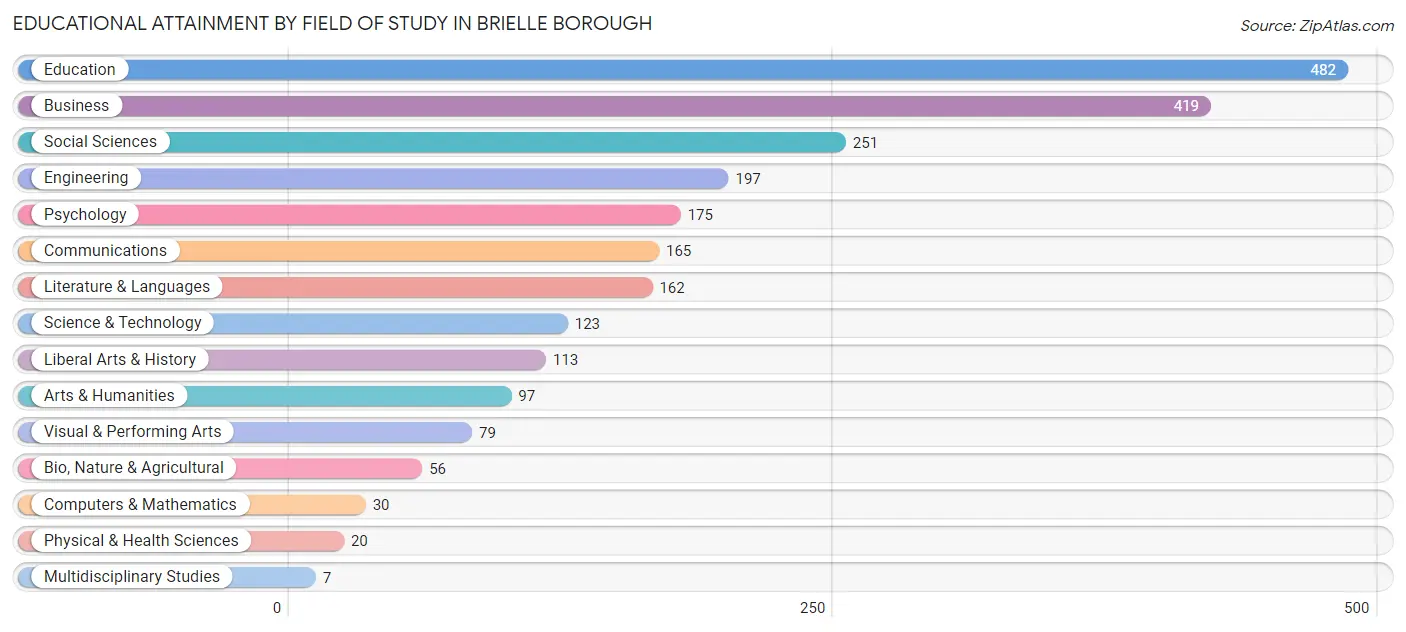
| Field of Study | # Graduates | % Graduates |
| Computers & Mathematics | 30 | 1.3% |
| Bio, Nature & Agricultural | 56 | 2.4% |
| Physical & Health Sciences | 20 | 0.8% |
| Psychology | 175 | 7.4% |
| Social Sciences | 251 | 10.6% |
| Engineering | 197 | 8.3% |
| Multidisciplinary Studies | 7 | 0.3% |
| Science & Technology | 123 | 5.2% |
| Business | 419 | 17.6% |
| Education | 482 | 20.3% |
| Literature & Languages | 162 | 6.8% |
| Liberal Arts & History | 113 | 4.8% |
| Visual & Performing Arts | 79 | 3.3% |
| Communications | 165 | 6.9% |
| Arts & Humanities | 97 | 4.1% |
| Total | 2,376 | 100.0% |
Transportation & Commute in Brielle borough
Vehicle Availability by Sex in Brielle borough
The most prevalent vehicle ownership categories in Brielle borough are males with 2 vehicles (627, accounting for 52.5%) and females with 2 vehicles (519, making up 53.2%).
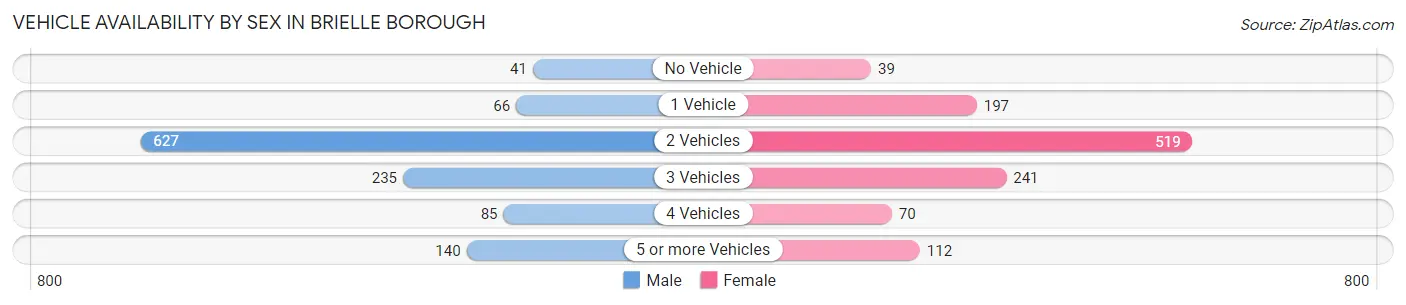
| Vehicles Available | Male | Female |
| No Vehicle | 41 (3.4%) | 39 (3.3%) |
| 1 Vehicle | 66 (5.5%) | 197 (16.7%) |
| 2 Vehicles | 627 (52.5%) | 519 (44.1%) |
| 3 Vehicles | 235 (19.7%) | 241 (20.5%) |
| 4 Vehicles | 85 (7.1%) | 70 (5.9%) |
| 5 or more Vehicles | 140 (11.7%) | 112 (9.5%) |
| Total | 1,194 (100.0%) | 1,178 (100.0%) |
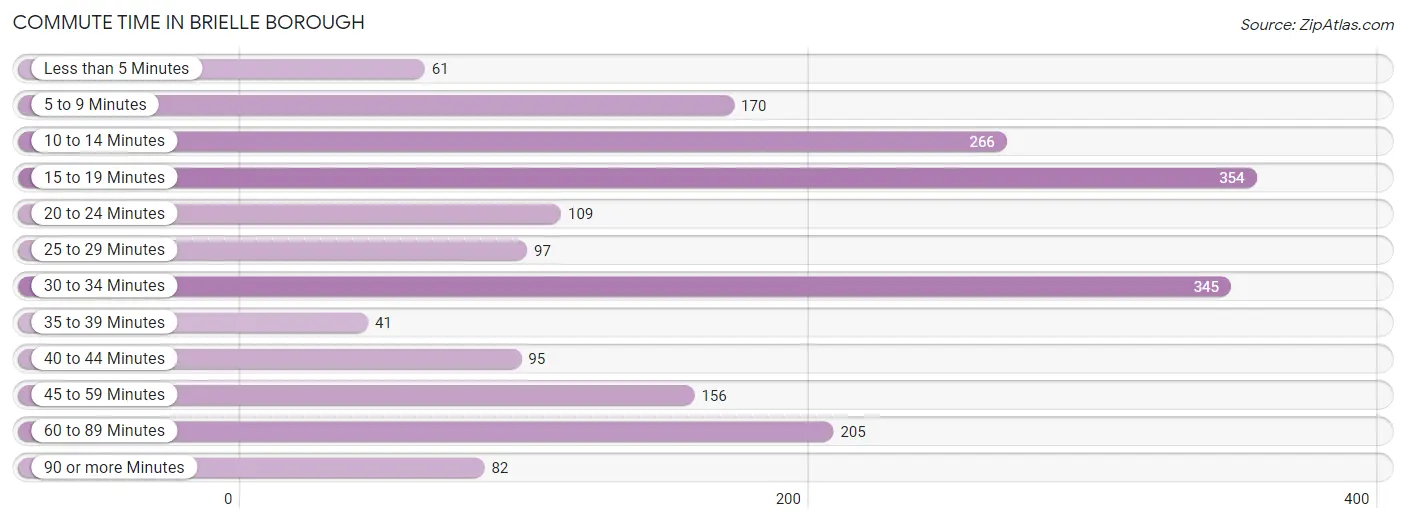
Commute Time in Brielle borough
The most frequently occuring commute durations in Brielle borough are 15 to 19 minutes (354 commuters, 17.9%), 30 to 34 minutes (345 commuters, 17.4%), and 10 to 14 minutes (266 commuters, 13.4%).
| Commute Time | # Commuters | % Commuters |
| Less than 5 Minutes | 61 | 3.1% |
| 5 to 9 Minutes | 170 | 8.6% |
| 10 to 14 Minutes | 266 | 13.4% |
| 15 to 19 Minutes | 354 | 17.9% |
| 20 to 24 Minutes | 109 | 5.5% |
| 25 to 29 Minutes | 97 | 4.9% |
| 30 to 34 Minutes | 345 | 17.4% |
| 35 to 39 Minutes | 41 | 2.1% |
| 40 to 44 Minutes | 95 | 4.8% |
| 45 to 59 Minutes | 156 | 7.9% |
| 60 to 89 Minutes | 205 | 10.3% |
| 90 or more Minutes | 82 | 4.1% |
Commute Time by Sex in Brielle borough
The most common commute times in Brielle borough are 30 to 34 minutes (191 commuters, 20.1%) for males and 15 to 19 minutes (217 commuters, 21.1%) for females.
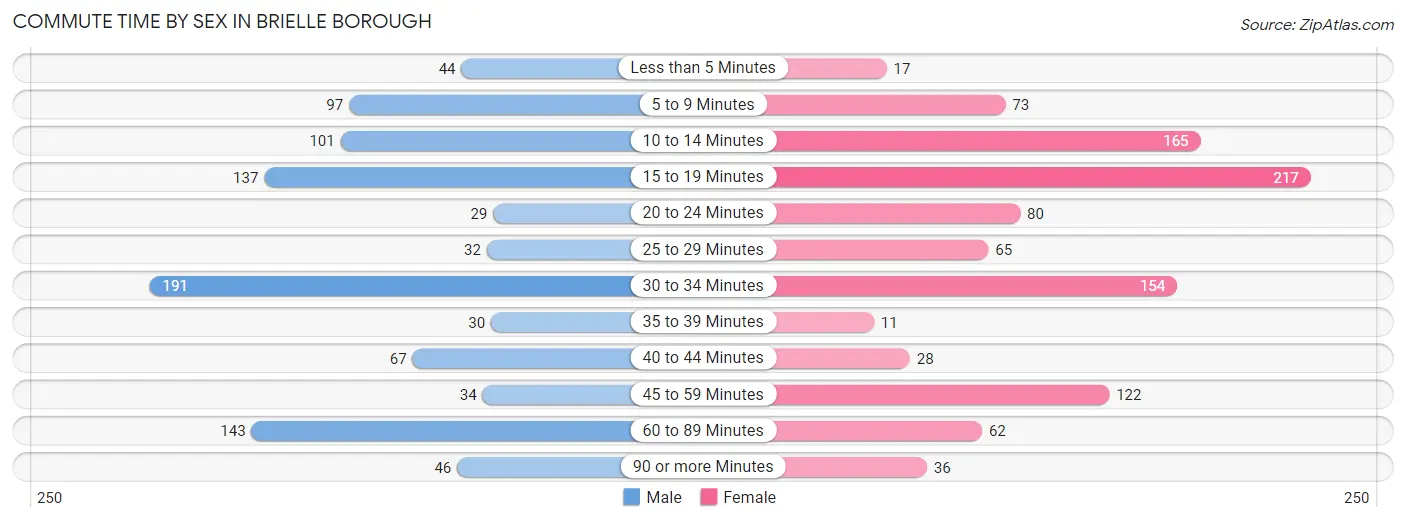
| Commute Time | Male | Female |
| Less than 5 Minutes | 44 (4.6%) | 17 (1.7%) |
| 5 to 9 Minutes | 97 (10.2%) | 73 (7.1%) |
| 10 to 14 Minutes | 101 (10.6%) | 165 (16.0%) |
| 15 to 19 Minutes | 137 (14.4%) | 217 (21.1%) |
| 20 to 24 Minutes | 29 (3.0%) | 80 (7.8%) |
| 25 to 29 Minutes | 32 (3.4%) | 65 (6.3%) |
| 30 to 34 Minutes | 191 (20.1%) | 154 (14.9%) |
| 35 to 39 Minutes | 30 (3.2%) | 11 (1.1%) |
| 40 to 44 Minutes | 67 (7.0%) | 28 (2.7%) |
| 45 to 59 Minutes | 34 (3.6%) | 122 (11.8%) |
| 60 to 89 Minutes | 143 (15.0%) | 62 (6.0%) |
| 90 or more Minutes | 46 (4.8%) | 36 (3.5%) |
Time of Departure to Work by Sex in Brielle borough
The most frequent times of departure to work in Brielle borough are 7:00 AM to 7:29 AM (177, 18.6%) for males and 8:30 AM to 8:59 AM (280, 27.2%) for females.
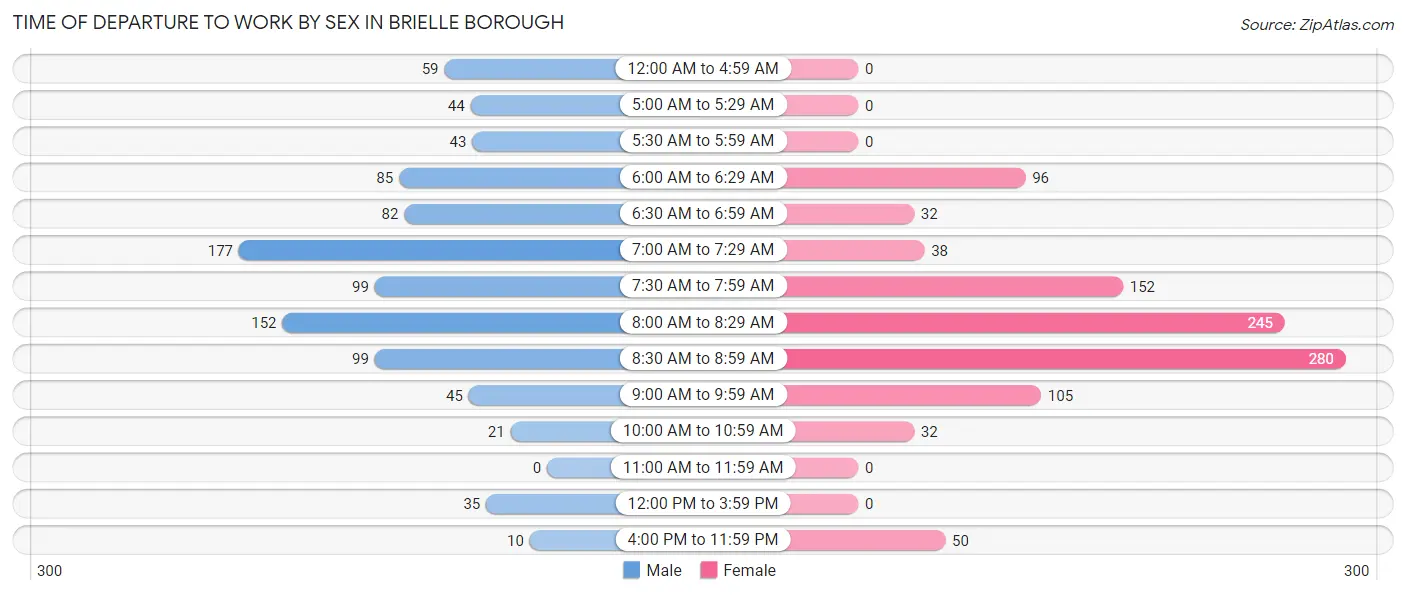
| Time of Departure | Male | Female |
| 12:00 AM to 4:59 AM | 59 (6.2%) | 0 (0.0%) |
| 5:00 AM to 5:29 AM | 44 (4.6%) | 0 (0.0%) |
| 5:30 AM to 5:59 AM | 43 (4.5%) | 0 (0.0%) |
| 6:00 AM to 6:29 AM | 85 (8.9%) | 96 (9.3%) |
| 6:30 AM to 6:59 AM | 82 (8.6%) | 32 (3.1%) |
| 7:00 AM to 7:29 AM | 177 (18.6%) | 38 (3.7%) |
| 7:30 AM to 7:59 AM | 99 (10.4%) | 152 (14.8%) |
| 8:00 AM to 8:29 AM | 152 (16.0%) | 245 (23.8%) |
| 8:30 AM to 8:59 AM | 99 (10.4%) | 280 (27.2%) |
| 9:00 AM to 9:59 AM | 45 (4.7%) | 105 (10.2%) |
| 10:00 AM to 10:59 AM | 21 (2.2%) | 32 (3.1%) |
| 11:00 AM to 11:59 AM | 0 (0.0%) | 0 (0.0%) |
| 12:00 PM to 3:59 PM | 35 (3.7%) | 0 (0.0%) |
| 4:00 PM to 11:59 PM | 10 (1.1%) | 50 (4.9%) |
| Total | 951 (100.0%) | 1,030 (100.0%) |
Housing Occupancy in Brielle borough
Occupancy by Ownership in Brielle borough
Of the total 1,846 dwellings in Brielle borough, owner-occupied units account for 1,731 (93.8%), while renter-occupied units make up 115 (6.2%).
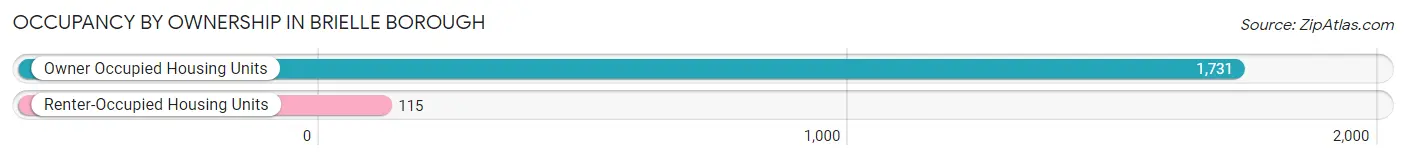
| Occupancy | # Housing Units | % Housing Units |
| Owner Occupied Housing Units | 1,731 | 93.8% |
| Renter-Occupied Housing Units | 115 | 6.2% |
| Total Occupied Housing Units | 1,846 | 100.0% |
Occupancy by Household Size in Brielle borough
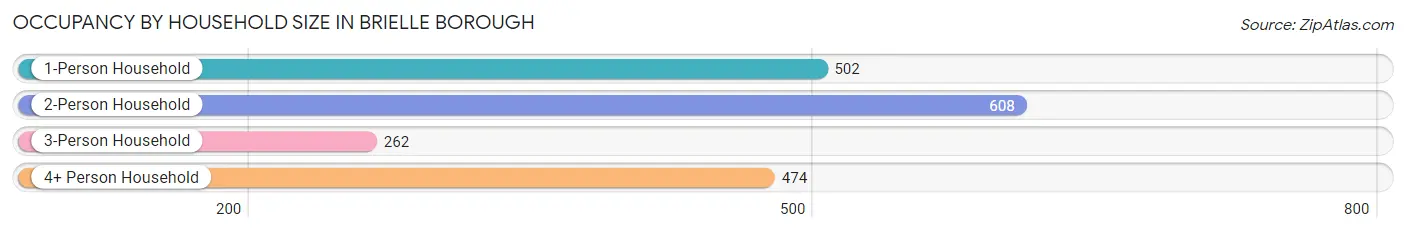
| Household Size | # Housing Units | % Housing Units |
| 1-Person Household | 502 | 27.2% |
| 2-Person Household | 608 | 32.9% |
| 3-Person Household | 262 | 14.2% |
| 4+ Person Household | 474 | 25.7% |
| Total Housing Units | 1,846 | 100.0% |
Occupancy by Ownership by Household Size in Brielle borough
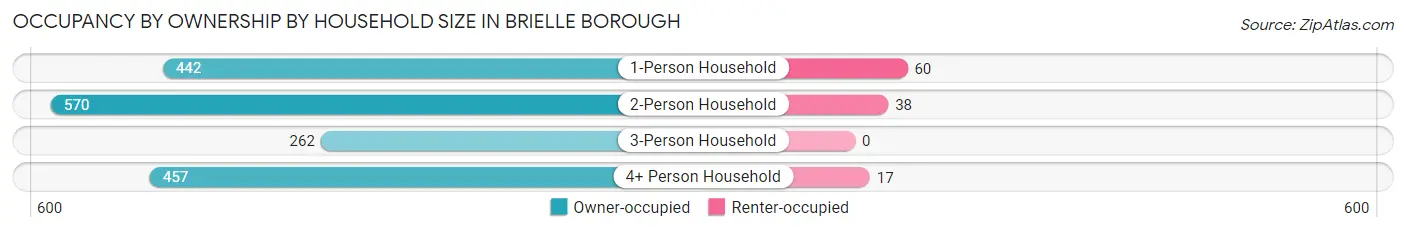
| Household Size | Owner-occupied | Renter-occupied |
| 1-Person Household | 442 (88.0%) | 60 (11.9%) |
| 2-Person Household | 570 (93.8%) | 38 (6.2%) |
| 3-Person Household | 262 (100.0%) | 0 (0.0%) |
| 4+ Person Household | 457 (96.4%) | 17 (3.6%) |
| Total Housing Units | 1,731 (93.8%) | 115 (6.2%) |
Occupancy by Educational Attainment in Brielle borough
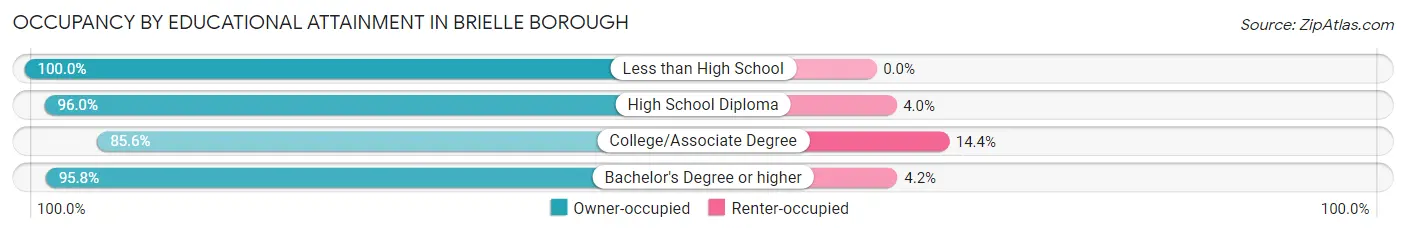
| Household Size | Owner-occupied | Renter-occupied |
| Less than High School | 24 (100.0%) | 0 (0.0%) |
| High School Diploma | 193 (96.0%) | 8 (4.0%) |
| College/Associate Degree | 327 (85.6%) | 55 (14.4%) |
| Bachelor's Degree or higher | 1,187 (95.8%) | 52 (4.2%) |
Occupancy by Age of Householder in Brielle borough
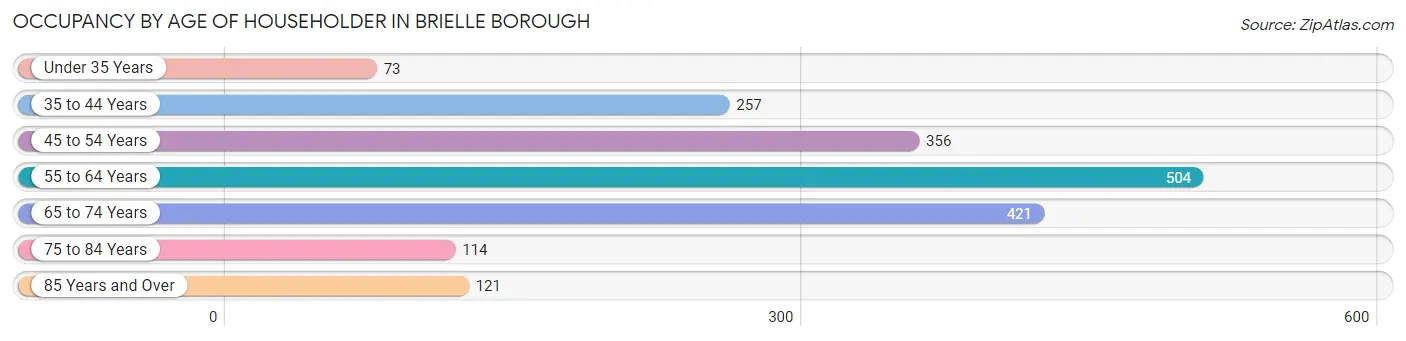
| Age Bracket | # Households | % Households |
| Under 35 Years | 73 | 4.0% |
| 35 to 44 Years | 257 | 13.9% |
| 45 to 54 Years | 356 | 19.3% |
| 55 to 64 Years | 504 | 27.3% |
| 65 to 74 Years | 421 | 22.8% |
| 75 to 84 Years | 114 | 6.2% |
| 85 Years and Over | 121 | 6.6% |
| Total | 1,846 | 100.0% |
Housing Finances in Brielle borough
Median Income by Occupancy in Brielle borough
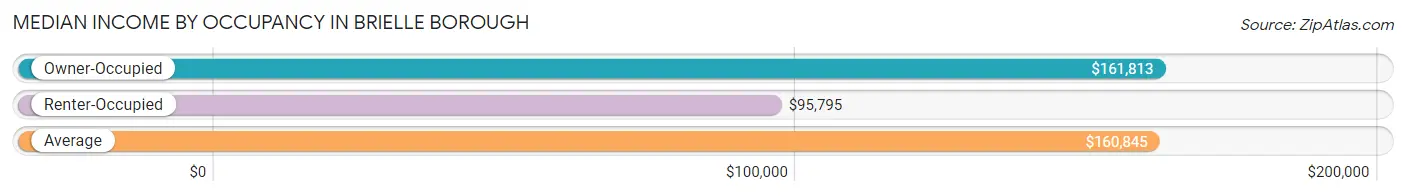
| Occupancy Type | # Households | Median Income |
| Owner-Occupied | 1,731 (93.8%) | $161,813 |
| Renter-Occupied | 115 (6.2%) | $95,795 |
| Average | 1,846 (100.0%) | $160,845 |
Occupancy by Householder Income Bracket in Brielle borough
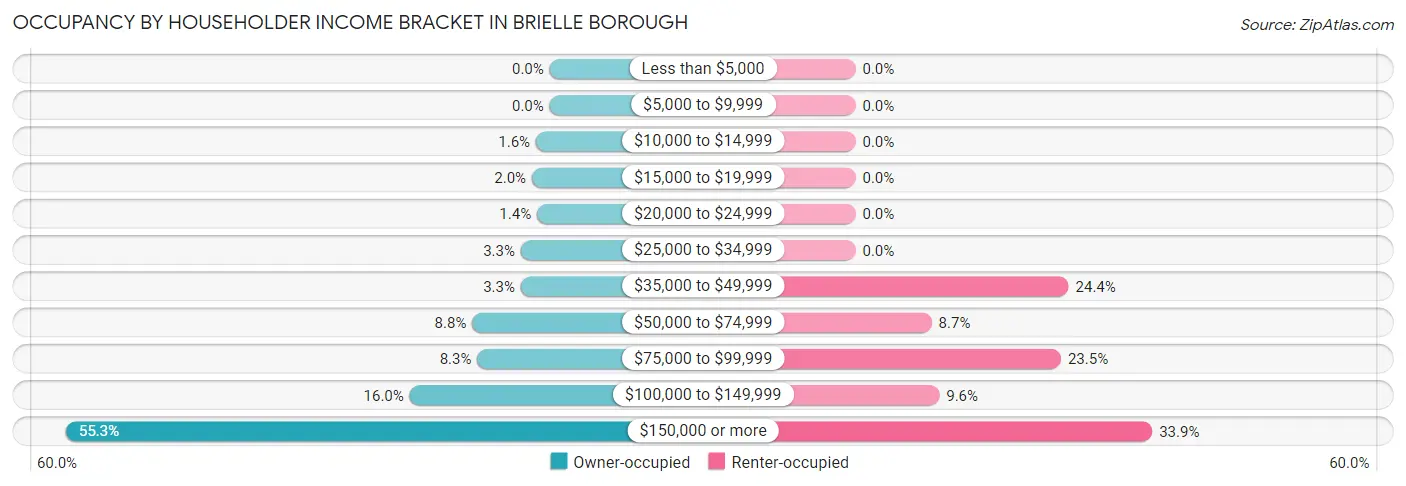
| Income Bracket | Owner-occupied | Renter-occupied |
| Less than $5,000 | 0 (0.0%) | 0 (0.0%) |
| $5,000 to $9,999 | 0 (0.0%) | 0 (0.0%) |
| $10,000 to $14,999 | 27 (1.6%) | 0 (0.0%) |
| $15,000 to $19,999 | 35 (2.0%) | 0 (0.0%) |
| $20,000 to $24,999 | 25 (1.4%) | 0 (0.0%) |
| $25,000 to $34,999 | 57 (3.3%) | 0 (0.0%) |
| $35,000 to $49,999 | 57 (3.3%) | 28 (24.3%) |
| $50,000 to $74,999 | 153 (8.8%) | 10 (8.7%) |
| $75,000 to $99,999 | 143 (8.3%) | 27 (23.5%) |
| $100,000 to $149,999 | 277 (16.0%) | 11 (9.6%) |
| $150,000 or more | 957 (55.3%) | 39 (33.9%) |
| Total | 1,731 (100.0%) | 115 (100.0%) |
Monthly Housing Cost Tiers in Brielle borough
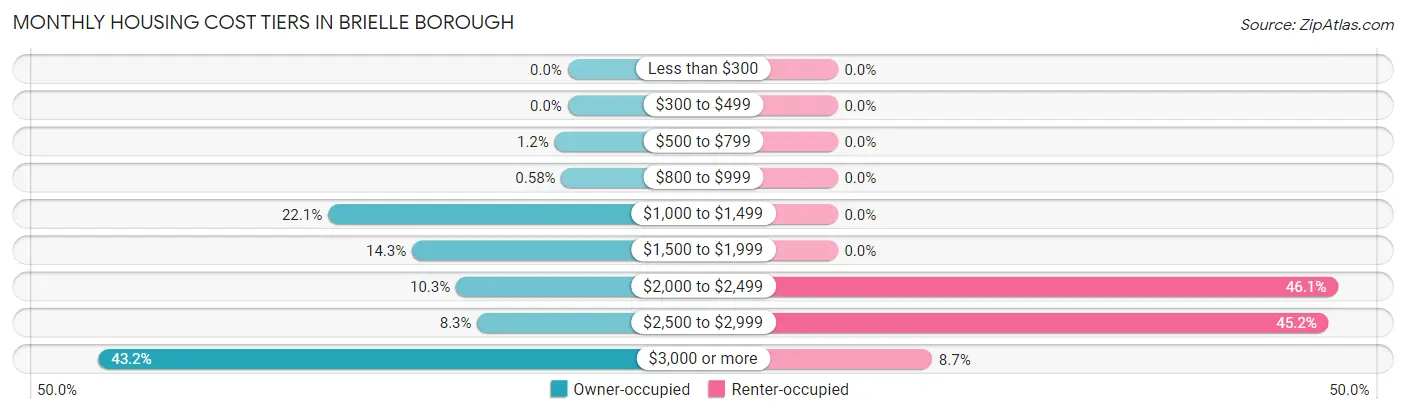
| Monthly Cost | Owner-occupied | Renter-occupied |
| Less than $300 | 0 (0.0%) | 0 (0.0%) |
| $300 to $499 | 0 (0.0%) | 0 (0.0%) |
| $500 to $799 | 21 (1.2%) | 0 (0.0%) |
| $800 to $999 | 10 (0.6%) | 0 (0.0%) |
| $1,000 to $1,499 | 382 (22.1%) | 0 (0.0%) |
| $1,500 to $1,999 | 248 (14.3%) | 0 (0.0%) |
| $2,000 to $2,499 | 178 (10.3%) | 53 (46.1%) |
| $2,500 to $2,999 | 144 (8.3%) | 52 (45.2%) |
| $3,000 or more | 748 (43.2%) | 10 (8.7%) |
| Total | 1,731 (100.0%) | 115 (100.0%) |
Physical Housing Characteristics in Brielle borough
Housing Structures in Brielle borough
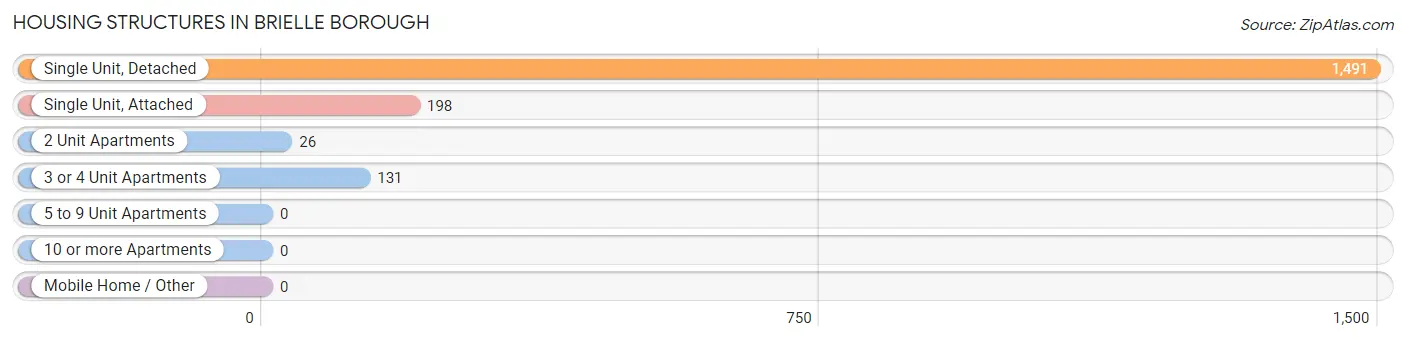
| Structure Type | # Housing Units | % Housing Units |
| Single Unit, Detached | 1,491 | 80.8% |
| Single Unit, Attached | 198 | 10.7% |
| 2 Unit Apartments | 26 | 1.4% |
| 3 or 4 Unit Apartments | 131 | 7.1% |
| 5 to 9 Unit Apartments | 0 | 0.0% |
| 10 or more Apartments | 0 | 0.0% |
| Mobile Home / Other | 0 | 0.0% |
| Total | 1,846 | 100.0% |
Housing Structures by Occupancy in Brielle borough
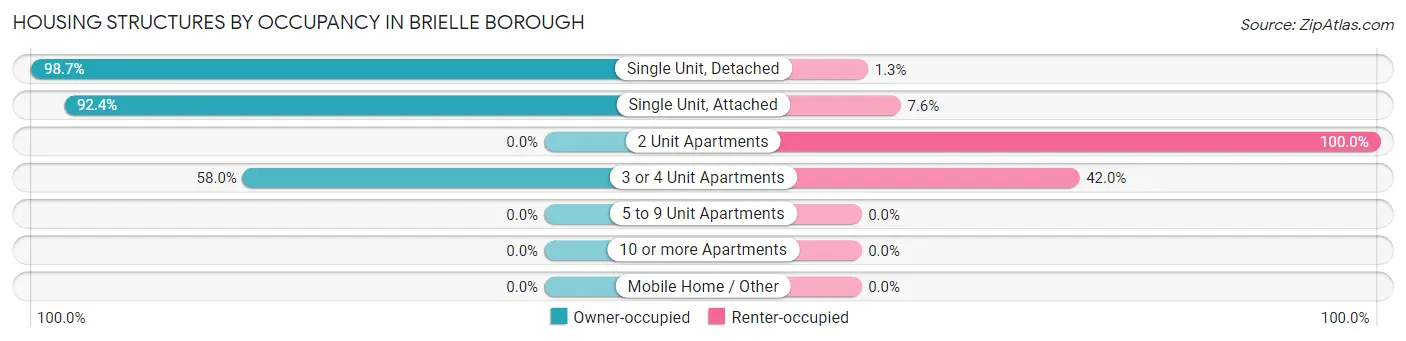
| Structure Type | Owner-occupied | Renter-occupied |
| Single Unit, Detached | 1,472 (98.7%) | 19 (1.3%) |
| Single Unit, Attached | 183 (92.4%) | 15 (7.6%) |
| 2 Unit Apartments | 0 (0.0%) | 26 (100.0%) |
| 3 or 4 Unit Apartments | 76 (58.0%) | 55 (42.0%) |
| 5 to 9 Unit Apartments | 0 (0.0%) | 0 (0.0%) |
| 10 or more Apartments | 0 (0.0%) | 0 (0.0%) |
| Mobile Home / Other | 0 (0.0%) | 0 (0.0%) |
| Total | 1,731 (93.8%) | 115 (6.2%) |
Housing Structures by Number of Rooms in Brielle borough
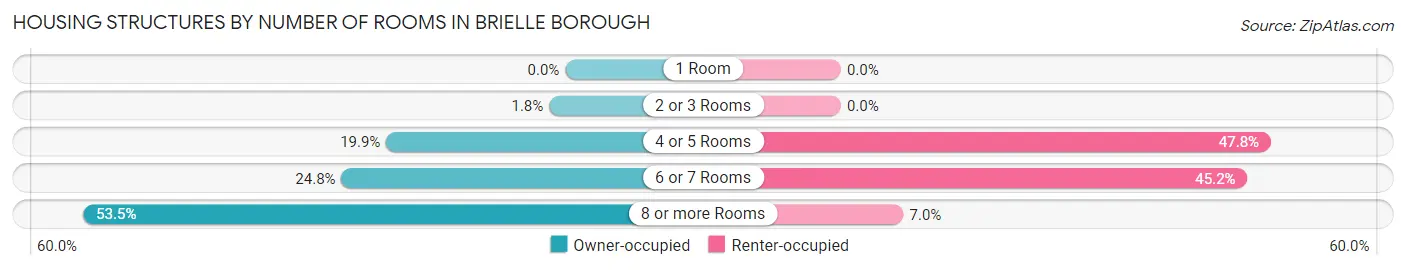
| Number of Rooms | Owner-occupied | Renter-occupied |
| 1 Room | 0 (0.0%) | 0 (0.0%) |
| 2 or 3 Rooms | 31 (1.8%) | 0 (0.0%) |
| 4 or 5 Rooms | 344 (19.9%) | 55 (47.8%) |
| 6 or 7 Rooms | 430 (24.8%) | 52 (45.2%) |
| 8 or more Rooms | 926 (53.5%) | 8 (7.0%) |
| Total | 1,731 (100.0%) | 115 (100.0%) |
Housing Structure by Heating Type in Brielle borough
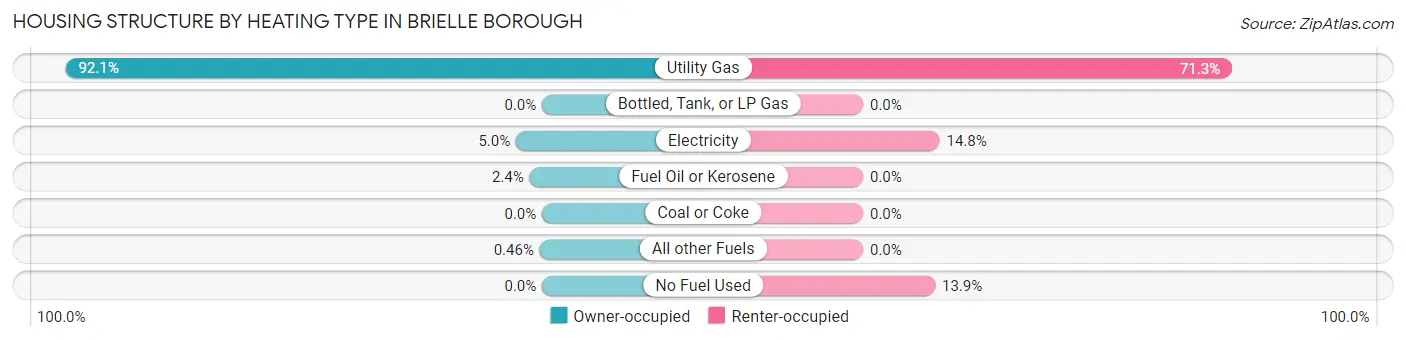
| Heating Type | Owner-occupied | Renter-occupied |
| Utility Gas | 1,594 (92.1%) | 82 (71.3%) |
| Bottled, Tank, or LP Gas | 0 (0.0%) | 0 (0.0%) |
| Electricity | 87 (5.0%) | 17 (14.8%) |
| Fuel Oil or Kerosene | 42 (2.4%) | 0 (0.0%) |
| Coal or Coke | 0 (0.0%) | 0 (0.0%) |
| All other Fuels | 8 (0.5%) | 0 (0.0%) |
| No Fuel Used | 0 (0.0%) | 16 (13.9%) |
| Total | 1,731 (100.0%) | 115 (100.0%) |
Household Vehicle Usage in Brielle borough
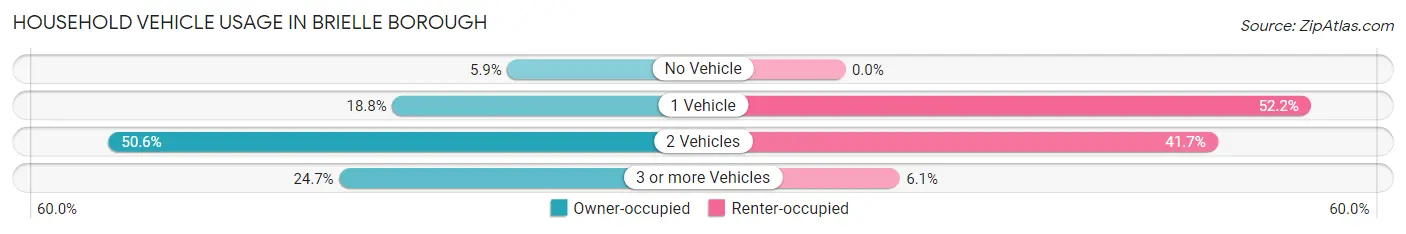
| Vehicles per Household | Owner-occupied | Renter-occupied |
| No Vehicle | 102 (5.9%) | 0 (0.0%) |
| 1 Vehicle | 325 (18.8%) | 60 (52.2%) |
| 2 Vehicles | 876 (50.6%) | 48 (41.7%) |
| 3 or more Vehicles | 428 (24.7%) | 7 (6.1%) |
| Total | 1,731 (100.0%) | 115 (100.0%) |
Real Estate & Mortgages in Brielle borough
Real Estate and Mortgage Overview in Brielle borough
| Characteristic | Without Mortgage | With Mortgage |
| Housing Units | 690 | 1,041 |
| Median Property Value | $726,600 | $796,000 |
| Median Household Income | $105,313 | $691 |
| Monthly Housing Costs | $1,462 | $732 |
| Real Estate Taxes | $10,001 | $0 |
Property Value by Mortgage Status in Brielle borough
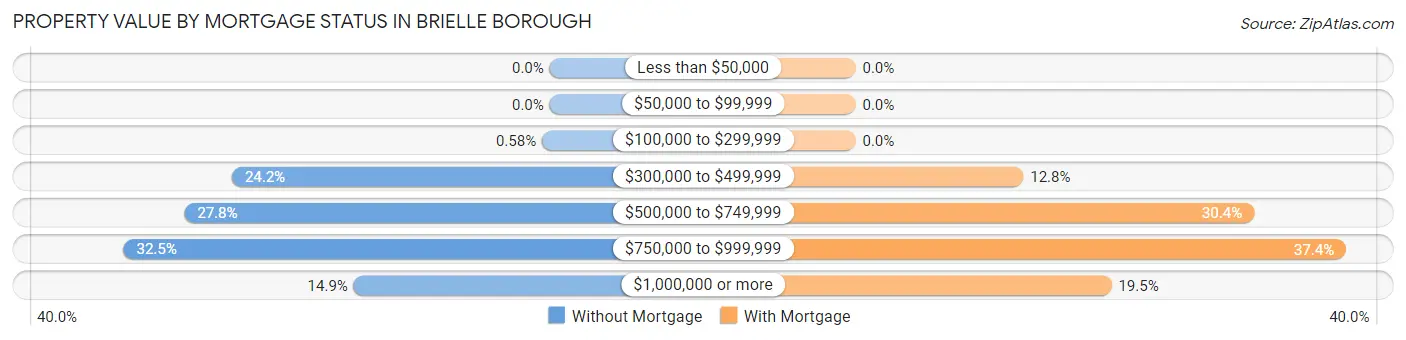
| Property Value | Without Mortgage | With Mortgage |
| Less than $50,000 | 0 (0.0%) | 0 (0.0%) |
| $50,000 to $99,999 | 0 (0.0%) | 0 (0.0%) |
| $100,000 to $299,999 | 4 (0.6%) | 0 (0.0%) |
| $300,000 to $499,999 | 167 (24.2%) | 133 (12.8%) |
| $500,000 to $749,999 | 192 (27.8%) | 316 (30.4%) |
| $750,000 to $999,999 | 224 (32.5%) | 389 (37.4%) |
| $1,000,000 or more | 103 (14.9%) | 203 (19.5%) |
| Total | 690 (100.0%) | 1,041 (100.0%) |
Household Income by Mortgage Status in Brielle borough
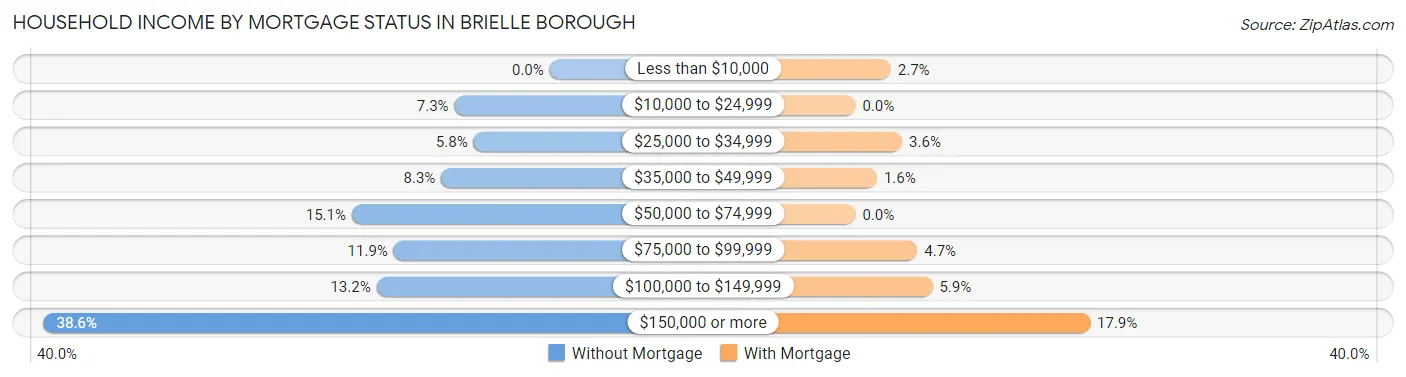
| Household Income | Without Mortgage | With Mortgage |
| Less than $10,000 | 0 (0.0%) | 28 (2.7%) |
| $10,000 to $24,999 | 50 (7.2%) | 0 (0.0%) |
| $25,000 to $34,999 | 40 (5.8%) | 37 (3.5%) |
| $35,000 to $49,999 | 57 (8.3%) | 17 (1.6%) |
| $50,000 to $74,999 | 104 (15.1%) | 0 (0.0%) |
| $75,000 to $99,999 | 82 (11.9%) | 49 (4.7%) |
| $100,000 to $149,999 | 91 (13.2%) | 61 (5.9%) |
| $150,000 or more | 266 (38.6%) | 186 (17.9%) |
| Total | 690 (100.0%) | 1,041 (100.0%) |
Property Value to Household Income Ratio in Brielle borough
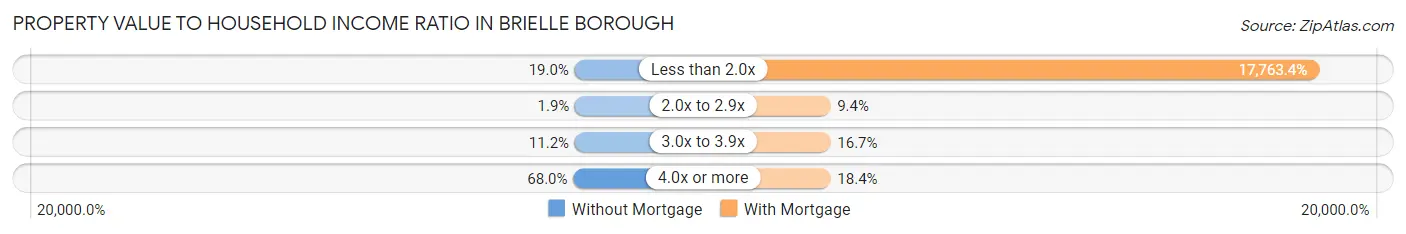
| Value-to-Income Ratio | Without Mortgage | With Mortgage |
| Less than 2.0x | 131 (19.0%) | 184,917 (17,763.4%) |
| 2.0x to 2.9x | 13 (1.9%) | 98 (9.4%) |
| 3.0x to 3.9x | 77 (11.2%) | 174 (16.7%) |
| 4.0x or more | 469 (68.0%) | 191 (18.3%) |
| Total | 690 (100.0%) | 1,041 (100.0%) |
Real Estate Taxes by Mortgage Status in Brielle borough
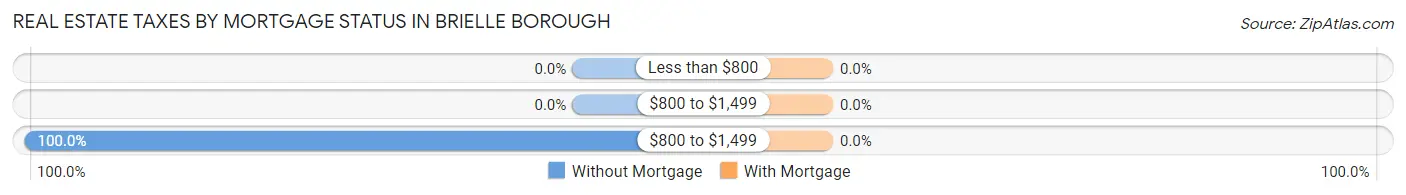
| Property Taxes | Without Mortgage | With Mortgage |
| Less than $800 | 0 (0.0%) | 0 (0.0%) |
| $800 to $1,499 | 0 (0.0%) | 0 (0.0%) |
| $800 to $1,499 | 690 (100.0%) | 0 (0.0%) |
| Total | 690 (100.0%) | 1,041 (100.0%) |
Health & Disability in Brielle borough
Health Insurance Coverage by Age in Brielle borough
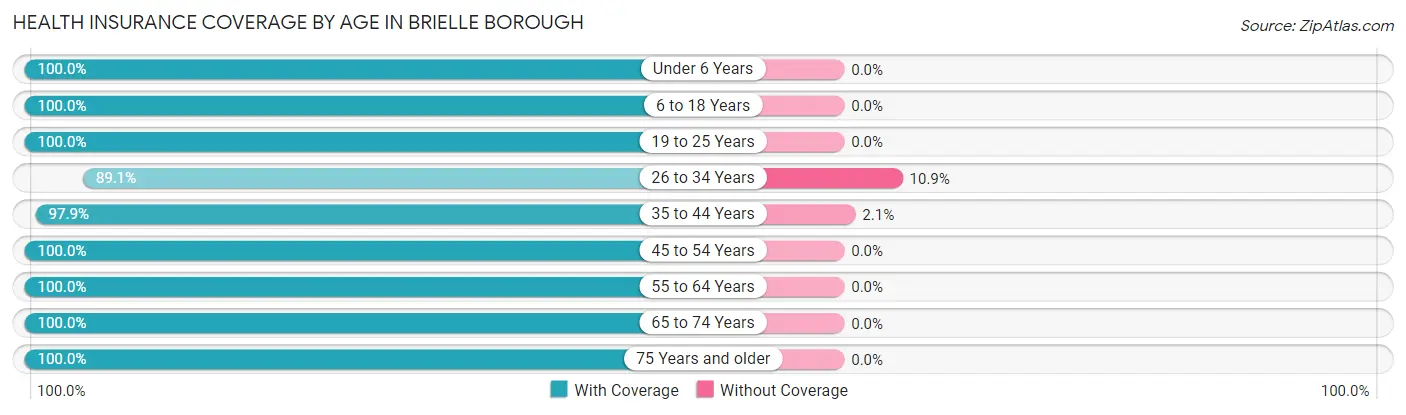
| Age Bracket | With Coverage | Without Coverage |
| Under 6 Years | 310 (100.0%) | 0 (0.0%) |
| 6 to 18 Years | 960 (100.0%) | 0 (0.0%) |
| 19 to 25 Years | 394 (100.0%) | 0 (0.0%) |
| 26 to 34 Years | 205 (89.1%) | 25 (10.9%) |
| 35 to 44 Years | 472 (97.9%) | 10 (2.1%) |
| 45 to 54 Years | 600 (100.0%) | 0 (0.0%) |
| 55 to 64 Years | 922 (100.0%) | 0 (0.0%) |
| 65 to 74 Years | 706 (100.0%) | 0 (0.0%) |
| 75 Years and older | 353 (100.0%) | 0 (0.0%) |
| Total | 4,922 (99.3%) | 35 (0.7%) |
Health Insurance Coverage by Citizenship Status in Brielle borough
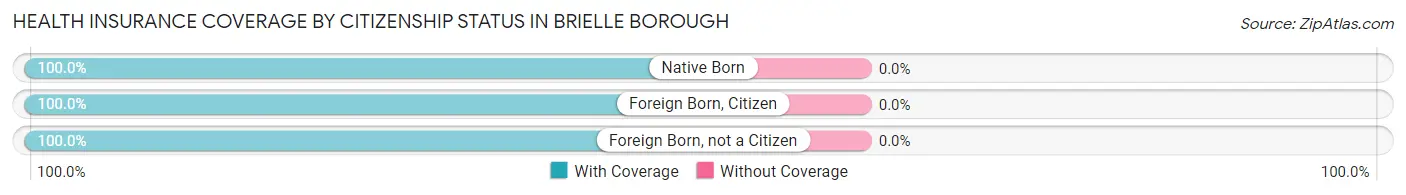
| Citizenship Status | With Coverage | Without Coverage |
| Native Born | 310 (100.0%) | 0 (0.0%) |
| Foreign Born, Citizen | 960 (100.0%) | 0 (0.0%) |
| Foreign Born, not a Citizen | 394 (100.0%) | 0 (0.0%) |
Health Insurance Coverage by Household Income in Brielle borough
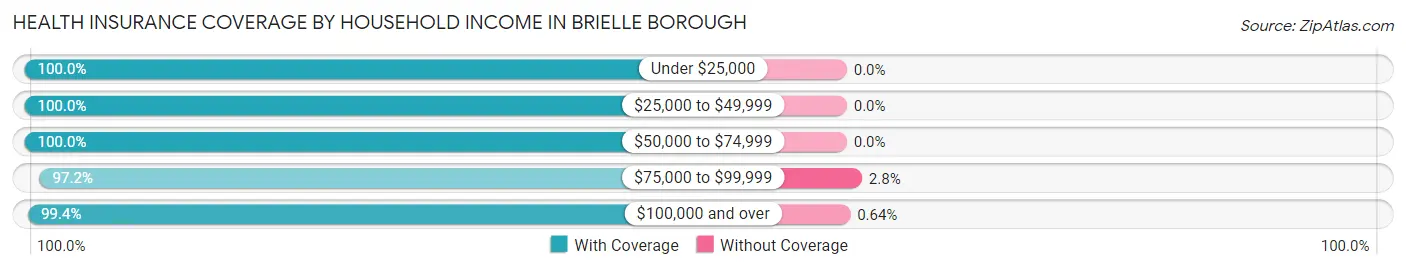
| Household Income | With Coverage | Without Coverage |
| Under $25,000 | 87 (100.0%) | 0 (0.0%) |
| $25,000 to $49,999 | 270 (100.0%) | 0 (0.0%) |
| $50,000 to $74,999 | 314 (100.0%) | 0 (0.0%) |
| $75,000 to $99,999 | 343 (97.2%) | 10 (2.8%) |
| $100,000 and over | 3,908 (99.4%) | 25 (0.6%) |
Public vs Private Health Insurance Coverage by Age in Brielle borough
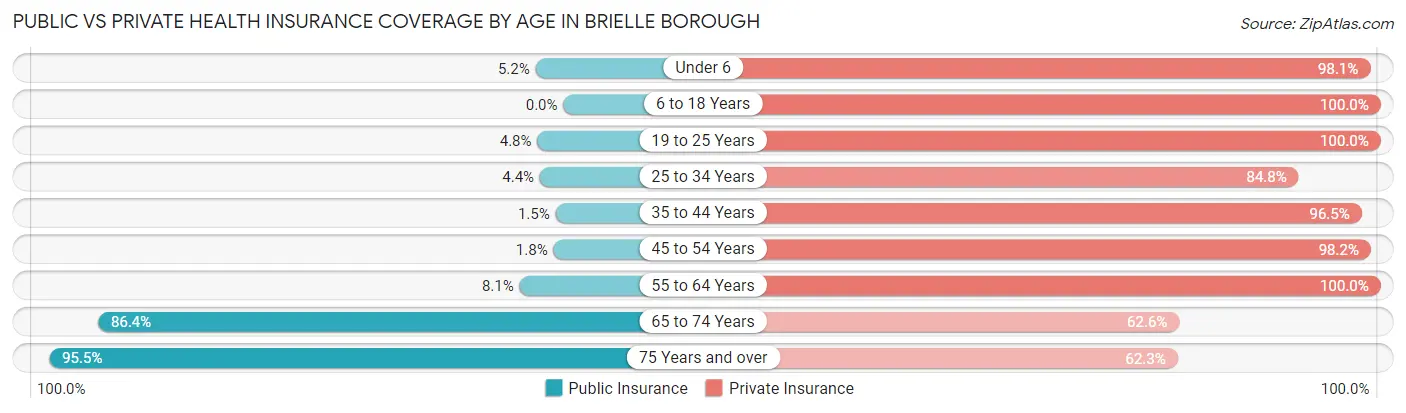
| Age Bracket | Public Insurance | Private Insurance |
| Under 6 | 16 (5.2%) | 304 (98.1%) |
| 6 to 18 Years | 0 (0.0%) | 960 (100.0%) |
| 19 to 25 Years | 19 (4.8%) | 394 (100.0%) |
| 25 to 34 Years | 10 (4.3%) | 195 (84.8%) |
| 35 to 44 Years | 7 (1.5%) | 465 (96.5%) |
| 45 to 54 Years | 11 (1.8%) | 589 (98.2%) |
| 55 to 64 Years | 75 (8.1%) | 922 (100.0%) |
| 65 to 74 Years | 610 (86.4%) | 442 (62.6%) |
| 75 Years and over | 337 (95.5%) | 220 (62.3%) |
| Total | 1,085 (21.9%) | 4,491 (90.6%) |
Disability Status by Sex by Age in Brielle borough
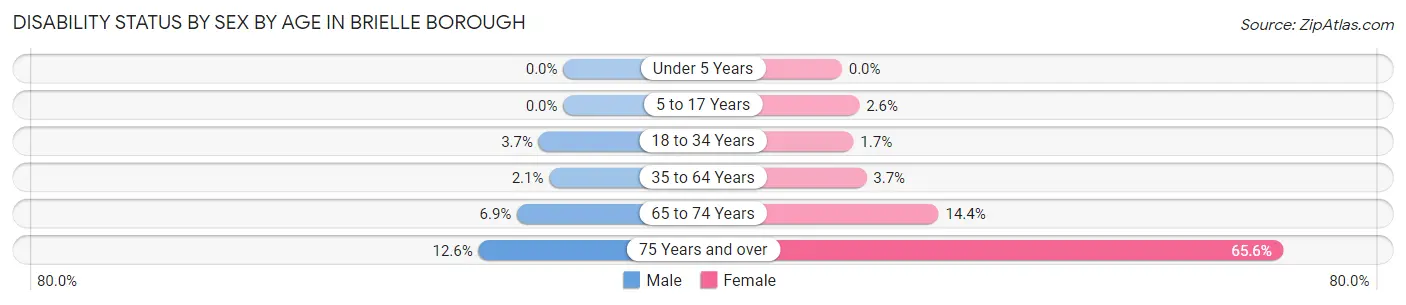
| Age Bracket | Male | Female |
| Under 5 Years | 0 (0.0%) | 0 (0.0%) |
| 5 to 17 Years | 0 (0.0%) | 14 (2.6%) |
| 18 to 34 Years | 10 (3.6%) | 7 (1.7%) |
| 35 to 64 Years | 19 (2.1%) | 40 (3.6%) |
| 65 to 74 Years | 26 (6.9%) | 47 (14.4%) |
| 75 Years and over | 17 (12.6%) | 143 (65.6%) |
Disability Class by Sex by Age in Brielle borough
Disability Class: Hearing Difficulty
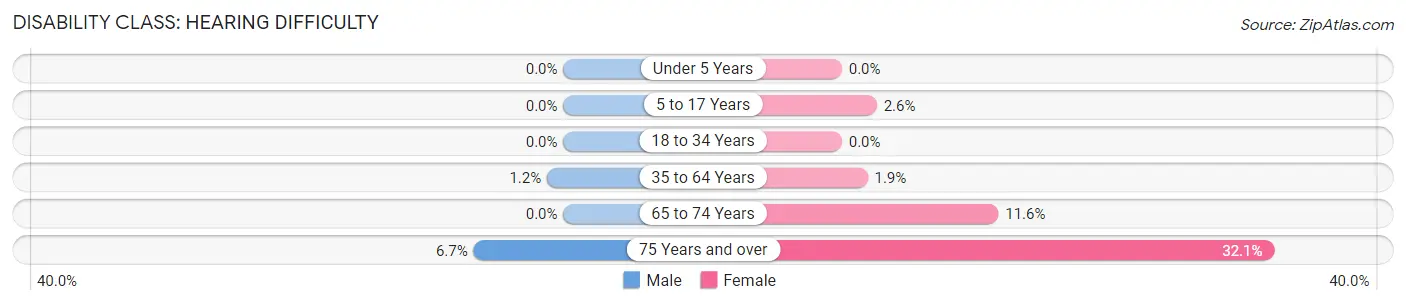
| Age Bracket | Male | Female |
| Under 5 Years | 0 (0.0%) | 0 (0.0%) |
| 5 to 17 Years | 0 (0.0%) | 14 (2.6%) |
| 18 to 34 Years | 0 (0.0%) | 0 (0.0%) |
| 35 to 64 Years | 11 (1.2%) | 21 (1.9%) |
| 65 to 74 Years | 0 (0.0%) | 38 (11.6%) |
| 75 Years and over | 9 (6.7%) | 70 (32.1%) |
Disability Class: Vision Difficulty
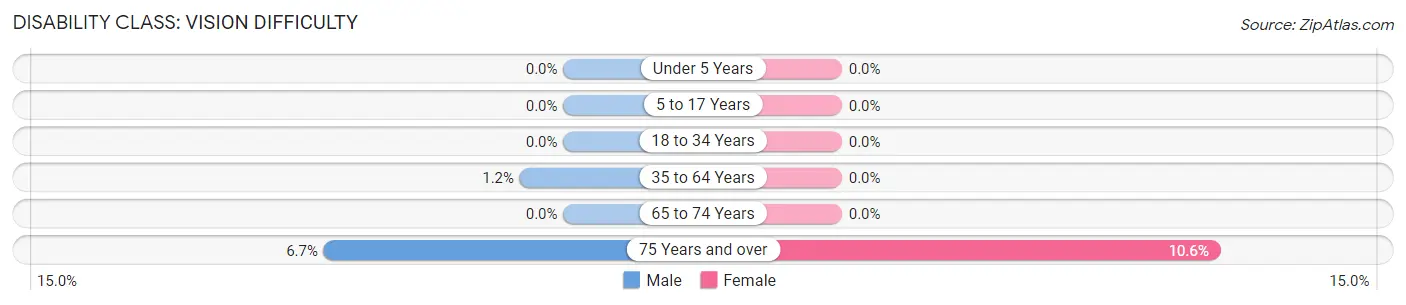
| Age Bracket | Male | Female |
| Under 5 Years | 0 (0.0%) | 0 (0.0%) |
| 5 to 17 Years | 0 (0.0%) | 0 (0.0%) |
| 18 to 34 Years | 0 (0.0%) | 0 (0.0%) |
| 35 to 64 Years | 11 (1.2%) | 0 (0.0%) |
| 65 to 74 Years | 0 (0.0%) | 0 (0.0%) |
| 75 Years and over | 9 (6.7%) | 23 (10.5%) |
Disability Class: Cognitive Difficulty
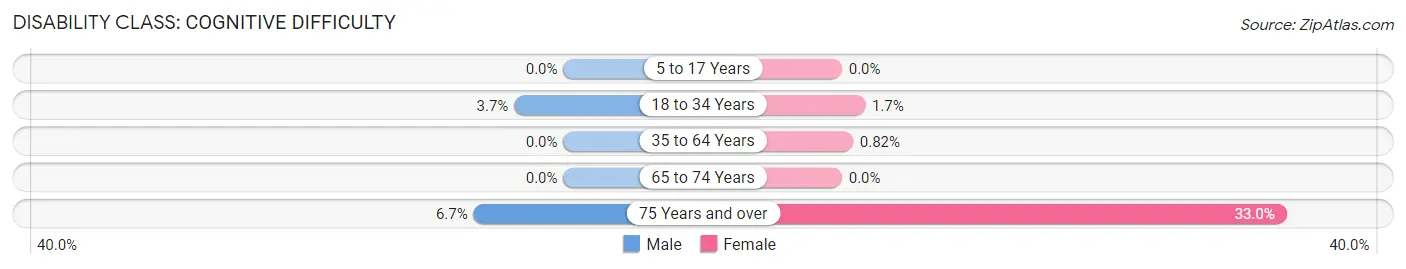
| Age Bracket | Male | Female |
| 5 to 17 Years | 0 (0.0%) | 0 (0.0%) |
| 18 to 34 Years | 10 (3.6%) | 7 (1.7%) |
| 35 to 64 Years | 0 (0.0%) | 9 (0.8%) |
| 65 to 74 Years | 0 (0.0%) | 0 (0.0%) |
| 75 Years and over | 9 (6.7%) | 72 (33.0%) |
Disability Class: Ambulatory Difficulty
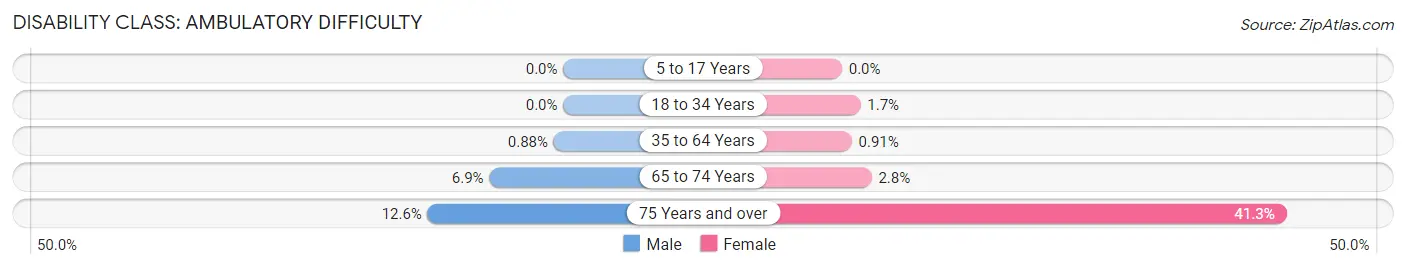
| Age Bracket | Male | Female |
| 5 to 17 Years | 0 (0.0%) | 0 (0.0%) |
| 18 to 34 Years | 0 (0.0%) | 7 (1.7%) |
| 35 to 64 Years | 8 (0.9%) | 10 (0.9%) |
| 65 to 74 Years | 26 (6.9%) | 9 (2.8%) |
| 75 Years and over | 17 (12.6%) | 90 (41.3%) |
Disability Class: Self-Care Difficulty
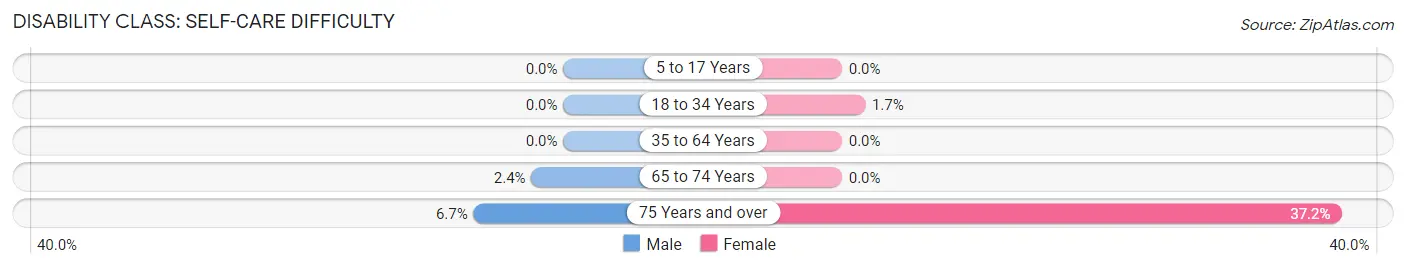
| Age Bracket | Male | Female |
| 5 to 17 Years | 0 (0.0%) | 0 (0.0%) |
| 18 to 34 Years | 0 (0.0%) | 7 (1.7%) |
| 35 to 64 Years | 0 (0.0%) | 0 (0.0%) |
| 65 to 74 Years | 9 (2.4%) | 0 (0.0%) |
| 75 Years and over | 9 (6.7%) | 81 (37.2%) |
Technology Access in Brielle borough
Computing Device Access in Brielle borough
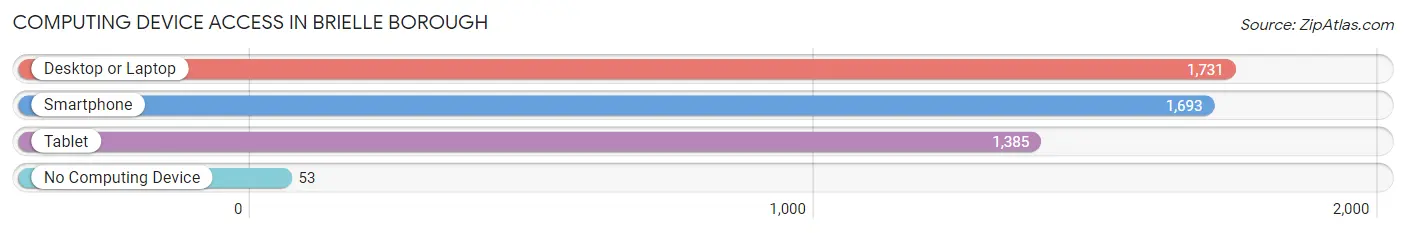
| Device Type | # Households | % Households |
| Desktop or Laptop | 1,731 | 93.8% |
| Smartphone | 1,693 | 91.7% |
| Tablet | 1,385 | 75.0% |
| No Computing Device | 53 | 2.9% |
| Total | 1,846 | 100.0% |
Internet Access in Brielle borough
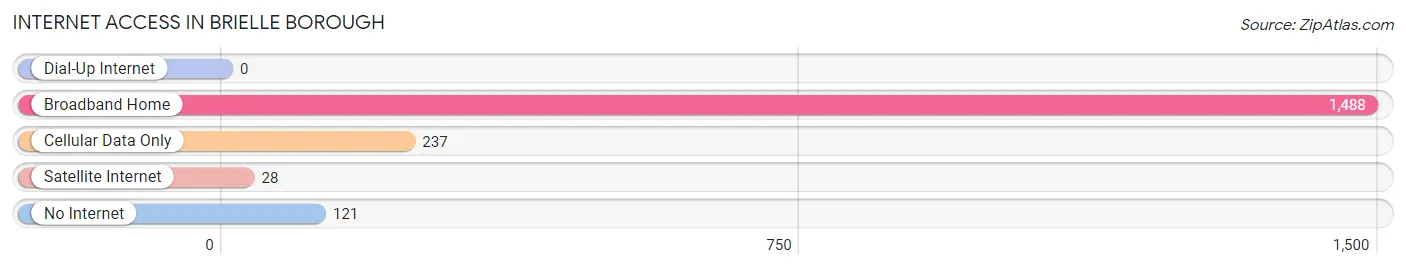
| Internet Type | # Households | % Households |
| Dial-Up Internet | 0 | 0.0% |
| Broadband Home | 1,488 | 80.6% |
| Cellular Data Only | 237 | 12.8% |
| Satellite Internet | 28 | 1.5% |
| No Internet | 121 | 6.6% |
| Total | 1,846 | 100.0% |
Brielle borough Summary
Brielle Borough is a small borough located in Monmouth County, New Jersey. It is situated on the Manasquan River, and is part of the Bayshore region. The borough has a population of 4,774 as of the 2010 census, and is home to a variety of businesses, including a marina, a yacht club, and a golf course.
Geography
Brielle Borough is located in the northern part of Monmouth County, New Jersey. It is situated on the Manasquan River, and is part of the Bayshore region. The borough is bordered by Manasquan to the north, Wall Township to the east, Point Pleasant Beach to the south, and the Atlantic Ocean to the west. The borough covers an area of 1.3 square miles, and is home to a variety of businesses, including a marina, a yacht club, and a golf course.
History
Brielle Borough was originally inhabited by the Lenape Native Americans. The area was first settled by Europeans in the late 17th century, and was known as Brielle Point. The borough was officially incorporated in 1917, and was named after the Dutch town of Brielle. The borough was originally a fishing and farming community, and was home to a variety of businesses, including a marina, a yacht club, and a golf course.
Economy
Brielle Borough is home to a variety of businesses, including a marina, a yacht club, and a golf course. The borough is also home to a number of restaurants, retail stores, and other businesses. The borough is also home to a number of manufacturing companies, including a plastics manufacturer and a metal fabricator.
Demographics
As of the 2010 census, Brielle Borough had a population of 4,774. The racial makeup of the borough was 94.3% White, 1.7% African American, 0.2% Native American, 1.7% Asian, 0.1% Pacific Islander, 0.9% from other races, and 1.2% from two or more races. Hispanic or Latino of any race were 4.2% of the population.
The median income for a household in the borough was $76,944, and the median income for a family was $90,917. The per capita income for the borough was $37,945. About 2.7% of families and 3.7% of the population were below the poverty line, including 4.2% of those under age 18 and 4.2% of those age 65 or over.
Conclusion
Brielle Borough is a small borough located in Monmouth County, New Jersey. It is situated on the Manasquan River, and is part of the Bayshore region. The borough has a population of 4,774 as of the 2010 census, and is home to a variety of businesses, including a marina, a yacht club, and a golf course. The borough is home to a variety of businesses, including a plastics manufacturer and a metal fabricator. The median income for a household in the borough was $76,944, and the median income for a family was $90,917. Brielle Borough is a vibrant community with a rich history and a diverse population.
Common Questions
What is the Total Population of Brielle borough?
Total Population of Brielle borough is 4,957.
What is the Total Male Population of Brielle borough?
Total Male Population of Brielle borough is 2,273.
What is the Total Female Population of Brielle borough?
Total Female Population of Brielle borough is 2,684.
What is the Ratio of Males per 100 Females in Brielle borough?
There are 84.69 Males per 100 Females in Brielle borough.
What is the Ratio of Females per 100 Males in Brielle borough?
There are 118.08 Females per 100 Males in Brielle borough.
What is the Median Population Age in Brielle borough?
Median Population Age in Brielle borough is 46.7 Years.
What is the Average Family Size in Brielle borough
Average Family Size in Brielle borough is 3.4 People.
What is the Average Household Size in Brielle borough
Average Household Size in Brielle borough is 2.7 People.
What is Per Capita Income in Brielle borough?
Per Capita income in Brielle borough is $81,236.
What is the Median Family Income in Brielle borough?
Median Family Income in Brielle borough is $169,676.
What is the Median Household income in Brielle borough?
Median Household Income in Brielle borough is $160,845.
What is Income or Wage Gap in Brielle borough?
Income or Wage Gap in Brielle borough is 65.5%.
Women in Brielle borough earn 34.5 cents for every dollar earned by a man.
What is Inequality or Gini Index in Brielle borough?
Inequality or Gini Index in Brielle borough is 0.46.
How Large is the Labor Force in Brielle borough?
There are 2,605 People in the Labor Forcein in Brielle borough.
What is the Percentage of People in the Labor Force in Brielle borough?
68.0% of People are in the Labor Force in Brielle borough.
What is the Unemployment Rate in Brielle borough?
Unemployment Rate in Brielle borough is 6.1%.