Tabor City, NC
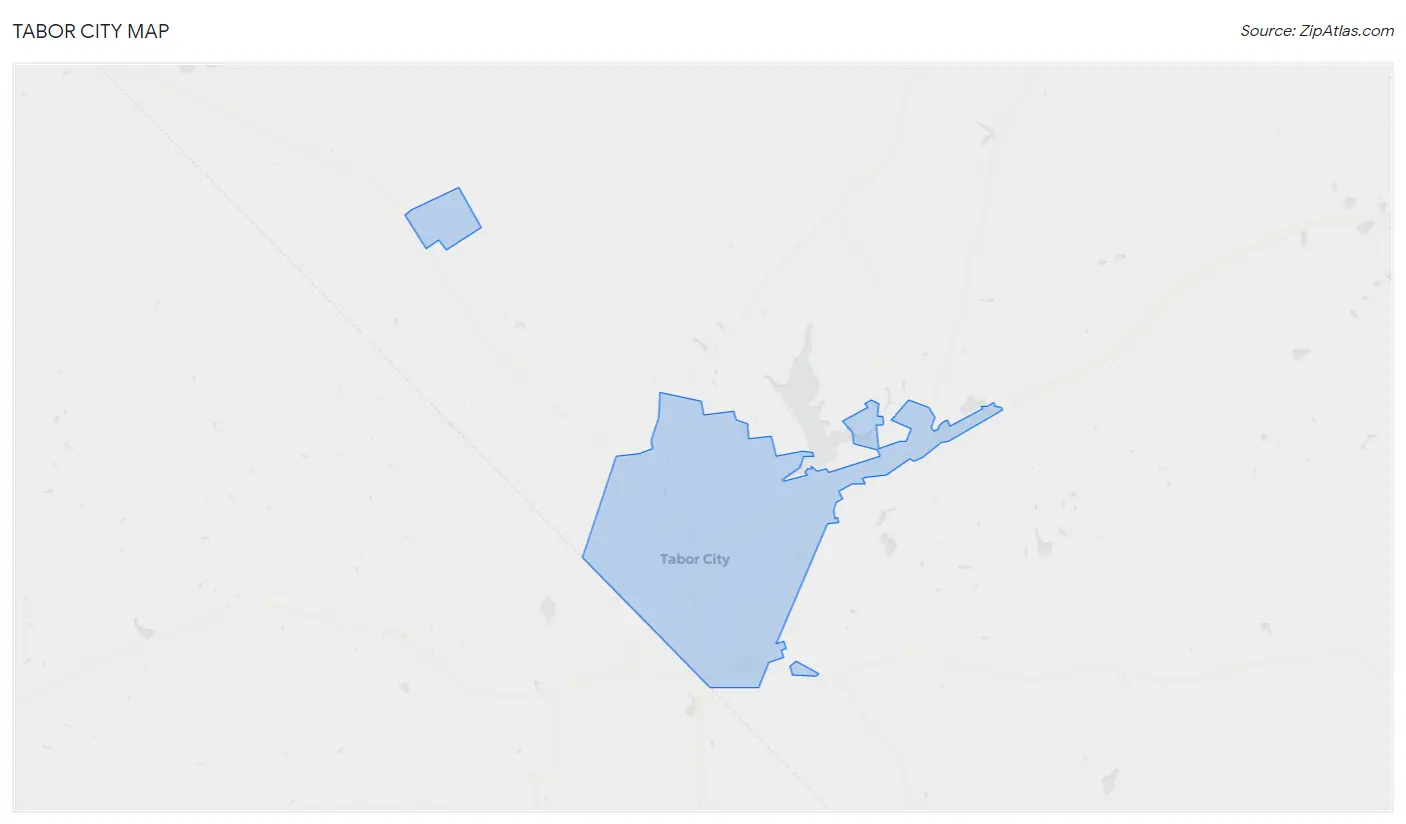
Tabor City Map
Tabor City Overview
3,709
TOTAL POPULATION
2,316
MALE POPULATION
1,393
FEMALE POPULATION
166.26
MALES / 100 FEMALES
60.15
FEMALES / 100 MALES
41.6
MEDIAN AGE
3.2
AVG FAMILY SIZE
2.6
AVG HOUSEHOLD SIZE
$16,230
PER CAPITA INCOME
$43,710
AVG FAMILY INCOME
$34,722
AVG HOUSEHOLD INCOME
57.0%
WAGE / INCOME GAP [ % ]
43.0¢/ $1
WAGE / INCOME GAP [ $ ]
$9,491
FAMILY INCOME DEFICIT
0.53
INEQUALITY / GINI INDEX
819
LABOR FORCE [ PEOPLE ]
25.5%
PERCENT IN LABOR FORCE
6.1%
UNEMPLOYMENT RATE
Tabor City Zip Codes
Tabor City Area Codes
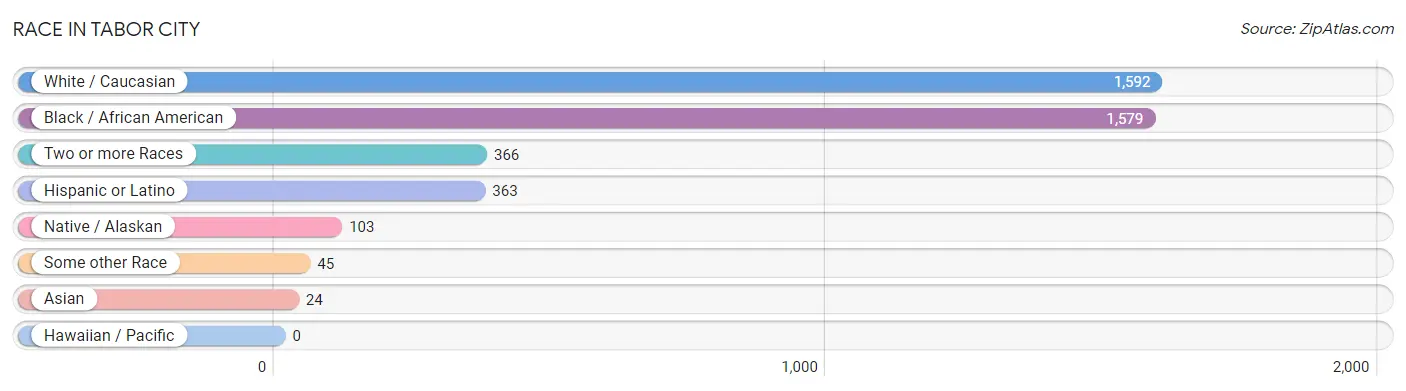
Race in Tabor City
The most populous races in Tabor City are White / Caucasian (1,592 | 42.9%), Black / African American (1,579 | 42.6%), and Two or more Races (366 | 9.9%).
| Race | # Population | % Population |
| Asian | 24 | 0.6% |
| Black / African American | 1,579 | 42.6% |
| Hawaiian / Pacific | 0 | 0.0% |
| Hispanic or Latino | 363 | 9.8% |
| Native / Alaskan | 103 | 2.8% |
| White / Caucasian | 1,592 | 42.9% |
| Two or more Races | 366 | 9.9% |
| Some other Race | 45 | 1.2% |
| Total | 3,709 | 100.0% |
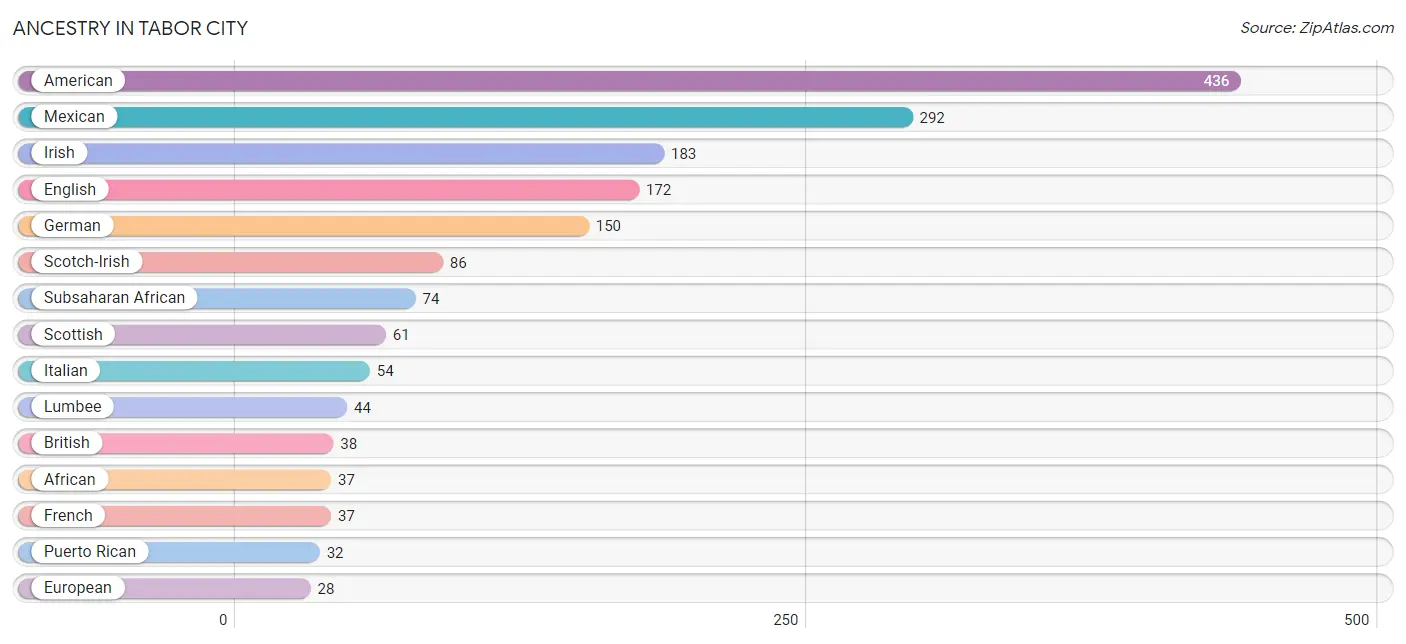
Ancestry in Tabor City
The most populous ancestries reported in Tabor City are American (436 | 11.8%), Mexican (292 | 7.9%), Irish (183 | 4.9%), English (172 | 4.6%), and German (150 | 4.0%), together accounting for 33.2% of all Tabor City residents.
| Ancestry | # Population | % Population |
| African | 37 | 1.0% |
| American | 436 | 11.8% |
| Arab | 10 | 0.3% |
| British | 38 | 1.0% |
| Burmese | 13 | 0.4% |
| Central American | 17 | 0.5% |
| Cherokee | 22 | 0.6% |
| Dominican | 10 | 0.3% |
| Dutch | 7 | 0.2% |
| Eastern European | 13 | 0.4% |
| English | 172 | 4.6% |
| Ethiopian | 11 | 0.3% |
| European | 28 | 0.7% |
| French | 37 | 1.0% |
| German | 150 | 4.0% |
| Guyanese | 7 | 0.2% |
| Irish | 183 | 4.9% |
| Italian | 54 | 1.5% |
| Liberian | 9 | 0.2% |
| Lumbee | 44 | 1.2% |
| Macedonian | 7 | 0.2% |
| Mexican | 292 | 7.9% |
| Mexican American Indian | 21 | 0.6% |
| Native Hawaiian | 4 | 0.1% |
| Nigerian | 17 | 0.5% |
| Norwegian | 9 | 0.2% |
| Palestinian | 10 | 0.3% |
| Polish | 21 | 0.6% |
| Portuguese | 18 | 0.5% |
| Puerto Rican | 32 | 0.9% |
| Salvadoran | 17 | 0.5% |
| Scotch-Irish | 86 | 2.3% |
| Scottish | 61 | 1.6% |
| Spanish | 12 | 0.3% |
| Subsaharan African | 74 | 2.0% |
| Trinidadian and Tobagonian | 9 | 0.2% |
| Ukrainian | 7 | 0.2% |
| Welsh | 10 | 0.3% | View All 38 Rows |
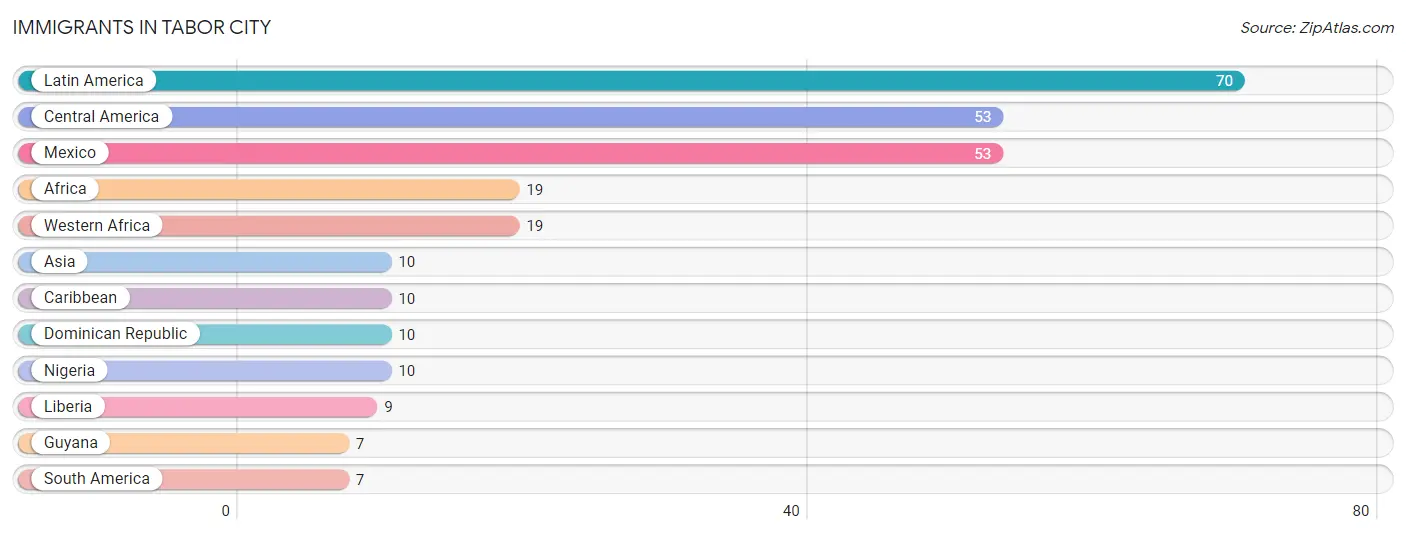
Immigrants in Tabor City
The most numerous immigrant groups reported in Tabor City came from Latin America (70 | 1.9%), Central America (53 | 1.4%), Mexico (53 | 1.4%), Africa (19 | 0.5%), and Western Africa (19 | 0.5%), together accounting for 5.8% of all Tabor City residents.
| Immigration Origin | # Population | % Population |
| Africa | 19 | 0.5% |
| Asia | 10 | 0.3% |
| Caribbean | 10 | 0.3% |
| Central America | 53 | 1.4% |
| Dominican Republic | 10 | 0.3% |
| Guyana | 7 | 0.2% |
| Latin America | 70 | 1.9% |
| Liberia | 9 | 0.2% |
| Mexico | 53 | 1.4% |
| Nigeria | 10 | 0.3% |
| South America | 7 | 0.2% |
| Western Africa | 19 | 0.5% | View All 12 Rows |
Sex and Age in Tabor City
Sex and Age in Tabor City
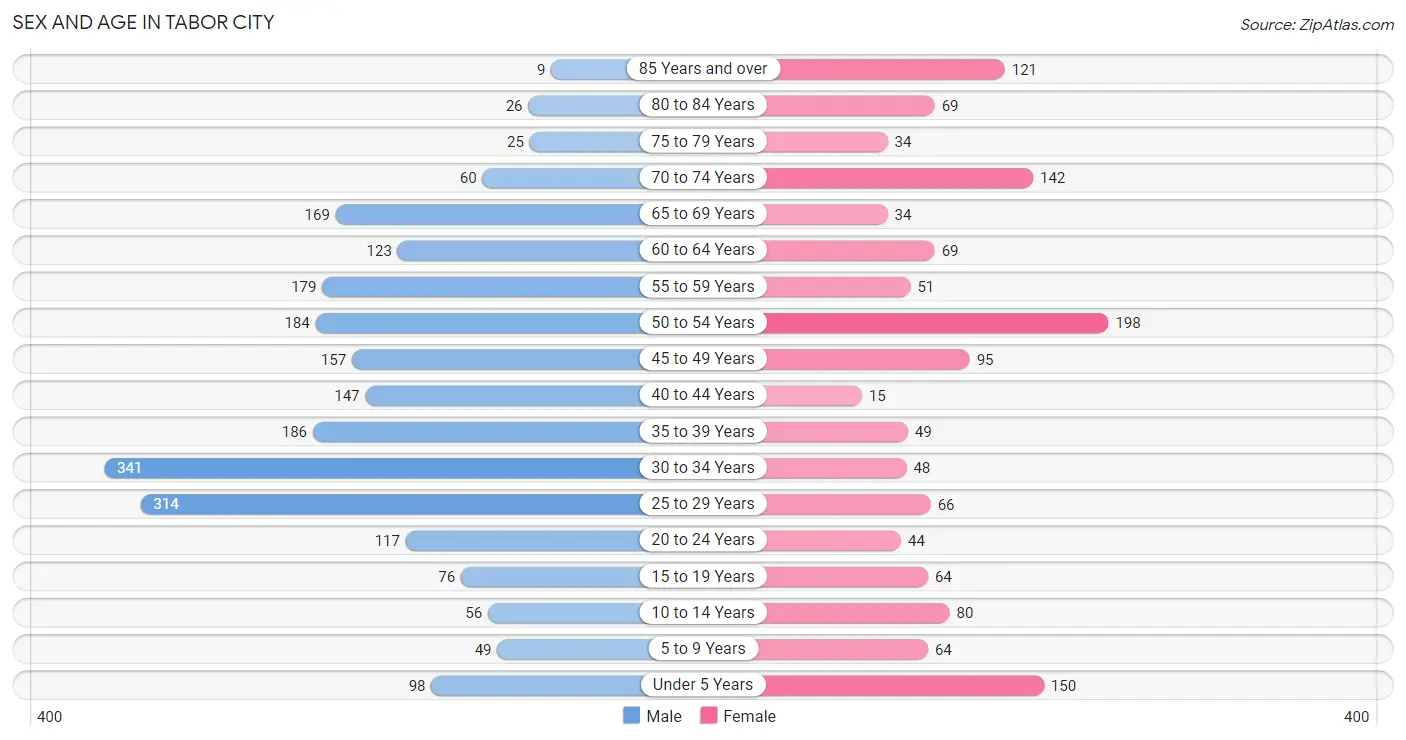
The most populous age groups in Tabor City are 30 to 34 Years (341 | 14.7%) for men and 50 to 54 Years (198 | 14.2%) for women.
| Age Bracket | Male | Female |
| Under 5 Years | 98 (4.2%) | 150 (10.8%) |
| 5 to 9 Years | 49 (2.1%) | 64 (4.6%) |
| 10 to 14 Years | 56 (2.4%) | 80 (5.7%) |
| 15 to 19 Years | 76 (3.3%) | 64 (4.6%) |
| 20 to 24 Years | 117 (5.1%) | 44 (3.2%) |
| 25 to 29 Years | 314 (13.6%) | 66 (4.7%) |
| 30 to 34 Years | 341 (14.7%) | 48 (3.5%) |
| 35 to 39 Years | 186 (8.0%) | 49 (3.5%) |
| 40 to 44 Years | 147 (6.4%) | 15 (1.1%) |
| 45 to 49 Years | 157 (6.8%) | 95 (6.8%) |
| 50 to 54 Years | 184 (7.9%) | 198 (14.2%) |
| 55 to 59 Years | 179 (7.7%) | 51 (3.7%) |
| 60 to 64 Years | 123 (5.3%) | 69 (5.0%) |
| 65 to 69 Years | 169 (7.3%) | 34 (2.4%) |
| 70 to 74 Years | 60 (2.6%) | 142 (10.2%) |
| 75 to 79 Years | 25 (1.1%) | 34 (2.4%) |
| 80 to 84 Years | 26 (1.1%) | 69 (5.0%) |
| 85 Years and over | 9 (0.4%) | 121 (8.7%) |
| Total | 2,316 (100.0%) | 1,393 (100.0%) |
Families and Households in Tabor City
Median Family Size in Tabor City
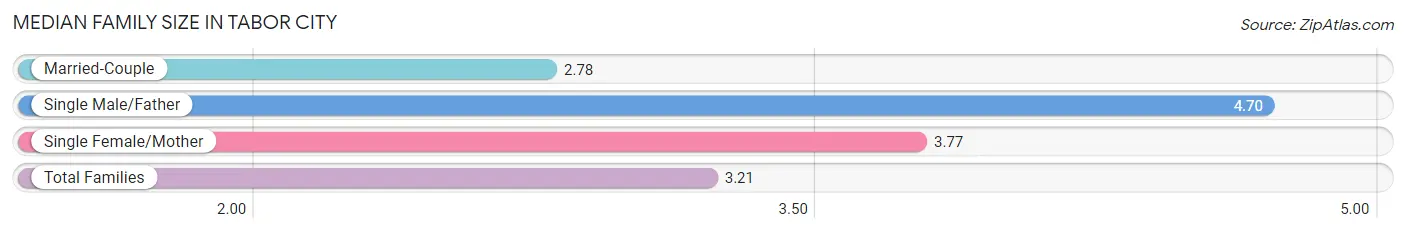
The median family size in Tabor City is 3.21 persons per family, with single male/father families (10 | 1.7%) accounting for the largest median family size of 4.7 persons per family. On the other hand, married-couple families (340 | 58.6%) represent the smallest median family size with 2.78 persons per family.
| Family Type | # Families | Family Size |
| Married-Couple | 340 (58.6%) | 2.78 |
| Single Male/Father | 10 (1.7%) | 4.70 |
| Single Female/Mother | 230 (39.7%) | 3.77 |
| Total Families | 580 (100.0%) | 3.21 |
Median Household Size in Tabor City
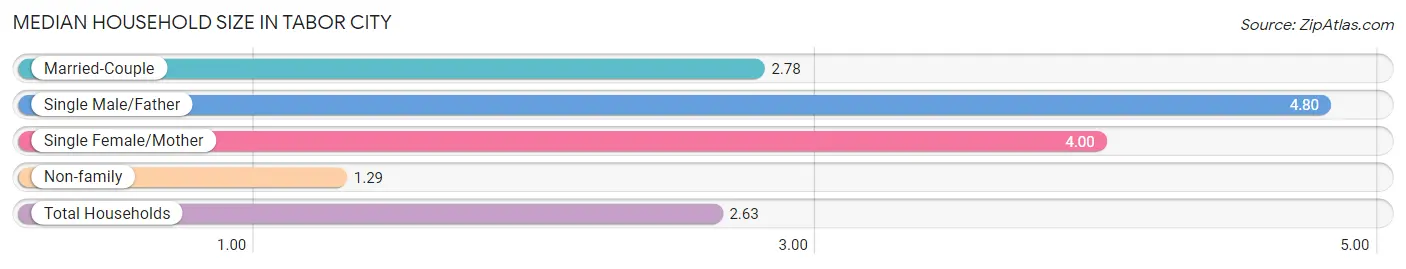
The median household size in Tabor City is 2.63 persons per household, with single male/father households (10 | 1.1%) accounting for the largest median household size of 4.8 persons per household. non-family households (286 | 33.0%) represent the smallest median household size with 1.29 persons per household.
| Household Type | # Households | Household Size |
| Married-Couple | 340 (39.3%) | 2.78 |
| Single Male/Father | 10 (1.1%) | 4.80 |
| Single Female/Mother | 230 (26.6%) | 4.00 |
| Non-family | 286 (33.0%) | 1.29 |
| Total Households | 866 (100.0%) | 2.63 |
Household Size by Marriage Status in Tabor City
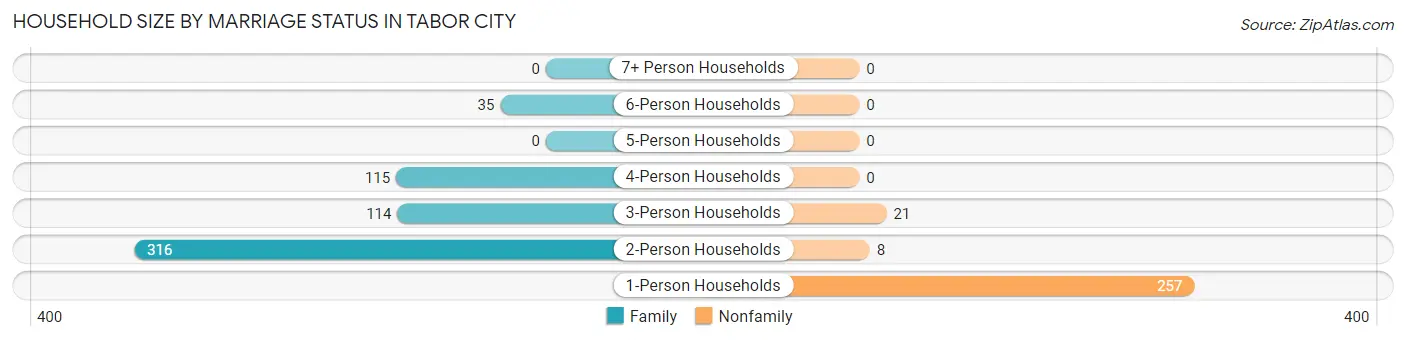
Out of a total of 866 households in Tabor City, 580 (67.0%) are family households, while 286 (33.0%) are nonfamily households. The most numerous type of family households are 2-person households, comprising 316, and the most common type of nonfamily households are 1-person households, comprising 257.
| Household Size | Family Households | Nonfamily Households |
| 1-Person Households | - | 257 (29.7%) |
| 2-Person Households | 316 (36.5%) | 8 (0.9%) |
| 3-Person Households | 114 (13.2%) | 21 (2.4%) |
| 4-Person Households | 115 (13.3%) | 0 (0.0%) |
| 5-Person Households | 0 (0.0%) | 0 (0.0%) |
| 6-Person Households | 35 (4.0%) | 0 (0.0%) |
| 7+ Person Households | 0 (0.0%) | 0 (0.0%) |
| Total | 580 (67.0%) | 286 (33.0%) |
Female Fertility in Tabor City
Fertility by Age in Tabor City
Average fertility rate in Tabor City is 131.0 births per 1,000 women. Women in the age bracket of 15 to 19 years have the highest fertility rate with 422.0 births per 1,000 women. Women in the age bracket of 20 to 34 years acount for 51.8% of all women with births.
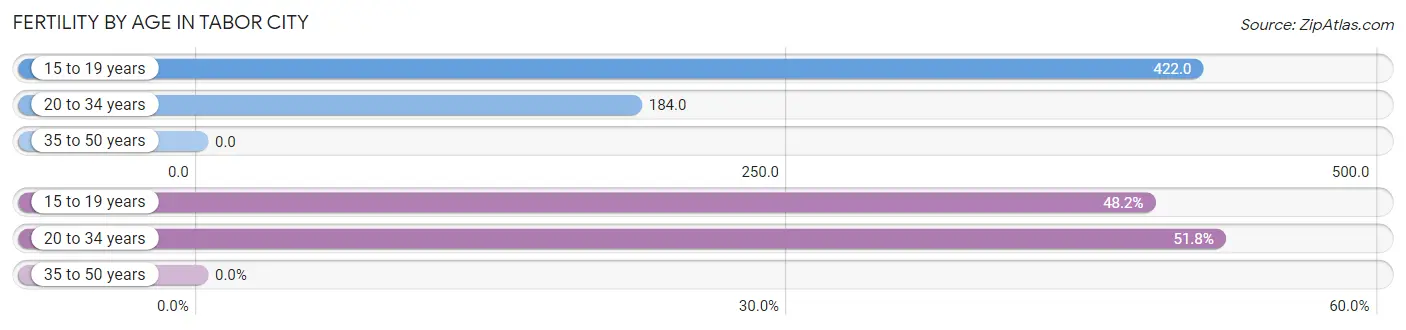
| Age Bracket | Women with Births | Births / 1,000 Women |
| 15 to 19 years | 27 (48.2%) | 422.0 |
| 20 to 34 years | 29 (51.8%) | 184.0 |
| 35 to 50 years | 0 (0.0%) | 0.0 |
| Total | 56 (100.0%) | 131.0 |
Fertility by Age by Marriage Status in Tabor City
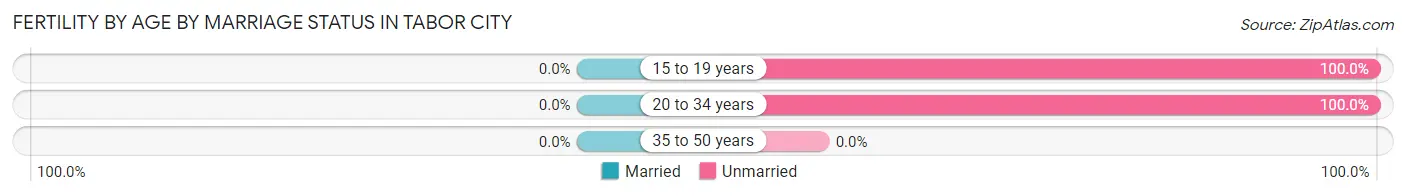
| Age Bracket | Married | Unmarried |
| 15 to 19 years | 0 (0.0%) | 27 (100.0%) |
| 20 to 34 years | 0 (0.0%) | 29 (100.0%) |
| 35 to 50 years | 0 (0.0%) | 0 (0.0%) |
| Total | 0 (0.0%) | 56 (100.0%) |
Fertility by Education in Tabor City
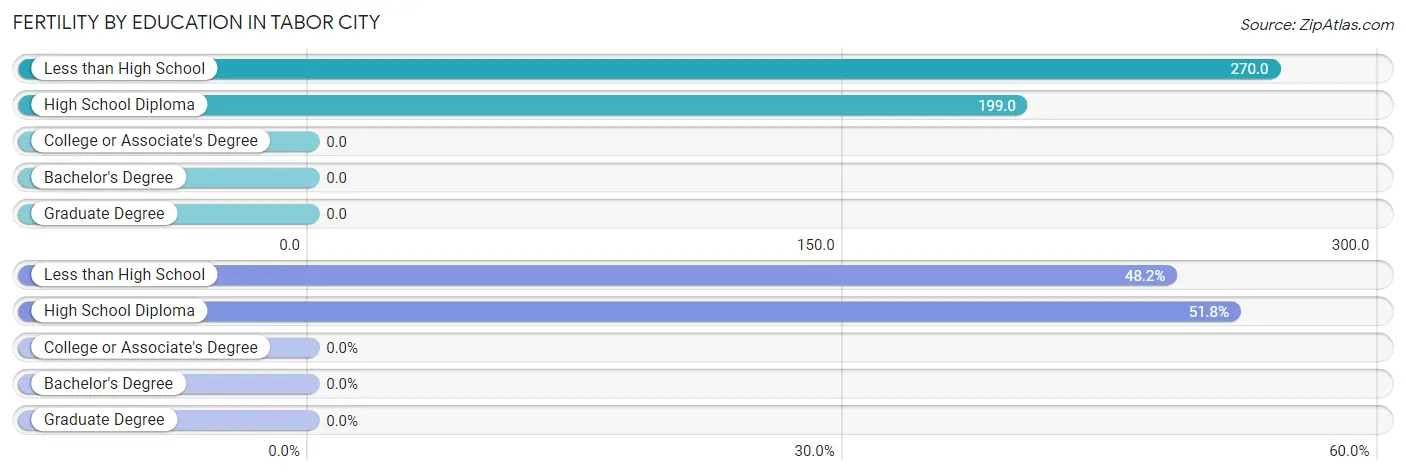
| Educational Attainment | Women with Births | Births / 1,000 Women |
| Less than High School | 27 (48.2%) | 270.0 |
| High School Diploma | 29 (51.8%) | 199.0 |
| College or Associate's Degree | 0 (0.0%) | 0.0 |
| Bachelor's Degree | 0 (0.0%) | 0.0 |
| Graduate Degree | 0 (0.0%) | 0.0 |
| Total | 56 (100.0%) | 131.0 |
Fertility by Education by Marriage Status in Tabor City
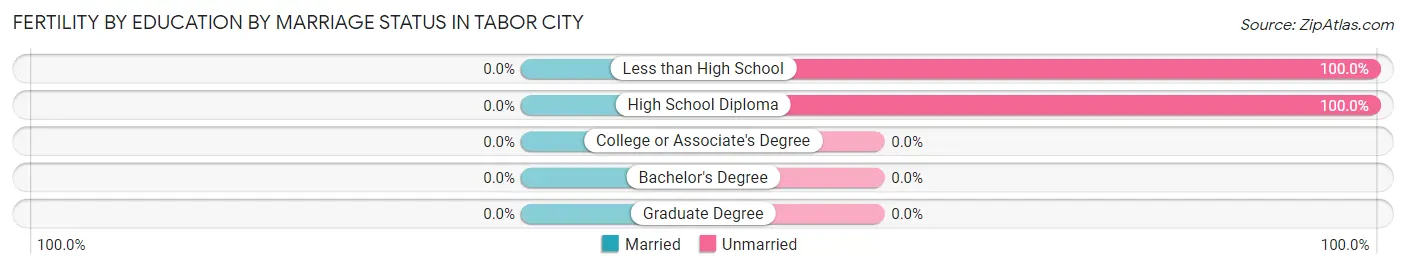
| Educational Attainment | Married | Unmarried |
| Less than High School | 0 (0.0%) | 27 (100.0%) |
| High School Diploma | 0 (0.0%) | 29 (100.0%) |
| College or Associate's Degree | 0 (0.0%) | 0 (0.0%) |
| Bachelor's Degree | 0 (0.0%) | 0 (0.0%) |
| Graduate Degree | 0 (0.0%) | 0 (0.0%) |
| Total | 0 (0.0%) | 56 (100.0%) |
Income in Tabor City
Income Overview in Tabor City
Per Capita Income in Tabor City is $16,230, while median incomes of families and households are $43,710 and $34,722 respectively.
| Characteristic | Number | Measure |
| Per Capita Income | 3,709 | $16,230 |
| Median Family Income | 580 | $43,710 |
| Mean Family Income | 580 | $69,939 |
| Median Household Income | 866 | $34,722 |
| Mean Household Income | 866 | $58,813 |
| Income Deficit | 580 | $9,491 |
| Wage / Income Gap (%) | 3,709 | 56.96% |
| Wage / Income Gap ($) | 3,709 | 43.04¢ per $1 |
| Gini / Inequality Index | 3,709 | 0.53 |
Earnings by Sex in Tabor City
Average Earnings in Tabor City are $16,452, $10,691 for men and $24,840 for women, a difference of 57.0%.
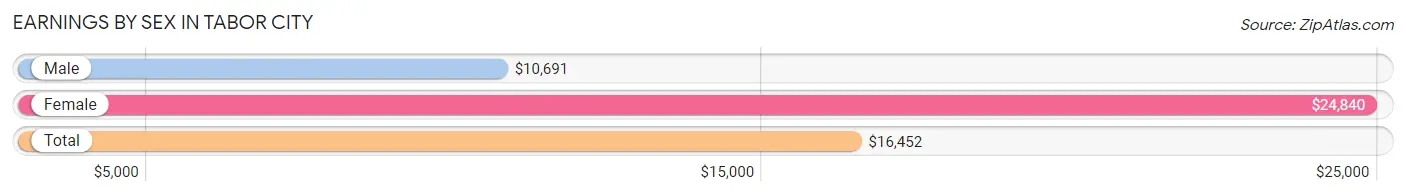
| Sex | Number | Average Earnings |
| Male | 1,028 (67.4%) | $10,691 |
| Female | 496 (32.6%) | $24,840 |
| Total | 1,524 (100.0%) | $16,452 |
Earnings by Sex by Income Bracket in Tabor City
The most common earnings brackets in Tabor City are $2,499 or less for men (214 | 20.8%) and $22,500 to $24,999 for women (94 | 19.0%).
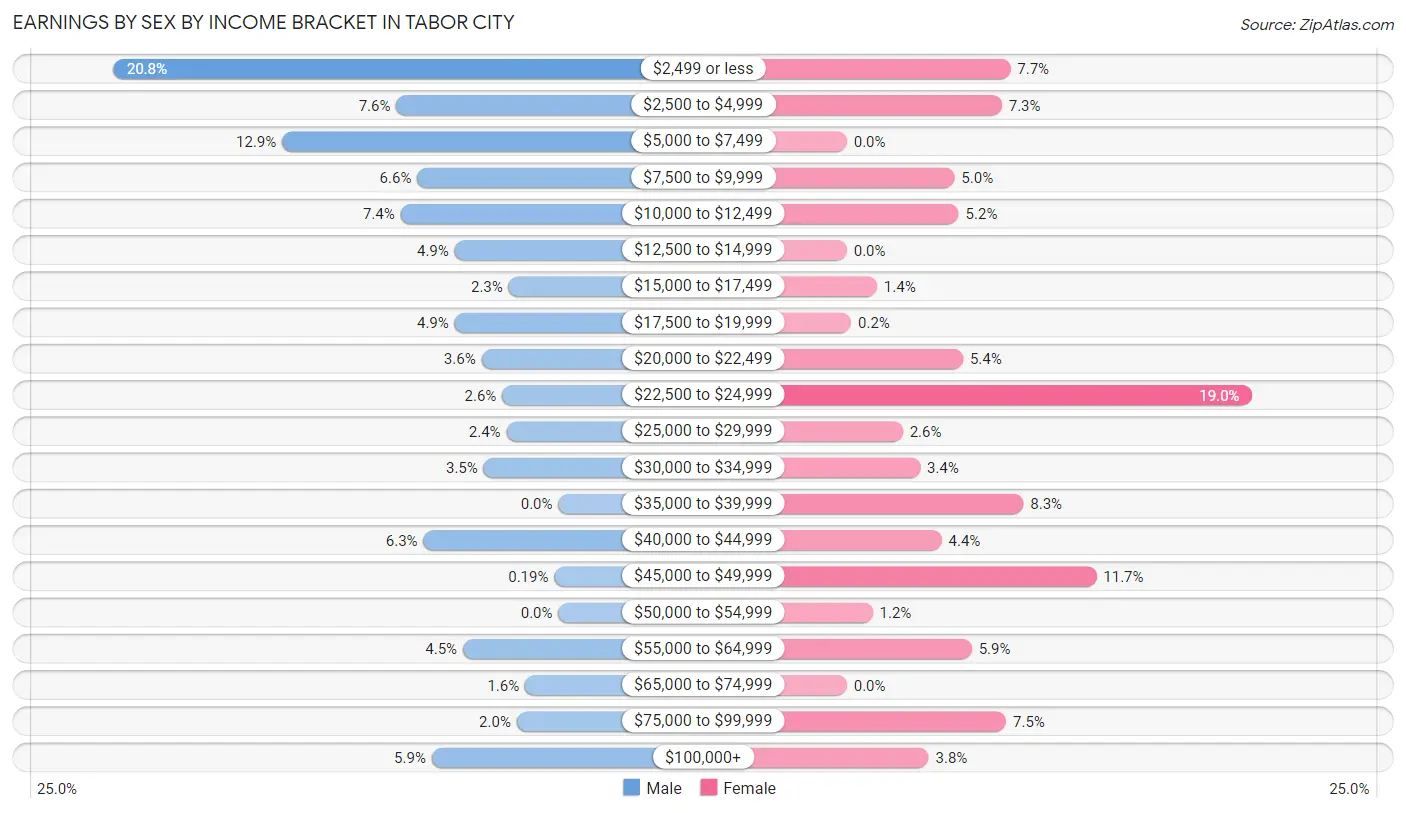
| Income | Male | Female |
| $2,499 or less | 214 (20.8%) | 38 (7.7%) |
| $2,500 to $4,999 | 78 (7.6%) | 36 (7.3%) |
| $5,000 to $7,499 | 133 (12.9%) | 0 (0.0%) |
| $7,500 to $9,999 | 68 (6.6%) | 25 (5.0%) |
| $10,000 to $12,499 | 76 (7.4%) | 26 (5.2%) |
| $12,500 to $14,999 | 50 (4.9%) | 0 (0.0%) |
| $15,000 to $17,499 | 24 (2.3%) | 7 (1.4%) |
| $17,500 to $19,999 | 50 (4.9%) | 1 (0.2%) |
| $20,000 to $22,499 | 37 (3.6%) | 27 (5.4%) |
| $22,500 to $24,999 | 27 (2.6%) | 94 (19.0%) |
| $25,000 to $29,999 | 25 (2.4%) | 13 (2.6%) |
| $30,000 to $34,999 | 36 (3.5%) | 17 (3.4%) |
| $35,000 to $39,999 | 0 (0.0%) | 41 (8.3%) |
| $40,000 to $44,999 | 65 (6.3%) | 22 (4.4%) |
| $45,000 to $49,999 | 2 (0.2%) | 58 (11.7%) |
| $50,000 to $54,999 | 0 (0.0%) | 6 (1.2%) |
| $55,000 to $64,999 | 46 (4.5%) | 29 (5.9%) |
| $65,000 to $74,999 | 16 (1.6%) | 0 (0.0%) |
| $75,000 to $99,999 | 20 (1.9%) | 37 (7.5%) |
| $100,000+ | 61 (5.9%) | 19 (3.8%) |
| Total | 1,028 (100.0%) | 496 (100.0%) |
Earnings by Sex by Educational Attainment in Tabor City
Average earnings in Tabor City are $11,683 for men and $26,923 for women, a difference of 56.6%. Men with an educational attainment of high school diploma enjoy the highest average annual earnings of $13,690, while those with less than high school education earn the least with $6,808. Women with an educational attainment of bachelor's degree earn the most with the average annual earnings of $45,134, while those with college or associate's degree education have the smallest earnings of $35,972.
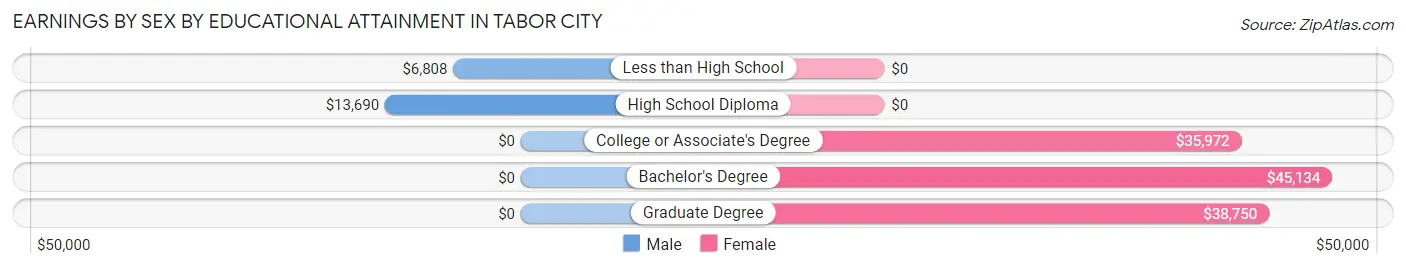
| Educational Attainment | Male Income | Female Income |
| Less than High School | $6,808 | $0 |
| High School Diploma | $13,690 | $0 |
| College or Associate's Degree | - | - |
| Bachelor's Degree | - | - |
| Graduate Degree | - | - |
| Total | $11,683 | $26,923 |
Family Income in Tabor City
Family Income Brackets in Tabor City
According to the Tabor City family income data, there are 145 families falling into the $35,000 to $49,999 income range, which is the most common income bracket and makes up 25.0% of all families. Conversely, the $50,000 to $74,999 income bracket is the least frequent group with only 28 families (4.8%) belonging to this category.
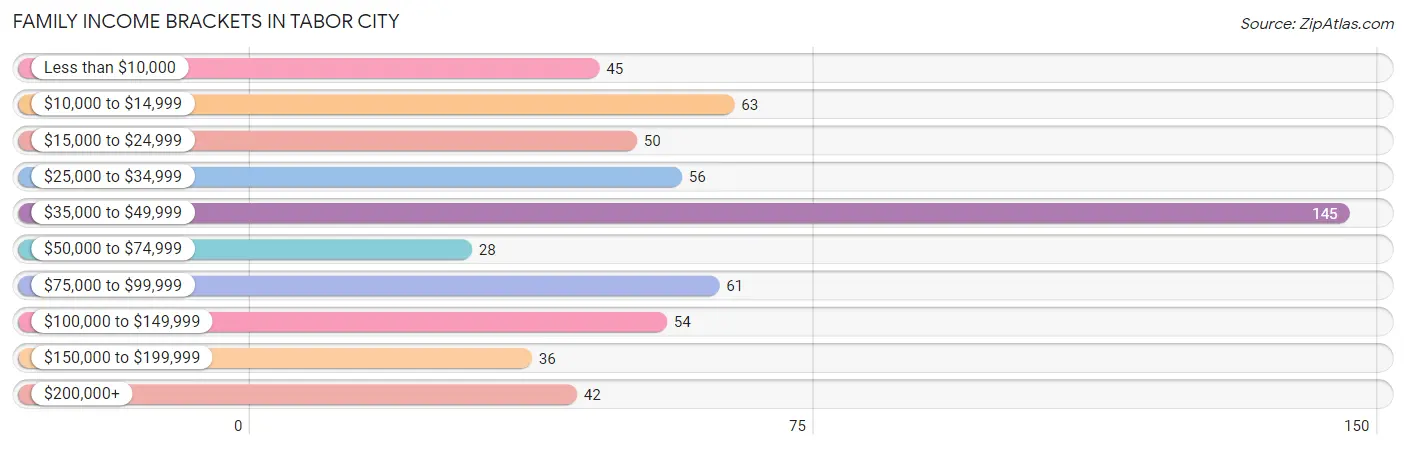
| Income Bracket | # Families | % Families |
| Less than $10,000 | 45 | 7.8% |
| $10,000 to $14,999 | 63 | 10.9% |
| $15,000 to $24,999 | 50 | 8.6% |
| $25,000 to $34,999 | 56 | 9.7% |
| $35,000 to $49,999 | 145 | 25.0% |
| $50,000 to $74,999 | 28 | 4.8% |
| $75,000 to $99,999 | 61 | 10.5% |
| $100,000 to $149,999 | 54 | 9.3% |
| $150,000 to $199,999 | 36 | 6.2% |
| $200,000+ | 42 | 7.2% |
Family Income by Famaliy Size in Tabor City
2-person families (325 | 56.0%) account for the highest median family income in Tabor City with $44,864 per family, while 2-person families (325 | 56.0%) have the highest median income of $22,432 per family member.
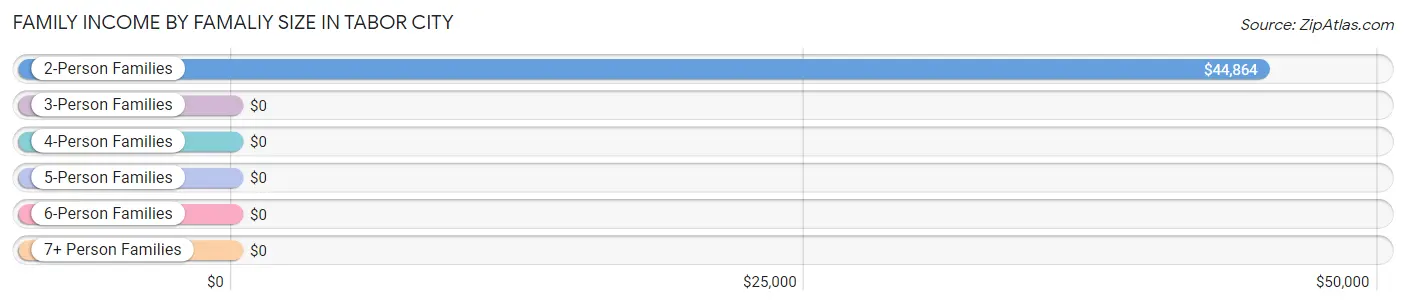
| Income Bracket | # Families | Median Income |
| 2-Person Families | 325 (56.0%) | $44,864 |
| 3-Person Families | 140 (24.1%) | $0 |
| 4-Person Families | 80 (13.8%) | $0 |
| 5-Person Families | 0 (0.0%) | $0 |
| 6-Person Families | 35 (6.0%) | $0 |
| 7+ Person Families | 0 (0.0%) | $0 |
| Total | 580 (100.0%) | $43,710 |
Family Income by Number of Earners in Tabor City
The median family income in Tabor City is $43,710, with families comprising 3+ earners (23) having the highest median family income of $149,554, while families with no earners (142) have the lowest median family income of $18,571, accounting for 4.0% and 24.5% of families, respectively.
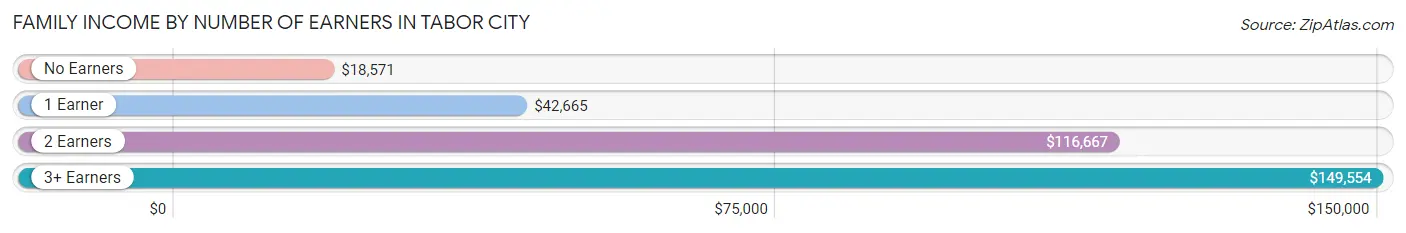
| Number of Earners | # Families | Median Income |
| No Earners | 142 (24.5%) | $18,571 |
| 1 Earner | 255 (44.0%) | $42,665 |
| 2 Earners | 160 (27.6%) | $116,667 |
| 3+ Earners | 23 (4.0%) | $149,554 |
| Total | 580 (100.0%) | $43,710 |
Household Income in Tabor City
Household Income Brackets in Tabor City
With 167 households falling in the category, the $10,000 to $14,999 income range is the most frequent in Tabor City, accounting for 19.3% of all households. In contrast, only 36 households (4.2%) fall into the $150,000 to $199,999 income bracket, making it the least populous group.
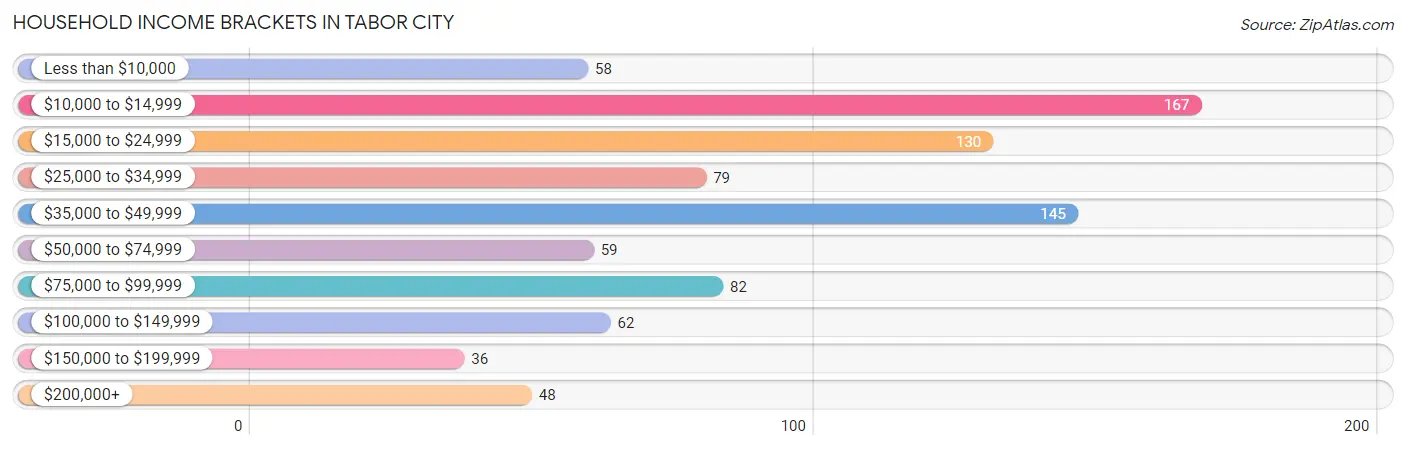
| Income Bracket | # Households | % Households |
| Less than $10,000 | 58 | 6.7% |
| $10,000 to $14,999 | 167 | 19.3% |
| $15,000 to $24,999 | 130 | 15.0% |
| $25,000 to $34,999 | 79 | 9.1% |
| $35,000 to $49,999 | 145 | 16.7% |
| $50,000 to $74,999 | 59 | 6.8% |
| $75,000 to $99,999 | 82 | 9.5% |
| $100,000 to $149,999 | 62 | 7.2% |
| $150,000 to $199,999 | 36 | 4.2% |
| $200,000+ | 48 | 5.5% |
Household Income by Householder Age in Tabor City
The median household income in Tabor City is $34,722, with the highest median household income of $46,354 found in the 25 to 44 years age bracket for the primary householder. A total of 143 households (16.5%) fall into this category. Meanwhile, the 65+ years age bracket for the primary householder has the lowest median household income of $0, with 338 households (39.0%) in this group.
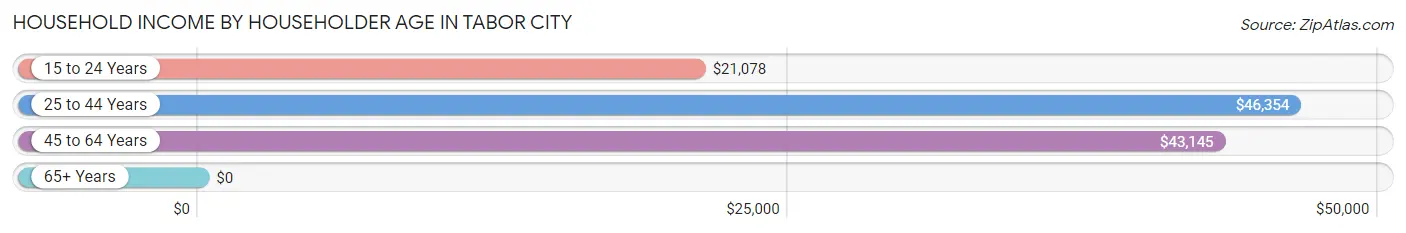
| Income Bracket | # Households | Median Income |
| 15 to 24 Years | 33 (3.8%) | $21,078 |
| 25 to 44 Years | 143 (16.5%) | $46,354 |
| 45 to 64 Years | 352 (40.6%) | $43,145 |
| 65+ Years | 338 (39.0%) | $0 |
| Total | 866 (100.0%) | $34,722 |
Poverty in Tabor City
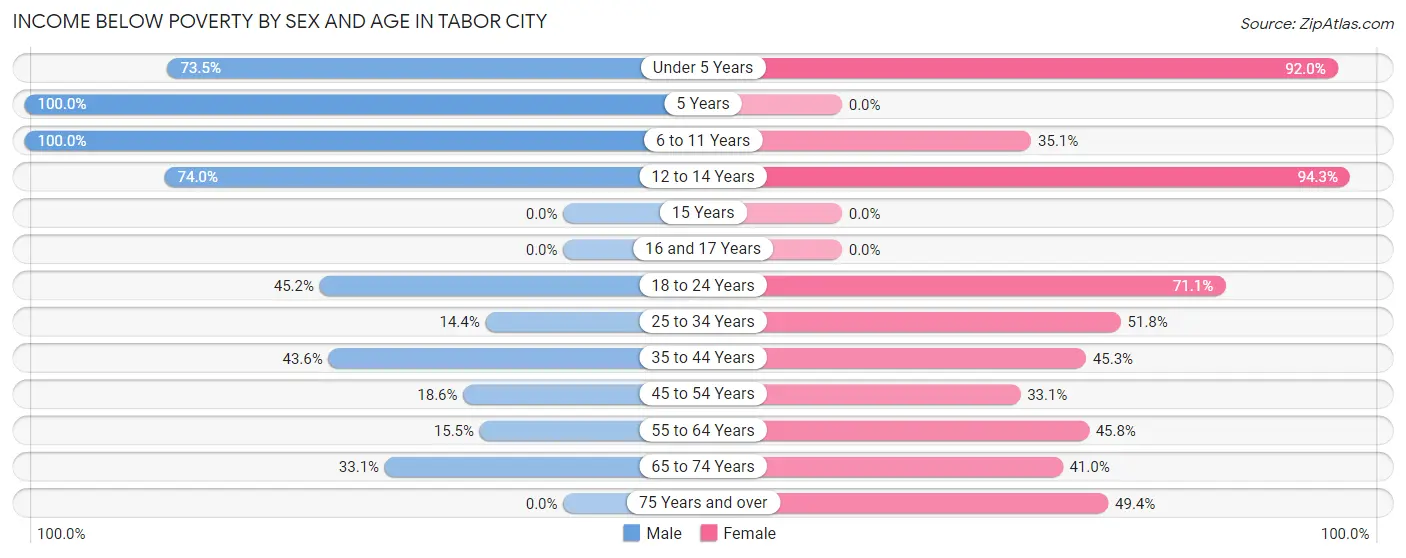
Income Below Poverty by Sex and Age in Tabor City
With 34.7% poverty level for males and 52.0% for females among the residents of Tabor City, 5 year old males and 12 to 14 year old females are the most vulnerable to poverty, with 36 males (100.0%) and 66 females (94.3%) in their respective age groups living below the poverty level.
| Age Bracket | Male | Female |
| Under 5 Years | 72 (73.5%) | 138 (92.0%) |
| 5 Years | 36 (100.0%) | 0 (0.0%) |
| 6 to 11 Years | 19 (100.0%) | 26 (35.1%) |
| 12 to 14 Years | 37 (74.0%) | 66 (94.3%) |
| 15 Years | 0 (0.0%) | 0 (0.0%) |
| 16 and 17 Years | 0 (0.0%) | 0 (0.0%) |
| 18 to 24 Years | 33 (45.2%) | 69 (71.1%) |
| 25 to 34 Years | 26 (14.4%) | 59 (51.7%) |
| 35 to 44 Years | 17 (43.6%) | 29 (45.3%) |
| 45 to 54 Years | 18 (18.6%) | 97 (33.1%) |
| 55 to 64 Years | 20 (15.5%) | 55 (45.8%) |
| 65 to 74 Years | 51 (33.1%) | 68 (41.0%) |
| 75 Years and over | 0 (0.0%) | 86 (49.4%) |
| Total | 329 (34.7%) | 693 (52.0%) |
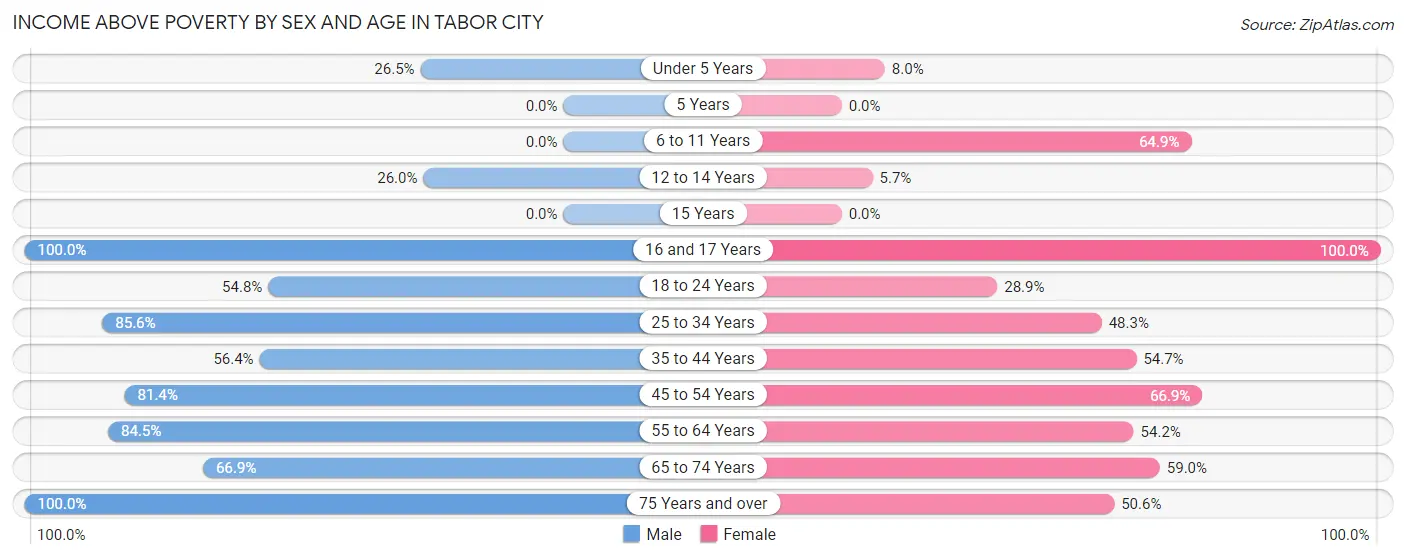
Income Above Poverty by Sex and Age in Tabor City
According to the poverty statistics in Tabor City, males aged 16 and 17 years and females aged 16 and 17 years are the age groups that are most secure financially, with 100.0% of males and 100.0% of females in these age groups living above the poverty line.
| Age Bracket | Male | Female |
| Under 5 Years | 26 (26.5%) | 12 (8.0%) |
| 5 Years | 0 (0.0%) | 0 (0.0%) |
| 6 to 11 Years | 0 (0.0%) | 48 (64.9%) |
| 12 to 14 Years | 13 (26.0%) | 4 (5.7%) |
| 15 Years | 0 (0.0%) | 0 (0.0%) |
| 16 and 17 Years | 12 (100.0%) | 11 (100.0%) |
| 18 to 24 Years | 40 (54.8%) | 28 (28.9%) |
| 25 to 34 Years | 154 (85.6%) | 55 (48.2%) |
| 35 to 44 Years | 22 (56.4%) | 35 (54.7%) |
| 45 to 54 Years | 79 (81.4%) | 196 (66.9%) |
| 55 to 64 Years | 109 (84.5%) | 65 (54.2%) |
| 65 to 74 Years | 103 (66.9%) | 98 (59.0%) |
| 75 Years and over | 60 (100.0%) | 88 (50.6%) |
| Total | 618 (65.3%) | 640 (48.0%) |
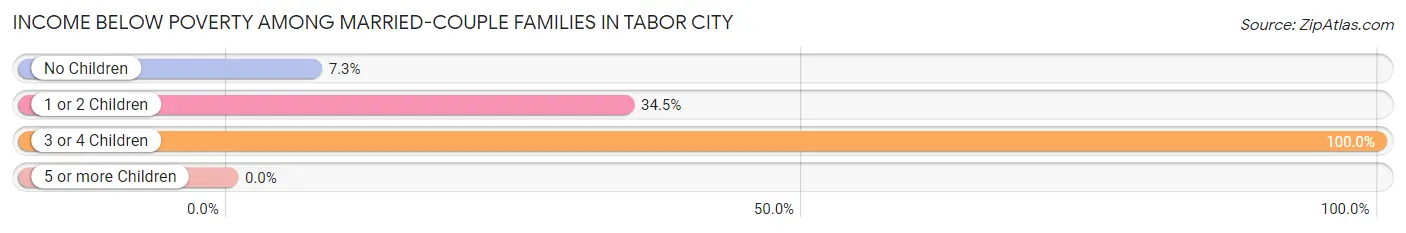
Income Below Poverty Among Married-Couple Families in Tabor City
The poverty statistics for married-couple families in Tabor City show that 15.9% or 54 of the total 340 families live below the poverty line. Families with 3 or 4 children have the highest poverty rate of 100.0%, comprising of 6 families. On the other hand, families with no children have the lowest poverty rate of 7.3%, which includes 18 families.
| Children | Above Poverty | Below Poverty |
| No Children | 229 (92.7%) | 18 (7.3%) |
| 1 or 2 Children | 57 (65.5%) | 30 (34.5%) |
| 3 or 4 Children | 0 (0.0%) | 6 (100.0%) |
| 5 or more Children | 0 (0.0%) | 0 (0.0%) |
| Total | 286 (84.1%) | 54 (15.9%) |
Income Below Poverty Among Single-Parent Households in Tabor City
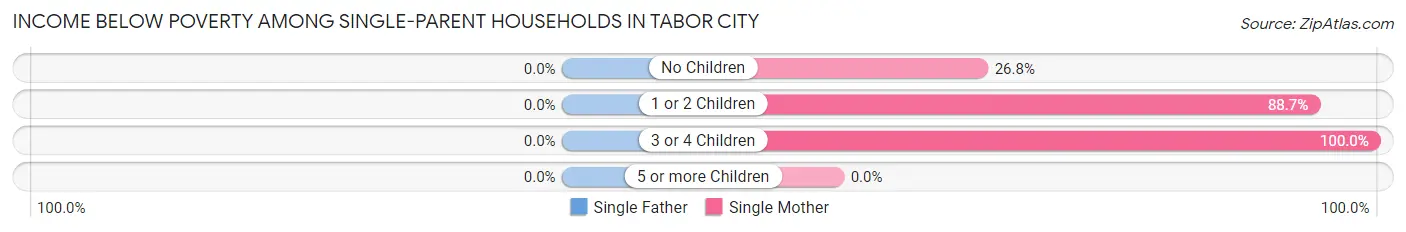
| Children | Single Father | Single Mother |
| No Children | 0 (0.0%) | 33 (26.8%) |
| 1 or 2 Children | 0 (0.0%) | 55 (88.7%) |
| 3 or 4 Children | 0 (0.0%) | 45 (100.0%) |
| 5 or more Children | 0 (0.0%) | 0 (0.0%) |
| Total | 0 (0.0%) | 133 (57.8%) |
Income Below Poverty Among Married-Couple vs Single-Parent Households in Tabor City
The poverty data for Tabor City shows that 54 of the married-couple family households (15.9%) and 133 of the single-parent households (55.4%) are living below the poverty level. Within the married-couple family households, those with 3 or 4 children have the highest poverty rate, with 6 households (100.0%) falling below the poverty line. Among the single-parent households, those with 3 or 4 children have the highest poverty rate, with 45 household (100.0%) living below poverty.
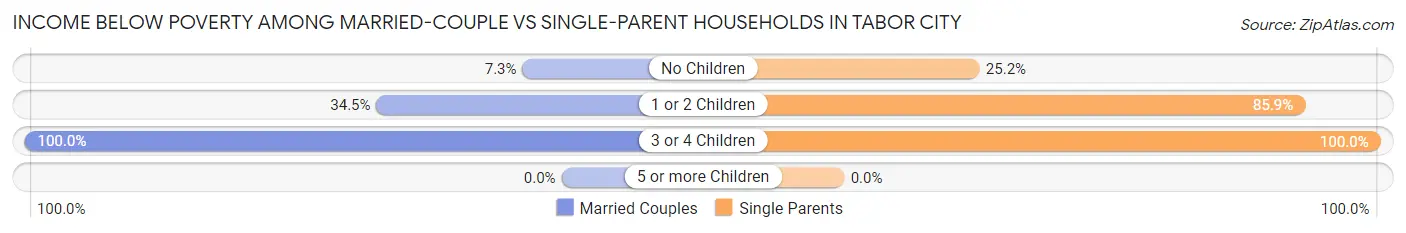
| Children | Married-Couple Families | Single-Parent Households |
| No Children | 18 (7.3%) | 33 (25.2%) |
| 1 or 2 Children | 30 (34.5%) | 55 (85.9%) |
| 3 or 4 Children | 6 (100.0%) | 45 (100.0%) |
| 5 or more Children | 0 (0.0%) | 0 (0.0%) |
| Total | 54 (15.9%) | 133 (55.4%) |
Employment Characteristics in Tabor City
Employment by Class of Employer in Tabor City
Among the 760 employed individuals in Tabor City, private company employees (499 | 65.7%), self-employed (not incorporated) (75 | 9.9%), and local government employees (63 | 8.3%) make up the most common classes of employment.
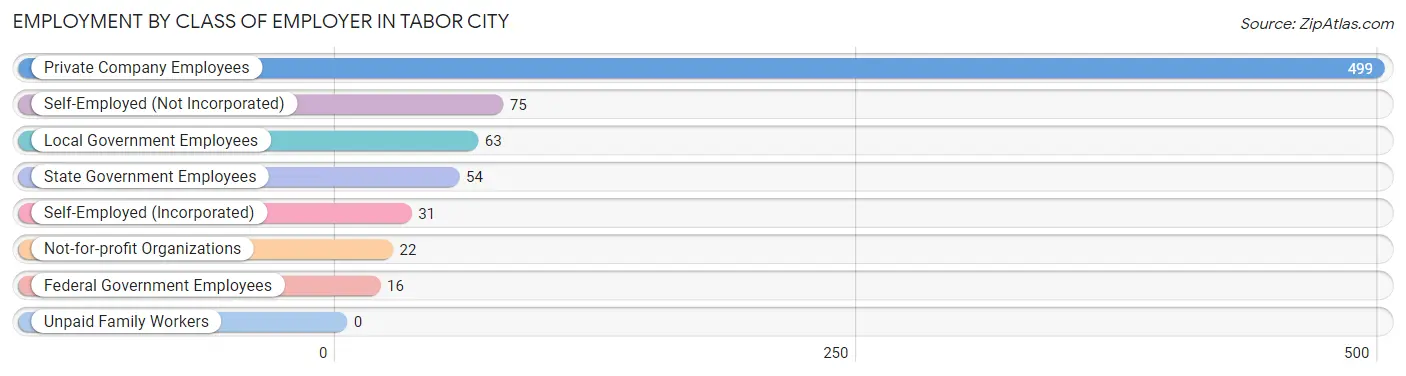
| Employer Class | # Employees | % Employees |
| Private Company Employees | 499 | 65.7% |
| Self-Employed (Incorporated) | 31 | 4.1% |
| Self-Employed (Not Incorporated) | 75 | 9.9% |
| Not-for-profit Organizations | 22 | 2.9% |
| Local Government Employees | 63 | 8.3% |
| State Government Employees | 54 | 7.1% |
| Federal Government Employees | 16 | 2.1% |
| Unpaid Family Workers | 0 | 0.0% |
| Total | 760 | 100.0% |
Employment Status by Age in Tabor City
According to the labor force statistics for Tabor City, out of the total population over 16 years of age (3,212), 25.5% or 819 individuals are in the labor force, with 6.1% or 50 of them unemployed. The age group with the highest labor force participation rate is 55 to 59 years, with 51.3% or 118 individuals in the labor force. Within the labor force, the 16 to 19 years age range has the highest percentage of unemployed individuals, with 33.3% or 11 of them being unemployed.
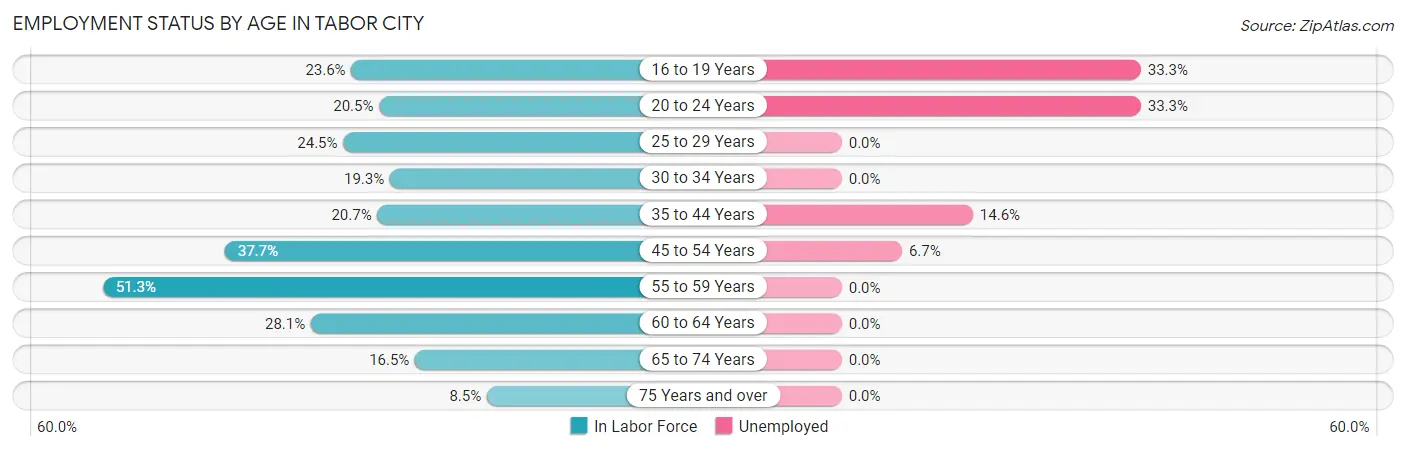
| Age Bracket | In Labor Force | Unemployed |
| 16 to 19 Years | 33 (23.6%) | 11 (33.3%) |
| 20 to 24 Years | 33 (20.5%) | 11 (33.3%) |
| 25 to 29 Years | 93 (24.5%) | 0 (0.0%) |
| 30 to 34 Years | 75 (19.3%) | 0 (0.0%) |
| 35 to 44 Years | 82 (20.7%) | 12 (14.6%) |
| 45 to 54 Years | 239 (37.7%) | 16 (6.7%) |
| 55 to 59 Years | 118 (51.3%) | 0 (0.0%) |
| 60 to 64 Years | 54 (28.1%) | 0 (0.0%) |
| 65 to 74 Years | 67 (16.5%) | 0 (0.0%) |
| 75 Years and over | 24 (8.5%) | 0 (0.0%) |
| Total | 819 (25.5%) | 50 (6.1%) |
Employment Status by Educational Attainment in Tabor City
According to labor force statistics for Tabor City, 29.7% of individuals (660) out of the total population between 25 and 64 years of age (2,222) are in the labor force, with 4.2% or 28 of them being unemployed. The group with the highest labor force participation rate are those with the educational attainment of bachelor's degree or higher, with 86.9% or 133 individuals in the labor force. Within the labor force, individuals with high school diploma education have the highest percentage of unemployment, with 13.5% or 28 of them being unemployed.
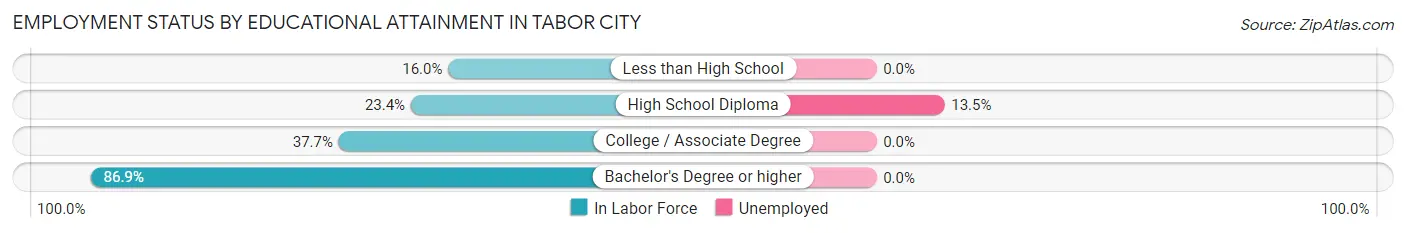
| Educational Attainment | In Labor Force | Unemployed |
| Less than High School | 92 (16.0%) | 0 (0.0%) |
| High School Diploma | 208 (23.4%) | 120 (13.5%) |
| College / Associate Degree | 228 (37.7%) | 0 (0.0%) |
| Bachelor's Degree or higher | 133 (86.9%) | 0 (0.0%) |
| Total | 660 (29.7%) | 93 (4.2%) |
Employment Occupations by Sex in Tabor City
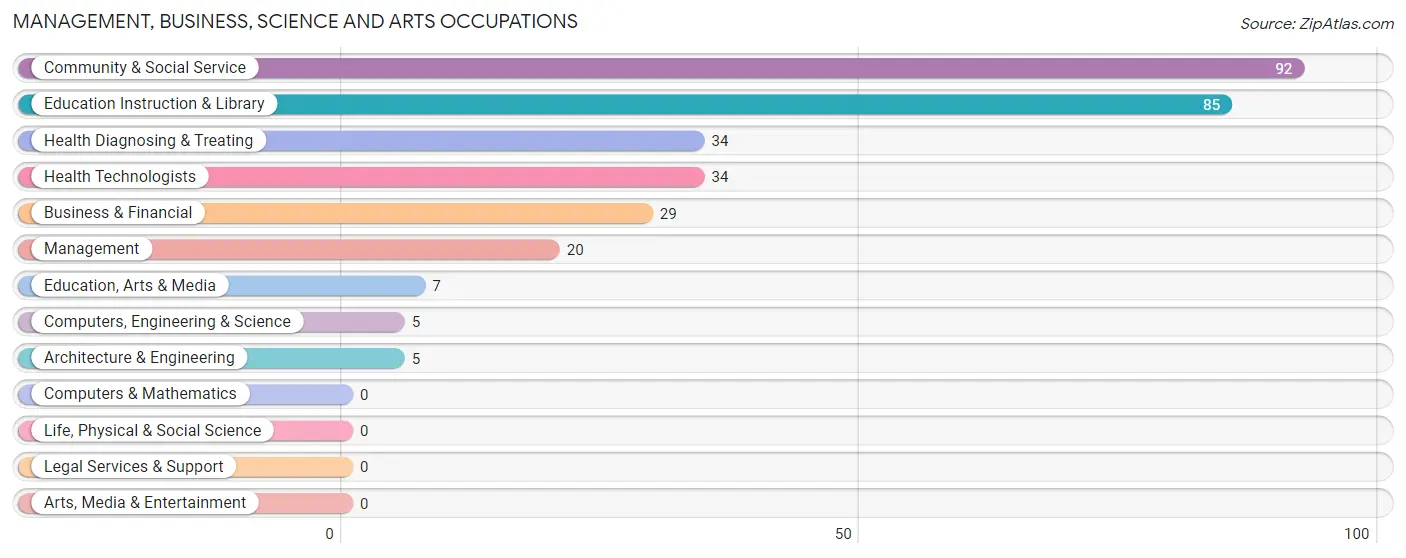
Management, Business, Science and Arts Occupations
The most common Management, Business, Science and Arts occupations in Tabor City are Community & Social Service (92 | 12.0%), Education Instruction & Library (85 | 11.1%), Health Diagnosing & Treating (34 | 4.4%), Health Technologists (34 | 4.4%), and Business & Financial (29 | 3.8%).
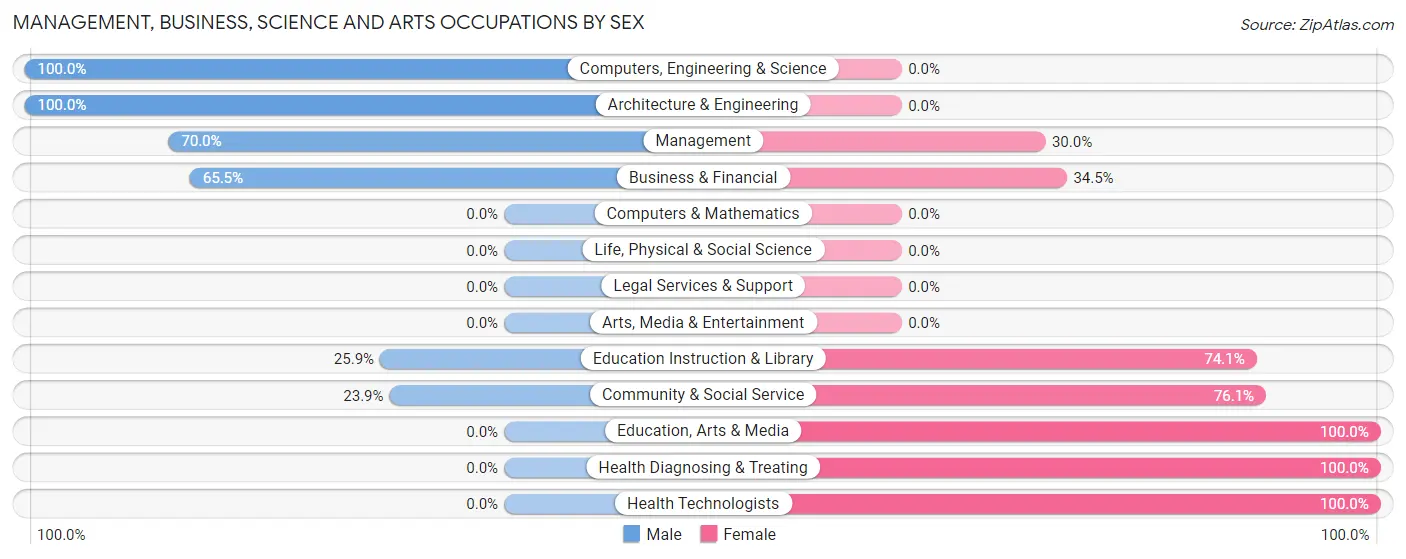
Management, Business, Science and Arts Occupations by Sex
Within the Management, Business, Science and Arts occupations in Tabor City, the most male-oriented occupations are Computers, Engineering & Science (100.0%), Architecture & Engineering (100.0%), and Management (70.0%), while the most female-oriented occupations are Education, Arts & Media (100.0%), Health Diagnosing & Treating (100.0%), and Health Technologists (100.0%).
| Occupation | Male | Female |
| Management | 14 (70.0%) | 6 (30.0%) |
| Business & Financial | 19 (65.5%) | 10 (34.5%) |
| Computers, Engineering & Science | 5 (100.0%) | 0 (0.0%) |
| Computers & Mathematics | 0 (0.0%) | 0 (0.0%) |
| Architecture & Engineering | 5 (100.0%) | 0 (0.0%) |
| Life, Physical & Social Science | 0 (0.0%) | 0 (0.0%) |
| Community & Social Service | 22 (23.9%) | 70 (76.1%) |
| Education, Arts & Media | 0 (0.0%) | 7 (100.0%) |
| Legal Services & Support | 0 (0.0%) | 0 (0.0%) |
| Education Instruction & Library | 22 (25.9%) | 63 (74.1%) |
| Arts, Media & Entertainment | 0 (0.0%) | 0 (0.0%) |
| Health Diagnosing & Treating | 0 (0.0%) | 34 (100.0%) |
| Health Technologists | 0 (0.0%) | 34 (100.0%) |
| Total (Category) | 60 (33.3%) | 120 (66.7%) |
| Total (Overall) | 378 (49.2%) | 390 (50.8%) |
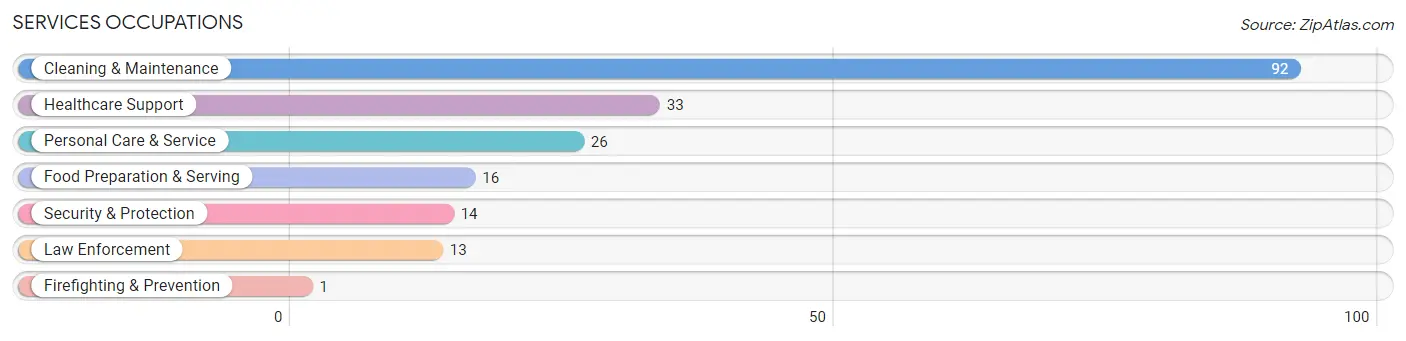
Services Occupations
The most common Services occupations in Tabor City are Cleaning & Maintenance (92 | 12.0%), Healthcare Support (33 | 4.3%), Personal Care & Service (26 | 3.4%), Food Preparation & Serving (16 | 2.1%), and Security & Protection (14 | 1.8%).
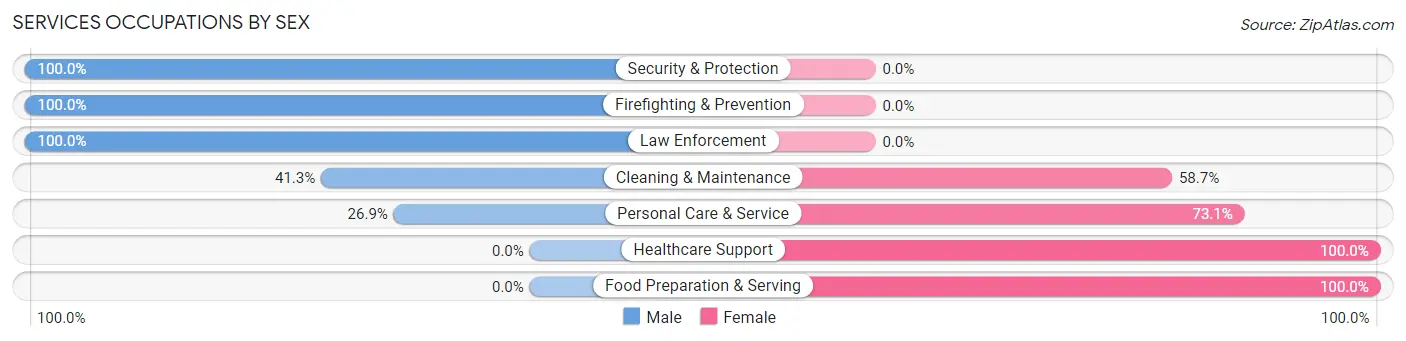
Services Occupations by Sex
Within the Services occupations in Tabor City, the most male-oriented occupations are Security & Protection (100.0%), Firefighting & Prevention (100.0%), and Law Enforcement (100.0%), while the most female-oriented occupations are Healthcare Support (100.0%), Food Preparation & Serving (100.0%), and Personal Care & Service (73.1%).
| Occupation | Male | Female |
| Healthcare Support | 0 (0.0%) | 33 (100.0%) |
| Security & Protection | 14 (100.0%) | 0 (0.0%) |
| Firefighting & Prevention | 1 (100.0%) | 0 (0.0%) |
| Law Enforcement | 13 (100.0%) | 0 (0.0%) |
| Food Preparation & Serving | 0 (0.0%) | 16 (100.0%) |
| Cleaning & Maintenance | 38 (41.3%) | 54 (58.7%) |
| Personal Care & Service | 7 (26.9%) | 19 (73.1%) |
| Total (Category) | 59 (32.6%) | 122 (67.4%) |
| Total (Overall) | 378 (49.2%) | 390 (50.8%) |
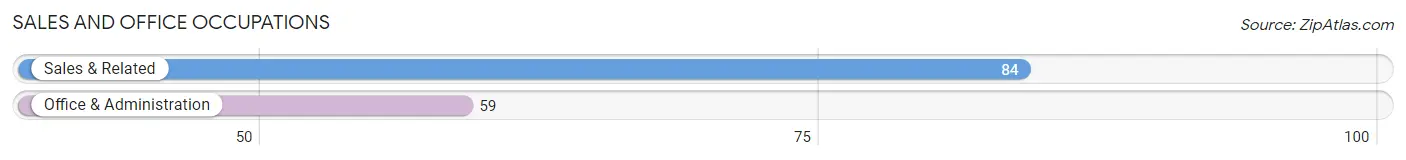
Sales and Office Occupations
The most common Sales and Office occupations in Tabor City are Sales & Related (84 | 10.9%), and Office & Administration (59 | 7.7%).
Sales and Office Occupations by Sex
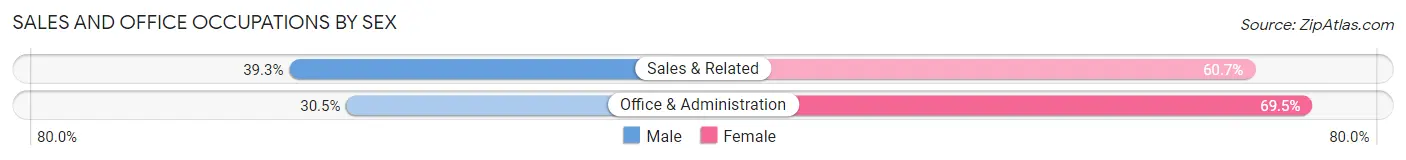
| Occupation | Male | Female |
| Sales & Related | 33 (39.3%) | 51 (60.7%) |
| Office & Administration | 18 (30.5%) | 41 (69.5%) |
| Total (Category) | 51 (35.7%) | 92 (64.3%) |
| Total (Overall) | 378 (49.2%) | 390 (50.8%) |
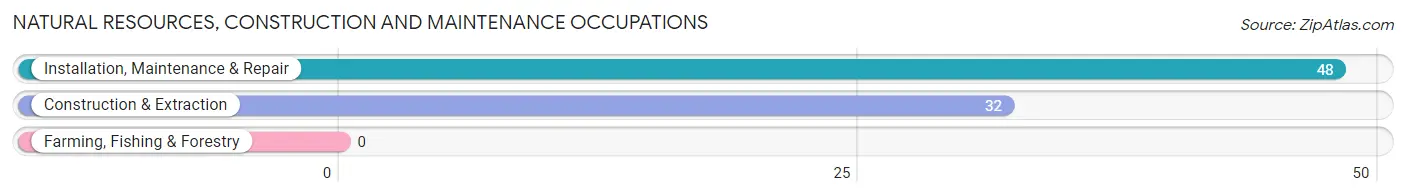
Natural Resources, Construction and Maintenance Occupations
The most common Natural Resources, Construction and Maintenance occupations in Tabor City are Installation, Maintenance & Repair (48 | 6.2%), and Construction & Extraction (32 | 4.2%).
Natural Resources, Construction and Maintenance Occupations by Sex
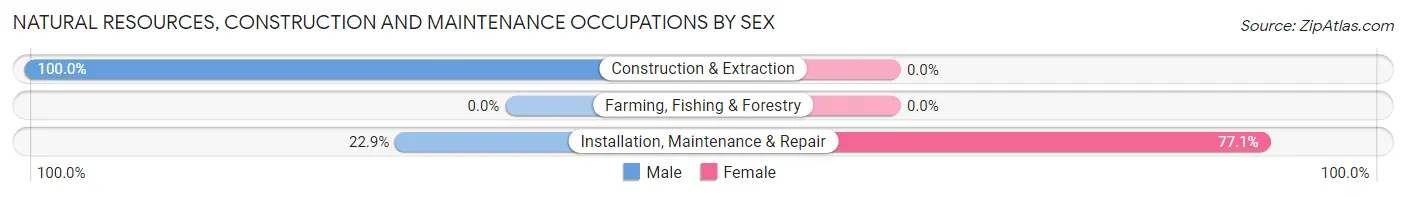
| Occupation | Male | Female |
| Farming, Fishing & Forestry | 0 (0.0%) | 0 (0.0%) |
| Construction & Extraction | 32 (100.0%) | 0 (0.0%) |
| Installation, Maintenance & Repair | 11 (22.9%) | 37 (77.1%) |
| Total (Category) | 43 (53.7%) | 37 (46.3%) |
| Total (Overall) | 378 (49.2%) | 390 (50.8%) |
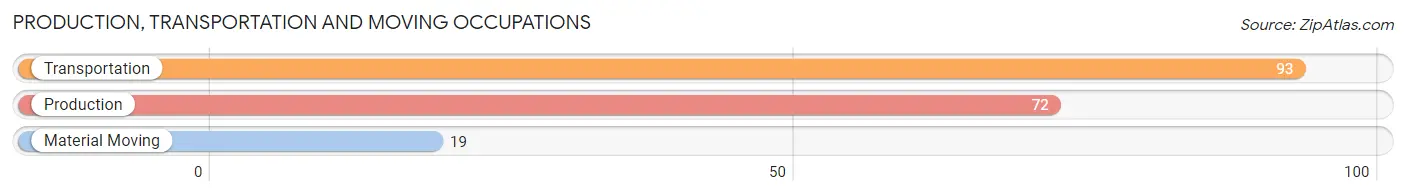
Production, Transportation and Moving Occupations
The most common Production, Transportation and Moving occupations in Tabor City are Transportation (93 | 12.1%), Production (72 | 9.4%), and Material Moving (19 | 2.5%).
Production, Transportation and Moving Occupations by Sex
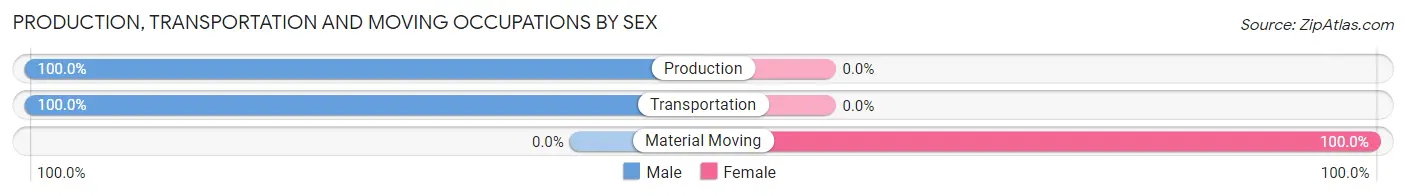
| Occupation | Male | Female |
| Production | 72 (100.0%) | 0 (0.0%) |
| Transportation | 93 (100.0%) | 0 (0.0%) |
| Material Moving | 0 (0.0%) | 19 (100.0%) |
| Total (Category) | 165 (89.7%) | 19 (10.3%) |
| Total (Overall) | 378 (49.2%) | 390 (50.8%) |
Employment Industries by Sex in Tabor City
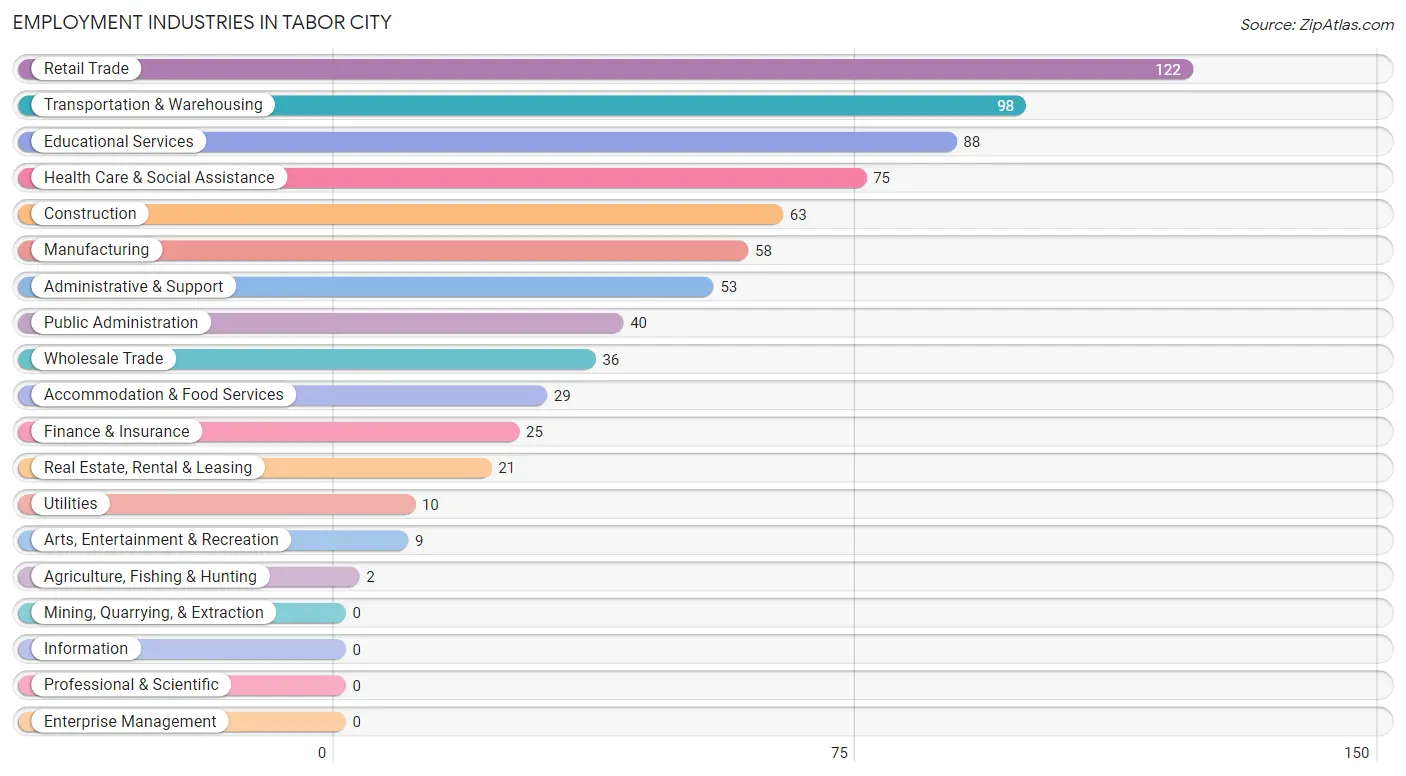
Employment Industries in Tabor City
The major employment industries in Tabor City include Retail Trade (122 | 15.9%), Transportation & Warehousing (98 | 12.8%), Educational Services (88 | 11.5%), Health Care & Social Assistance (75 | 9.8%), and Construction (63 | 8.2%).
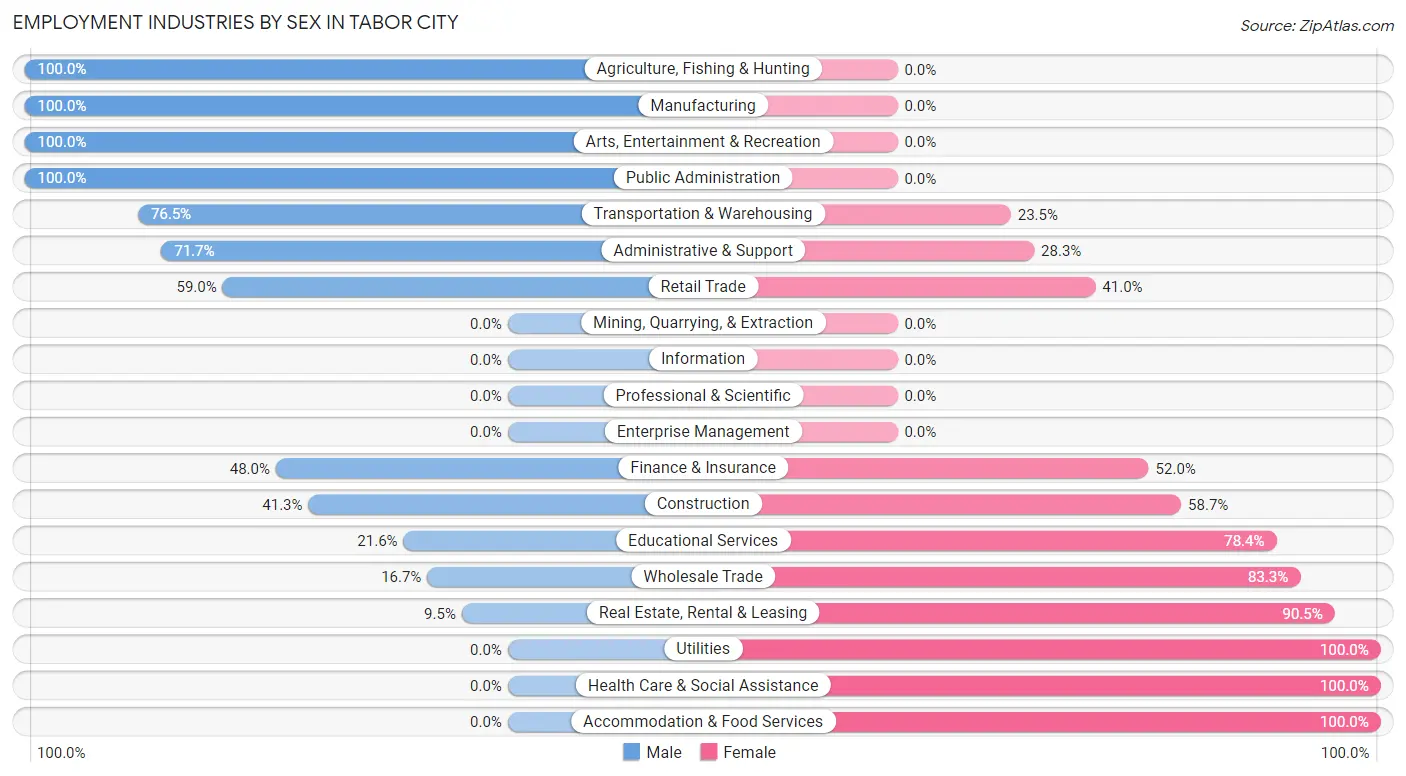
Employment Industries by Sex in Tabor City
The Tabor City industries that see more men than women are Agriculture, Fishing & Hunting (100.0%), Manufacturing (100.0%), and Arts, Entertainment & Recreation (100.0%), whereas the industries that tend to have a higher number of women are Utilities (100.0%), Health Care & Social Assistance (100.0%), and Accommodation & Food Services (100.0%).
| Industry | Male | Female |
| Agriculture, Fishing & Hunting | 2 (100.0%) | 0 (0.0%) |
| Mining, Quarrying, & Extraction | 0 (0.0%) | 0 (0.0%) |
| Construction | 26 (41.3%) | 37 (58.7%) |
| Manufacturing | 58 (100.0%) | 0 (0.0%) |
| Wholesale Trade | 6 (16.7%) | 30 (83.3%) |
| Retail Trade | 72 (59.0%) | 50 (41.0%) |
| Transportation & Warehousing | 75 (76.5%) | 23 (23.5%) |
| Utilities | 0 (0.0%) | 10 (100.0%) |
| Information | 0 (0.0%) | 0 (0.0%) |
| Finance & Insurance | 12 (48.0%) | 13 (52.0%) |
| Real Estate, Rental & Leasing | 2 (9.5%) | 19 (90.5%) |
| Professional & Scientific | 0 (0.0%) | 0 (0.0%) |
| Enterprise Management | 0 (0.0%) | 0 (0.0%) |
| Administrative & Support | 38 (71.7%) | 15 (28.3%) |
| Educational Services | 19 (21.6%) | 69 (78.4%) |
| Health Care & Social Assistance | 0 (0.0%) | 75 (100.0%) |
| Arts, Entertainment & Recreation | 9 (100.0%) | 0 (0.0%) |
| Accommodation & Food Services | 0 (0.0%) | 29 (100.0%) |
| Public Administration | 40 (100.0%) | 0 (0.0%) |
| Total | 378 (49.2%) | 390 (50.8%) |
Education in Tabor City
School Enrollment in Tabor City
The most common levels of schooling among the 443 students in Tabor City are college / undergraduate (107 | 24.1%), middle school (103 | 23.3%), and high school (98 | 22.1%).
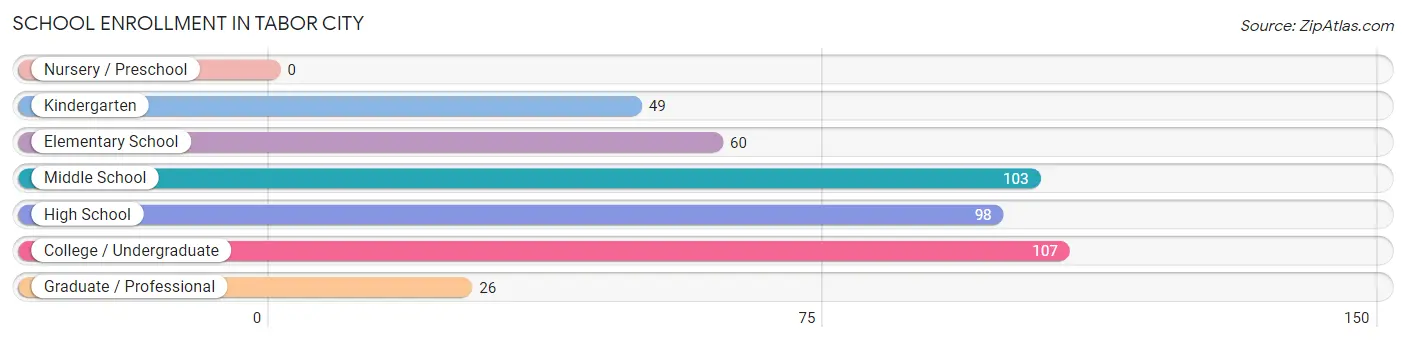
| School Level | # Students | % Students |
| Nursery / Preschool | 0 | 0.0% |
| Kindergarten | 49 | 11.1% |
| Elementary School | 60 | 13.5% |
| Middle School | 103 | 23.3% |
| High School | 98 | 22.1% |
| College / Undergraduate | 107 | 24.1% |
| Graduate / Professional | 26 | 5.9% |
| Total | 443 | 100.0% |
School Enrollment by Age by Funding Source in Tabor City
Out of a total of 443 students who are enrolled in schools in Tabor City, 33 (7.4%) attend a private institution, while the remaining 410 (92.6%) are enrolled in public schools. The age group of 35 years and over has the highest likelihood of being enrolled in private schools, with 10 (22.2% in the age bracket) enrolled. Conversely, the age group of 10 to 14 year olds has the lowest likelihood of being enrolled in a private school, with 136 (100.0% in the age bracket) attending a public institution.
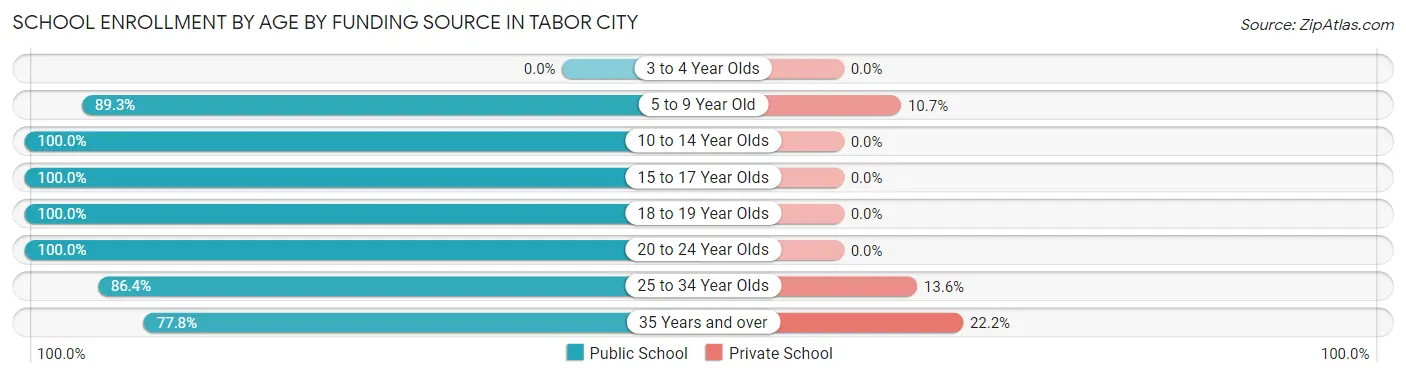
| Age Bracket | Public School | Private School |
| 3 to 4 Year Olds | 0 (0.0%) | 0 (0.0%) |
| 5 to 9 Year Old | 92 (89.3%) | 11 (10.7%) |
| 10 to 14 Year Olds | 136 (100.0%) | 0 (0.0%) |
| 15 to 17 Year Olds | 23 (100.0%) | 0 (0.0%) |
| 18 to 19 Year Olds | 41 (100.0%) | 0 (0.0%) |
| 20 to 24 Year Olds | 7 (100.0%) | 0 (0.0%) |
| 25 to 34 Year Olds | 76 (86.4%) | 12 (13.6%) |
| 35 Years and over | 35 (77.8%) | 10 (22.2%) |
| Total | 410 (92.6%) | 33 (7.4%) |
Educational Attainment by Field of Study in Tabor City
Education (111 | 41.3%), arts & humanities (64 | 23.8%), science & technology (29 | 10.8%), liberal arts & history (28 | 10.4%), and bio, nature & agricultural (14 | 5.2%) are the most common fields of study among 269 individuals in Tabor City who have obtained a bachelor's degree or higher.
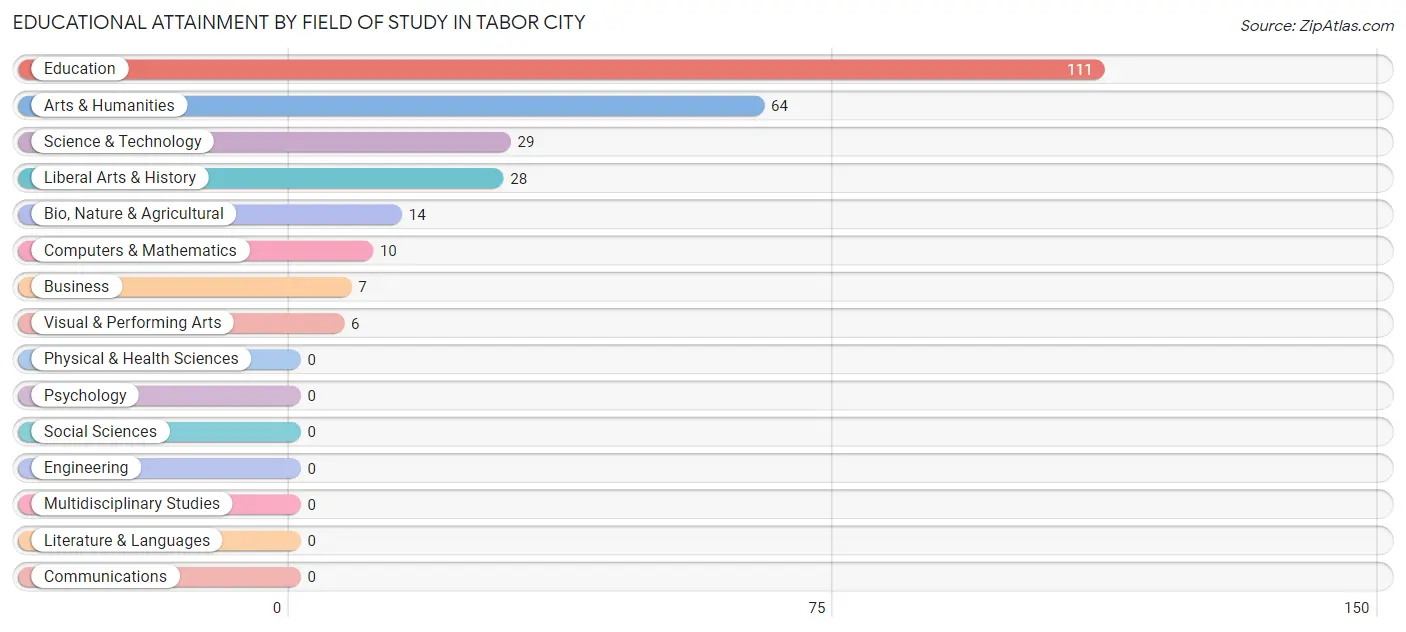
| Field of Study | # Graduates | % Graduates |
| Computers & Mathematics | 10 | 3.7% |
| Bio, Nature & Agricultural | 14 | 5.2% |
| Physical & Health Sciences | 0 | 0.0% |
| Psychology | 0 | 0.0% |
| Social Sciences | 0 | 0.0% |
| Engineering | 0 | 0.0% |
| Multidisciplinary Studies | 0 | 0.0% |
| Science & Technology | 29 | 10.8% |
| Business | 7 | 2.6% |
| Education | 111 | 41.3% |
| Literature & Languages | 0 | 0.0% |
| Liberal Arts & History | 28 | 10.4% |
| Visual & Performing Arts | 6 | 2.2% |
| Communications | 0 | 0.0% |
| Arts & Humanities | 64 | 23.8% |
| Total | 269 | 100.0% |
Transportation & Commute in Tabor City
Vehicle Availability by Sex in Tabor City
The most prevalent vehicle ownership categories in Tabor City are males with 2 vehicles (134, accounting for 36.2%) and females with 2 vehicles (160, making up 34.4%).
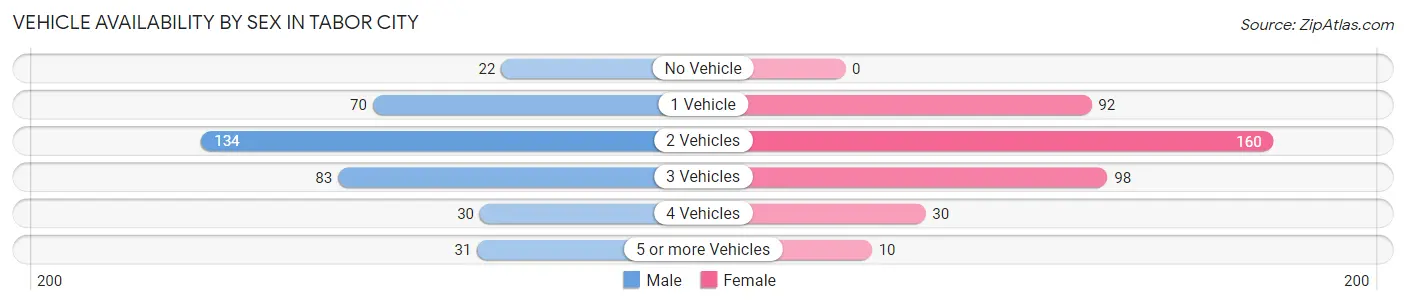
| Vehicles Available | Male | Female |
| No Vehicle | 22 (5.9%) | 0 (0.0%) |
| 1 Vehicle | 70 (18.9%) | 92 (23.6%) |
| 2 Vehicles | 134 (36.2%) | 160 (41.0%) |
| 3 Vehicles | 83 (22.4%) | 98 (25.1%) |
| 4 Vehicles | 30 (8.1%) | 30 (7.7%) |
| 5 or more Vehicles | 31 (8.4%) | 10 (2.6%) |
| Total | 370 (100.0%) | 390 (100.0%) |
Commute Time in Tabor City
The most frequently occuring commute durations in Tabor City are 30 to 34 minutes (149 commuters, 21.8%), 5 to 9 minutes (114 commuters, 16.7%), and 60 to 89 minutes (70 commuters, 10.2%).
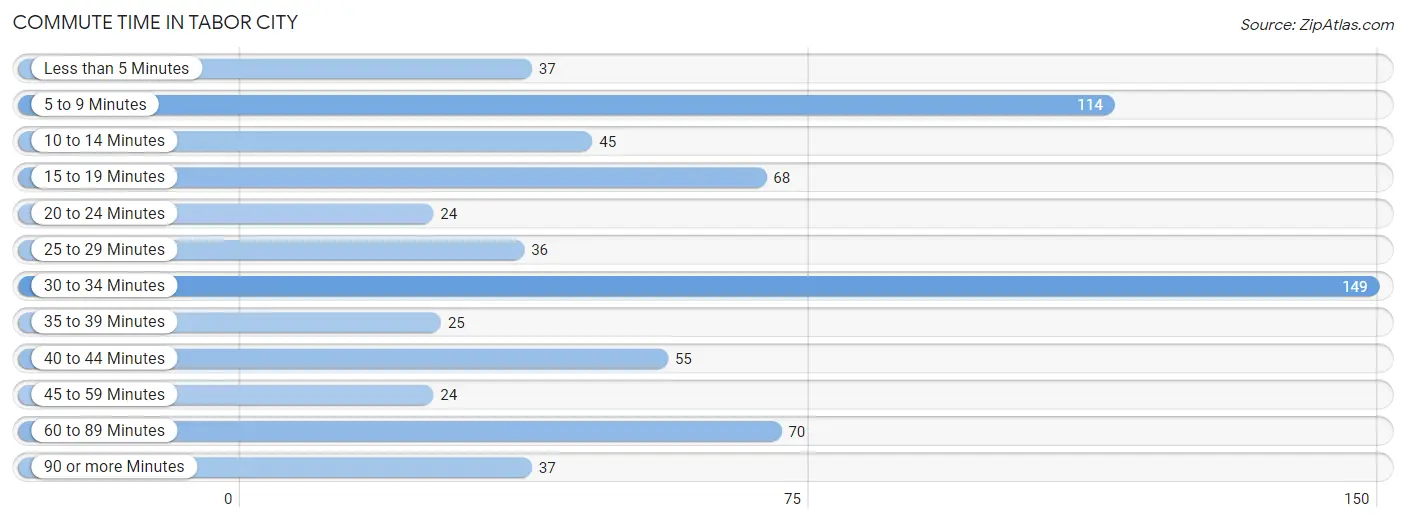
| Commute Time | # Commuters | % Commuters |
| Less than 5 Minutes | 37 | 5.4% |
| 5 to 9 Minutes | 114 | 16.7% |
| 10 to 14 Minutes | 45 | 6.6% |
| 15 to 19 Minutes | 68 | 9.9% |
| 20 to 24 Minutes | 24 | 3.5% |
| 25 to 29 Minutes | 36 | 5.3% |
| 30 to 34 Minutes | 149 | 21.8% |
| 35 to 39 Minutes | 25 | 3.6% |
| 40 to 44 Minutes | 55 | 8.0% |
| 45 to 59 Minutes | 24 | 3.5% |
| 60 to 89 Minutes | 70 | 10.2% |
| 90 or more Minutes | 37 | 5.4% |
Commute Time by Sex in Tabor City
The most common commute times in Tabor City are 60 to 89 minutes (70 commuters, 22.2%) for males and 5 to 9 minutes (91 commuters, 24.7%) for females.
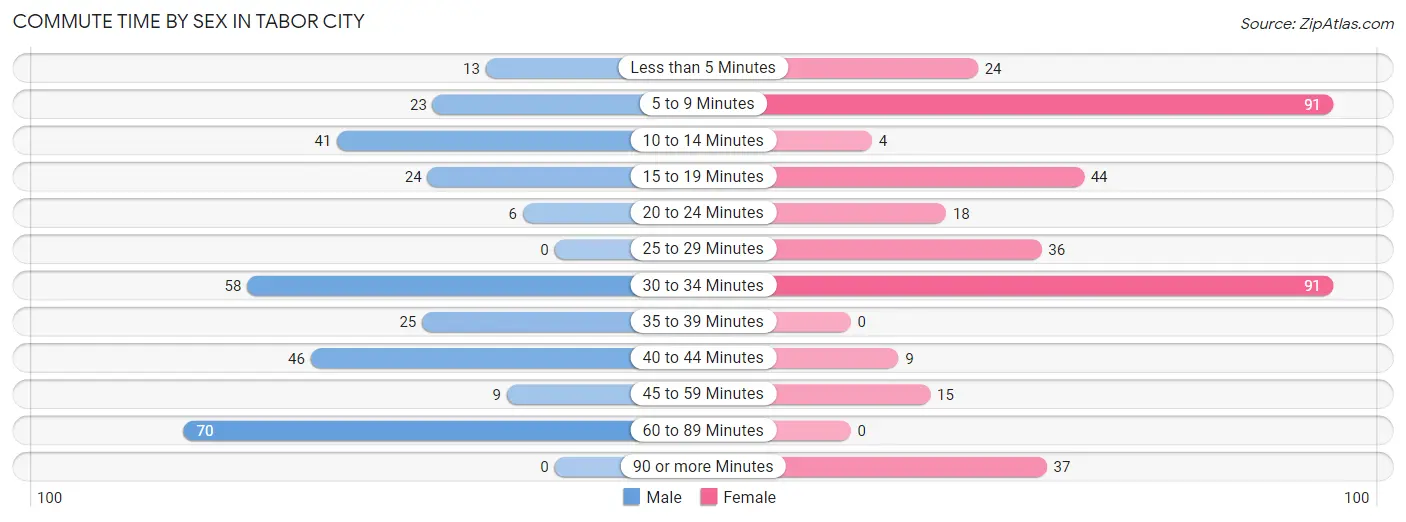
| Commute Time | Male | Female |
| Less than 5 Minutes | 13 (4.1%) | 24 (6.5%) |
| 5 to 9 Minutes | 23 (7.3%) | 91 (24.7%) |
| 10 to 14 Minutes | 41 (13.0%) | 4 (1.1%) |
| 15 to 19 Minutes | 24 (7.6%) | 44 (11.9%) |
| 20 to 24 Minutes | 6 (1.9%) | 18 (4.9%) |
| 25 to 29 Minutes | 0 (0.0%) | 36 (9.8%) |
| 30 to 34 Minutes | 58 (18.4%) | 91 (24.7%) |
| 35 to 39 Minutes | 25 (7.9%) | 0 (0.0%) |
| 40 to 44 Minutes | 46 (14.6%) | 9 (2.4%) |
| 45 to 59 Minutes | 9 (2.9%) | 15 (4.1%) |
| 60 to 89 Minutes | 70 (22.2%) | 0 (0.0%) |
| 90 or more Minutes | 0 (0.0%) | 37 (10.0%) |
Time of Departure to Work by Sex in Tabor City
The most frequent times of departure to work in Tabor City are 12:00 AM to 4:59 AM (73, 23.2%) for males and 6:30 AM to 6:59 AM (75, 20.3%) for females.
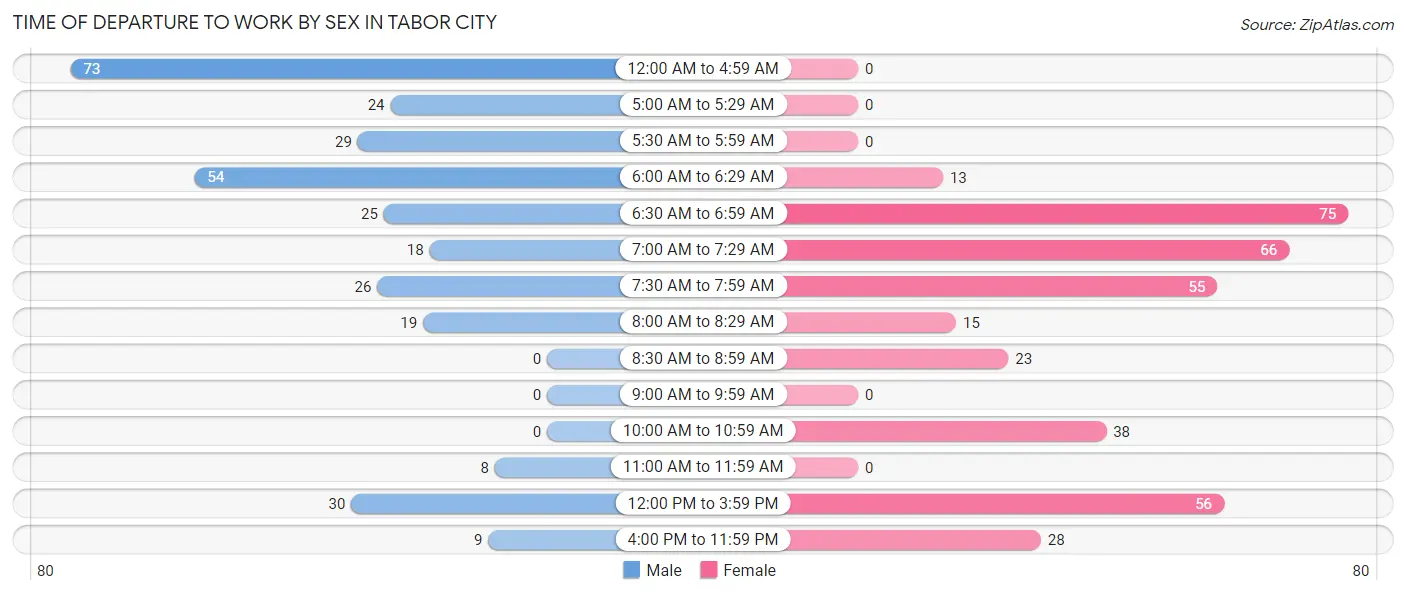
| Time of Departure | Male | Female |
| 12:00 AM to 4:59 AM | 73 (23.2%) | 0 (0.0%) |
| 5:00 AM to 5:29 AM | 24 (7.6%) | 0 (0.0%) |
| 5:30 AM to 5:59 AM | 29 (9.2%) | 0 (0.0%) |
| 6:00 AM to 6:29 AM | 54 (17.1%) | 13 (3.5%) |
| 6:30 AM to 6:59 AM | 25 (7.9%) | 75 (20.3%) |
| 7:00 AM to 7:29 AM | 18 (5.7%) | 66 (17.9%) |
| 7:30 AM to 7:59 AM | 26 (8.3%) | 55 (14.9%) |
| 8:00 AM to 8:29 AM | 19 (6.0%) | 15 (4.1%) |
| 8:30 AM to 8:59 AM | 0 (0.0%) | 23 (6.2%) |
| 9:00 AM to 9:59 AM | 0 (0.0%) | 0 (0.0%) |
| 10:00 AM to 10:59 AM | 0 (0.0%) | 38 (10.3%) |
| 11:00 AM to 11:59 AM | 8 (2.5%) | 0 (0.0%) |
| 12:00 PM to 3:59 PM | 30 (9.5%) | 56 (15.2%) |
| 4:00 PM to 11:59 PM | 9 (2.9%) | 28 (7.6%) |
| Total | 315 (100.0%) | 369 (100.0%) |
Housing Occupancy in Tabor City
Occupancy by Ownership in Tabor City
Of the total 866 dwellings in Tabor City, owner-occupied units account for 474 (54.7%), while renter-occupied units make up 392 (45.3%).

| Occupancy | # Housing Units | % Housing Units |
| Owner Occupied Housing Units | 474 | 54.7% |
| Renter-Occupied Housing Units | 392 | 45.3% |
| Total Occupied Housing Units | 866 | 100.0% |
Occupancy by Household Size in Tabor City
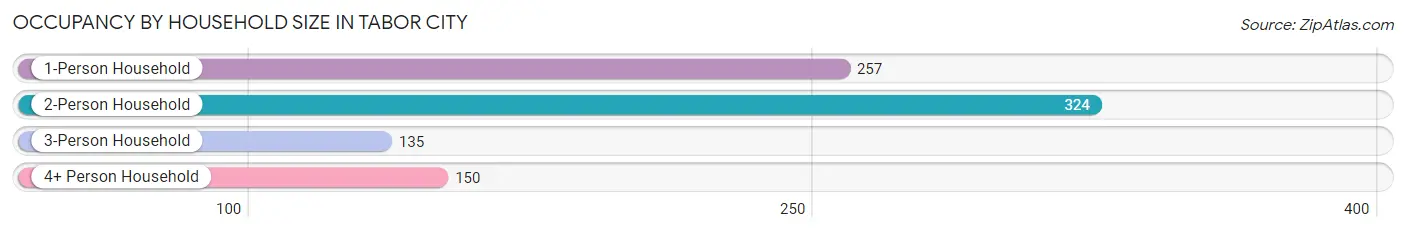
| Household Size | # Housing Units | % Housing Units |
| 1-Person Household | 257 | 29.7% |
| 2-Person Household | 324 | 37.4% |
| 3-Person Household | 135 | 15.6% |
| 4+ Person Household | 150 | 17.3% |
| Total Housing Units | 866 | 100.0% |
Occupancy by Ownership by Household Size in Tabor City
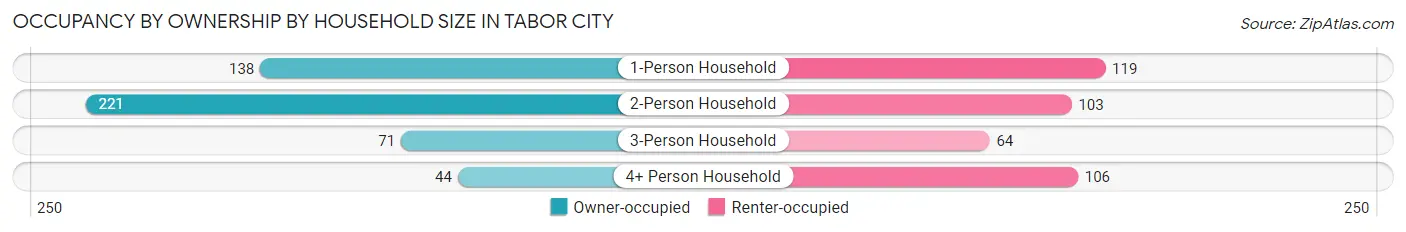
| Household Size | Owner-occupied | Renter-occupied |
| 1-Person Household | 138 (53.7%) | 119 (46.3%) |
| 2-Person Household | 221 (68.2%) | 103 (31.8%) |
| 3-Person Household | 71 (52.6%) | 64 (47.4%) |
| 4+ Person Household | 44 (29.3%) | 106 (70.7%) |
| Total Housing Units | 474 (54.7%) | 392 (45.3%) |
Occupancy by Educational Attainment in Tabor City
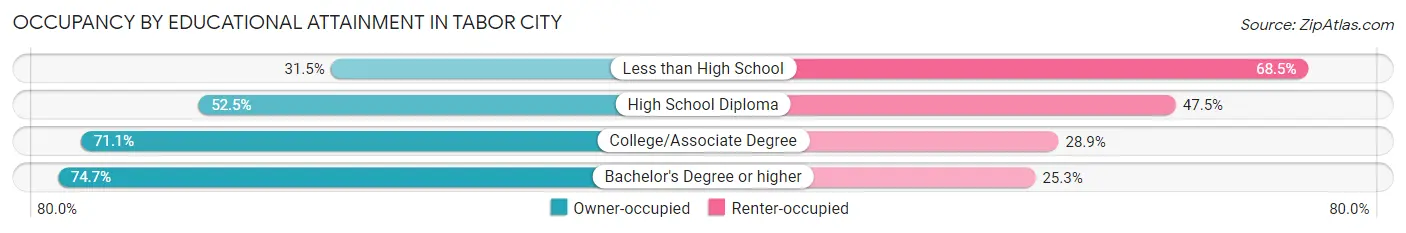
| Household Size | Owner-occupied | Renter-occupied |
| Less than High School | 79 (31.5%) | 172 (68.5%) |
| High School Diploma | 128 (52.5%) | 116 (47.5%) |
| College/Associate Degree | 199 (71.1%) | 81 (28.9%) |
| Bachelor's Degree or higher | 68 (74.7%) | 23 (25.3%) |
Occupancy by Age of Householder in Tabor City
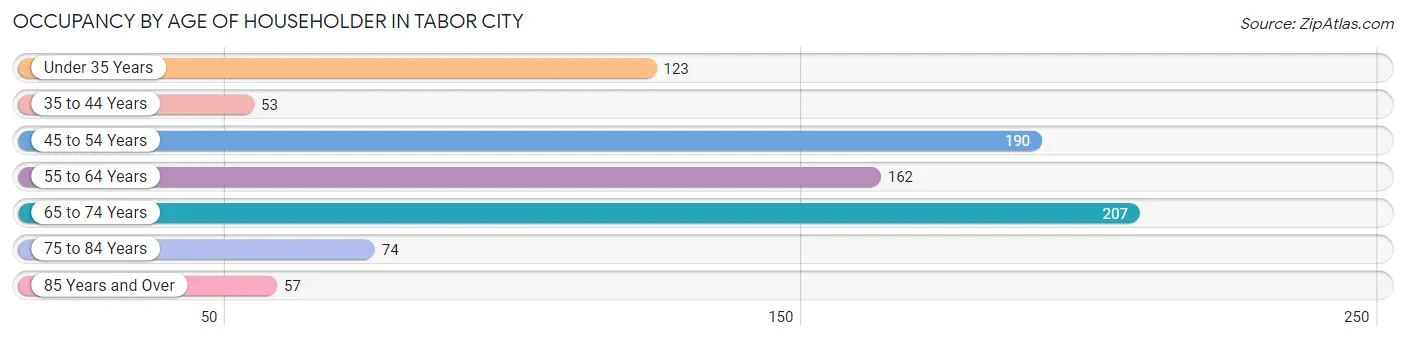
| Age Bracket | # Households | % Households |
| Under 35 Years | 123 | 14.2% |
| 35 to 44 Years | 53 | 6.1% |
| 45 to 54 Years | 190 | 21.9% |
| 55 to 64 Years | 162 | 18.7% |
| 65 to 74 Years | 207 | 23.9% |
| 75 to 84 Years | 74 | 8.6% |
| 85 Years and Over | 57 | 6.6% |
| Total | 866 | 100.0% |
Housing Finances in Tabor City
Median Income by Occupancy in Tabor City
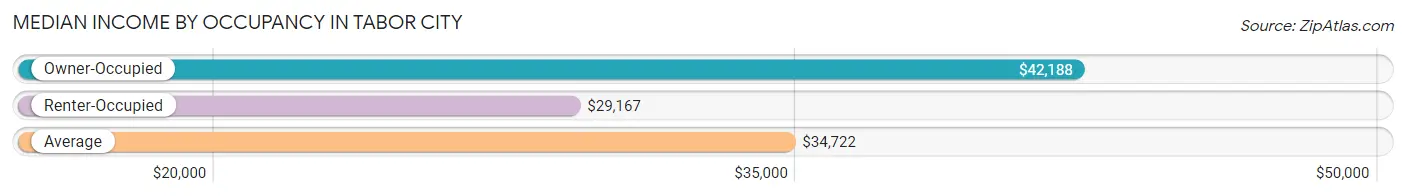
| Occupancy Type | # Households | Median Income |
| Owner-Occupied | 474 (54.7%) | $42,188 |
| Renter-Occupied | 392 (45.3%) | $29,167 |
| Average | 866 (100.0%) | $34,722 |
Occupancy by Householder Income Bracket in Tabor City
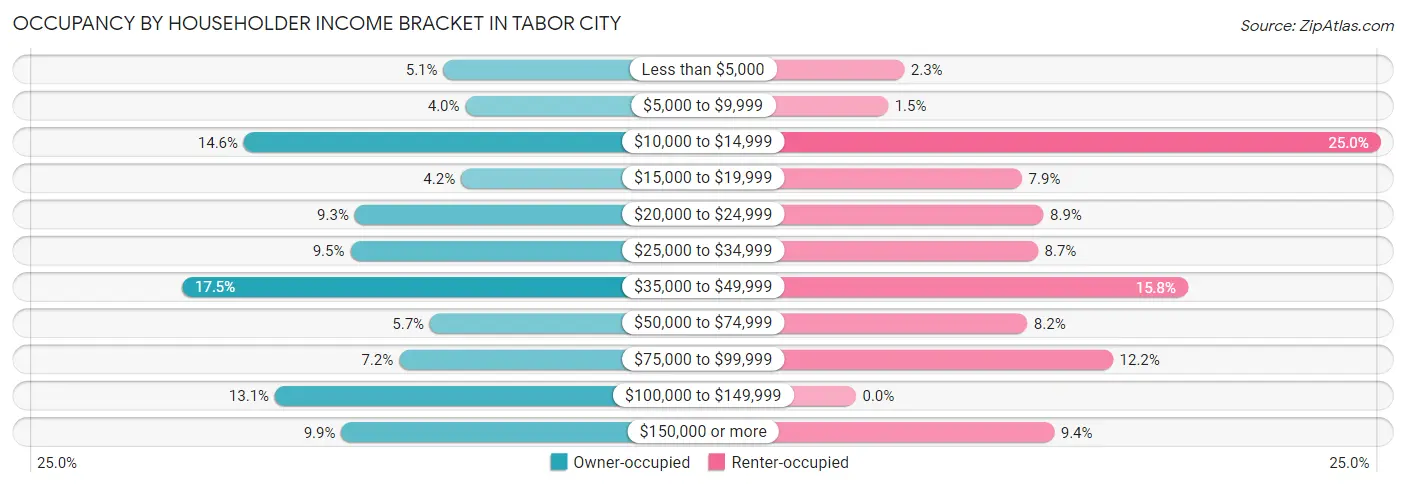
| Income Bracket | Owner-occupied | Renter-occupied |
| Less than $5,000 | 24 (5.1%) | 9 (2.3%) |
| $5,000 to $9,999 | 19 (4.0%) | 6 (1.5%) |
| $10,000 to $14,999 | 69 (14.6%) | 98 (25.0%) |
| $15,000 to $19,999 | 20 (4.2%) | 31 (7.9%) |
| $20,000 to $24,999 | 44 (9.3%) | 35 (8.9%) |
| $25,000 to $34,999 | 45 (9.5%) | 34 (8.7%) |
| $35,000 to $49,999 | 83 (17.5%) | 62 (15.8%) |
| $50,000 to $74,999 | 27 (5.7%) | 32 (8.2%) |
| $75,000 to $99,999 | 34 (7.2%) | 48 (12.2%) |
| $100,000 to $149,999 | 62 (13.1%) | 0 (0.0%) |
| $150,000 or more | 47 (9.9%) | 37 (9.4%) |
| Total | 474 (100.0%) | 392 (100.0%) |
Monthly Housing Cost Tiers in Tabor City
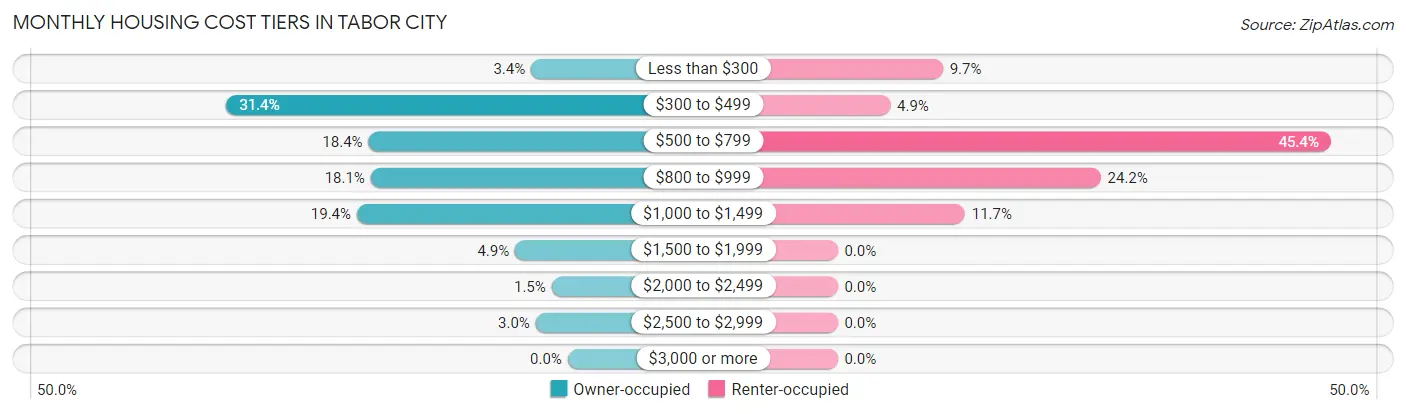
| Monthly Cost | Owner-occupied | Renter-occupied |
| Less than $300 | 16 (3.4%) | 38 (9.7%) |
| $300 to $499 | 149 (31.4%) | 19 (4.9%) |
| $500 to $799 | 87 (18.3%) | 178 (45.4%) |
| $800 to $999 | 86 (18.1%) | 95 (24.2%) |
| $1,000 to $1,499 | 92 (19.4%) | 46 (11.7%) |
| $1,500 to $1,999 | 23 (4.9%) | 0 (0.0%) |
| $2,000 to $2,499 | 7 (1.5%) | 0 (0.0%) |
| $2,500 to $2,999 | 14 (2.9%) | 0 (0.0%) |
| $3,000 or more | 0 (0.0%) | 0 (0.0%) |
| Total | 474 (100.0%) | 392 (100.0%) |
Physical Housing Characteristics in Tabor City
Housing Structures in Tabor City
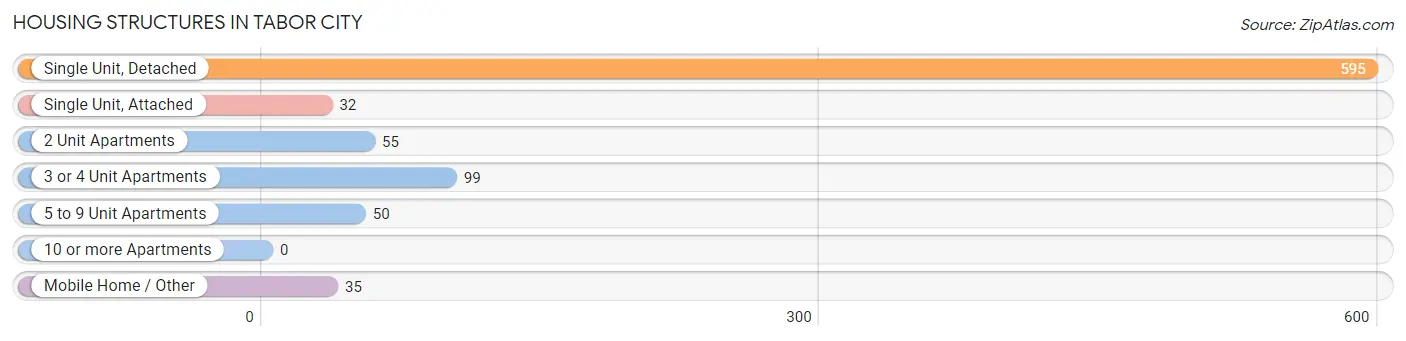
| Structure Type | # Housing Units | % Housing Units |
| Single Unit, Detached | 595 | 68.7% |
| Single Unit, Attached | 32 | 3.7% |
| 2 Unit Apartments | 55 | 6.4% |
| 3 or 4 Unit Apartments | 99 | 11.4% |
| 5 to 9 Unit Apartments | 50 | 5.8% |
| 10 or more Apartments | 0 | 0.0% |
| Mobile Home / Other | 35 | 4.0% |
| Total | 866 | 100.0% |
Housing Structures by Occupancy in Tabor City
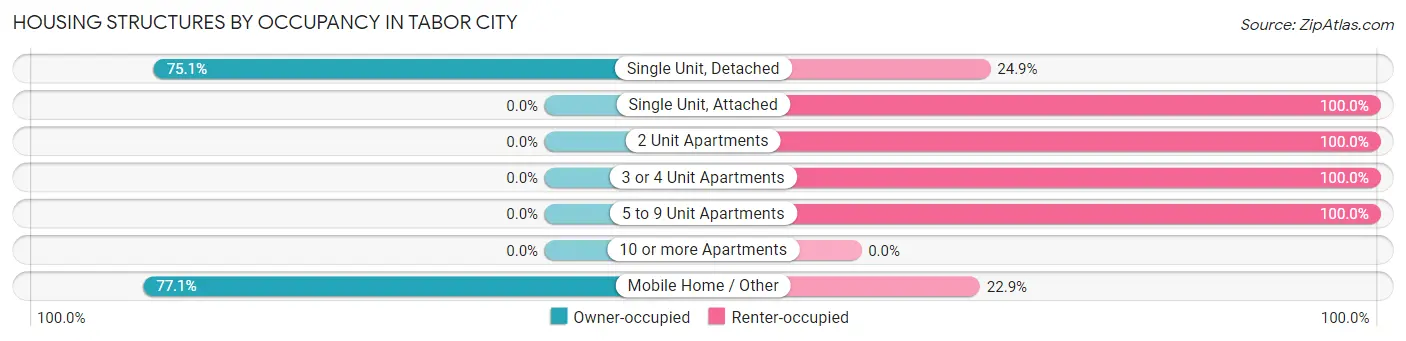
| Structure Type | Owner-occupied | Renter-occupied |
| Single Unit, Detached | 447 (75.1%) | 148 (24.9%) |
| Single Unit, Attached | 0 (0.0%) | 32 (100.0%) |
| 2 Unit Apartments | 0 (0.0%) | 55 (100.0%) |
| 3 or 4 Unit Apartments | 0 (0.0%) | 99 (100.0%) |
| 5 to 9 Unit Apartments | 0 (0.0%) | 50 (100.0%) |
| 10 or more Apartments | 0 (0.0%) | 0 (0.0%) |
| Mobile Home / Other | 27 (77.1%) | 8 (22.9%) |
| Total | 474 (54.7%) | 392 (45.3%) |
Housing Structures by Number of Rooms in Tabor City
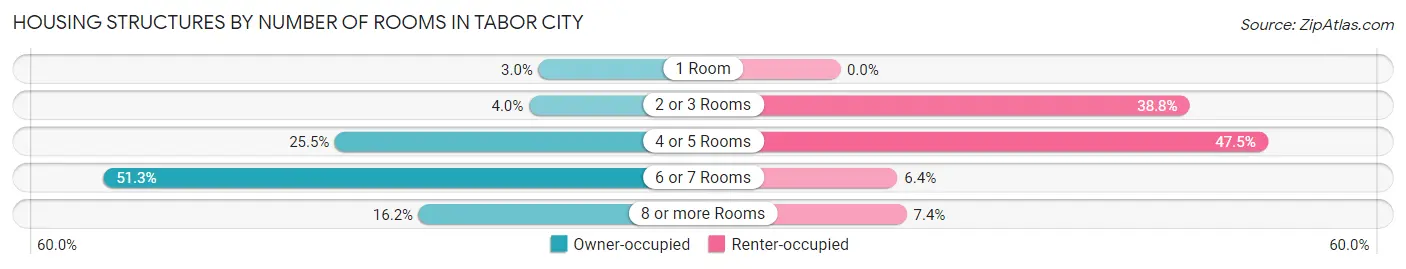
| Number of Rooms | Owner-occupied | Renter-occupied |
| 1 Room | 14 (2.9%) | 0 (0.0%) |
| 2 or 3 Rooms | 19 (4.0%) | 152 (38.8%) |
| 4 or 5 Rooms | 121 (25.5%) | 186 (47.4%) |
| 6 or 7 Rooms | 243 (51.3%) | 25 (6.4%) |
| 8 or more Rooms | 77 (16.2%) | 29 (7.4%) |
| Total | 474 (100.0%) | 392 (100.0%) |
Housing Structure by Heating Type in Tabor City
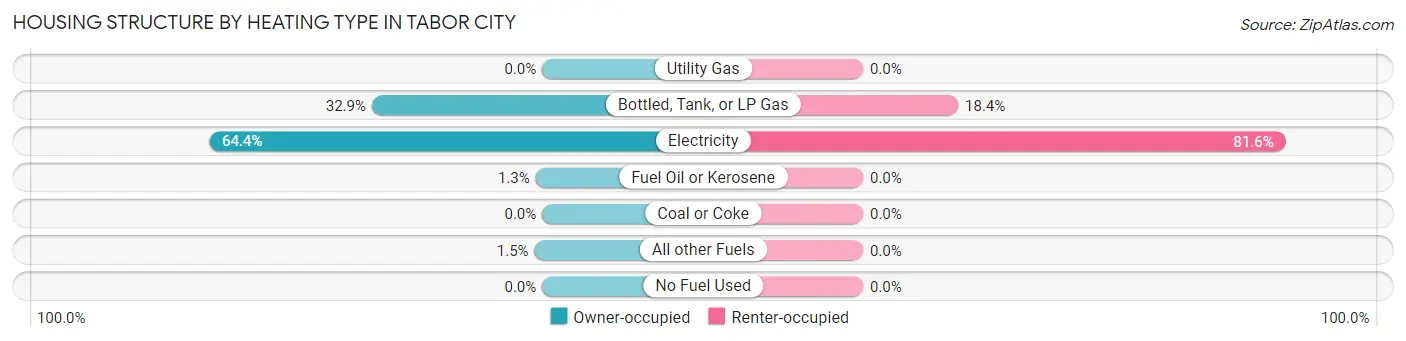
| Heating Type | Owner-occupied | Renter-occupied |
| Utility Gas | 0 (0.0%) | 0 (0.0%) |
| Bottled, Tank, or LP Gas | 156 (32.9%) | 72 (18.4%) |
| Electricity | 305 (64.3%) | 320 (81.6%) |
| Fuel Oil or Kerosene | 6 (1.3%) | 0 (0.0%) |
| Coal or Coke | 0 (0.0%) | 0 (0.0%) |
| All other Fuels | 7 (1.5%) | 0 (0.0%) |
| No Fuel Used | 0 (0.0%) | 0 (0.0%) |
| Total | 474 (100.0%) | 392 (100.0%) |
Household Vehicle Usage in Tabor City
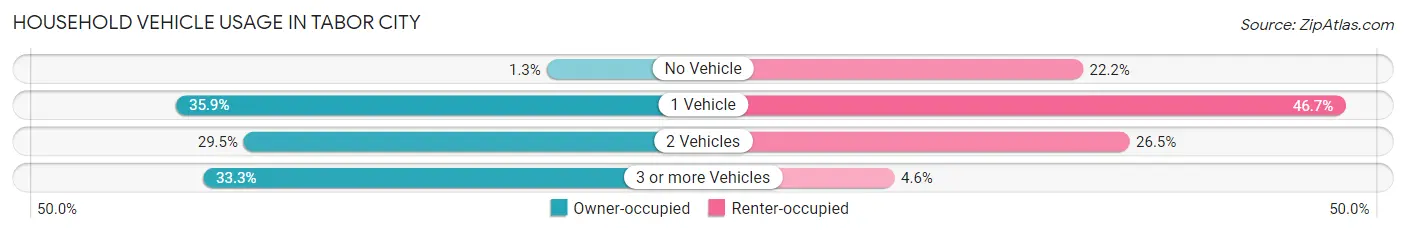
| Vehicles per Household | Owner-occupied | Renter-occupied |
| No Vehicle | 6 (1.3%) | 87 (22.2%) |
| 1 Vehicle | 170 (35.9%) | 183 (46.7%) |
| 2 Vehicles | 140 (29.5%) | 104 (26.5%) |
| 3 or more Vehicles | 158 (33.3%) | 18 (4.6%) |
| Total | 474 (100.0%) | 392 (100.0%) |
Real Estate & Mortgages in Tabor City
Real Estate and Mortgage Overview in Tabor City
| Characteristic | Without Mortgage | With Mortgage |
| Housing Units | 300 | 174 |
| Median Property Value | $75,700 | $134,400 |
| Median Household Income | $30,167 | $41 |
| Monthly Housing Costs | $487 | $0 |
| Real Estate Taxes | $1,212 | $0 |
Property Value by Mortgage Status in Tabor City
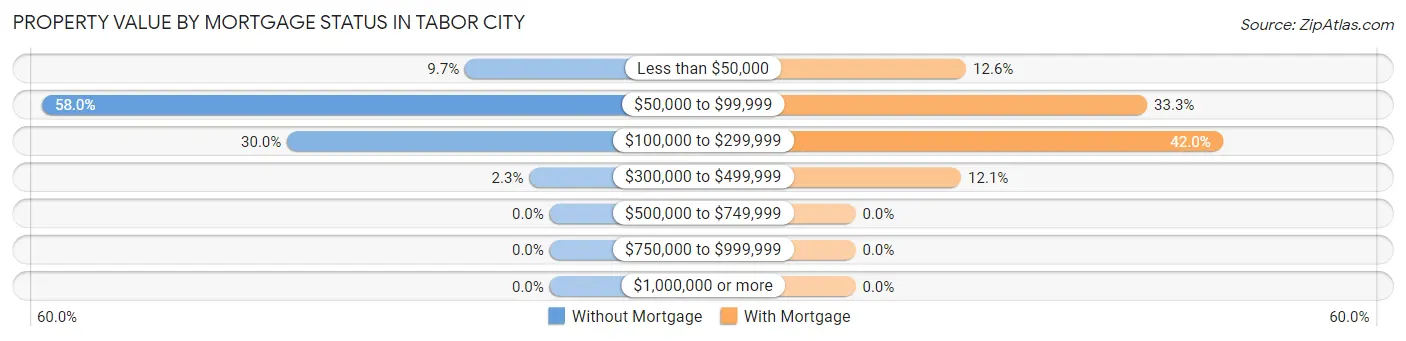
| Property Value | Without Mortgage | With Mortgage |
| Less than $50,000 | 29 (9.7%) | 22 (12.6%) |
| $50,000 to $99,999 | 174 (58.0%) | 58 (33.3%) |
| $100,000 to $299,999 | 90 (30.0%) | 73 (41.9%) |
| $300,000 to $499,999 | 7 (2.3%) | 21 (12.1%) |
| $500,000 to $749,999 | 0 (0.0%) | 0 (0.0%) |
| $750,000 to $999,999 | 0 (0.0%) | 0 (0.0%) |
| $1,000,000 or more | 0 (0.0%) | 0 (0.0%) |
| Total | 300 (100.0%) | 174 (100.0%) |
Household Income by Mortgage Status in Tabor City
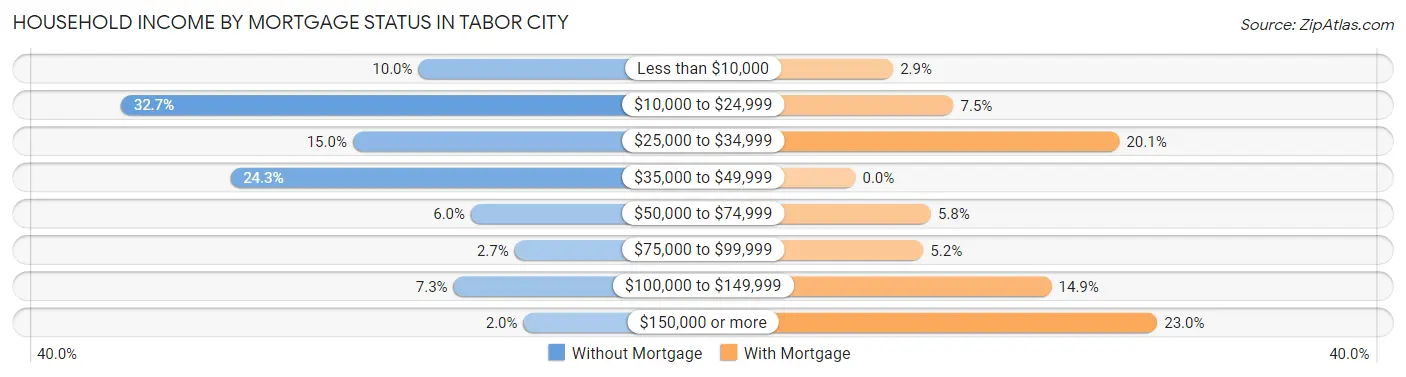
| Household Income | Without Mortgage | With Mortgage |
| Less than $10,000 | 30 (10.0%) | 5 (2.9%) |
| $10,000 to $24,999 | 98 (32.7%) | 13 (7.5%) |
| $25,000 to $34,999 | 45 (15.0%) | 35 (20.1%) |
| $35,000 to $49,999 | 73 (24.3%) | 0 (0.0%) |
| $50,000 to $74,999 | 18 (6.0%) | 10 (5.8%) |
| $75,000 to $99,999 | 8 (2.7%) | 9 (5.2%) |
| $100,000 to $149,999 | 22 (7.3%) | 26 (14.9%) |
| $150,000 or more | 6 (2.0%) | 40 (23.0%) |
| Total | 300 (100.0%) | 174 (100.0%) |
Property Value to Household Income Ratio in Tabor City
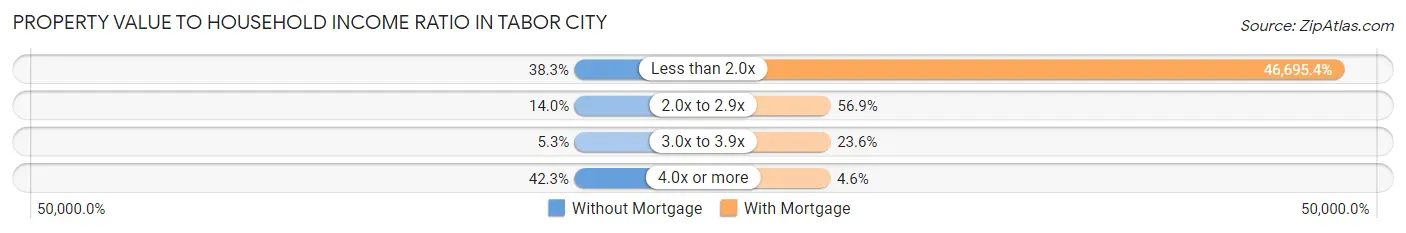
| Value-to-Income Ratio | Without Mortgage | With Mortgage |
| Less than 2.0x | 115 (38.3%) | 81,250 (46,695.4%) |
| 2.0x to 2.9x | 42 (14.0%) | 99 (56.9%) |
| 3.0x to 3.9x | 16 (5.3%) | 41 (23.6%) |
| 4.0x or more | 127 (42.3%) | 8 (4.6%) |
| Total | 300 (100.0%) | 174 (100.0%) |
Real Estate Taxes by Mortgage Status in Tabor City
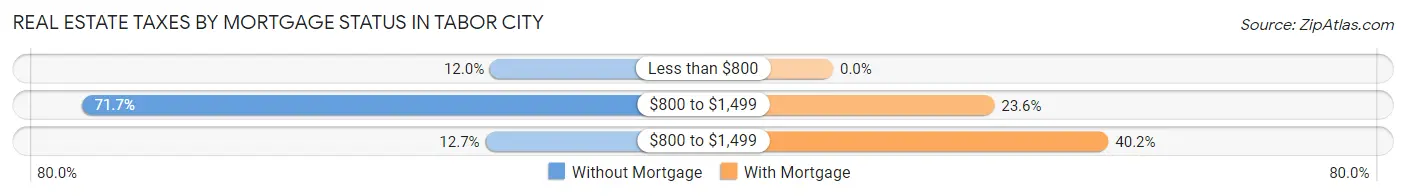
| Property Taxes | Without Mortgage | With Mortgage |
| Less than $800 | 36 (12.0%) | 0 (0.0%) |
| $800 to $1,499 | 215 (71.7%) | 41 (23.6%) |
| $800 to $1,499 | 38 (12.7%) | 70 (40.2%) |
| Total | 300 (100.0%) | 174 (100.0%) |
Health & Disability in Tabor City
Health Insurance Coverage by Age in Tabor City
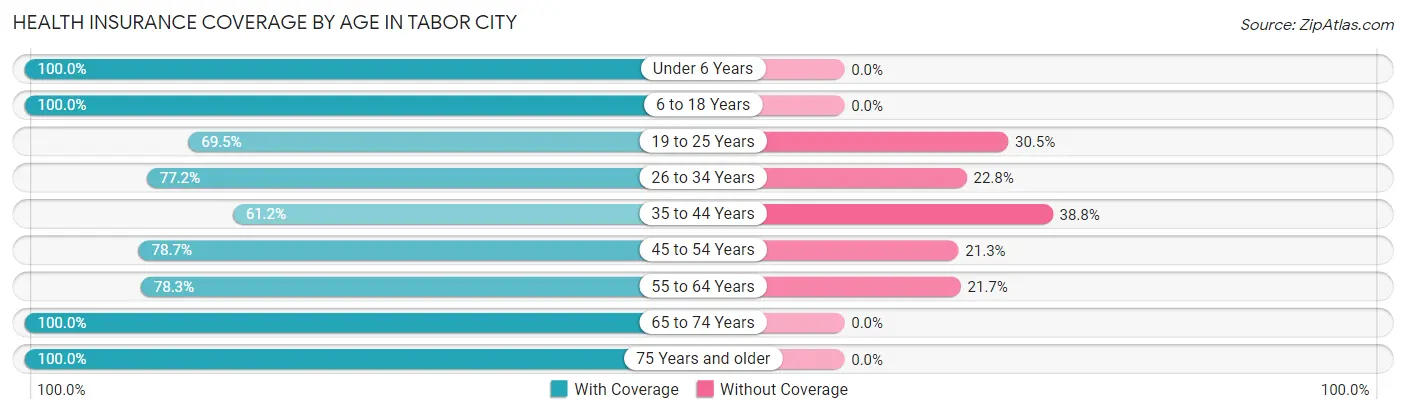
| Age Bracket | With Coverage | Without Coverage |
| Under 6 Years | 284 (100.0%) | 0 (0.0%) |
| 6 to 18 Years | 283 (100.0%) | 0 (0.0%) |
| 19 to 25 Years | 116 (69.5%) | 51 (30.5%) |
| 26 to 34 Years | 193 (77.2%) | 57 (22.8%) |
| 35 to 44 Years | 63 (61.2%) | 40 (38.8%) |
| 45 to 54 Years | 307 (78.7%) | 83 (21.3%) |
| 55 to 64 Years | 195 (78.3%) | 54 (21.7%) |
| 65 to 74 Years | 320 (100.0%) | 0 (0.0%) |
| 75 Years and older | 234 (100.0%) | 0 (0.0%) |
| Total | 1,995 (87.5%) | 285 (12.5%) |
Health Insurance Coverage by Citizenship Status in Tabor City
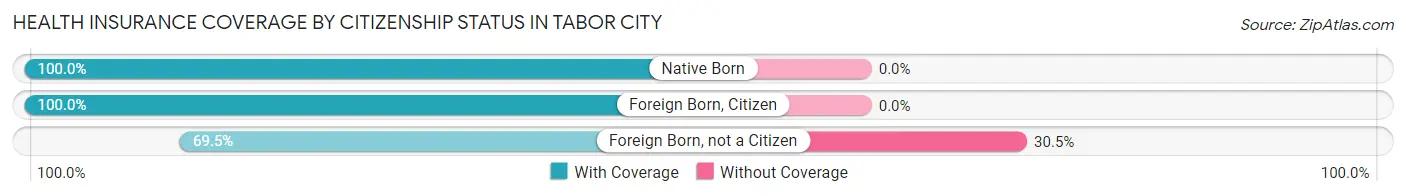
| Citizenship Status | With Coverage | Without Coverage |
| Native Born | 284 (100.0%) | 0 (0.0%) |
| Foreign Born, Citizen | 283 (100.0%) | 0 (0.0%) |
| Foreign Born, not a Citizen | 116 (69.5%) | 51 (30.5%) |
Health Insurance Coverage by Household Income in Tabor City
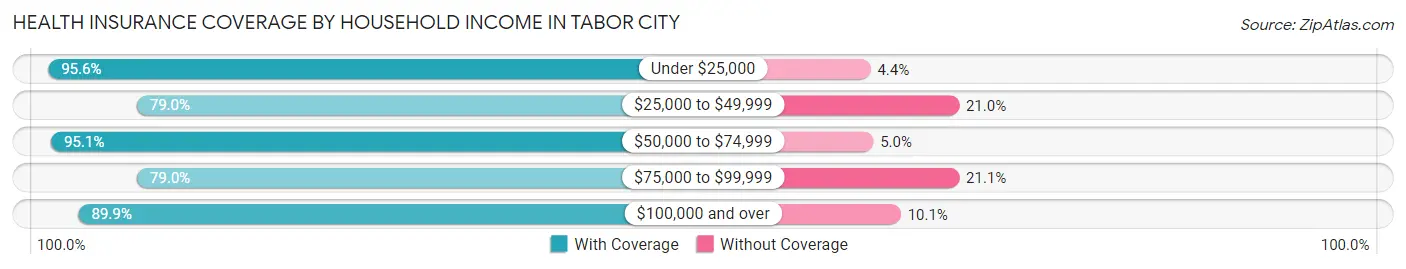
| Household Income | With Coverage | Without Coverage |
| Under $25,000 | 777 (95.6%) | 36 (4.4%) |
| $25,000 to $49,999 | 571 (79.0%) | 152 (21.0%) |
| $50,000 to $74,999 | 96 (95.1%) | 5 (5.0%) |
| $75,000 to $99,999 | 195 (78.9%) | 52 (21.0%) |
| $100,000 and over | 356 (89.9%) | 40 (10.1%) |
Public vs Private Health Insurance Coverage by Age in Tabor City
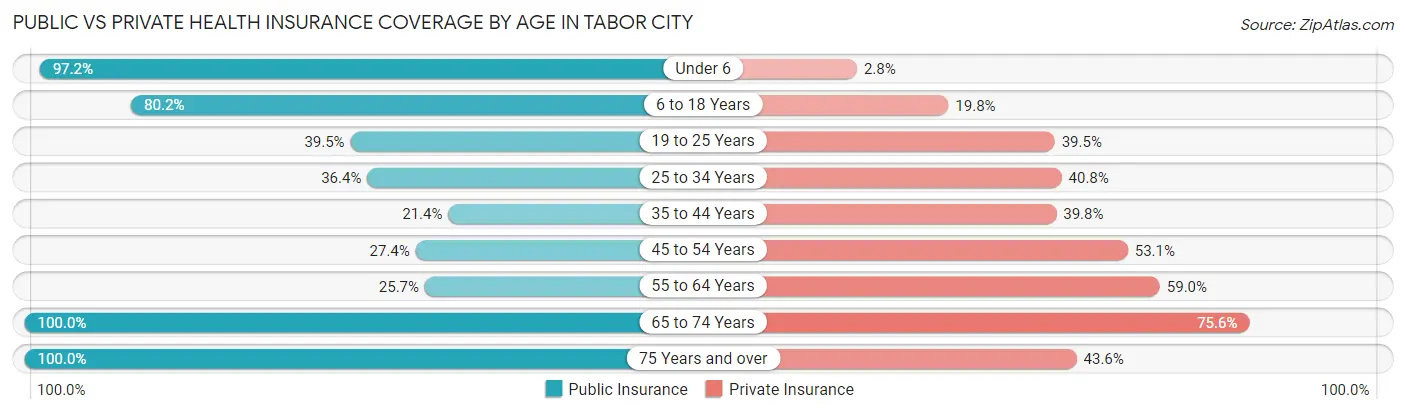
| Age Bracket | Public Insurance | Private Insurance |
| Under 6 | 276 (97.2%) | 8 (2.8%) |
| 6 to 18 Years | 227 (80.2%) | 56 (19.8%) |
| 19 to 25 Years | 66 (39.5%) | 66 (39.5%) |
| 25 to 34 Years | 91 (36.4%) | 102 (40.8%) |
| 35 to 44 Years | 22 (21.4%) | 41 (39.8%) |
| 45 to 54 Years | 107 (27.4%) | 207 (53.1%) |
| 55 to 64 Years | 64 (25.7%) | 147 (59.0%) |
| 65 to 74 Years | 320 (100.0%) | 242 (75.6%) |
| 75 Years and over | 234 (100.0%) | 102 (43.6%) |
| Total | 1,407 (61.7%) | 971 (42.6%) |
Disability Status by Sex by Age in Tabor City
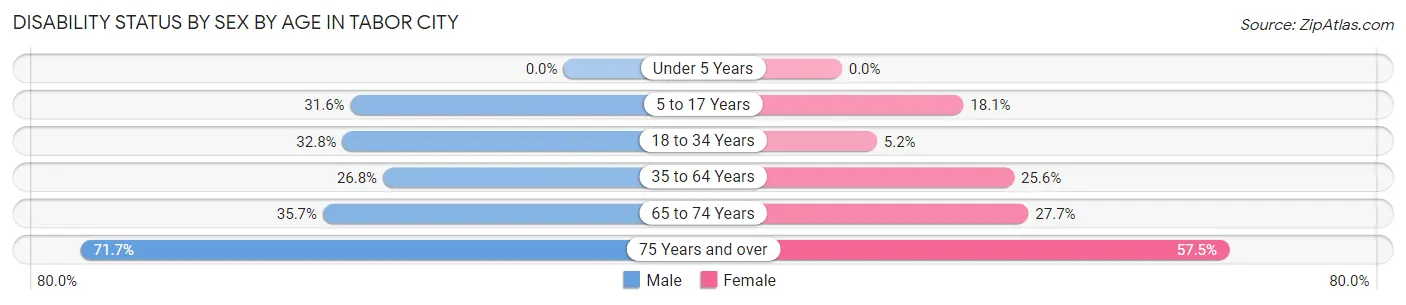
| Age Bracket | Male | Female |
| Under 5 Years | 0 (0.0%) | 0 (0.0%) |
| 5 to 17 Years | 37 (31.6%) | 28 (18.1%) |
| 18 to 34 Years | 83 (32.8%) | 11 (5.2%) |
| 35 to 64 Years | 71 (26.8%) | 122 (25.6%) |
| 65 to 74 Years | 55 (35.7%) | 46 (27.7%) |
| 75 Years and over | 43 (71.7%) | 100 (57.5%) |
Disability Class by Sex by Age in Tabor City
Disability Class: Hearing Difficulty
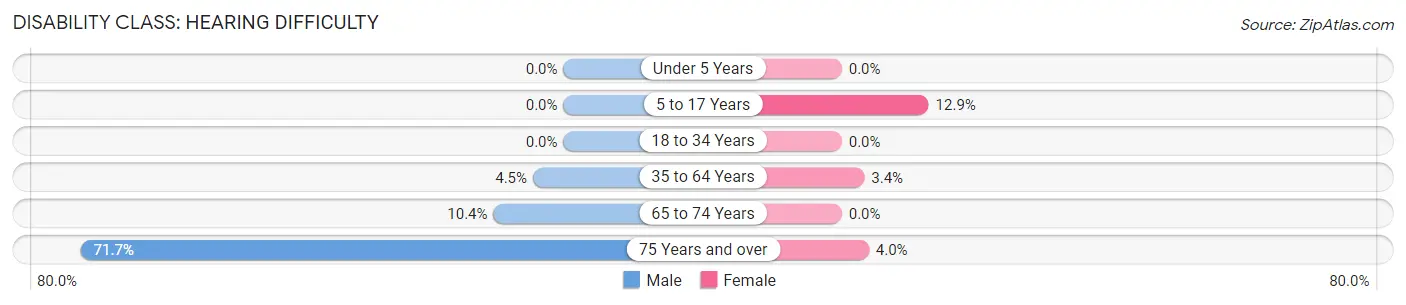
| Age Bracket | Male | Female |
| Under 5 Years | 0 (0.0%) | 0 (0.0%) |
| 5 to 17 Years | 0 (0.0%) | 20 (12.9%) |
| 18 to 34 Years | 0 (0.0%) | 0 (0.0%) |
| 35 to 64 Years | 12 (4.5%) | 16 (3.4%) |
| 65 to 74 Years | 16 (10.4%) | 0 (0.0%) |
| 75 Years and over | 43 (71.7%) | 7 (4.0%) |
Disability Class: Vision Difficulty
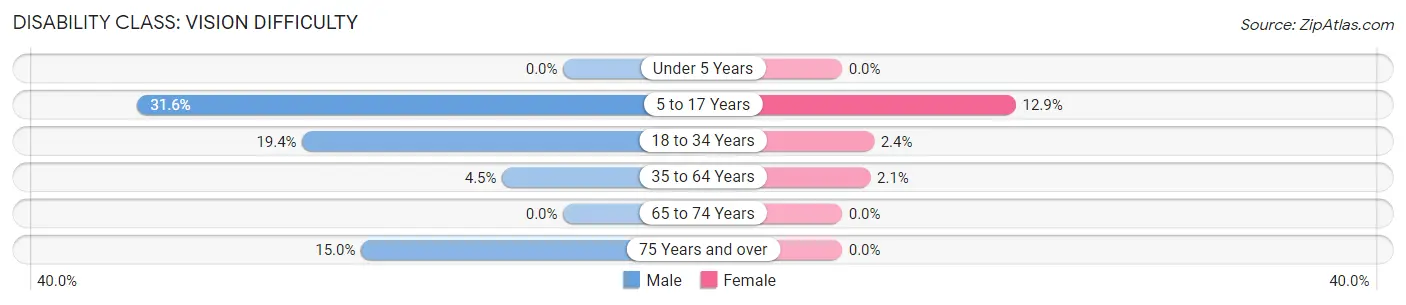
| Age Bracket | Male | Female |
| Under 5 Years | 0 (0.0%) | 0 (0.0%) |
| 5 to 17 Years | 37 (31.6%) | 20 (12.9%) |
| 18 to 34 Years | 49 (19.4%) | 5 (2.4%) |
| 35 to 64 Years | 12 (4.5%) | 10 (2.1%) |
| 65 to 74 Years | 0 (0.0%) | 0 (0.0%) |
| 75 Years and over | 9 (15.0%) | 0 (0.0%) |
Disability Class: Cognitive Difficulty
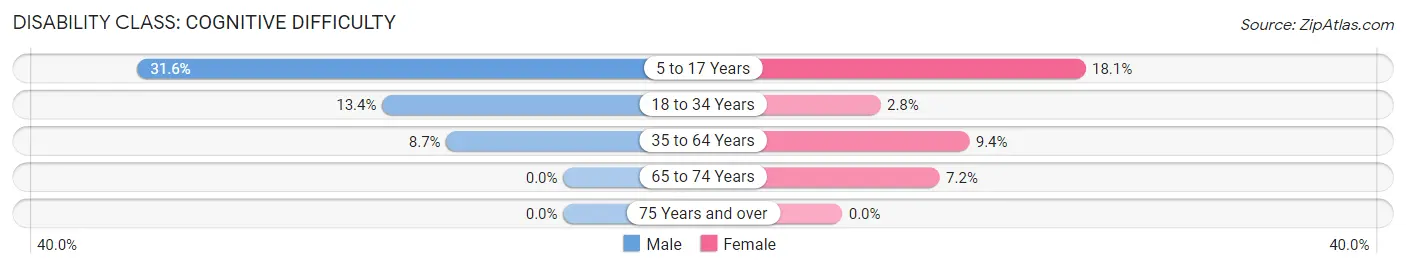
| Age Bracket | Male | Female |
| 5 to 17 Years | 37 (31.6%) | 28 (18.1%) |
| 18 to 34 Years | 34 (13.4%) | 6 (2.8%) |
| 35 to 64 Years | 23 (8.7%) | 45 (9.4%) |
| 65 to 74 Years | 0 (0.0%) | 12 (7.2%) |
| 75 Years and over | 0 (0.0%) | 0 (0.0%) |
Disability Class: Ambulatory Difficulty
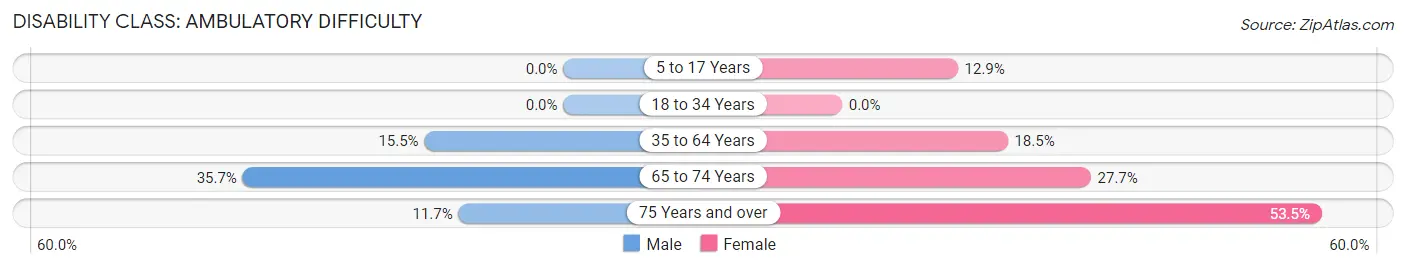
| Age Bracket | Male | Female |
| 5 to 17 Years | 0 (0.0%) | 20 (12.9%) |
| 18 to 34 Years | 0 (0.0%) | 0 (0.0%) |
| 35 to 64 Years | 41 (15.5%) | 88 (18.4%) |
| 65 to 74 Years | 55 (35.7%) | 46 (27.7%) |
| 75 Years and over | 7 (11.7%) | 93 (53.4%) |
Disability Class: Self-Care Difficulty
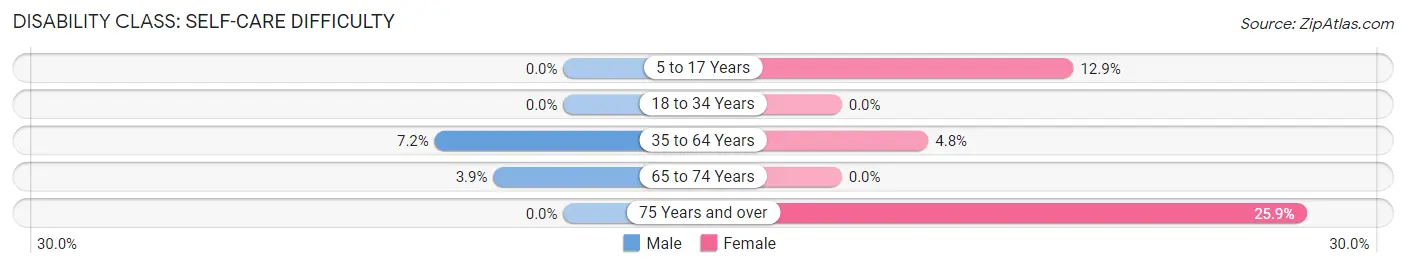
| Age Bracket | Male | Female |
| 5 to 17 Years | 0 (0.0%) | 20 (12.9%) |
| 18 to 34 Years | 0 (0.0%) | 0 (0.0%) |
| 35 to 64 Years | 19 (7.2%) | 23 (4.8%) |
| 65 to 74 Years | 6 (3.9%) | 0 (0.0%) |
| 75 Years and over | 0 (0.0%) | 45 (25.9%) |
Technology Access in Tabor City
Computing Device Access in Tabor City
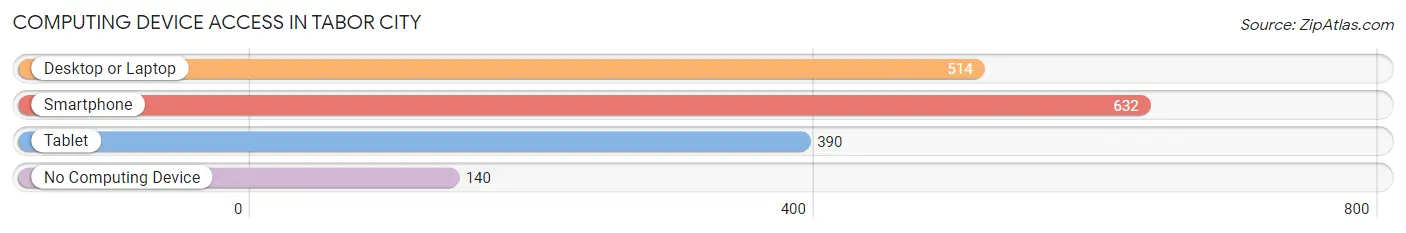
| Device Type | # Households | % Households |
| Desktop or Laptop | 514 | 59.4% |
| Smartphone | 632 | 73.0% |
| Tablet | 390 | 45.0% |
| No Computing Device | 140 | 16.2% |
| Total | 866 | 100.0% |
Internet Access in Tabor City
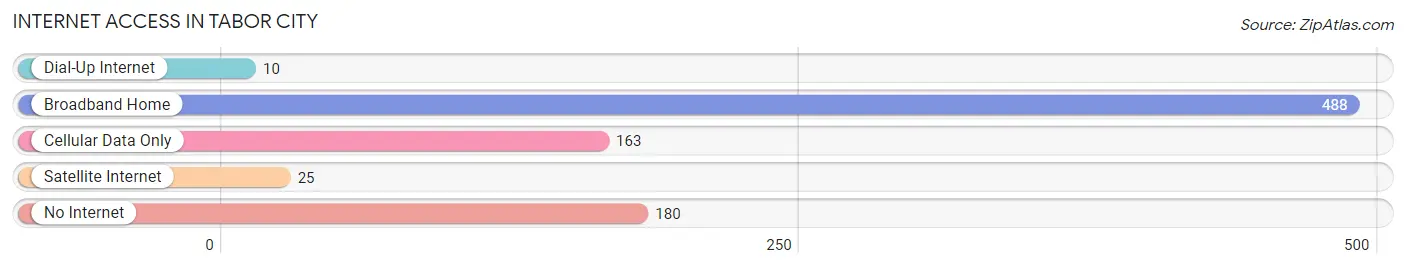
| Internet Type | # Households | % Households |
| Dial-Up Internet | 10 | 1.1% |
| Broadband Home | 488 | 56.4% |
| Cellular Data Only | 163 | 18.8% |
| Satellite Internet | 25 | 2.9% |
| No Internet | 180 | 20.8% |
| Total | 866 | 100.0% |
Tabor City Summary
Tabor City is a small town located in Columbus County, North Carolina. It is situated on the banks of the Waccamaw River, approximately 20 miles from the Atlantic Ocean. The town was founded in 1883 and named after the biblical Mount Tabor. It is a rural community with a population of approximately 2,500 people.
Geography
Tabor City is located in the southeastern corner of North Carolina, near the border with South Carolina. It is situated on the banks of the Waccamaw River, approximately 20 miles from the Atlantic Ocean. The town is surrounded by a number of small towns and villages, including Whiteville, Chadbourn, and Lake Waccamaw. The town is located in a humid subtropical climate zone, with hot, humid summers and mild winters.
Economy
Tabor City’s economy is largely based on agriculture and manufacturing. The town is home to several large poultry processing plants, as well as a number of smaller businesses. The town is also home to a number of retail stores, restaurants, and other services. The town is also home to a number of small farms, which produce a variety of crops, including corn, soybeans, and cotton.
Demographics
As of the 2010 census, Tabor City had a population of 2,500 people. The racial makeup of the town was 79.2% White, 17.2% African American, 0.4% Native American, 0.4% Asian, 0.2% Pacific Islander, and 2.8% from other races. The median household income was $25,000, and the median family income was $30,000. The town’s population is largely rural, with a large percentage of the population living below the poverty line.
History
Tabor City was founded in 1883 and named after the biblical Mount Tabor. The town was originally a small farming community, but it began to grow in the early 20th century when the Atlantic Coast Line Railroad built a line through the town. The town was also home to a number of sawmills and lumber companies, which provided employment for many of the town’s residents. In the 1950s, the town began to experience a decline in population as many of the town’s residents moved away in search of better job opportunities. In the late 1970s, the town began to experience a resurgence in population as the poultry industry began to move into the area. Today, Tabor City is a small, rural community with a population of approximately 2,500 people.
Common Questions
What is the Total Population of Tabor City?
Total Population of Tabor City is 3,709.
What is the Total Male Population of Tabor City?
Total Male Population of Tabor City is 2,316.
What is the Total Female Population of Tabor City?
Total Female Population of Tabor City is 1,393.
What is the Ratio of Males per 100 Females in Tabor City?
There are 166.26 Males per 100 Females in Tabor City.
What is the Ratio of Females per 100 Males in Tabor City?
There are 60.15 Females per 100 Males in Tabor City.
What is the Median Population Age in Tabor City?
Median Population Age in Tabor City is 41.6 Years.
What is the Average Family Size in Tabor City
Average Family Size in Tabor City is 3.2 People.
What is the Average Household Size in Tabor City
Average Household Size in Tabor City is 2.6 People.
What is Per Capita Income in Tabor City?
Per Capita income in Tabor City is $16,230.
What is the Median Family Income in Tabor City?
Median Family Income in Tabor City is $43,710.
What is the Median Household income in Tabor City?
Median Household Income in Tabor City is $34,722.
What is Income or Wage Gap in Tabor City?
Income or Wage Gap in Tabor City is 57.0%.
Women in Tabor City earn 43.0 cents for every dollar earned by a man.
What is Family Income Deficit in Tabor City?
Family Income Deficit in Tabor City is $9,491.
Families that are below poverty line in Tabor City earn $9,491 less on average than the poverty threshold level.
What is Inequality or Gini Index in Tabor City?
Inequality or Gini Index in Tabor City is 0.53.
How Large is the Labor Force in Tabor City?
There are 819 People in the Labor Forcein in Tabor City.
What is the Percentage of People in the Labor Force in Tabor City?
25.5% of People are in the Labor Force in Tabor City.
What is the Unemployment Rate in Tabor City?
Unemployment Rate in Tabor City is 6.1%.