Breckenridge Hills, MO
Breckenridge Hills Map
Breckenridge Hills Overview
4,452
TOTAL POPULATION
2,294
MALE POPULATION
2,158
FEMALE POPULATION
106.30
MALES / 100 FEMALES
94.07
FEMALES / 100 MALES
34.5
MEDIAN AGE
2.6
AVG FAMILY SIZE
2.3
AVG HOUSEHOLD SIZE
$29,419
PER CAPITA INCOME
$48,409
AVG FAMILY INCOME
$49,198
AVG HOUSEHOLD INCOME
16.9%
WAGE / INCOME GAP [ % ]
83.1¢/ $1
WAGE / INCOME GAP [ $ ]
$19,648
FAMILY INCOME DEFICIT
0.49
INEQUALITY / GINI INDEX
2,477
LABOR FORCE [ PEOPLE ]
72.1%
PERCENT IN LABOR FORCE
8.2%
UNEMPLOYMENT RATE
Breckenridge Hills Area Codes
Race in Breckenridge Hills
The most populous races in Breckenridge Hills are White / Caucasian (2,144 | 48.2%), Black / African American (1,219 | 27.4%), and Hispanic or Latino (931 | 20.9%).

| Race | # Population | % Population |
| Asian | 0 | 0.0% |
| Black / African American | 1,219 | 27.4% |
| Hawaiian / Pacific | 0 | 0.0% |
| Hispanic or Latino | 931 | 20.9% |
| Native / Alaskan | 0 | 0.0% |
| White / Caucasian | 2,144 | 48.2% |
| Two or more Races | 308 | 6.9% |
| Some other Race | 781 | 17.5% |
| Total | 4,452 | 100.0% |
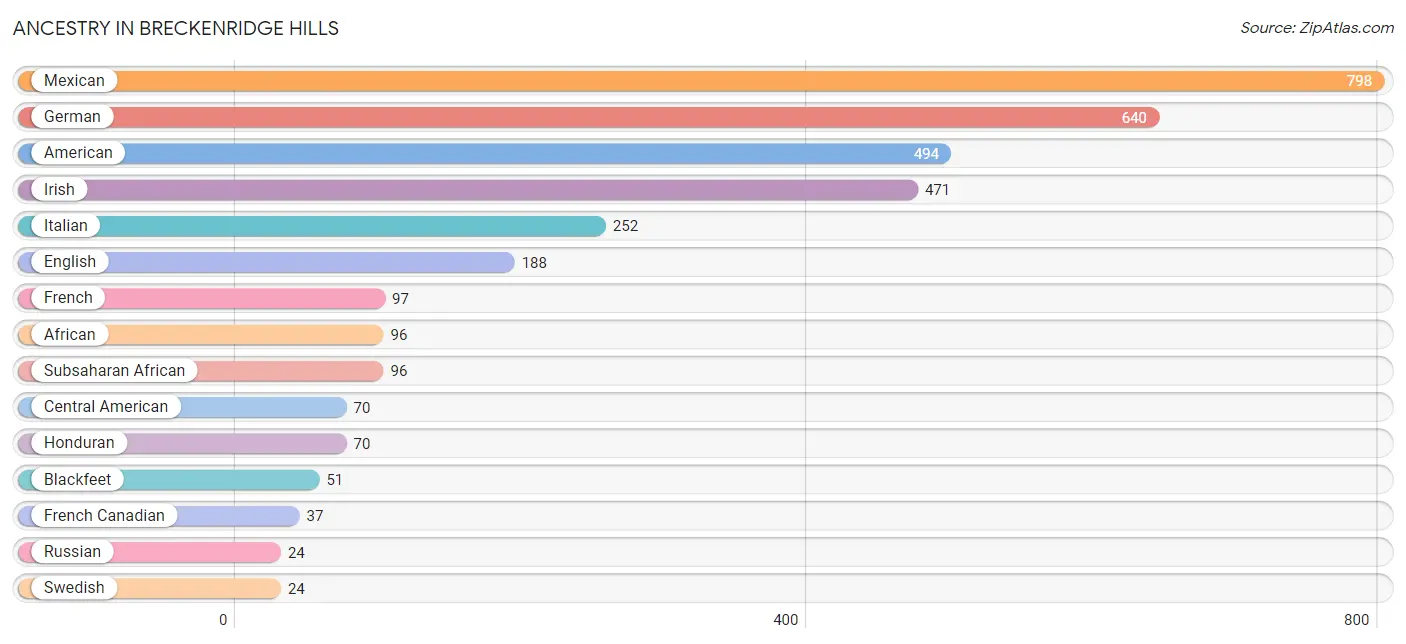
Ancestry in Breckenridge Hills
The most populous ancestries reported in Breckenridge Hills are Mexican (798 | 17.9%), German (640 | 14.4%), American (494 | 11.1%), Irish (471 | 10.6%), and Italian (252 | 5.7%), together accounting for 59.6% of all Breckenridge Hills residents.
| Ancestry | # Population | % Population |
| African | 96 | 2.2% |
| American | 494 | 11.1% |
| Belgian | 20 | 0.4% |
| Blackfeet | 51 | 1.1% |
| Central American | 70 | 1.6% |
| English | 188 | 4.2% |
| French | 97 | 2.2% |
| French Canadian | 37 | 0.8% |
| German | 640 | 14.4% |
| Honduran | 70 | 1.6% |
| Irish | 471 | 10.6% |
| Italian | 252 | 5.7% |
| Mexican | 798 | 17.9% |
| Russian | 24 | 0.5% |
| Subsaharan African | 96 | 2.2% |
| Swedish | 24 | 0.5% | View All 16 Rows |
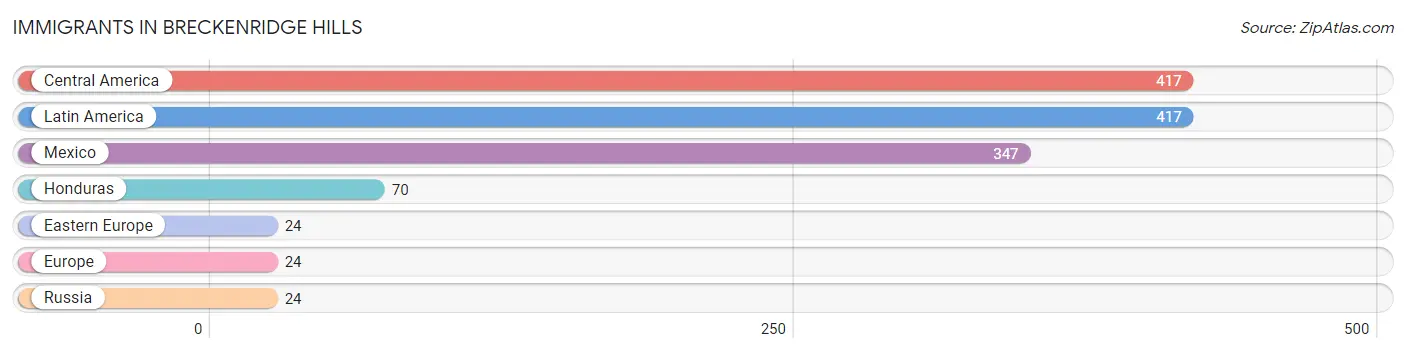
Immigrants in Breckenridge Hills
The most numerous immigrant groups reported in Breckenridge Hills came from Central America (417 | 9.4%), Latin America (417 | 9.4%), Mexico (347 | 7.8%), Honduras (70 | 1.6%), and Eastern Europe (24 | 0.5%), together accounting for 28.6% of all Breckenridge Hills residents.
| Immigration Origin | # Population | % Population |
| Central America | 417 | 9.4% |
| Eastern Europe | 24 | 0.5% |
| Europe | 24 | 0.5% |
| Honduras | 70 | 1.6% |
| Latin America | 417 | 9.4% |
| Mexico | 347 | 7.8% |
| Russia | 24 | 0.5% | View All 7 Rows |
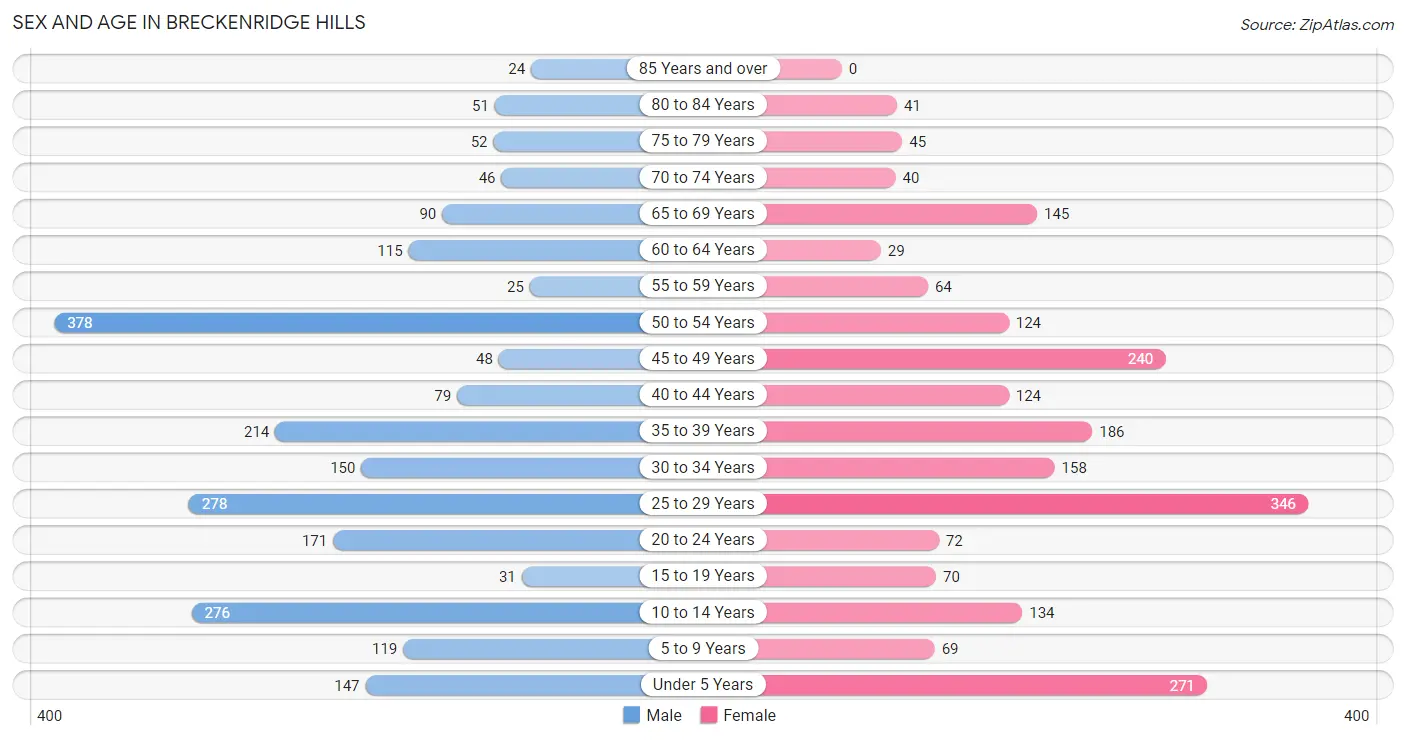
Sex and Age in Breckenridge Hills
Sex and Age in Breckenridge Hills
The most populous age groups in Breckenridge Hills are 50 to 54 Years (378 | 16.5%) for men and 25 to 29 Years (346 | 16.0%) for women.
| Age Bracket | Male | Female |
| Under 5 Years | 147 (6.4%) | 271 (12.6%) |
| 5 to 9 Years | 119 (5.2%) | 69 (3.2%) |
| 10 to 14 Years | 276 (12.0%) | 134 (6.2%) |
| 15 to 19 Years | 31 (1.3%) | 70 (3.2%) |
| 20 to 24 Years | 171 (7.4%) | 72 (3.3%) |
| 25 to 29 Years | 278 (12.1%) | 346 (16.0%) |
| 30 to 34 Years | 150 (6.5%) | 158 (7.3%) |
| 35 to 39 Years | 214 (9.3%) | 186 (8.6%) |
| 40 to 44 Years | 79 (3.4%) | 124 (5.8%) |
| 45 to 49 Years | 48 (2.1%) | 240 (11.1%) |
| 50 to 54 Years | 378 (16.5%) | 124 (5.8%) |
| 55 to 59 Years | 25 (1.1%) | 64 (3.0%) |
| 60 to 64 Years | 115 (5.0%) | 29 (1.3%) |
| 65 to 69 Years | 90 (3.9%) | 145 (6.7%) |
| 70 to 74 Years | 46 (2.0%) | 40 (1.8%) |
| 75 to 79 Years | 52 (2.3%) | 45 (2.1%) |
| 80 to 84 Years | 51 (2.2%) | 41 (1.9%) |
| 85 Years and over | 24 (1.1%) | 0 (0.0%) |
| Total | 2,294 (100.0%) | 2,158 (100.0%) |
Families and Households in Breckenridge Hills
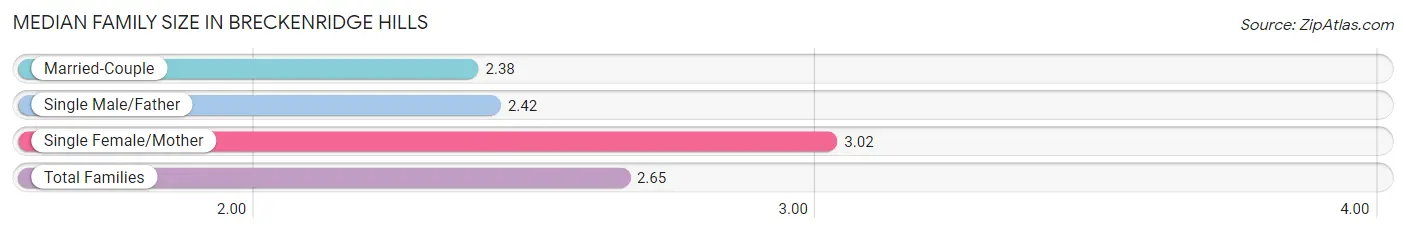
Median Family Size in Breckenridge Hills
The median family size in Breckenridge Hills is 2.65 persons per family, with single female/mother families (460 | 40.3%) accounting for the largest median family size of 3.02 persons per family. On the other hand, married-couple families (418 | 36.6%) represent the smallest median family size with 2.38 persons per family.
| Family Type | # Families | Family Size |
| Married-Couple | 418 (36.6%) | 2.38 |
| Single Male/Father | 264 (23.1%) | 2.42 |
| Single Female/Mother | 460 (40.3%) | 3.02 |
| Total Families | 1,142 (100.0%) | 2.65 |
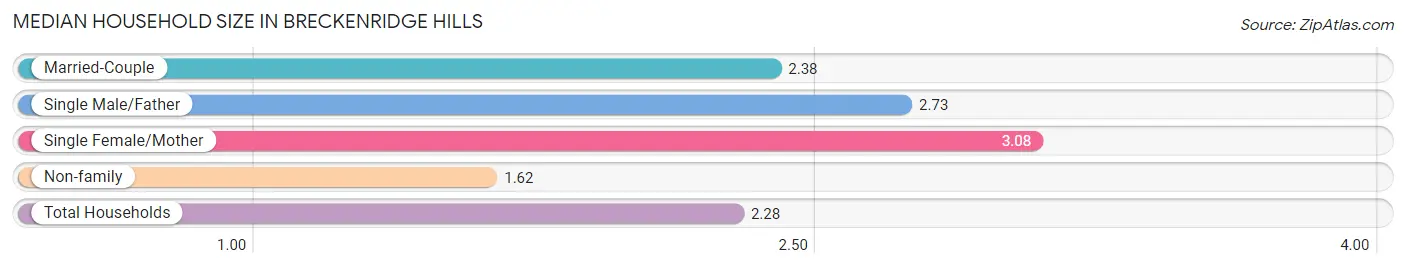
Median Household Size in Breckenridge Hills
The median household size in Breckenridge Hills is 2.28 persons per household, with single female/mother households (460 | 23.5%) accounting for the largest median household size of 3.08 persons per household. non-family households (813 | 41.6%) represent the smallest median household size with 1.62 persons per household.
| Household Type | # Households | Household Size |
| Married-Couple | 418 (21.4%) | 2.38 |
| Single Male/Father | 264 (13.5%) | 2.73 |
| Single Female/Mother | 460 (23.5%) | 3.08 |
| Non-family | 813 (41.6%) | 1.62 |
| Total Households | 1,955 (100.0%) | 2.28 |
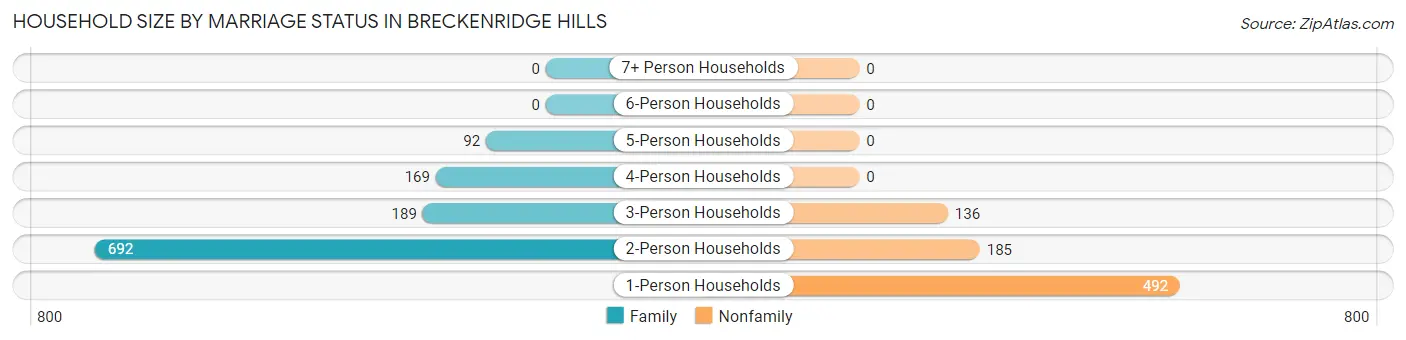
Household Size by Marriage Status in Breckenridge Hills
Out of a total of 1,955 households in Breckenridge Hills, 1,142 (58.4%) are family households, while 813 (41.6%) are nonfamily households. The most numerous type of family households are 2-person households, comprising 692, and the most common type of nonfamily households are 1-person households, comprising 492.
| Household Size | Family Households | Nonfamily Households |
| 1-Person Households | - | 492 (25.2%) |
| 2-Person Households | 692 (35.4%) | 185 (9.5%) |
| 3-Person Households | 189 (9.7%) | 136 (7.0%) |
| 4-Person Households | 169 (8.6%) | 0 (0.0%) |
| 5-Person Households | 92 (4.7%) | 0 (0.0%) |
| 6-Person Households | 0 (0.0%) | 0 (0.0%) |
| 7+ Person Households | 0 (0.0%) | 0 (0.0%) |
| Total | 1,142 (58.4%) | 813 (41.6%) |
Female Fertility in Breckenridge Hills
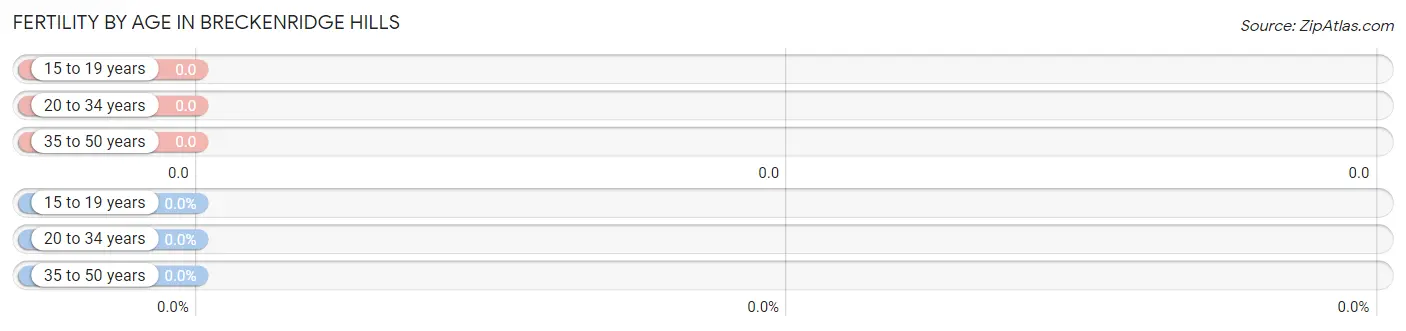
Fertility by Age in Breckenridge Hills
| Age Bracket | Women with Births | Births / 1,000 Women |
| 15 to 19 years | 0 (0.0%) | 0.0 |
| 20 to 34 years | 0 (0.0%) | 0.0 |
| 35 to 50 years | 0 (0.0%) | 0.0 |
| Total | 0 (0.0%) | 0.0 |
Fertility by Age by Marriage Status in Breckenridge Hills
| Age Bracket | Married | Unmarried |
| 15 to 19 years | 0 (0.0%) | 0 (0.0%) |
| 20 to 34 years | 0 (0.0%) | 0 (0.0%) |
| 35 to 50 years | 0 (0.0%) | 0 (0.0%) |
| Total | 0 (0.0%) | 0 (0.0%) |
Fertility by Education in Breckenridge Hills
| Educational Attainment | Women with Births | Births / 1,000 Women |
| Less than High School | 0 (0.0%) | 0.0 |
| High School Diploma | 0 (0.0%) | 0.0 |
| College or Associate's Degree | 0 (0.0%) | 0.0 |
| Bachelor's Degree | 0 (0.0%) | 0.0 |
| Graduate Degree | 0 (0.0%) | 0.0 |
| Total | 0 (0.0%) | 0.0 |
Fertility by Education by Marriage Status in Breckenridge Hills
| Educational Attainment | Married | Unmarried |
| Less than High School | 0 (0.0%) | 0 (0.0%) |
| High School Diploma | 0 (0.0%) | 0 (0.0%) |
| College or Associate's Degree | 0 (0.0%) | 0 (0.0%) |
| Bachelor's Degree | 0 (0.0%) | 0 (0.0%) |
| Graduate Degree | 0 (0.0%) | 0 (0.0%) |
| Total | 0 (0.0%) | 0 (0.0%) |
Income in Breckenridge Hills
Income Overview in Breckenridge Hills
Per Capita Income in Breckenridge Hills is $29,419, while median incomes of families and households are $48,409 and $49,198 respectively.
| Characteristic | Number | Measure |
| Per Capita Income | 4,452 | $29,419 |
| Median Family Income | 1,142 | $48,409 |
| Mean Family Income | 1,142 | $56,743 |
| Median Household Income | 1,955 | $49,198 |
| Mean Household Income | 1,955 | $64,651 |
| Income Deficit | 1,142 | $19,648 |
| Wage / Income Gap (%) | 4,452 | 16.86% |
| Wage / Income Gap ($) | 4,452 | 83.14¢ per $1 |
| Gini / Inequality Index | 4,452 | 0.49 |
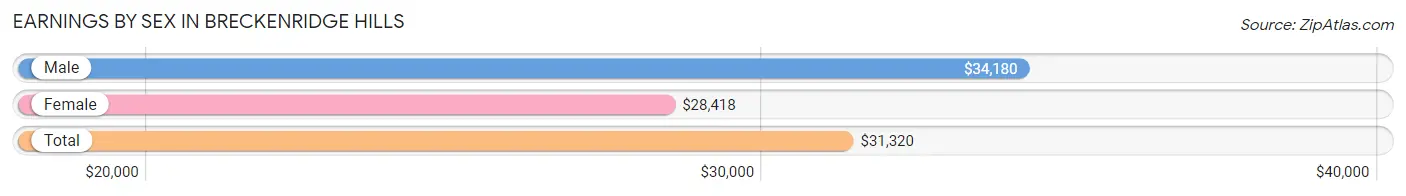
Earnings by Sex in Breckenridge Hills
Average Earnings in Breckenridge Hills are $31,320, $34,180 for men and $28,418 for women, a difference of 16.9%.
| Sex | Number | Average Earnings |
| Male | 1,282 (52.6%) | $34,180 |
| Female | 1,154 (47.4%) | $28,418 |
| Total | 2,436 (100.0%) | $31,320 |
Earnings by Sex by Income Bracket in Breckenridge Hills
The most common earnings brackets in Breckenridge Hills are $45,000 to $49,999 for men (300 | 23.4%) and $55,000 to $64,999 for women (189 | 16.4%).
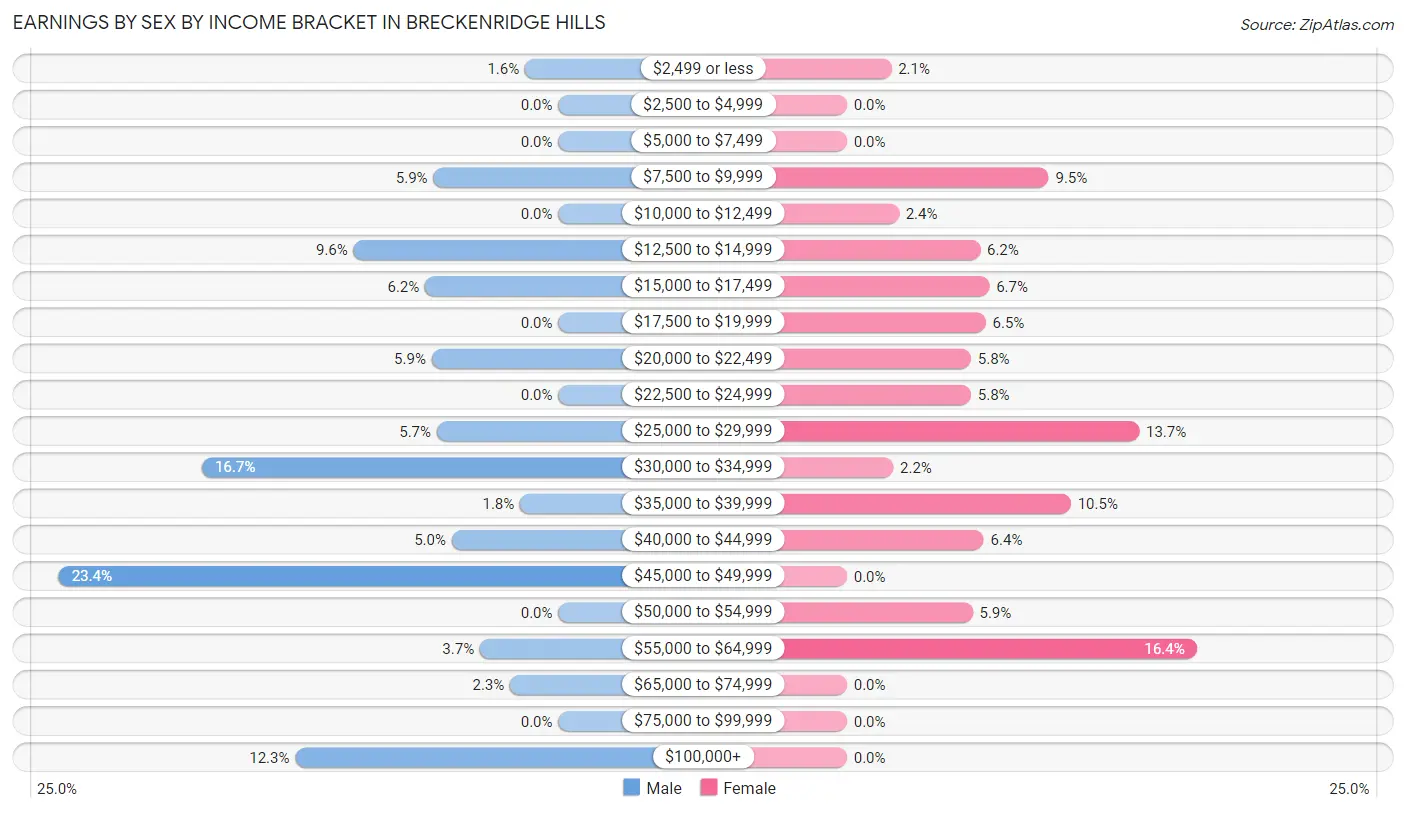
| Income | Male | Female |
| $2,499 or less | 20 (1.6%) | 24 (2.1%) |
| $2,500 to $4,999 | 0 (0.0%) | 0 (0.0%) |
| $5,000 to $7,499 | 0 (0.0%) | 0 (0.0%) |
| $7,500 to $9,999 | 75 (5.9%) | 109 (9.5%) |
| $10,000 to $12,499 | 0 (0.0%) | 28 (2.4%) |
| $12,500 to $14,999 | 123 (9.6%) | 72 (6.2%) |
| $15,000 to $17,499 | 80 (6.2%) | 77 (6.7%) |
| $17,500 to $19,999 | 0 (0.0%) | 75 (6.5%) |
| $20,000 to $22,499 | 76 (5.9%) | 67 (5.8%) |
| $22,500 to $24,999 | 0 (0.0%) | 67 (5.8%) |
| $25,000 to $29,999 | 73 (5.7%) | 158 (13.7%) |
| $30,000 to $34,999 | 214 (16.7%) | 25 (2.2%) |
| $35,000 to $39,999 | 23 (1.8%) | 121 (10.5%) |
| $40,000 to $44,999 | 64 (5.0%) | 74 (6.4%) |
| $45,000 to $49,999 | 300 (23.4%) | 0 (0.0%) |
| $50,000 to $54,999 | 0 (0.0%) | 68 (5.9%) |
| $55,000 to $64,999 | 47 (3.7%) | 189 (16.4%) |
| $65,000 to $74,999 | 29 (2.3%) | 0 (0.0%) |
| $75,000 to $99,999 | 0 (0.0%) | 0 (0.0%) |
| $100,000+ | 158 (12.3%) | 0 (0.0%) |
| Total | 1,282 (100.0%) | 1,154 (100.0%) |
Earnings by Sex by Educational Attainment in Breckenridge Hills
Average earnings in Breckenridge Hills are $33,135 for men and $28,062 for women, a difference of 15.3%. Men with an educational attainment of high school diploma enjoy the highest average annual earnings of $45,104, while those with less than high school education earn the least with $25,813. Women with an educational attainment of college or associate's degree earn the most with the average annual earnings of $29,270, while those with high school diploma education have the smallest earnings of $15,275.
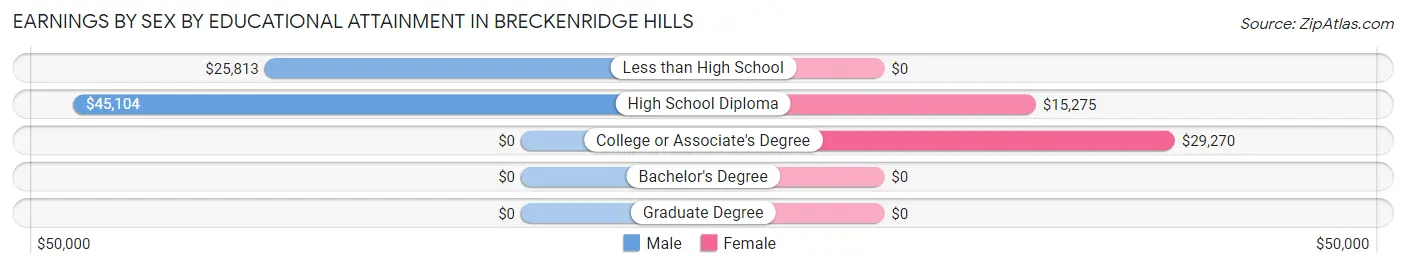
| Educational Attainment | Male Income | Female Income |
| Less than High School | $25,813 | $0 |
| High School Diploma | $45,104 | $15,275 |
| College or Associate's Degree | - | - |
| Bachelor's Degree | - | - |
| Graduate Degree | - | - |
| Total | $33,135 | $28,062 |
Family Income in Breckenridge Hills
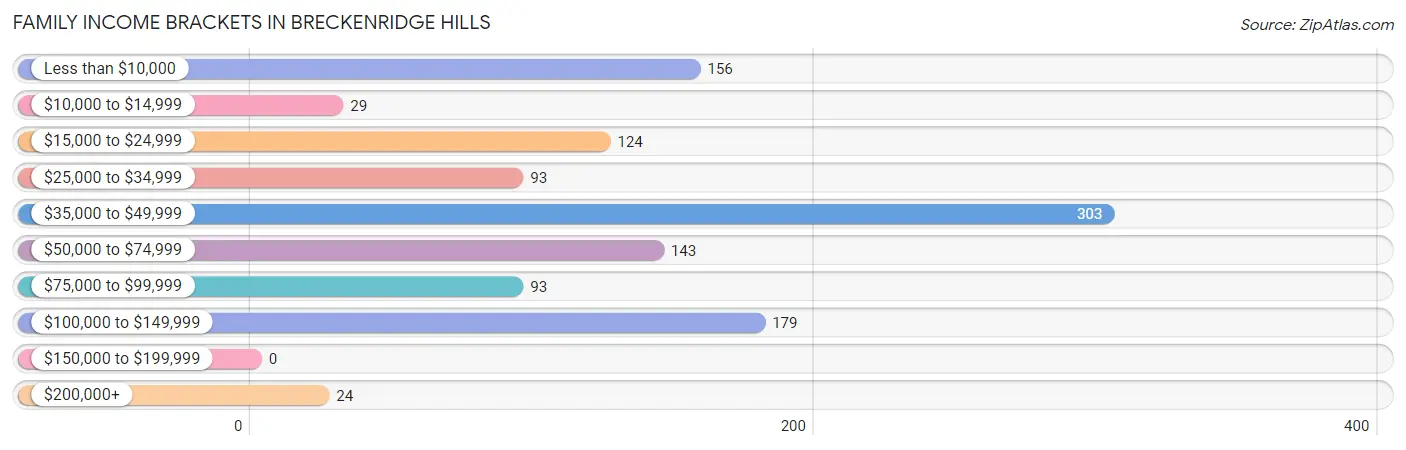
Family Income Brackets in Breckenridge Hills
According to the Breckenridge Hills family income data, there are 303 families falling into the $35,000 to $49,999 income range, which is the most common income bracket and makes up 26.5% of all families.
| Income Bracket | # Families | % Families |
| Less than $10,000 | 156 | 13.7% |
| $10,000 to $14,999 | 29 | 2.5% |
| $15,000 to $24,999 | 124 | 10.9% |
| $25,000 to $34,999 | 93 | 8.1% |
| $35,000 to $49,999 | 303 | 26.5% |
| $50,000 to $74,999 | 143 | 12.5% |
| $75,000 to $99,999 | 93 | 8.1% |
| $100,000 to $149,999 | 179 | 15.7% |
| $150,000 to $199,999 | 0 | 0.0% |
| $200,000+ | 24 | 2.1% |
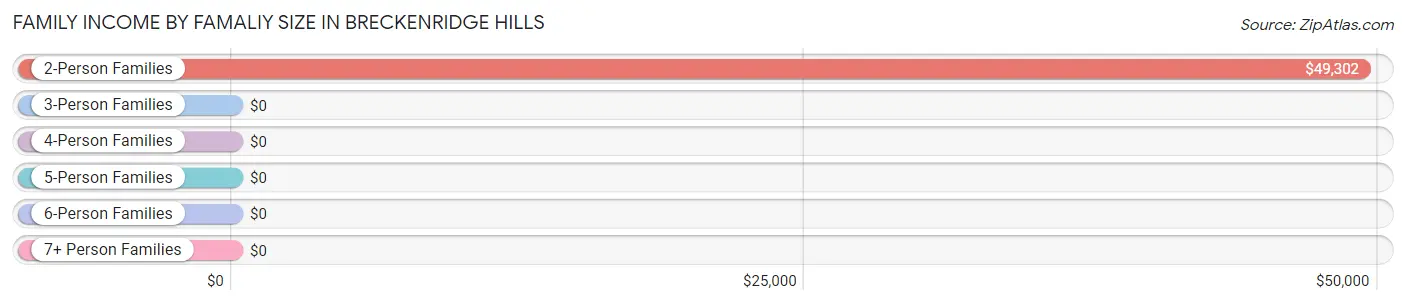
Family Income by Famaliy Size in Breckenridge Hills
2-person families (692 | 60.6%) account for the highest median family income in Breckenridge Hills with $49,302 per family, while 2-person families (692 | 60.6%) have the highest median income of $24,651 per family member.
| Income Bracket | # Families | Median Income |
| 2-Person Families | 692 (60.6%) | $49,302 |
| 3-Person Families | 213 (18.6%) | $0 |
| 4-Person Families | 237 (20.7%) | $0 |
| 5-Person Families | 0 (0.0%) | $0 |
| 6-Person Families | 0 (0.0%) | $0 |
| 7+ Person Families | 0 (0.0%) | $0 |
| Total | 1,142 (100.0%) | $48,409 |
Family Income by Number of Earners in Breckenridge Hills
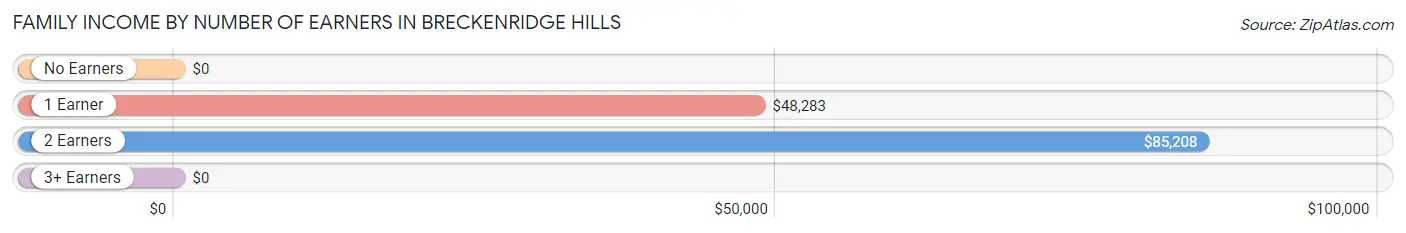
| Number of Earners | # Families | Median Income |
| No Earners | 151 (13.2%) | $0 |
| 1 Earner | 773 (67.7%) | $48,283 |
| 2 Earners | 218 (19.1%) | $85,208 |
| 3+ Earners | 0 (0.0%) | $0 |
| Total | 1,142 (100.0%) | $48,409 |
Household Income in Breckenridge Hills
Household Income Brackets in Breckenridge Hills
With 534 households falling in the category, the $50,000 to $74,999 income range is the most frequent in Breckenridge Hills, accounting for 27.3% of all households.
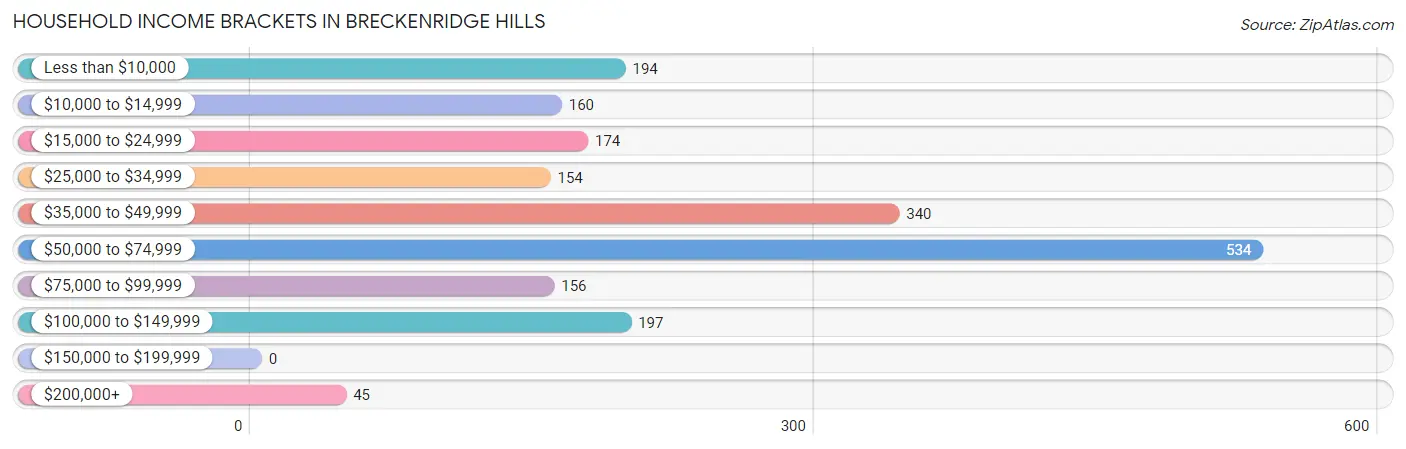
| Income Bracket | # Households | % Households |
| Less than $10,000 | 194 | 9.9% |
| $10,000 to $14,999 | 160 | 8.2% |
| $15,000 to $24,999 | 174 | 8.9% |
| $25,000 to $34,999 | 154 | 7.9% |
| $35,000 to $49,999 | 340 | 17.4% |
| $50,000 to $74,999 | 534 | 27.3% |
| $75,000 to $99,999 | 156 | 8.0% |
| $100,000 to $149,999 | 197 | 10.1% |
| $150,000 to $199,999 | 0 | 0.0% |
| $200,000+ | 45 | 2.3% |
Household Income by Householder Age in Breckenridge Hills
The median household income in Breckenridge Hills is $49,198, with the highest median household income of $63,333 found in the 65+ years age bracket for the primary householder. A total of 346 households (17.7%) fall into this category. Meanwhile, the 15 to 24 years age bracket for the primary householder has the lowest median household income of $0, with 183 households (9.4%) in this group.
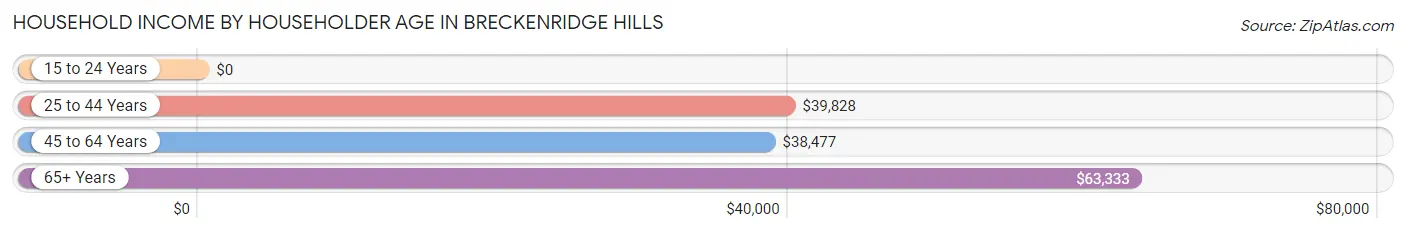
| Income Bracket | # Households | Median Income |
| 15 to 24 Years | 183 (9.4%) | $0 |
| 25 to 44 Years | 731 (37.4%) | $39,828 |
| 45 to 64 Years | 695 (35.5%) | $38,477 |
| 65+ Years | 346 (17.7%) | $63,333 |
| Total | 1,955 (100.0%) | $49,198 |
Poverty in Breckenridge Hills
Income Below Poverty by Sex and Age in Breckenridge Hills
With 23.9% poverty level for males and 27.3% for females among the residents of Breckenridge Hills, 6 to 11 year old males and 12 to 14 year old females are the most vulnerable to poverty, with 215 males (66.4%) and 84 females (100.0%) in their respective age groups living below the poverty level.
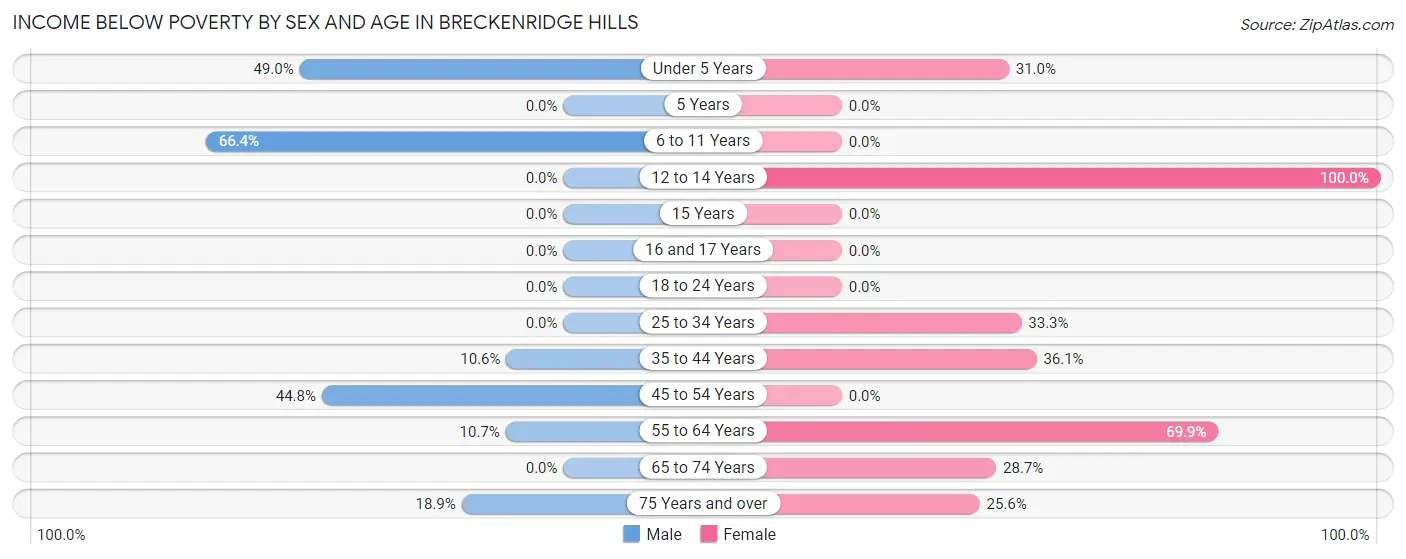
| Age Bracket | Male | Female |
| Under 5 Years | 72 (49.0%) | 84 (31.0%) |
| 5 Years | 0 (0.0%) | 0 (0.0%) |
| 6 to 11 Years | 215 (66.4%) | 0 (0.0%) |
| 12 to 14 Years | 0 (0.0%) | 84 (100.0%) |
| 15 Years | 0 (0.0%) | 0 (0.0%) |
| 16 and 17 Years | 0 (0.0%) | 0 (0.0%) |
| 18 to 24 Years | 0 (0.0%) | 0 (0.0%) |
| 25 to 34 Years | 0 (0.0%) | 168 (33.3%) |
| 35 to 44 Years | 31 (10.6%) | 112 (36.1%) |
| 45 to 54 Years | 191 (44.8%) | 0 (0.0%) |
| 55 to 64 Years | 15 (10.7%) | 65 (69.9%) |
| 65 to 74 Years | 0 (0.0%) | 53 (28.6%) |
| 75 Years and over | 24 (18.9%) | 22 (25.6%) |
| Total | 548 (23.9%) | 588 (27.3%) |
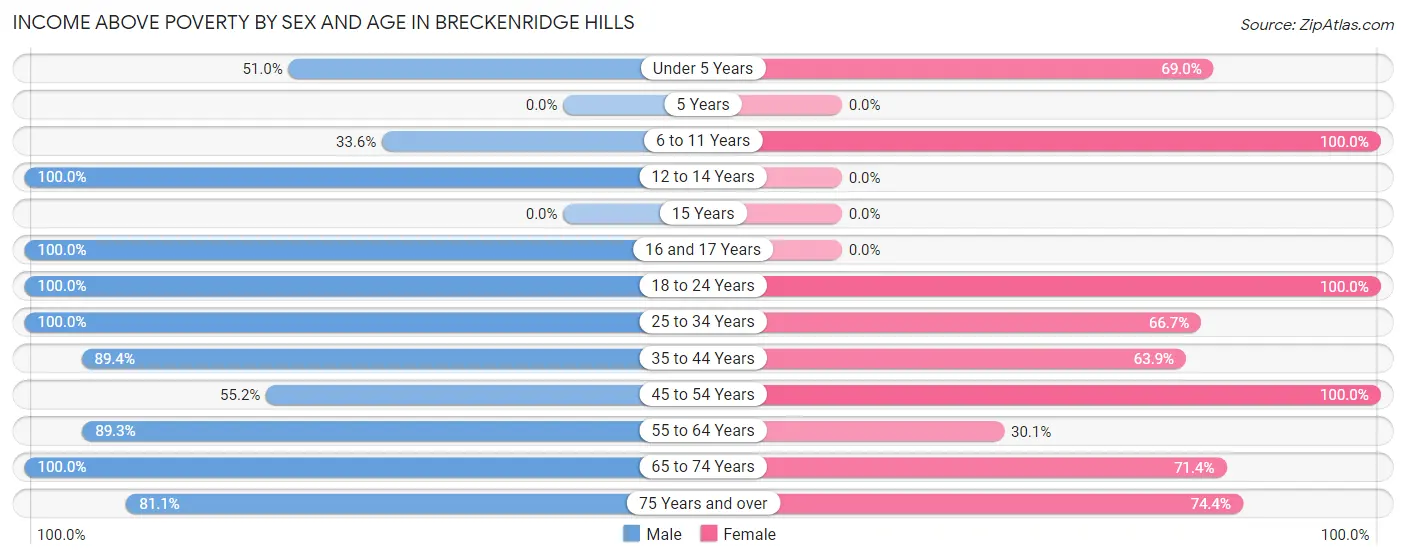
Income Above Poverty by Sex and Age in Breckenridge Hills
According to the poverty statistics in Breckenridge Hills, males aged 12 to 14 years and females aged 6 to 11 years are the age groups that are most secure financially, with 100.0% of males and 100.0% of females in these age groups living above the poverty line.
| Age Bracket | Male | Female |
| Under 5 Years | 75 (51.0%) | 187 (69.0%) |
| 5 Years | 0 (0.0%) | 0 (0.0%) |
| 6 to 11 Years | 109 (33.6%) | 119 (100.0%) |
| 12 to 14 Years | 71 (100.0%) | 0 (0.0%) |
| 15 Years | 0 (0.0%) | 0 (0.0%) |
| 16 and 17 Years | 31 (100.0%) | 0 (0.0%) |
| 18 to 24 Years | 171 (100.0%) | 142 (100.0%) |
| 25 to 34 Years | 428 (100.0%) | 336 (66.7%) |
| 35 to 44 Years | 262 (89.4%) | 198 (63.9%) |
| 45 to 54 Years | 235 (55.2%) | 364 (100.0%) |
| 55 to 64 Years | 125 (89.3%) | 28 (30.1%) |
| 65 to 74 Years | 136 (100.0%) | 132 (71.4%) |
| 75 Years and over | 103 (81.1%) | 64 (74.4%) |
| Total | 1,746 (76.1%) | 1,570 (72.8%) |
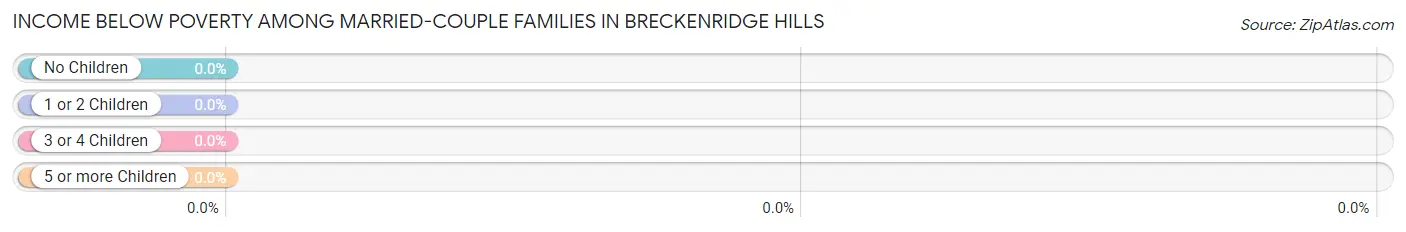
Income Below Poverty Among Married-Couple Families in Breckenridge Hills
| Children | Above Poverty | Below Poverty |
| No Children | 298 (100.0%) | 0 (0.0%) |
| 1 or 2 Children | 120 (100.0%) | 0 (0.0%) |
| 3 or 4 Children | 0 (0.0%) | 0 (0.0%) |
| 5 or more Children | 0 (0.0%) | 0 (0.0%) |
| Total | 418 (100.0%) | 0 (0.0%) |
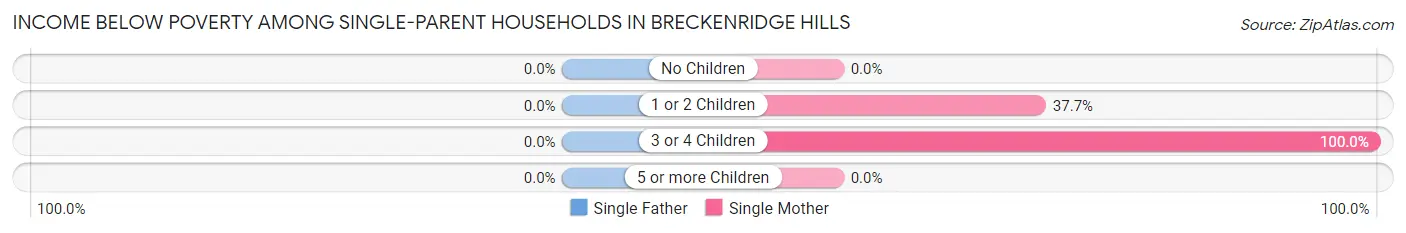
Income Below Poverty Among Single-Parent Households in Breckenridge Hills
| Children | Single Father | Single Mother |
| No Children | 0 (0.0%) | 0 (0.0%) |
| 1 or 2 Children | 0 (0.0%) | 84 (37.7%) |
| 3 or 4 Children | 0 (0.0%) | 100 (100.0%) |
| 5 or more Children | 0 (0.0%) | 0 (0.0%) |
| Total | 0 (0.0%) | 184 (40.0%) |
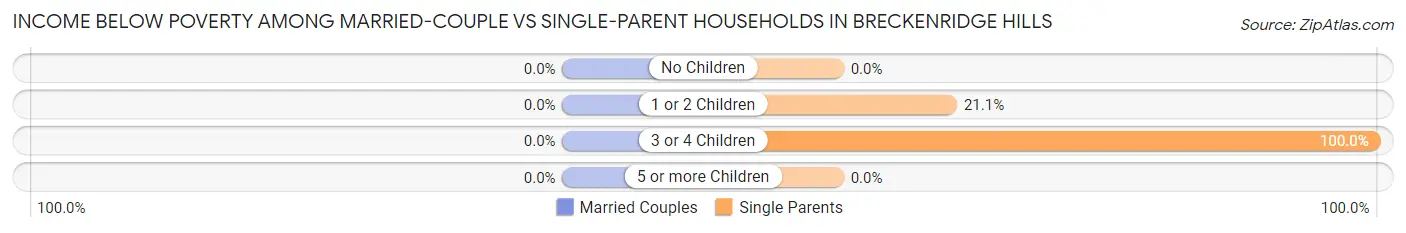
Income Below Poverty Among Married-Couple vs Single-Parent Households in Breckenridge Hills
| Children | Married-Couple Families | Single-Parent Households |
| No Children | 0 (0.0%) | 0 (0.0%) |
| 1 or 2 Children | 0 (0.0%) | 84 (21.1%) |
| 3 or 4 Children | 0 (0.0%) | 100 (100.0%) |
| 5 or more Children | 0 (0.0%) | 0 (0.0%) |
| Total | 0 (0.0%) | 184 (25.4%) |
Employment Characteristics in Breckenridge Hills
Employment by Class of Employer in Breckenridge Hills
Among the 2,260 employed individuals in Breckenridge Hills, private company employees (1,563 | 69.2%), not-for-profit organizations (265 | 11.7%), and self-employed (not incorporated) (198 | 8.8%) make up the most common classes of employment.

| Employer Class | # Employees | % Employees |
| Private Company Employees | 1,563 | 69.2% |
| Self-Employed (Incorporated) | 64 | 2.8% |
| Self-Employed (Not Incorporated) | 198 | 8.8% |
| Not-for-profit Organizations | 265 | 11.7% |
| Local Government Employees | 23 | 1.0% |
| State Government Employees | 50 | 2.2% |
| Federal Government Employees | 97 | 4.3% |
| Unpaid Family Workers | 0 | 0.0% |
| Total | 2,260 | 100.0% |
Employment Status by Age in Breckenridge Hills
According to the labor force statistics for Breckenridge Hills, out of the total population over 16 years of age (3,436), 72.1% or 2,477 individuals are in the labor force, with 8.2% or 203 of them unemployed. The age group with the highest labor force participation rate is 20 to 24 years, with 100.0% or 243 individuals in the labor force. Within the labor force, the 30 to 34 years age range has the highest percentage of unemployed individuals, with 44.8% or 138 of them being unemployed.
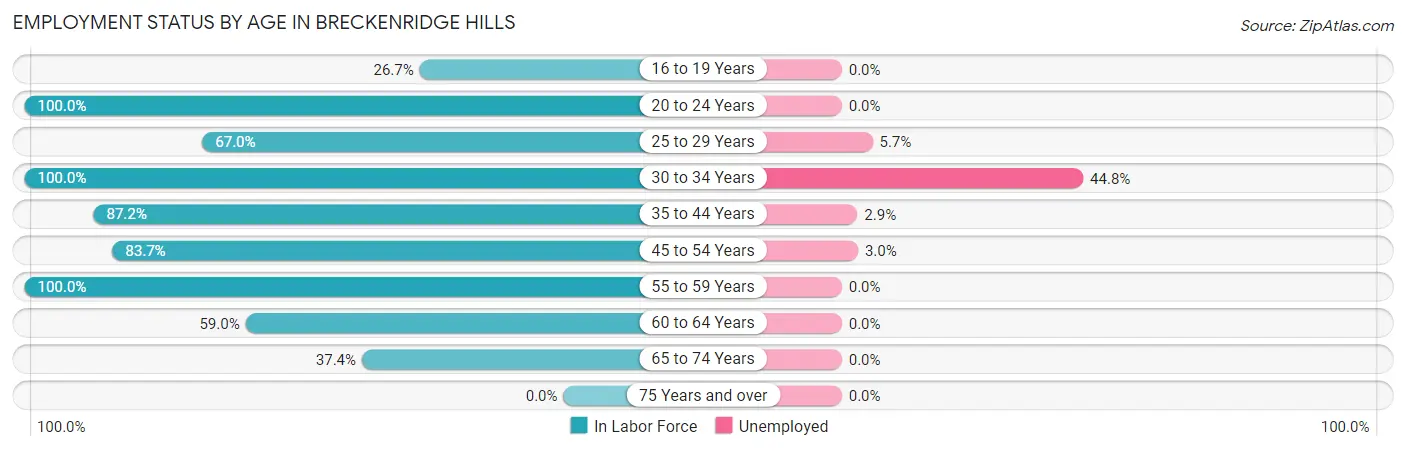
| Age Bracket | In Labor Force | Unemployed |
| 16 to 19 Years | 27 (26.7%) | 0 (0.0%) |
| 20 to 24 Years | 243 (100.0%) | 0 (0.0%) |
| 25 to 29 Years | 418 (67.0%) | 24 (5.7%) |
| 30 to 34 Years | 308 (100.0%) | 138 (44.8%) |
| 35 to 44 Years | 526 (87.2%) | 15 (2.9%) |
| 45 to 54 Years | 661 (83.7%) | 20 (3.0%) |
| 55 to 59 Years | 89 (100.0%) | 0 (0.0%) |
| 60 to 64 Years | 85 (59.0%) | 0 (0.0%) |
| 65 to 74 Years | 120 (37.4%) | 0 (0.0%) |
| 75 Years and over | 0 (0.0%) | 0 (0.0%) |
| Total | 2,477 (72.1%) | 203 (8.2%) |
Employment Status by Educational Attainment in Breckenridge Hills
According to labor force statistics for Breckenridge Hills, 81.6% of individuals (2,087) out of the total population between 25 and 64 years of age (2,558) are in the labor force, with 9.4% or 196 of them being unemployed. The group with the highest labor force participation rate are those with the educational attainment of college / associate degree, with 96.9% or 1,047 individuals in the labor force. Within the labor force, individuals with high school diploma education have the highest percentage of unemployment, with 22.5% or 177 of them being unemployed.
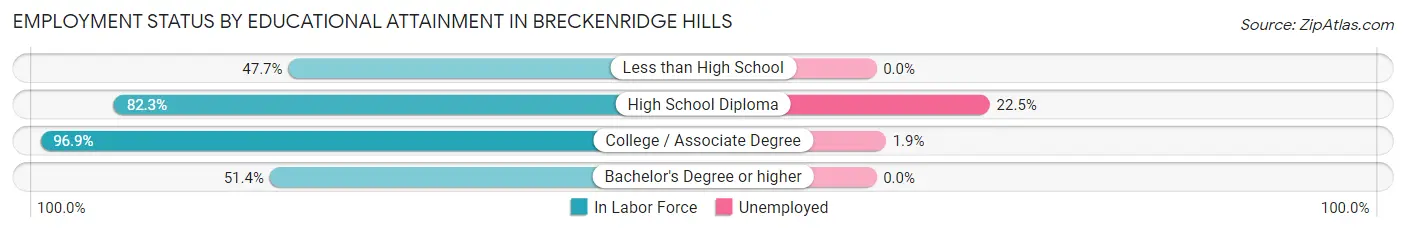
| Educational Attainment | In Labor Force | Unemployed |
| Less than High School | 179 (47.7%) | 0 (0.0%) |
| High School Diploma | 785 (82.3%) | 215 (22.5%) |
| College / Associate Degree | 1,047 (96.9%) | 21 (1.9%) |
| Bachelor's Degree or higher | 76 (51.4%) | 0 (0.0%) |
| Total | 2,087 (81.6%) | 240 (9.4%) |
Employment Occupations by Sex in Breckenridge Hills
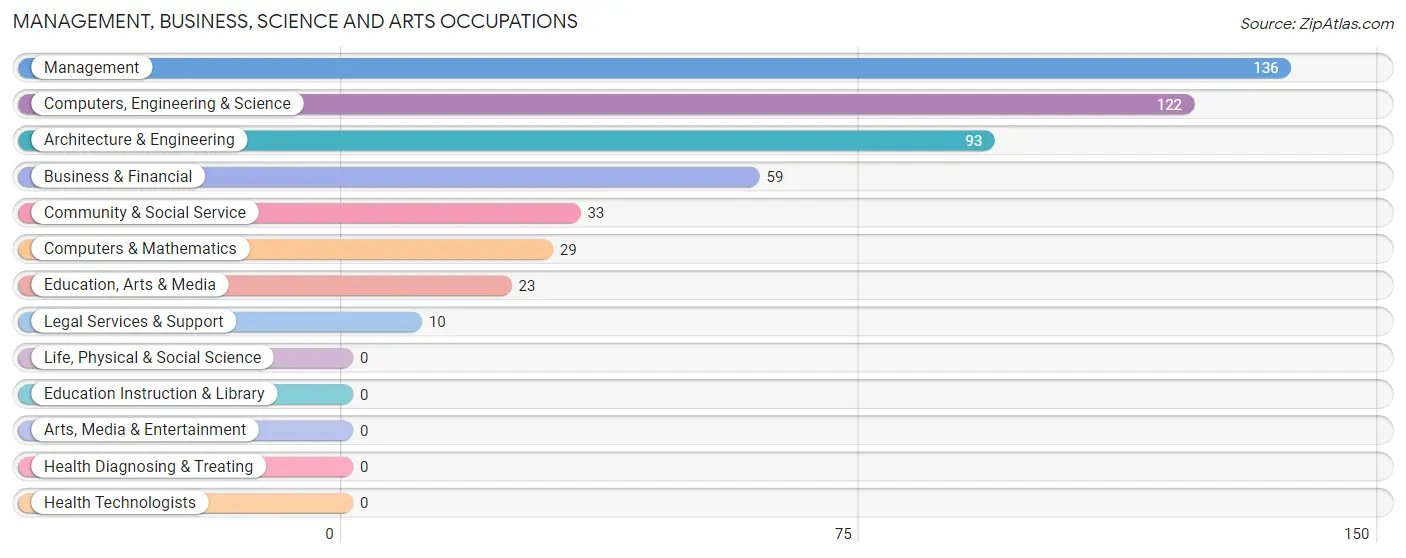
Management, Business, Science and Arts Occupations
The most common Management, Business, Science and Arts occupations in Breckenridge Hills are Management (136 | 6.1%), Computers, Engineering & Science (122 | 5.5%), Architecture & Engineering (93 | 4.2%), Business & Financial (59 | 2.7%), and Community & Social Service (33 | 1.5%).
Management, Business, Science and Arts Occupations by Sex
Within the Management, Business, Science and Arts occupations in Breckenridge Hills, the most male-oriented occupations are Computers, Engineering & Science (100.0%), Computers & Mathematics (100.0%), and Architecture & Engineering (100.0%), while the most female-oriented occupations are Business & Financial (100.0%), Legal Services & Support (100.0%), and Management (80.1%).
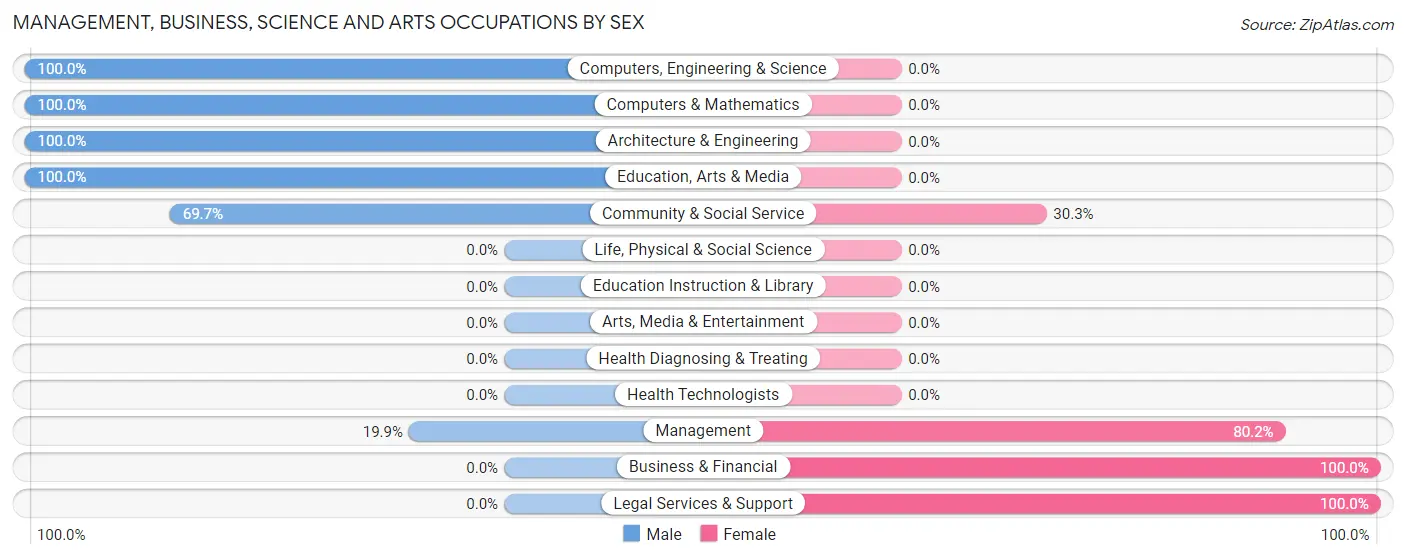
| Occupation | Male | Female |
| Management | 27 (19.9%) | 109 (80.1%) |
| Business & Financial | 0 (0.0%) | 59 (100.0%) |
| Computers, Engineering & Science | 122 (100.0%) | 0 (0.0%) |
| Computers & Mathematics | 29 (100.0%) | 0 (0.0%) |
| Architecture & Engineering | 93 (100.0%) | 0 (0.0%) |
| Life, Physical & Social Science | 0 (0.0%) | 0 (0.0%) |
| Community & Social Service | 23 (69.7%) | 10 (30.3%) |
| Education, Arts & Media | 23 (100.0%) | 0 (0.0%) |
| Legal Services & Support | 0 (0.0%) | 10 (100.0%) |
| Education Instruction & Library | 0 (0.0%) | 0 (0.0%) |
| Arts, Media & Entertainment | 0 (0.0%) | 0 (0.0%) |
| Health Diagnosing & Treating | 0 (0.0%) | 0 (0.0%) |
| Health Technologists | 0 (0.0%) | 0 (0.0%) |
| Total (Category) | 172 (49.1%) | 178 (50.9%) |
| Total (Overall) | 1,115 (50.2%) | 1,105 (49.8%) |
Services Occupations
The most common Services occupations in Breckenridge Hills are Cleaning & Maintenance (195 | 8.8%), Healthcare Support (143 | 6.4%), Food Preparation & Serving (84 | 3.8%), Security & Protection (75 | 3.4%), and Firefighting & Prevention (75 | 3.4%).
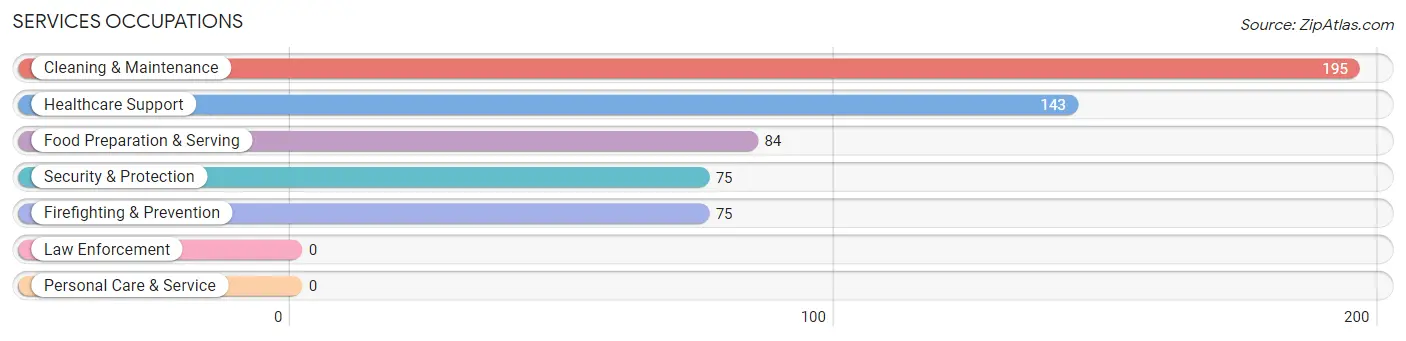
Services Occupations by Sex
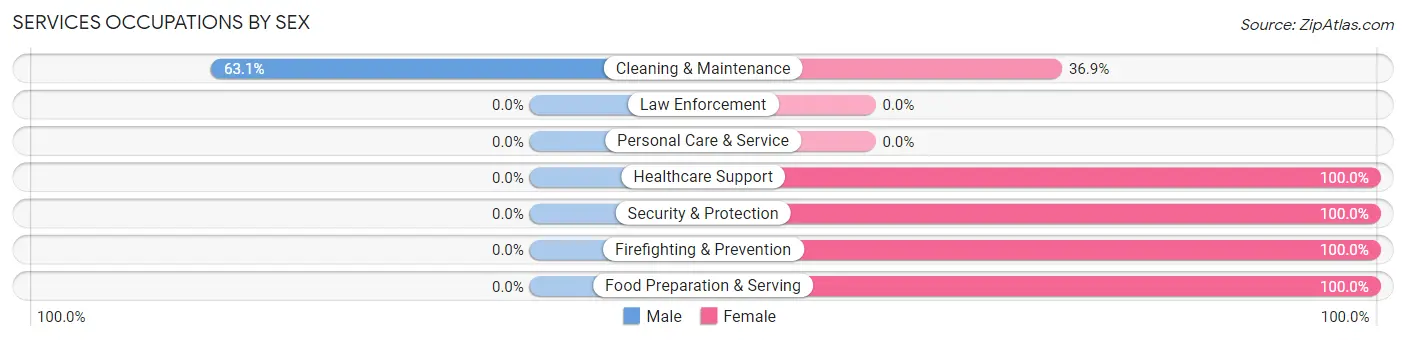
| Occupation | Male | Female |
| Healthcare Support | 0 (0.0%) | 143 (100.0%) |
| Security & Protection | 0 (0.0%) | 75 (100.0%) |
| Firefighting & Prevention | 0 (0.0%) | 75 (100.0%) |
| Law Enforcement | 0 (0.0%) | 0 (0.0%) |
| Food Preparation & Serving | 0 (0.0%) | 84 (100.0%) |
| Cleaning & Maintenance | 123 (63.1%) | 72 (36.9%) |
| Personal Care & Service | 0 (0.0%) | 0 (0.0%) |
| Total (Category) | 123 (24.7%) | 374 (75.2%) |
| Total (Overall) | 1,115 (50.2%) | 1,105 (49.8%) |
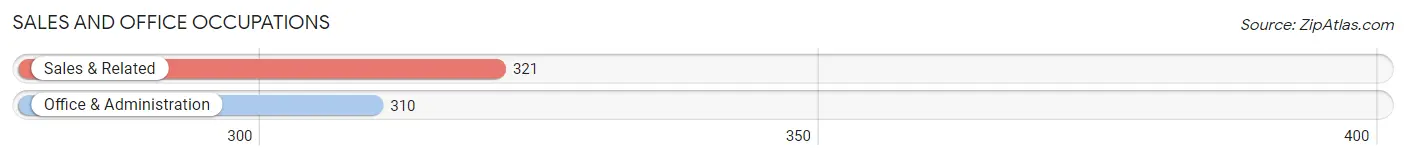
Sales and Office Occupations
The most common Sales and Office occupations in Breckenridge Hills are Sales & Related (321 | 14.5%), and Office & Administration (310 | 14.0%).
Sales and Office Occupations by Sex
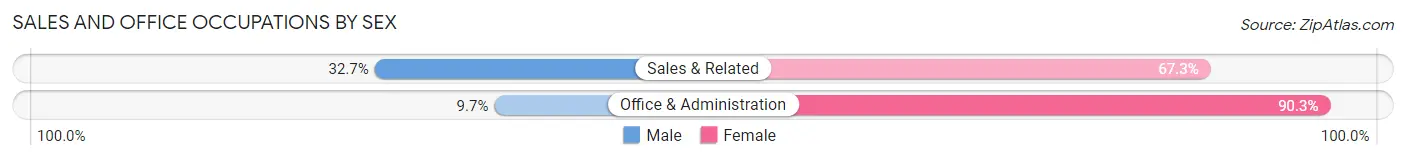
| Occupation | Male | Female |
| Sales & Related | 105 (32.7%) | 216 (67.3%) |
| Office & Administration | 30 (9.7%) | 280 (90.3%) |
| Total (Category) | 135 (21.4%) | 496 (78.6%) |
| Total (Overall) | 1,115 (50.2%) | 1,105 (49.8%) |
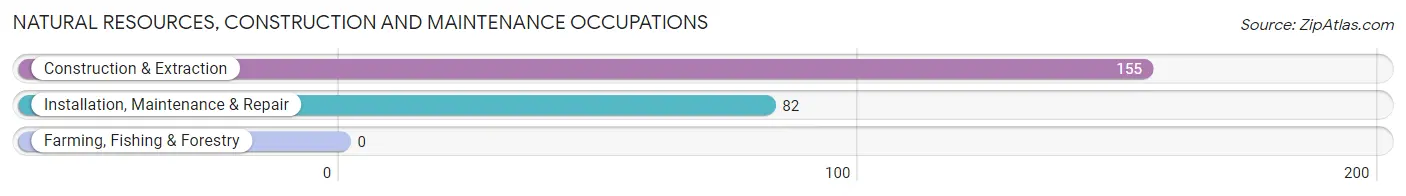
Natural Resources, Construction and Maintenance Occupations
The most common Natural Resources, Construction and Maintenance occupations in Breckenridge Hills are Construction & Extraction (155 | 7.0%), and Installation, Maintenance & Repair (82 | 3.7%).
Natural Resources, Construction and Maintenance Occupations by Sex
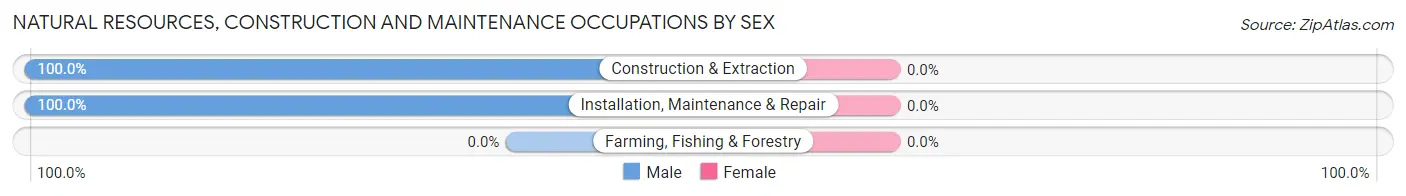
| Occupation | Male | Female |
| Farming, Fishing & Forestry | 0 (0.0%) | 0 (0.0%) |
| Construction & Extraction | 155 (100.0%) | 0 (0.0%) |
| Installation, Maintenance & Repair | 82 (100.0%) | 0 (0.0%) |
| Total (Category) | 237 (100.0%) | 0 (0.0%) |
| Total (Overall) | 1,115 (50.2%) | 1,105 (49.8%) |
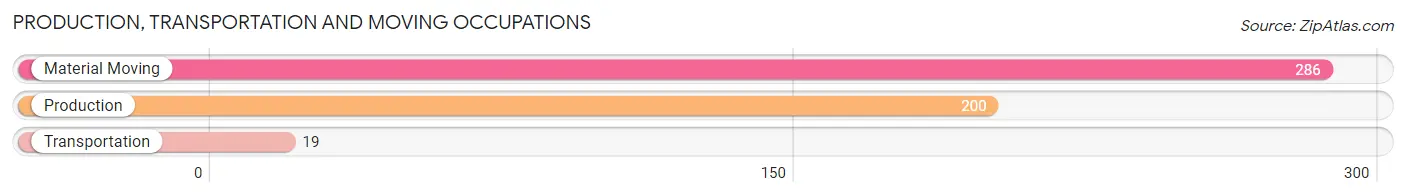
Production, Transportation and Moving Occupations
The most common Production, Transportation and Moving occupations in Breckenridge Hills are Material Moving (286 | 12.9%), Production (200 | 9.0%), and Transportation (19 | 0.9%).
Production, Transportation and Moving Occupations by Sex
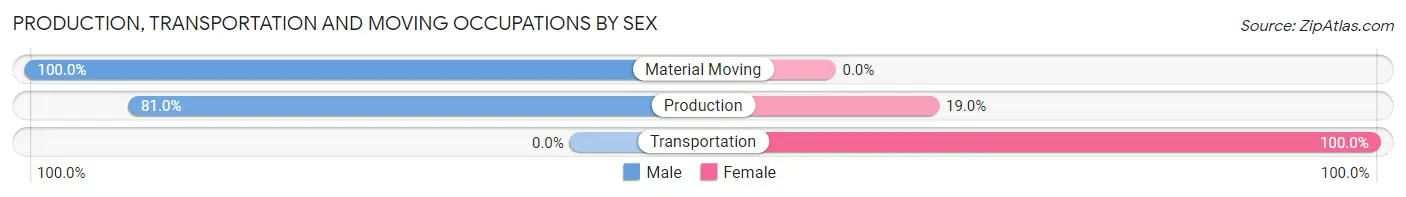
| Occupation | Male | Female |
| Production | 162 (81.0%) | 38 (19.0%) |
| Transportation | 0 (0.0%) | 19 (100.0%) |
| Material Moving | 286 (100.0%) | 0 (0.0%) |
| Total (Category) | 448 (88.7%) | 57 (11.3%) |
| Total (Overall) | 1,115 (50.2%) | 1,105 (49.8%) |
Employment Industries by Sex in Breckenridge Hills
Employment Industries in Breckenridge Hills
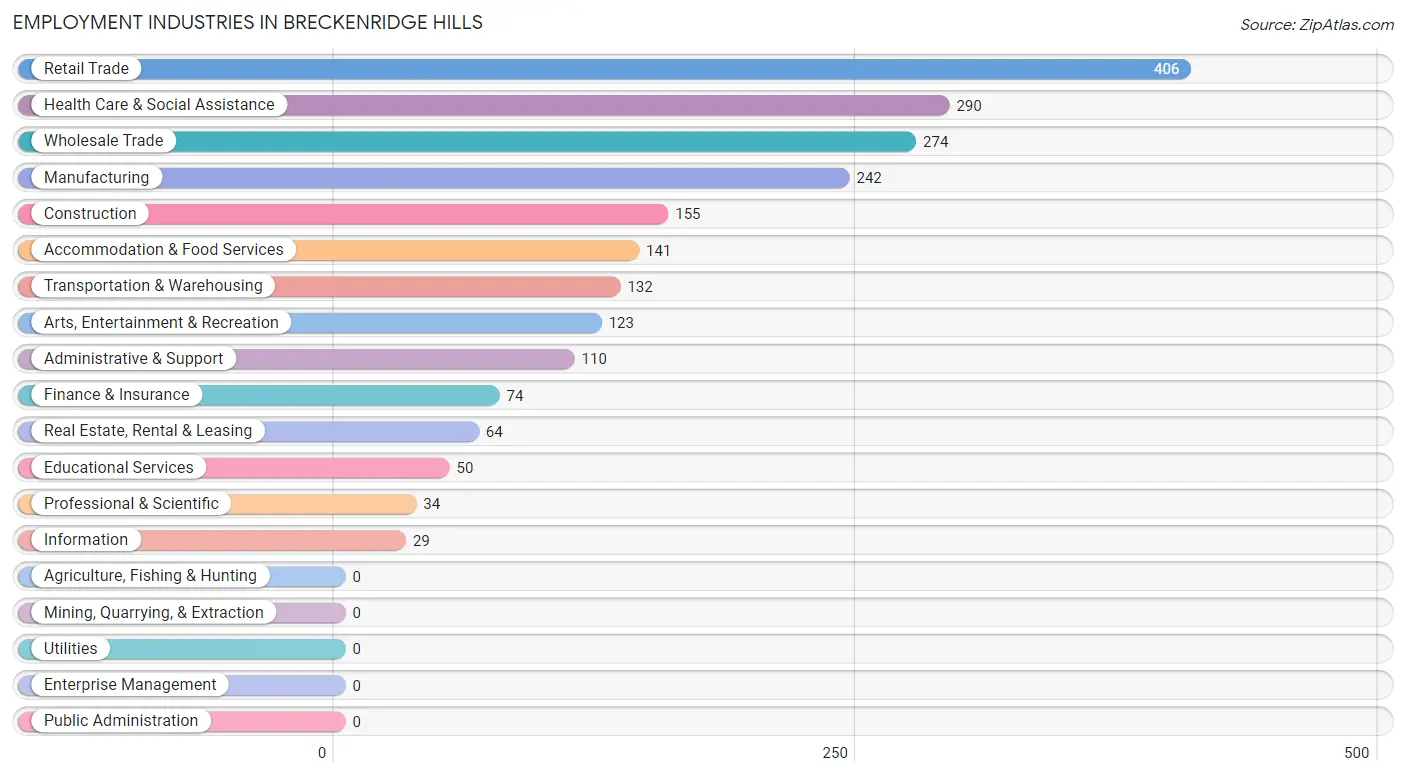
The major employment industries in Breckenridge Hills include Retail Trade (406 | 18.3%), Health Care & Social Assistance (290 | 13.1%), Wholesale Trade (274 | 12.3%), Manufacturing (242 | 10.9%), and Construction (155 | 7.0%).
Employment Industries by Sex in Breckenridge Hills
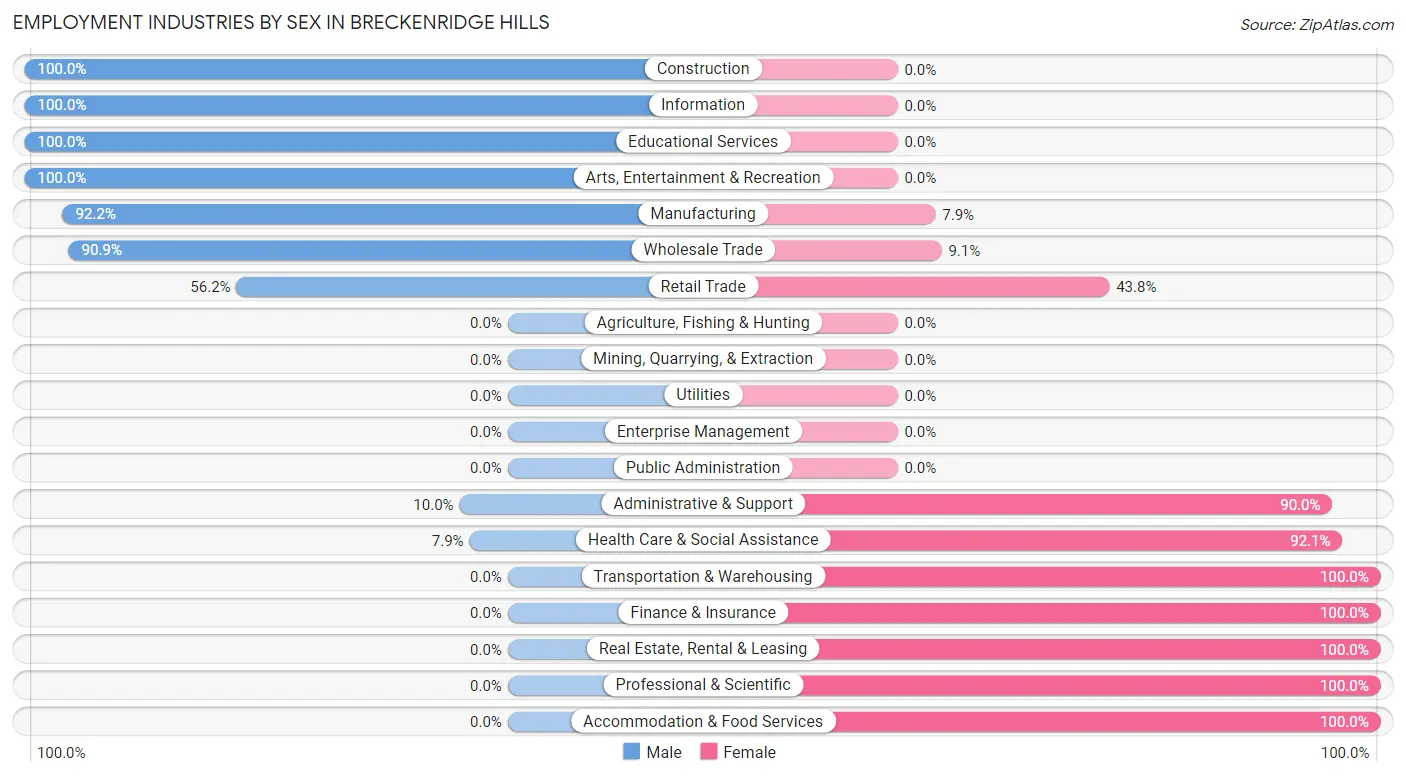
The Breckenridge Hills industries that see more men than women are Construction (100.0%), Information (100.0%), and Educational Services (100.0%), whereas the industries that tend to have a higher number of women are Transportation & Warehousing (100.0%), Finance & Insurance (100.0%), and Real Estate, Rental & Leasing (100.0%).
| Industry | Male | Female |
| Agriculture, Fishing & Hunting | 0 (0.0%) | 0 (0.0%) |
| Mining, Quarrying, & Extraction | 0 (0.0%) | 0 (0.0%) |
| Construction | 155 (100.0%) | 0 (0.0%) |
| Manufacturing | 223 (92.1%) | 19 (7.9%) |
| Wholesale Trade | 249 (90.9%) | 25 (9.1%) |
| Retail Trade | 228 (56.2%) | 178 (43.8%) |
| Transportation & Warehousing | 0 (0.0%) | 132 (100.0%) |
| Utilities | 0 (0.0%) | 0 (0.0%) |
| Information | 29 (100.0%) | 0 (0.0%) |
| Finance & Insurance | 0 (0.0%) | 74 (100.0%) |
| Real Estate, Rental & Leasing | 0 (0.0%) | 64 (100.0%) |
| Professional & Scientific | 0 (0.0%) | 34 (100.0%) |
| Enterprise Management | 0 (0.0%) | 0 (0.0%) |
| Administrative & Support | 11 (10.0%) | 99 (90.0%) |
| Educational Services | 50 (100.0%) | 0 (0.0%) |
| Health Care & Social Assistance | 23 (7.9%) | 267 (92.1%) |
| Arts, Entertainment & Recreation | 123 (100.0%) | 0 (0.0%) |
| Accommodation & Food Services | 0 (0.0%) | 141 (100.0%) |
| Public Administration | 0 (0.0%) | 0 (0.0%) |
| Total | 1,115 (50.2%) | 1,105 (49.8%) |
Education in Breckenridge Hills
School Enrollment in Breckenridge Hills
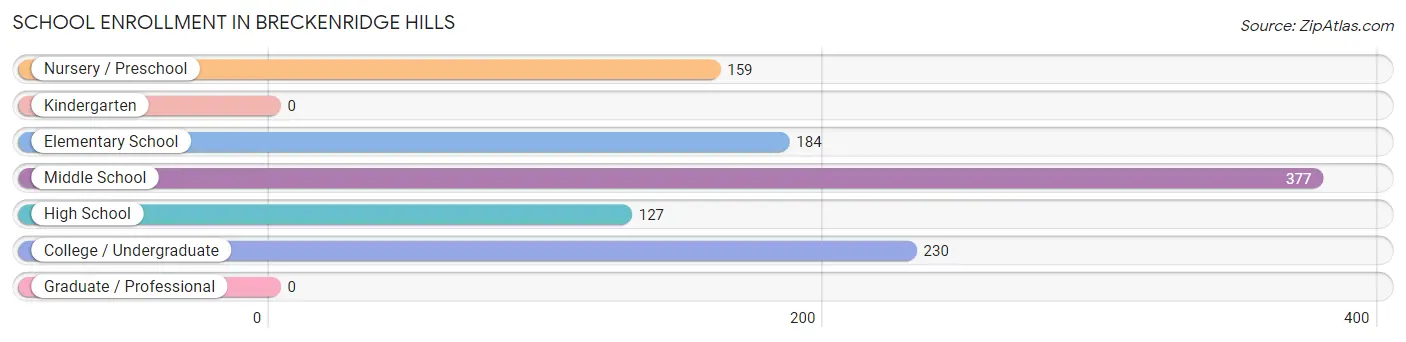
The most common levels of schooling among the 1,077 students in Breckenridge Hills are middle school (377 | 35.0%), college / undergraduate (230 | 21.4%), and elementary school (184 | 17.1%).
| School Level | # Students | % Students |
| Nursery / Preschool | 159 | 14.8% |
| Kindergarten | 0 | 0.0% |
| Elementary School | 184 | 17.1% |
| Middle School | 377 | 35.0% |
| High School | 127 | 11.8% |
| College / Undergraduate | 230 | 21.4% |
| Graduate / Professional | 0 | 0.0% |
| Total | 1,077 | 100.0% |
School Enrollment by Age by Funding Source in Breckenridge Hills
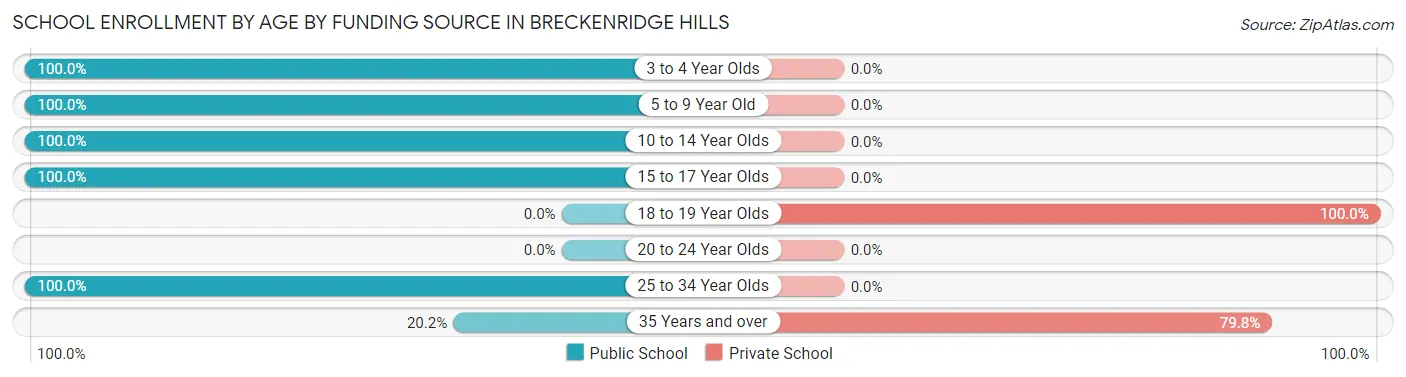
Out of a total of 1,077 students who are enrolled in schools in Breckenridge Hills, 118 (11.0%) attend a private institution, while the remaining 959 (89.0%) are enrolled in public schools. The age group of 18 to 19 year olds has the highest likelihood of being enrolled in private schools, with 43 (100.0% in the age bracket) enrolled. Conversely, the age group of 3 to 4 year olds has the lowest likelihood of being enrolled in a private school, with 159 (100.0% in the age bracket) attending a public institution.
| Age Bracket | Public School | Private School |
| 3 to 4 Year Olds | 159 (100.0%) | 0 (0.0%) |
| 5 to 9 Year Old | 188 (100.0%) | 0 (0.0%) |
| 10 to 14 Year Olds | 373 (100.0%) | 0 (0.0%) |
| 15 to 17 Year Olds | 31 (100.0%) | 0 (0.0%) |
| 18 to 19 Year Olds | 0 (0.0%) | 43 (100.0%) |
| 20 to 24 Year Olds | 0 (0.0%) | 0 (0.0%) |
| 25 to 34 Year Olds | 189 (100.0%) | 0 (0.0%) |
| 35 Years and over | 19 (20.2%) | 75 (79.8%) |
| Total | 959 (89.0%) | 118 (11.0%) |
Educational Attainment by Field of Study in Breckenridge Hills
Arts & humanities (72 | 21.9%), business (51 | 15.5%), psychology (34 | 10.3%), science & technology (34 | 10.3%), and education (34 | 10.3%) are the most common fields of study among 329 individuals in Breckenridge Hills who have obtained a bachelor's degree or higher.
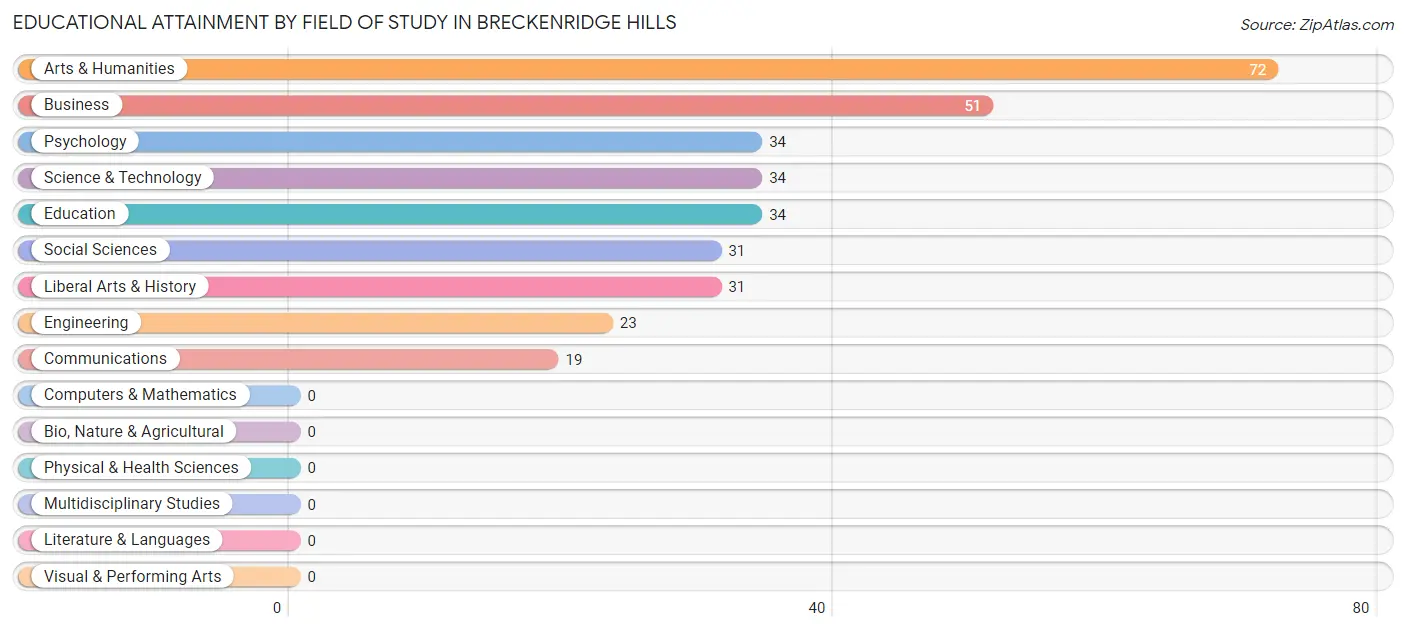
| Field of Study | # Graduates | % Graduates |
| Computers & Mathematics | 0 | 0.0% |
| Bio, Nature & Agricultural | 0 | 0.0% |
| Physical & Health Sciences | 0 | 0.0% |
| Psychology | 34 | 10.3% |
| Social Sciences | 31 | 9.4% |
| Engineering | 23 | 7.0% |
| Multidisciplinary Studies | 0 | 0.0% |
| Science & Technology | 34 | 10.3% |
| Business | 51 | 15.5% |
| Education | 34 | 10.3% |
| Literature & Languages | 0 | 0.0% |
| Liberal Arts & History | 31 | 9.4% |
| Visual & Performing Arts | 0 | 0.0% |
| Communications | 19 | 5.8% |
| Arts & Humanities | 72 | 21.9% |
| Total | 329 | 100.0% |
Transportation & Commute in Breckenridge Hills
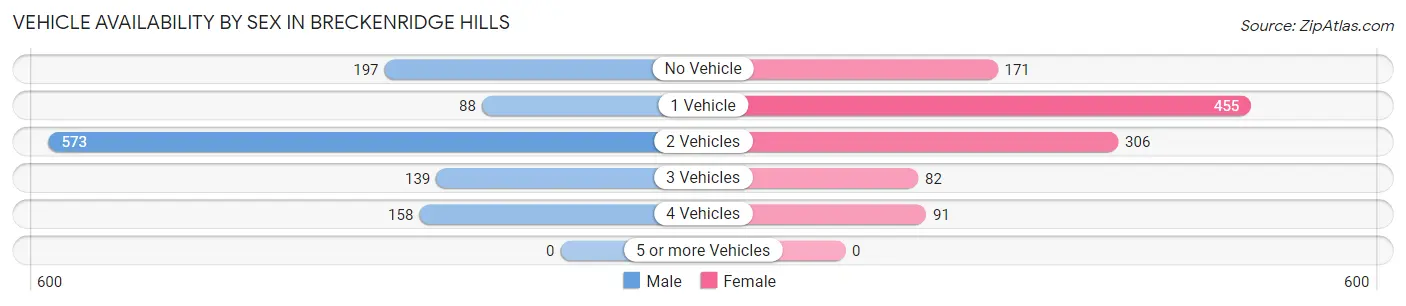
Vehicle Availability by Sex in Breckenridge Hills
The most prevalent vehicle ownership categories in Breckenridge Hills are males with 2 vehicles (573, accounting for 49.6%) and females with 2 vehicles (306, making up 51.9%).
| Vehicles Available | Male | Female |
| No Vehicle | 197 (17.1%) | 171 (15.5%) |
| 1 Vehicle | 88 (7.6%) | 455 (41.2%) |
| 2 Vehicles | 573 (49.6%) | 306 (27.7%) |
| 3 Vehicles | 139 (12.0%) | 82 (7.4%) |
| 4 Vehicles | 158 (13.7%) | 91 (8.2%) |
| 5 or more Vehicles | 0 (0.0%) | 0 (0.0%) |
| Total | 1,155 (100.0%) | 1,105 (100.0%) |
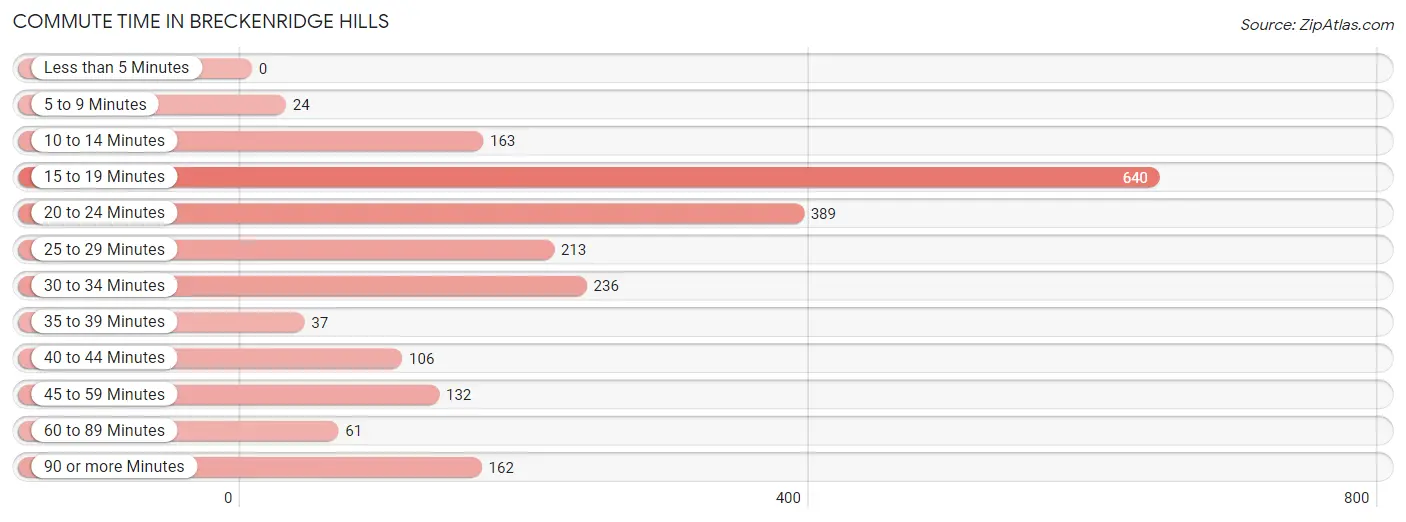
Commute Time in Breckenridge Hills
The most frequently occuring commute durations in Breckenridge Hills are 15 to 19 minutes (640 commuters, 29.6%), 20 to 24 minutes (389 commuters, 18.0%), and 30 to 34 minutes (236 commuters, 10.9%).
| Commute Time | # Commuters | % Commuters |
| Less than 5 Minutes | 0 | 0.0% |
| 5 to 9 Minutes | 24 | 1.1% |
| 10 to 14 Minutes | 163 | 7.5% |
| 15 to 19 Minutes | 640 | 29.6% |
| 20 to 24 Minutes | 389 | 18.0% |
| 25 to 29 Minutes | 213 | 9.9% |
| 30 to 34 Minutes | 236 | 10.9% |
| 35 to 39 Minutes | 37 | 1.7% |
| 40 to 44 Minutes | 106 | 4.9% |
| 45 to 59 Minutes | 132 | 6.1% |
| 60 to 89 Minutes | 61 | 2.8% |
| 90 or more Minutes | 162 | 7.5% |
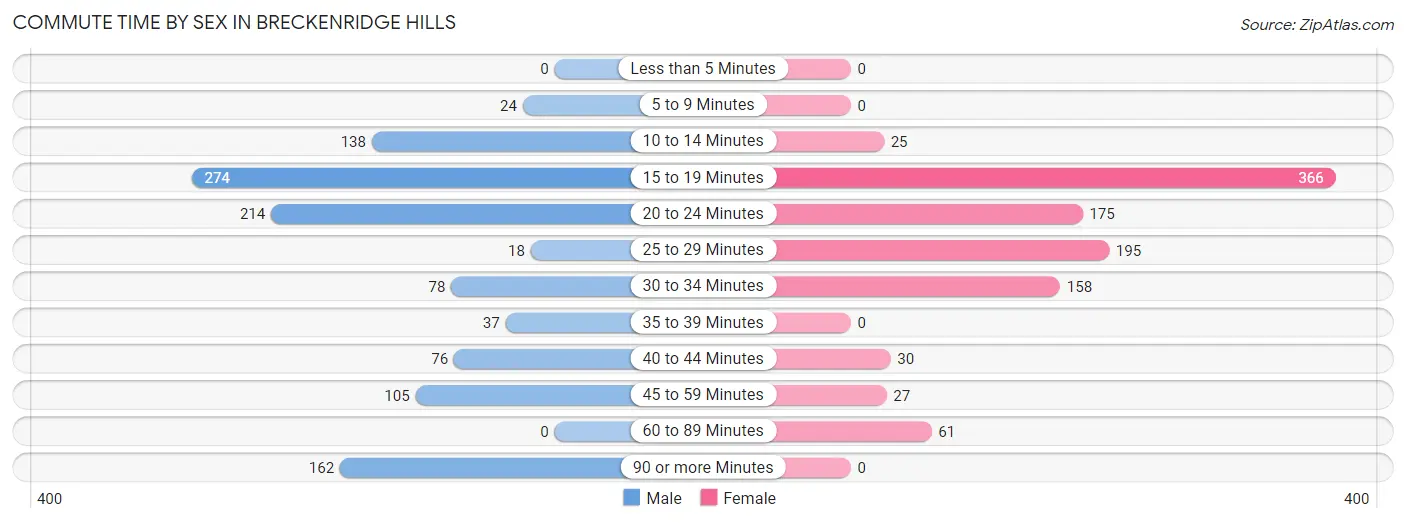
Commute Time by Sex in Breckenridge Hills
The most common commute times in Breckenridge Hills are 15 to 19 minutes (274 commuters, 24.3%) for males and 15 to 19 minutes (366 commuters, 35.3%) for females.
| Commute Time | Male | Female |
| Less than 5 Minutes | 0 (0.0%) | 0 (0.0%) |
| 5 to 9 Minutes | 24 (2.1%) | 0 (0.0%) |
| 10 to 14 Minutes | 138 (12.3%) | 25 (2.4%) |
| 15 to 19 Minutes | 274 (24.3%) | 366 (35.3%) |
| 20 to 24 Minutes | 214 (19.0%) | 175 (16.9%) |
| 25 to 29 Minutes | 18 (1.6%) | 195 (18.8%) |
| 30 to 34 Minutes | 78 (6.9%) | 158 (15.2%) |
| 35 to 39 Minutes | 37 (3.3%) | 0 (0.0%) |
| 40 to 44 Minutes | 76 (6.8%) | 30 (2.9%) |
| 45 to 59 Minutes | 105 (9.3%) | 27 (2.6%) |
| 60 to 89 Minutes | 0 (0.0%) | 61 (5.9%) |
| 90 or more Minutes | 162 (14.4%) | 0 (0.0%) |
Time of Departure to Work by Sex in Breckenridge Hills
The most frequent times of departure to work in Breckenridge Hills are 6:30 AM to 6:59 AM (338, 30.0%) for males and 7:00 AM to 7:29 AM (288, 27.8%) for females.
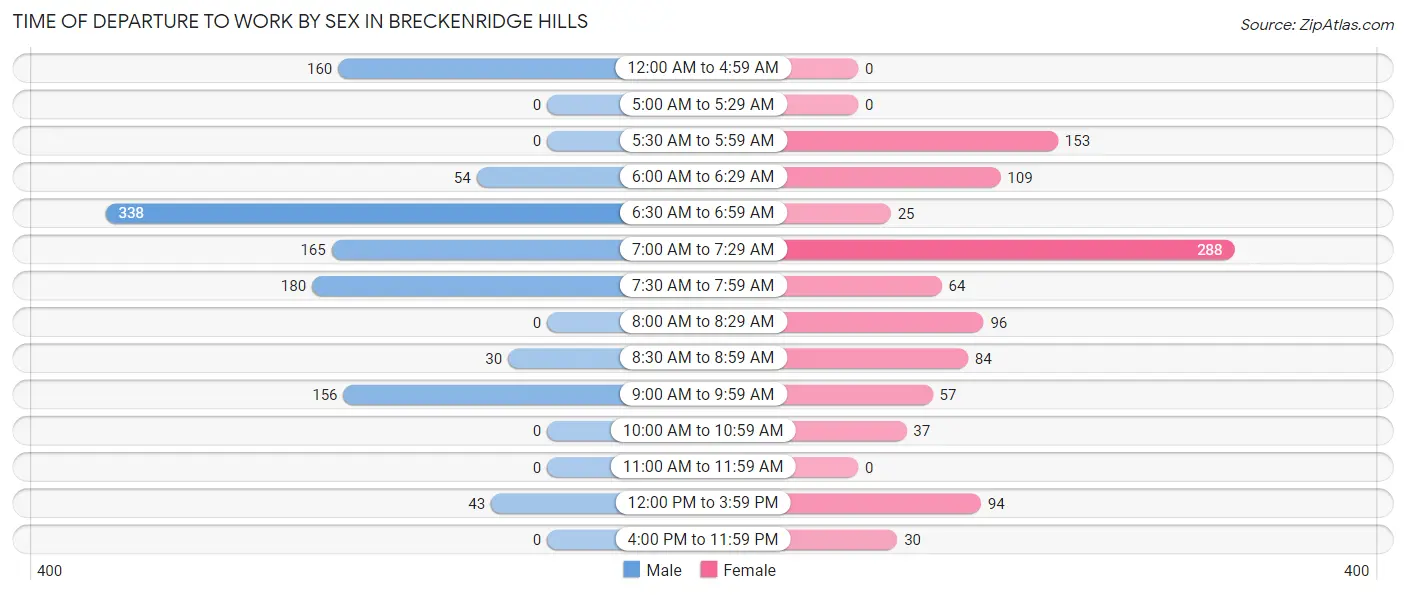
| Time of Departure | Male | Female |
| 12:00 AM to 4:59 AM | 160 (14.2%) | 0 (0.0%) |
| 5:00 AM to 5:29 AM | 0 (0.0%) | 0 (0.0%) |
| 5:30 AM to 5:59 AM | 0 (0.0%) | 153 (14.7%) |
| 6:00 AM to 6:29 AM | 54 (4.8%) | 109 (10.5%) |
| 6:30 AM to 6:59 AM | 338 (30.0%) | 25 (2.4%) |
| 7:00 AM to 7:29 AM | 165 (14.6%) | 288 (27.8%) |
| 7:30 AM to 7:59 AM | 180 (16.0%) | 64 (6.2%) |
| 8:00 AM to 8:29 AM | 0 (0.0%) | 96 (9.3%) |
| 8:30 AM to 8:59 AM | 30 (2.7%) | 84 (8.1%) |
| 9:00 AM to 9:59 AM | 156 (13.9%) | 57 (5.5%) |
| 10:00 AM to 10:59 AM | 0 (0.0%) | 37 (3.6%) |
| 11:00 AM to 11:59 AM | 0 (0.0%) | 0 (0.0%) |
| 12:00 PM to 3:59 PM | 43 (3.8%) | 94 (9.1%) |
| 4:00 PM to 11:59 PM | 0 (0.0%) | 30 (2.9%) |
| Total | 1,126 (100.0%) | 1,037 (100.0%) |
Housing Occupancy in Breckenridge Hills
Occupancy by Ownership in Breckenridge Hills
Of the total 1,955 dwellings in Breckenridge Hills, owner-occupied units account for 1,090 (55.7%), while renter-occupied units make up 865 (44.3%).
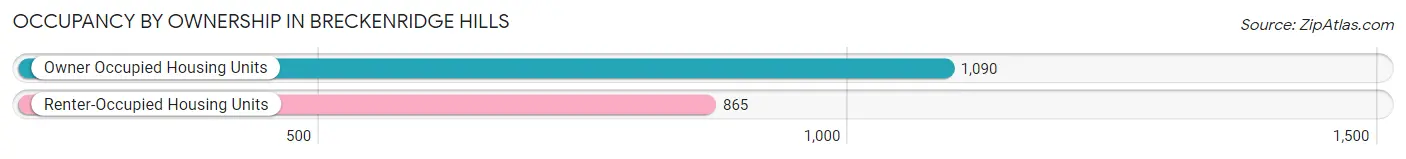
| Occupancy | # Housing Units | % Housing Units |
| Owner Occupied Housing Units | 1,090 | 55.7% |
| Renter-Occupied Housing Units | 865 | 44.3% |
| Total Occupied Housing Units | 1,955 | 100.0% |
Occupancy by Household Size in Breckenridge Hills
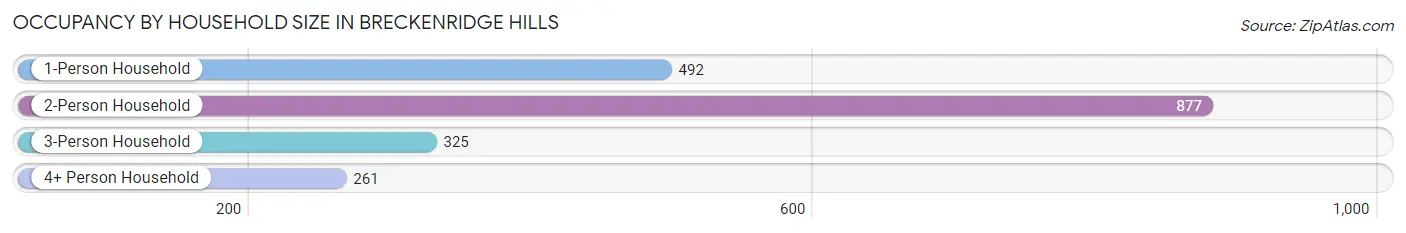
| Household Size | # Housing Units | % Housing Units |
| 1-Person Household | 492 | 25.2% |
| 2-Person Household | 877 | 44.9% |
| 3-Person Household | 325 | 16.6% |
| 4+ Person Household | 261 | 13.4% |
| Total Housing Units | 1,955 | 100.0% |
Occupancy by Ownership by Household Size in Breckenridge Hills
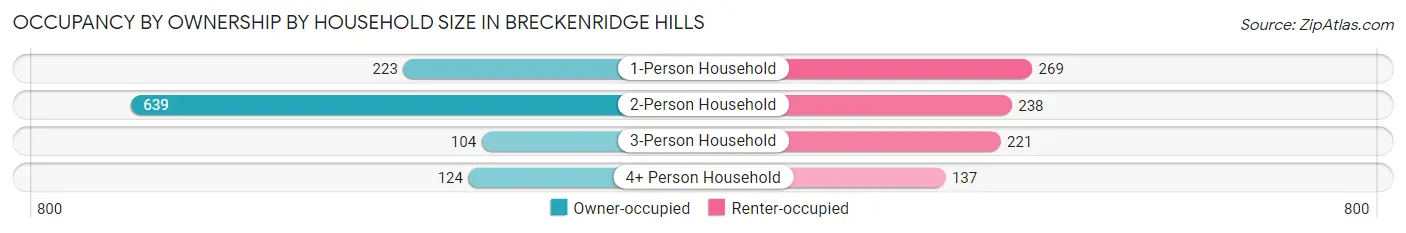
| Household Size | Owner-occupied | Renter-occupied |
| 1-Person Household | 223 (45.3%) | 269 (54.7%) |
| 2-Person Household | 639 (72.9%) | 238 (27.1%) |
| 3-Person Household | 104 (32.0%) | 221 (68.0%) |
| 4+ Person Household | 124 (47.5%) | 137 (52.5%) |
| Total Housing Units | 1,090 (55.7%) | 865 (44.3%) |
Occupancy by Educational Attainment in Breckenridge Hills
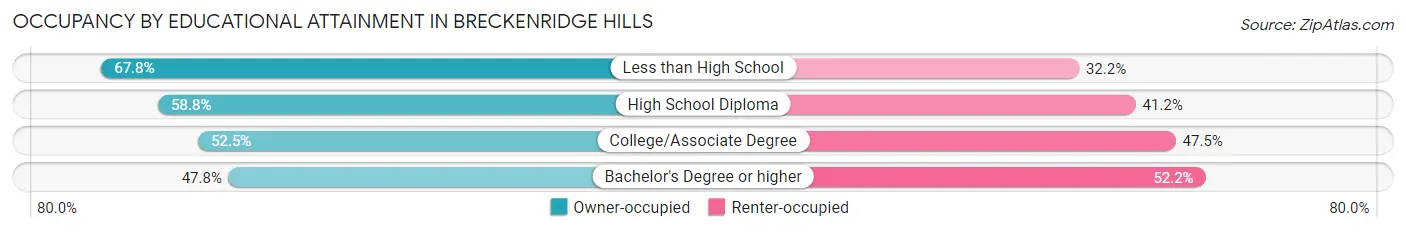
| Household Size | Owner-occupied | Renter-occupied |
| Less than High School | 78 (67.8%) | 37 (32.2%) |
| High School Diploma | 516 (58.8%) | 361 (41.2%) |
| College/Associate Degree | 399 (52.5%) | 361 (47.5%) |
| Bachelor's Degree or higher | 97 (47.8%) | 106 (52.2%) |
Occupancy by Age of Householder in Breckenridge Hills
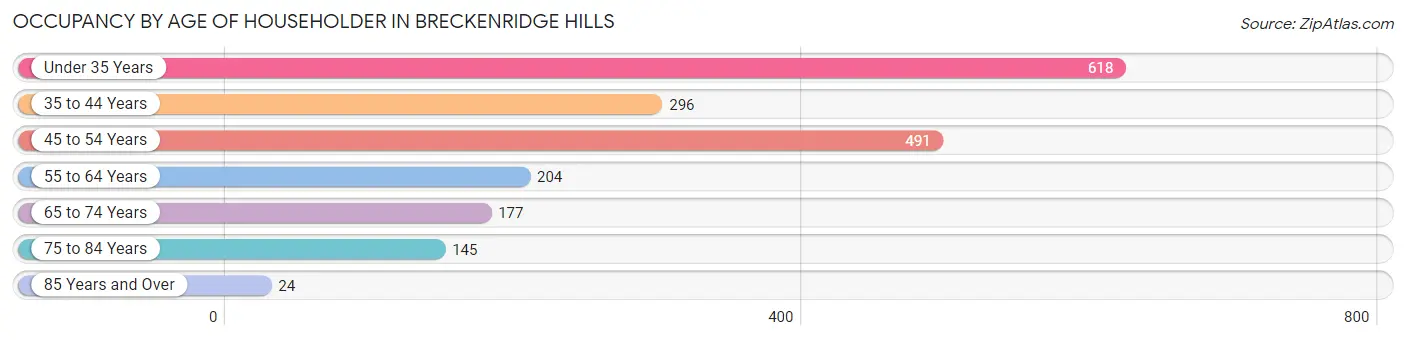
| Age Bracket | # Households | % Households |
| Under 35 Years | 618 | 31.6% |
| 35 to 44 Years | 296 | 15.1% |
| 45 to 54 Years | 491 | 25.1% |
| 55 to 64 Years | 204 | 10.4% |
| 65 to 74 Years | 177 | 9.0% |
| 75 to 84 Years | 145 | 7.4% |
| 85 Years and Over | 24 | 1.2% |
| Total | 1,955 | 100.0% |
Housing Finances in Breckenridge Hills
Median Income by Occupancy in Breckenridge Hills
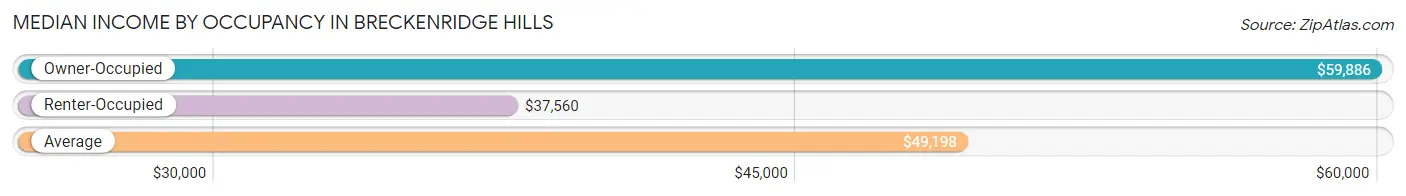
| Occupancy Type | # Households | Median Income |
| Owner-Occupied | 1,090 (55.7%) | $59,886 |
| Renter-Occupied | 865 (44.3%) | $37,560 |
| Average | 1,955 (100.0%) | $49,198 |
Occupancy by Householder Income Bracket in Breckenridge Hills
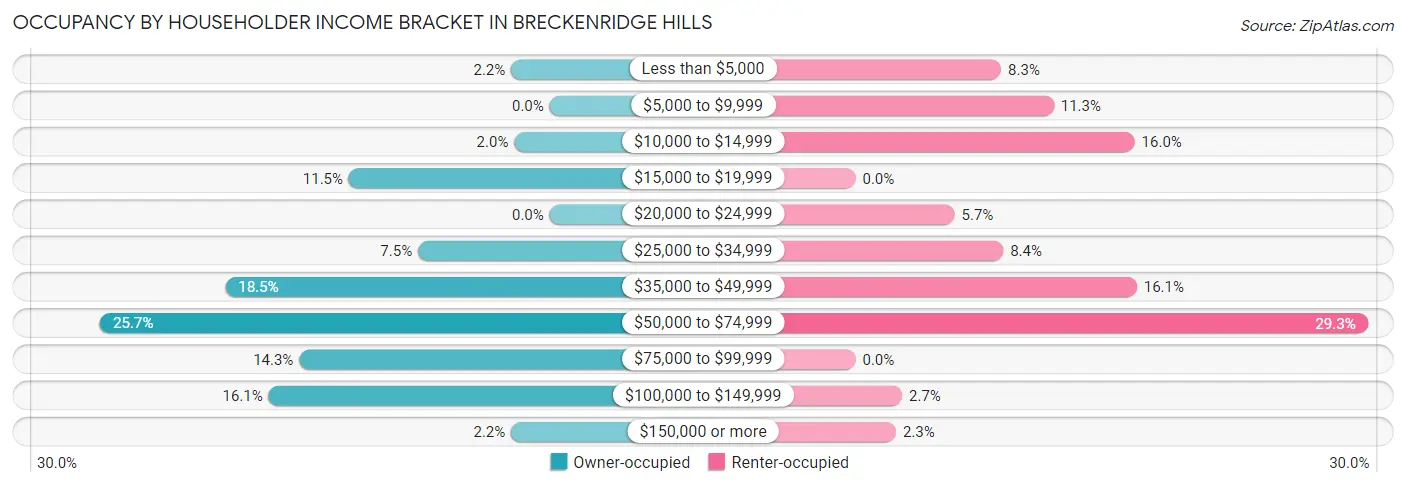
| Income Bracket | Owner-occupied | Renter-occupied |
| Less than $5,000 | 24 (2.2%) | 72 (8.3%) |
| $5,000 to $9,999 | 0 (0.0%) | 98 (11.3%) |
| $10,000 to $14,999 | 22 (2.0%) | 138 (16.0%) |
| $15,000 to $19,999 | 125 (11.5%) | 0 (0.0%) |
| $20,000 to $24,999 | 0 (0.0%) | 49 (5.7%) |
| $25,000 to $34,999 | 82 (7.5%) | 73 (8.4%) |
| $35,000 to $49,999 | 202 (18.5%) | 139 (16.1%) |
| $50,000 to $74,999 | 280 (25.7%) | 253 (29.2%) |
| $75,000 to $99,999 | 156 (14.3%) | 0 (0.0%) |
| $100,000 to $149,999 | 175 (16.1%) | 23 (2.7%) |
| $150,000 or more | 24 (2.2%) | 20 (2.3%) |
| Total | 1,090 (100.0%) | 865 (100.0%) |
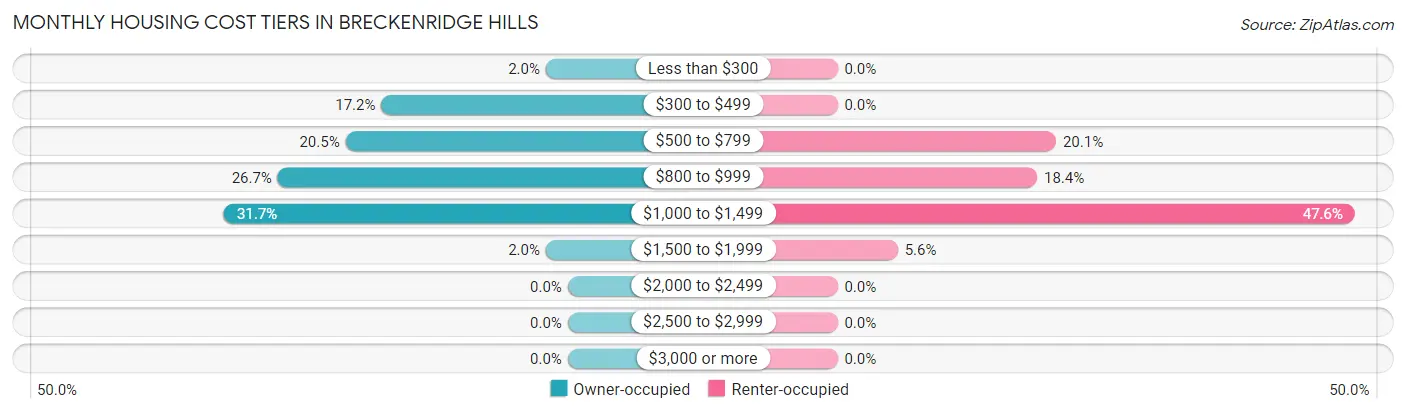
Monthly Housing Cost Tiers in Breckenridge Hills
| Monthly Cost | Owner-occupied | Renter-occupied |
| Less than $300 | 22 (2.0%) | 0 (0.0%) |
| $300 to $499 | 187 (17.2%) | 0 (0.0%) |
| $500 to $799 | 223 (20.5%) | 174 (20.1%) |
| $800 to $999 | 291 (26.7%) | 159 (18.4%) |
| $1,000 to $1,499 | 345 (31.7%) | 412 (47.6%) |
| $1,500 to $1,999 | 22 (2.0%) | 48 (5.6%) |
| $2,000 to $2,499 | 0 (0.0%) | 0 (0.0%) |
| $2,500 to $2,999 | 0 (0.0%) | 0 (0.0%) |
| $3,000 or more | 0 (0.0%) | 0 (0.0%) |
| Total | 1,090 (100.0%) | 865 (100.0%) |
Physical Housing Characteristics in Breckenridge Hills
Housing Structures in Breckenridge Hills
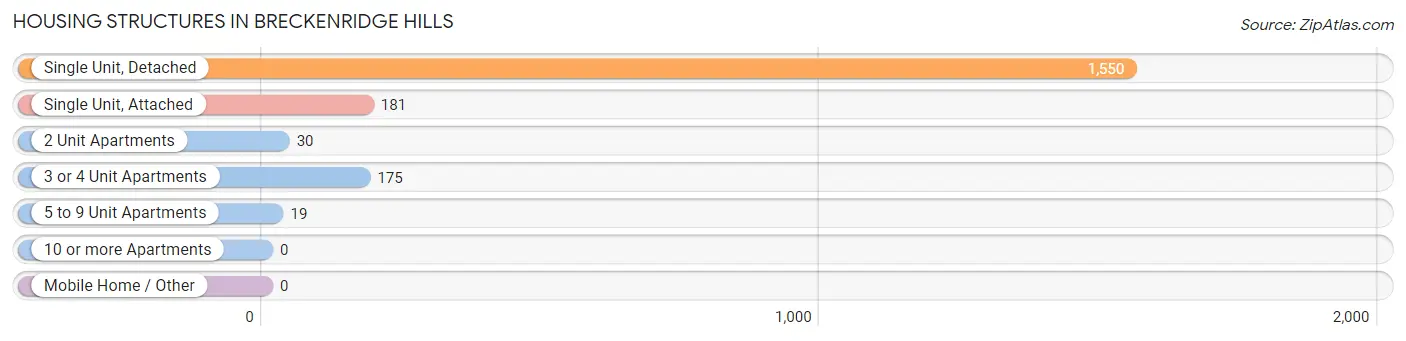
| Structure Type | # Housing Units | % Housing Units |
| Single Unit, Detached | 1,550 | 79.3% |
| Single Unit, Attached | 181 | 9.3% |
| 2 Unit Apartments | 30 | 1.5% |
| 3 or 4 Unit Apartments | 175 | 8.9% |
| 5 to 9 Unit Apartments | 19 | 1.0% |
| 10 or more Apartments | 0 | 0.0% |
| Mobile Home / Other | 0 | 0.0% |
| Total | 1,955 | 100.0% |
Housing Structures by Occupancy in Breckenridge Hills
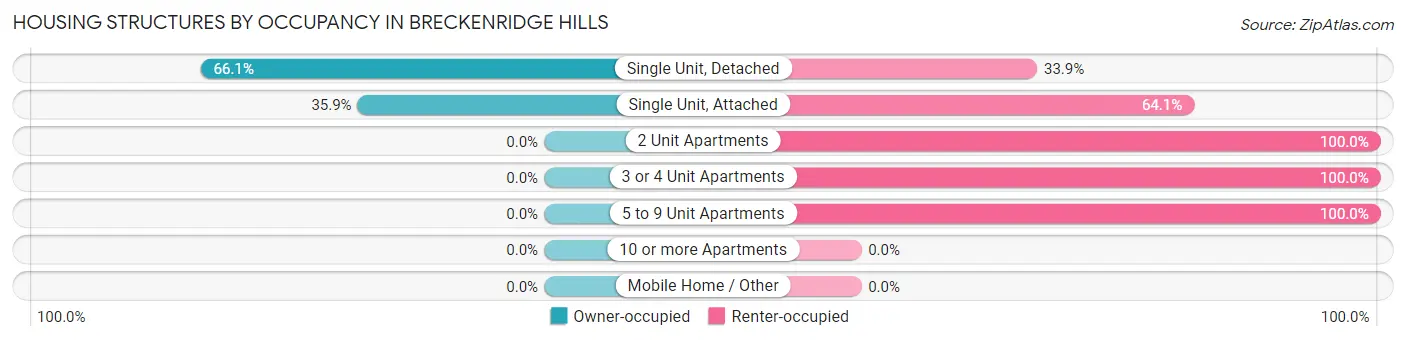
| Structure Type | Owner-occupied | Renter-occupied |
| Single Unit, Detached | 1,025 (66.1%) | 525 (33.9%) |
| Single Unit, Attached | 65 (35.9%) | 116 (64.1%) |
| 2 Unit Apartments | 0 (0.0%) | 30 (100.0%) |
| 3 or 4 Unit Apartments | 0 (0.0%) | 175 (100.0%) |
| 5 to 9 Unit Apartments | 0 (0.0%) | 19 (100.0%) |
| 10 or more Apartments | 0 (0.0%) | 0 (0.0%) |
| Mobile Home / Other | 0 (0.0%) | 0 (0.0%) |
| Total | 1,090 (55.7%) | 865 (44.3%) |
Housing Structures by Number of Rooms in Breckenridge Hills
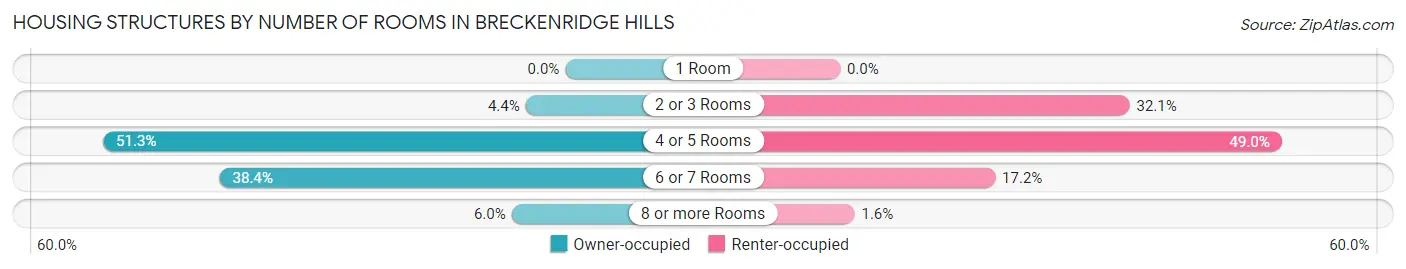
| Number of Rooms | Owner-occupied | Renter-occupied |
| 1 Room | 0 (0.0%) | 0 (0.0%) |
| 2 or 3 Rooms | 48 (4.4%) | 278 (32.1%) |
| 4 or 5 Rooms | 559 (51.3%) | 424 (49.0%) |
| 6 or 7 Rooms | 418 (38.4%) | 149 (17.2%) |
| 8 or more Rooms | 65 (6.0%) | 14 (1.6%) |
| Total | 1,090 (100.0%) | 865 (100.0%) |
Housing Structure by Heating Type in Breckenridge Hills
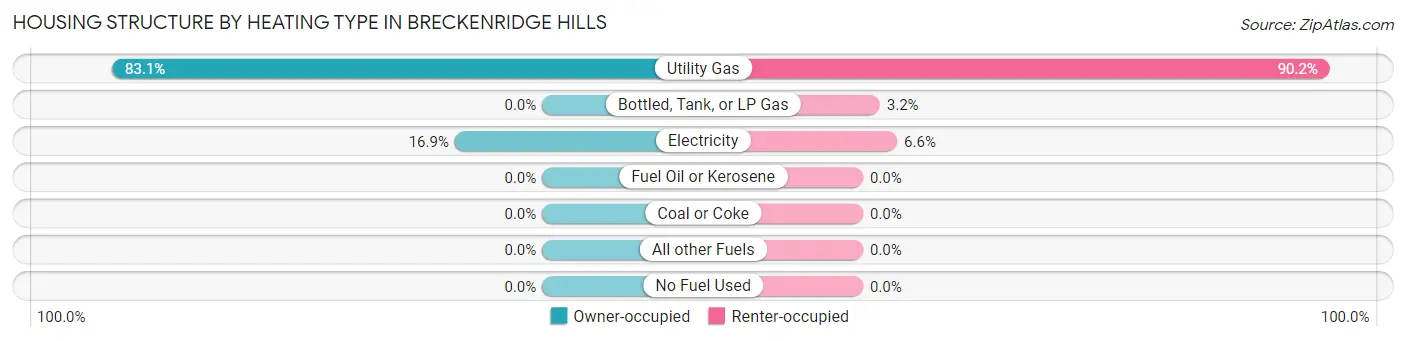
| Heating Type | Owner-occupied | Renter-occupied |
| Utility Gas | 906 (83.1%) | 780 (90.2%) |
| Bottled, Tank, or LP Gas | 0 (0.0%) | 28 (3.2%) |
| Electricity | 184 (16.9%) | 57 (6.6%) |
| Fuel Oil or Kerosene | 0 (0.0%) | 0 (0.0%) |
| Coal or Coke | 0 (0.0%) | 0 (0.0%) |
| All other Fuels | 0 (0.0%) | 0 (0.0%) |
| No Fuel Used | 0 (0.0%) | 0 (0.0%) |
| Total | 1,090 (100.0%) | 865 (100.0%) |
Household Vehicle Usage in Breckenridge Hills
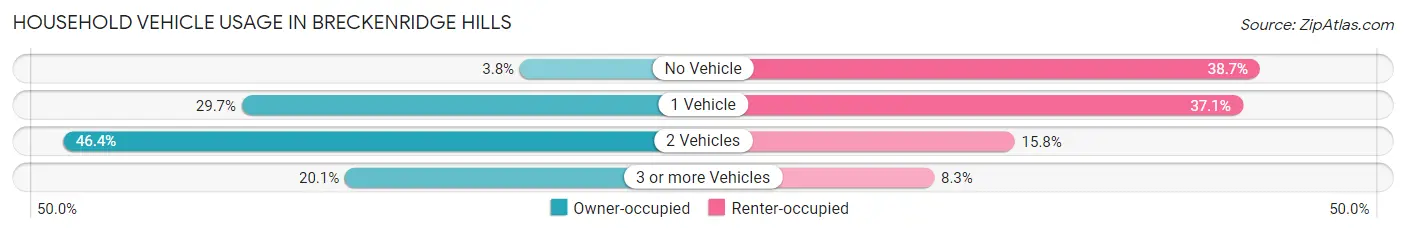
| Vehicles per Household | Owner-occupied | Renter-occupied |
| No Vehicle | 41 (3.8%) | 335 (38.7%) |
| 1 Vehicle | 324 (29.7%) | 321 (37.1%) |
| 2 Vehicles | 506 (46.4%) | 137 (15.8%) |
| 3 or more Vehicles | 219 (20.1%) | 72 (8.3%) |
| Total | 1,090 (100.0%) | 865 (100.0%) |
Real Estate & Mortgages in Breckenridge Hills
Real Estate and Mortgage Overview in Breckenridge Hills
| Characteristic | Without Mortgage | With Mortgage |
| Housing Units | 427 | 663 |
| Median Property Value | $91,000 | $93,100 |
| Median Household Income | $52,022 | $0 |
| Monthly Housing Costs | $526 | $0 |
| Real Estate Taxes | $1,699 | $73 |
Property Value by Mortgage Status in Breckenridge Hills
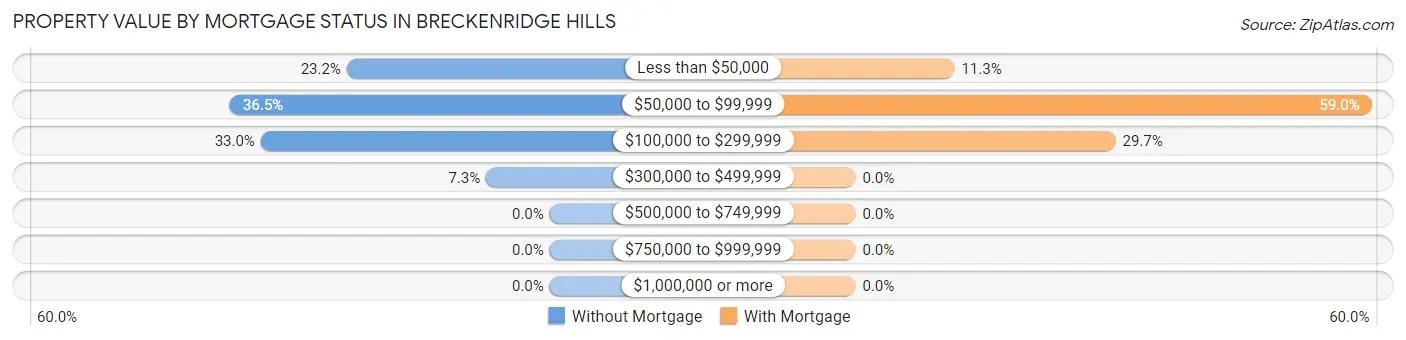
| Property Value | Without Mortgage | With Mortgage |
| Less than $50,000 | 99 (23.2%) | 75 (11.3%) |
| $50,000 to $99,999 | 156 (36.5%) | 391 (59.0%) |
| $100,000 to $299,999 | 141 (33.0%) | 197 (29.7%) |
| $300,000 to $499,999 | 31 (7.3%) | 0 (0.0%) |
| $500,000 to $749,999 | 0 (0.0%) | 0 (0.0%) |
| $750,000 to $999,999 | 0 (0.0%) | 0 (0.0%) |
| $1,000,000 or more | 0 (0.0%) | 0 (0.0%) |
| Total | 427 (100.0%) | 663 (100.0%) |
Household Income by Mortgage Status in Breckenridge Hills
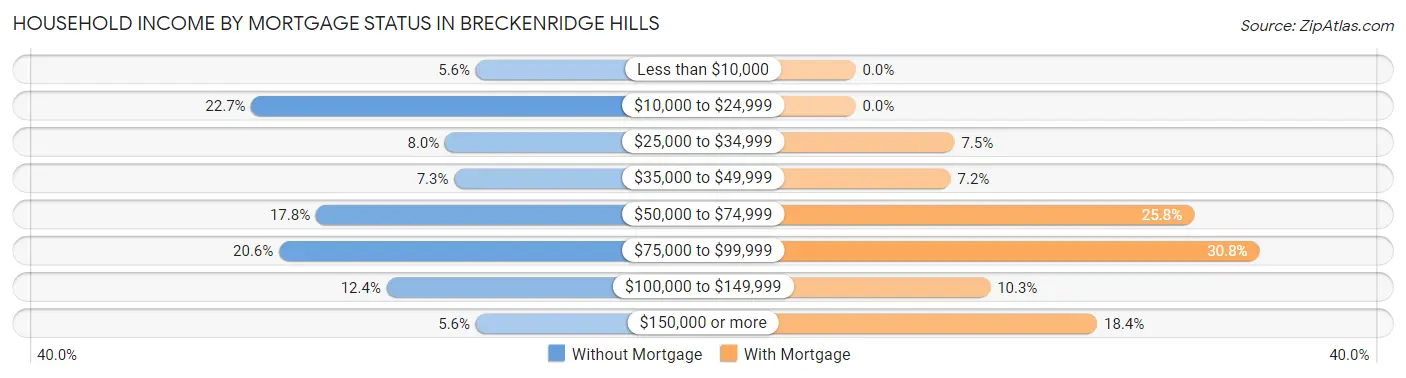
| Household Income | Without Mortgage | With Mortgage |
| Less than $10,000 | 24 (5.6%) | 0 (0.0%) |
| $10,000 to $24,999 | 97 (22.7%) | 0 (0.0%) |
| $25,000 to $34,999 | 34 (8.0%) | 50 (7.5%) |
| $35,000 to $49,999 | 31 (7.3%) | 48 (7.2%) |
| $50,000 to $74,999 | 76 (17.8%) | 171 (25.8%) |
| $75,000 to $99,999 | 88 (20.6%) | 204 (30.8%) |
| $100,000 to $149,999 | 53 (12.4%) | 68 (10.3%) |
| $150,000 or more | 24 (5.6%) | 122 (18.4%) |
| Total | 427 (100.0%) | 663 (100.0%) |
Property Value to Household Income Ratio in Breckenridge Hills
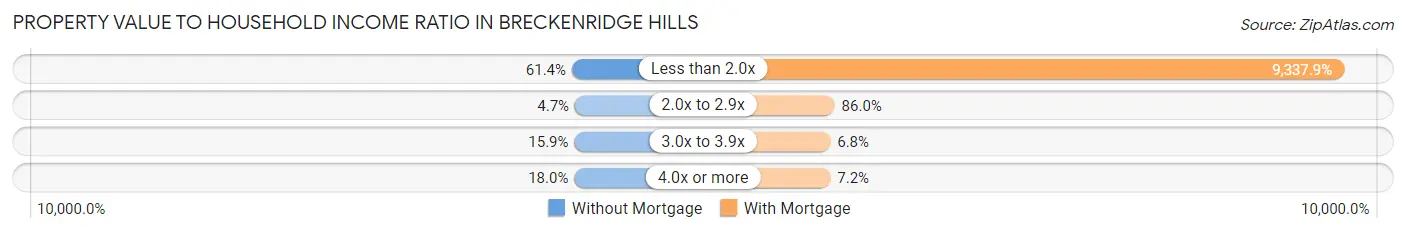
| Value-to-Income Ratio | Without Mortgage | With Mortgage |
| Less than 2.0x | 262 (61.4%) | 61,910 (9,337.9%) |
| 2.0x to 2.9x | 20 (4.7%) | 570 (86.0%) |
| 3.0x to 3.9x | 68 (15.9%) | 45 (6.8%) |
| 4.0x or more | 77 (18.0%) | 48 (7.2%) |
| Total | 427 (100.0%) | 663 (100.0%) |
Real Estate Taxes by Mortgage Status in Breckenridge Hills
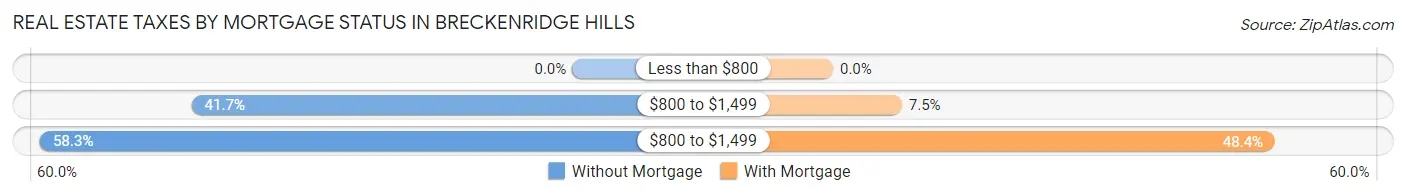
| Property Taxes | Without Mortgage | With Mortgage |
| Less than $800 | 0 (0.0%) | 0 (0.0%) |
| $800 to $1,499 | 178 (41.7%) | 50 (7.5%) |
| $800 to $1,499 | 249 (58.3%) | 321 (48.4%) |
| Total | 427 (100.0%) | 663 (100.0%) |
Health & Disability in Breckenridge Hills
Health Insurance Coverage by Age in Breckenridge Hills
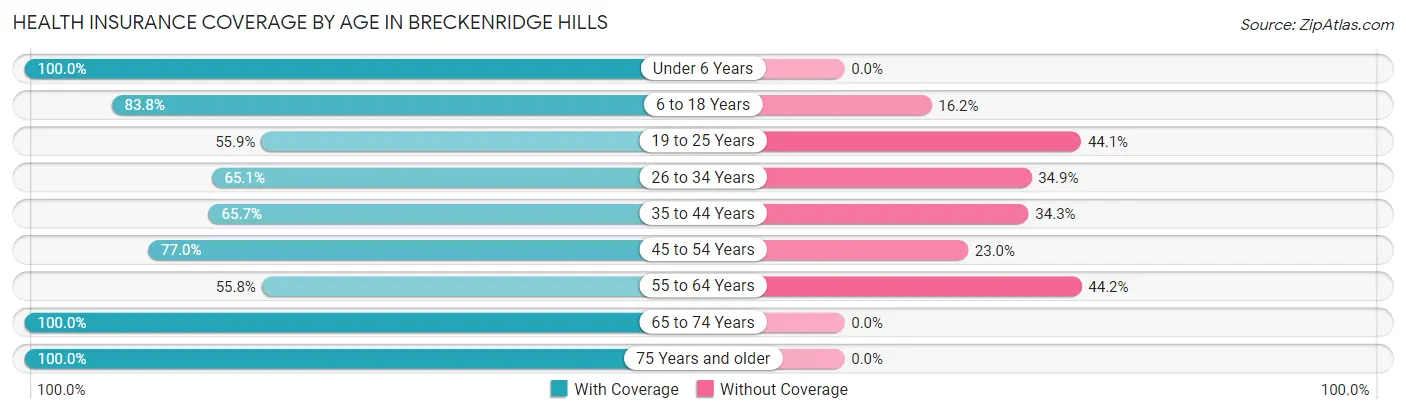
| Age Bracket | With Coverage | Without Coverage |
| Under 6 Years | 418 (100.0%) | 0 (0.0%) |
| 6 to 18 Years | 563 (83.8%) | 109 (16.2%) |
| 19 to 25 Years | 138 (55.9%) | 109 (44.1%) |
| 26 to 34 Years | 583 (65.1%) | 312 (34.9%) |
| 35 to 44 Years | 396 (65.7%) | 207 (34.3%) |
| 45 to 54 Years | 608 (77.0%) | 182 (23.0%) |
| 55 to 64 Years | 130 (55.8%) | 103 (44.2%) |
| 65 to 74 Years | 321 (100.0%) | 0 (0.0%) |
| 75 Years and older | 213 (100.0%) | 0 (0.0%) |
| Total | 3,370 (76.7%) | 1,022 (23.3%) |
Health Insurance Coverage by Citizenship Status in Breckenridge Hills
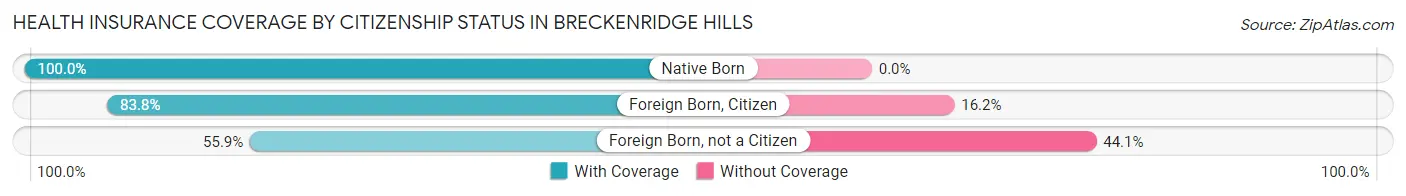
| Citizenship Status | With Coverage | Without Coverage |
| Native Born | 418 (100.0%) | 0 (0.0%) |
| Foreign Born, Citizen | 563 (83.8%) | 109 (16.2%) |
| Foreign Born, not a Citizen | 138 (55.9%) | 109 (44.1%) |
Health Insurance Coverage by Household Income in Breckenridge Hills
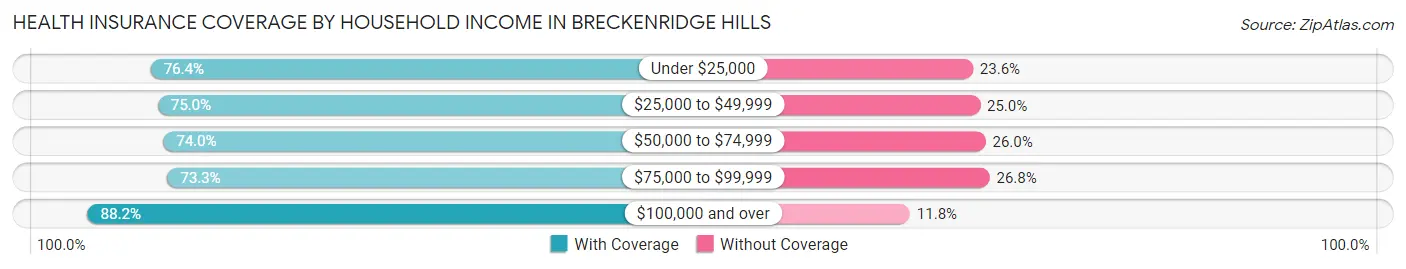
| Household Income | With Coverage | Without Coverage |
| Under $25,000 | 808 (76.4%) | 250 (23.6%) |
| $25,000 to $49,999 | 854 (75.0%) | 284 (25.0%) |
| $50,000 to $74,999 | 803 (74.0%) | 282 (26.0%) |
| $75,000 to $99,999 | 367 (73.3%) | 134 (26.8%) |
| $100,000 and over | 537 (88.2%) | 72 (11.8%) |
Public vs Private Health Insurance Coverage by Age in Breckenridge Hills
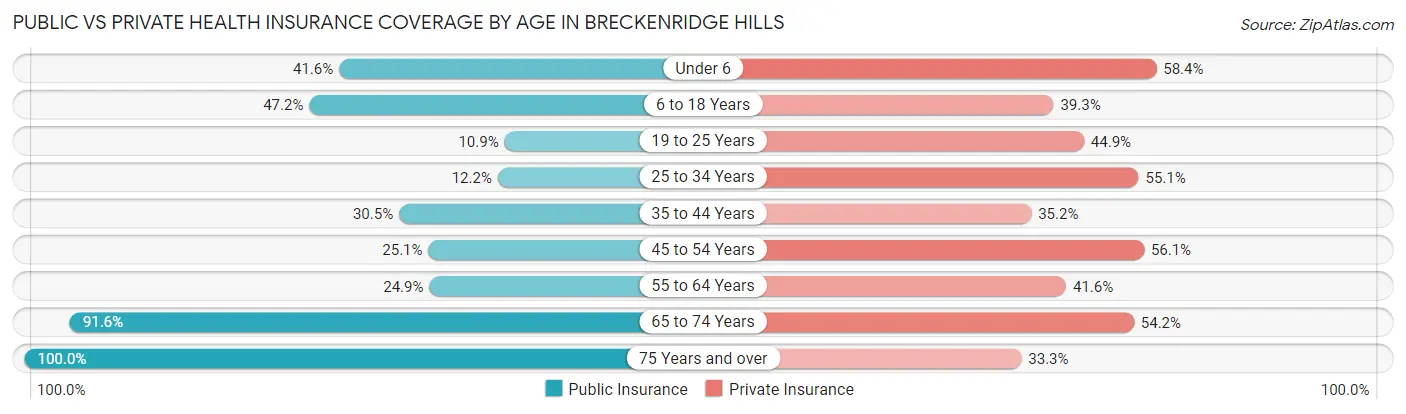
| Age Bracket | Public Insurance | Private Insurance |
| Under 6 | 174 (41.6%) | 244 (58.4%) |
| 6 to 18 Years | 317 (47.2%) | 264 (39.3%) |
| 19 to 25 Years | 27 (10.9%) | 111 (44.9%) |
| 25 to 34 Years | 109 (12.2%) | 493 (55.1%) |
| 35 to 44 Years | 184 (30.5%) | 212 (35.2%) |
| 45 to 54 Years | 198 (25.1%) | 443 (56.1%) |
| 55 to 64 Years | 58 (24.9%) | 97 (41.6%) |
| 65 to 74 Years | 294 (91.6%) | 174 (54.2%) |
| 75 Years and over | 213 (100.0%) | 71 (33.3%) |
| Total | 1,574 (35.8%) | 2,109 (48.0%) |
Disability Status by Sex by Age in Breckenridge Hills
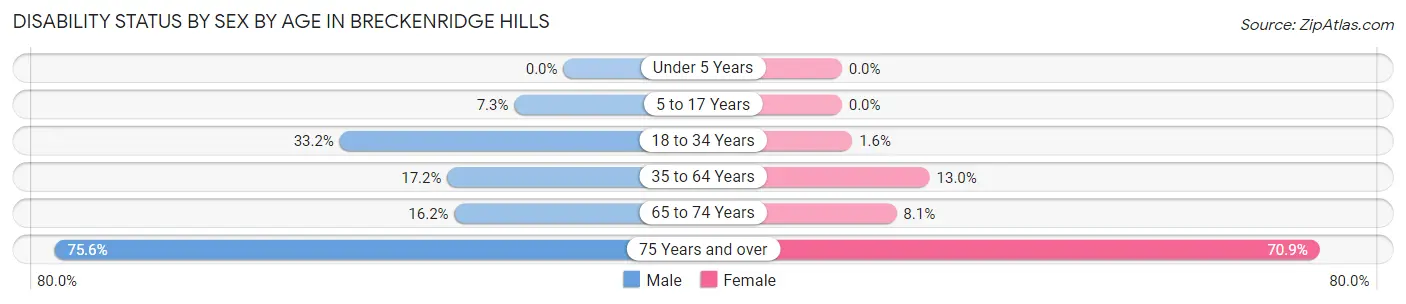
| Age Bracket | Male | Female |
| Under 5 Years | 0 (0.0%) | 0 (0.0%) |
| 5 to 17 Years | 31 (7.3%) | 0 (0.0%) |
| 18 to 34 Years | 179 (33.2%) | 10 (1.5%) |
| 35 to 64 Years | 148 (17.2%) | 100 (13.0%) |
| 65 to 74 Years | 22 (16.2%) | 15 (8.1%) |
| 75 Years and over | 96 (75.6%) | 61 (70.9%) |
Disability Class by Sex by Age in Breckenridge Hills
Disability Class: Hearing Difficulty
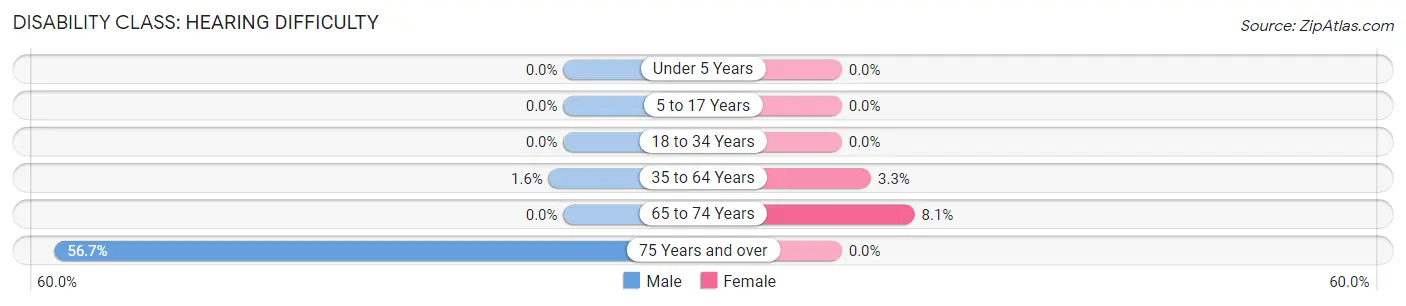
| Age Bracket | Male | Female |
| Under 5 Years | 0 (0.0%) | 0 (0.0%) |
| 5 to 17 Years | 0 (0.0%) | 0 (0.0%) |
| 18 to 34 Years | 0 (0.0%) | 0 (0.0%) |
| 35 to 64 Years | 14 (1.6%) | 25 (3.3%) |
| 65 to 74 Years | 0 (0.0%) | 15 (8.1%) |
| 75 Years and over | 72 (56.7%) | 0 (0.0%) |
Disability Class: Vision Difficulty
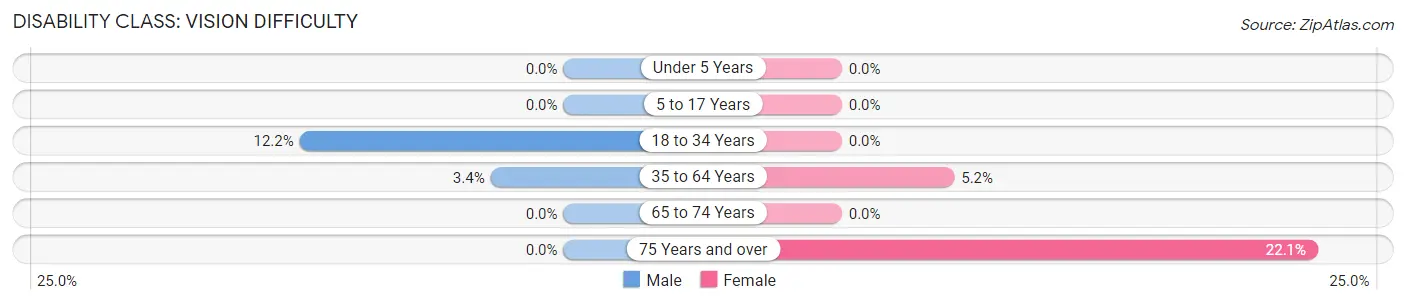
| Age Bracket | Male | Female |
| Under 5 Years | 0 (0.0%) | 0 (0.0%) |
| 5 to 17 Years | 0 (0.0%) | 0 (0.0%) |
| 18 to 34 Years | 66 (12.2%) | 0 (0.0%) |
| 35 to 64 Years | 29 (3.4%) | 40 (5.2%) |
| 65 to 74 Years | 0 (0.0%) | 0 (0.0%) |
| 75 Years and over | 0 (0.0%) | 19 (22.1%) |
Disability Class: Cognitive Difficulty
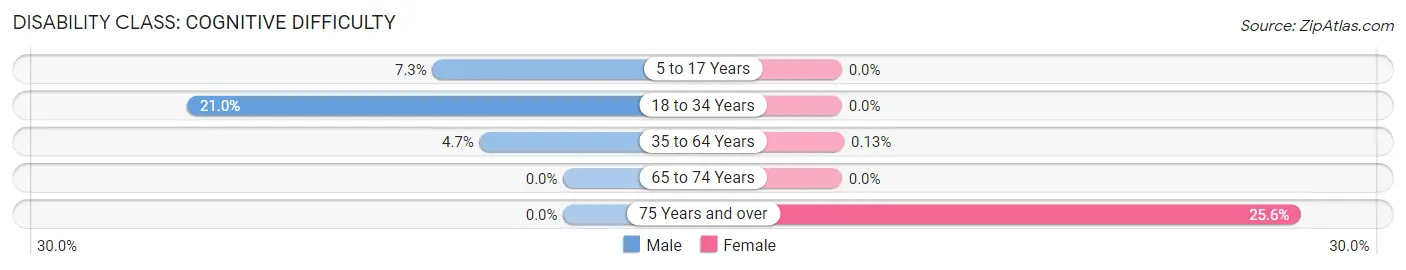
| Age Bracket | Male | Female |
| 5 to 17 Years | 31 (7.3%) | 0 (0.0%) |
| 18 to 34 Years | 113 (21.0%) | 0 (0.0%) |
| 35 to 64 Years | 40 (4.7%) | 1 (0.1%) |
| 65 to 74 Years | 0 (0.0%) | 0 (0.0%) |
| 75 Years and over | 0 (0.0%) | 22 (25.6%) |
Disability Class: Ambulatory Difficulty
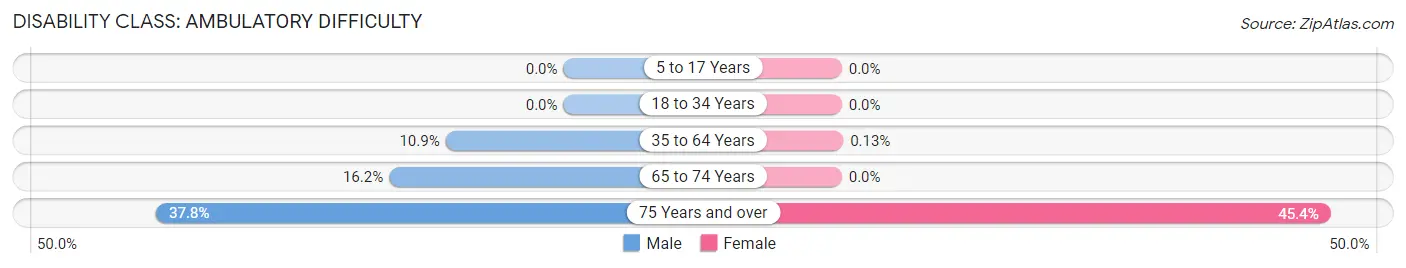
| Age Bracket | Male | Female |
| 5 to 17 Years | 0 (0.0%) | 0 (0.0%) |
| 18 to 34 Years | 0 (0.0%) | 0 (0.0%) |
| 35 to 64 Years | 94 (10.9%) | 1 (0.1%) |
| 65 to 74 Years | 22 (16.2%) | 0 (0.0%) |
| 75 Years and over | 48 (37.8%) | 39 (45.4%) |
Disability Class: Self-Care Difficulty
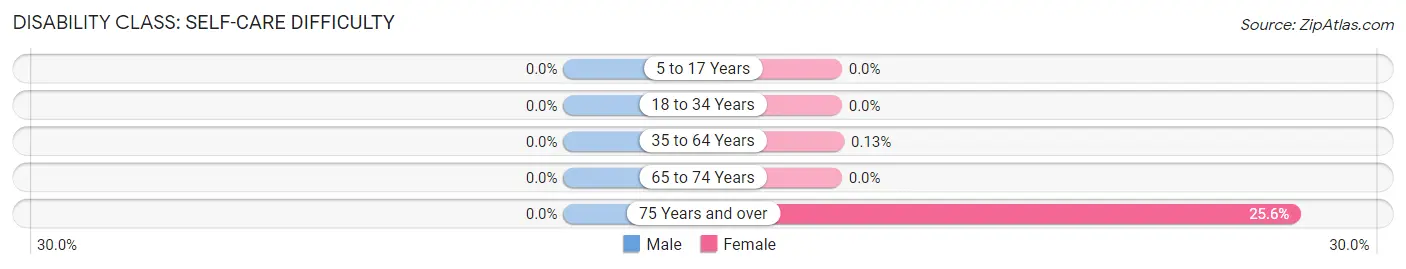
| Age Bracket | Male | Female |
| 5 to 17 Years | 0 (0.0%) | 0 (0.0%) |
| 18 to 34 Years | 0 (0.0%) | 0 (0.0%) |
| 35 to 64 Years | 0 (0.0%) | 1 (0.1%) |
| 65 to 74 Years | 0 (0.0%) | 0 (0.0%) |
| 75 Years and over | 0 (0.0%) | 22 (25.6%) |
Technology Access in Breckenridge Hills
Computing Device Access in Breckenridge Hills
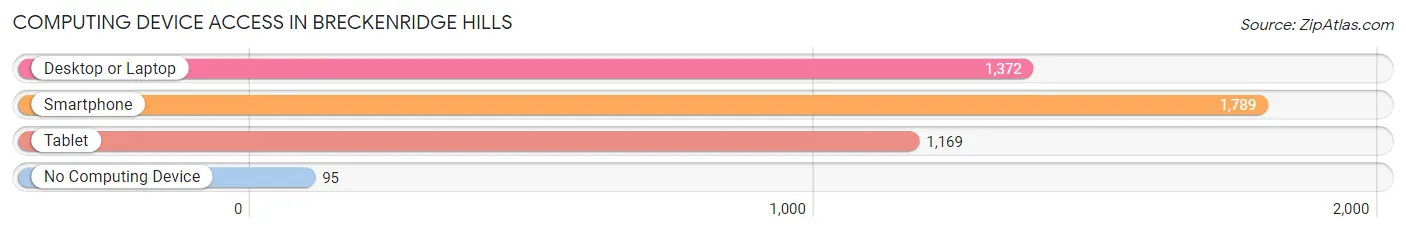
| Device Type | # Households | % Households |
| Desktop or Laptop | 1,372 | 70.2% |
| Smartphone | 1,789 | 91.5% |
| Tablet | 1,169 | 59.8% |
| No Computing Device | 95 | 4.9% |
| Total | 1,955 | 100.0% |
Internet Access in Breckenridge Hills
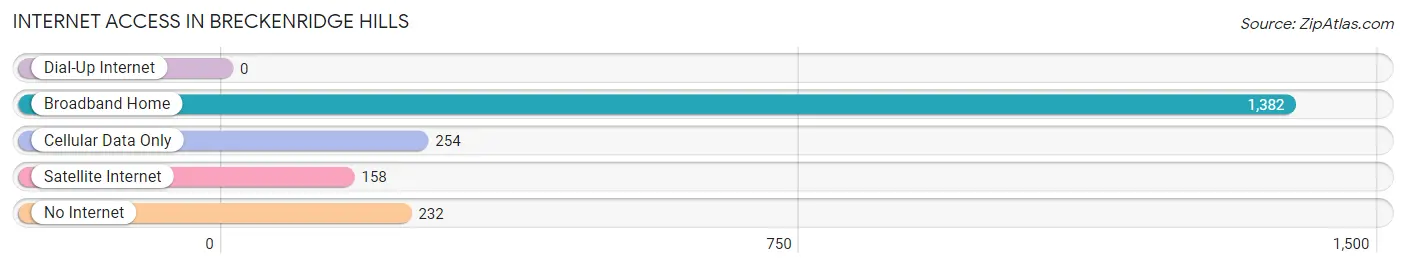
| Internet Type | # Households | % Households |
| Dial-Up Internet | 0 | 0.0% |
| Broadband Home | 1,382 | 70.7% |
| Cellular Data Only | 254 | 13.0% |
| Satellite Internet | 158 | 8.1% |
| No Internet | 232 | 11.9% |
| Total | 1,955 | 100.0% |
Breckenridge Hills Summary
Breckenridge Hills is a small city located in St. Louis County, Missouri. It is situated in the northwest corner of the county, just south of the city of St. Louis. The city has a population of approximately 3,000 people and covers an area of 1.2 square miles.
History
Breckenridge Hills was founded in the early 1950s by a group of developers who wanted to create a suburban community in the St. Louis area. The city was named after the nearby Breckenridge Hills Country Club, which was established in the late 1940s. The city was incorporated in 1954 and has remained relatively unchanged since then.
Geography
Breckenridge Hills is located in the northwest corner of St. Louis County, just south of the city of St. Louis. The city is bordered by the cities of St. Ann to the north, Overland to the east, and St. John to the south. The city is situated on a plateau, with an elevation of approximately 500 feet above sea level. The city is located in the Missouri River Valley, and is surrounded by rolling hills and wooded areas.
Economy
Breckenridge Hills is primarily a residential community, with most of its residents employed in the nearby cities of St. Louis and St. Ann. The city does not have any major industries or businesses, but there are several small businesses located in the city, including restaurants, retail stores, and professional services.
Demographics
As of the 2010 census, the population of Breckenridge Hills was 3,039. The racial makeup of the city was 79.3% White, 15.2% African American, 0.3% Native American, 0.7% Asian, 0.1% Pacific Islander, and 4.4% from other races. The median household income was $45,938, and the median family income was $51,938. The per capita income was $20,938.
Conclusion
Breckenridge Hills is a small city located in St. Louis County, Missouri. It is situated in the northwest corner of the county, just south of the city of St. Louis. The city has a population of approximately 3,000 people and covers an area of 1.2 square miles. The city was founded in the early 1950s and has remained relatively unchanged since then. Breckenridge Hills is primarily a residential community, with most of its residents employed in the nearby cities of St. Louis and St. Ann. The city does not have any major industries or businesses, but there are several small businesses located in the city. As of the 2010 census, the population of Breckenridge Hills was 3,039, with a median household income of $45,938.
Common Questions
What is the Total Population of Breckenridge Hills?
Total Population of Breckenridge Hills is 4,452.
What is the Total Male Population of Breckenridge Hills?
Total Male Population of Breckenridge Hills is 2,294.
What is the Total Female Population of Breckenridge Hills?
Total Female Population of Breckenridge Hills is 2,158.
What is the Ratio of Males per 100 Females in Breckenridge Hills?
There are 106.30 Males per 100 Females in Breckenridge Hills.
What is the Ratio of Females per 100 Males in Breckenridge Hills?
There are 94.07 Females per 100 Males in Breckenridge Hills.
What is the Median Population Age in Breckenridge Hills?
Median Population Age in Breckenridge Hills is 34.5 Years.
What is the Average Family Size in Breckenridge Hills
Average Family Size in Breckenridge Hills is 2.6 People.
What is the Average Household Size in Breckenridge Hills
Average Household Size in Breckenridge Hills is 2.3 People.
What is Per Capita Income in Breckenridge Hills?
Per Capita income in Breckenridge Hills is $29,419.
What is the Median Family Income in Breckenridge Hills?
Median Family Income in Breckenridge Hills is $48,409.
What is the Median Household income in Breckenridge Hills?
Median Household Income in Breckenridge Hills is $49,198.
What is Income or Wage Gap in Breckenridge Hills?
Income or Wage Gap in Breckenridge Hills is 16.9%.
Women in Breckenridge Hills earn 83.1 cents for every dollar earned by a man.
What is Family Income Deficit in Breckenridge Hills?
Family Income Deficit in Breckenridge Hills is $19,648.
Families that are below poverty line in Breckenridge Hills earn $19,648 less on average than the poverty threshold level.
What is Inequality or Gini Index in Breckenridge Hills?
Inequality or Gini Index in Breckenridge Hills is 0.49.
How Large is the Labor Force in Breckenridge Hills?
There are 2,477 People in the Labor Forcein in Breckenridge Hills.
What is the Percentage of People in the Labor Force in Breckenridge Hills?
72.1% of People are in the Labor Force in Breckenridge Hills.
What is the Unemployment Rate in Breckenridge Hills?
Unemployment Rate in Breckenridge Hills is 8.2%.