Bellefontaine Neighbors, MO
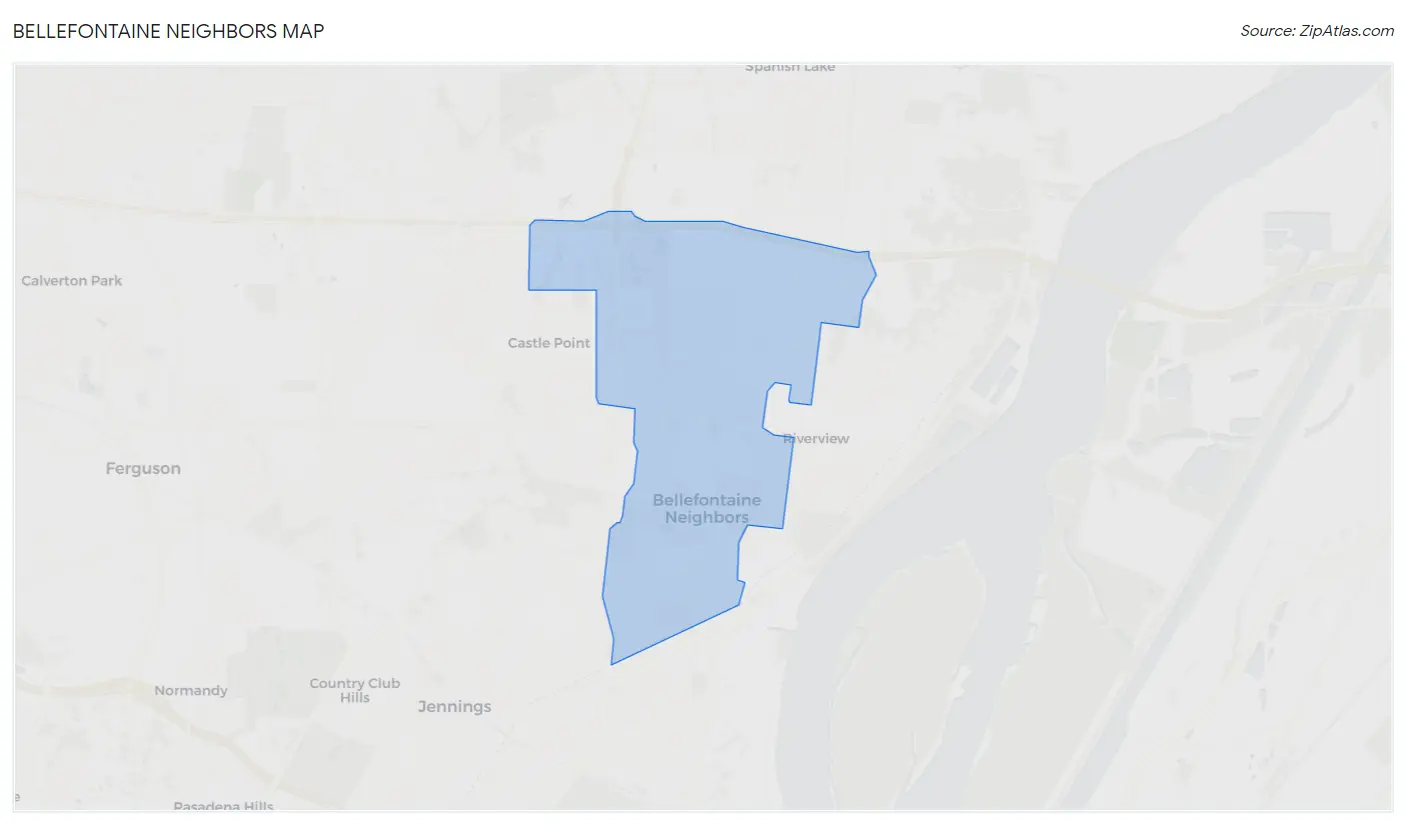
Bellefontaine Neighbors Map
Bellefontaine Neighbors Overview
10,637
TOTAL POPULATION
4,417
MALE POPULATION
6,220
FEMALE POPULATION
71.01
MALES / 100 FEMALES
140.82
FEMALES / 100 MALES
45.1
MEDIAN AGE
3.1
AVG FAMILY SIZE
2.2
AVG HOUSEHOLD SIZE
$27,865
PER CAPITA INCOME
$53,644
AVG FAMILY INCOME
$46,115
AVG HOUSEHOLD INCOME
11.6%
WAGE / INCOME GAP [ % ]
88.4¢/ $1
WAGE / INCOME GAP [ $ ]
0.48
INEQUALITY / GINI INDEX
4,090
LABOR FORCE [ PEOPLE ]
48.9%
PERCENT IN LABOR FORCE
6.2%
UNEMPLOYMENT RATE
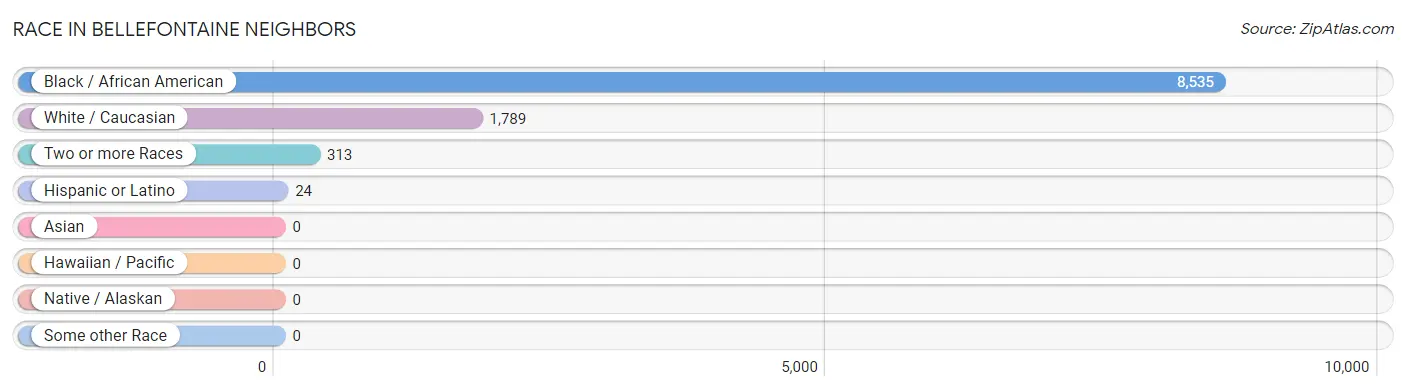
Race in Bellefontaine Neighbors
The most populous races in Bellefontaine Neighbors are Black / African American (8,535 | 80.2%), White / Caucasian (1,789 | 16.8%), and Two or more Races (313 | 2.9%).
| Race | # Population | % Population |
| Asian | 0 | 0.0% |
| Black / African American | 8,535 | 80.2% |
| Hawaiian / Pacific | 0 | 0.0% |
| Hispanic or Latino | 24 | 0.2% |
| Native / Alaskan | 0 | 0.0% |
| White / Caucasian | 1,789 | 16.8% |
| Two or more Races | 313 | 2.9% |
| Some other Race | 0 | 0.0% |
| Total | 10,637 | 100.0% |
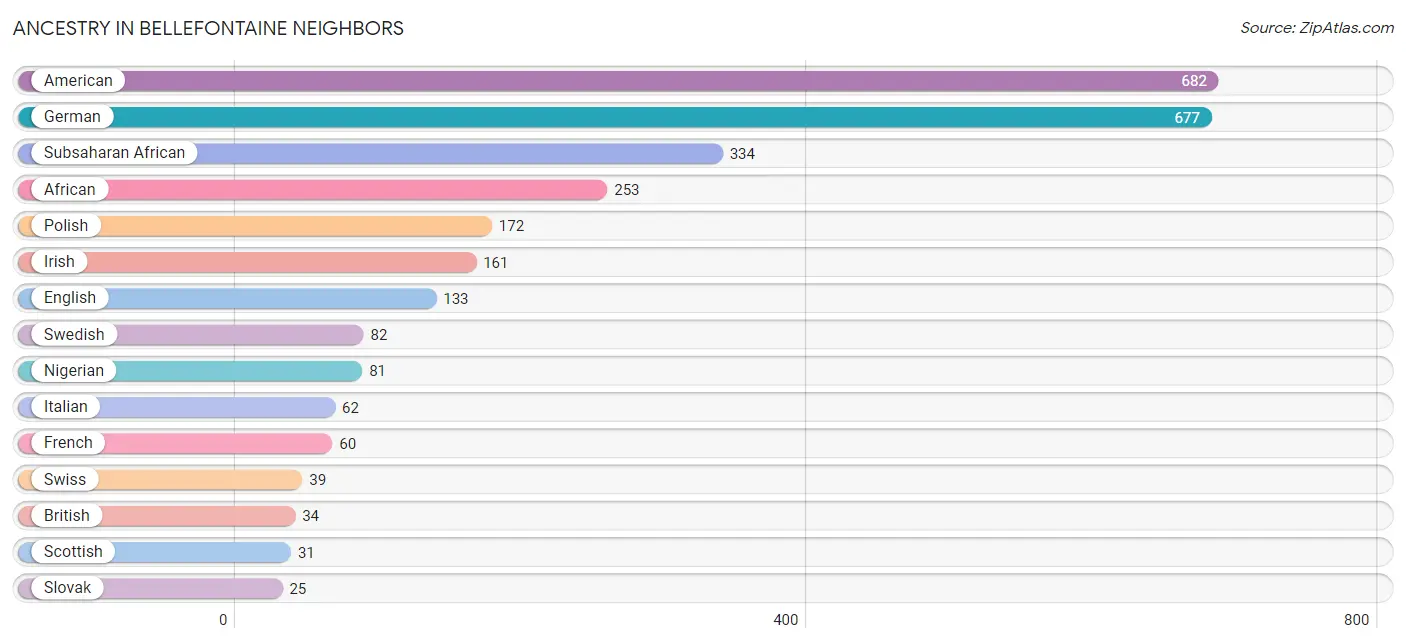
Ancestry in Bellefontaine Neighbors
The most populous ancestries reported in Bellefontaine Neighbors are American (682 | 6.4%), German (677 | 6.4%), Subsaharan African (334 | 3.1%), African (253 | 2.4%), and Polish (172 | 1.6%), together accounting for 19.9% of all Bellefontaine Neighbors residents.
| Ancestry | # Population | % Population |
| African | 253 | 2.4% |
| American | 682 | 6.4% |
| Arab | 21 | 0.2% |
| Armenian | 5 | 0.1% |
| Austrian | 24 | 0.2% |
| British | 34 | 0.3% |
| Cherokee | 15 | 0.1% |
| Choctaw | 11 | 0.1% |
| English | 133 | 1.3% |
| European | 22 | 0.2% |
| French | 60 | 0.6% |
| German | 677 | 6.4% |
| Irish | 161 | 1.5% |
| Italian | 62 | 0.6% |
| Lebanese | 21 | 0.2% |
| Lithuanian | 10 | 0.1% |
| Mexican | 15 | 0.1% |
| Nigerian | 81 | 0.8% |
| Polish | 172 | 1.6% |
| Scottish | 31 | 0.3% |
| Slovak | 25 | 0.2% |
| Subsaharan African | 334 | 3.1% |
| Swedish | 82 | 0.8% |
| Swiss | 39 | 0.4% | View All 24 Rows |
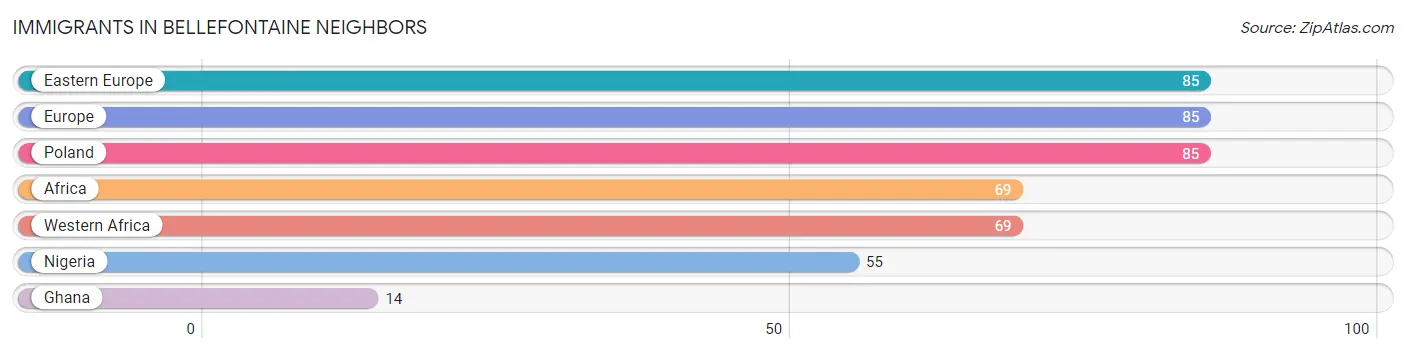
Immigrants in Bellefontaine Neighbors
The most numerous immigrant groups reported in Bellefontaine Neighbors came from Eastern Europe (85 | 0.8%), Europe (85 | 0.8%), Poland (85 | 0.8%), Africa (69 | 0.6%), and Western Africa (69 | 0.6%), together accounting for 3.7% of all Bellefontaine Neighbors residents.
| Immigration Origin | # Population | % Population |
| Africa | 69 | 0.6% |
| Eastern Europe | 85 | 0.8% |
| Europe | 85 | 0.8% |
| Ghana | 14 | 0.1% |
| Nigeria | 55 | 0.5% |
| Poland | 85 | 0.8% |
| Western Africa | 69 | 0.6% | View All 7 Rows |
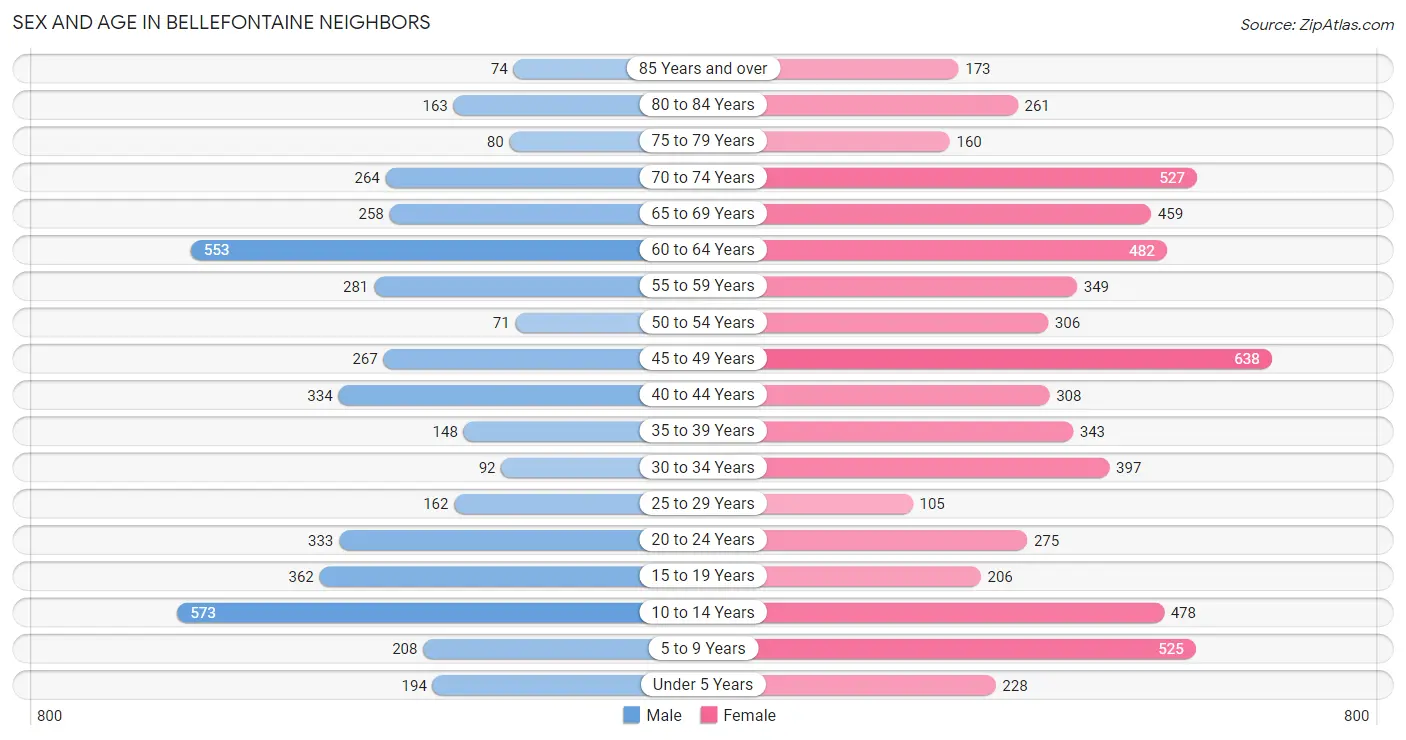
Sex and Age in Bellefontaine Neighbors
Sex and Age in Bellefontaine Neighbors
The most populous age groups in Bellefontaine Neighbors are 10 to 14 Years (573 | 13.0%) for men and 45 to 49 Years (638 | 10.3%) for women.
| Age Bracket | Male | Female |
| Under 5 Years | 194 (4.4%) | 228 (3.7%) |
| 5 to 9 Years | 208 (4.7%) | 525 (8.4%) |
| 10 to 14 Years | 573 (13.0%) | 478 (7.7%) |
| 15 to 19 Years | 362 (8.2%) | 206 (3.3%) |
| 20 to 24 Years | 333 (7.5%) | 275 (4.4%) |
| 25 to 29 Years | 162 (3.7%) | 105 (1.7%) |
| 30 to 34 Years | 92 (2.1%) | 397 (6.4%) |
| 35 to 39 Years | 148 (3.4%) | 343 (5.5%) |
| 40 to 44 Years | 334 (7.6%) | 308 (5.0%) |
| 45 to 49 Years | 267 (6.0%) | 638 (10.3%) |
| 50 to 54 Years | 71 (1.6%) | 306 (4.9%) |
| 55 to 59 Years | 281 (6.4%) | 349 (5.6%) |
| 60 to 64 Years | 553 (12.5%) | 482 (7.7%) |
| 65 to 69 Years | 258 (5.8%) | 459 (7.4%) |
| 70 to 74 Years | 264 (6.0%) | 527 (8.5%) |
| 75 to 79 Years | 80 (1.8%) | 160 (2.6%) |
| 80 to 84 Years | 163 (3.7%) | 261 (4.2%) |
| 85 Years and over | 74 (1.7%) | 173 (2.8%) |
| Total | 4,417 (100.0%) | 6,220 (100.0%) |
Families and Households in Bellefontaine Neighbors
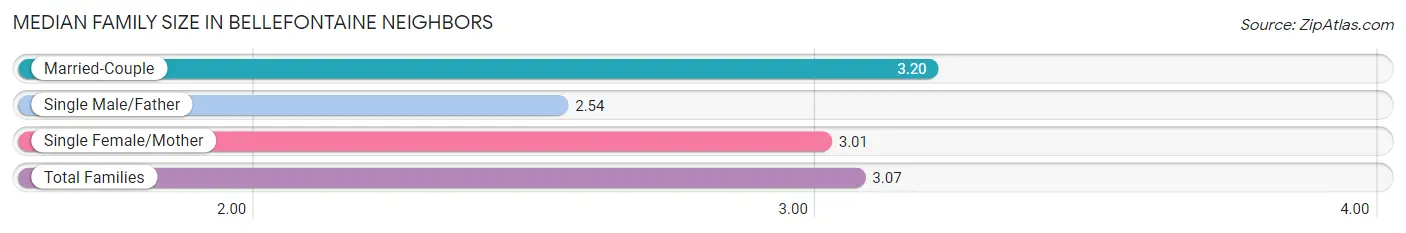
Median Family Size in Bellefontaine Neighbors
The median family size in Bellefontaine Neighbors is 3.07 persons per family, with married-couple families (965 | 37.4%) accounting for the largest median family size of 3.2 persons per family. On the other hand, single male/father families (84 | 3.3%) represent the smallest median family size with 2.54 persons per family.
| Family Type | # Families | Family Size |
| Married-Couple | 965 (37.4%) | 3.20 |
| Single Male/Father | 84 (3.3%) | 2.54 |
| Single Female/Mother | 1,533 (59.4%) | 3.01 |
| Total Families | 2,582 (100.0%) | 3.07 |
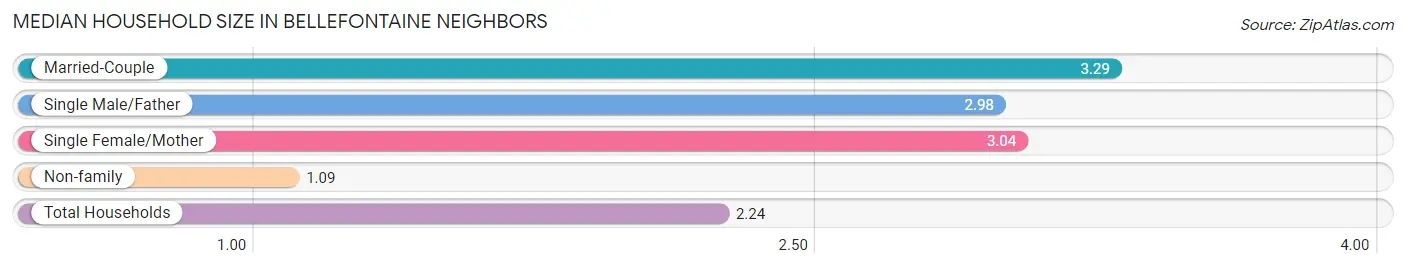
Median Household Size in Bellefontaine Neighbors
The median household size in Bellefontaine Neighbors is 2.24 persons per household, with married-couple households (965 | 21.0%) accounting for the largest median household size of 3.29 persons per household. non-family households (2,002 | 43.7%) represent the smallest median household size with 1.09 persons per household.
| Household Type | # Households | Household Size |
| Married-Couple | 965 (21.0%) | 3.29 |
| Single Male/Father | 84 (1.8%) | 2.98 |
| Single Female/Mother | 1,533 (33.4%) | 3.04 |
| Non-family | 2,002 (43.7%) | 1.09 |
| Total Households | 4,584 (100.0%) | 2.24 |
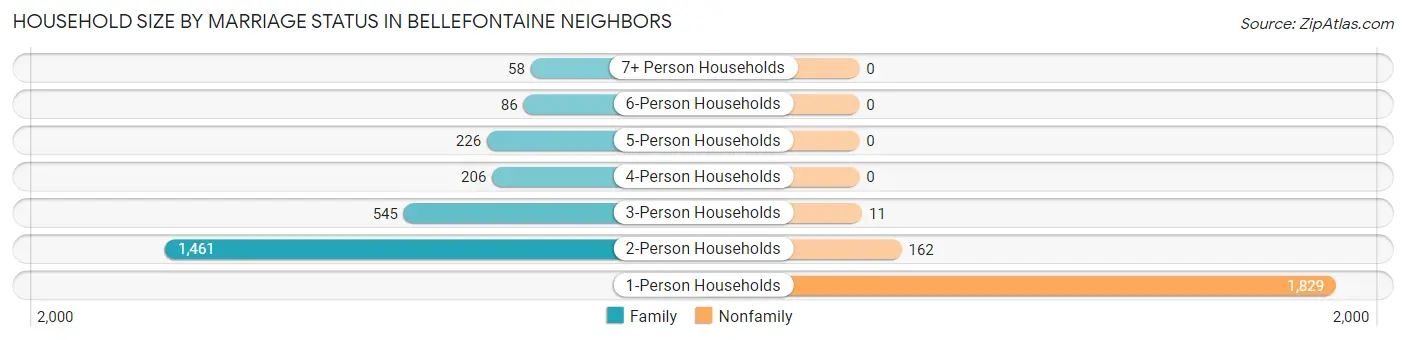
Household Size by Marriage Status in Bellefontaine Neighbors
Out of a total of 4,584 households in Bellefontaine Neighbors, 2,582 (56.3%) are family households, while 2,002 (43.7%) are nonfamily households. The most numerous type of family households are 2-person households, comprising 1,461, and the most common type of nonfamily households are 1-person households, comprising 1,829.
| Household Size | Family Households | Nonfamily Households |
| 1-Person Households | - | 1,829 (39.9%) |
| 2-Person Households | 1,461 (31.9%) | 162 (3.5%) |
| 3-Person Households | 545 (11.9%) | 11 (0.2%) |
| 4-Person Households | 206 (4.5%) | 0 (0.0%) |
| 5-Person Households | 226 (4.9%) | 0 (0.0%) |
| 6-Person Households | 86 (1.9%) | 0 (0.0%) |
| 7+ Person Households | 58 (1.3%) | 0 (0.0%) |
| Total | 2,582 (56.3%) | 2,002 (43.7%) |
Female Fertility in Bellefontaine Neighbors
Fertility by Age in Bellefontaine Neighbors
Average fertility rate in Bellefontaine Neighbors is 104.0 births per 1,000 women. Women in the age bracket of 15 to 19 years have the highest fertility rate with 272.0 births per 1,000 women. Women in the age bracket of 20 to 34 years acount for 76.9% of all women with births.
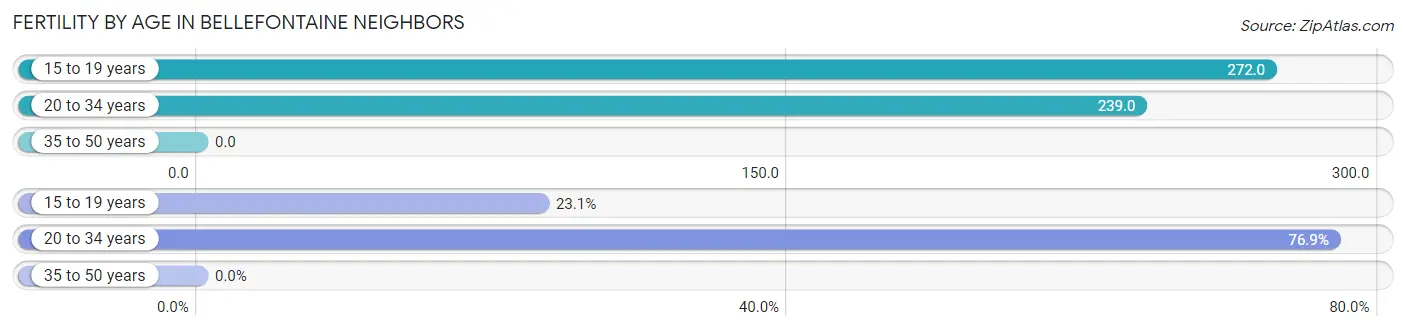
| Age Bracket | Women with Births | Births / 1,000 Women |
| 15 to 19 years | 56 (23.1%) | 272.0 |
| 20 to 34 years | 186 (76.9%) | 239.0 |
| 35 to 50 years | 0 (0.0%) | 0.0 |
| Total | 242 (100.0%) | 104.0 |
Fertility by Age by Marriage Status in Bellefontaine Neighbors
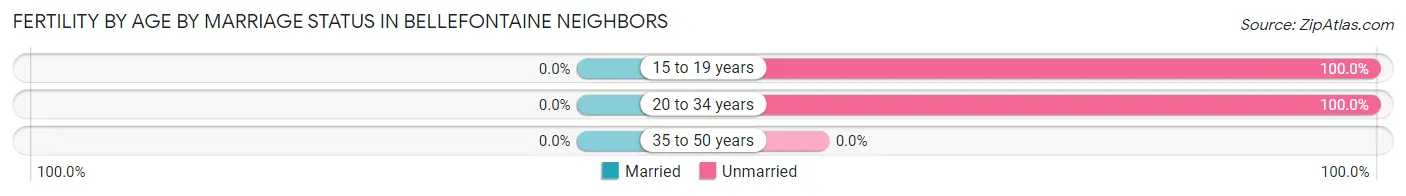
| Age Bracket | Married | Unmarried |
| 15 to 19 years | 0 (0.0%) | 56 (100.0%) |
| 20 to 34 years | 0 (0.0%) | 186 (100.0%) |
| 35 to 50 years | 0 (0.0%) | 0 (0.0%) |
| Total | 0 (0.0%) | 242 (100.0%) |
Fertility by Education in Bellefontaine Neighbors
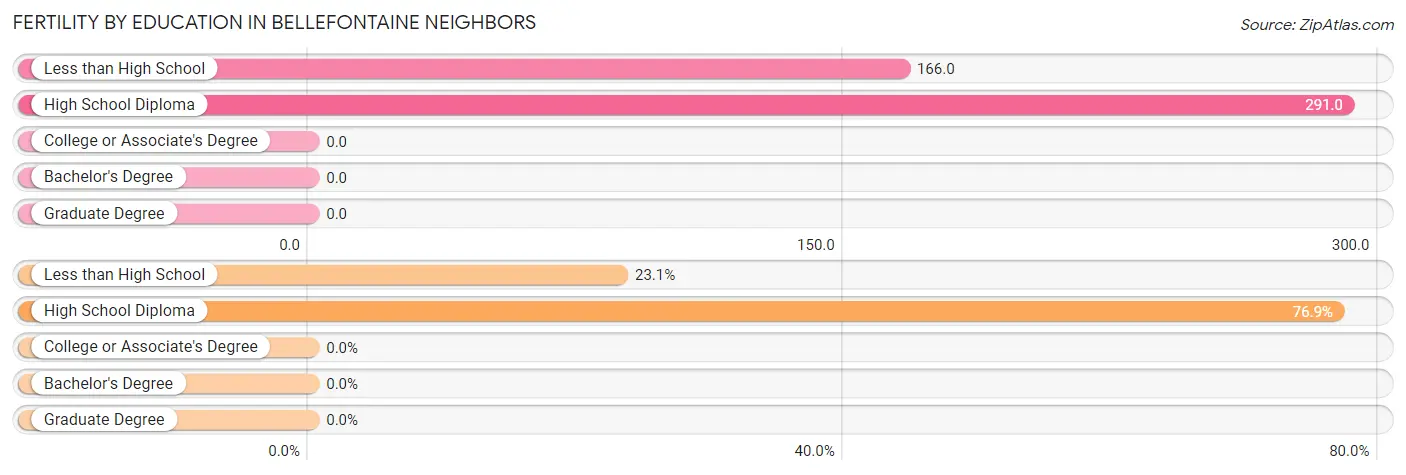
| Educational Attainment | Women with Births | Births / 1,000 Women |
| Less than High School | 56 (23.1%) | 166.0 |
| High School Diploma | 186 (76.9%) | 291.0 |
| College or Associate's Degree | 0 (0.0%) | 0.0 |
| Bachelor's Degree | 0 (0.0%) | 0.0 |
| Graduate Degree | 0 (0.0%) | 0.0 |
| Total | 242 (100.0%) | 104.0 |
Fertility by Education by Marriage Status in Bellefontaine Neighbors
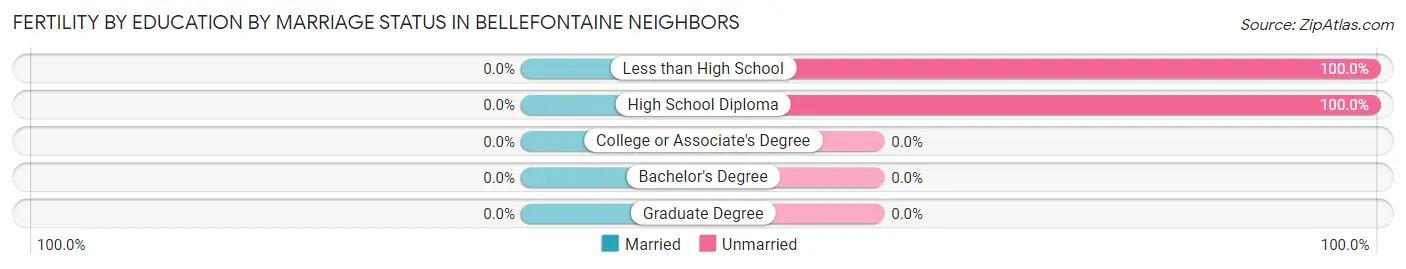
| Educational Attainment | Married | Unmarried |
| Less than High School | 0 (0.0%) | 56 (100.0%) |
| High School Diploma | 0 (0.0%) | 186 (100.0%) |
| College or Associate's Degree | 0 (0.0%) | 0 (0.0%) |
| Bachelor's Degree | 0 (0.0%) | 0 (0.0%) |
| Graduate Degree | 0 (0.0%) | 0 (0.0%) |
| Total | 0 (0.0%) | 242 (100.0%) |
Income in Bellefontaine Neighbors
Income Overview in Bellefontaine Neighbors
Per Capita Income in Bellefontaine Neighbors is $27,865, while median incomes of families and households are $53,644 and $46,115 respectively.
| Characteristic | Number | Measure |
| Per Capita Income | 10,637 | $27,865 |
| Median Family Income | 2,582 | $53,644 |
| Mean Family Income | 2,582 | $76,016 |
| Median Household Income | 4,584 | $46,115 |
| Mean Household Income | 4,584 | $61,358 |
| Income Deficit | 2,582 | $0 |
| Wage / Income Gap (%) | 10,637 | 11.59% |
| Wage / Income Gap ($) | 10,637 | 88.41¢ per $1 |
| Gini / Inequality Index | 10,637 | 0.48 |
Earnings by Sex in Bellefontaine Neighbors
Average Earnings in Bellefontaine Neighbors are $34,132, $32,306 for men and $36,541 for women, a difference of 11.6%.
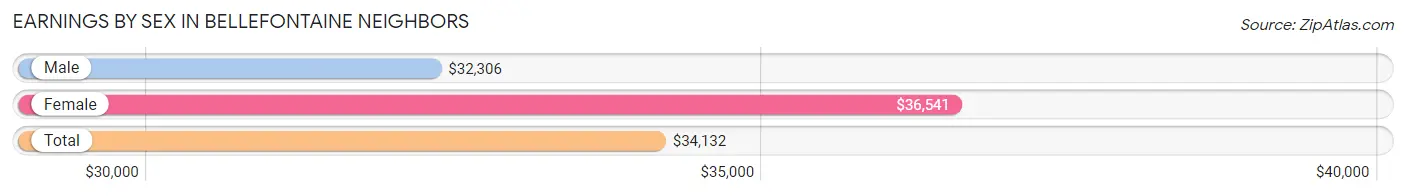
| Sex | Number | Average Earnings |
| Male | 1,489 (34.9%) | $32,306 |
| Female | 2,781 (65.1%) | $36,541 |
| Total | 4,270 (100.0%) | $34,132 |
Earnings by Sex by Income Bracket in Bellefontaine Neighbors
The most common earnings brackets in Bellefontaine Neighbors are $30,000 to $34,999 for men (191 | 12.8%) and $45,000 to $49,999 for women (346 | 12.4%).
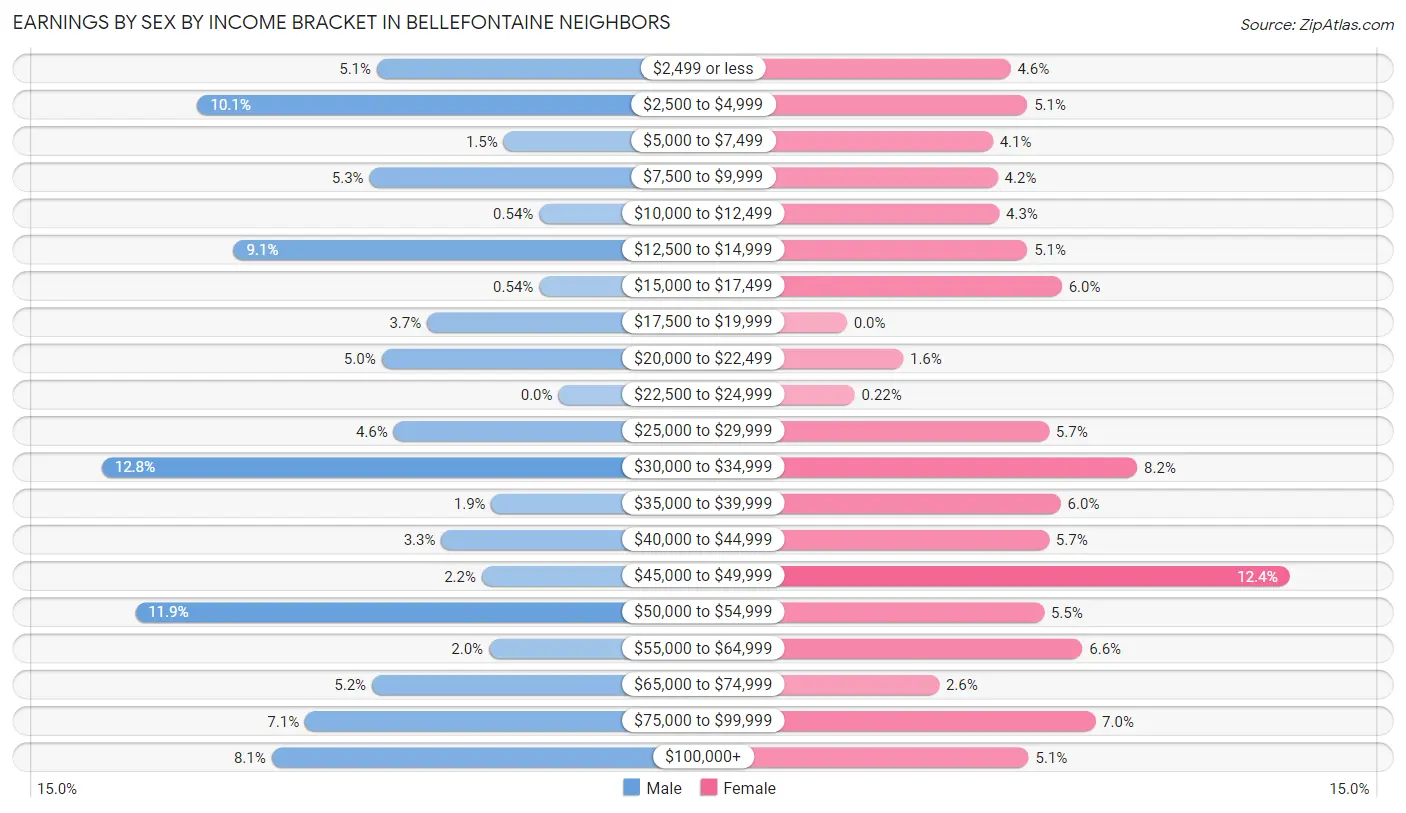
| Income | Male | Female |
| $2,499 or less | 76 (5.1%) | 128 (4.6%) |
| $2,500 to $4,999 | 151 (10.1%) | 141 (5.1%) |
| $5,000 to $7,499 | 23 (1.5%) | 114 (4.1%) |
| $7,500 to $9,999 | 79 (5.3%) | 118 (4.2%) |
| $10,000 to $12,499 | 8 (0.5%) | 119 (4.3%) |
| $12,500 to $14,999 | 136 (9.1%) | 141 (5.1%) |
| $15,000 to $17,499 | 8 (0.5%) | 168 (6.0%) |
| $17,500 to $19,999 | 55 (3.7%) | 0 (0.0%) |
| $20,000 to $22,499 | 74 (5.0%) | 44 (1.6%) |
| $22,500 to $24,999 | 0 (0.0%) | 6 (0.2%) |
| $25,000 to $29,999 | 69 (4.6%) | 158 (5.7%) |
| $30,000 to $34,999 | 191 (12.8%) | 227 (8.2%) |
| $35,000 to $39,999 | 28 (1.9%) | 167 (6.0%) |
| $40,000 to $44,999 | 49 (3.3%) | 158 (5.7%) |
| $45,000 to $49,999 | 32 (2.1%) | 346 (12.4%) |
| $50,000 to $54,999 | 177 (11.9%) | 154 (5.5%) |
| $55,000 to $64,999 | 29 (1.9%) | 184 (6.6%) |
| $65,000 to $74,999 | 78 (5.2%) | 72 (2.6%) |
| $75,000 to $99,999 | 106 (7.1%) | 194 (7.0%) |
| $100,000+ | 120 (8.1%) | 142 (5.1%) |
| Total | 1,489 (100.0%) | 2,781 (100.0%) |
Earnings by Sex by Educational Attainment in Bellefontaine Neighbors
Average earnings in Bellefontaine Neighbors are $34,979 for men and $41,122 for women, a difference of 14.9%. Men with an educational attainment of high school diploma enjoy the highest average annual earnings of $65,103, while those with college or associate's degree education earn the least with $34,855. Women with an educational attainment of bachelor's degree earn the most with the average annual earnings of $64,208, while those with college or associate's degree education have the smallest earnings of $38,063.
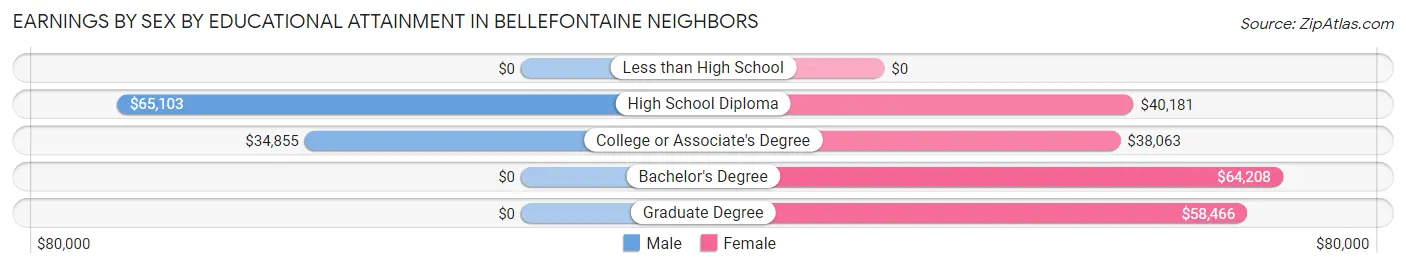
| Educational Attainment | Male Income | Female Income |
| Less than High School | - | - |
| High School Diploma | $65,103 | $40,181 |
| College or Associate's Degree | $34,855 | $38,063 |
| Bachelor's Degree | - | - |
| Graduate Degree | - | - |
| Total | $34,979 | $41,122 |
Family Income in Bellefontaine Neighbors
Family Income Brackets in Bellefontaine Neighbors
According to the Bellefontaine Neighbors family income data, there are 609 families falling into the $50,000 to $74,999 income range, which is the most common income bracket and makes up 23.6% of all families. Conversely, the $10,000 to $14,999 income bracket is the least frequent group with only 62 families (2.4%) belonging to this category.
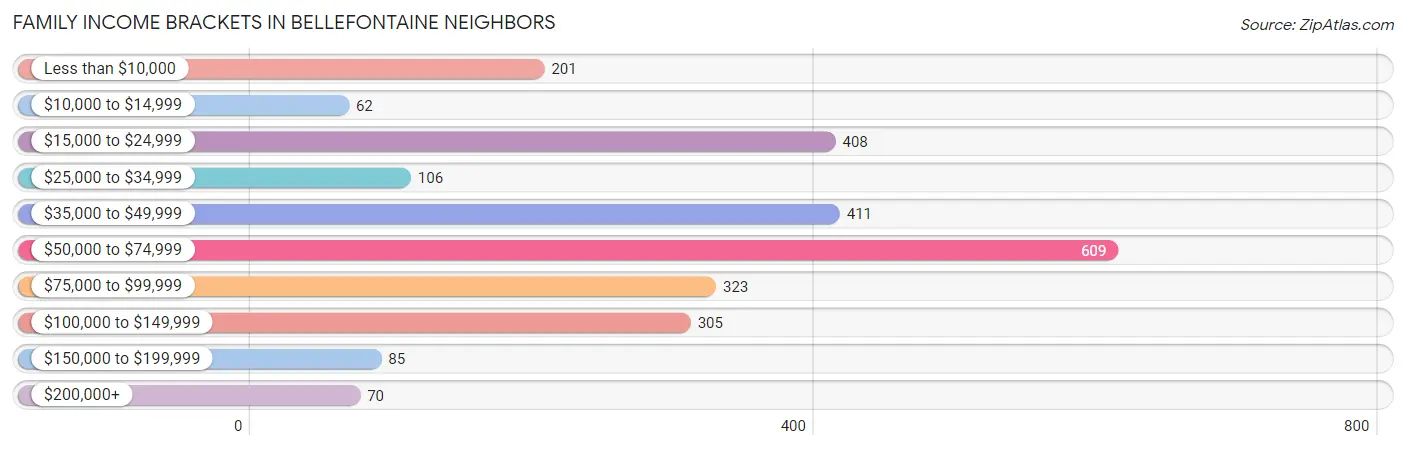
| Income Bracket | # Families | % Families |
| Less than $10,000 | 201 | 7.8% |
| $10,000 to $14,999 | 62 | 2.4% |
| $15,000 to $24,999 | 408 | 15.8% |
| $25,000 to $34,999 | 106 | 4.1% |
| $35,000 to $49,999 | 411 | 15.9% |
| $50,000 to $74,999 | 609 | 23.6% |
| $75,000 to $99,999 | 323 | 12.5% |
| $100,000 to $149,999 | 305 | 11.8% |
| $150,000 to $199,999 | 85 | 3.3% |
| $200,000+ | 70 | 2.7% |
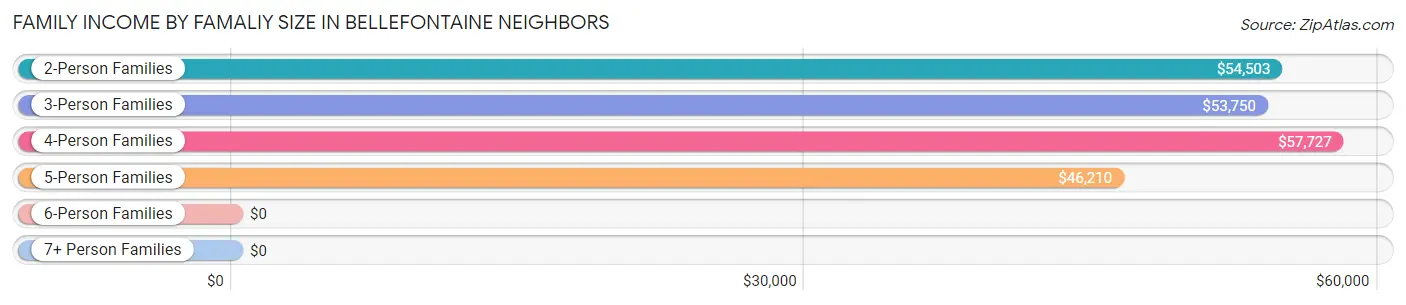
Family Income by Famaliy Size in Bellefontaine Neighbors
4-person families (206 | 8.0%) account for the highest median family income in Bellefontaine Neighbors with $57,727 per family, while 2-person families (1,519 | 58.8%) have the highest median income of $27,252 per family member.
| Income Bracket | # Families | Median Income |
| 2-Person Families | 1,519 (58.8%) | $54,503 |
| 3-Person Families | 510 (19.8%) | $53,750 |
| 4-Person Families | 206 (8.0%) | $57,727 |
| 5-Person Families | 214 (8.3%) | $46,210 |
| 6-Person Families | 75 (2.9%) | $0 |
| 7+ Person Families | 58 (2.2%) | $0 |
| Total | 2,582 (100.0%) | $53,644 |
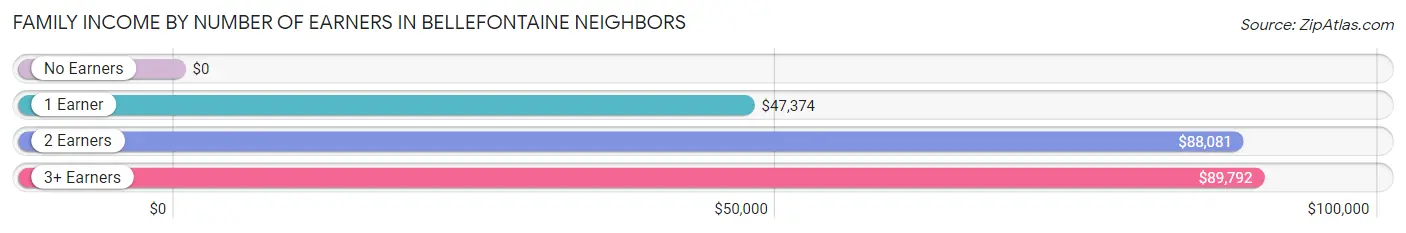
Family Income by Number of Earners in Bellefontaine Neighbors
| Number of Earners | # Families | Median Income |
| No Earners | 704 (27.3%) | $0 |
| 1 Earner | 1,013 (39.2%) | $47,374 |
| 2 Earners | 671 (26.0%) | $88,081 |
| 3+ Earners | 194 (7.5%) | $89,792 |
| Total | 2,582 (100.0%) | $53,644 |
Household Income in Bellefontaine Neighbors
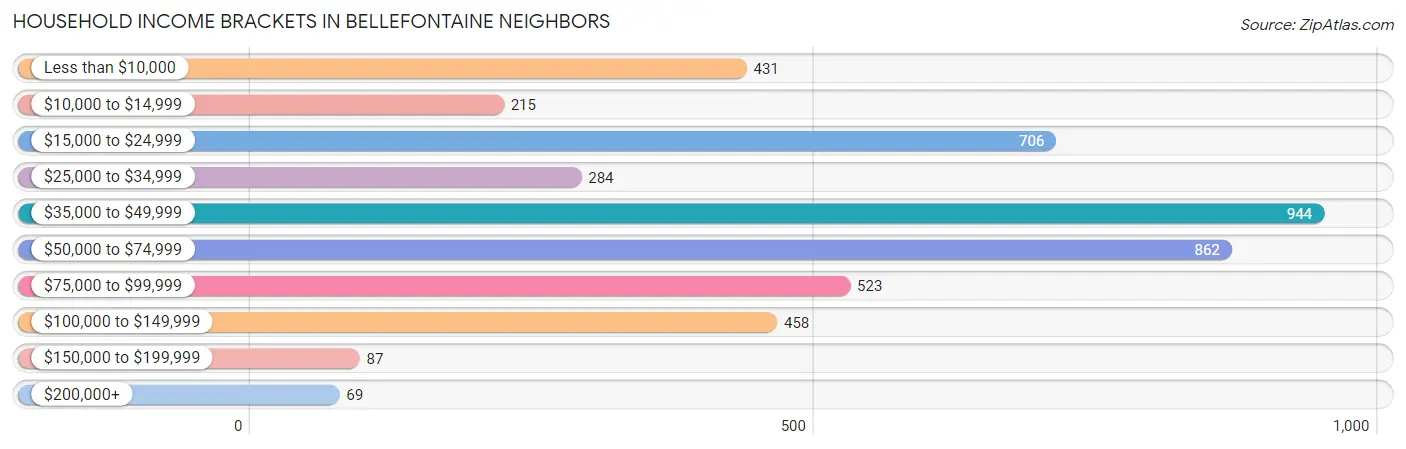
Household Income Brackets in Bellefontaine Neighbors
With 944 households falling in the category, the $35,000 to $49,999 income range is the most frequent in Bellefontaine Neighbors, accounting for 20.6% of all households. In contrast, only 69 households (1.5%) fall into the $200,000+ income bracket, making it the least populous group.
| Income Bracket | # Households | % Households |
| Less than $10,000 | 431 | 9.4% |
| $10,000 to $14,999 | 215 | 4.7% |
| $15,000 to $24,999 | 706 | 15.4% |
| $25,000 to $34,999 | 284 | 6.2% |
| $35,000 to $49,999 | 944 | 20.6% |
| $50,000 to $74,999 | 862 | 18.8% |
| $75,000 to $99,999 | 523 | 11.4% |
| $100,000 to $149,999 | 458 | 10.0% |
| $150,000 to $199,999 | 87 | 1.9% |
| $200,000+ | 69 | 1.5% |
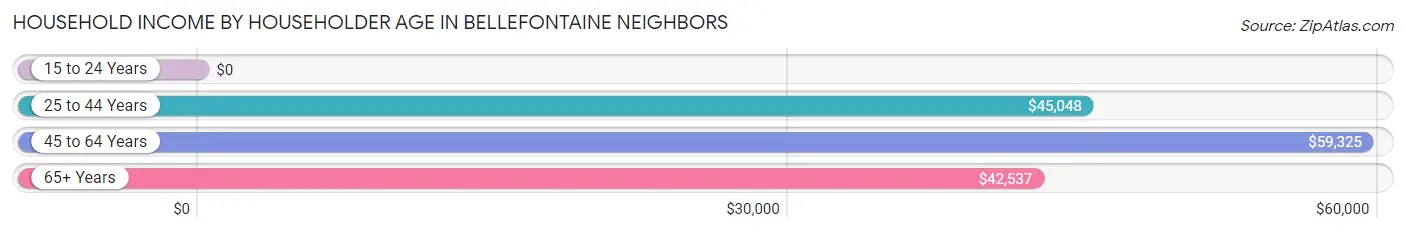
Household Income by Householder Age in Bellefontaine Neighbors
The median household income in Bellefontaine Neighbors is $46,115, with the highest median household income of $59,325 found in the 45 to 64 years age bracket for the primary householder. A total of 1,712 households (37.3%) fall into this category.
| Income Bracket | # Households | Median Income |
| 15 to 24 Years | 0 (0.0%) | $0 |
| 25 to 44 Years | 1,088 (23.7%) | $45,048 |
| 45 to 64 Years | 1,712 (37.3%) | $59,325 |
| 65+ Years | 1,784 (38.9%) | $42,537 |
| Total | 4,584 (100.0%) | $46,115 |
Poverty in Bellefontaine Neighbors
Income Below Poverty by Sex and Age in Bellefontaine Neighbors
With 13.3% poverty level for males and 29.3% for females among the residents of Bellefontaine Neighbors, 6 to 11 year old males and 6 to 11 year old females are the most vulnerable to poverty, with 159 males (53.9%) and 460 females (69.7%) in their respective age groups living below the poverty level.
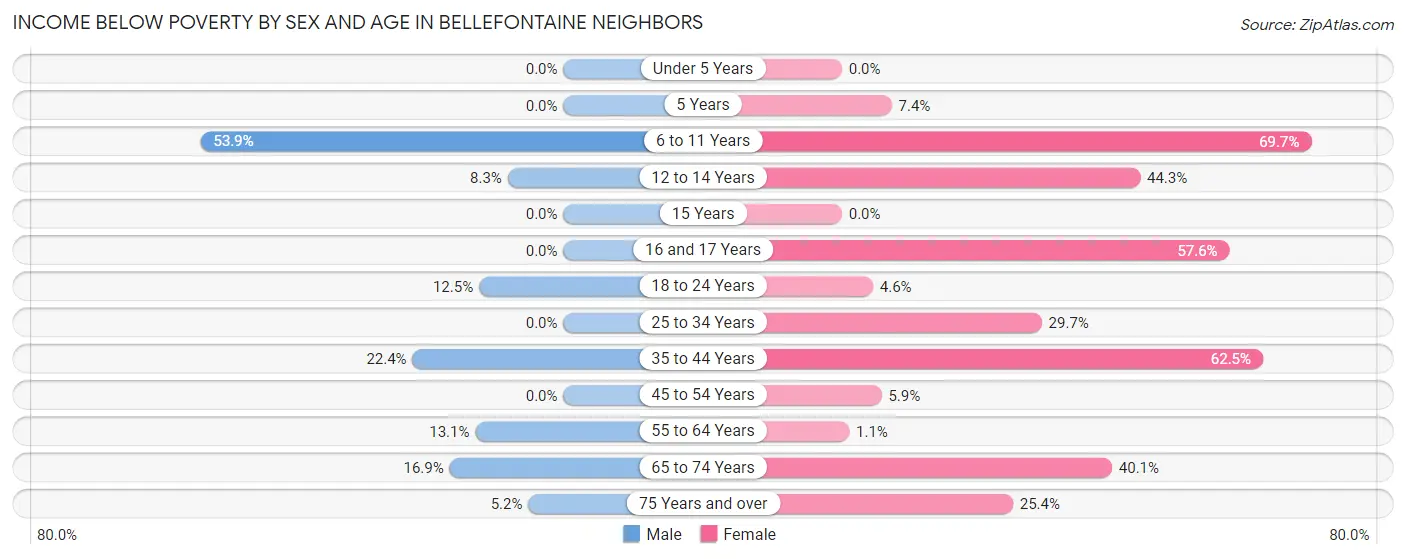
| Age Bracket | Male | Female |
| Under 5 Years | 0 (0.0%) | 0 (0.0%) |
| 5 Years | 0 (0.0%) | 15 (7.4%) |
| 6 to 11 Years | 159 (53.9%) | 460 (69.7%) |
| 12 to 14 Years | 39 (8.3%) | 62 (44.3%) |
| 15 Years | 0 (0.0%) | 0 (0.0%) |
| 16 and 17 Years | 0 (0.0%) | 99 (57.6%) |
| 18 to 24 Years | 52 (12.5%) | 14 (4.6%) |
| 25 to 34 Years | 0 (0.0%) | 149 (29.7%) |
| 35 to 44 Years | 108 (22.4%) | 407 (62.5%) |
| 45 to 54 Years | 0 (0.0%) | 55 (5.9%) |
| 55 to 64 Years | 107 (13.1%) | 9 (1.1%) |
| 65 to 74 Years | 73 (16.9%) | 391 (40.1%) |
| 75 Years and over | 10 (5.2%) | 146 (25.4%) |
| Total | 548 (13.3%) | 1,807 (29.3%) |
Income Above Poverty by Sex and Age in Bellefontaine Neighbors
According to the poverty statistics in Bellefontaine Neighbors, males aged under 5 years and females aged under 5 years are the age groups that are most secure financially, with 100.0% of males and 100.0% of females in these age groups living above the poverty line.
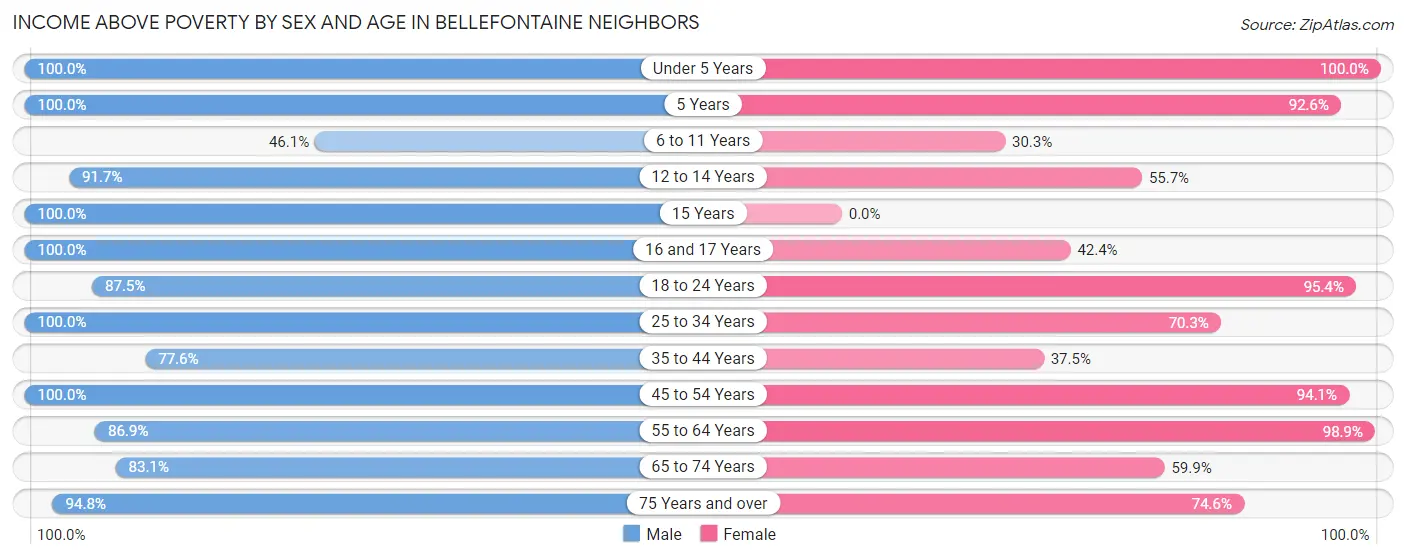
| Age Bracket | Male | Female |
| Under 5 Years | 157 (100.0%) | 228 (100.0%) |
| 5 Years | 14 (100.0%) | 188 (92.6%) |
| 6 to 11 Years | 136 (46.1%) | 200 (30.3%) |
| 12 to 14 Years | 433 (91.7%) | 78 (55.7%) |
| 15 Years | 67 (100.0%) | 0 (0.0%) |
| 16 and 17 Years | 206 (100.0%) | 73 (42.4%) |
| 18 to 24 Years | 363 (87.5%) | 290 (95.4%) |
| 25 to 34 Years | 249 (100.0%) | 353 (70.3%) |
| 35 to 44 Years | 374 (77.6%) | 244 (37.5%) |
| 45 to 54 Years | 334 (100.0%) | 879 (94.1%) |
| 55 to 64 Years | 711 (86.9%) | 822 (98.9%) |
| 65 to 74 Years | 359 (83.1%) | 584 (59.9%) |
| 75 Years and over | 182 (94.8%) | 429 (74.6%) |
| Total | 3,585 (86.7%) | 4,368 (70.7%) |
Income Below Poverty Among Married-Couple Families in Bellefontaine Neighbors
The poverty statistics for married-couple families in Bellefontaine Neighbors show that 1.8% or 17 of the total 965 families live below the poverty line. Families with 3 or 4 children have the highest poverty rate of 39.5%, comprising of 17 families. On the other hand, families with no children have the lowest poverty rate of 0.0%, which includes 0 families.
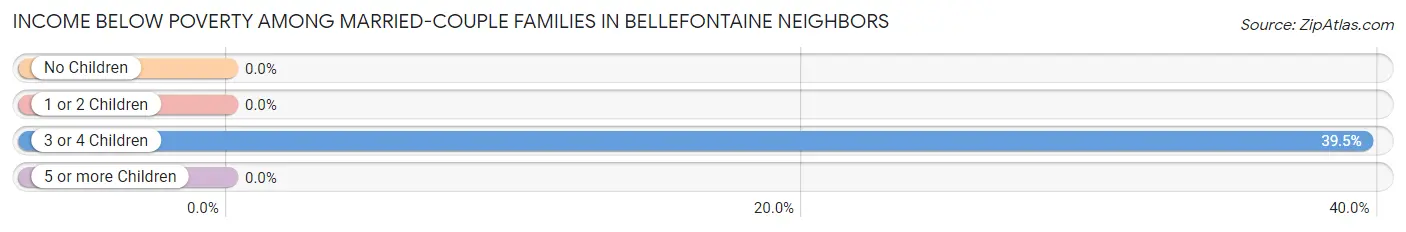
| Children | Above Poverty | Below Poverty |
| No Children | 715 (100.0%) | 0 (0.0%) |
| 1 or 2 Children | 149 (100.0%) | 0 (0.0%) |
| 3 or 4 Children | 26 (60.5%) | 17 (39.5%) |
| 5 or more Children | 58 (100.0%) | 0 (0.0%) |
| Total | 948 (98.2%) | 17 (1.8%) |
Income Below Poverty Among Single-Parent Households in Bellefontaine Neighbors
According to the poverty data in Bellefontaine Neighbors, 10.7% or 9 single-father households and 42.1% or 645 single-mother households are living below the poverty line. Among single-father households, those with no children have the highest poverty rate, with 9 households (10.7%) experiencing poverty. Likewise, among single-mother households, those with 1 or 2 children have the highest poverty rate, with 514 households (71.3%) falling below the poverty line.
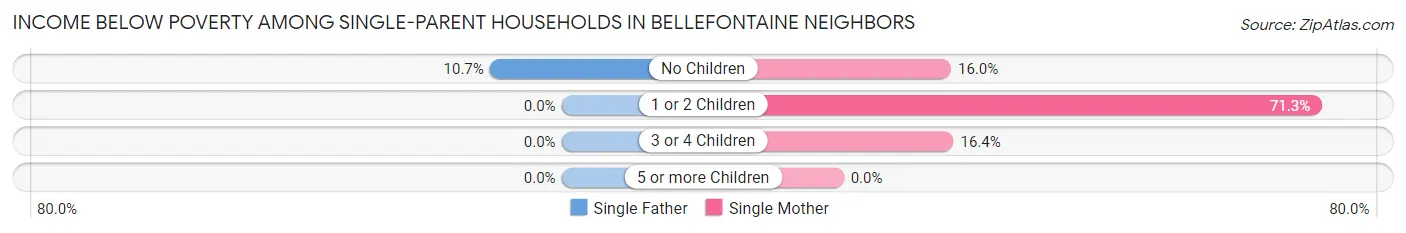
| Children | Single Father | Single Mother |
| No Children | 9 (10.7%) | 85 (16.0%) |
| 1 or 2 Children | 0 (0.0%) | 514 (71.3%) |
| 3 or 4 Children | 0 (0.0%) | 46 (16.4%) |
| 5 or more Children | 0 (0.0%) | 0 (0.0%) |
| Total | 9 (10.7%) | 645 (42.1%) |
Income Below Poverty Among Married-Couple vs Single-Parent Households in Bellefontaine Neighbors
The poverty data for Bellefontaine Neighbors shows that 17 of the married-couple family households (1.8%) and 654 of the single-parent households (40.5%) are living below the poverty level. Within the married-couple family households, those with 3 or 4 children have the highest poverty rate, with 17 households (39.5%) falling below the poverty line. Among the single-parent households, those with 1 or 2 children have the highest poverty rate, with 514 household (71.3%) living below poverty.
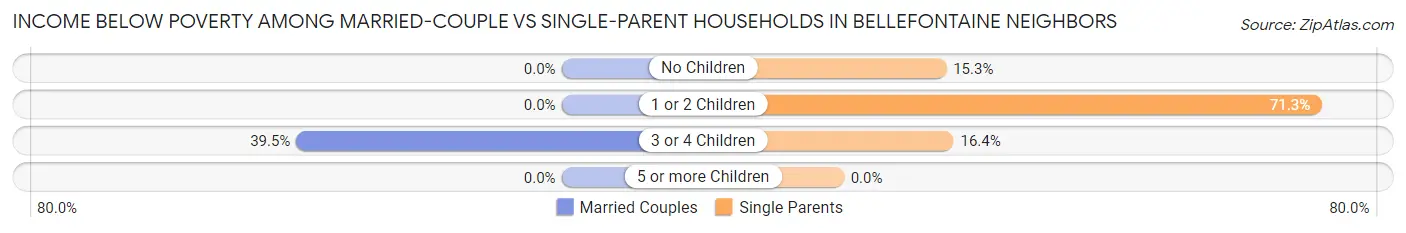
| Children | Married-Couple Families | Single-Parent Households |
| No Children | 0 (0.0%) | 94 (15.3%) |
| 1 or 2 Children | 0 (0.0%) | 514 (71.3%) |
| 3 or 4 Children | 17 (39.5%) | 46 (16.4%) |
| 5 or more Children | 0 (0.0%) | 0 (0.0%) |
| Total | 17 (1.8%) | 654 (40.5%) |
Employment Characteristics in Bellefontaine Neighbors
Employment by Class of Employer in Bellefontaine Neighbors
Among the 3,745 employed individuals in Bellefontaine Neighbors, private company employees (2,294 | 61.3%), not-for-profit organizations (616 | 16.5%), and local government employees (401 | 10.7%) make up the most common classes of employment.
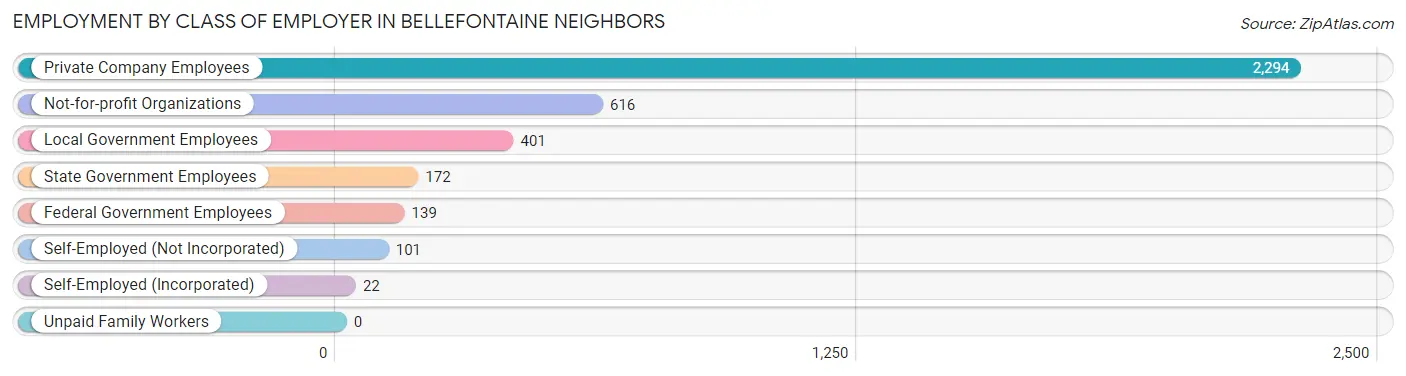
| Employer Class | # Employees | % Employees |
| Private Company Employees | 2,294 | 61.3% |
| Self-Employed (Incorporated) | 22 | 0.6% |
| Self-Employed (Not Incorporated) | 101 | 2.7% |
| Not-for-profit Organizations | 616 | 16.5% |
| Local Government Employees | 401 | 10.7% |
| State Government Employees | 172 | 4.6% |
| Federal Government Employees | 139 | 3.7% |
| Unpaid Family Workers | 0 | 0.0% |
| Total | 3,745 | 100.0% |
Employment Status by Age in Bellefontaine Neighbors
According to the labor force statistics for Bellefontaine Neighbors, out of the total population over 16 years of age (8,364), 48.9% or 4,090 individuals are in the labor force, with 6.2% or 254 of them unemployed. The age group with the highest labor force participation rate is 25 to 29 years, with 94.4% or 252 individuals in the labor force. Within the labor force, the 25 to 29 years age range has the highest percentage of unemployed individuals, with 40.5% or 102 of them being unemployed.
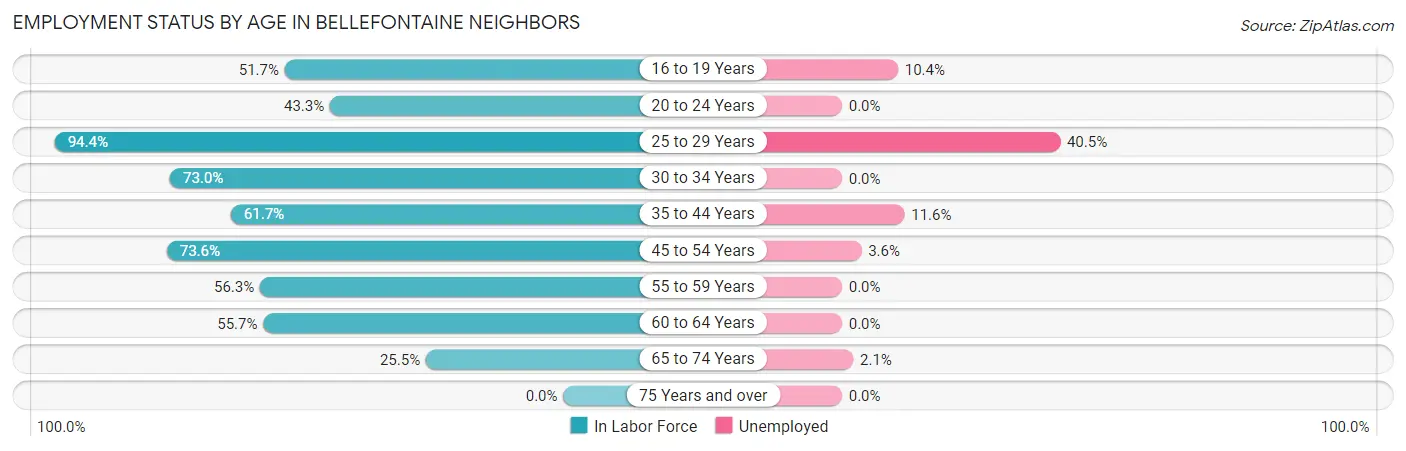
| Age Bracket | In Labor Force | Unemployed |
| 16 to 19 Years | 259 (51.7%) | 27 (10.4%) |
| 20 to 24 Years | 263 (43.3%) | 0 (0.0%) |
| 25 to 29 Years | 252 (94.4%) | 102 (40.5%) |
| 30 to 34 Years | 357 (73.0%) | 0 (0.0%) |
| 35 to 44 Years | 699 (61.7%) | 81 (11.6%) |
| 45 to 54 Years | 944 (73.6%) | 34 (3.6%) |
| 55 to 59 Years | 355 (56.3%) | 0 (0.0%) |
| 60 to 64 Years | 576 (55.7%) | 0 (0.0%) |
| 65 to 74 Years | 385 (25.5%) | 8 (2.1%) |
| 75 Years and over | 0 (0.0%) | 0 (0.0%) |
| Total | 4,090 (48.9%) | 254 (6.2%) |
Employment Status by Educational Attainment in Bellefontaine Neighbors
According to labor force statistics for Bellefontaine Neighbors, 65.8% of individuals (3,182) out of the total population between 25 and 64 years of age (4,836) are in the labor force, with 6.8% or 216 of them being unemployed. The group with the highest labor force participation rate are those with the educational attainment of bachelor's degree or higher, with 88.9% or 853 individuals in the labor force. Within the labor force, individuals with less than high school education have the highest percentage of unemployment, with 36.4% or 107 of them being unemployed.
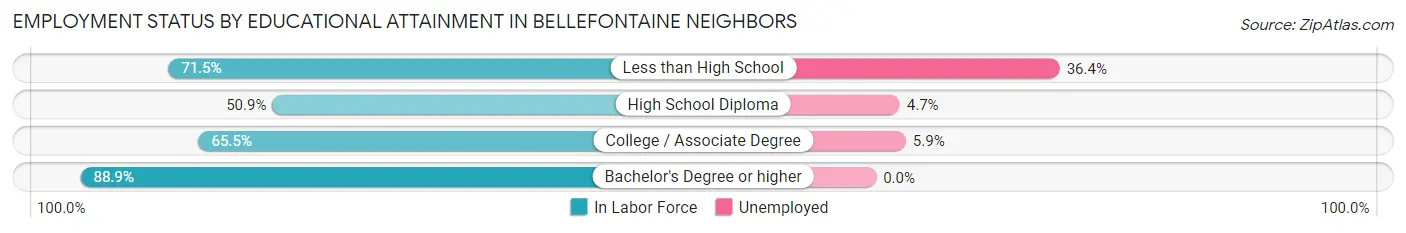
| Educational Attainment | In Labor Force | Unemployed |
| Less than High School | 294 (71.5%) | 150 (36.4%) |
| High School Diploma | 815 (50.9%) | 75 (4.7%) |
| College / Associate Degree | 1,221 (65.5%) | 110 (5.9%) |
| Bachelor's Degree or higher | 853 (88.9%) | 0 (0.0%) |
| Total | 3,182 (65.8%) | 329 (6.8%) |
Employment Occupations by Sex in Bellefontaine Neighbors
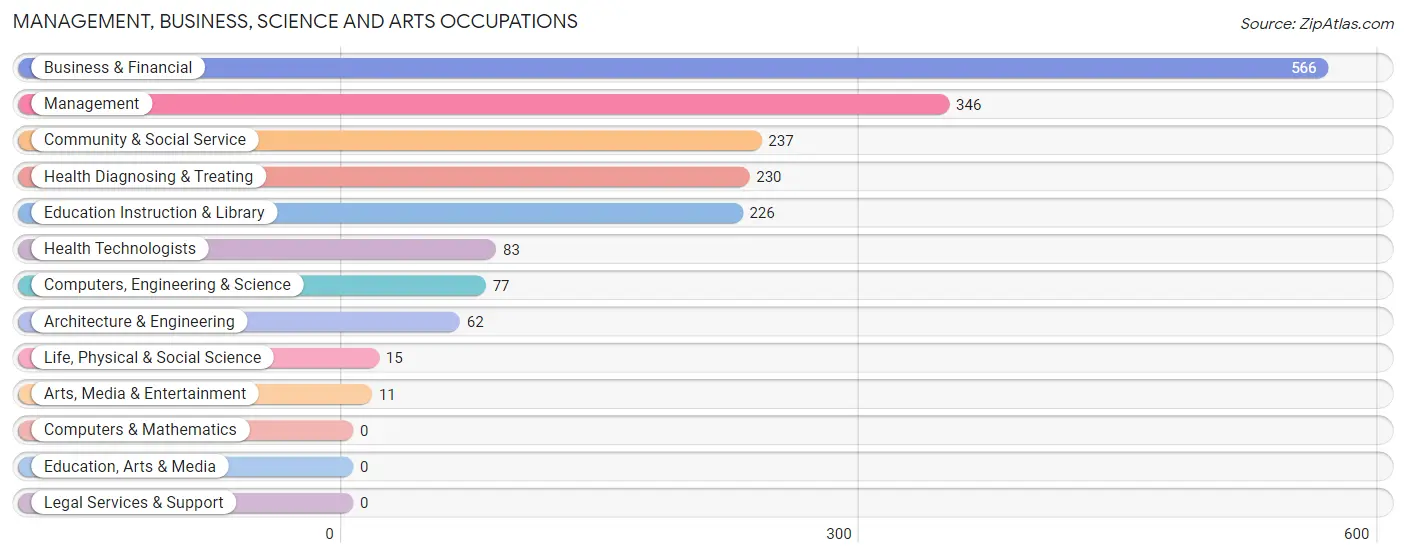
Management, Business, Science and Arts Occupations
The most common Management, Business, Science and Arts occupations in Bellefontaine Neighbors are Business & Financial (566 | 14.7%), Management (346 | 9.0%), Community & Social Service (237 | 6.2%), Health Diagnosing & Treating (230 | 6.0%), and Education Instruction & Library (226 | 5.9%).
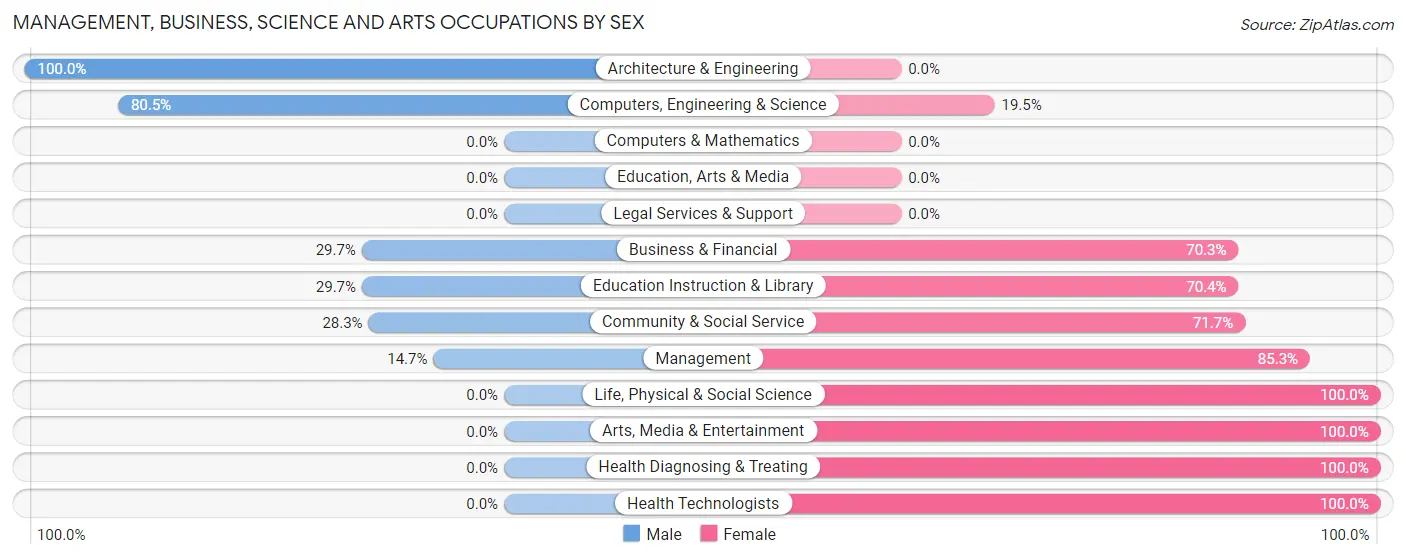
Management, Business, Science and Arts Occupations by Sex
Within the Management, Business, Science and Arts occupations in Bellefontaine Neighbors, the most male-oriented occupations are Architecture & Engineering (100.0%), Computers, Engineering & Science (80.5%), and Business & Financial (29.7%), while the most female-oriented occupations are Life, Physical & Social Science (100.0%), Arts, Media & Entertainment (100.0%), and Health Diagnosing & Treating (100.0%).
| Occupation | Male | Female |
| Management | 51 (14.7%) | 295 (85.3%) |
| Business & Financial | 168 (29.7%) | 398 (70.3%) |
| Computers, Engineering & Science | 62 (80.5%) | 15 (19.5%) |
| Computers & Mathematics | 0 (0.0%) | 0 (0.0%) |
| Architecture & Engineering | 62 (100.0%) | 0 (0.0%) |
| Life, Physical & Social Science | 0 (0.0%) | 15 (100.0%) |
| Community & Social Service | 67 (28.3%) | 170 (71.7%) |
| Education, Arts & Media | 0 (0.0%) | 0 (0.0%) |
| Legal Services & Support | 0 (0.0%) | 0 (0.0%) |
| Education Instruction & Library | 67 (29.6%) | 159 (70.4%) |
| Arts, Media & Entertainment | 0 (0.0%) | 11 (100.0%) |
| Health Diagnosing & Treating | 0 (0.0%) | 230 (100.0%) |
| Health Technologists | 0 (0.0%) | 83 (100.0%) |
| Total (Category) | 348 (23.9%) | 1,108 (76.1%) |
| Total (Overall) | 1,236 (32.2%) | 2,602 (67.8%) |
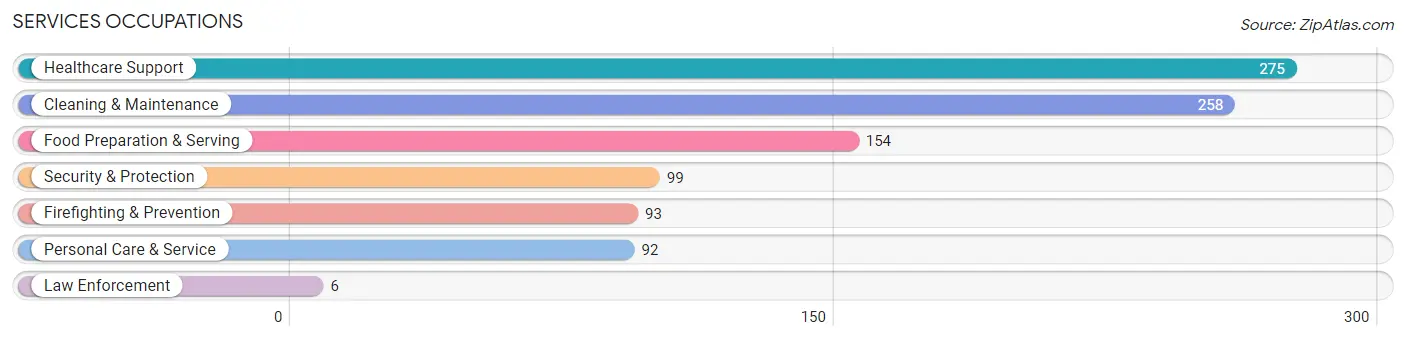
Services Occupations
The most common Services occupations in Bellefontaine Neighbors are Healthcare Support (275 | 7.2%), Cleaning & Maintenance (258 | 6.7%), Food Preparation & Serving (154 | 4.0%), Security & Protection (99 | 2.6%), and Firefighting & Prevention (93 | 2.4%).
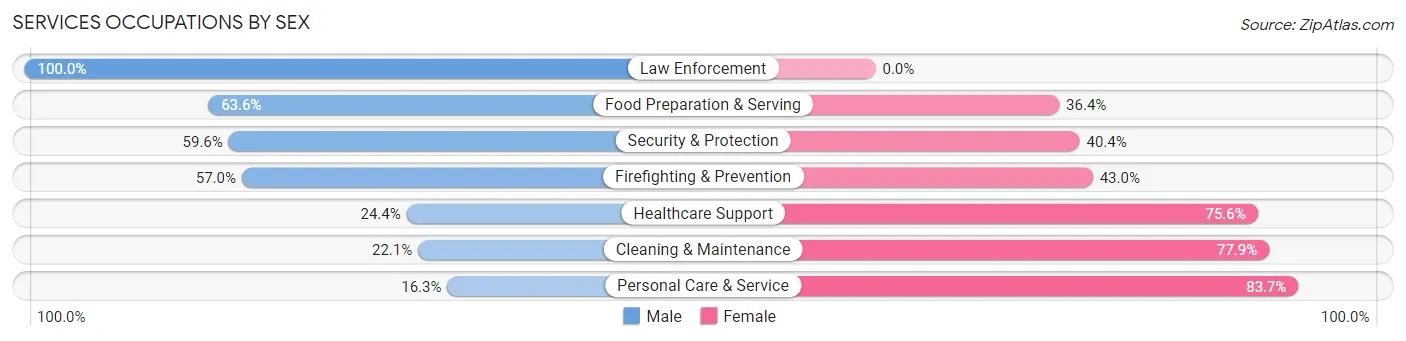
Services Occupations by Sex
Within the Services occupations in Bellefontaine Neighbors, the most male-oriented occupations are Law Enforcement (100.0%), Food Preparation & Serving (63.6%), and Security & Protection (59.6%), while the most female-oriented occupations are Personal Care & Service (83.7%), Cleaning & Maintenance (77.9%), and Healthcare Support (75.6%).
| Occupation | Male | Female |
| Healthcare Support | 67 (24.4%) | 208 (75.6%) |
| Security & Protection | 59 (59.6%) | 40 (40.4%) |
| Firefighting & Prevention | 53 (57.0%) | 40 (43.0%) |
| Law Enforcement | 6 (100.0%) | 0 (0.0%) |
| Food Preparation & Serving | 98 (63.6%) | 56 (36.4%) |
| Cleaning & Maintenance | 57 (22.1%) | 201 (77.9%) |
| Personal Care & Service | 15 (16.3%) | 77 (83.7%) |
| Total (Category) | 296 (33.7%) | 582 (66.3%) |
| Total (Overall) | 1,236 (32.2%) | 2,602 (67.8%) |
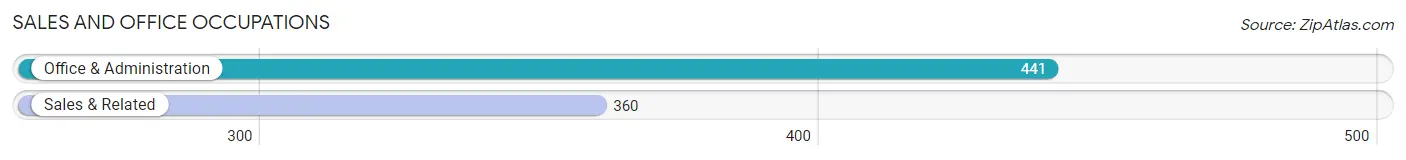
Sales and Office Occupations
The most common Sales and Office occupations in Bellefontaine Neighbors are Office & Administration (441 | 11.5%), and Sales & Related (360 | 9.4%).
Sales and Office Occupations by Sex
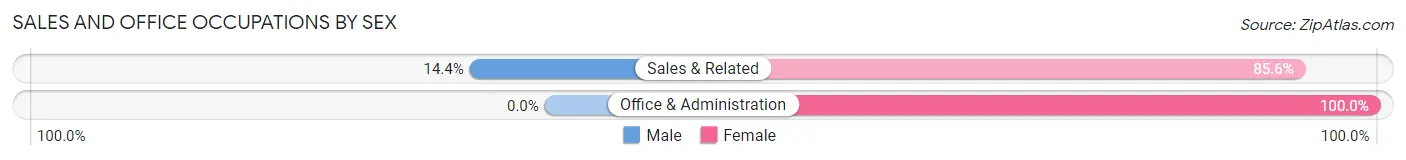
| Occupation | Male | Female |
| Sales & Related | 52 (14.4%) | 308 (85.6%) |
| Office & Administration | 0 (0.0%) | 441 (100.0%) |
| Total (Category) | 52 (6.5%) | 749 (93.5%) |
| Total (Overall) | 1,236 (32.2%) | 2,602 (67.8%) |
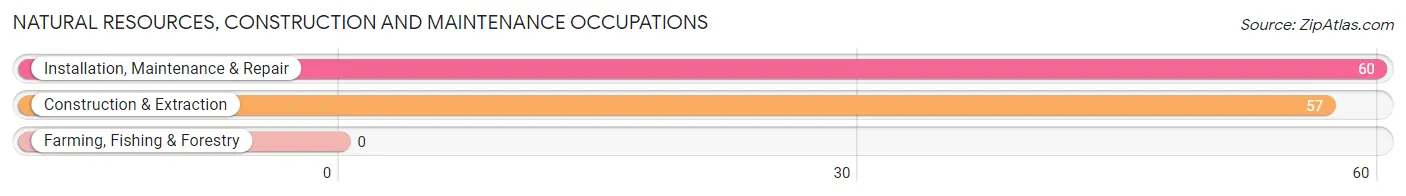
Natural Resources, Construction and Maintenance Occupations
The most common Natural Resources, Construction and Maintenance occupations in Bellefontaine Neighbors are Installation, Maintenance & Repair (60 | 1.6%), and Construction & Extraction (57 | 1.5%).
Natural Resources, Construction and Maintenance Occupations by Sex
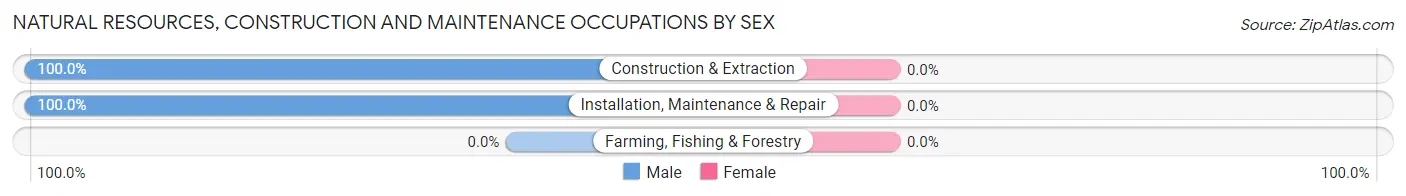
| Occupation | Male | Female |
| Farming, Fishing & Forestry | 0 (0.0%) | 0 (0.0%) |
| Construction & Extraction | 57 (100.0%) | 0 (0.0%) |
| Installation, Maintenance & Repair | 60 (100.0%) | 0 (0.0%) |
| Total (Category) | 117 (100.0%) | 0 (0.0%) |
| Total (Overall) | 1,236 (32.2%) | 2,602 (67.8%) |
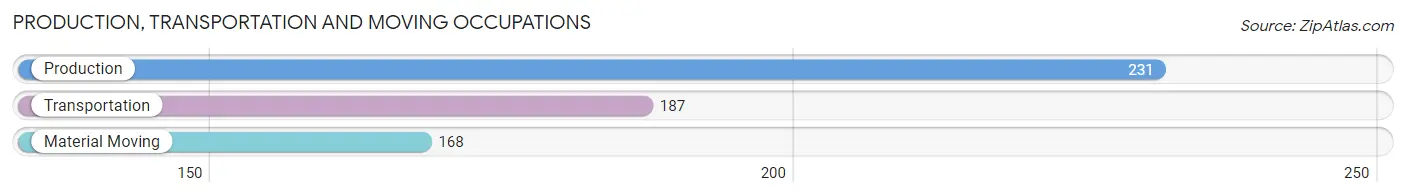
Production, Transportation and Moving Occupations
The most common Production, Transportation and Moving occupations in Bellefontaine Neighbors are Production (231 | 6.0%), Transportation (187 | 4.9%), and Material Moving (168 | 4.4%).
Production, Transportation and Moving Occupations by Sex
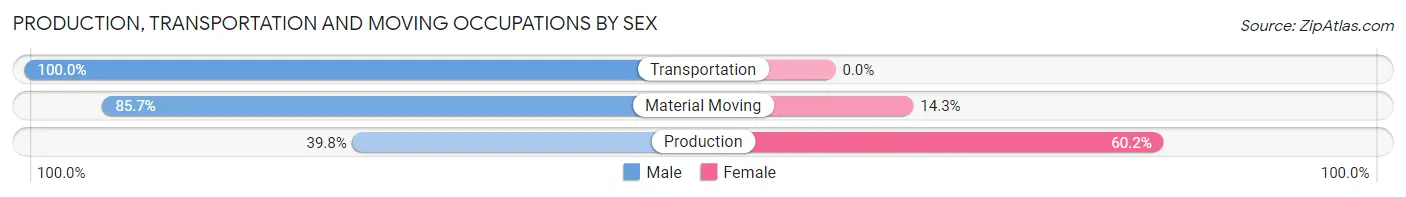
| Occupation | Male | Female |
| Production | 92 (39.8%) | 139 (60.2%) |
| Transportation | 187 (100.0%) | 0 (0.0%) |
| Material Moving | 144 (85.7%) | 24 (14.3%) |
| Total (Category) | 423 (72.2%) | 163 (27.8%) |
| Total (Overall) | 1,236 (32.2%) | 2,602 (67.8%) |
Employment Industries by Sex in Bellefontaine Neighbors
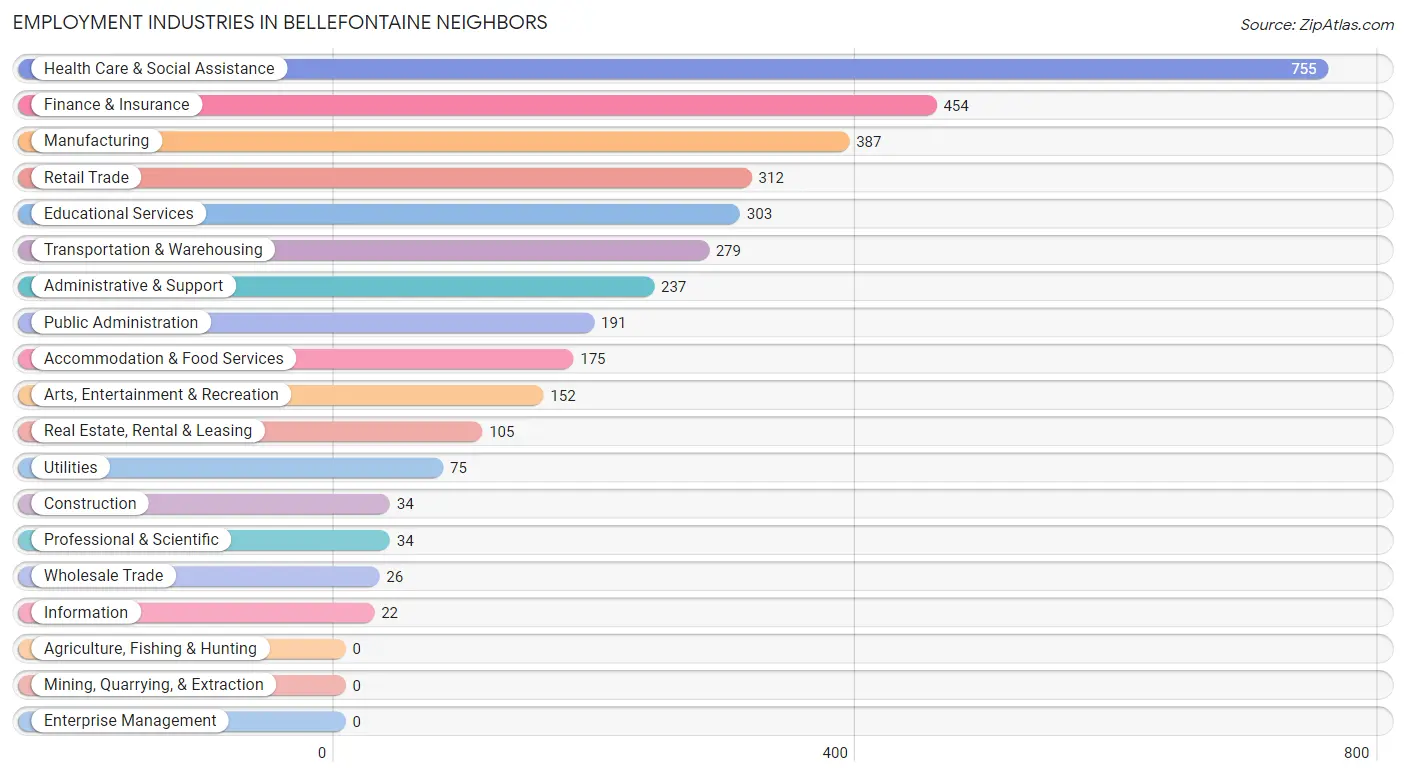
Employment Industries in Bellefontaine Neighbors
The major employment industries in Bellefontaine Neighbors include Health Care & Social Assistance (755 | 19.7%), Finance & Insurance (454 | 11.8%), Manufacturing (387 | 10.1%), Retail Trade (312 | 8.1%), and Educational Services (303 | 7.9%).
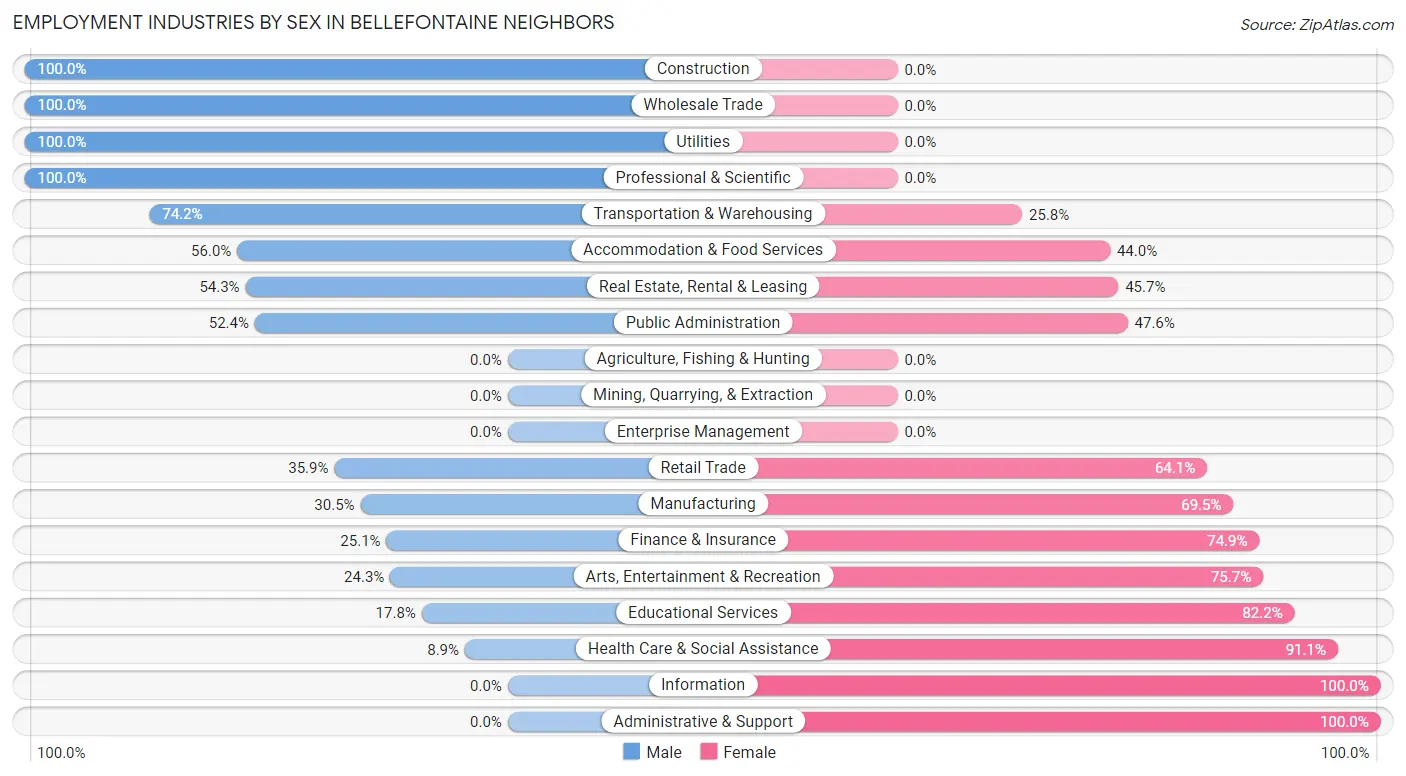
Employment Industries by Sex in Bellefontaine Neighbors
The Bellefontaine Neighbors industries that see more men than women are Construction (100.0%), Wholesale Trade (100.0%), and Utilities (100.0%), whereas the industries that tend to have a higher number of women are Information (100.0%), Administrative & Support (100.0%), and Health Care & Social Assistance (91.1%).
| Industry | Male | Female |
| Agriculture, Fishing & Hunting | 0 (0.0%) | 0 (0.0%) |
| Mining, Quarrying, & Extraction | 0 (0.0%) | 0 (0.0%) |
| Construction | 34 (100.0%) | 0 (0.0%) |
| Manufacturing | 118 (30.5%) | 269 (69.5%) |
| Wholesale Trade | 26 (100.0%) | 0 (0.0%) |
| Retail Trade | 112 (35.9%) | 200 (64.1%) |
| Transportation & Warehousing | 207 (74.2%) | 72 (25.8%) |
| Utilities | 75 (100.0%) | 0 (0.0%) |
| Information | 0 (0.0%) | 22 (100.0%) |
| Finance & Insurance | 114 (25.1%) | 340 (74.9%) |
| Real Estate, Rental & Leasing | 57 (54.3%) | 48 (45.7%) |
| Professional & Scientific | 34 (100.0%) | 0 (0.0%) |
| Enterprise Management | 0 (0.0%) | 0 (0.0%) |
| Administrative & Support | 0 (0.0%) | 237 (100.0%) |
| Educational Services | 54 (17.8%) | 249 (82.2%) |
| Health Care & Social Assistance | 67 (8.9%) | 688 (91.1%) |
| Arts, Entertainment & Recreation | 37 (24.3%) | 115 (75.7%) |
| Accommodation & Food Services | 98 (56.0%) | 77 (44.0%) |
| Public Administration | 100 (52.4%) | 91 (47.6%) |
| Total | 1,236 (32.2%) | 2,602 (67.8%) |
Education in Bellefontaine Neighbors
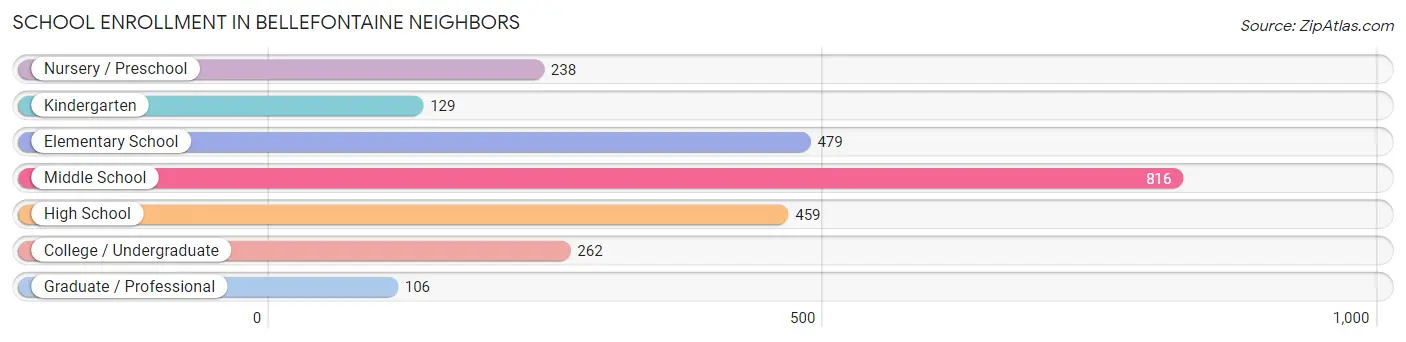
School Enrollment in Bellefontaine Neighbors
The most common levels of schooling among the 2,489 students in Bellefontaine Neighbors are middle school (816 | 32.8%), elementary school (479 | 19.2%), and high school (459 | 18.4%).
| School Level | # Students | % Students |
| Nursery / Preschool | 238 | 9.6% |
| Kindergarten | 129 | 5.2% |
| Elementary School | 479 | 19.2% |
| Middle School | 816 | 32.8% |
| High School | 459 | 18.4% |
| College / Undergraduate | 262 | 10.5% |
| Graduate / Professional | 106 | 4.3% |
| Total | 2,489 | 100.0% |
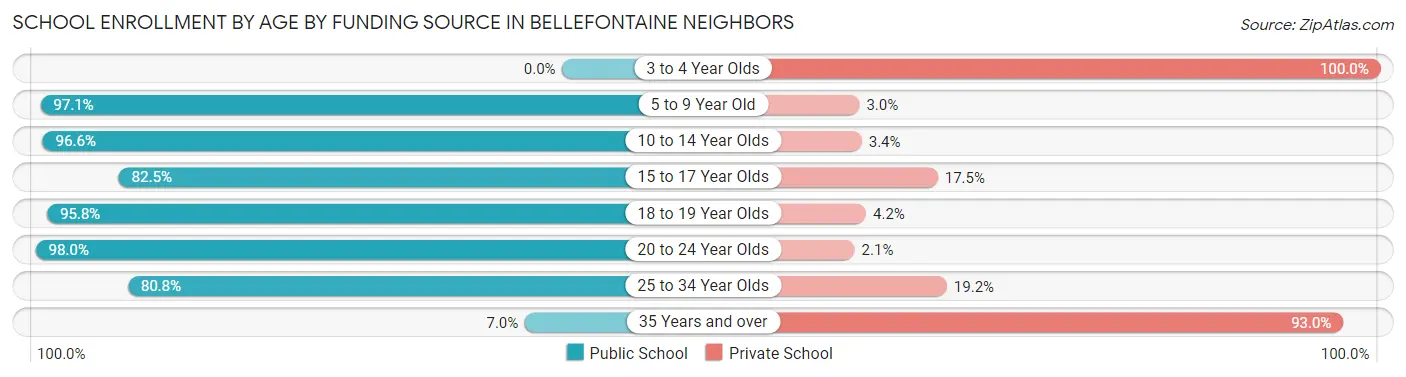
School Enrollment by Age by Funding Source in Bellefontaine Neighbors
Out of a total of 2,489 students who are enrolled in schools in Bellefontaine Neighbors, 321 (12.9%) attend a private institution, while the remaining 2,168 (87.1%) are enrolled in public schools. The age group of 3 to 4 year olds has the highest likelihood of being enrolled in private schools, with 64 (100.0% in the age bracket) enrolled. Conversely, the age group of 20 to 24 year olds has the lowest likelihood of being enrolled in a private school, with 143 (98.0% in the age bracket) attending a public institution.
| Age Bracket | Public School | Private School |
| 3 to 4 Year Olds | 0 (0.0%) | 64 (100.0%) |
| 5 to 9 Year Old | 659 (97.1%) | 20 (2.9%) |
| 10 to 14 Year Olds | 888 (96.6%) | 31 (3.4%) |
| 15 to 17 Year Olds | 320 (82.5%) | 68 (17.5%) |
| 18 to 19 Year Olds | 46 (95.8%) | 2 (4.2%) |
| 20 to 24 Year Olds | 143 (98.0%) | 3 (2.1%) |
| 25 to 34 Year Olds | 105 (80.8%) | 25 (19.2%) |
| 35 Years and over | 8 (7.0%) | 107 (93.0%) |
| Total | 2,168 (87.1%) | 321 (12.9%) |
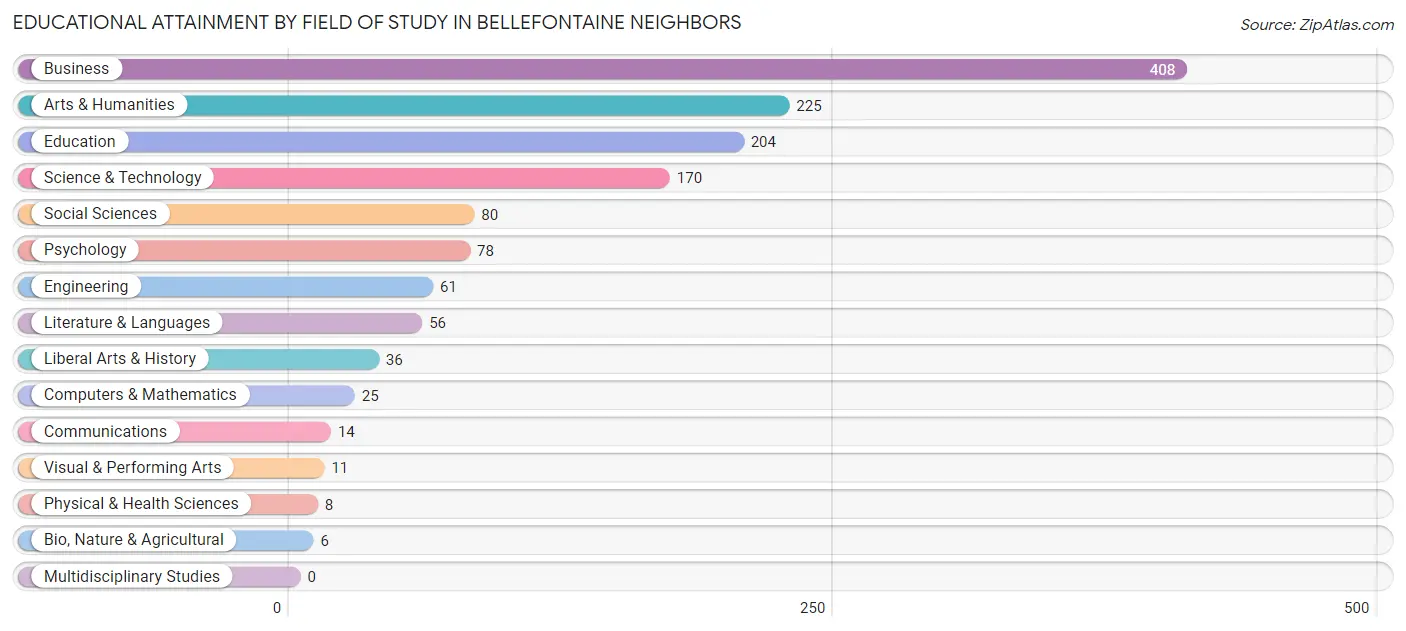
Educational Attainment by Field of Study in Bellefontaine Neighbors
Business (408 | 29.5%), arts & humanities (225 | 16.3%), education (204 | 14.8%), science & technology (170 | 12.3%), and social sciences (80 | 5.8%) are the most common fields of study among 1,382 individuals in Bellefontaine Neighbors who have obtained a bachelor's degree or higher.
| Field of Study | # Graduates | % Graduates |
| Computers & Mathematics | 25 | 1.8% |
| Bio, Nature & Agricultural | 6 | 0.4% |
| Physical & Health Sciences | 8 | 0.6% |
| Psychology | 78 | 5.6% |
| Social Sciences | 80 | 5.8% |
| Engineering | 61 | 4.4% |
| Multidisciplinary Studies | 0 | 0.0% |
| Science & Technology | 170 | 12.3% |
| Business | 408 | 29.5% |
| Education | 204 | 14.8% |
| Literature & Languages | 56 | 4.1% |
| Liberal Arts & History | 36 | 2.6% |
| Visual & Performing Arts | 11 | 0.8% |
| Communications | 14 | 1.0% |
| Arts & Humanities | 225 | 16.3% |
| Total | 1,382 | 100.0% |
Transportation & Commute in Bellefontaine Neighbors
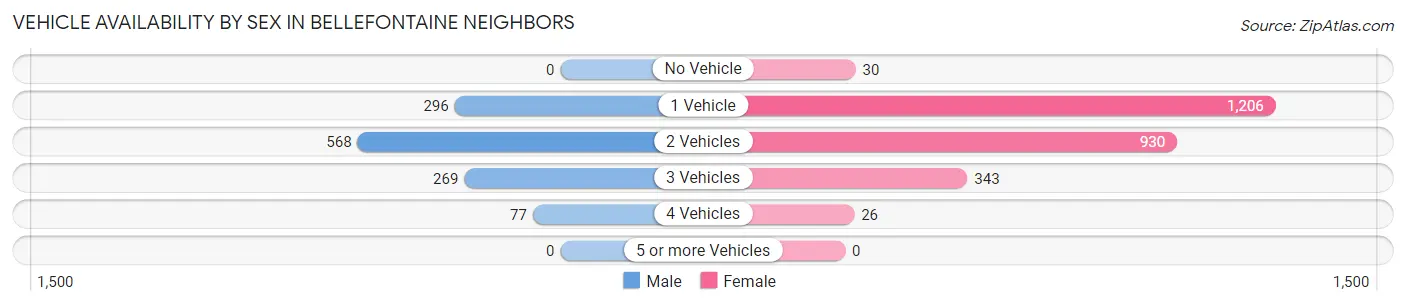
Vehicle Availability by Sex in Bellefontaine Neighbors
The most prevalent vehicle ownership categories in Bellefontaine Neighbors are males with 2 vehicles (568, accounting for 46.9%) and females with 2 vehicles (930, making up 22.4%).
| Vehicles Available | Male | Female |
| No Vehicle | 0 (0.0%) | 30 (1.2%) |
| 1 Vehicle | 296 (24.5%) | 1,206 (47.6%) |
| 2 Vehicles | 568 (46.9%) | 930 (36.7%) |
| 3 Vehicles | 269 (22.2%) | 343 (13.5%) |
| 4 Vehicles | 77 (6.4%) | 26 (1.0%) |
| 5 or more Vehicles | 0 (0.0%) | 0 (0.0%) |
| Total | 1,210 (100.0%) | 2,535 (100.0%) |
Commute Time in Bellefontaine Neighbors
The most frequently occuring commute durations in Bellefontaine Neighbors are 30 to 34 minutes (652 commuters, 21.0%), 25 to 29 minutes (455 commuters, 14.7%), and 15 to 19 minutes (377 commuters, 12.2%).
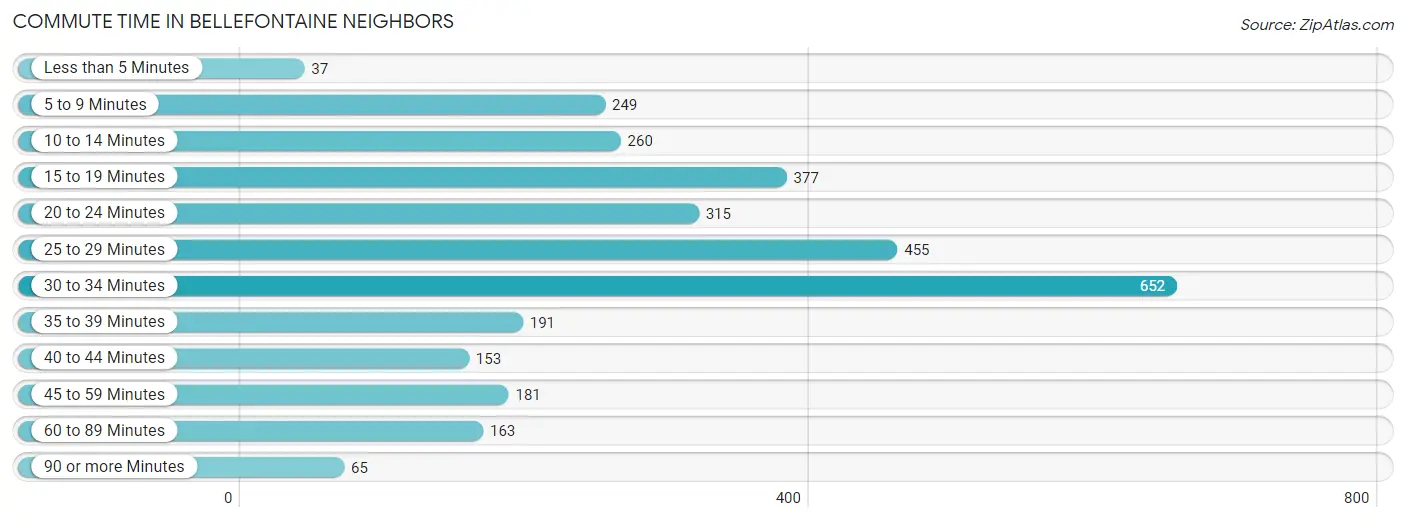
| Commute Time | # Commuters | % Commuters |
| Less than 5 Minutes | 37 | 1.2% |
| 5 to 9 Minutes | 249 | 8.0% |
| 10 to 14 Minutes | 260 | 8.4% |
| 15 to 19 Minutes | 377 | 12.2% |
| 20 to 24 Minutes | 315 | 10.2% |
| 25 to 29 Minutes | 455 | 14.7% |
| 30 to 34 Minutes | 652 | 21.0% |
| 35 to 39 Minutes | 191 | 6.2% |
| 40 to 44 Minutes | 153 | 4.9% |
| 45 to 59 Minutes | 181 | 5.8% |
| 60 to 89 Minutes | 163 | 5.3% |
| 90 or more Minutes | 65 | 2.1% |
Commute Time by Sex in Bellefontaine Neighbors
The most common commute times in Bellefontaine Neighbors are 20 to 24 minutes (175 commuters, 16.1%) for males and 30 to 34 minutes (480 commuters, 23.9%) for females.
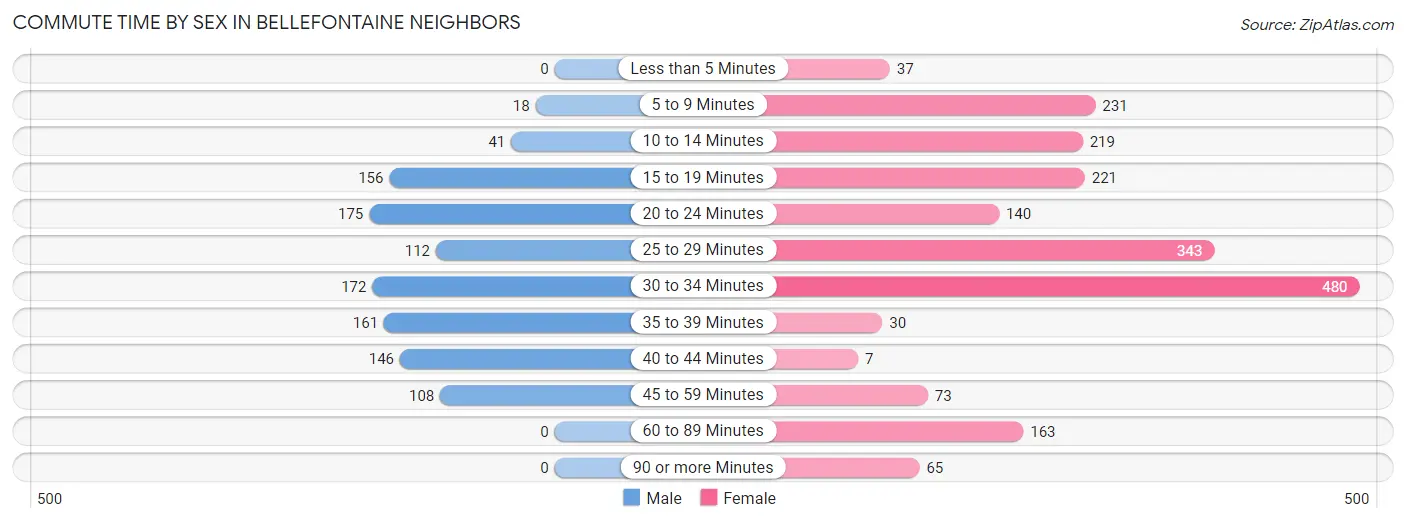
| Commute Time | Male | Female |
| Less than 5 Minutes | 0 (0.0%) | 37 (1.8%) |
| 5 to 9 Minutes | 18 (1.7%) | 231 (11.5%) |
| 10 to 14 Minutes | 41 (3.8%) | 219 (10.9%) |
| 15 to 19 Minutes | 156 (14.3%) | 221 (11.0%) |
| 20 to 24 Minutes | 175 (16.1%) | 140 (7.0%) |
| 25 to 29 Minutes | 112 (10.3%) | 343 (17.1%) |
| 30 to 34 Minutes | 172 (15.8%) | 480 (23.9%) |
| 35 to 39 Minutes | 161 (14.8%) | 30 (1.5%) |
| 40 to 44 Minutes | 146 (13.4%) | 7 (0.4%) |
| 45 to 59 Minutes | 108 (9.9%) | 73 (3.6%) |
| 60 to 89 Minutes | 0 (0.0%) | 163 (8.1%) |
| 90 or more Minutes | 0 (0.0%) | 65 (3.2%) |
Time of Departure to Work by Sex in Bellefontaine Neighbors
The most frequent times of departure to work in Bellefontaine Neighbors are 4:00 PM to 11:59 PM (362, 33.2%) for males and 12:00 PM to 3:59 PM (364, 18.1%) for females.
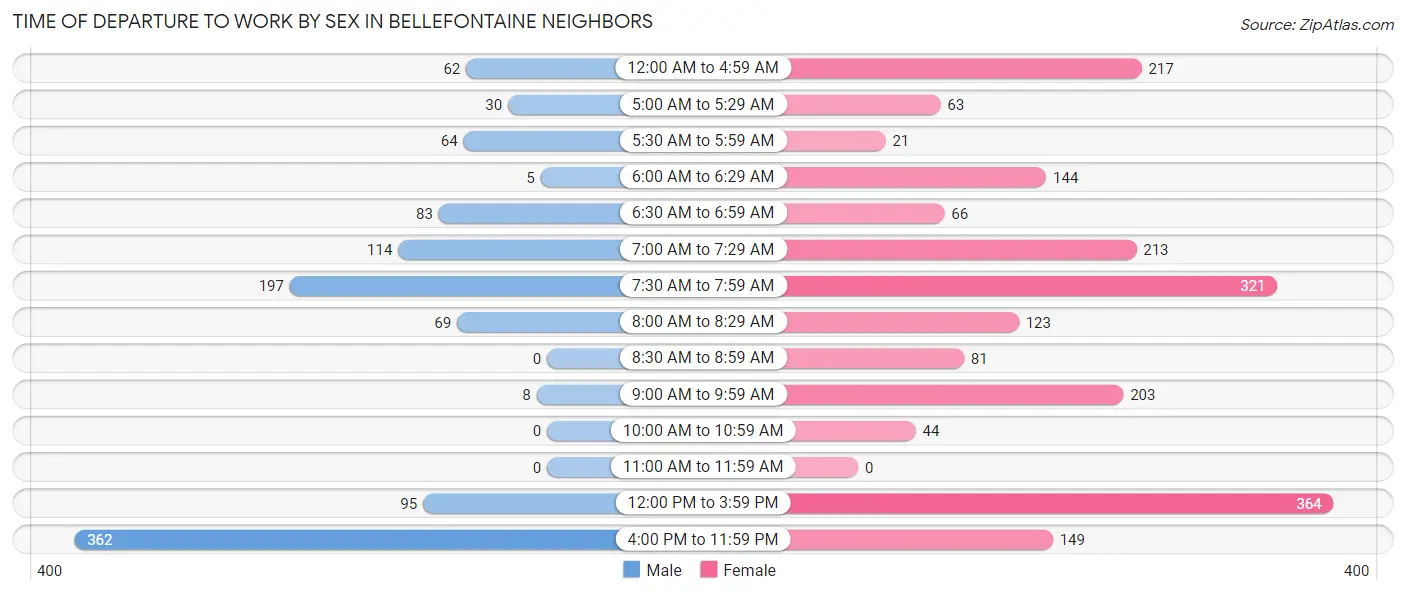
| Time of Departure | Male | Female |
| 12:00 AM to 4:59 AM | 62 (5.7%) | 217 (10.8%) |
| 5:00 AM to 5:29 AM | 30 (2.8%) | 63 (3.1%) |
| 5:30 AM to 5:59 AM | 64 (5.9%) | 21 (1.1%) |
| 6:00 AM to 6:29 AM | 5 (0.5%) | 144 (7.2%) |
| 6:30 AM to 6:59 AM | 83 (7.6%) | 66 (3.3%) |
| 7:00 AM to 7:29 AM | 114 (10.5%) | 213 (10.6%) |
| 7:30 AM to 7:59 AM | 197 (18.1%) | 321 (16.0%) |
| 8:00 AM to 8:29 AM | 69 (6.3%) | 123 (6.1%) |
| 8:30 AM to 8:59 AM | 0 (0.0%) | 81 (4.0%) |
| 9:00 AM to 9:59 AM | 8 (0.7%) | 203 (10.1%) |
| 10:00 AM to 10:59 AM | 0 (0.0%) | 44 (2.2%) |
| 11:00 AM to 11:59 AM | 0 (0.0%) | 0 (0.0%) |
| 12:00 PM to 3:59 PM | 95 (8.7%) | 364 (18.1%) |
| 4:00 PM to 11:59 PM | 362 (33.2%) | 149 (7.4%) |
| Total | 1,089 (100.0%) | 2,009 (100.0%) |
Housing Occupancy in Bellefontaine Neighbors
Occupancy by Ownership in Bellefontaine Neighbors
Of the total 4,584 dwellings in Bellefontaine Neighbors, owner-occupied units account for 2,751 (60.0%), while renter-occupied units make up 1,833 (40.0%).
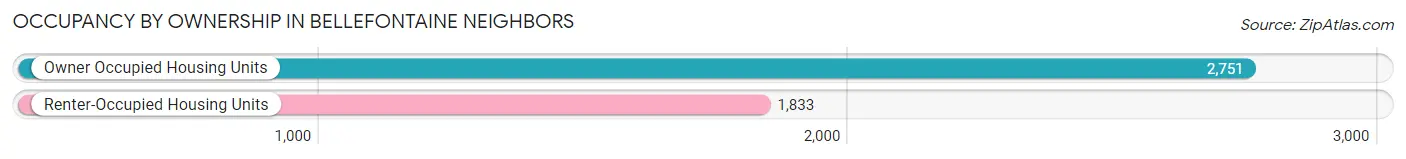
| Occupancy | # Housing Units | % Housing Units |
| Owner Occupied Housing Units | 2,751 | 60.0% |
| Renter-Occupied Housing Units | 1,833 | 40.0% |
| Total Occupied Housing Units | 4,584 | 100.0% |
Occupancy by Household Size in Bellefontaine Neighbors
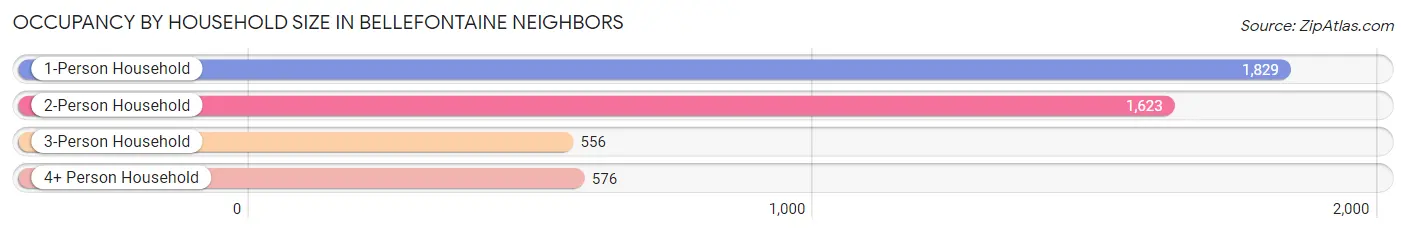
| Household Size | # Housing Units | % Housing Units |
| 1-Person Household | 1,829 | 39.9% |
| 2-Person Household | 1,623 | 35.4% |
| 3-Person Household | 556 | 12.1% |
| 4+ Person Household | 576 | 12.6% |
| Total Housing Units | 4,584 | 100.0% |
Occupancy by Ownership by Household Size in Bellefontaine Neighbors
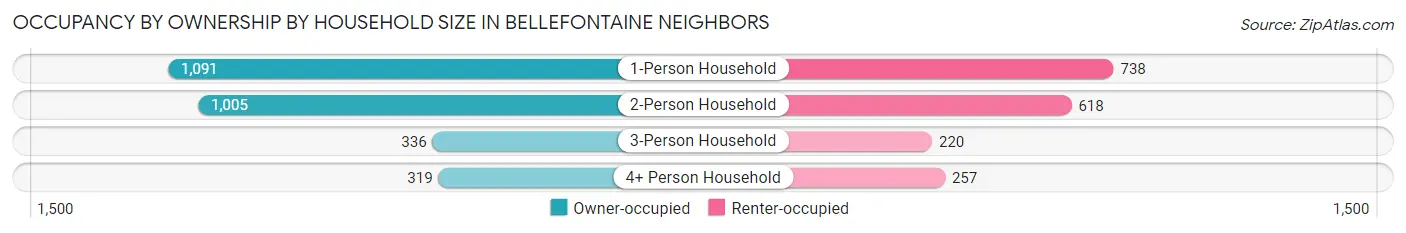
| Household Size | Owner-occupied | Renter-occupied |
| 1-Person Household | 1,091 (59.7%) | 738 (40.4%) |
| 2-Person Household | 1,005 (61.9%) | 618 (38.1%) |
| 3-Person Household | 336 (60.4%) | 220 (39.6%) |
| 4+ Person Household | 319 (55.4%) | 257 (44.6%) |
| Total Housing Units | 2,751 (60.0%) | 1,833 (40.0%) |
Occupancy by Educational Attainment in Bellefontaine Neighbors
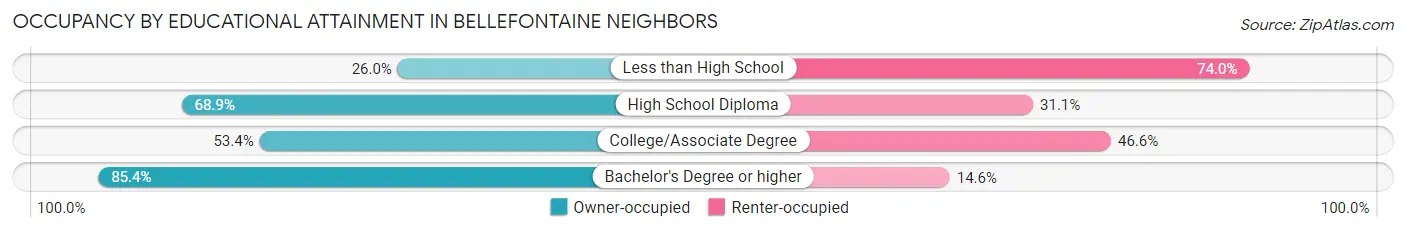
| Household Size | Owner-occupied | Renter-occupied |
| Less than High School | 145 (26.0%) | 412 (74.0%) |
| High School Diploma | 932 (68.9%) | 421 (31.1%) |
| College/Associate Degree | 1,019 (53.4%) | 888 (46.6%) |
| Bachelor's Degree or higher | 655 (85.4%) | 112 (14.6%) |
Occupancy by Age of Householder in Bellefontaine Neighbors
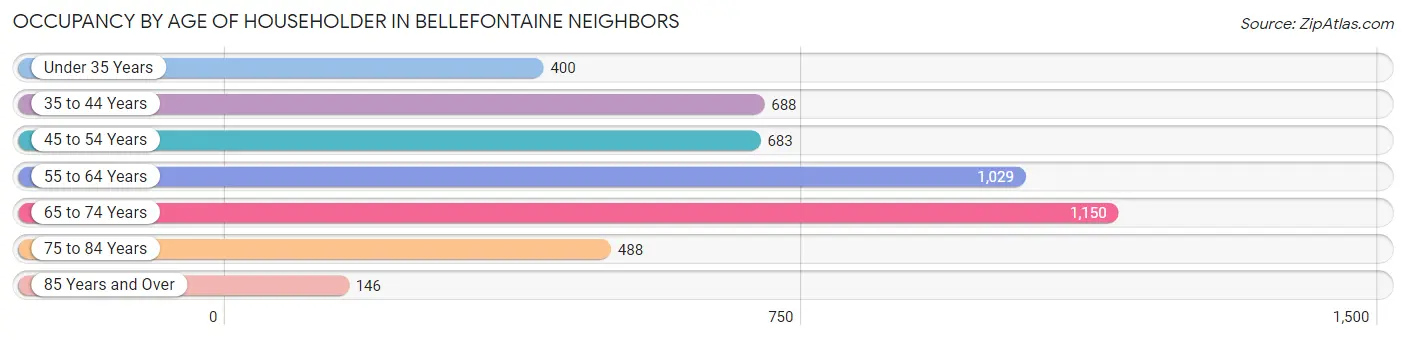
| Age Bracket | # Households | % Households |
| Under 35 Years | 400 | 8.7% |
| 35 to 44 Years | 688 | 15.0% |
| 45 to 54 Years | 683 | 14.9% |
| 55 to 64 Years | 1,029 | 22.5% |
| 65 to 74 Years | 1,150 | 25.1% |
| 75 to 84 Years | 488 | 10.6% |
| 85 Years and Over | 146 | 3.2% |
| Total | 4,584 | 100.0% |
Housing Finances in Bellefontaine Neighbors
Median Income by Occupancy in Bellefontaine Neighbors
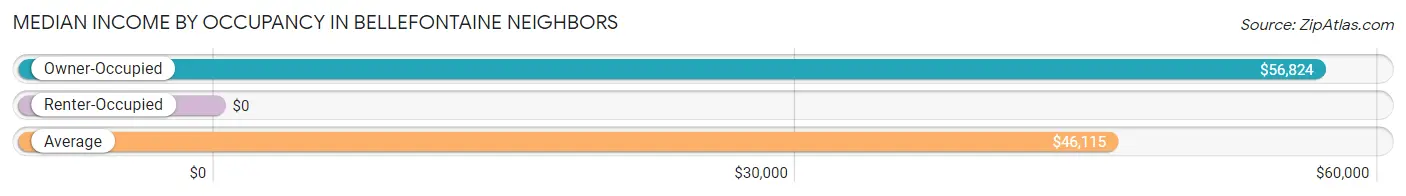
| Occupancy Type | # Households | Median Income |
| Owner-Occupied | 2,751 (60.0%) | $56,824 |
| Renter-Occupied | 1,833 (40.0%) | $0 |
| Average | 4,584 (100.0%) | $46,115 |
Occupancy by Householder Income Bracket in Bellefontaine Neighbors
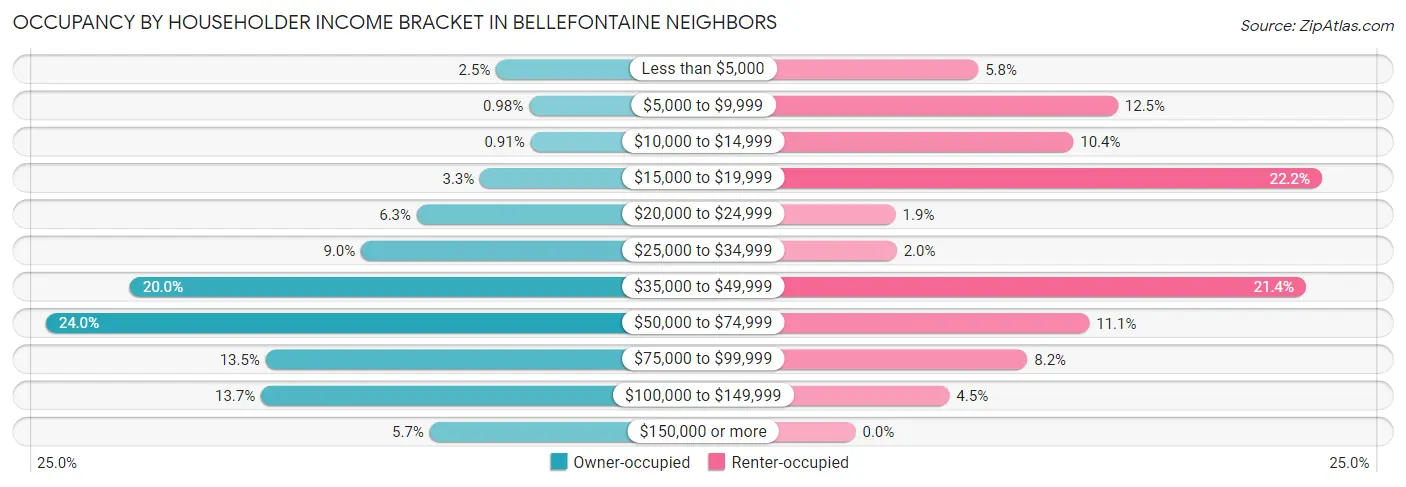
| Income Bracket | Owner-occupied | Renter-occupied |
| Less than $5,000 | 70 (2.5%) | 107 (5.8%) |
| $5,000 to $9,999 | 27 (1.0%) | 229 (12.5%) |
| $10,000 to $14,999 | 25 (0.9%) | 190 (10.4%) |
| $15,000 to $19,999 | 91 (3.3%) | 407 (22.2%) |
| $20,000 to $24,999 | 174 (6.3%) | 35 (1.9%) |
| $25,000 to $34,999 | 247 (9.0%) | 36 (2.0%) |
| $35,000 to $49,999 | 550 (20.0%) | 393 (21.4%) |
| $50,000 to $74,999 | 660 (24.0%) | 204 (11.1%) |
| $75,000 to $99,999 | 372 (13.5%) | 150 (8.2%) |
| $100,000 to $149,999 | 378 (13.7%) | 82 (4.5%) |
| $150,000 or more | 157 (5.7%) | 0 (0.0%) |
| Total | 2,751 (100.0%) | 1,833 (100.0%) |
Monthly Housing Cost Tiers in Bellefontaine Neighbors
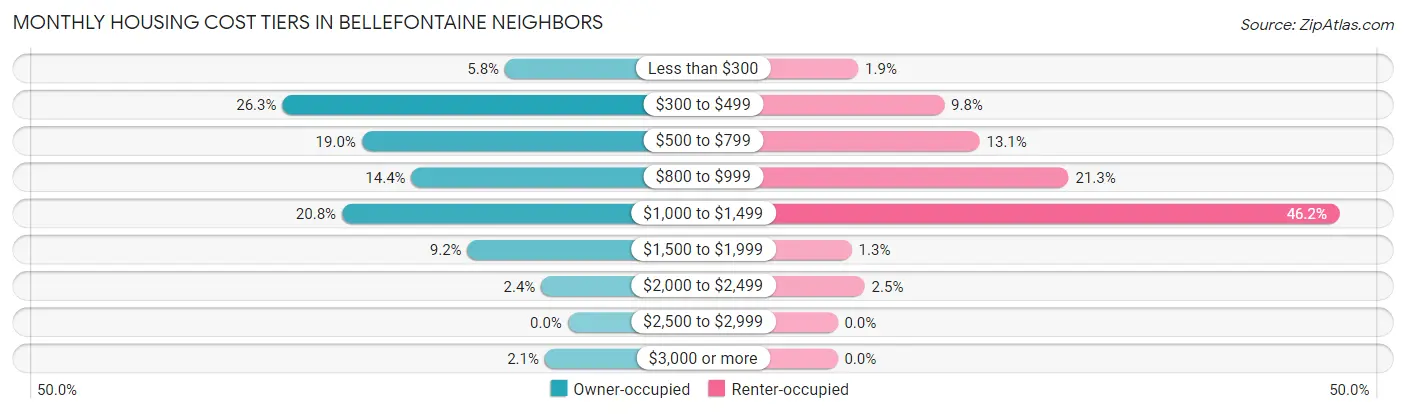
| Monthly Cost | Owner-occupied | Renter-occupied |
| Less than $300 | 159 (5.8%) | 35 (1.9%) |
| $300 to $499 | 723 (26.3%) | 180 (9.8%) |
| $500 to $799 | 522 (19.0%) | 240 (13.1%) |
| $800 to $999 | 396 (14.4%) | 390 (21.3%) |
| $1,000 to $1,499 | 572 (20.8%) | 846 (46.2%) |
| $1,500 to $1,999 | 254 (9.2%) | 24 (1.3%) |
| $2,000 to $2,499 | 67 (2.4%) | 46 (2.5%) |
| $2,500 to $2,999 | 0 (0.0%) | 0 (0.0%) |
| $3,000 or more | 58 (2.1%) | 0 (0.0%) |
| Total | 2,751 (100.0%) | 1,833 (100.0%) |
Physical Housing Characteristics in Bellefontaine Neighbors
Housing Structures in Bellefontaine Neighbors
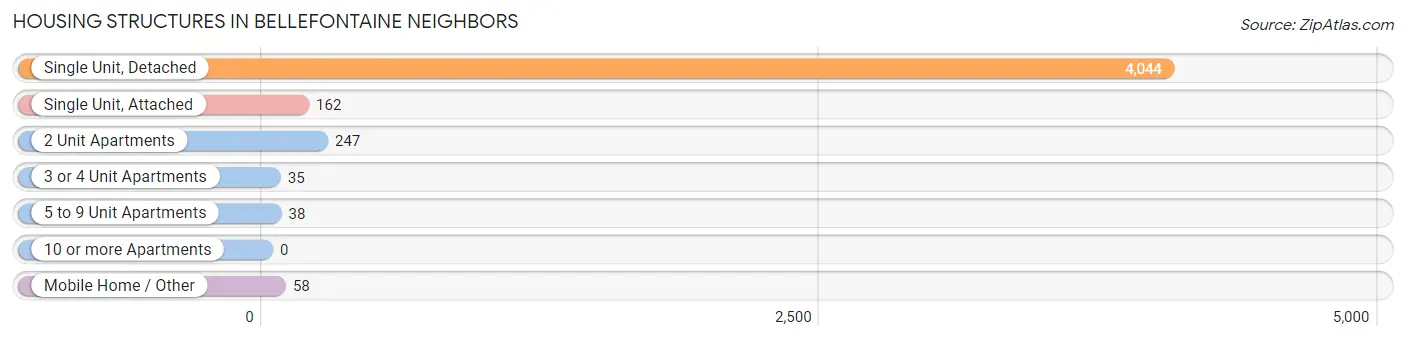
| Structure Type | # Housing Units | % Housing Units |
| Single Unit, Detached | 4,044 | 88.2% |
| Single Unit, Attached | 162 | 3.5% |
| 2 Unit Apartments | 247 | 5.4% |
| 3 or 4 Unit Apartments | 35 | 0.8% |
| 5 to 9 Unit Apartments | 38 | 0.8% |
| 10 or more Apartments | 0 | 0.0% |
| Mobile Home / Other | 58 | 1.3% |
| Total | 4,584 | 100.0% |
Housing Structures by Occupancy in Bellefontaine Neighbors
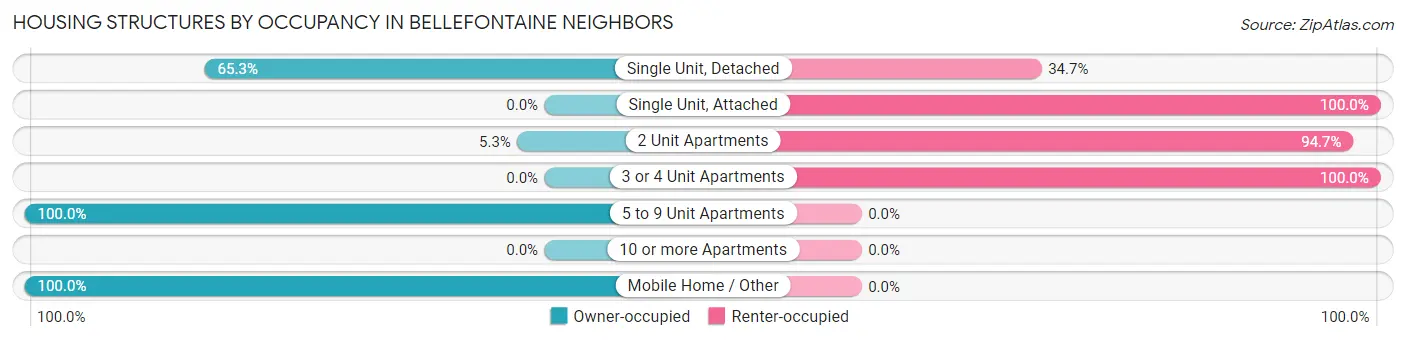
| Structure Type | Owner-occupied | Renter-occupied |
| Single Unit, Detached | 2,642 (65.3%) | 1,402 (34.7%) |
| Single Unit, Attached | 0 (0.0%) | 162 (100.0%) |
| 2 Unit Apartments | 13 (5.3%) | 234 (94.7%) |
| 3 or 4 Unit Apartments | 0 (0.0%) | 35 (100.0%) |
| 5 to 9 Unit Apartments | 38 (100.0%) | 0 (0.0%) |
| 10 or more Apartments | 0 (0.0%) | 0 (0.0%) |
| Mobile Home / Other | 58 (100.0%) | 0 (0.0%) |
| Total | 2,751 (60.0%) | 1,833 (40.0%) |
Housing Structures by Number of Rooms in Bellefontaine Neighbors
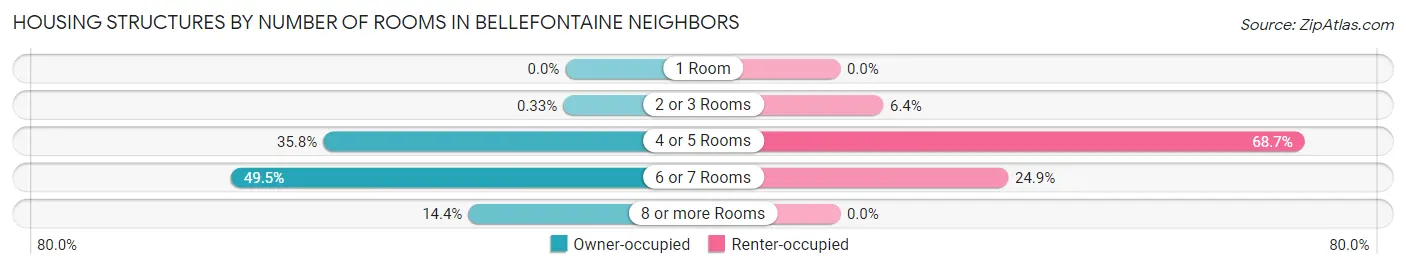
| Number of Rooms | Owner-occupied | Renter-occupied |
| 1 Room | 0 (0.0%) | 0 (0.0%) |
| 2 or 3 Rooms | 9 (0.3%) | 117 (6.4%) |
| 4 or 5 Rooms | 986 (35.8%) | 1,260 (68.7%) |
| 6 or 7 Rooms | 1,361 (49.5%) | 456 (24.9%) |
| 8 or more Rooms | 395 (14.4%) | 0 (0.0%) |
| Total | 2,751 (100.0%) | 1,833 (100.0%) |
Housing Structure by Heating Type in Bellefontaine Neighbors
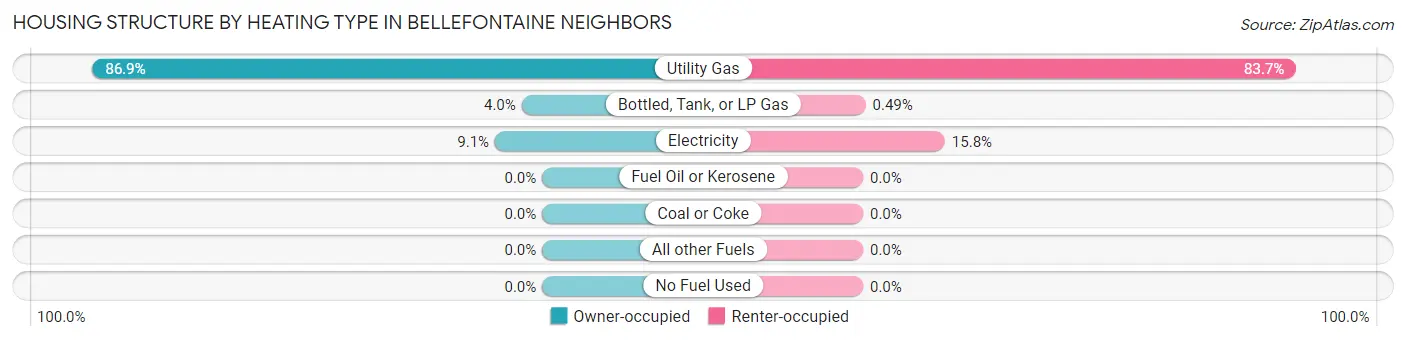
| Heating Type | Owner-occupied | Renter-occupied |
| Utility Gas | 2,391 (86.9%) | 1,534 (83.7%) |
| Bottled, Tank, or LP Gas | 109 (4.0%) | 9 (0.5%) |
| Electricity | 251 (9.1%) | 290 (15.8%) |
| Fuel Oil or Kerosene | 0 (0.0%) | 0 (0.0%) |
| Coal or Coke | 0 (0.0%) | 0 (0.0%) |
| All other Fuels | 0 (0.0%) | 0 (0.0%) |
| No Fuel Used | 0 (0.0%) | 0 (0.0%) |
| Total | 2,751 (100.0%) | 1,833 (100.0%) |
Household Vehicle Usage in Bellefontaine Neighbors
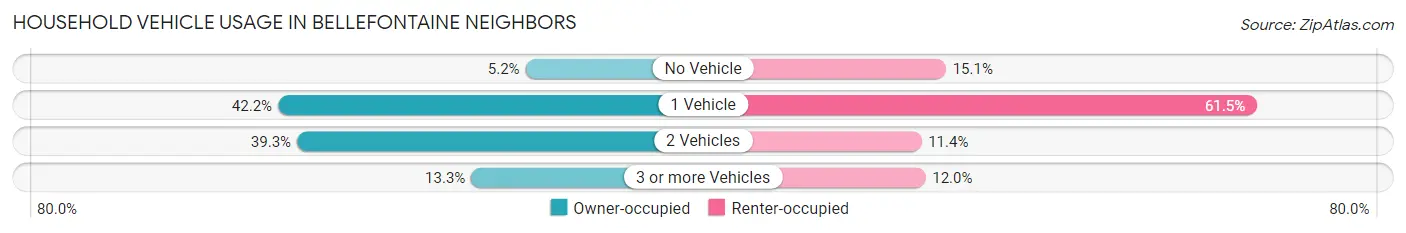
| Vehicles per Household | Owner-occupied | Renter-occupied |
| No Vehicle | 143 (5.2%) | 276 (15.1%) |
| 1 Vehicle | 1,160 (42.2%) | 1,128 (61.5%) |
| 2 Vehicles | 1,082 (39.3%) | 209 (11.4%) |
| 3 or more Vehicles | 366 (13.3%) | 220 (12.0%) |
| Total | 2,751 (100.0%) | 1,833 (100.0%) |
Real Estate & Mortgages in Bellefontaine Neighbors
Real Estate and Mortgage Overview in Bellefontaine Neighbors
| Characteristic | Without Mortgage | With Mortgage |
| Housing Units | 1,159 | 1,592 |
| Median Property Value | $65,900 | $91,400 |
| Median Household Income | $50,165 | $152 |
| Monthly Housing Costs | $444 | $0 |
| Real Estate Taxes | $1,529 | $0 |
Property Value by Mortgage Status in Bellefontaine Neighbors
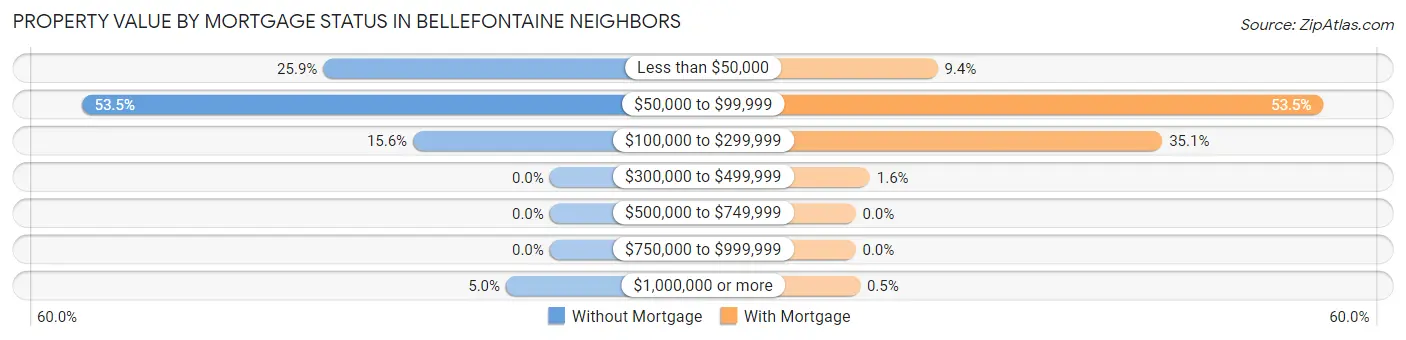
| Property Value | Without Mortgage | With Mortgage |
| Less than $50,000 | 300 (25.9%) | 149 (9.4%) |
| $50,000 to $99,999 | 620 (53.5%) | 851 (53.4%) |
| $100,000 to $299,999 | 181 (15.6%) | 558 (35.0%) |
| $300,000 to $499,999 | 0 (0.0%) | 26 (1.6%) |
| $500,000 to $749,999 | 0 (0.0%) | 0 (0.0%) |
| $750,000 to $999,999 | 0 (0.0%) | 0 (0.0%) |
| $1,000,000 or more | 58 (5.0%) | 8 (0.5%) |
| Total | 1,159 (100.0%) | 1,592 (100.0%) |
Household Income by Mortgage Status in Bellefontaine Neighbors
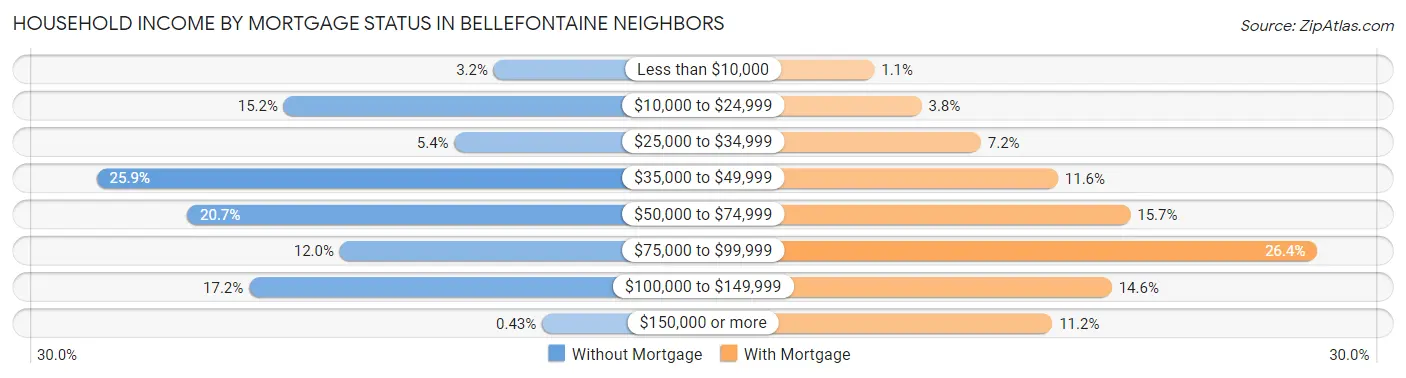
| Household Income | Without Mortgage | With Mortgage |
| Less than $10,000 | 37 (3.2%) | 17 (1.1%) |
| $10,000 to $24,999 | 176 (15.2%) | 60 (3.8%) |
| $25,000 to $34,999 | 63 (5.4%) | 114 (7.2%) |
| $35,000 to $49,999 | 300 (25.9%) | 184 (11.6%) |
| $50,000 to $74,999 | 240 (20.7%) | 250 (15.7%) |
| $75,000 to $99,999 | 139 (12.0%) | 420 (26.4%) |
| $100,000 to $149,999 | 199 (17.2%) | 233 (14.6%) |
| $150,000 or more | 5 (0.4%) | 179 (11.2%) |
| Total | 1,159 (100.0%) | 1,592 (100.0%) |
Property Value to Household Income Ratio in Bellefontaine Neighbors
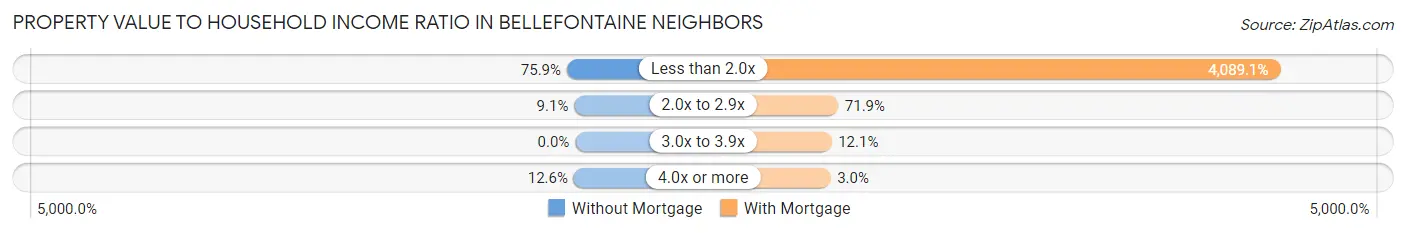
| Value-to-Income Ratio | Without Mortgage | With Mortgage |
| Less than 2.0x | 880 (75.9%) | 65,098 (4,089.1%) |
| 2.0x to 2.9x | 105 (9.1%) | 1,144 (71.9%) |
| 3.0x to 3.9x | 0 (0.0%) | 192 (12.1%) |
| 4.0x or more | 146 (12.6%) | 47 (2.9%) |
| Total | 1,159 (100.0%) | 1,592 (100.0%) |
Real Estate Taxes by Mortgage Status in Bellefontaine Neighbors
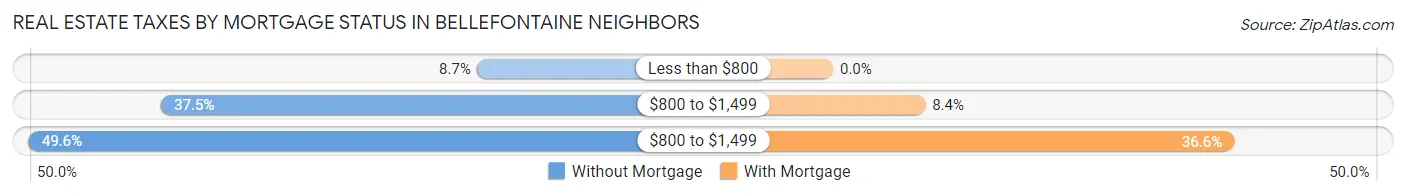
| Property Taxes | Without Mortgage | With Mortgage |
| Less than $800 | 101 (8.7%) | 0 (0.0%) |
| $800 to $1,499 | 435 (37.5%) | 134 (8.4%) |
| $800 to $1,499 | 575 (49.6%) | 583 (36.6%) |
| Total | 1,159 (100.0%) | 1,592 (100.0%) |
Health & Disability in Bellefontaine Neighbors
Health Insurance Coverage by Age in Bellefontaine Neighbors
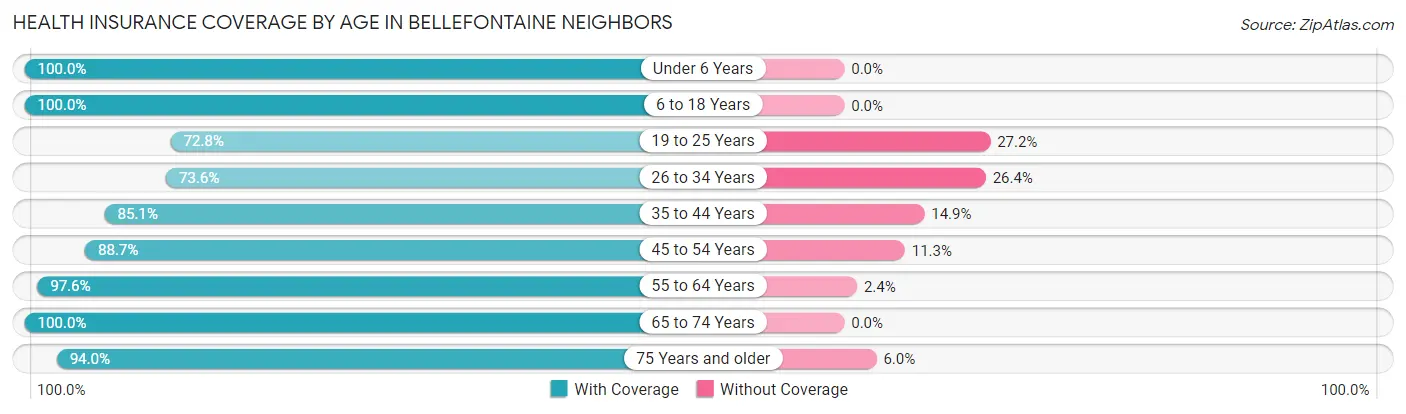
| Age Bracket | With Coverage | Without Coverage |
| Under 6 Years | 639 (100.0%) | 0 (0.0%) |
| 6 to 18 Years | 2,026 (100.0%) | 0 (0.0%) |
| 19 to 25 Years | 527 (72.8%) | 197 (27.2%) |
| 26 to 34 Years | 539 (73.6%) | 193 (26.4%) |
| 35 to 44 Years | 964 (85.1%) | 169 (14.9%) |
| 45 to 54 Years | 1,125 (88.7%) | 143 (11.3%) |
| 55 to 64 Years | 1,610 (97.6%) | 39 (2.4%) |
| 65 to 74 Years | 1,407 (100.0%) | 0 (0.0%) |
| 75 Years and older | 721 (94.0%) | 46 (6.0%) |
| Total | 9,558 (92.4%) | 787 (7.6%) |
Health Insurance Coverage by Citizenship Status in Bellefontaine Neighbors
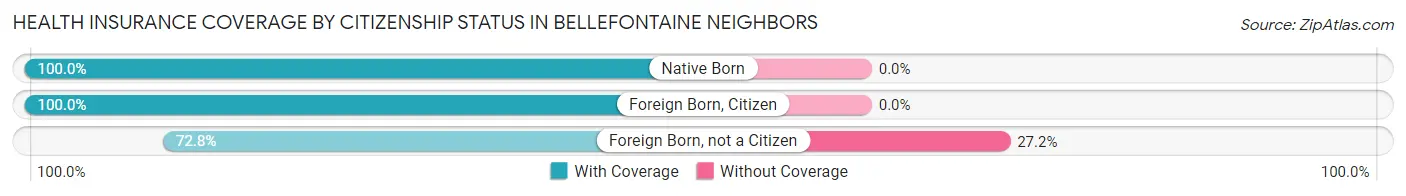
| Citizenship Status | With Coverage | Without Coverage |
| Native Born | 639 (100.0%) | 0 (0.0%) |
| Foreign Born, Citizen | 2,026 (100.0%) | 0 (0.0%) |
| Foreign Born, not a Citizen | 527 (72.8%) | 197 (27.2%) |
Health Insurance Coverage by Household Income in Bellefontaine Neighbors
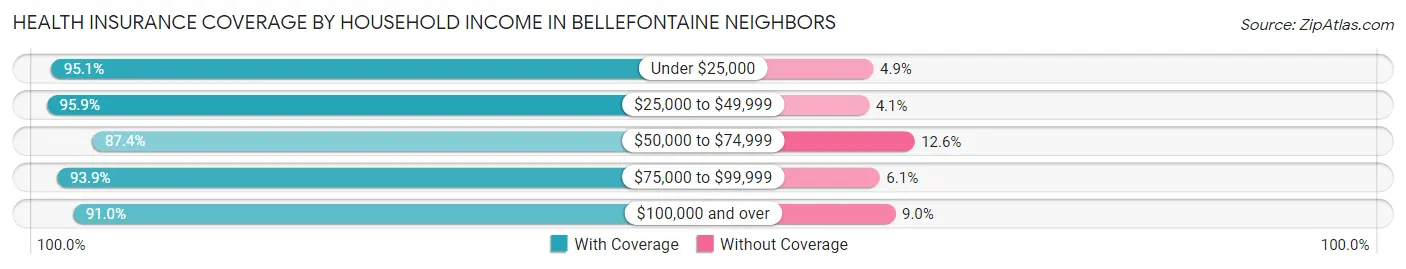
| Household Income | With Coverage | Without Coverage |
| Under $25,000 | 2,295 (95.1%) | 119 (4.9%) |
| $25,000 to $49,999 | 2,406 (95.9%) | 103 (4.1%) |
| $50,000 to $74,999 | 1,923 (87.4%) | 278 (12.6%) |
| $75,000 to $99,999 | 1,428 (93.9%) | 93 (6.1%) |
| $100,000 and over | 1,480 (91.0%) | 147 (9.0%) |
Public vs Private Health Insurance Coverage by Age in Bellefontaine Neighbors
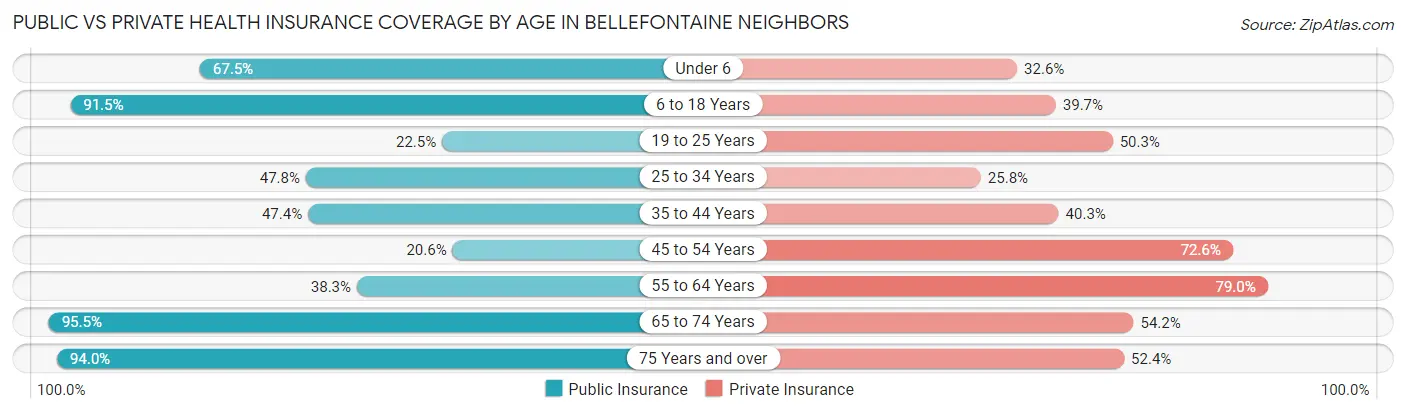
| Age Bracket | Public Insurance | Private Insurance |
| Under 6 | 431 (67.4%) | 208 (32.6%) |
| 6 to 18 Years | 1,854 (91.5%) | 805 (39.7%) |
| 19 to 25 Years | 163 (22.5%) | 364 (50.3%) |
| 25 to 34 Years | 350 (47.8%) | 189 (25.8%) |
| 35 to 44 Years | 537 (47.4%) | 456 (40.3%) |
| 45 to 54 Years | 261 (20.6%) | 920 (72.6%) |
| 55 to 64 Years | 632 (38.3%) | 1,303 (79.0%) |
| 65 to 74 Years | 1,344 (95.5%) | 762 (54.2%) |
| 75 Years and over | 721 (94.0%) | 402 (52.4%) |
| Total | 6,293 (60.8%) | 5,409 (52.3%) |
Disability Status by Sex by Age in Bellefontaine Neighbors
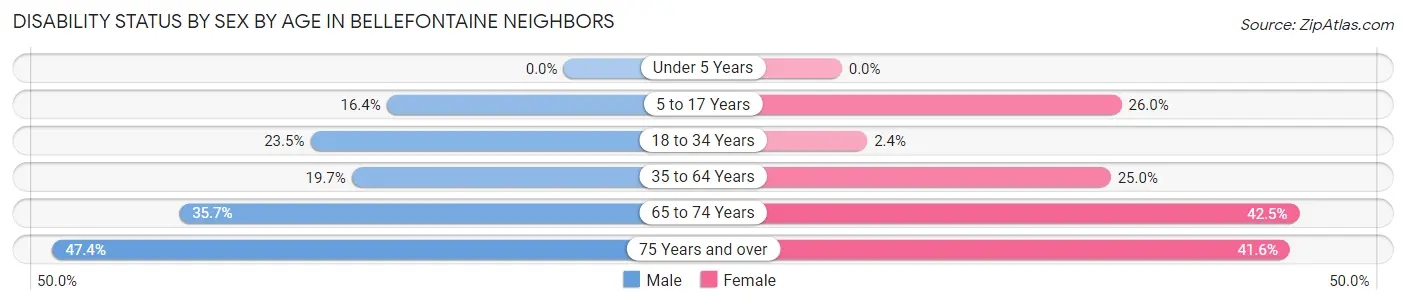
| Age Bracket | Male | Female |
| Under 5 Years | 0 (0.0%) | 0 (0.0%) |
| 5 to 17 Years | 173 (16.4%) | 305 (26.0%) |
| 18 to 34 Years | 156 (23.5%) | 19 (2.4%) |
| 35 to 64 Years | 321 (19.7%) | 603 (25.0%) |
| 65 to 74 Years | 154 (35.6%) | 414 (42.5%) |
| 75 Years and over | 91 (47.4%) | 239 (41.6%) |
Disability Class by Sex by Age in Bellefontaine Neighbors
Disability Class: Hearing Difficulty
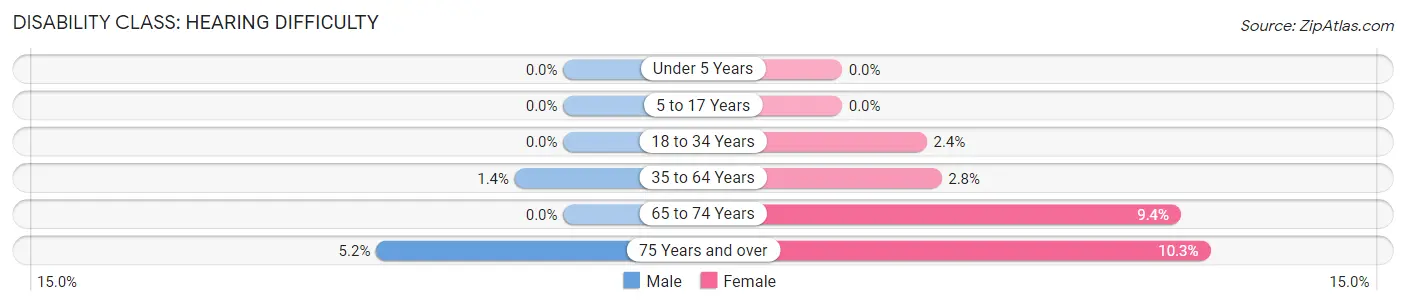
| Age Bracket | Male | Female |
| Under 5 Years | 0 (0.0%) | 0 (0.0%) |
| 5 to 17 Years | 0 (0.0%) | 0 (0.0%) |
| 18 to 34 Years | 0 (0.0%) | 19 (2.4%) |
| 35 to 64 Years | 22 (1.3%) | 67 (2.8%) |
| 65 to 74 Years | 0 (0.0%) | 92 (9.4%) |
| 75 Years and over | 10 (5.2%) | 59 (10.3%) |
Disability Class: Vision Difficulty
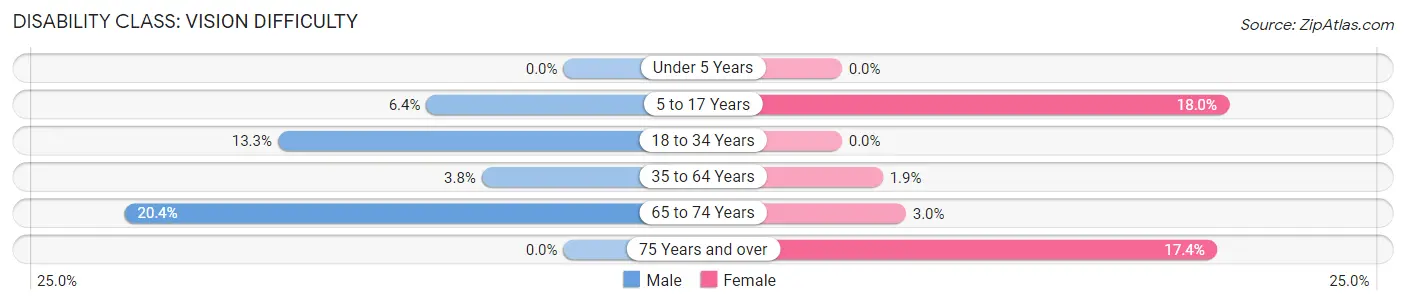
| Age Bracket | Male | Female |
| Under 5 Years | 0 (0.0%) | 0 (0.0%) |
| 5 to 17 Years | 67 (6.4%) | 211 (18.0%) |
| 18 to 34 Years | 88 (13.3%) | 0 (0.0%) |
| 35 to 64 Years | 62 (3.8%) | 46 (1.9%) |
| 65 to 74 Years | 88 (20.4%) | 29 (3.0%) |
| 75 Years and over | 0 (0.0%) | 100 (17.4%) |
Disability Class: Cognitive Difficulty
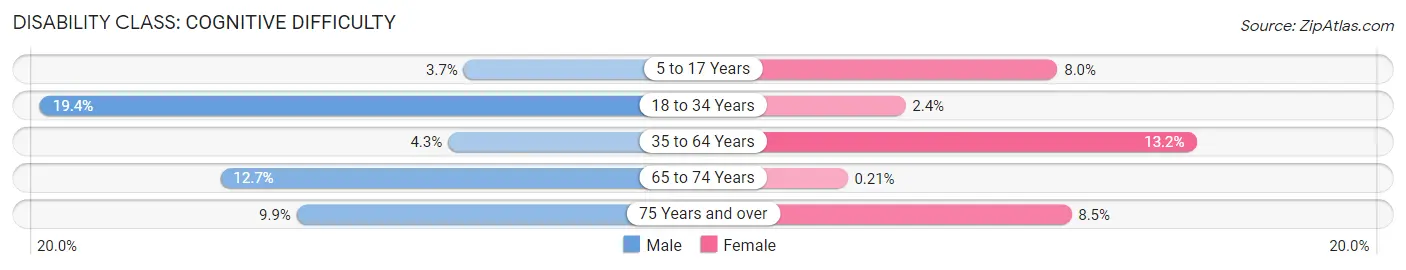
| Age Bracket | Male | Female |
| 5 to 17 Years | 39 (3.7%) | 94 (8.0%) |
| 18 to 34 Years | 129 (19.4%) | 19 (2.4%) |
| 35 to 64 Years | 70 (4.3%) | 318 (13.2%) |
| 65 to 74 Years | 55 (12.7%) | 2 (0.2%) |
| 75 Years and over | 19 (9.9%) | 49 (8.5%) |
Disability Class: Ambulatory Difficulty
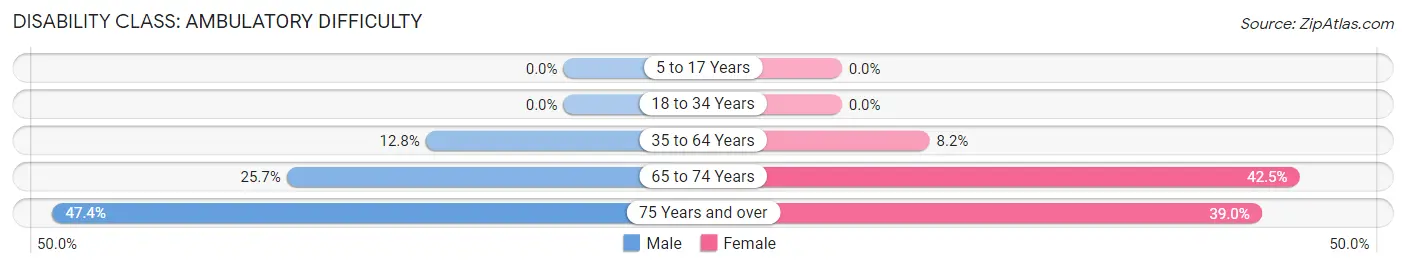
| Age Bracket | Male | Female |
| 5 to 17 Years | 0 (0.0%) | 0 (0.0%) |
| 18 to 34 Years | 0 (0.0%) | 0 (0.0%) |
| 35 to 64 Years | 209 (12.8%) | 197 (8.2%) |
| 65 to 74 Years | 111 (25.7%) | 414 (42.5%) |
| 75 Years and over | 91 (47.4%) | 224 (39.0%) |
Disability Class: Self-Care Difficulty
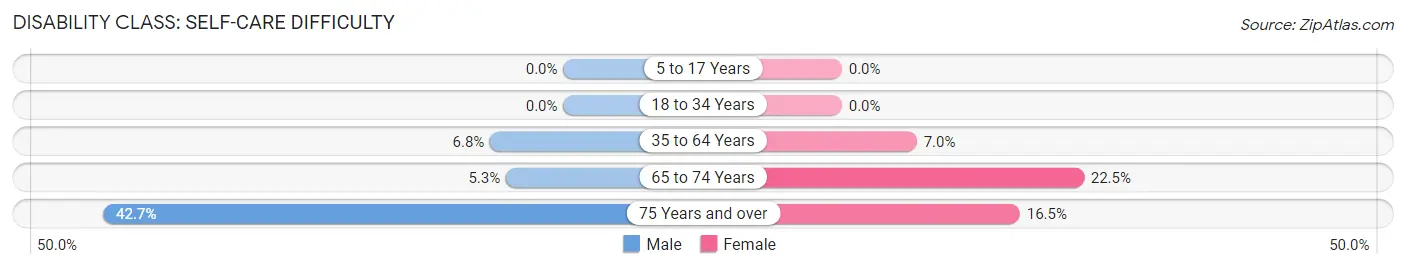
| Age Bracket | Male | Female |
| 5 to 17 Years | 0 (0.0%) | 0 (0.0%) |
| 18 to 34 Years | 0 (0.0%) | 0 (0.0%) |
| 35 to 64 Years | 111 (6.8%) | 168 (7.0%) |
| 65 to 74 Years | 23 (5.3%) | 219 (22.5%) |
| 75 Years and over | 82 (42.7%) | 95 (16.5%) |
Technology Access in Bellefontaine Neighbors
Computing Device Access in Bellefontaine Neighbors
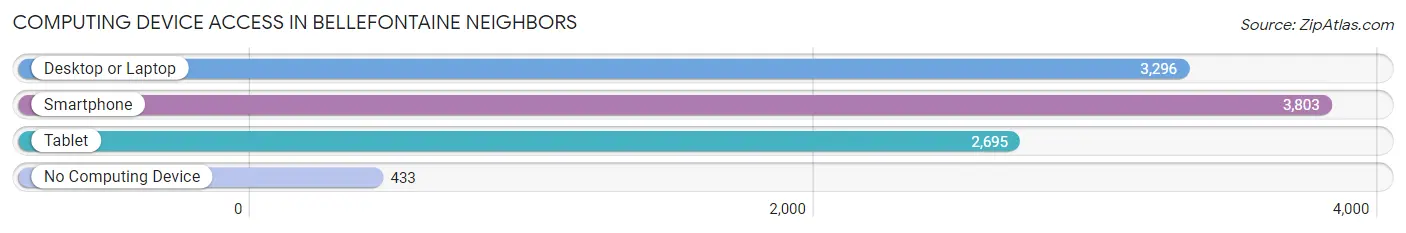
| Device Type | # Households | % Households |
| Desktop or Laptop | 3,296 | 71.9% |
| Smartphone | 3,803 | 83.0% |
| Tablet | 2,695 | 58.8% |
| No Computing Device | 433 | 9.5% |
| Total | 4,584 | 100.0% |
Internet Access in Bellefontaine Neighbors
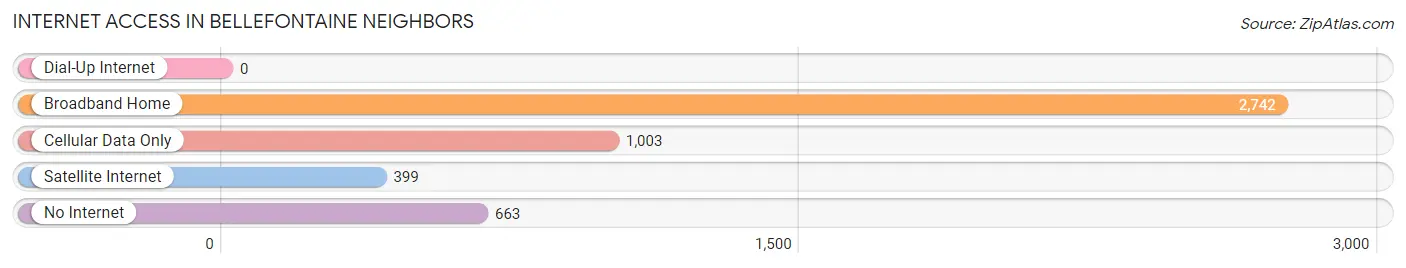
| Internet Type | # Households | % Households |
| Dial-Up Internet | 0 | 0.0% |
| Broadband Home | 2,742 | 59.8% |
| Cellular Data Only | 1,003 | 21.9% |
| Satellite Internet | 399 | 8.7% |
| No Internet | 663 | 14.5% |
| Total | 4,584 | 100.0% |
Bellefontaine Neighbors Summary
Bellefontaine Neighbors is a city located in St. Louis County, Missouri. It is a suburb of St. Louis and is part of the Greater St. Louis metropolitan area. The city was incorporated in 1950 and is home to approximately 8,500 people.
Geography
Bellefontaine Neighbors is located in the northern part of St. Louis County, Missouri. It is bordered by the cities of Ferguson, Florissant, and Hazelwood. The city is situated on the banks of the Missouri River and is approximately 10 miles north of downtown St. Louis. The city has a total area of 2.2 square miles, all of which is land.
Climate
Bellefontaine Neighbors has a humid continental climate, with hot, humid summers and cold, snowy winters. The average annual temperature is around 54°F, with an average high of around 79°F in the summer and an average low of around 30°F in the winter. The average annual precipitation is around 40 inches.
Demographics
As of the 2010 census, Bellefontaine Neighbors had a population of 8,385 people. The racial makeup of the city was 57.3% White, 33.2% African American, 0.3% Native American, 1.2% Asian, 0.1% Pacific Islander, 5.2% from other races, and 2.9% from two or more races. Hispanic or Latino of any race were 8.7% of the population.
Economy
Bellefontaine Neighbors is home to a variety of businesses, including retail stores, restaurants, and professional services. The city is also home to several industrial parks, which provide employment opportunities for local residents. The largest employers in the city are the St. Louis County government, the St. Louis Public Schools, and the St. Louis Community College.
History
Bellefontaine Neighbors was first settled in the early 1800s by French-Canadian immigrants. The city was originally known as Bellefontaine, but the name was changed to Bellefontaine Neighbors in 1950 when it was incorporated. The city was named after the nearby Bellefontaine Cemetery, which was established in 1849.
Bellefontaine Neighbors has a long history of racial segregation. In the 1950s, the city was one of the first in St. Louis County to adopt a racial zoning ordinance, which prohibited African Americans from living in certain areas of the city. This ordinance was eventually overturned in the 1970s, but the city still has a history of racial segregation.
Conclusion
Bellefontaine Neighbors is a city located in St. Louis County, Missouri. It is a suburb of St. Louis and is part of the Greater St. Louis metropolitan area. The city was incorporated in 1950 and is home to approximately 8,500 people. Bellefontaine Neighbors has a humid continental climate, with hot, humid summers and cold, snowy winters. The city has a diverse population, with a majority of the population being White, African American, and Hispanic or Latino. The city is home to a variety of businesses, including retail stores, restaurants, and professional services. Bellefontaine Neighbors has a long history of racial segregation, but this has been slowly changing in recent years.
Common Questions
What is the Total Population of Bellefontaine Neighbors?
Total Population of Bellefontaine Neighbors is 10,637.
What is the Total Male Population of Bellefontaine Neighbors?
Total Male Population of Bellefontaine Neighbors is 4,417.
What is the Total Female Population of Bellefontaine Neighbors?
Total Female Population of Bellefontaine Neighbors is 6,220.
What is the Ratio of Males per 100 Females in Bellefontaine Neighbors?
There are 71.01 Males per 100 Females in Bellefontaine Neighbors.
What is the Ratio of Females per 100 Males in Bellefontaine Neighbors?
There are 140.82 Females per 100 Males in Bellefontaine Neighbors.
What is the Median Population Age in Bellefontaine Neighbors?
Median Population Age in Bellefontaine Neighbors is 45.1 Years.
What is the Average Family Size in Bellefontaine Neighbors
Average Family Size in Bellefontaine Neighbors is 3.1 People.
What is the Average Household Size in Bellefontaine Neighbors
Average Household Size in Bellefontaine Neighbors is 2.2 People.
What is Per Capita Income in Bellefontaine Neighbors?
Per Capita income in Bellefontaine Neighbors is $27,865.
What is the Median Family Income in Bellefontaine Neighbors?
Median Family Income in Bellefontaine Neighbors is $53,644.
What is the Median Household income in Bellefontaine Neighbors?
Median Household Income in Bellefontaine Neighbors is $46,115.
What is Income or Wage Gap in Bellefontaine Neighbors?
Income or Wage Gap in Bellefontaine Neighbors is 11.6%.
Women in Bellefontaine Neighbors earn 88.4 cents for every dollar earned by a man.
What is Inequality or Gini Index in Bellefontaine Neighbors?
Inequality or Gini Index in Bellefontaine Neighbors is 0.48.
How Large is the Labor Force in Bellefontaine Neighbors?
There are 4,090 People in the Labor Forcein in Bellefontaine Neighbors.
What is the Percentage of People in the Labor Force in Bellefontaine Neighbors?
48.9% of People are in the Labor Force in Bellefontaine Neighbors.
What is the Unemployment Rate in Bellefontaine Neighbors?
Unemployment Rate in Bellefontaine Neighbors is 6.2%.