Grantwood Village, MO
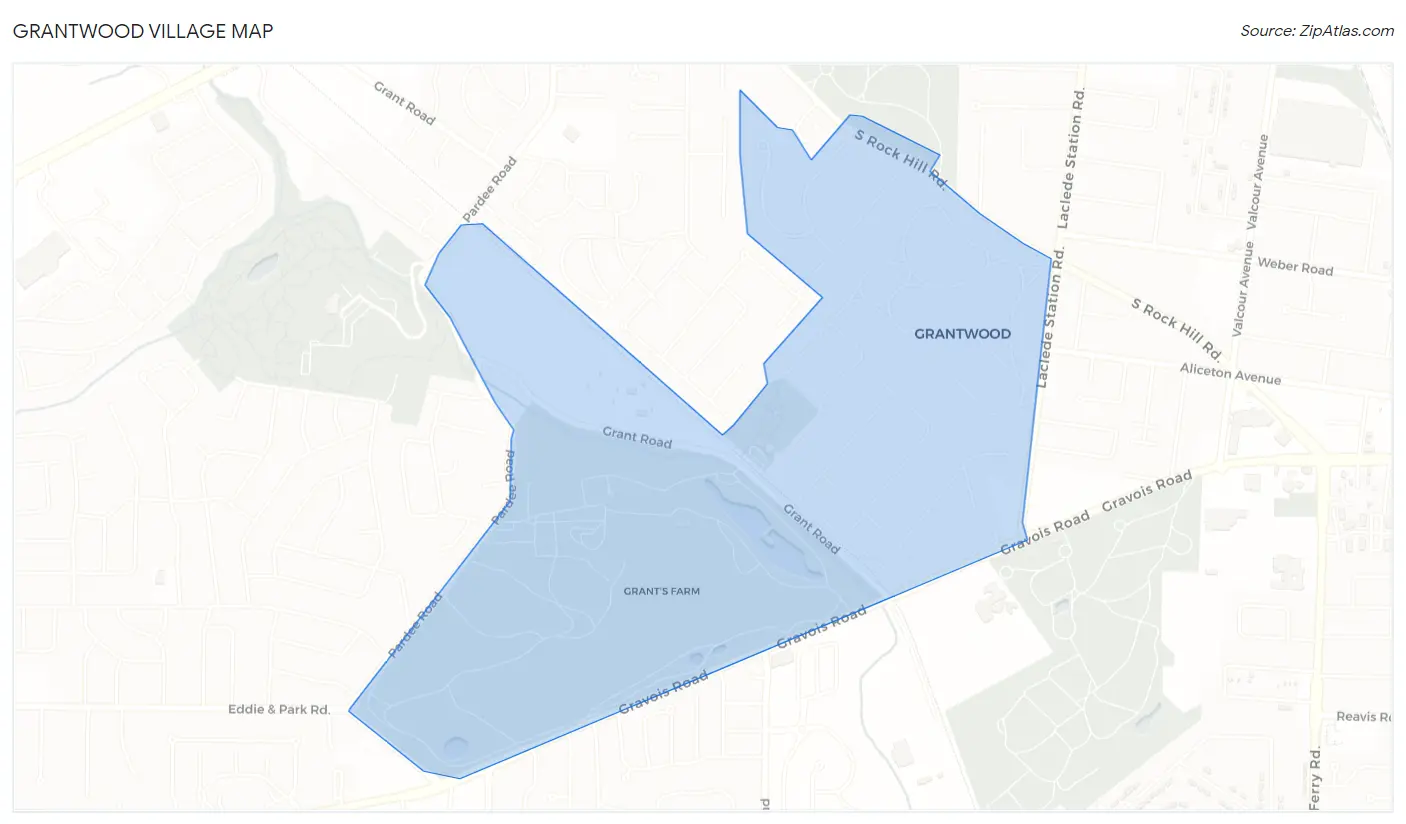
Grantwood Village Map
Grantwood Village Overview
924
TOTAL POPULATION
424
MALE POPULATION
500
FEMALE POPULATION
84.80
MALES / 100 FEMALES
117.92
FEMALES / 100 MALES
54.9
MEDIAN AGE
2.7
AVG FAMILY SIZE
2.5
AVG HOUSEHOLD SIZE
$73,908
PER CAPITA INCOME
$143,947
AVG FAMILY INCOME
$131,250
AVG HOUSEHOLD INCOME
47.5%
WAGE / INCOME GAP [ % ]
52.5¢/ $1
WAGE / INCOME GAP [ $ ]
0.41
INEQUALITY / GINI INDEX
473
LABOR FORCE [ PEOPLE ]
61.0%
PERCENT IN LABOR FORCE
2.5%
UNEMPLOYMENT RATE
Grantwood Village Area Codes
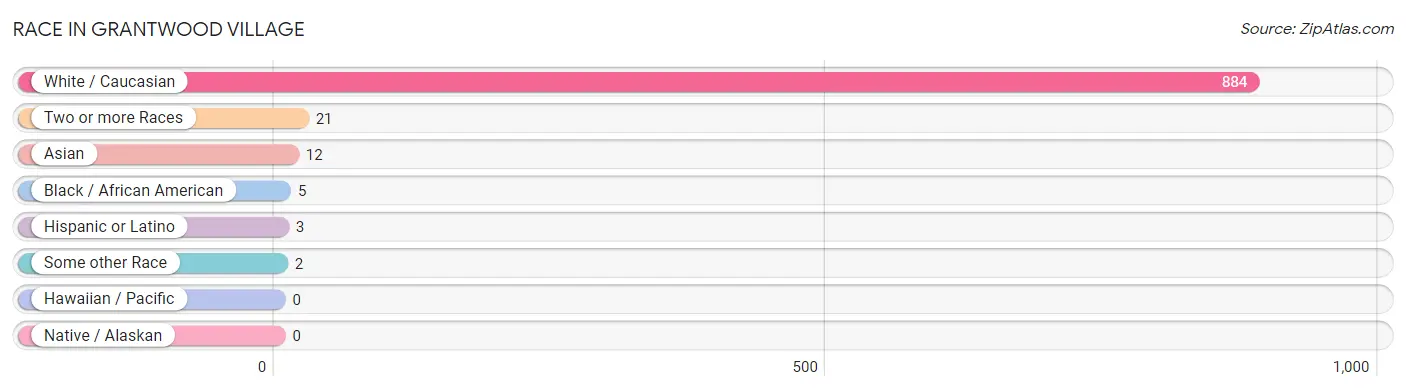
Race in Grantwood Village
The most populous races in Grantwood Village are White / Caucasian (884 | 95.7%), Two or more Races (21 | 2.3%), and Asian (12 | 1.3%).
| Race | # Population | % Population |
| Asian | 12 | 1.3% |
| Black / African American | 5 | 0.5% |
| Hawaiian / Pacific | 0 | 0.0% |
| Hispanic or Latino | 3 | 0.3% |
| Native / Alaskan | 0 | 0.0% |
| White / Caucasian | 884 | 95.7% |
| Two or more Races | 21 | 2.3% |
| Some other Race | 2 | 0.2% |
| Total | 924 | 100.0% |
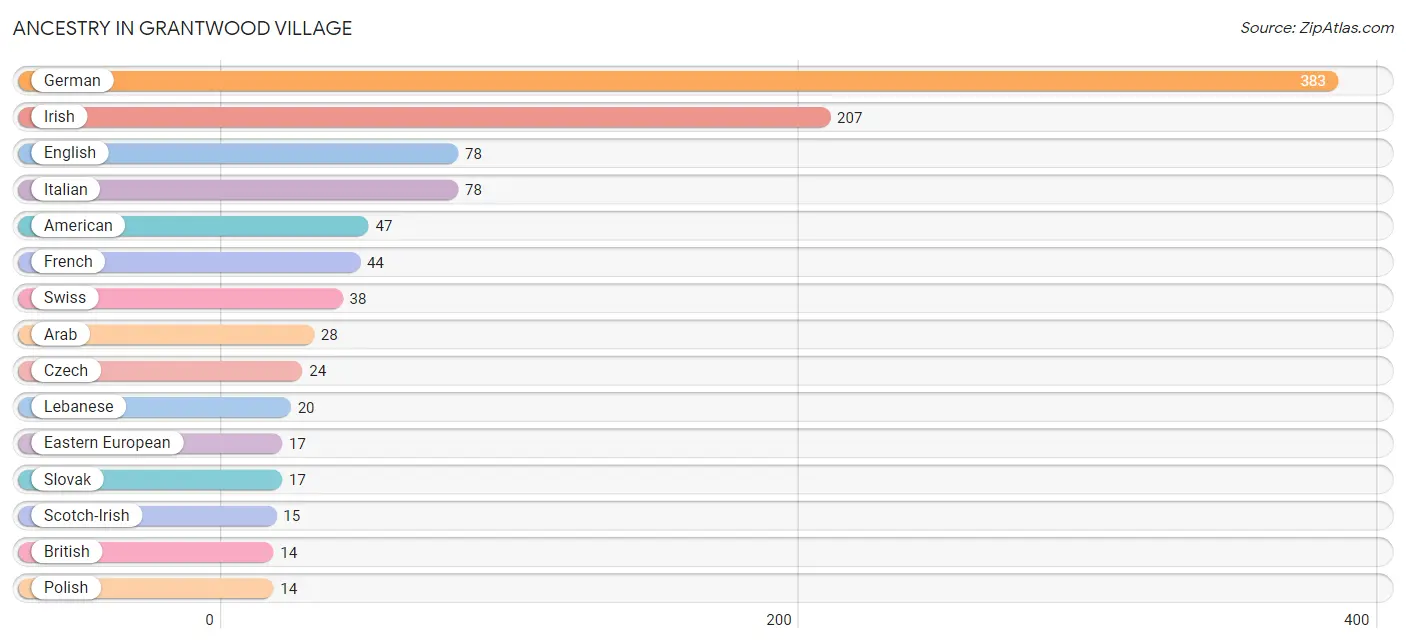
Ancestry in Grantwood Village
The most populous ancestries reported in Grantwood Village are German (383 | 41.4%), Irish (207 | 22.4%), English (78 | 8.4%), Italian (78 | 8.4%), and American (47 | 5.1%), together accounting for 85.8% of all Grantwood Village residents.
| Ancestry | # Population | % Population |
| American | 47 | 5.1% |
| Arab | 28 | 3.0% |
| Austrian | 7 | 0.8% |
| Bhutanese | 8 | 0.9% |
| British | 14 | 1.5% |
| Central American Indian | 1 | 0.1% |
| Croatian | 6 | 0.6% |
| Czech | 24 | 2.6% |
| Danish | 7 | 0.8% |
| Dutch | 4 | 0.4% |
| Eastern European | 17 | 1.8% |
| English | 78 | 8.4% |
| European | 6 | 0.6% |
| French | 44 | 4.8% |
| German | 383 | 41.4% |
| Hungarian | 4 | 0.4% |
| Indian (Asian) | 5 | 0.5% |
| Inupiat | 8 | 0.9% |
| Irish | 207 | 22.4% |
| Italian | 78 | 8.4% |
| Lebanese | 20 | 2.2% |
| Lithuanian | 2 | 0.2% |
| Native Hawaiian | 8 | 0.9% |
| Polish | 14 | 1.5% |
| Portuguese | 1 | 0.1% |
| Puerto Rican | 1 | 0.1% |
| Russian | 2 | 0.2% |
| Scotch-Irish | 15 | 1.6% |
| Scottish | 8 | 0.9% |
| Slavic | 1 | 0.1% |
| Slovak | 17 | 1.8% |
| Spanish | 2 | 0.2% |
| Sri Lankan | 13 | 1.4% |
| Swedish | 6 | 0.6% |
| Swiss | 38 | 4.1% |
| Syrian | 8 | 0.9% |
| Welsh | 6 | 0.6% |
| Yugoslavian | 6 | 0.6% | View All 38 Rows |
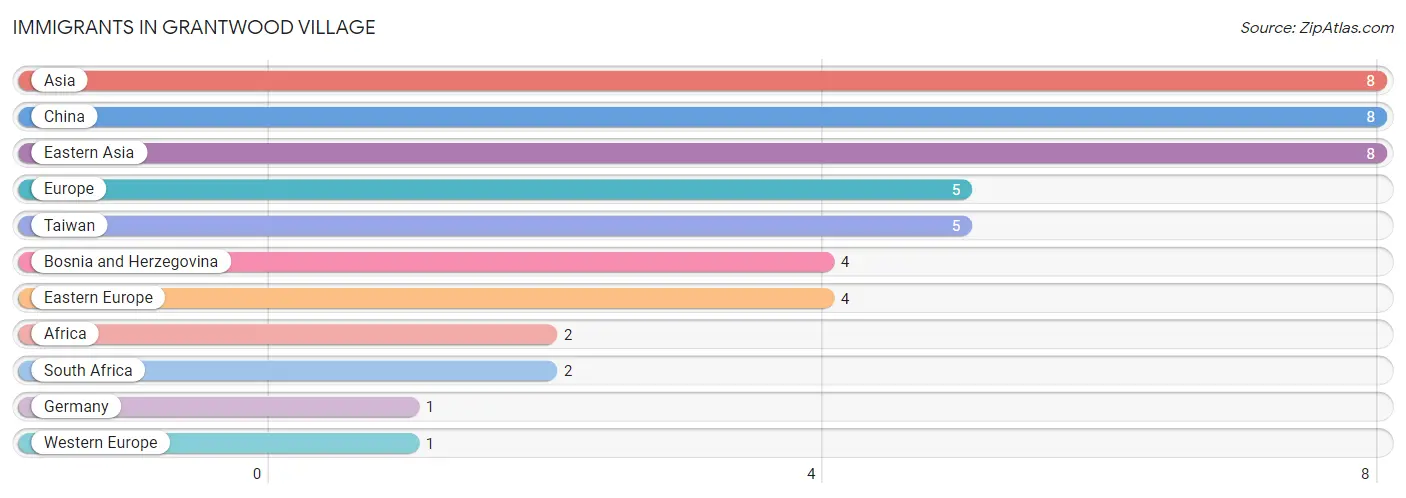
Immigrants in Grantwood Village
The most numerous immigrant groups reported in Grantwood Village came from Asia (8 | 0.9%), China (8 | 0.9%), Eastern Asia (8 | 0.9%), Europe (5 | 0.5%), and Taiwan (5 | 0.5%), together accounting for 3.7% of all Grantwood Village residents.
| Immigration Origin | # Population | % Population |
| Africa | 2 | 0.2% |
| Asia | 8 | 0.9% |
| Bosnia and Herzegovina | 4 | 0.4% |
| China | 8 | 0.9% |
| Eastern Asia | 8 | 0.9% |
| Eastern Europe | 4 | 0.4% |
| Europe | 5 | 0.5% |
| Germany | 1 | 0.1% |
| South Africa | 2 | 0.2% |
| Taiwan | 5 | 0.5% |
| Western Europe | 1 | 0.1% | View All 11 Rows |
Sex and Age in Grantwood Village
Sex and Age in Grantwood Village
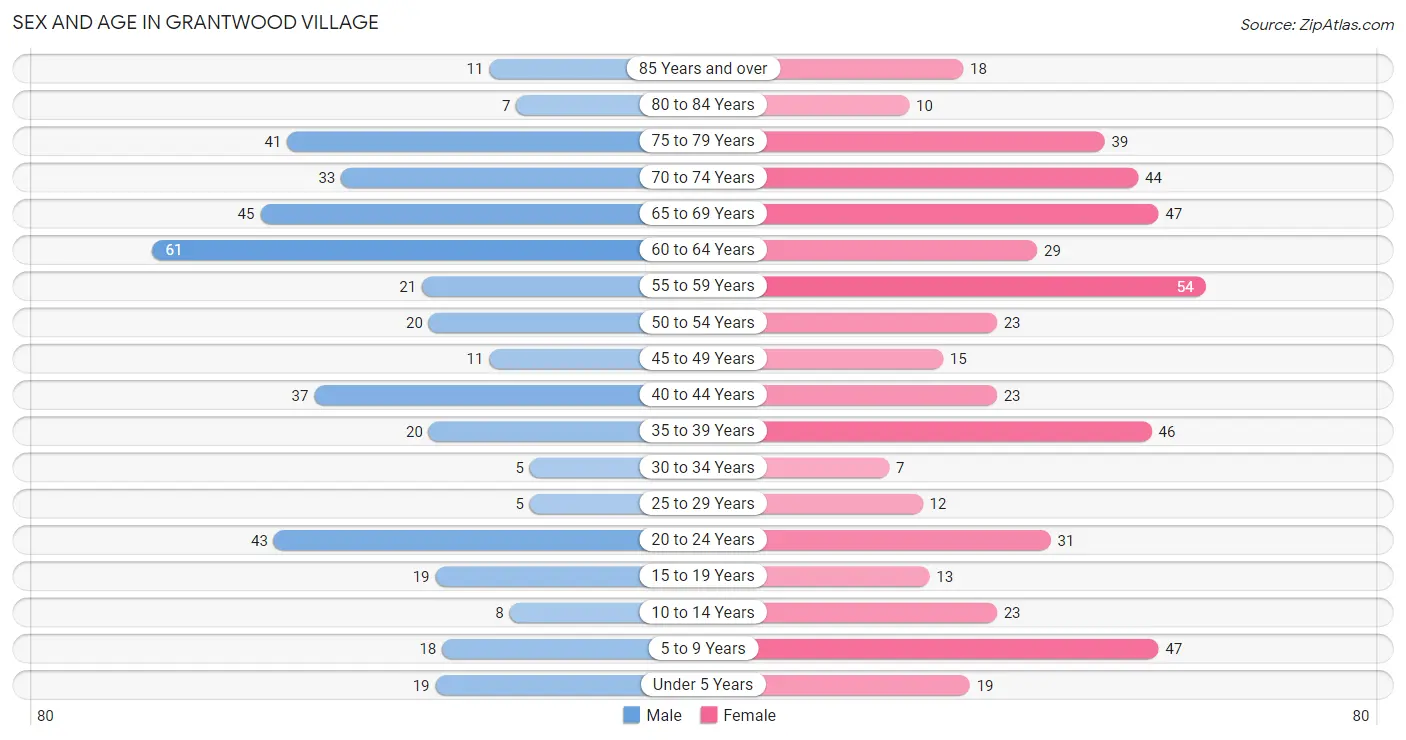
The most populous age groups in Grantwood Village are 60 to 64 Years (61 | 14.4%) for men and 55 to 59 Years (54 | 10.8%) for women.
| Age Bracket | Male | Female |
| Under 5 Years | 19 (4.5%) | 19 (3.8%) |
| 5 to 9 Years | 18 (4.3%) | 47 (9.4%) |
| 10 to 14 Years | 8 (1.9%) | 23 (4.6%) |
| 15 to 19 Years | 19 (4.5%) | 13 (2.6%) |
| 20 to 24 Years | 43 (10.1%) | 31 (6.2%) |
| 25 to 29 Years | 5 (1.2%) | 12 (2.4%) |
| 30 to 34 Years | 5 (1.2%) | 7 (1.4%) |
| 35 to 39 Years | 20 (4.7%) | 46 (9.2%) |
| 40 to 44 Years | 37 (8.7%) | 23 (4.6%) |
| 45 to 49 Years | 11 (2.6%) | 15 (3.0%) |
| 50 to 54 Years | 20 (4.7%) | 23 (4.6%) |
| 55 to 59 Years | 21 (5.0%) | 54 (10.8%) |
| 60 to 64 Years | 61 (14.4%) | 29 (5.8%) |
| 65 to 69 Years | 45 (10.6%) | 47 (9.4%) |
| 70 to 74 Years | 33 (7.8%) | 44 (8.8%) |
| 75 to 79 Years | 41 (9.7%) | 39 (7.8%) |
| 80 to 84 Years | 7 (1.7%) | 10 (2.0%) |
| 85 Years and over | 11 (2.6%) | 18 (3.6%) |
| Total | 424 (100.0%) | 500 (100.0%) |
Families and Households in Grantwood Village
Median Family Size in Grantwood Village
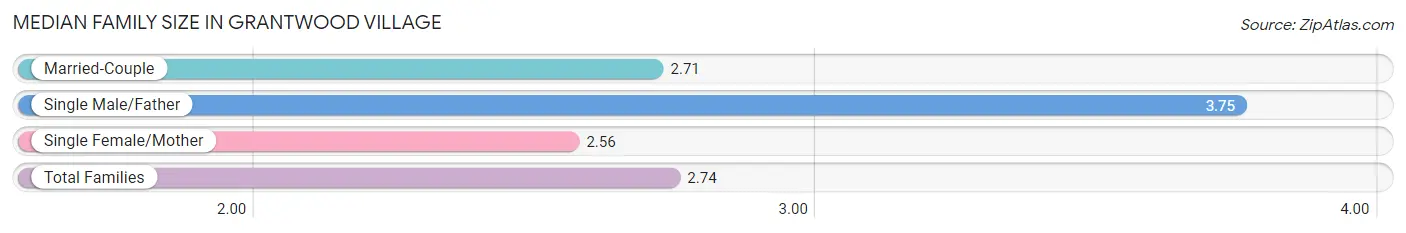
The median family size in Grantwood Village is 2.74 persons per family, with single male/father families (12 | 4.0%) accounting for the largest median family size of 3.75 persons per family. On the other hand, single female/mother families (25 | 8.2%) represent the smallest median family size with 2.56 persons per family.
| Family Type | # Families | Family Size |
| Married-Couple | 267 (87.8%) | 2.71 |
| Single Male/Father | 12 (4.0%) | 3.75 |
| Single Female/Mother | 25 (8.2%) | 2.56 |
| Total Families | 304 (100.0%) | 2.74 |
Median Household Size in Grantwood Village
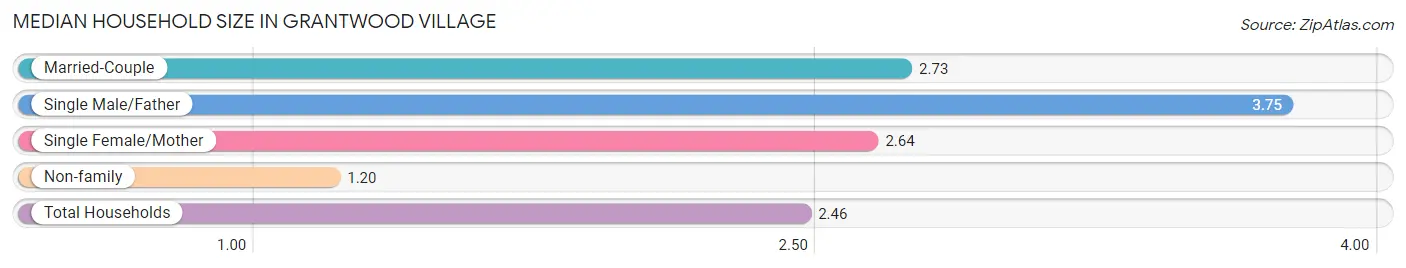
The median household size in Grantwood Village is 2.46 persons per household, with single male/father households (12 | 3.2%) accounting for the largest median household size of 3.75 persons per household. non-family households (71 | 18.9%) represent the smallest median household size with 1.20 persons per household.
| Household Type | # Households | Household Size |
| Married-Couple | 267 (71.2%) | 2.73 |
| Single Male/Father | 12 (3.2%) | 3.75 |
| Single Female/Mother | 25 (6.7%) | 2.64 |
| Non-family | 71 (18.9%) | 1.20 |
| Total Households | 375 (100.0%) | 2.46 |
Household Size by Marriage Status in Grantwood Village
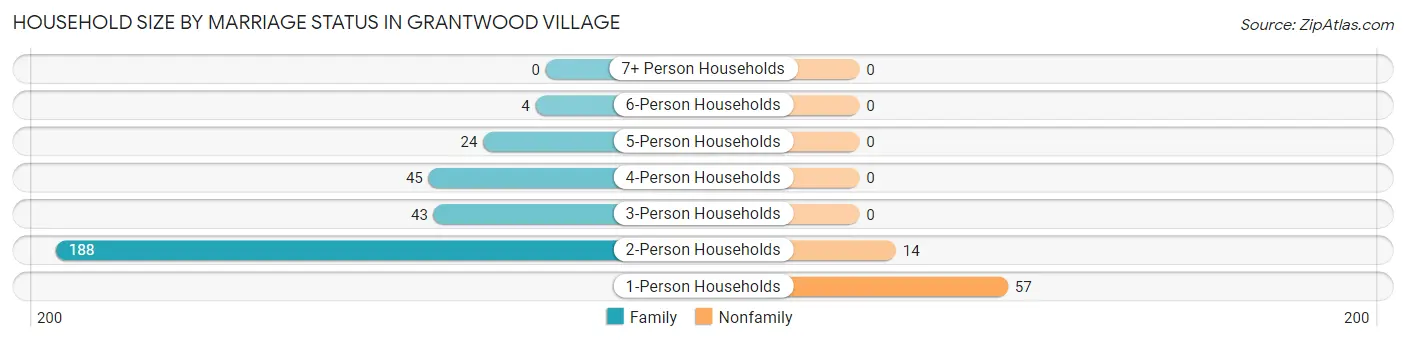
Out of a total of 375 households in Grantwood Village, 304 (81.1%) are family households, while 71 (18.9%) are nonfamily households. The most numerous type of family households are 2-person households, comprising 188, and the most common type of nonfamily households are 1-person households, comprising 57.
| Household Size | Family Households | Nonfamily Households |
| 1-Person Households | - | 57 (15.2%) |
| 2-Person Households | 188 (50.1%) | 14 (3.7%) |
| 3-Person Households | 43 (11.5%) | 0 (0.0%) |
| 4-Person Households | 45 (12.0%) | 0 (0.0%) |
| 5-Person Households | 24 (6.4%) | 0 (0.0%) |
| 6-Person Households | 4 (1.1%) | 0 (0.0%) |
| 7+ Person Households | 0 (0.0%) | 0 (0.0%) |
| Total | 304 (81.1%) | 71 (18.9%) |
Female Fertility in Grantwood Village
Fertility by Age in Grantwood Village
Average fertility rate in Grantwood Village is 27.0 births per 1,000 women. Women in the age bracket of 35 to 50 years have the highest fertility rate with 47.0 births per 1,000 women. Women in the age bracket of 35 to 50 years acount for 100.0% of all women with births.
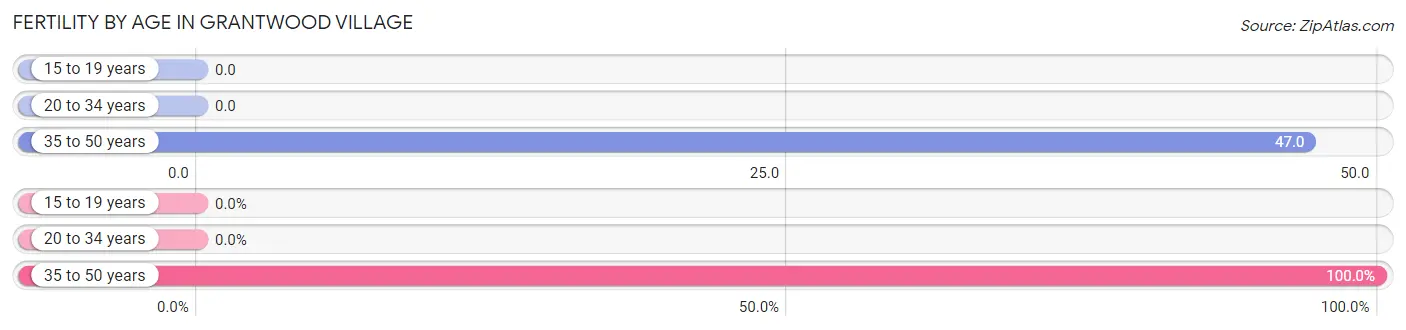
| Age Bracket | Women with Births | Births / 1,000 Women |
| 15 to 19 years | 0 (0.0%) | 0.0 |
| 20 to 34 years | 0 (0.0%) | 0.0 |
| 35 to 50 years | 4 (100.0%) | 47.0 |
| Total | 4 (100.0%) | 27.0 |
Fertility by Age by Marriage Status in Grantwood Village
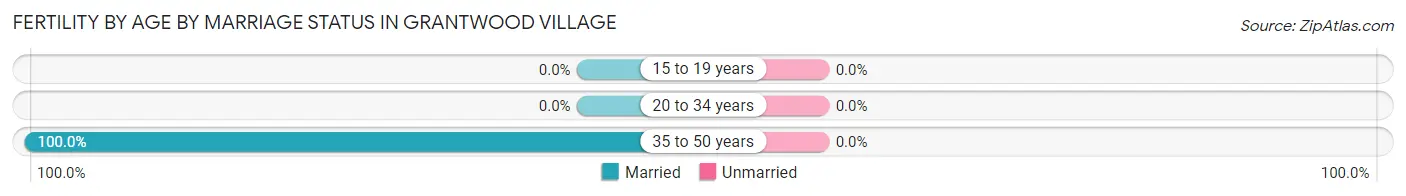
| Age Bracket | Married | Unmarried |
| 15 to 19 years | 0 (0.0%) | 0 (0.0%) |
| 20 to 34 years | 0 (0.0%) | 0 (0.0%) |
| 35 to 50 years | 4 (100.0%) | 0 (0.0%) |
| Total | 4 (100.0%) | 0 (0.0%) |
Fertility by Education in Grantwood Village
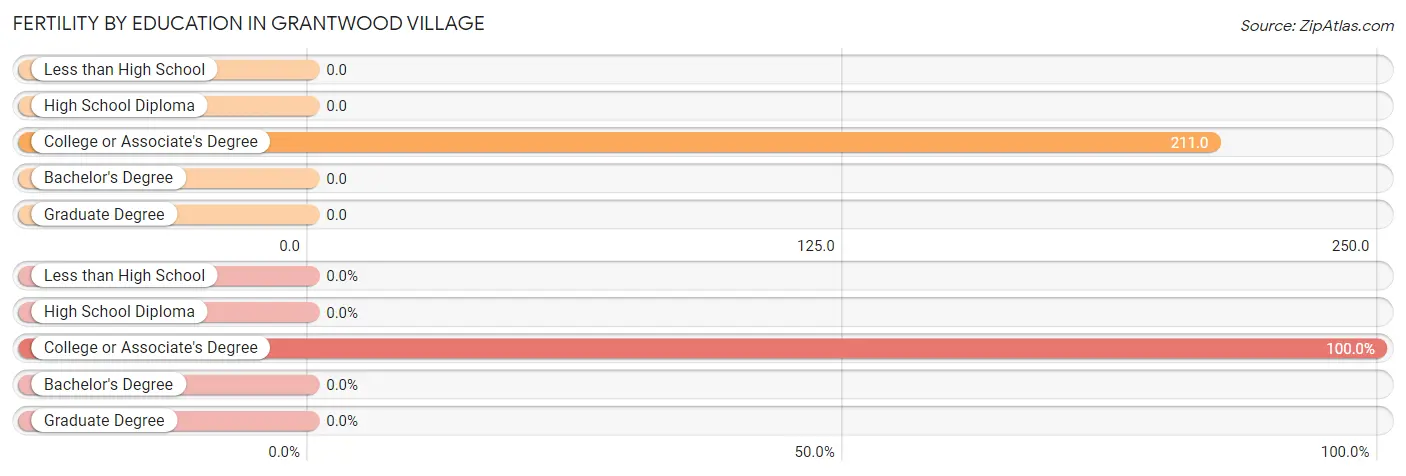
| Educational Attainment | Women with Births | Births / 1,000 Women |
| Less than High School | 0 (0.0%) | 0.0 |
| High School Diploma | 0 (0.0%) | 0.0 |
| College or Associate's Degree | 4 (100.0%) | 211.0 |
| Bachelor's Degree | 0 (0.0%) | 0.0 |
| Graduate Degree | 0 (0.0%) | 0.0 |
| Total | 4 (100.0%) | 27.0 |
Fertility by Education by Marriage Status in Grantwood Village
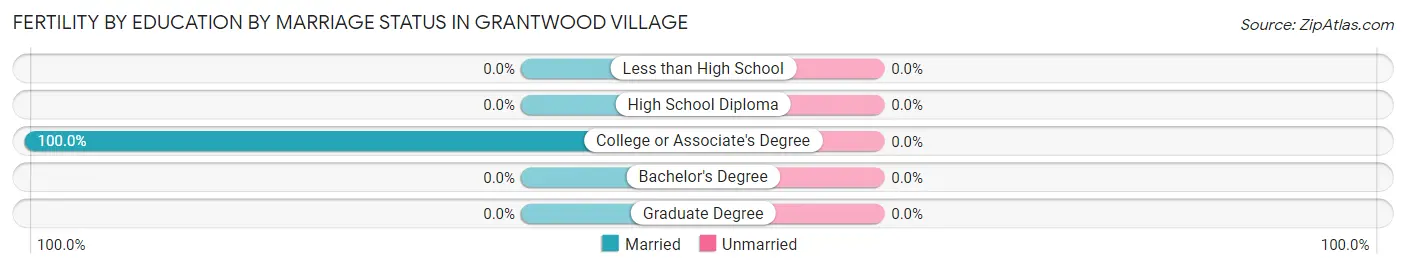
| Educational Attainment | Married | Unmarried |
| Less than High School | 0 (0.0%) | 0 (0.0%) |
| High School Diploma | 0 (0.0%) | 0 (0.0%) |
| College or Associate's Degree | 4 (100.0%) | 0 (0.0%) |
| Bachelor's Degree | 0 (0.0%) | 0 (0.0%) |
| Graduate Degree | 0 (0.0%) | 0 (0.0%) |
| Total | 4 (100.0%) | 0 (0.0%) |
Income in Grantwood Village
Income Overview in Grantwood Village
Per Capita Income in Grantwood Village is $73,908, while median incomes of families and households are $143,947 and $131,250 respectively.
| Characteristic | Number | Measure |
| Per Capita Income | 924 | $73,908 |
| Median Family Income | 304 | $143,947 |
| Mean Family Income | 304 | $195,397 |
| Median Household Income | 375 | $131,250 |
| Mean Household Income | 375 | $176,625 |
| Income Deficit | 304 | $0 |
| Wage / Income Gap (%) | 924 | 47.46% |
| Wage / Income Gap ($) | 924 | 52.54¢ per $1 |
| Gini / Inequality Index | 924 | 0.41 |
Earnings by Sex in Grantwood Village
Average Earnings in Grantwood Village are $55,500, $76,818 for men and $40,357 for women, a difference of 47.5%.
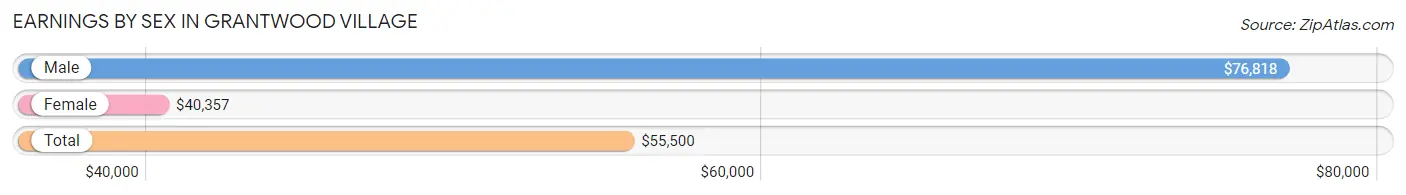
| Sex | Number | Average Earnings |
| Male | 272 (51.5%) | $76,818 |
| Female | 256 (48.5%) | $40,357 |
| Total | 528 (100.0%) | $55,500 |
Earnings by Sex by Income Bracket in Grantwood Village
The most common earnings brackets in Grantwood Village are $100,000+ for men (90 | 33.1%) and $100,000+ for women (71 | 27.7%).
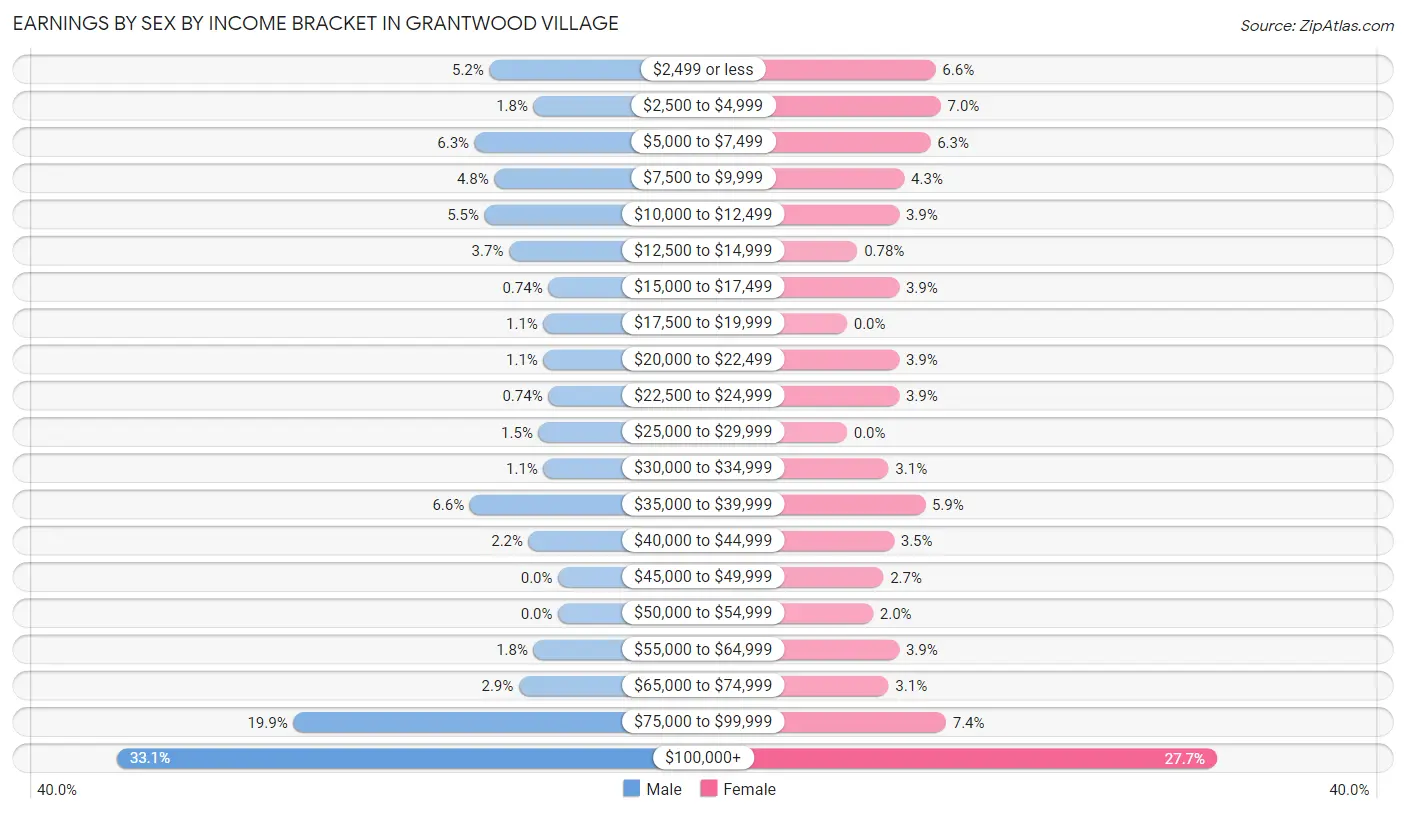
| Income | Male | Female |
| $2,499 or less | 14 (5.1%) | 17 (6.6%) |
| $2,500 to $4,999 | 5 (1.8%) | 18 (7.0%) |
| $5,000 to $7,499 | 17 (6.2%) | 16 (6.2%) |
| $7,500 to $9,999 | 13 (4.8%) | 11 (4.3%) |
| $10,000 to $12,499 | 15 (5.5%) | 10 (3.9%) |
| $12,500 to $14,999 | 10 (3.7%) | 2 (0.8%) |
| $15,000 to $17,499 | 2 (0.7%) | 10 (3.9%) |
| $17,500 to $19,999 | 3 (1.1%) | 0 (0.0%) |
| $20,000 to $22,499 | 3 (1.1%) | 10 (3.9%) |
| $22,500 to $24,999 | 2 (0.7%) | 10 (3.9%) |
| $25,000 to $29,999 | 4 (1.5%) | 0 (0.0%) |
| $30,000 to $34,999 | 3 (1.1%) | 8 (3.1%) |
| $35,000 to $39,999 | 18 (6.6%) | 15 (5.9%) |
| $40,000 to $44,999 | 6 (2.2%) | 9 (3.5%) |
| $45,000 to $49,999 | 0 (0.0%) | 7 (2.7%) |
| $50,000 to $54,999 | 0 (0.0%) | 5 (1.9%) |
| $55,000 to $64,999 | 5 (1.8%) | 10 (3.9%) |
| $65,000 to $74,999 | 8 (2.9%) | 8 (3.1%) |
| $75,000 to $99,999 | 54 (19.9%) | 19 (7.4%) |
| $100,000+ | 90 (33.1%) | 71 (27.7%) |
| Total | 272 (100.0%) | 256 (100.0%) |
Earnings by Sex by Educational Attainment in Grantwood Village
Average earnings in Grantwood Village are $89,861 for men and $45,357 for women, a difference of 49.5%. Men with an educational attainment of graduate degree enjoy the highest average annual earnings of $94,250, while those with college or associate's degree education earn the least with $86,875. Women with an educational attainment of graduate degree earn the most with the average annual earnings of $78,750, while those with high school diploma education have the smallest earnings of $5,625.
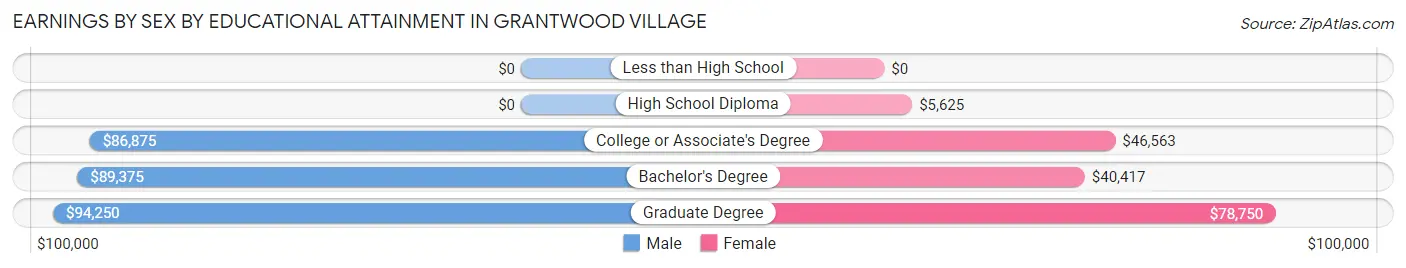
| Educational Attainment | Male Income | Female Income |
| Less than High School | - | - |
| High School Diploma | - | - |
| College or Associate's Degree | $86,875 | $46,563 |
| Bachelor's Degree | $89,375 | $40,417 |
| Graduate Degree | $94,250 | $78,750 |
| Total | $89,861 | $45,357 |
Family Income in Grantwood Village
Family Income Brackets in Grantwood Village
According to the Grantwood Village family income data, there are 106 families falling into the $200,000+ income range, which is the most common income bracket and makes up 34.9% of all families.
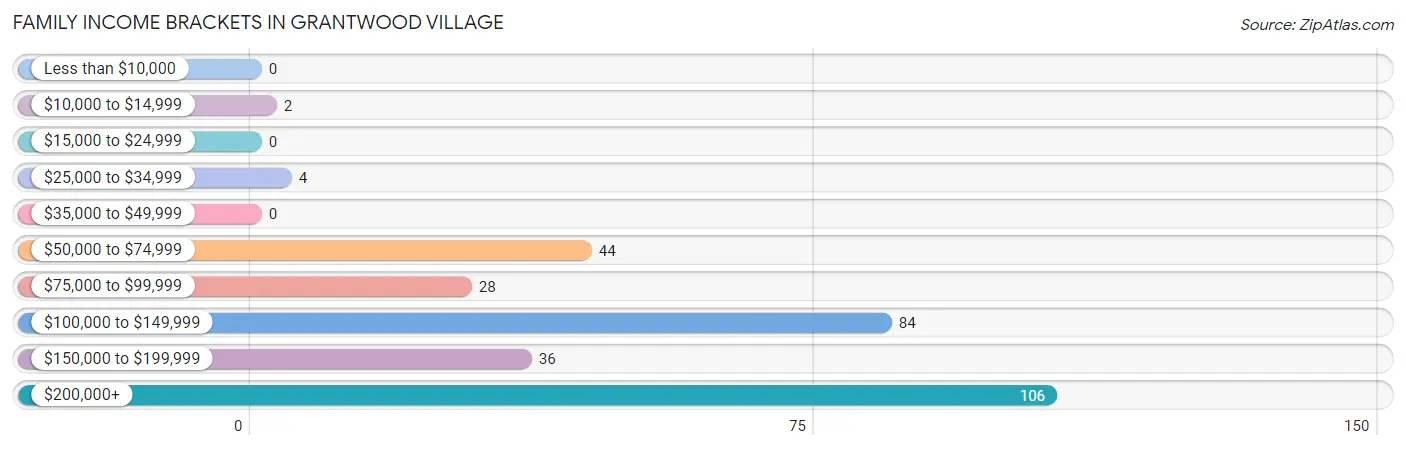
| Income Bracket | # Families | % Families |
| Less than $10,000 | 0 | 0.0% |
| $10,000 to $14,999 | 2 | 0.7% |
| $15,000 to $24,999 | 0 | 0.0% |
| $25,000 to $34,999 | 4 | 1.3% |
| $35,000 to $49,999 | 0 | 0.0% |
| $50,000 to $74,999 | 44 | 14.5% |
| $75,000 to $99,999 | 28 | 9.2% |
| $100,000 to $149,999 | 84 | 27.6% |
| $150,000 to $199,999 | 36 | 11.8% |
| $200,000+ | 106 | 34.9% |
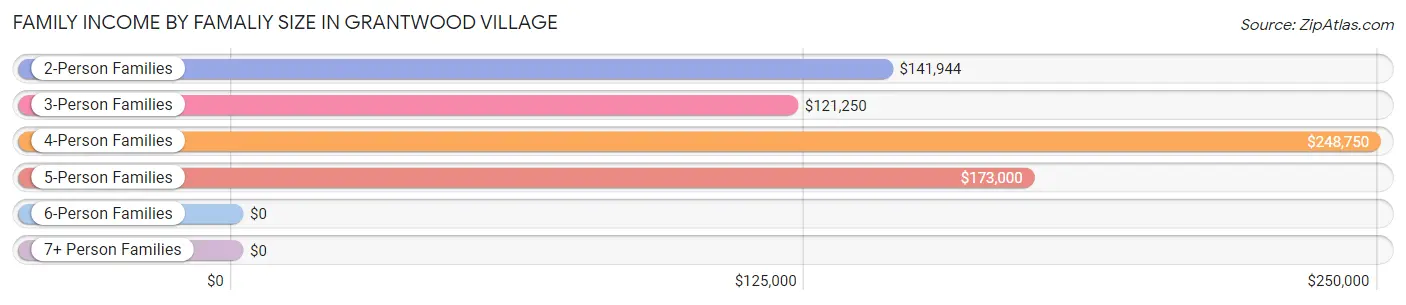
Family Income by Famaliy Size in Grantwood Village
4-person families (44 | 14.5%) account for the highest median family income in Grantwood Village with $248,750 per family, while 2-person families (188 | 61.8%) have the highest median income of $70,972 per family member.
| Income Bracket | # Families | Median Income |
| 2-Person Families | 188 (61.8%) | $141,944 |
| 3-Person Families | 44 (14.5%) | $121,250 |
| 4-Person Families | 44 (14.5%) | $248,750 |
| 5-Person Families | 28 (9.2%) | $173,000 |
| 6-Person Families | 0 (0.0%) | $0 |
| 7+ Person Families | 0 (0.0%) | $0 |
| Total | 304 (100.0%) | $143,947 |
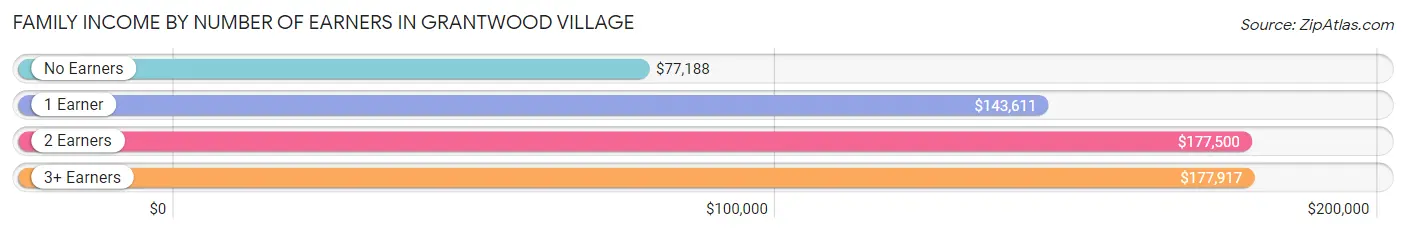
Family Income by Number of Earners in Grantwood Village
The median family income in Grantwood Village is $143,947, with families comprising 3+ earners (27) having the highest median family income of $177,917, while families with no earners (47) have the lowest median family income of $77,188, accounting for 8.9% and 15.5% of families, respectively.
| Number of Earners | # Families | Median Income |
| No Earners | 47 (15.5%) | $77,188 |
| 1 Earner | 76 (25.0%) | $143,611 |
| 2 Earners | 154 (50.7%) | $177,500 |
| 3+ Earners | 27 (8.9%) | $177,917 |
| Total | 304 (100.0%) | $143,947 |
Household Income in Grantwood Village
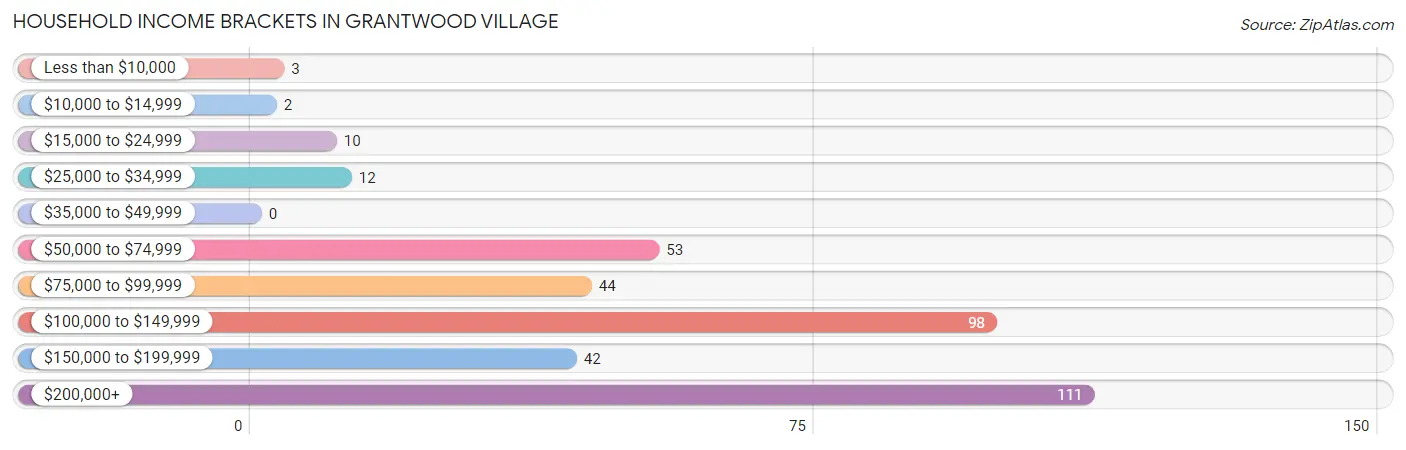
Household Income Brackets in Grantwood Village
With 111 households falling in the category, the $200,000+ income range is the most frequent in Grantwood Village, accounting for 29.6% of all households.
| Income Bracket | # Households | % Households |
| Less than $10,000 | 3 | 0.8% |
| $10,000 to $14,999 | 2 | 0.5% |
| $15,000 to $24,999 | 10 | 2.7% |
| $25,000 to $34,999 | 12 | 3.2% |
| $35,000 to $49,999 | 0 | 0.0% |
| $50,000 to $74,999 | 53 | 14.1% |
| $75,000 to $99,999 | 44 | 11.7% |
| $100,000 to $149,999 | 98 | 26.1% |
| $150,000 to $199,999 | 42 | 11.2% |
| $200,000+ | 111 | 29.6% |
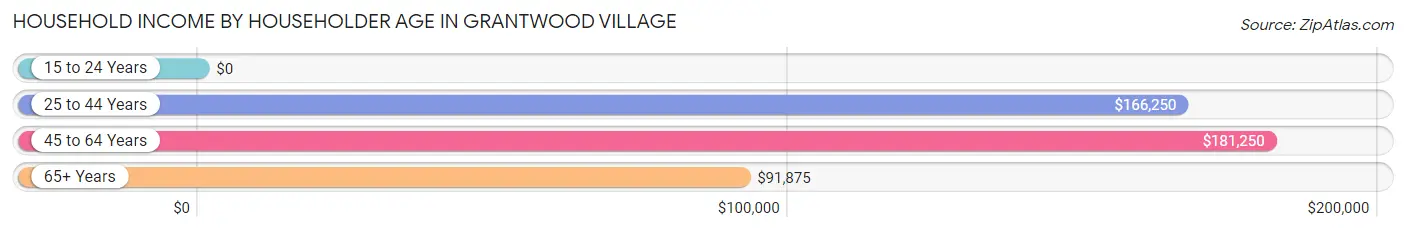
Household Income by Householder Age in Grantwood Village
The median household income in Grantwood Village is $131,250, with the highest median household income of $181,250 found in the 45 to 64 years age bracket for the primary householder. A total of 130 households (34.7%) fall into this category.
| Income Bracket | # Households | Median Income |
| 15 to 24 Years | 0 (0.0%) | $0 |
| 25 to 44 Years | 76 (20.3%) | $166,250 |
| 45 to 64 Years | 130 (34.7%) | $181,250 |
| 65+ Years | 169 (45.1%) | $91,875 |
| Total | 375 (100.0%) | $131,250 |
Poverty in Grantwood Village
Income Below Poverty by Sex and Age in Grantwood Village
With 0.7% poverty level for males and 2.6% for females among the residents of Grantwood Village, 55 to 64 year old males and 18 to 24 year old females are the most vulnerable to poverty, with 2 males (2.4%) and 5 females (15.1%) in their respective age groups living below the poverty level.
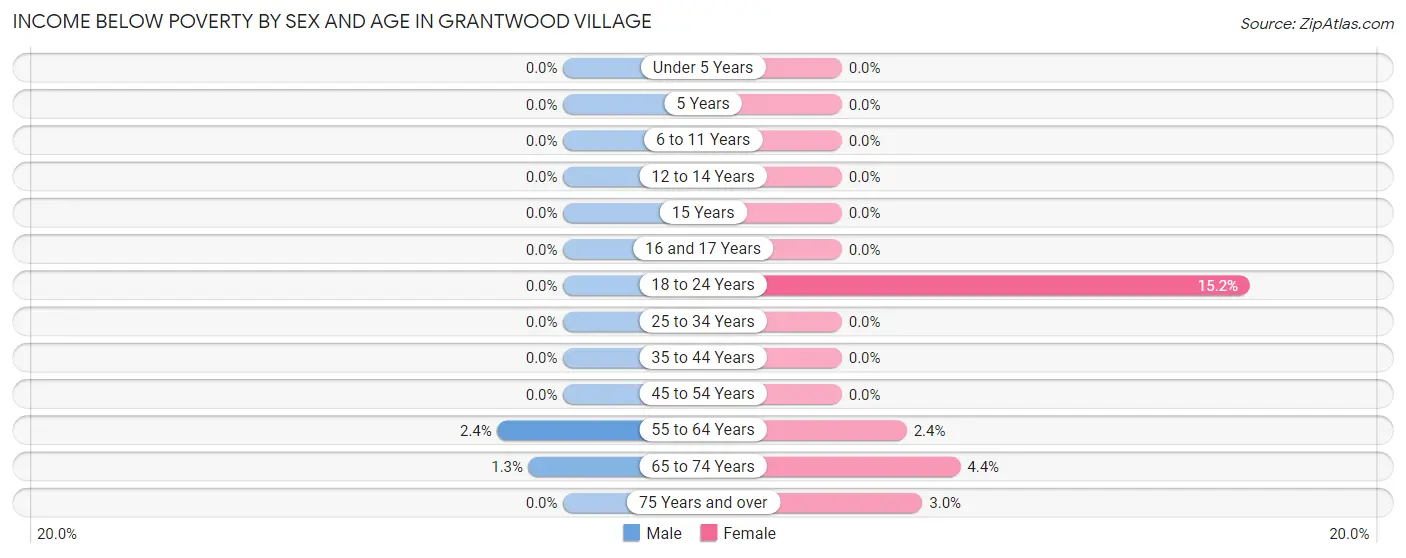
| Age Bracket | Male | Female |
| Under 5 Years | 0 (0.0%) | 0 (0.0%) |
| 5 Years | 0 (0.0%) | 0 (0.0%) |
| 6 to 11 Years | 0 (0.0%) | 0 (0.0%) |
| 12 to 14 Years | 0 (0.0%) | 0 (0.0%) |
| 15 Years | 0 (0.0%) | 0 (0.0%) |
| 16 and 17 Years | 0 (0.0%) | 0 (0.0%) |
| 18 to 24 Years | 0 (0.0%) | 5 (15.1%) |
| 25 to 34 Years | 0 (0.0%) | 0 (0.0%) |
| 35 to 44 Years | 0 (0.0%) | 0 (0.0%) |
| 45 to 54 Years | 0 (0.0%) | 0 (0.0%) |
| 55 to 64 Years | 2 (2.4%) | 2 (2.4%) |
| 65 to 74 Years | 1 (1.3%) | 4 (4.4%) |
| 75 Years and over | 0 (0.0%) | 2 (3.0%) |
| Total | 3 (0.7%) | 13 (2.6%) |
Income Above Poverty by Sex and Age in Grantwood Village
According to the poverty statistics in Grantwood Village, males aged under 5 years and females aged under 5 years are the age groups that are most secure financially, with 100.0% of males and 100.0% of females in these age groups living above the poverty line.
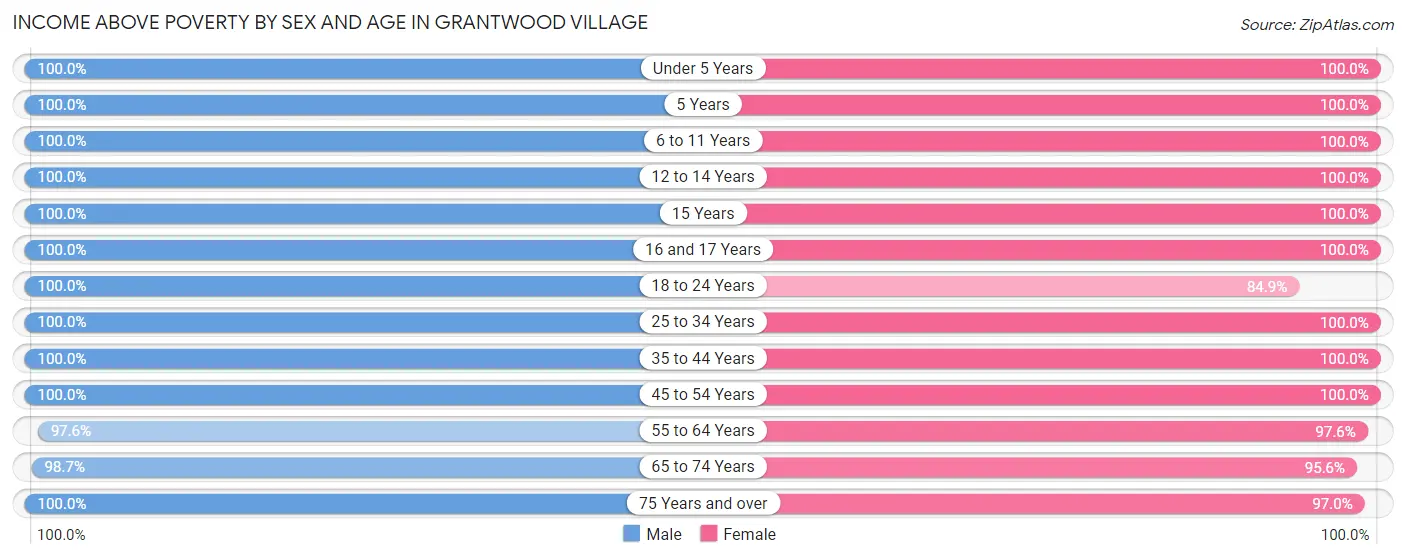
| Age Bracket | Male | Female |
| Under 5 Years | 19 (100.0%) | 19 (100.0%) |
| 5 Years | 3 (100.0%) | 11 (100.0%) |
| 6 to 11 Years | 21 (100.0%) | 48 (100.0%) |
| 12 to 14 Years | 2 (100.0%) | 11 (100.0%) |
| 15 Years | 9 (100.0%) | 6 (100.0%) |
| 16 and 17 Years | 8 (100.0%) | 5 (100.0%) |
| 18 to 24 Years | 45 (100.0%) | 28 (84.9%) |
| 25 to 34 Years | 10 (100.0%) | 19 (100.0%) |
| 35 to 44 Years | 57 (100.0%) | 69 (100.0%) |
| 45 to 54 Years | 31 (100.0%) | 38 (100.0%) |
| 55 to 64 Years | 80 (97.6%) | 81 (97.6%) |
| 65 to 74 Years | 77 (98.7%) | 87 (95.6%) |
| 75 Years and over | 59 (100.0%) | 65 (97.0%) |
| Total | 421 (99.3%) | 487 (97.4%) |
Income Below Poverty Among Married-Couple Families in Grantwood Village
The poverty statistics for married-couple families in Grantwood Village show that 0.7% or 2 of the total 267 families live below the poverty line. Families with no children have the highest poverty rate of 1.0%, comprising of 2 families. On the other hand, families with 1 or 2 children have the lowest poverty rate of 0.0%, which includes 0 families.
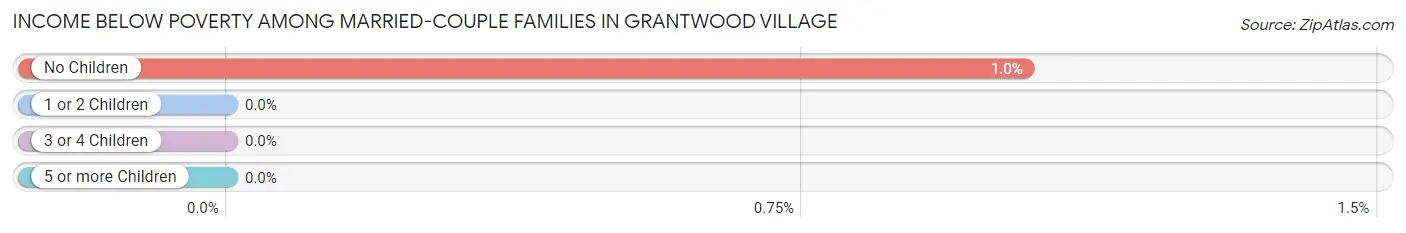
| Children | Above Poverty | Below Poverty |
| No Children | 190 (99.0%) | 2 (1.0%) |
| 1 or 2 Children | 55 (100.0%) | 0 (0.0%) |
| 3 or 4 Children | 20 (100.0%) | 0 (0.0%) |
| 5 or more Children | 0 (0.0%) | 0 (0.0%) |
| Total | 265 (99.3%) | 2 (0.7%) |
Income Below Poverty Among Single-Parent Households in Grantwood Village
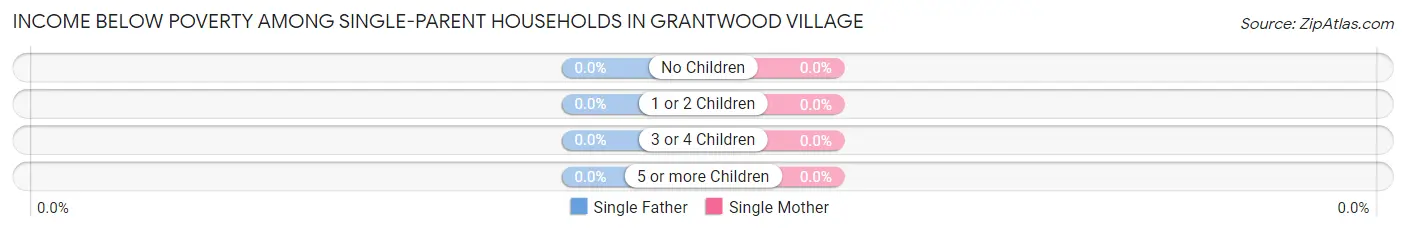
| Children | Single Father | Single Mother |
| No Children | 0 (0.0%) | 0 (0.0%) |
| 1 or 2 Children | 0 (0.0%) | 0 (0.0%) |
| 3 or 4 Children | 0 (0.0%) | 0 (0.0%) |
| 5 or more Children | 0 (0.0%) | 0 (0.0%) |
| Total | 0 (0.0%) | 0 (0.0%) |
Income Below Poverty Among Married-Couple vs Single-Parent Households in Grantwood Village
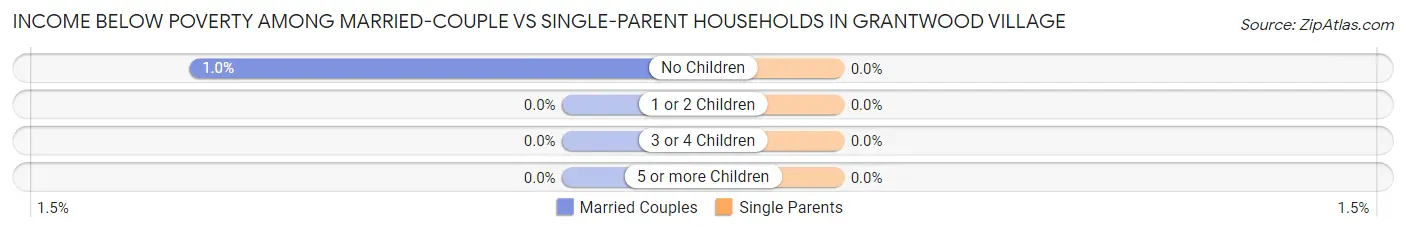
| Children | Married-Couple Families | Single-Parent Households |
| No Children | 2 (1.0%) | 0 (0.0%) |
| 1 or 2 Children | 0 (0.0%) | 0 (0.0%) |
| 3 or 4 Children | 0 (0.0%) | 0 (0.0%) |
| 5 or more Children | 0 (0.0%) | 0 (0.0%) |
| Total | 2 (0.7%) | 0 (0.0%) |
Employment Characteristics in Grantwood Village
Employment by Class of Employer in Grantwood Village
Among the 461 employed individuals in Grantwood Village, private company employees (269 | 58.4%), not-for-profit organizations (86 | 18.7%), and self-employed (incorporated) (38 | 8.2%) make up the most common classes of employment.
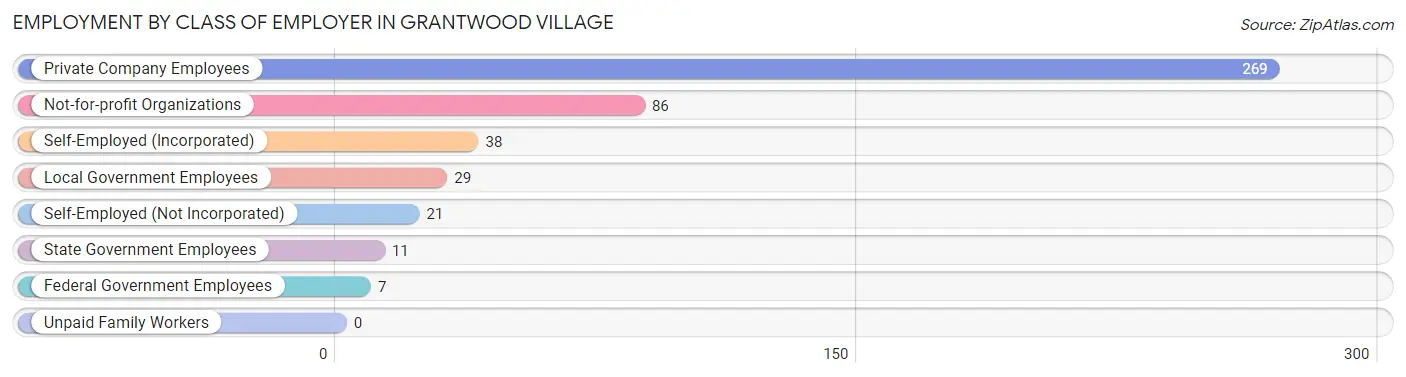
| Employer Class | # Employees | % Employees |
| Private Company Employees | 269 | 58.4% |
| Self-Employed (Incorporated) | 38 | 8.2% |
| Self-Employed (Not Incorporated) | 21 | 4.6% |
| Not-for-profit Organizations | 86 | 18.7% |
| Local Government Employees | 29 | 6.3% |
| State Government Employees | 11 | 2.4% |
| Federal Government Employees | 7 | 1.5% |
| Unpaid Family Workers | 0 | 0.0% |
| Total | 461 | 100.0% |
Employment Status by Age in Grantwood Village
According to the labor force statistics for Grantwood Village, out of the total population over 16 years of age (775), 61.0% or 473 individuals are in the labor force, with 2.5% or 12 of them unemployed. The age group with the highest labor force participation rate is 25 to 29 years, with 100.0% or 17 individuals in the labor force. Within the labor force, the 25 to 29 years age range has the highest percentage of unemployed individuals, with 23.5% or 4 of them being unemployed.
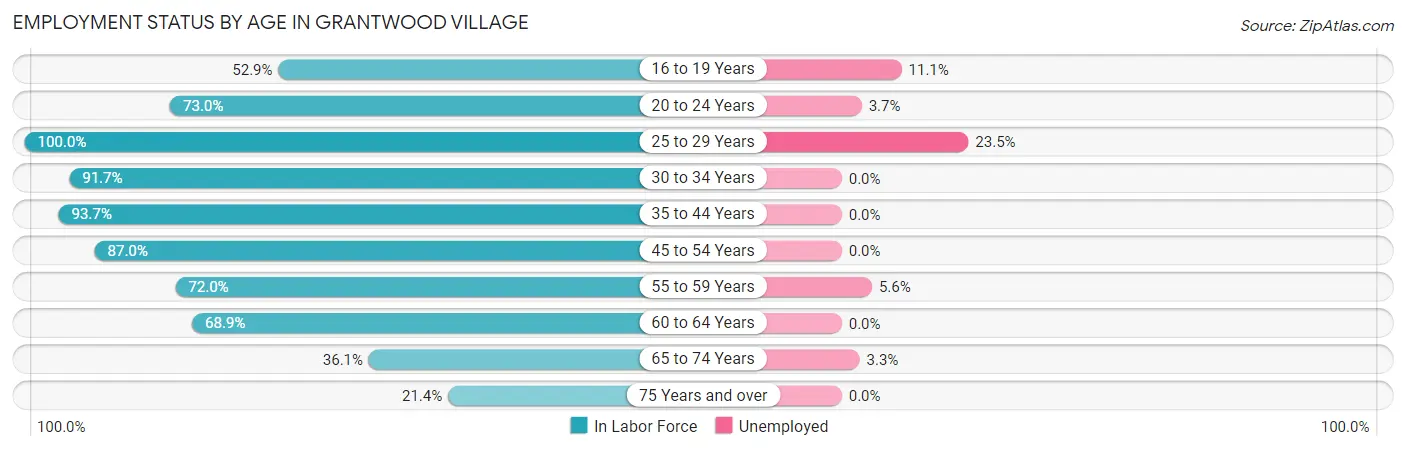
| Age Bracket | In Labor Force | Unemployed |
| 16 to 19 Years | 9 (52.9%) | 1 (11.1%) |
| 20 to 24 Years | 54 (73.0%) | 2 (3.7%) |
| 25 to 29 Years | 17 (100.0%) | 4 (23.5%) |
| 30 to 34 Years | 11 (91.7%) | 0 (0.0%) |
| 35 to 44 Years | 118 (93.7%) | 0 (0.0%) |
| 45 to 54 Years | 60 (87.0%) | 0 (0.0%) |
| 55 to 59 Years | 54 (72.0%) | 3 (5.6%) |
| 60 to 64 Years | 62 (68.9%) | 0 (0.0%) |
| 65 to 74 Years | 61 (36.1%) | 2 (3.3%) |
| 75 Years and over | 27 (21.4%) | 0 (0.0%) |
| Total | 473 (61.0%) | 12 (2.5%) |
Employment Status by Educational Attainment in Grantwood Village
According to labor force statistics for Grantwood Village, 82.8% of individuals (322) out of the total population between 25 and 64 years of age (389) are in the labor force, with 2.2% or 7 of them being unemployed. The group with the highest labor force participation rate are those with the educational attainment of less than high school, with 100.0% or 2 individuals in the labor force. Within the labor force, individuals with high school diploma education have the highest percentage of unemployment, with 16.7% or 3 of them being unemployed.
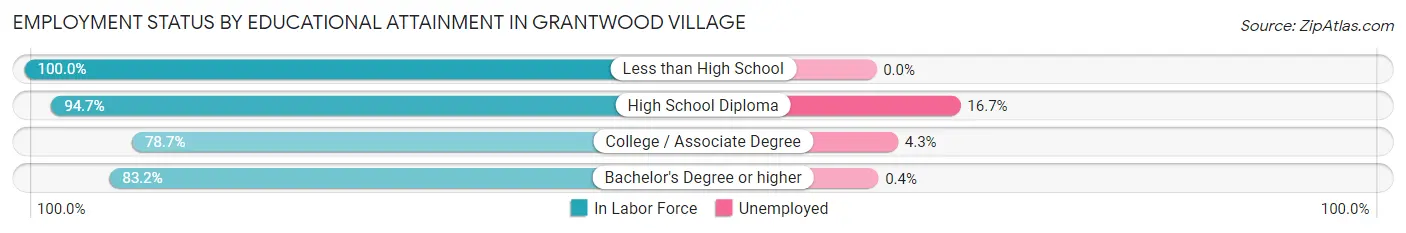
| Educational Attainment | In Labor Force | Unemployed |
| Less than High School | 2 (100.0%) | 0 (0.0%) |
| High School Diploma | 18 (94.7%) | 3 (16.7%) |
| College / Associate Degree | 70 (78.7%) | 4 (4.3%) |
| Bachelor's Degree or higher | 232 (83.2%) | 1 (0.4%) |
| Total | 322 (82.8%) | 9 (2.2%) |
Employment Occupations by Sex in Grantwood Village
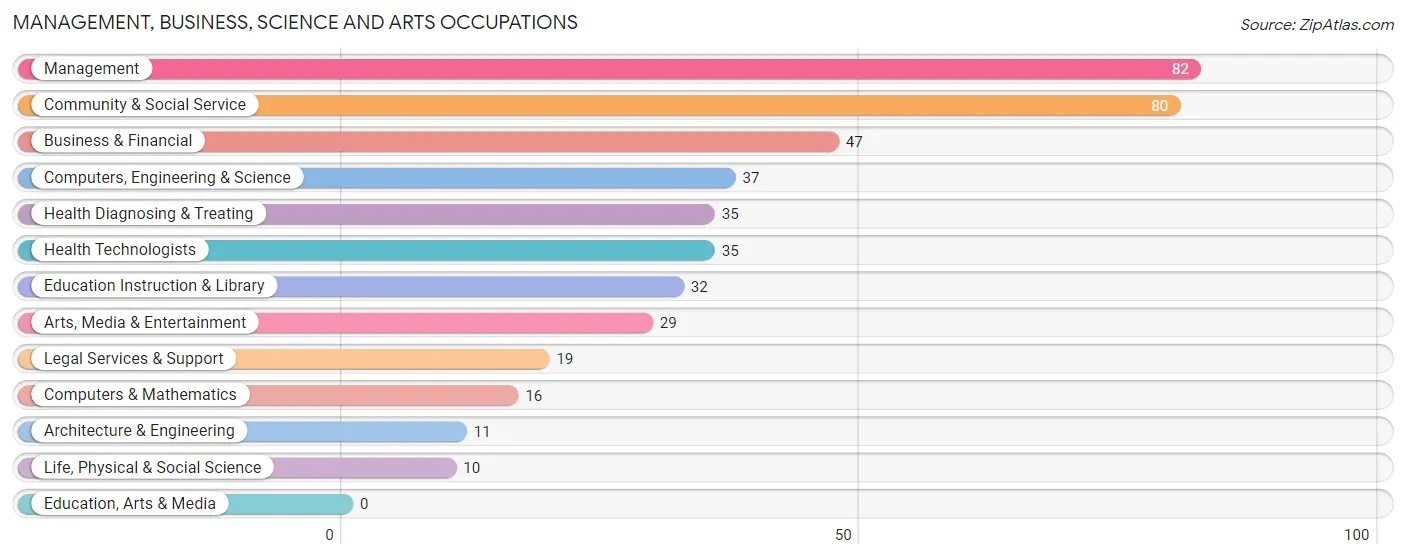
Management, Business, Science and Arts Occupations
The most common Management, Business, Science and Arts occupations in Grantwood Village are Management (82 | 17.8%), Community & Social Service (80 | 17.3%), Business & Financial (47 | 10.2%), Computers, Engineering & Science (37 | 8.0%), and Health Diagnosing & Treating (35 | 7.6%).
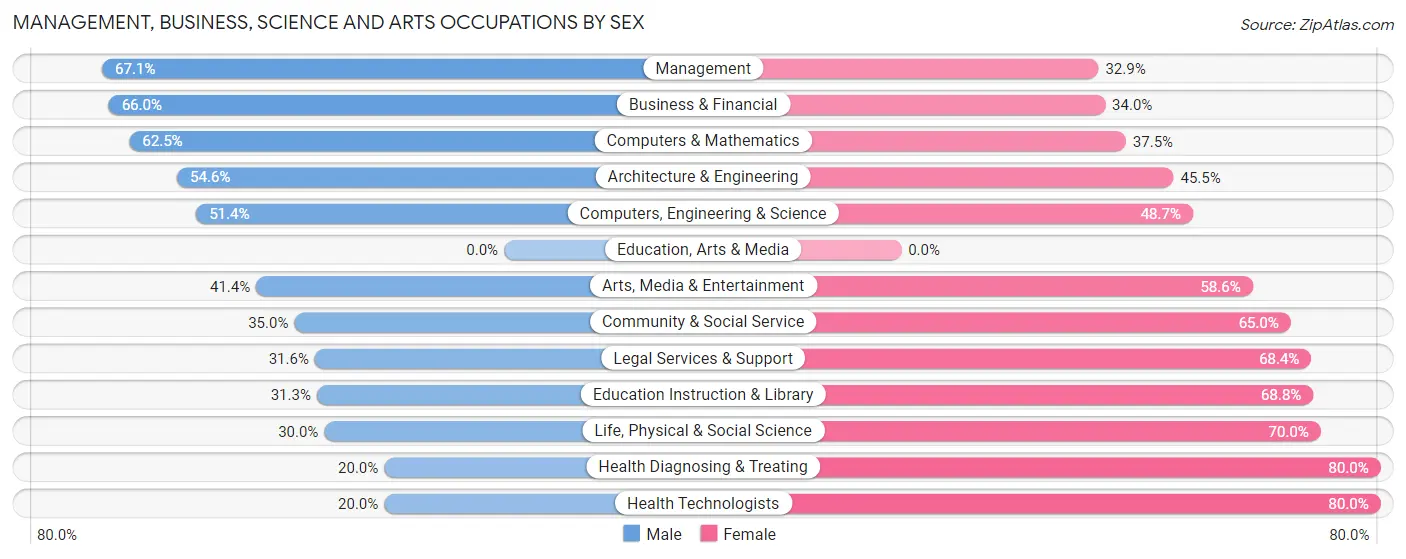
Management, Business, Science and Arts Occupations by Sex
Within the Management, Business, Science and Arts occupations in Grantwood Village, the most male-oriented occupations are Management (67.1%), Business & Financial (66.0%), and Computers & Mathematics (62.5%), while the most female-oriented occupations are Health Diagnosing & Treating (80.0%), Health Technologists (80.0%), and Life, Physical & Social Science (70.0%).
| Occupation | Male | Female |
| Management | 55 (67.1%) | 27 (32.9%) |
| Business & Financial | 31 (66.0%) | 16 (34.0%) |
| Computers, Engineering & Science | 19 (51.3%) | 18 (48.6%) |
| Computers & Mathematics | 10 (62.5%) | 6 (37.5%) |
| Architecture & Engineering | 6 (54.5%) | 5 (45.5%) |
| Life, Physical & Social Science | 3 (30.0%) | 7 (70.0%) |
| Community & Social Service | 28 (35.0%) | 52 (65.0%) |
| Education, Arts & Media | 0 (0.0%) | 0 (0.0%) |
| Legal Services & Support | 6 (31.6%) | 13 (68.4%) |
| Education Instruction & Library | 10 (31.2%) | 22 (68.8%) |
| Arts, Media & Entertainment | 12 (41.4%) | 17 (58.6%) |
| Health Diagnosing & Treating | 7 (20.0%) | 28 (80.0%) |
| Health Technologists | 7 (20.0%) | 28 (80.0%) |
| Total (Category) | 140 (49.8%) | 141 (50.2%) |
| Total (Overall) | 237 (51.4%) | 224 (48.6%) |
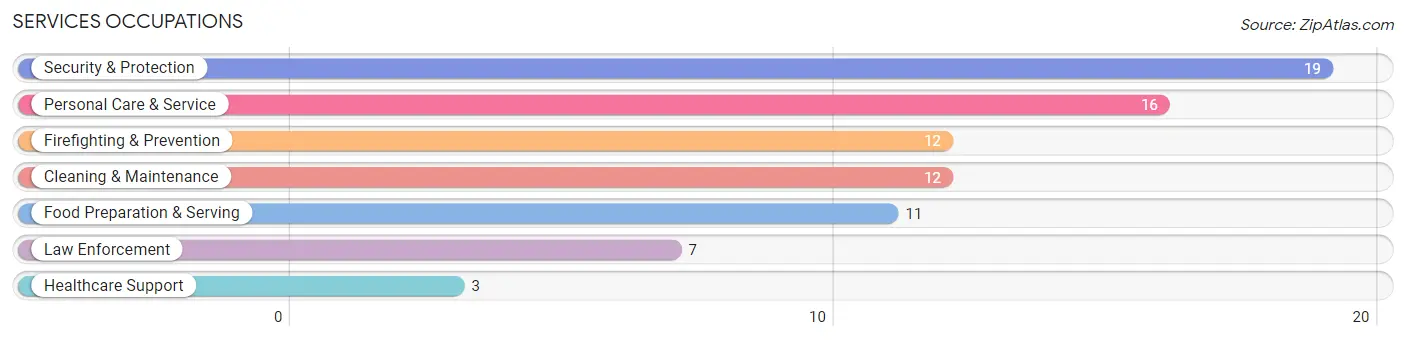
Services Occupations
The most common Services occupations in Grantwood Village are Security & Protection (19 | 4.1%), Personal Care & Service (16 | 3.5%), Firefighting & Prevention (12 | 2.6%), Cleaning & Maintenance (12 | 2.6%), and Food Preparation & Serving (11 | 2.4%).
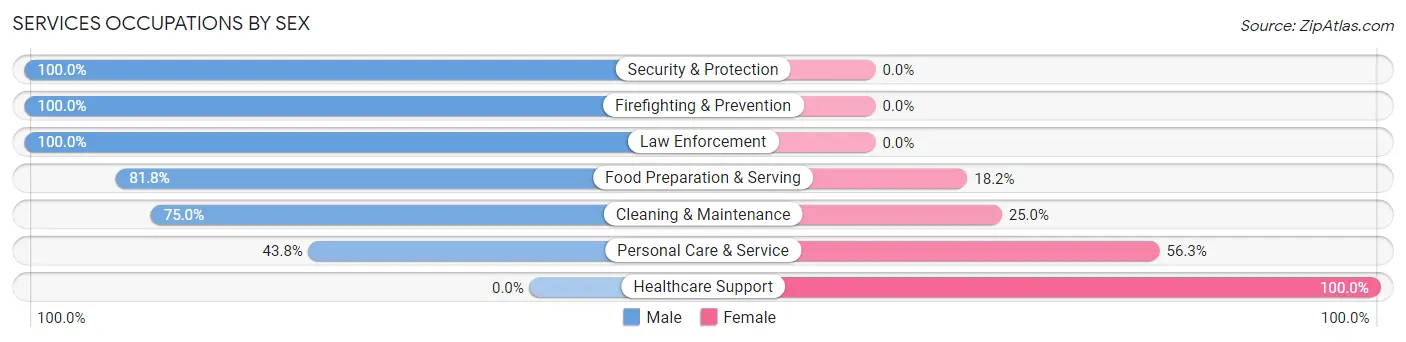
Services Occupations by Sex
Within the Services occupations in Grantwood Village, the most male-oriented occupations are Security & Protection (100.0%), Firefighting & Prevention (100.0%), and Law Enforcement (100.0%), while the most female-oriented occupations are Healthcare Support (100.0%), Personal Care & Service (56.2%), and Cleaning & Maintenance (25.0%).
| Occupation | Male | Female |
| Healthcare Support | 0 (0.0%) | 3 (100.0%) |
| Security & Protection | 19 (100.0%) | 0 (0.0%) |
| Firefighting & Prevention | 12 (100.0%) | 0 (0.0%) |
| Law Enforcement | 7 (100.0%) | 0 (0.0%) |
| Food Preparation & Serving | 9 (81.8%) | 2 (18.2%) |
| Cleaning & Maintenance | 9 (75.0%) | 3 (25.0%) |
| Personal Care & Service | 7 (43.8%) | 9 (56.2%) |
| Total (Category) | 44 (72.1%) | 17 (27.9%) |
| Total (Overall) | 237 (51.4%) | 224 (48.6%) |
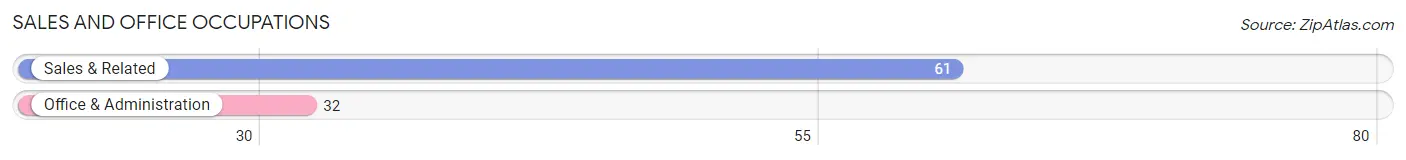
Sales and Office Occupations
The most common Sales and Office occupations in Grantwood Village are Sales & Related (61 | 13.2%), and Office & Administration (32 | 6.9%).
Sales and Office Occupations by Sex
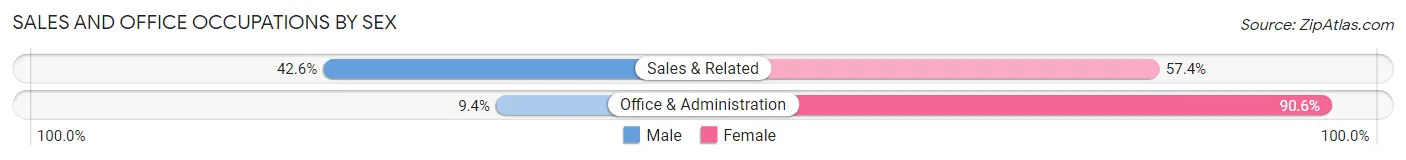
| Occupation | Male | Female |
| Sales & Related | 26 (42.6%) | 35 (57.4%) |
| Office & Administration | 3 (9.4%) | 29 (90.6%) |
| Total (Category) | 29 (31.2%) | 64 (68.8%) |
| Total (Overall) | 237 (51.4%) | 224 (48.6%) |
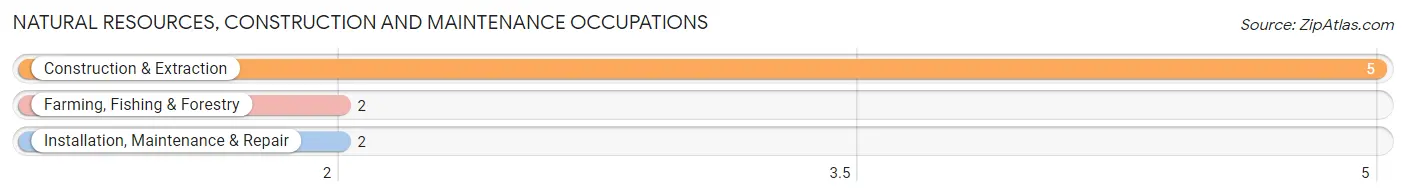
Natural Resources, Construction and Maintenance Occupations
The most common Natural Resources, Construction and Maintenance occupations in Grantwood Village are Construction & Extraction (5 | 1.1%), Farming, Fishing & Forestry (2 | 0.4%), and Installation, Maintenance & Repair (2 | 0.4%).
Natural Resources, Construction and Maintenance Occupations by Sex
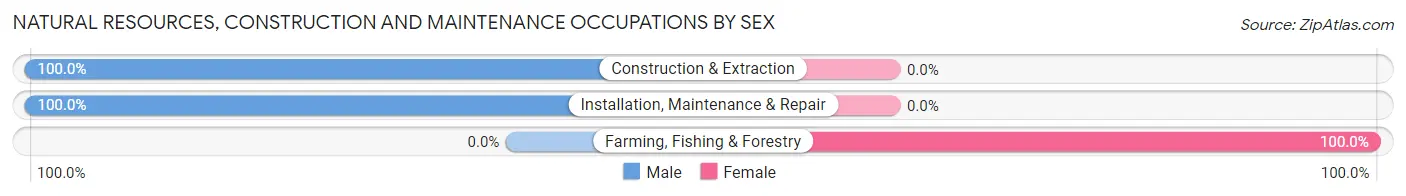
| Occupation | Male | Female |
| Farming, Fishing & Forestry | 0 (0.0%) | 2 (100.0%) |
| Construction & Extraction | 5 (100.0%) | 0 (0.0%) |
| Installation, Maintenance & Repair | 2 (100.0%) | 0 (0.0%) |
| Total (Category) | 7 (77.8%) | 2 (22.2%) |
| Total (Overall) | 237 (51.4%) | 224 (48.6%) |
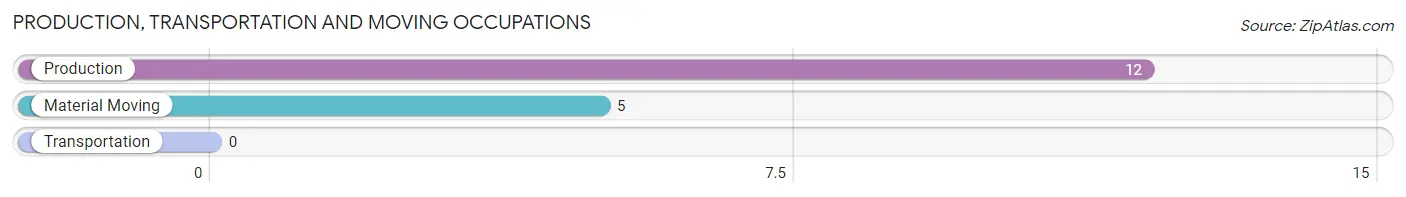
Production, Transportation and Moving Occupations
The most common Production, Transportation and Moving occupations in Grantwood Village are Production (12 | 2.6%), and Material Moving (5 | 1.1%).
Production, Transportation and Moving Occupations by Sex
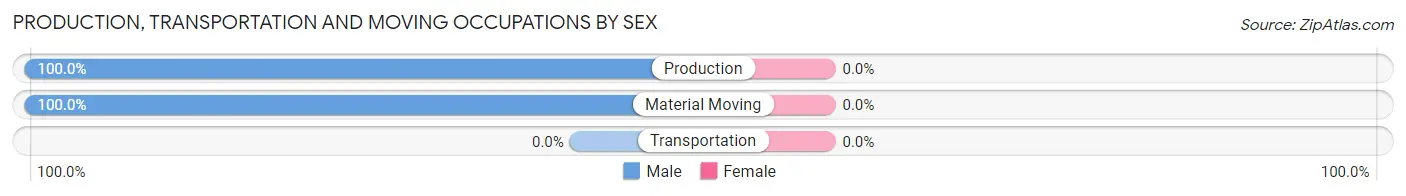
| Occupation | Male | Female |
| Production | 12 (100.0%) | 0 (0.0%) |
| Transportation | 0 (0.0%) | 0 (0.0%) |
| Material Moving | 5 (100.0%) | 0 (0.0%) |
| Total (Category) | 17 (100.0%) | 0 (0.0%) |
| Total (Overall) | 237 (51.4%) | 224 (48.6%) |
Employment Industries by Sex in Grantwood Village
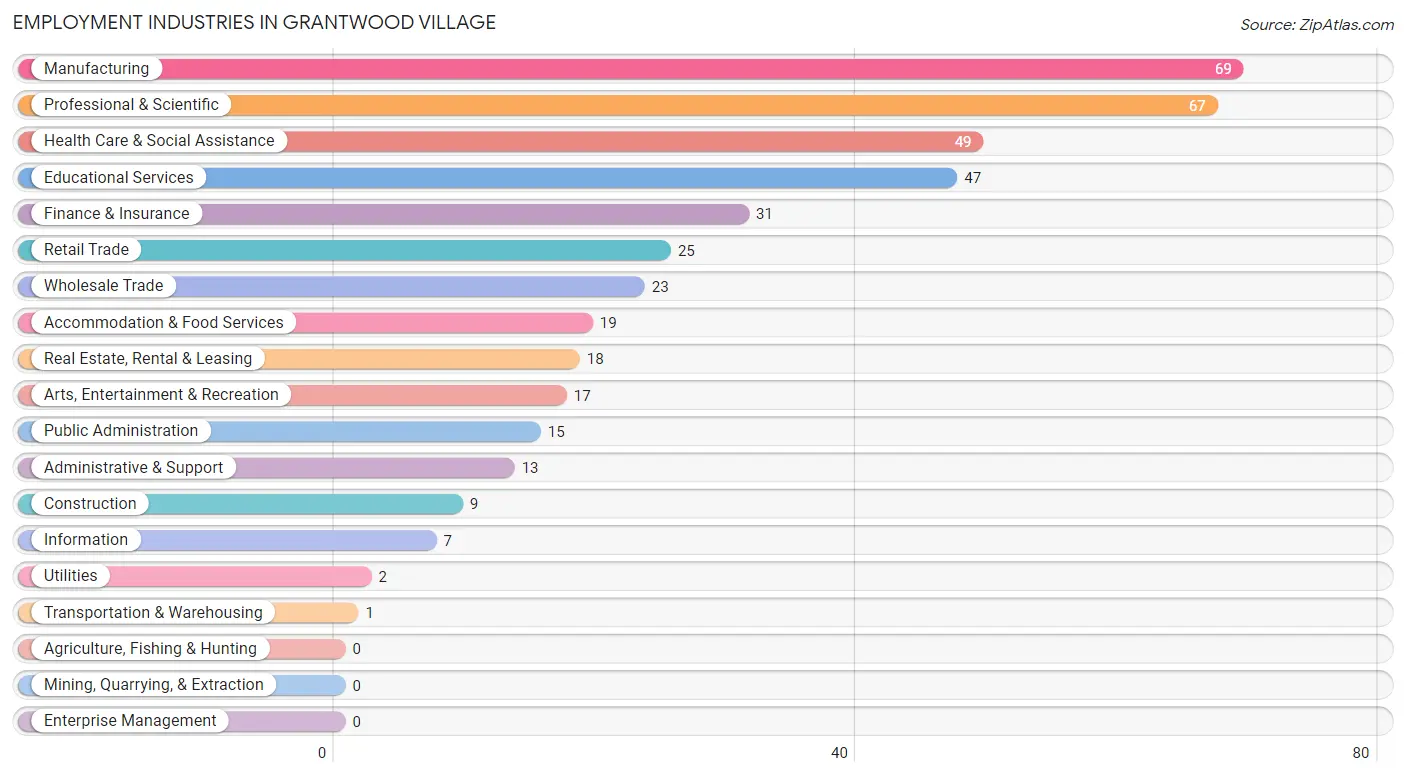
Employment Industries in Grantwood Village
The major employment industries in Grantwood Village include Manufacturing (69 | 15.0%), Professional & Scientific (67 | 14.5%), Health Care & Social Assistance (49 | 10.6%), Educational Services (47 | 10.2%), and Finance & Insurance (31 | 6.7%).
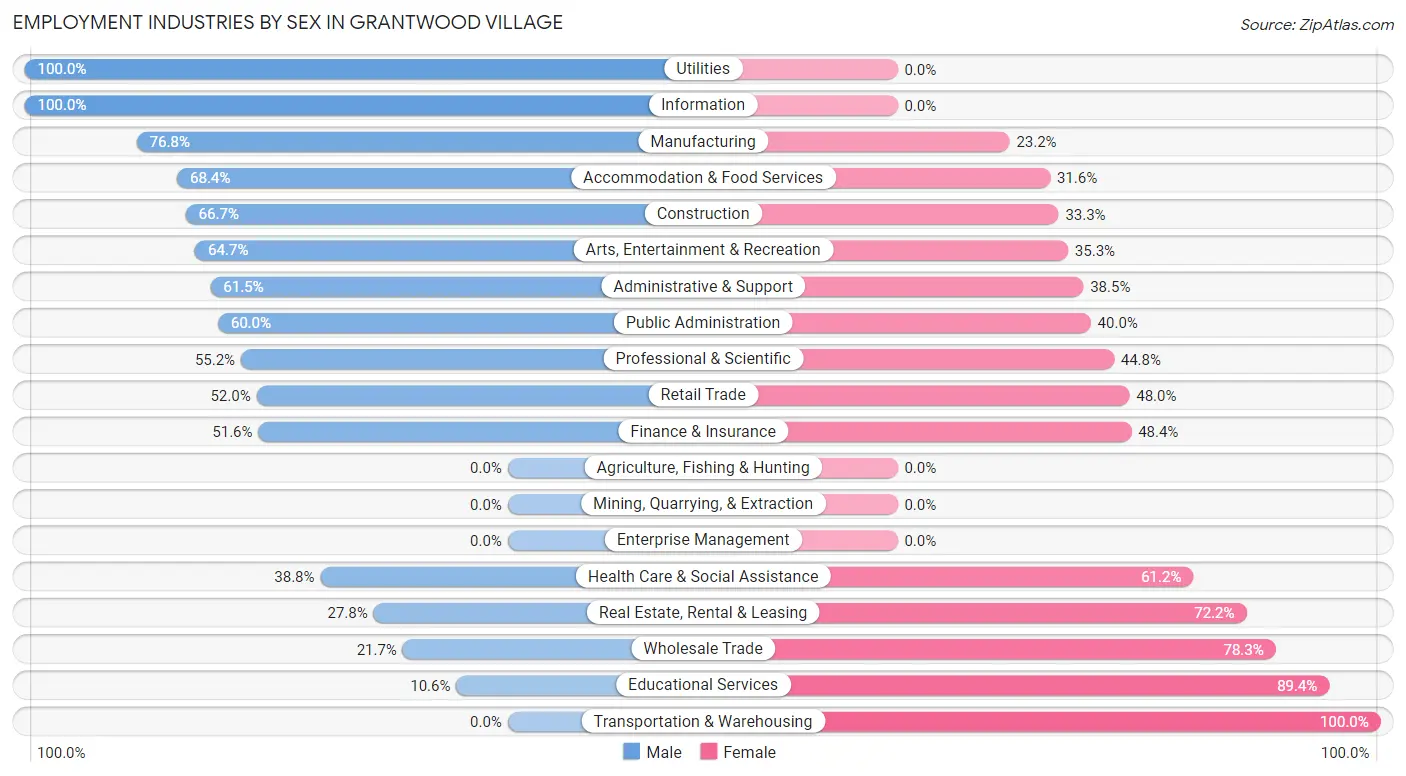
Employment Industries by Sex in Grantwood Village
The Grantwood Village industries that see more men than women are Utilities (100.0%), Information (100.0%), and Manufacturing (76.8%), whereas the industries that tend to have a higher number of women are Transportation & Warehousing (100.0%), Educational Services (89.4%), and Wholesale Trade (78.3%).
| Industry | Male | Female |
| Agriculture, Fishing & Hunting | 0 (0.0%) | 0 (0.0%) |
| Mining, Quarrying, & Extraction | 0 (0.0%) | 0 (0.0%) |
| Construction | 6 (66.7%) | 3 (33.3%) |
| Manufacturing | 53 (76.8%) | 16 (23.2%) |
| Wholesale Trade | 5 (21.7%) | 18 (78.3%) |
| Retail Trade | 13 (52.0%) | 12 (48.0%) |
| Transportation & Warehousing | 0 (0.0%) | 1 (100.0%) |
| Utilities | 2 (100.0%) | 0 (0.0%) |
| Information | 7 (100.0%) | 0 (0.0%) |
| Finance & Insurance | 16 (51.6%) | 15 (48.4%) |
| Real Estate, Rental & Leasing | 5 (27.8%) | 13 (72.2%) |
| Professional & Scientific | 37 (55.2%) | 30 (44.8%) |
| Enterprise Management | 0 (0.0%) | 0 (0.0%) |
| Administrative & Support | 8 (61.5%) | 5 (38.5%) |
| Educational Services | 5 (10.6%) | 42 (89.4%) |
| Health Care & Social Assistance | 19 (38.8%) | 30 (61.2%) |
| Arts, Entertainment & Recreation | 11 (64.7%) | 6 (35.3%) |
| Accommodation & Food Services | 13 (68.4%) | 6 (31.6%) |
| Public Administration | 9 (60.0%) | 6 (40.0%) |
| Total | 237 (51.4%) | 224 (48.6%) |
Education in Grantwood Village
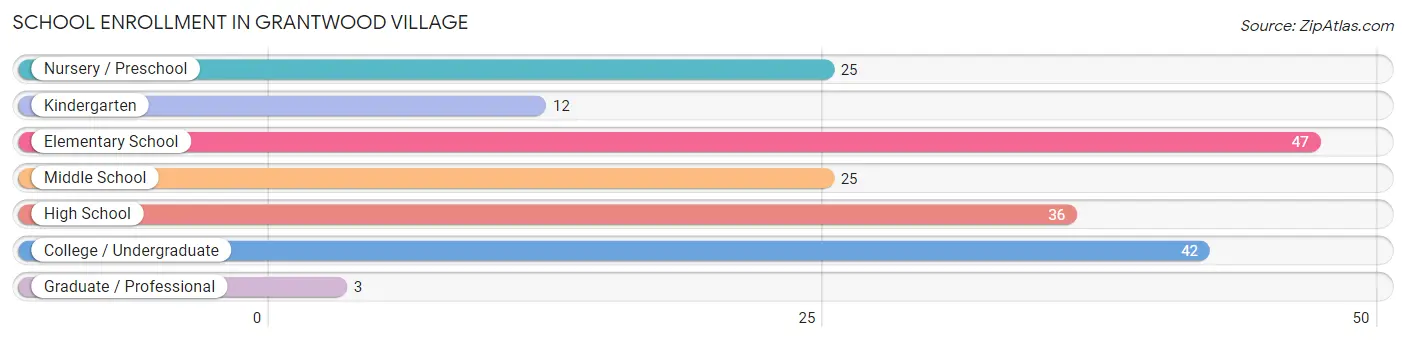
School Enrollment in Grantwood Village
The most common levels of schooling among the 190 students in Grantwood Village are elementary school (47 | 24.7%), college / undergraduate (42 | 22.1%), and high school (36 | 19.0%).
| School Level | # Students | % Students |
| Nursery / Preschool | 25 | 13.2% |
| Kindergarten | 12 | 6.3% |
| Elementary School | 47 | 24.7% |
| Middle School | 25 | 13.2% |
| High School | 36 | 19.0% |
| College / Undergraduate | 42 | 22.1% |
| Graduate / Professional | 3 | 1.6% |
| Total | 190 | 100.0% |
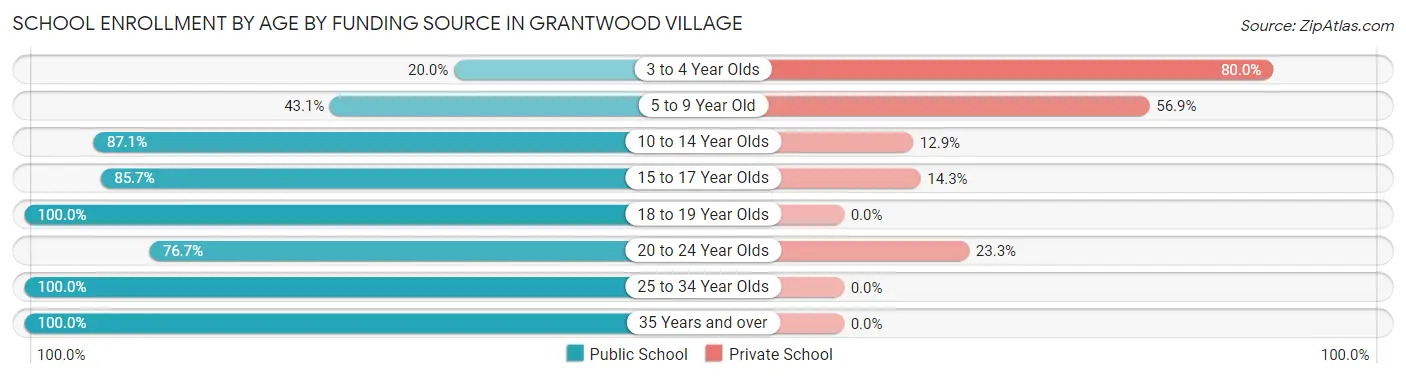
School Enrollment by Age by Funding Source in Grantwood Village
Out of a total of 190 students who are enrolled in schools in Grantwood Village, 64 (33.7%) attend a private institution, while the remaining 126 (66.3%) are enrolled in public schools. The age group of 3 to 4 year olds has the highest likelihood of being enrolled in private schools, with 12 (80.0% in the age bracket) enrolled. Conversely, the age group of 18 to 19 year olds has the lowest likelihood of being enrolled in a private school, with 4 (100.0% in the age bracket) attending a public institution.
| Age Bracket | Public School | Private School |
| 3 to 4 Year Olds | 3 (20.0%) | 12 (80.0%) |
| 5 to 9 Year Old | 28 (43.1%) | 37 (56.9%) |
| 10 to 14 Year Olds | 27 (87.1%) | 4 (12.9%) |
| 15 to 17 Year Olds | 24 (85.7%) | 4 (14.3%) |
| 18 to 19 Year Olds | 4 (100.0%) | 0 (0.0%) |
| 20 to 24 Year Olds | 23 (76.7%) | 7 (23.3%) |
| 25 to 34 Year Olds | 1 (100.0%) | 0 (0.0%) |
| 35 Years and over | 16 (100.0%) | 0 (0.0%) |
| Total | 126 (66.3%) | 64 (33.7%) |
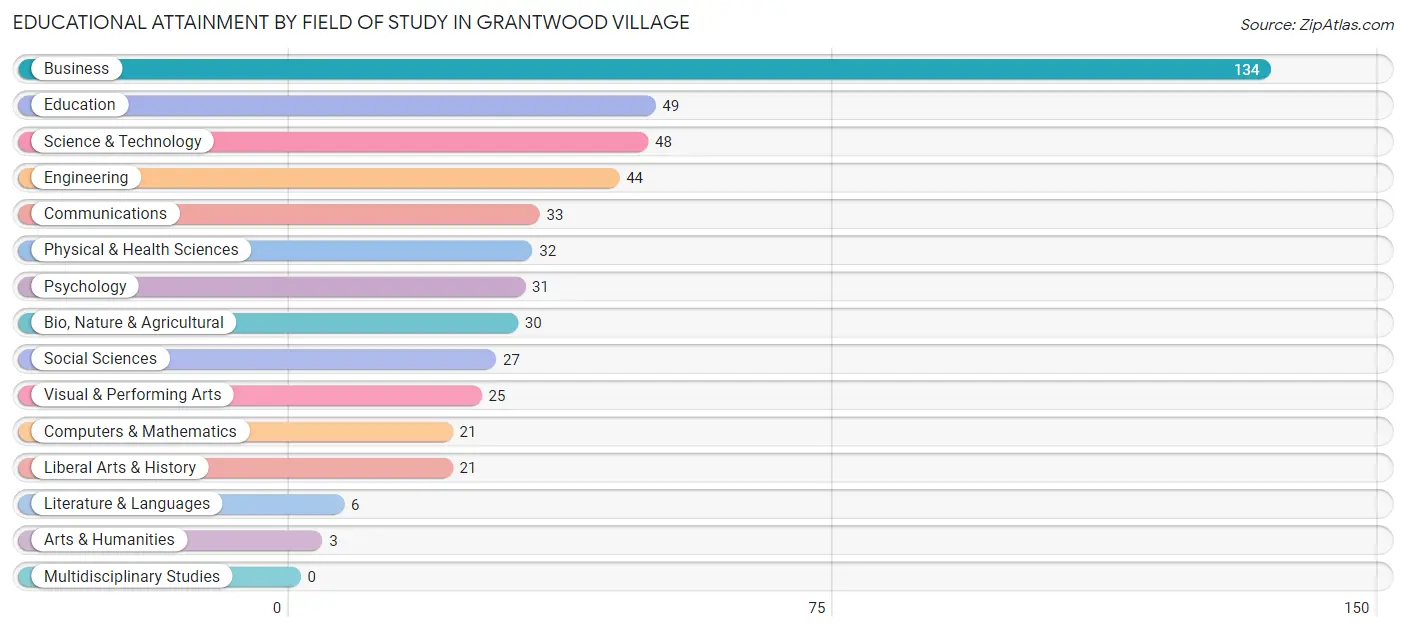
Educational Attainment by Field of Study in Grantwood Village
Business (134 | 26.6%), education (49 | 9.7%), science & technology (48 | 9.5%), engineering (44 | 8.7%), and communications (33 | 6.6%) are the most common fields of study among 504 individuals in Grantwood Village who have obtained a bachelor's degree or higher.
| Field of Study | # Graduates | % Graduates |
| Computers & Mathematics | 21 | 4.2% |
| Bio, Nature & Agricultural | 30 | 5.9% |
| Physical & Health Sciences | 32 | 6.4% |
| Psychology | 31 | 6.1% |
| Social Sciences | 27 | 5.4% |
| Engineering | 44 | 8.7% |
| Multidisciplinary Studies | 0 | 0.0% |
| Science & Technology | 48 | 9.5% |
| Business | 134 | 26.6% |
| Education | 49 | 9.7% |
| Literature & Languages | 6 | 1.2% |
| Liberal Arts & History | 21 | 4.2% |
| Visual & Performing Arts | 25 | 5.0% |
| Communications | 33 | 6.6% |
| Arts & Humanities | 3 | 0.6% |
| Total | 504 | 100.0% |
Transportation & Commute in Grantwood Village
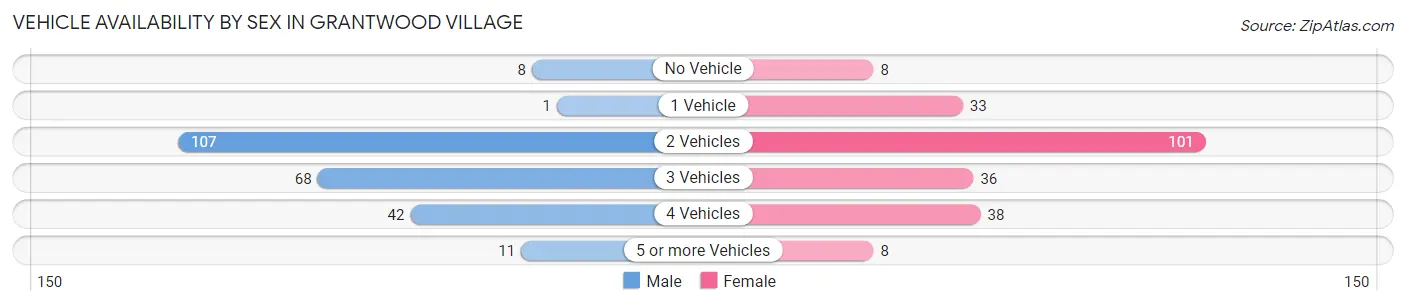
Vehicle Availability by Sex in Grantwood Village
The most prevalent vehicle ownership categories in Grantwood Village are males with 2 vehicles (107, accounting for 45.2%) and females with 2 vehicles (101, making up 47.8%).
| Vehicles Available | Male | Female |
| No Vehicle | 8 (3.4%) | 8 (3.6%) |
| 1 Vehicle | 1 (0.4%) | 33 (14.7%) |
| 2 Vehicles | 107 (45.2%) | 101 (45.1%) |
| 3 Vehicles | 68 (28.7%) | 36 (16.1%) |
| 4 Vehicles | 42 (17.7%) | 38 (17.0%) |
| 5 or more Vehicles | 11 (4.6%) | 8 (3.6%) |
| Total | 237 (100.0%) | 224 (100.0%) |
Commute Time in Grantwood Village
The most frequently occuring commute durations in Grantwood Village are 15 to 19 minutes (91 commuters, 26.2%), 20 to 24 minutes (64 commuters, 18.4%), and 10 to 14 minutes (41 commuters, 11.8%).
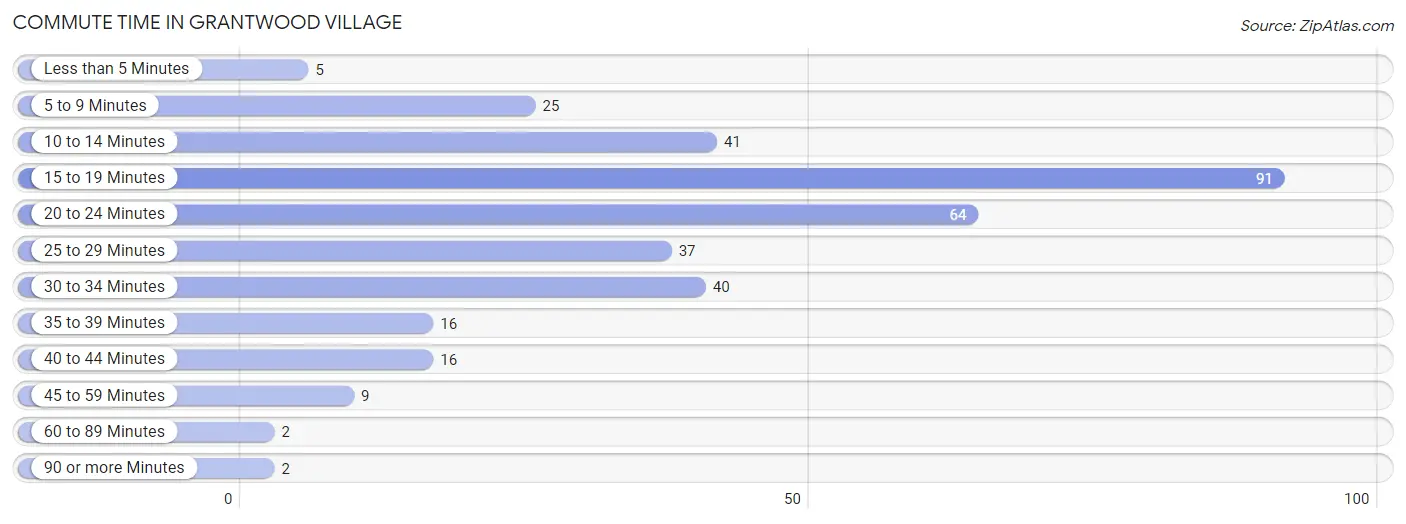
| Commute Time | # Commuters | % Commuters |
| Less than 5 Minutes | 5 | 1.4% |
| 5 to 9 Minutes | 25 | 7.2% |
| 10 to 14 Minutes | 41 | 11.8% |
| 15 to 19 Minutes | 91 | 26.2% |
| 20 to 24 Minutes | 64 | 18.4% |
| 25 to 29 Minutes | 37 | 10.6% |
| 30 to 34 Minutes | 40 | 11.5% |
| 35 to 39 Minutes | 16 | 4.6% |
| 40 to 44 Minutes | 16 | 4.6% |
| 45 to 59 Minutes | 9 | 2.6% |
| 60 to 89 Minutes | 2 | 0.6% |
| 90 or more Minutes | 2 | 0.6% |
Commute Time by Sex in Grantwood Village
The most common commute times in Grantwood Village are 15 to 19 minutes (51 commuters, 27.0%) for males and 15 to 19 minutes (40 commuters, 25.2%) for females.
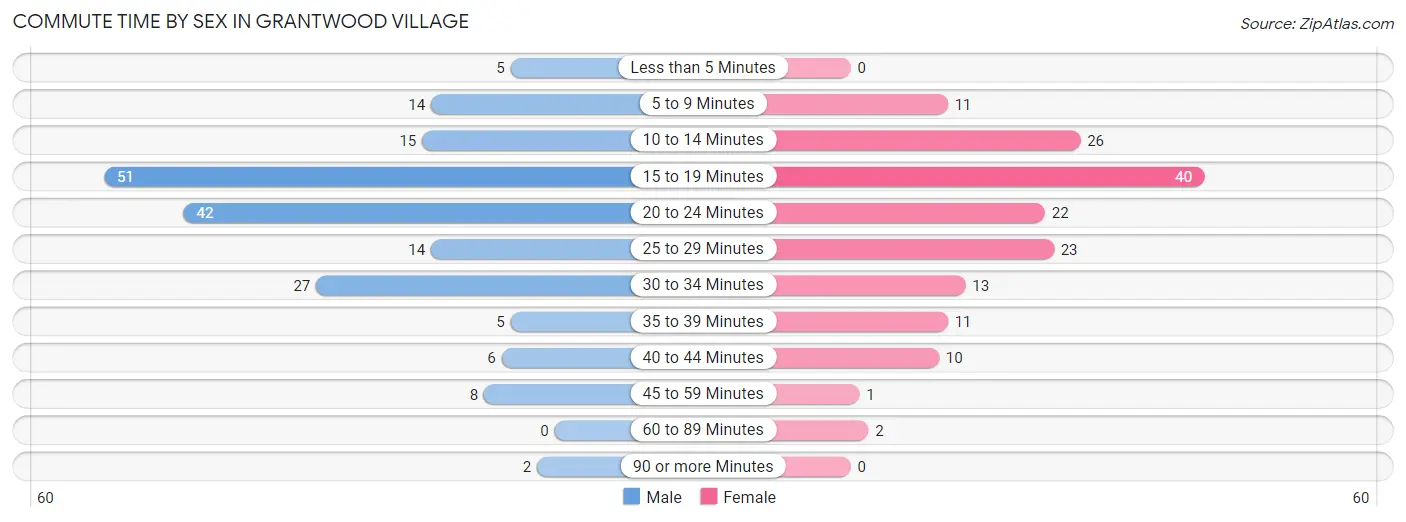
| Commute Time | Male | Female |
| Less than 5 Minutes | 5 (2.6%) | 0 (0.0%) |
| 5 to 9 Minutes | 14 (7.4%) | 11 (6.9%) |
| 10 to 14 Minutes | 15 (7.9%) | 26 (16.4%) |
| 15 to 19 Minutes | 51 (27.0%) | 40 (25.2%) |
| 20 to 24 Minutes | 42 (22.2%) | 22 (13.8%) |
| 25 to 29 Minutes | 14 (7.4%) | 23 (14.5%) |
| 30 to 34 Minutes | 27 (14.3%) | 13 (8.2%) |
| 35 to 39 Minutes | 5 (2.6%) | 11 (6.9%) |
| 40 to 44 Minutes | 6 (3.2%) | 10 (6.3%) |
| 45 to 59 Minutes | 8 (4.2%) | 1 (0.6%) |
| 60 to 89 Minutes | 0 (0.0%) | 2 (1.3%) |
| 90 or more Minutes | 2 (1.1%) | 0 (0.0%) |
Time of Departure to Work by Sex in Grantwood Village
The most frequent times of departure to work in Grantwood Village are 8:00 AM to 8:29 AM (35, 18.5%) for males and 8:00 AM to 8:29 AM (35, 22.0%) for females.
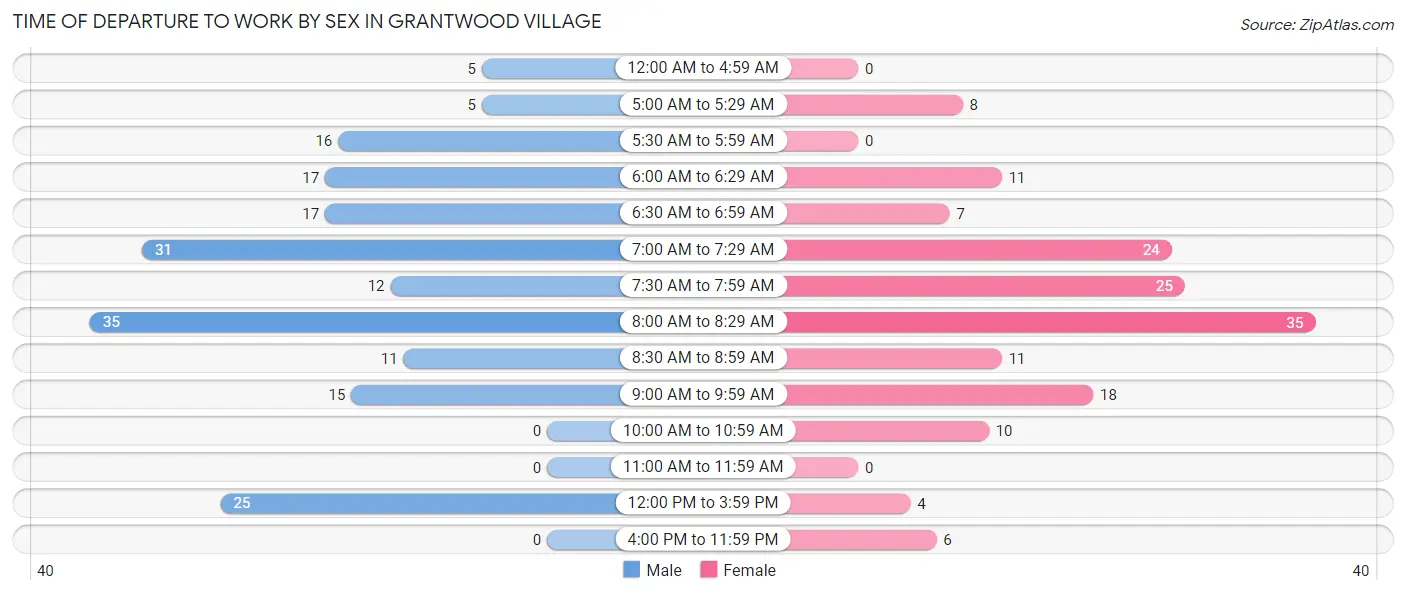
| Time of Departure | Male | Female |
| 12:00 AM to 4:59 AM | 5 (2.6%) | 0 (0.0%) |
| 5:00 AM to 5:29 AM | 5 (2.6%) | 8 (5.0%) |
| 5:30 AM to 5:59 AM | 16 (8.5%) | 0 (0.0%) |
| 6:00 AM to 6:29 AM | 17 (9.0%) | 11 (6.9%) |
| 6:30 AM to 6:59 AM | 17 (9.0%) | 7 (4.4%) |
| 7:00 AM to 7:29 AM | 31 (16.4%) | 24 (15.1%) |
| 7:30 AM to 7:59 AM | 12 (6.4%) | 25 (15.7%) |
| 8:00 AM to 8:29 AM | 35 (18.5%) | 35 (22.0%) |
| 8:30 AM to 8:59 AM | 11 (5.8%) | 11 (6.9%) |
| 9:00 AM to 9:59 AM | 15 (7.9%) | 18 (11.3%) |
| 10:00 AM to 10:59 AM | 0 (0.0%) | 10 (6.3%) |
| 11:00 AM to 11:59 AM | 0 (0.0%) | 0 (0.0%) |
| 12:00 PM to 3:59 PM | 25 (13.2%) | 4 (2.5%) |
| 4:00 PM to 11:59 PM | 0 (0.0%) | 6 (3.8%) |
| Total | 189 (100.0%) | 159 (100.0%) |
Housing Occupancy in Grantwood Village
Occupancy by Ownership in Grantwood Village
Of the total 375 dwellings in Grantwood Village, owner-occupied units account for 369 (98.4%), while renter-occupied units make up 6 (1.6%).
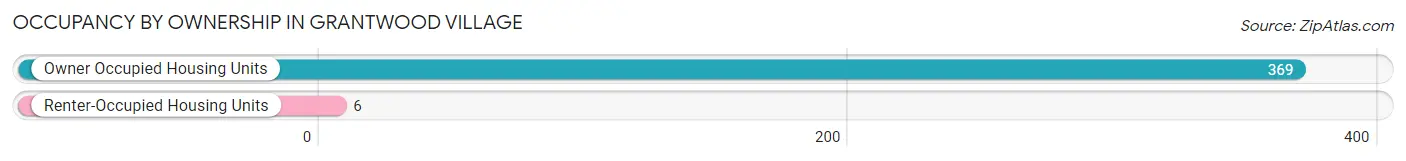
| Occupancy | # Housing Units | % Housing Units |
| Owner Occupied Housing Units | 369 | 98.4% |
| Renter-Occupied Housing Units | 6 | 1.6% |
| Total Occupied Housing Units | 375 | 100.0% |
Occupancy by Household Size in Grantwood Village
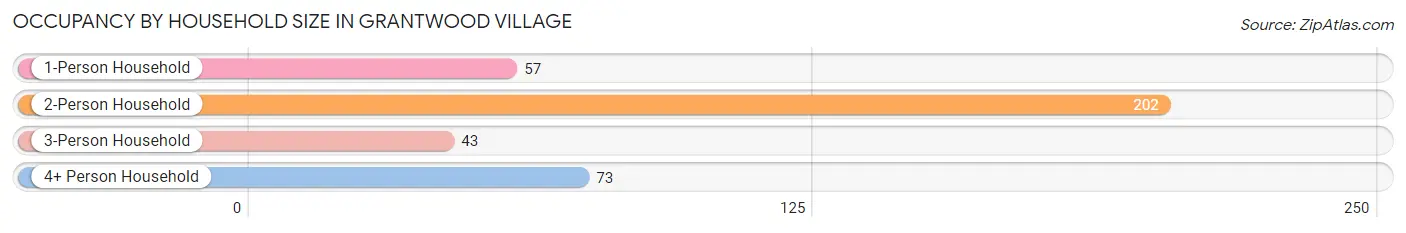
| Household Size | # Housing Units | % Housing Units |
| 1-Person Household | 57 | 15.2% |
| 2-Person Household | 202 | 53.9% |
| 3-Person Household | 43 | 11.5% |
| 4+ Person Household | 73 | 19.5% |
| Total Housing Units | 375 | 100.0% |
Occupancy by Ownership by Household Size in Grantwood Village
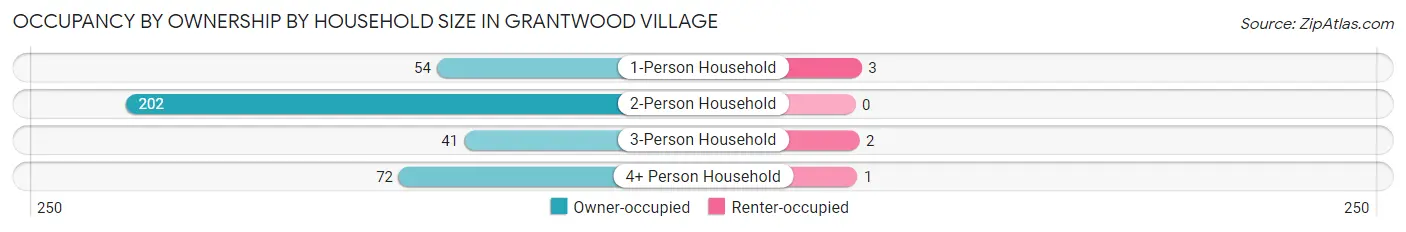
| Household Size | Owner-occupied | Renter-occupied |
| 1-Person Household | 54 (94.7%) | 3 (5.3%) |
| 2-Person Household | 202 (100.0%) | 0 (0.0%) |
| 3-Person Household | 41 (95.4%) | 2 (4.6%) |
| 4+ Person Household | 72 (98.6%) | 1 (1.4%) |
| Total Housing Units | 369 (98.4%) | 6 (1.6%) |
Occupancy by Educational Attainment in Grantwood Village
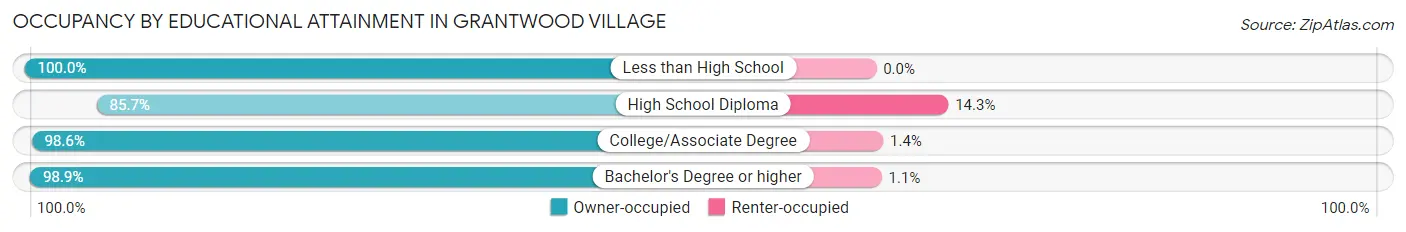
| Household Size | Owner-occupied | Renter-occupied |
| Less than High School | 10 (100.0%) | 0 (0.0%) |
| High School Diploma | 12 (85.7%) | 2 (14.3%) |
| College/Associate Degree | 72 (98.6%) | 1 (1.4%) |
| Bachelor's Degree or higher | 275 (98.9%) | 3 (1.1%) |
Occupancy by Age of Householder in Grantwood Village
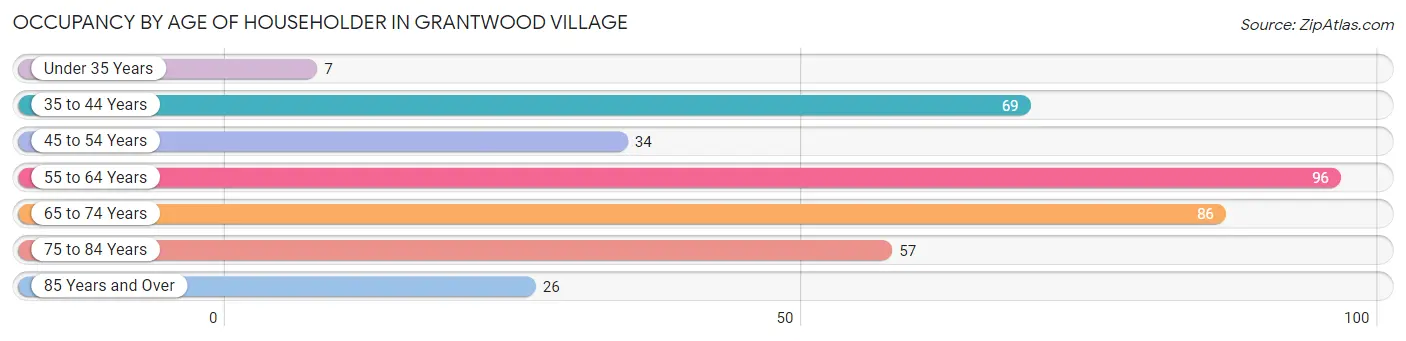
| Age Bracket | # Households | % Households |
| Under 35 Years | 7 | 1.9% |
| 35 to 44 Years | 69 | 18.4% |
| 45 to 54 Years | 34 | 9.1% |
| 55 to 64 Years | 96 | 25.6% |
| 65 to 74 Years | 86 | 22.9% |
| 75 to 84 Years | 57 | 15.2% |
| 85 Years and Over | 26 | 6.9% |
| Total | 375 | 100.0% |
Housing Finances in Grantwood Village
Median Income by Occupancy in Grantwood Village
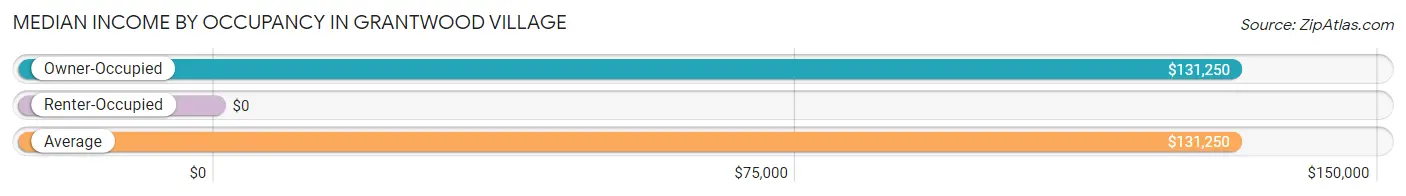
| Occupancy Type | # Households | Median Income |
| Owner-Occupied | 369 (98.4%) | $131,250 |
| Renter-Occupied | 6 (1.6%) | $0 |
| Average | 375 (100.0%) | $131,250 |
Occupancy by Householder Income Bracket in Grantwood Village
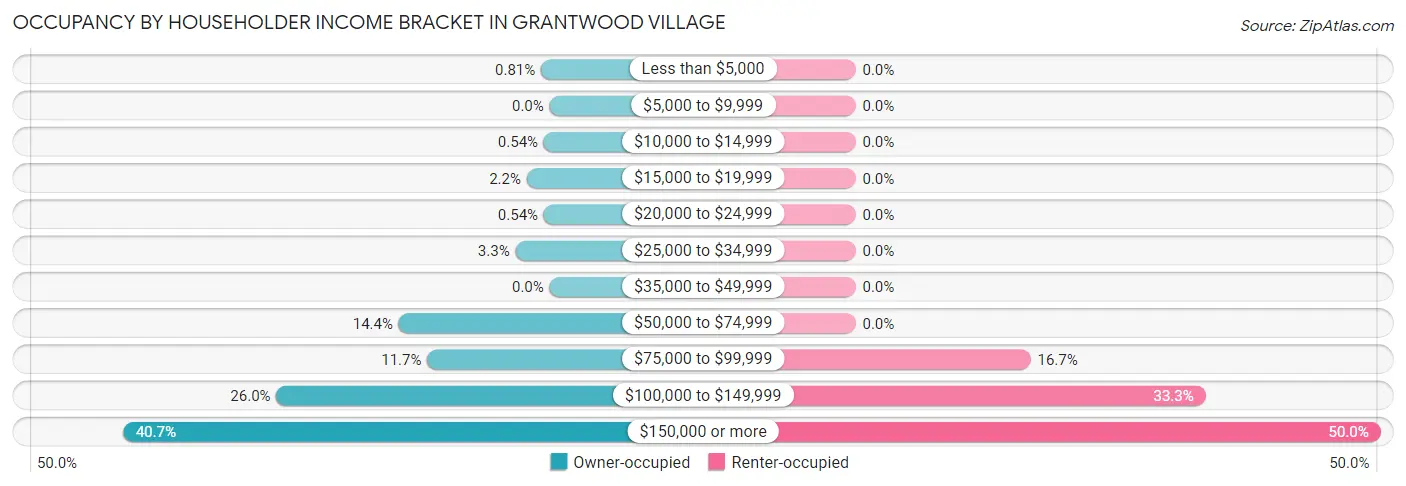
| Income Bracket | Owner-occupied | Renter-occupied |
| Less than $5,000 | 3 (0.8%) | 0 (0.0%) |
| $5,000 to $9,999 | 0 (0.0%) | 0 (0.0%) |
| $10,000 to $14,999 | 2 (0.5%) | 0 (0.0%) |
| $15,000 to $19,999 | 8 (2.2%) | 0 (0.0%) |
| $20,000 to $24,999 | 2 (0.5%) | 0 (0.0%) |
| $25,000 to $34,999 | 12 (3.3%) | 0 (0.0%) |
| $35,000 to $49,999 | 0 (0.0%) | 0 (0.0%) |
| $50,000 to $74,999 | 53 (14.4%) | 0 (0.0%) |
| $75,000 to $99,999 | 43 (11.7%) | 1 (16.7%) |
| $100,000 to $149,999 | 96 (26.0%) | 2 (33.3%) |
| $150,000 or more | 150 (40.6%) | 3 (50.0%) |
| Total | 369 (100.0%) | 6 (100.0%) |
Monthly Housing Cost Tiers in Grantwood Village
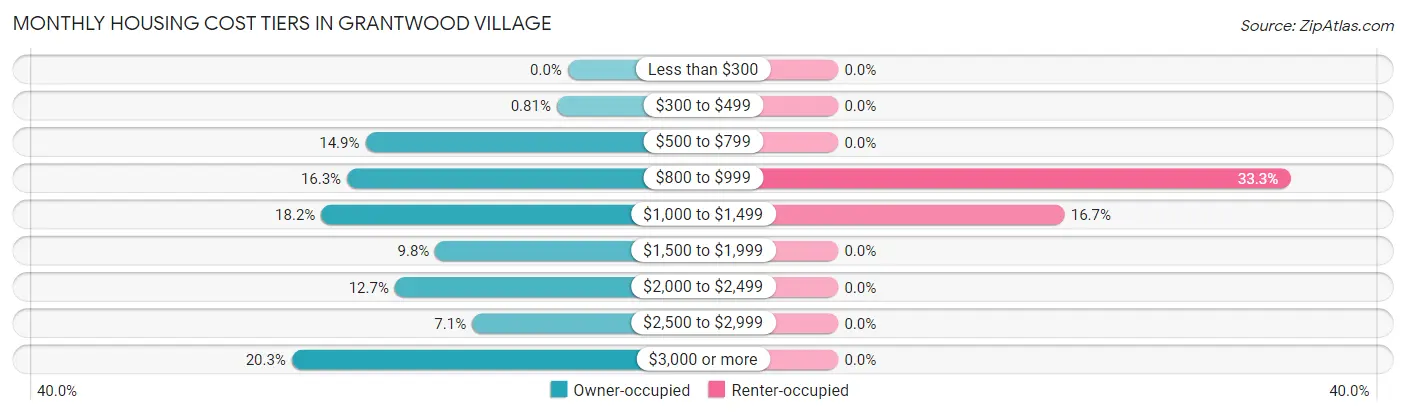
| Monthly Cost | Owner-occupied | Renter-occupied |
| Less than $300 | 0 (0.0%) | 0 (0.0%) |
| $300 to $499 | 3 (0.8%) | 0 (0.0%) |
| $500 to $799 | 55 (14.9%) | 0 (0.0%) |
| $800 to $999 | 60 (16.3%) | 2 (33.3%) |
| $1,000 to $1,499 | 67 (18.2%) | 1 (16.7%) |
| $1,500 to $1,999 | 36 (9.8%) | 0 (0.0%) |
| $2,000 to $2,499 | 47 (12.7%) | 0 (0.0%) |
| $2,500 to $2,999 | 26 (7.0%) | 0 (0.0%) |
| $3,000 or more | 75 (20.3%) | 0 (0.0%) |
| Total | 369 (100.0%) | 6 (100.0%) |
Physical Housing Characteristics in Grantwood Village
Housing Structures in Grantwood Village
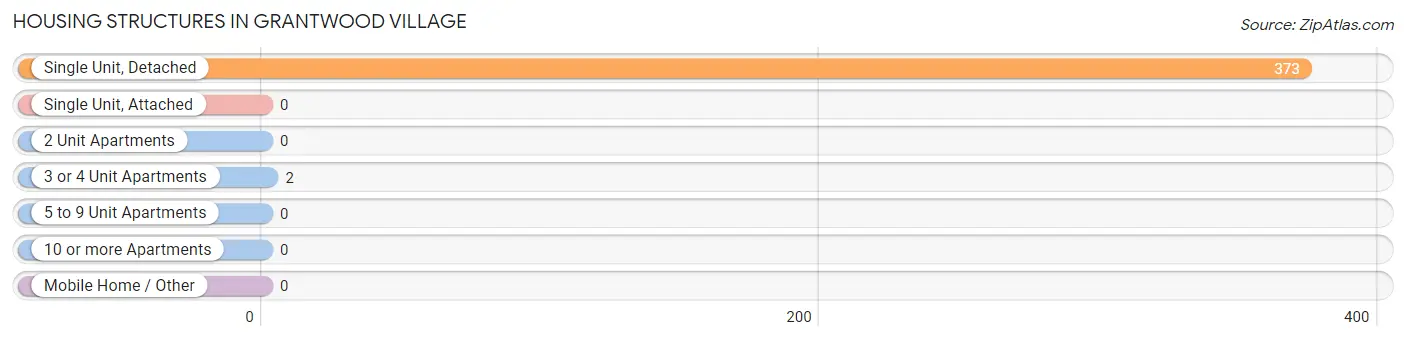
| Structure Type | # Housing Units | % Housing Units |
| Single Unit, Detached | 373 | 99.5% |
| Single Unit, Attached | 0 | 0.0% |
| 2 Unit Apartments | 0 | 0.0% |
| 3 or 4 Unit Apartments | 2 | 0.5% |
| 5 to 9 Unit Apartments | 0 | 0.0% |
| 10 or more Apartments | 0 | 0.0% |
| Mobile Home / Other | 0 | 0.0% |
| Total | 375 | 100.0% |
Housing Structures by Occupancy in Grantwood Village
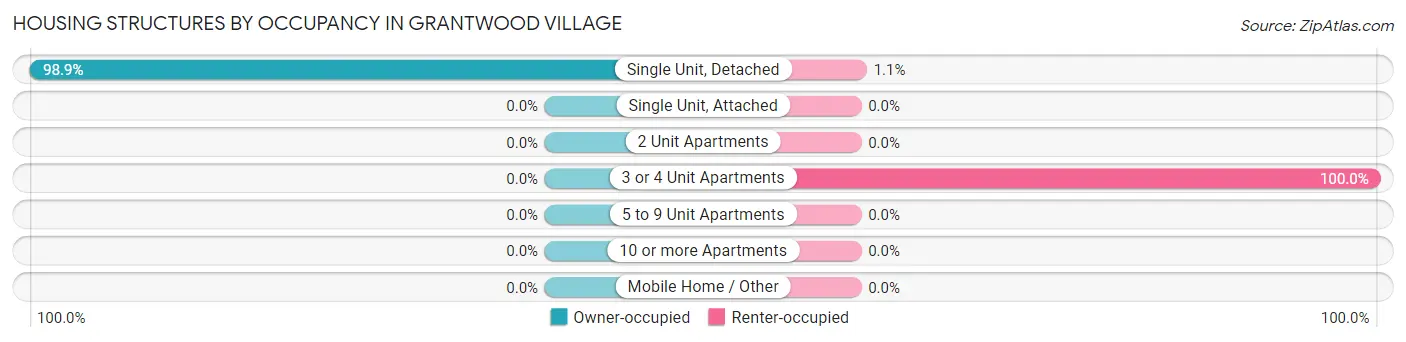
| Structure Type | Owner-occupied | Renter-occupied |
| Single Unit, Detached | 369 (98.9%) | 4 (1.1%) |
| Single Unit, Attached | 0 (0.0%) | 0 (0.0%) |
| 2 Unit Apartments | 0 (0.0%) | 0 (0.0%) |
| 3 or 4 Unit Apartments | 0 (0.0%) | 2 (100.0%) |
| 5 to 9 Unit Apartments | 0 (0.0%) | 0 (0.0%) |
| 10 or more Apartments | 0 (0.0%) | 0 (0.0%) |
| Mobile Home / Other | 0 (0.0%) | 0 (0.0%) |
| Total | 369 (98.4%) | 6 (1.6%) |
Housing Structures by Number of Rooms in Grantwood Village
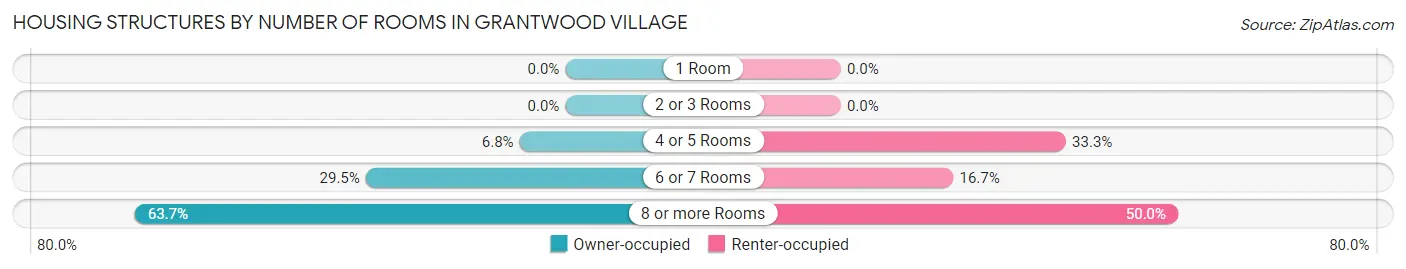
| Number of Rooms | Owner-occupied | Renter-occupied |
| 1 Room | 0 (0.0%) | 0 (0.0%) |
| 2 or 3 Rooms | 0 (0.0%) | 0 (0.0%) |
| 4 or 5 Rooms | 25 (6.8%) | 2 (33.3%) |
| 6 or 7 Rooms | 109 (29.5%) | 1 (16.7%) |
| 8 or more Rooms | 235 (63.7%) | 3 (50.0%) |
| Total | 369 (100.0%) | 6 (100.0%) |
Housing Structure by Heating Type in Grantwood Village
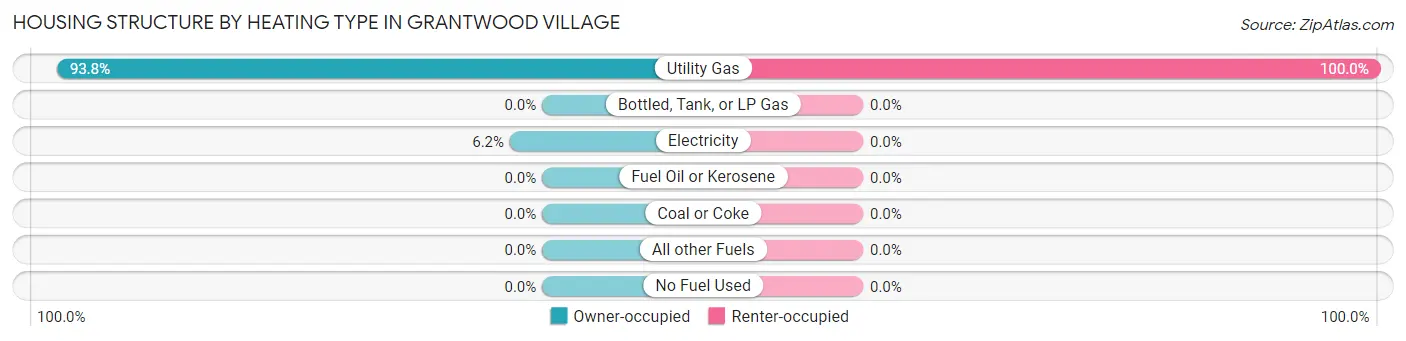
| Heating Type | Owner-occupied | Renter-occupied |
| Utility Gas | 346 (93.8%) | 6 (100.0%) |
| Bottled, Tank, or LP Gas | 0 (0.0%) | 0 (0.0%) |
| Electricity | 23 (6.2%) | 0 (0.0%) |
| Fuel Oil or Kerosene | 0 (0.0%) | 0 (0.0%) |
| Coal or Coke | 0 (0.0%) | 0 (0.0%) |
| All other Fuels | 0 (0.0%) | 0 (0.0%) |
| No Fuel Used | 0 (0.0%) | 0 (0.0%) |
| Total | 369 (100.0%) | 6 (100.0%) |
Household Vehicle Usage in Grantwood Village
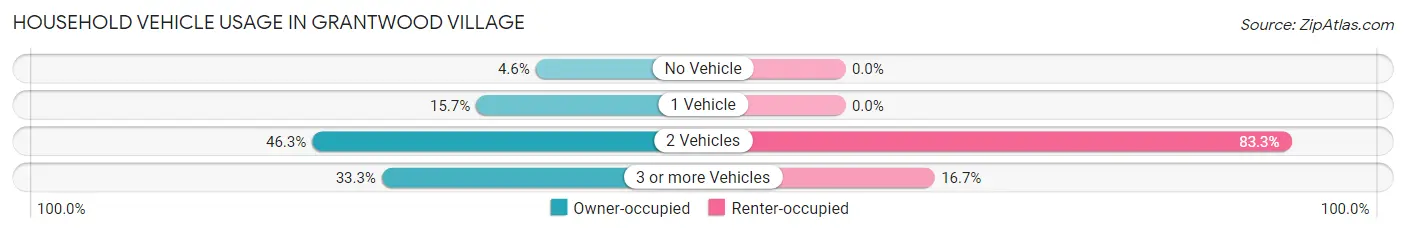
| Vehicles per Household | Owner-occupied | Renter-occupied |
| No Vehicle | 17 (4.6%) | 0 (0.0%) |
| 1 Vehicle | 58 (15.7%) | 0 (0.0%) |
| 2 Vehicles | 171 (46.3%) | 5 (83.3%) |
| 3 or more Vehicles | 123 (33.3%) | 1 (16.7%) |
| Total | 369 (100.0%) | 6 (100.0%) |
Real Estate & Mortgages in Grantwood Village
Real Estate and Mortgage Overview in Grantwood Village
| Characteristic | Without Mortgage | With Mortgage |
| Housing Units | 192 | 177 |
| Median Property Value | $390,900 | $469,900 |
| Median Household Income | $111,250 | $78 |
| Monthly Housing Costs | $953 | $75 |
| Real Estate Taxes | $5,651 | $0 |
Property Value by Mortgage Status in Grantwood Village
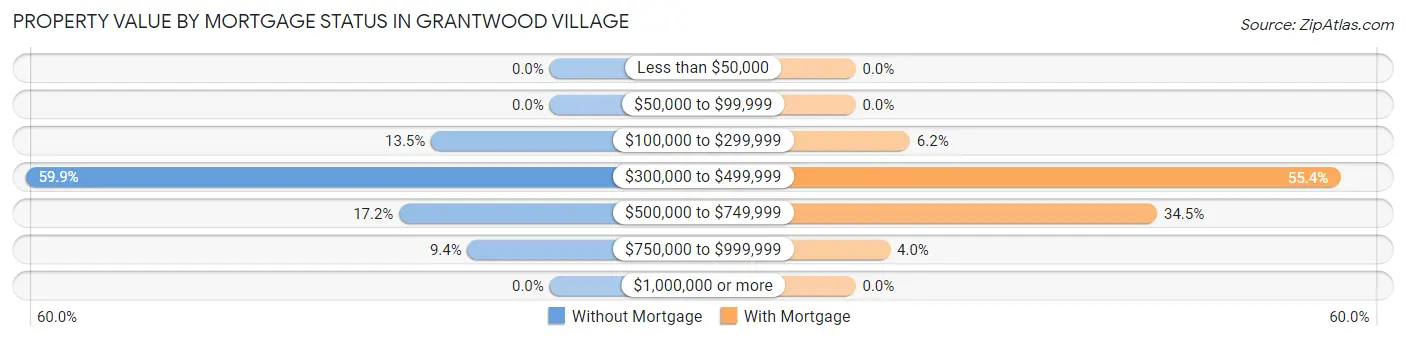
| Property Value | Without Mortgage | With Mortgage |
| Less than $50,000 | 0 (0.0%) | 0 (0.0%) |
| $50,000 to $99,999 | 0 (0.0%) | 0 (0.0%) |
| $100,000 to $299,999 | 26 (13.5%) | 11 (6.2%) |
| $300,000 to $499,999 | 115 (59.9%) | 98 (55.4%) |
| $500,000 to $749,999 | 33 (17.2%) | 61 (34.5%) |
| $750,000 to $999,999 | 18 (9.4%) | 7 (4.0%) |
| $1,000,000 or more | 0 (0.0%) | 0 (0.0%) |
| Total | 192 (100.0%) | 177 (100.0%) |
Household Income by Mortgage Status in Grantwood Village
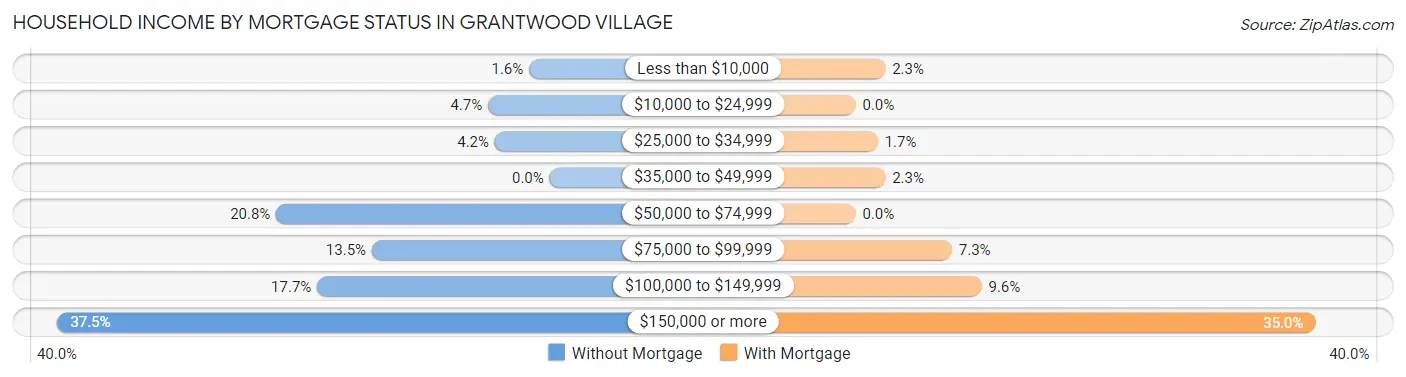
| Household Income | Without Mortgage | With Mortgage |
| Less than $10,000 | 3 (1.6%) | 4 (2.3%) |
| $10,000 to $24,999 | 9 (4.7%) | 0 (0.0%) |
| $25,000 to $34,999 | 8 (4.2%) | 3 (1.7%) |
| $35,000 to $49,999 | 0 (0.0%) | 4 (2.3%) |
| $50,000 to $74,999 | 40 (20.8%) | 0 (0.0%) |
| $75,000 to $99,999 | 26 (13.5%) | 13 (7.3%) |
| $100,000 to $149,999 | 34 (17.7%) | 17 (9.6%) |
| $150,000 or more | 72 (37.5%) | 62 (35.0%) |
| Total | 192 (100.0%) | 177 (100.0%) |
Property Value to Household Income Ratio in Grantwood Village
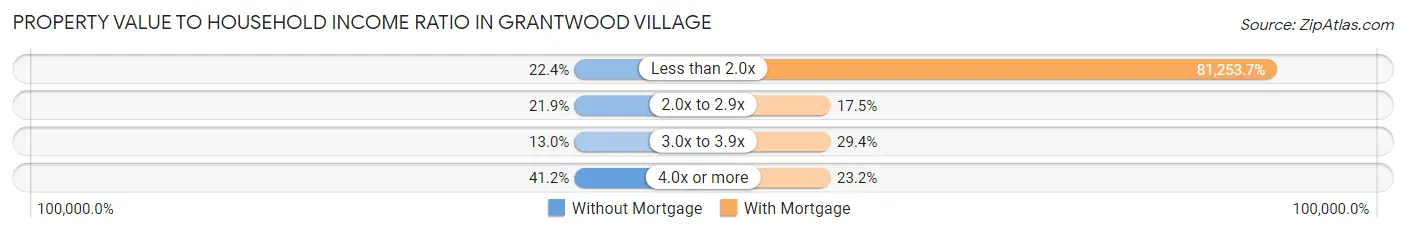
| Value-to-Income Ratio | Without Mortgage | With Mortgage |
| Less than 2.0x | 43 (22.4%) | 143,819 (81,253.7%) |
| 2.0x to 2.9x | 42 (21.9%) | 31 (17.5%) |
| 3.0x to 3.9x | 25 (13.0%) | 52 (29.4%) |
| 4.0x or more | 79 (41.1%) | 41 (23.2%) |
| Total | 192 (100.0%) | 177 (100.0%) |
Real Estate Taxes by Mortgage Status in Grantwood Village
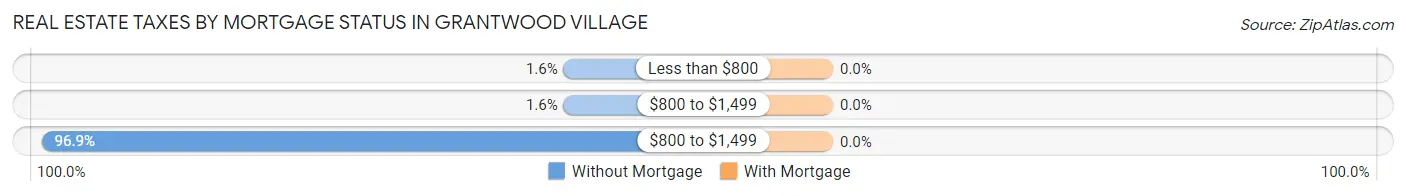
| Property Taxes | Without Mortgage | With Mortgage |
| Less than $800 | 3 (1.6%) | 0 (0.0%) |
| $800 to $1,499 | 3 (1.6%) | 0 (0.0%) |
| $800 to $1,499 | 186 (96.9%) | 0 (0.0%) |
| Total | 192 (100.0%) | 177 (100.0%) |
Health & Disability in Grantwood Village
Health Insurance Coverage by Age in Grantwood Village
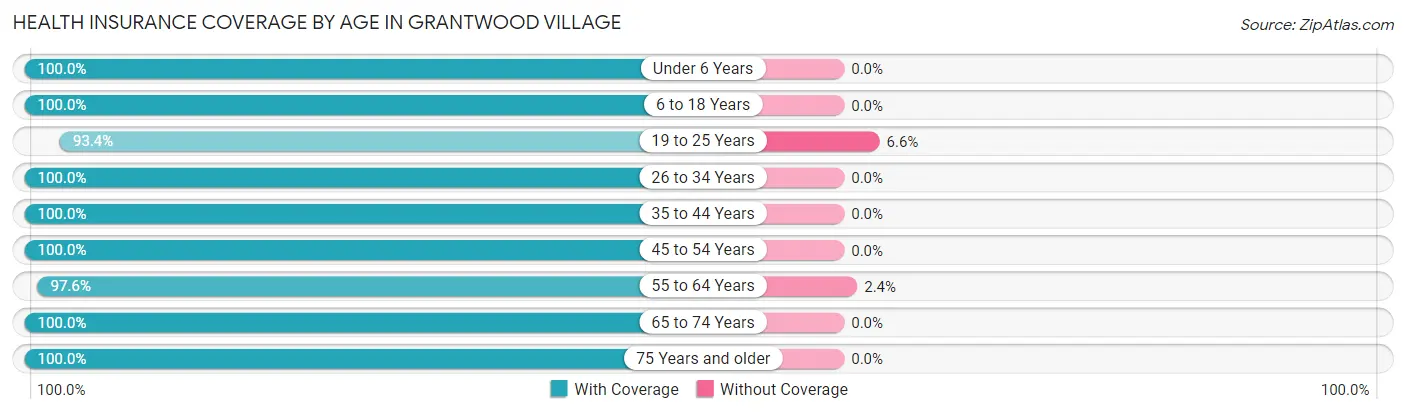
| Age Bracket | With Coverage | Without Coverage |
| Under 6 Years | 52 (100.0%) | 0 (0.0%) |
| 6 to 18 Years | 114 (100.0%) | 0 (0.0%) |
| 19 to 25 Years | 71 (93.4%) | 5 (6.6%) |
| 26 to 34 Years | 27 (100.0%) | 0 (0.0%) |
| 35 to 44 Years | 126 (100.0%) | 0 (0.0%) |
| 45 to 54 Years | 69 (100.0%) | 0 (0.0%) |
| 55 to 64 Years | 161 (97.6%) | 4 (2.4%) |
| 65 to 74 Years | 169 (100.0%) | 0 (0.0%) |
| 75 Years and older | 126 (100.0%) | 0 (0.0%) |
| Total | 915 (99.0%) | 9 (1.0%) |
Health Insurance Coverage by Citizenship Status in Grantwood Village
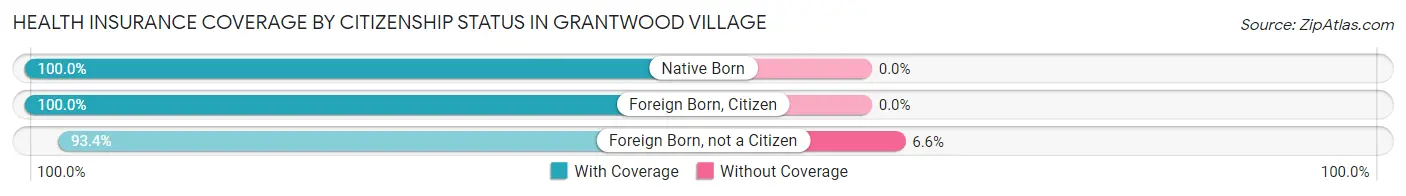
| Citizenship Status | With Coverage | Without Coverage |
| Native Born | 52 (100.0%) | 0 (0.0%) |
| Foreign Born, Citizen | 114 (100.0%) | 0 (0.0%) |
| Foreign Born, not a Citizen | 71 (93.4%) | 5 (6.6%) |
Health Insurance Coverage by Household Income in Grantwood Village
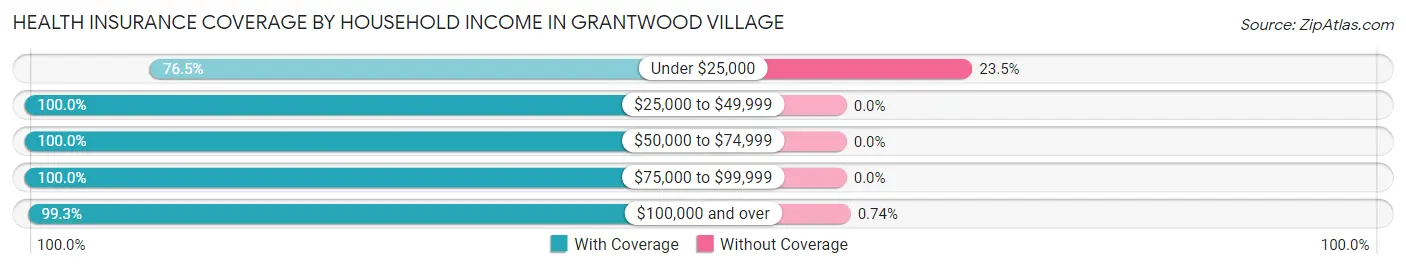
| Household Income | With Coverage | Without Coverage |
| Under $25,000 | 13 (76.5%) | 4 (23.5%) |
| $25,000 to $49,999 | 16 (100.0%) | 0 (0.0%) |
| $50,000 to $74,999 | 121 (100.0%) | 0 (0.0%) |
| $75,000 to $99,999 | 90 (100.0%) | 0 (0.0%) |
| $100,000 and over | 675 (99.3%) | 5 (0.7%) |
Public vs Private Health Insurance Coverage by Age in Grantwood Village
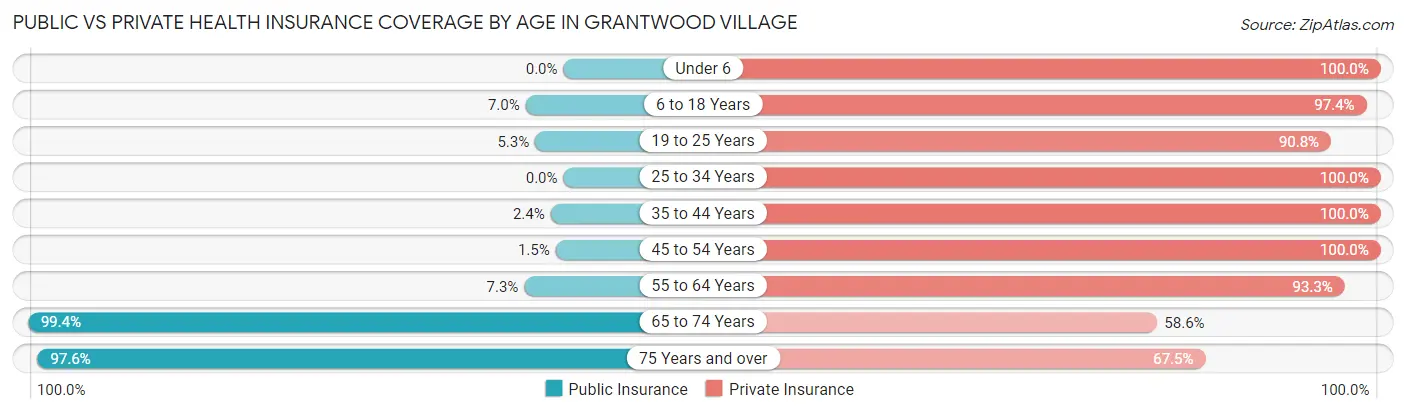
| Age Bracket | Public Insurance | Private Insurance |
| Under 6 | 0 (0.0%) | 52 (100.0%) |
| 6 to 18 Years | 8 (7.0%) | 111 (97.4%) |
| 19 to 25 Years | 4 (5.3%) | 69 (90.8%) |
| 25 to 34 Years | 0 (0.0%) | 27 (100.0%) |
| 35 to 44 Years | 3 (2.4%) | 126 (100.0%) |
| 45 to 54 Years | 1 (1.5%) | 69 (100.0%) |
| 55 to 64 Years | 12 (7.3%) | 154 (93.3%) |
| 65 to 74 Years | 168 (99.4%) | 99 (58.6%) |
| 75 Years and over | 123 (97.6%) | 85 (67.5%) |
| Total | 319 (34.5%) | 792 (85.7%) |
Disability Status by Sex by Age in Grantwood Village
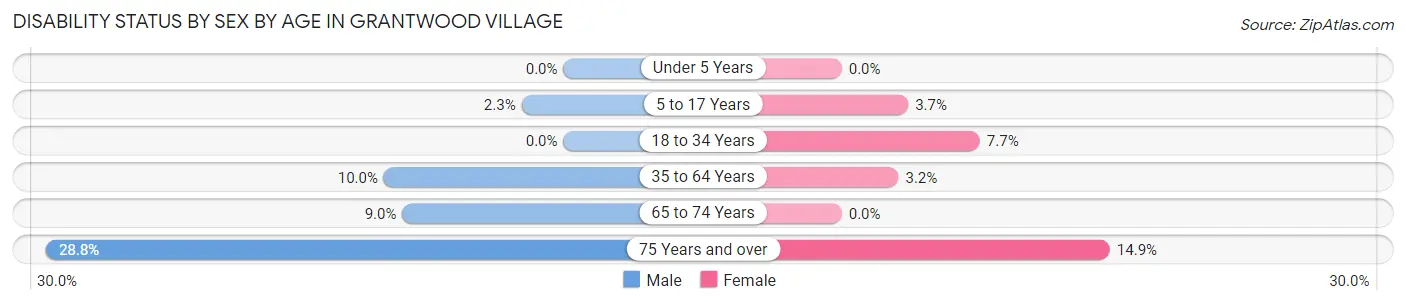
| Age Bracket | Male | Female |
| Under 5 Years | 0 (0.0%) | 0 (0.0%) |
| 5 to 17 Years | 1 (2.3%) | 3 (3.7%) |
| 18 to 34 Years | 0 (0.0%) | 4 (7.7%) |
| 35 to 64 Years | 17 (10.0%) | 6 (3.2%) |
| 65 to 74 Years | 7 (9.0%) | 0 (0.0%) |
| 75 Years and over | 17 (28.8%) | 10 (14.9%) |
Disability Class by Sex by Age in Grantwood Village
Disability Class: Hearing Difficulty
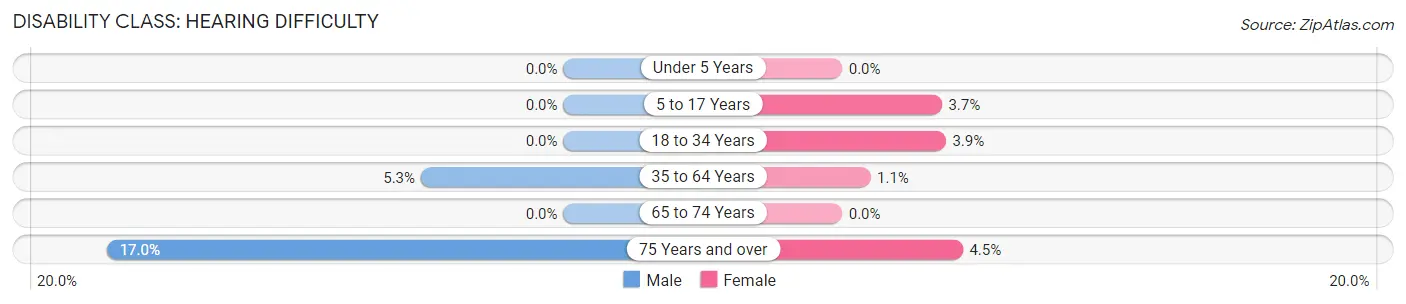
| Age Bracket | Male | Female |
| Under 5 Years | 0 (0.0%) | 0 (0.0%) |
| 5 to 17 Years | 0 (0.0%) | 3 (3.7%) |
| 18 to 34 Years | 0 (0.0%) | 2 (3.8%) |
| 35 to 64 Years | 9 (5.3%) | 2 (1.1%) |
| 65 to 74 Years | 0 (0.0%) | 0 (0.0%) |
| 75 Years and over | 10 (17.0%) | 3 (4.5%) |
Disability Class: Vision Difficulty
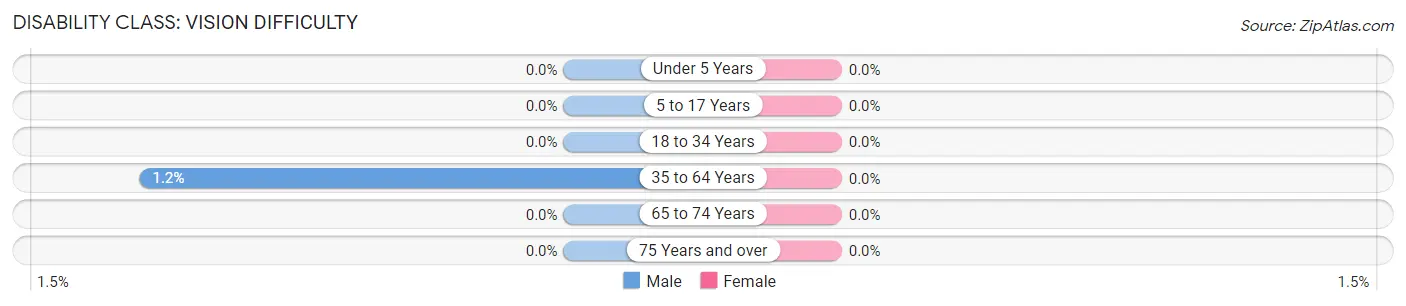
| Age Bracket | Male | Female |
| Under 5 Years | 0 (0.0%) | 0 (0.0%) |
| 5 to 17 Years | 0 (0.0%) | 0 (0.0%) |
| 18 to 34 Years | 0 (0.0%) | 0 (0.0%) |
| 35 to 64 Years | 2 (1.2%) | 0 (0.0%) |
| 65 to 74 Years | 0 (0.0%) | 0 (0.0%) |
| 75 Years and over | 0 (0.0%) | 0 (0.0%) |
Disability Class: Cognitive Difficulty
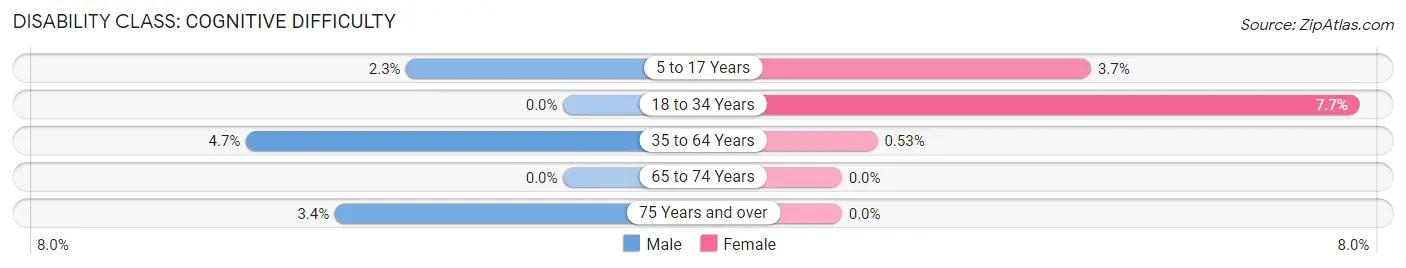
| Age Bracket | Male | Female |
| 5 to 17 Years | 1 (2.3%) | 3 (3.7%) |
| 18 to 34 Years | 0 (0.0%) | 4 (7.7%) |
| 35 to 64 Years | 8 (4.7%) | 1 (0.5%) |
| 65 to 74 Years | 0 (0.0%) | 0 (0.0%) |
| 75 Years and over | 2 (3.4%) | 0 (0.0%) |
Disability Class: Ambulatory Difficulty
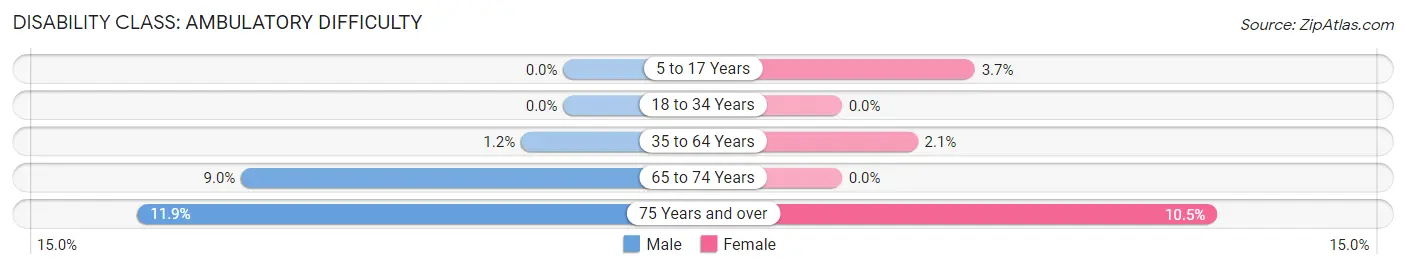
| Age Bracket | Male | Female |
| 5 to 17 Years | 0 (0.0%) | 3 (3.7%) |
| 18 to 34 Years | 0 (0.0%) | 0 (0.0%) |
| 35 to 64 Years | 2 (1.2%) | 4 (2.1%) |
| 65 to 74 Years | 7 (9.0%) | 0 (0.0%) |
| 75 Years and over | 7 (11.9%) | 7 (10.4%) |
Disability Class: Self-Care Difficulty
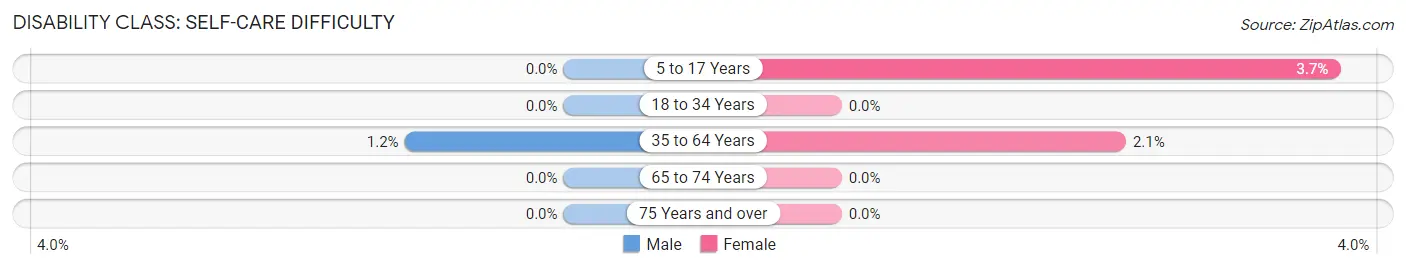
| Age Bracket | Male | Female |
| 5 to 17 Years | 0 (0.0%) | 3 (3.7%) |
| 18 to 34 Years | 0 (0.0%) | 0 (0.0%) |
| 35 to 64 Years | 2 (1.2%) | 4 (2.1%) |
| 65 to 74 Years | 0 (0.0%) | 0 (0.0%) |
| 75 Years and over | 0 (0.0%) | 0 (0.0%) |
Technology Access in Grantwood Village
Computing Device Access in Grantwood Village
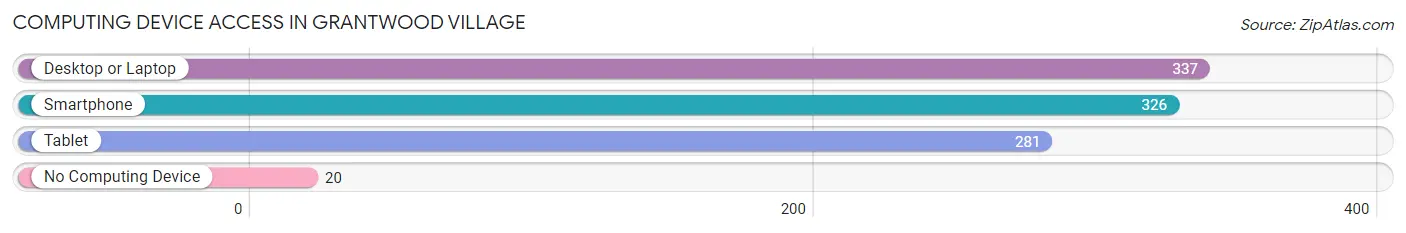
| Device Type | # Households | % Households |
| Desktop or Laptop | 337 | 89.9% |
| Smartphone | 326 | 86.9% |
| Tablet | 281 | 74.9% |
| No Computing Device | 20 | 5.3% |
| Total | 375 | 100.0% |
Internet Access in Grantwood Village
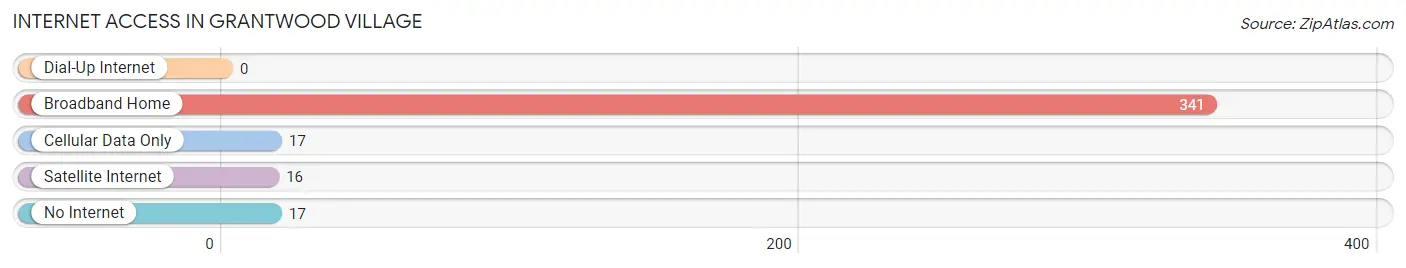
| Internet Type | # Households | % Households |
| Dial-Up Internet | 0 | 0.0% |
| Broadband Home | 341 | 90.9% |
| Cellular Data Only | 17 | 4.5% |
| Satellite Internet | 16 | 4.3% |
| No Internet | 17 | 4.5% |
| Total | 375 | 100.0% |
Grantwood Village Summary
Wood Village, Missouri is a small village located in St. Louis County, Missouri. It is a part of the Greater St. Louis metropolitan area and is located just south of the city of St. Louis. The village was founded in the late 19th century and has a population of approximately 1,500 people.
Geography
Grantwood Village is located in St. Louis County, Missouri, just south of the city of St. Louis. It is situated on the banks of the Meramec River and is bordered by the cities of Kirkwood, Webster Groves, and Glendale. The village is located in the Missouri River Valley and is surrounded by rolling hills and wooded areas. The village is located at an elevation of approximately 500 feet above sea level.
Climate
Grantwood Village has a humid continental climate, with hot, humid summers and cold, snowy winters. The average annual temperature is around 54°F, with an average high of around 79°F in the summer and an average low of around 30°F in the winter. The average annual precipitation is around 40 inches, with most of the precipitation occurring in the spring and summer months.
Demographics
As of the 2010 census, Grantwood Village had a population of 1,500 people. The racial makeup of the village was 94.7% White, 1.3% African American, 0.7% Asian, 0.3% Native American, and 2.7% from other races. The median household income was $50,000, and the median family income was $60,000.
Economy
Grantwood Village is primarily a residential community, with most of its residents employed in the nearby cities of St. Louis and Kirkwood. The village is home to several small businesses, including a grocery store, a hardware store, and a few restaurants. The village also has a few small industrial businesses, such as a printing company and a metal fabrication shop.
History
Grantwood Village was founded in the late 19th century by a group of German immigrants. The village was named after General Ulysses S. Grant, who had recently been elected President of the United States. The village grew slowly over the years, and by the early 20th century, it had become a popular destination for St. Louisans looking to escape the city. In the 1950s, the village was incorporated as a municipality, and it has remained a small, quiet community ever since.
Conclusion
Grantwood Village is a small village located in St. Louis County, Missouri. It is a part of the Greater St. Louis metropolitan area and is located just south of the city of St. Louis. The village was founded in the late 19th century and has a population of approximately 1,500 people. The village has a humid continental climate, with hot, humid summers and cold, snowy winters. The village is primarily a residential community, with most of its residents employed in the nearby cities of St. Louis and Kirkwood. The village is home to several small businesses, including a grocery store, a hardware store, and a few restaurants. Grantwood Village has a rich history and is a great place to live and work.
Common Questions
What is the Total Population of Grantwood Village?
Total Population of Grantwood Village is 924.
What is the Total Male Population of Grantwood Village?
Total Male Population of Grantwood Village is 424.
What is the Total Female Population of Grantwood Village?
Total Female Population of Grantwood Village is 500.
What is the Ratio of Males per 100 Females in Grantwood Village?
There are 84.80 Males per 100 Females in Grantwood Village.
What is the Ratio of Females per 100 Males in Grantwood Village?
There are 117.92 Females per 100 Males in Grantwood Village.
What is the Median Population Age in Grantwood Village?
Median Population Age in Grantwood Village is 54.9 Years.
What is the Average Family Size in Grantwood Village
Average Family Size in Grantwood Village is 2.7 People.
What is the Average Household Size in Grantwood Village
Average Household Size in Grantwood Village is 2.5 People.
What is Per Capita Income in Grantwood Village?
Per Capita income in Grantwood Village is $73,908.
What is the Median Family Income in Grantwood Village?
Median Family Income in Grantwood Village is $143,947.
What is the Median Household income in Grantwood Village?
Median Household Income in Grantwood Village is $131,250.
What is Income or Wage Gap in Grantwood Village?
Income or Wage Gap in Grantwood Village is 47.5%.
Women in Grantwood Village earn 52.5 cents for every dollar earned by a man.
What is Inequality or Gini Index in Grantwood Village?
Inequality or Gini Index in Grantwood Village is 0.41.
How Large is the Labor Force in Grantwood Village?
There are 473 People in the Labor Forcein in Grantwood Village.
What is the Percentage of People in the Labor Force in Grantwood Village?
61.0% of People are in the Labor Force in Grantwood Village.
What is the Unemployment Rate in Grantwood Village?
Unemployment Rate in Grantwood Village is 2.5%.