Brownsdale, MN
Brownsdale Map
Brownsdale Overview
797
TOTAL POPULATION
449
MALE POPULATION
348
FEMALE POPULATION
129.02
MALES / 100 FEMALES
77.51
FEMALES / 100 MALES
43.8
MEDIAN AGE
2.9
AVG FAMILY SIZE
2.3
AVG HOUSEHOLD SIZE
$30,523
PER CAPITA INCOME
$75,000
AVG FAMILY INCOME
$63,750
AVG HOUSEHOLD INCOME
18.2%
WAGE / INCOME GAP [ % ]
81.8¢/ $1
WAGE / INCOME GAP [ $ ]
0.32
INEQUALITY / GINI INDEX
469
LABOR FORCE [ PEOPLE ]
71.3%
PERCENT IN LABOR FORCE
4.9%
UNEMPLOYMENT RATE
Brownsdale Zip Codes
Brownsdale Area Codes
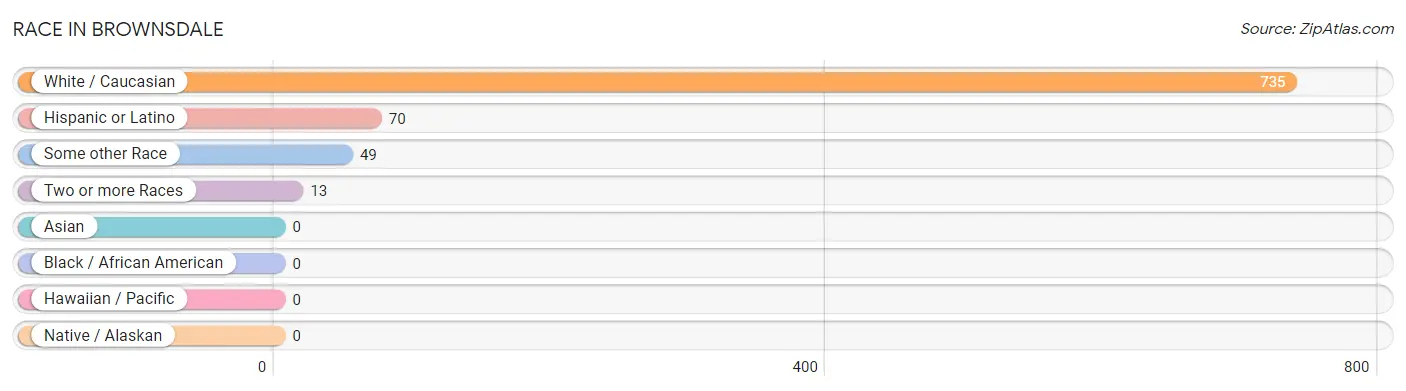
Race in Brownsdale
The most populous races in Brownsdale are White / Caucasian (735 | 92.2%), Hispanic or Latino (70 | 8.8%), and Some other Race (49 | 6.1%).
| Race | # Population | % Population |
| Asian | 0 | 0.0% |
| Black / African American | 0 | 0.0% |
| Hawaiian / Pacific | 0 | 0.0% |
| Hispanic or Latino | 70 | 8.8% |
| Native / Alaskan | 0 | 0.0% |
| White / Caucasian | 735 | 92.2% |
| Two or more Races | 13 | 1.6% |
| Some other Race | 49 | 6.1% |
| Total | 797 | 100.0% |
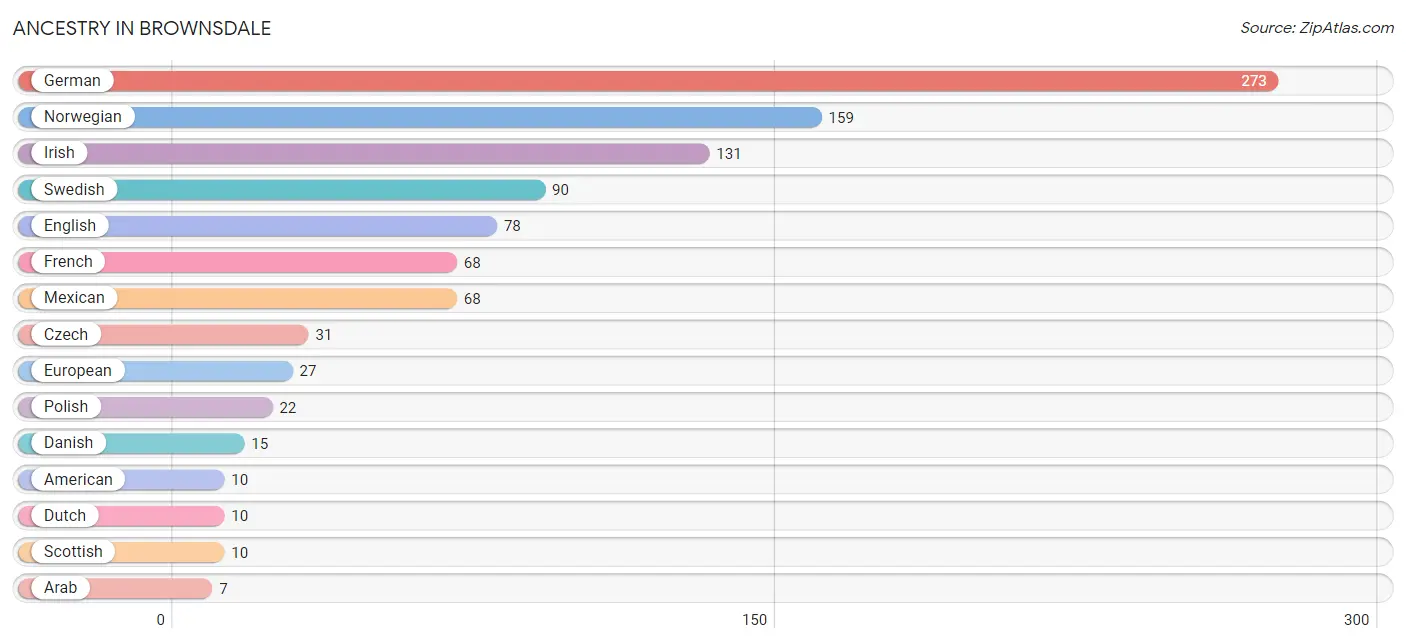
Ancestry in Brownsdale
The most populous ancestries reported in Brownsdale are German (273 | 34.3%), Norwegian (159 | 20.0%), Irish (131 | 16.4%), Swedish (90 | 11.3%), and English (78 | 9.8%), together accounting for 91.7% of all Brownsdale residents.
| Ancestry | # Population | % Population |
| American | 10 | 1.3% |
| Arab | 7 | 0.9% |
| Cherokee | 2 | 0.3% |
| Czech | 31 | 3.9% |
| Danish | 15 | 1.9% |
| Dutch | 10 | 1.3% |
| English | 78 | 9.8% |
| European | 27 | 3.4% |
| French | 68 | 8.5% |
| French Canadian | 7 | 0.9% |
| German | 273 | 34.3% |
| Hungarian | 1 | 0.1% |
| Irish | 131 | 16.4% |
| Italian | 6 | 0.7% |
| Lebanese | 7 | 0.9% |
| Mexican | 68 | 8.5% |
| Norwegian | 159 | 20.0% |
| Polish | 22 | 2.8% |
| Scandinavian | 3 | 0.4% |
| Scotch-Irish | 3 | 0.4% |
| Scottish | 10 | 1.3% |
| Slovak | 2 | 0.3% |
| Spanish | 2 | 0.3% |
| Swedish | 90 | 11.3% | View All 24 Rows |
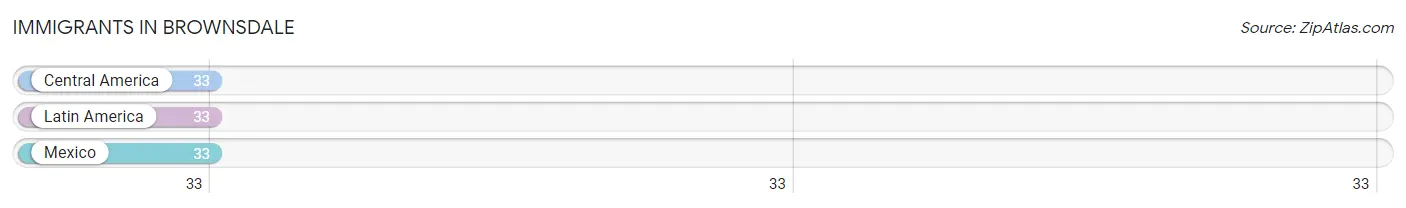
Immigrants in Brownsdale
The most numerous immigrant groups reported in Brownsdale came from Central America (33 | 4.1%), Latin America (33 | 4.1%), and Mexico (33 | 4.1%), together accounting for 12.4% of all Brownsdale residents.
| Immigration Origin | # Population | % Population |
| Central America | 33 | 4.1% |
| Latin America | 33 | 4.1% |
| Mexico | 33 | 4.1% | View All 3 Rows |
Sex and Age in Brownsdale
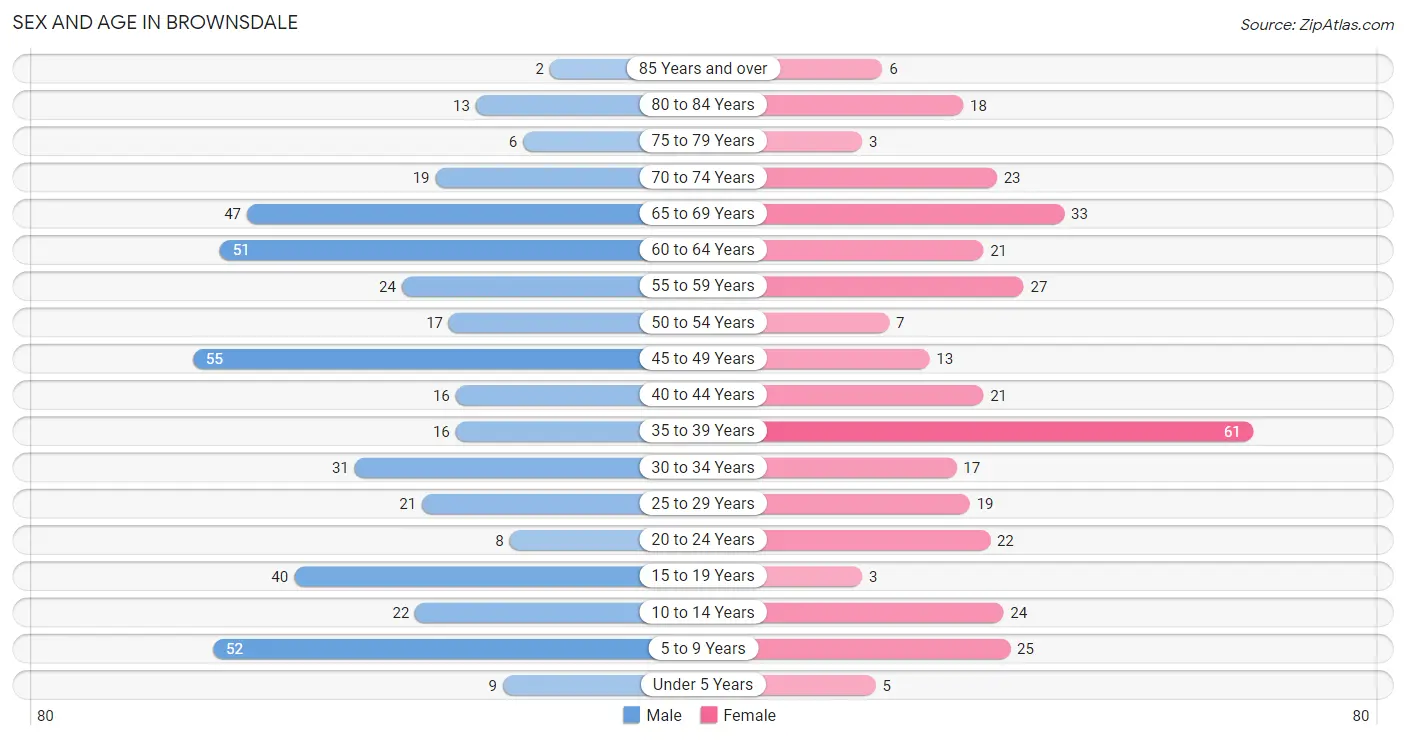
Sex and Age in Brownsdale
The most populous age groups in Brownsdale are 45 to 49 Years (55 | 12.2%) for men and 35 to 39 Years (61 | 17.5%) for women.
| Age Bracket | Male | Female |
| Under 5 Years | 9 (2.0%) | 5 (1.4%) |
| 5 to 9 Years | 52 (11.6%) | 25 (7.2%) |
| 10 to 14 Years | 22 (4.9%) | 24 (6.9%) |
| 15 to 19 Years | 40 (8.9%) | 3 (0.9%) |
| 20 to 24 Years | 8 (1.8%) | 22 (6.3%) |
| 25 to 29 Years | 21 (4.7%) | 19 (5.5%) |
| 30 to 34 Years | 31 (6.9%) | 17 (4.9%) |
| 35 to 39 Years | 16 (3.6%) | 61 (17.5%) |
| 40 to 44 Years | 16 (3.6%) | 21 (6.0%) |
| 45 to 49 Years | 55 (12.2%) | 13 (3.7%) |
| 50 to 54 Years | 17 (3.8%) | 7 (2.0%) |
| 55 to 59 Years | 24 (5.3%) | 27 (7.8%) |
| 60 to 64 Years | 51 (11.4%) | 21 (6.0%) |
| 65 to 69 Years | 47 (10.5%) | 33 (9.5%) |
| 70 to 74 Years | 19 (4.2%) | 23 (6.6%) |
| 75 to 79 Years | 6 (1.3%) | 3 (0.9%) |
| 80 to 84 Years | 13 (2.9%) | 18 (5.2%) |
| 85 Years and over | 2 (0.4%) | 6 (1.7%) |
| Total | 449 (100.0%) | 348 (100.0%) |
Families and Households in Brownsdale
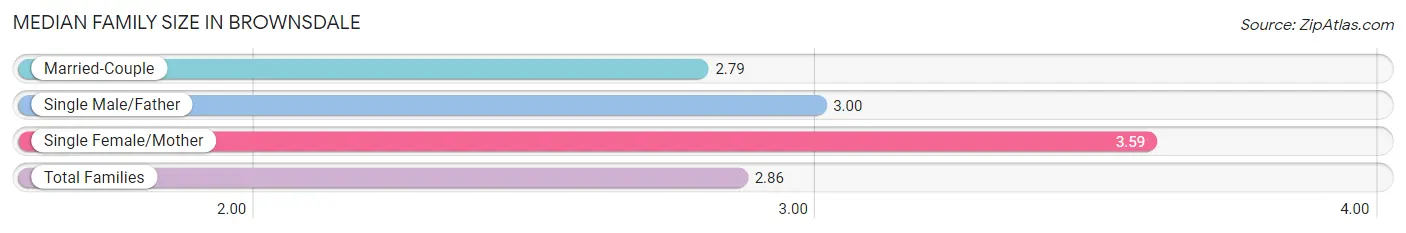
Median Family Size in Brownsdale
The median family size in Brownsdale is 2.86 persons per family, with single female/mother families (17 | 8.1%) accounting for the largest median family size of 3.59 persons per family. On the other hand, married-couple families (190 | 90.5%) represent the smallest median family size with 2.79 persons per family.
| Family Type | # Families | Family Size |
| Married-Couple | 190 (90.5%) | 2.79 |
| Single Male/Father | 3 (1.4%) | 3.00 |
| Single Female/Mother | 17 (8.1%) | 3.59 |
| Total Families | 210 (100.0%) | 2.86 |
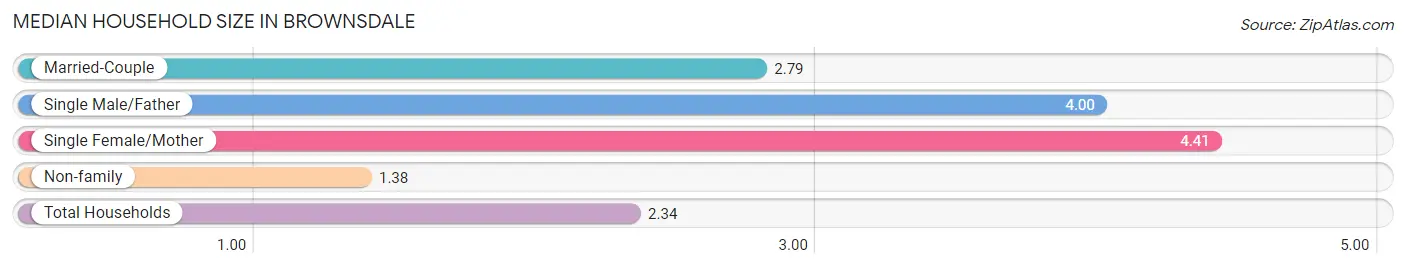
Median Household Size in Brownsdale
The median household size in Brownsdale is 2.34 persons per household, with single female/mother households (17 | 5.0%) accounting for the largest median household size of 4.41 persons per household. non-family households (130 | 38.2%) represent the smallest median household size with 1.38 persons per household.
| Household Type | # Households | Household Size |
| Married-Couple | 190 (55.9%) | 2.79 |
| Single Male/Father | 3 (0.9%) | 4.00 |
| Single Female/Mother | 17 (5.0%) | 4.41 |
| Non-family | 130 (38.2%) | 1.38 |
| Total Households | 340 (100.0%) | 2.34 |
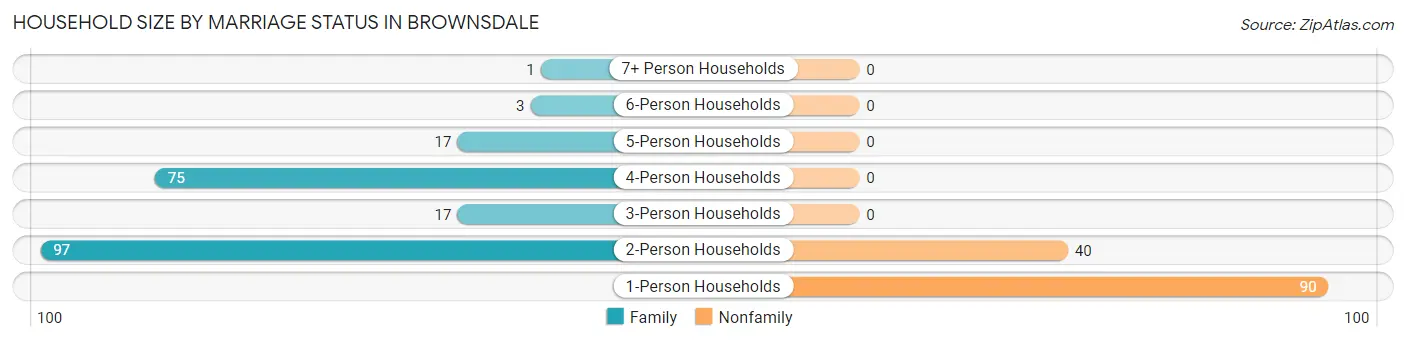
Household Size by Marriage Status in Brownsdale
Out of a total of 340 households in Brownsdale, 210 (61.8%) are family households, while 130 (38.2%) are nonfamily households. The most numerous type of family households are 2-person households, comprising 97, and the most common type of nonfamily households are 1-person households, comprising 90.
| Household Size | Family Households | Nonfamily Households |
| 1-Person Households | - | 90 (26.5%) |
| 2-Person Households | 97 (28.5%) | 40 (11.8%) |
| 3-Person Households | 17 (5.0%) | 0 (0.0%) |
| 4-Person Households | 75 (22.1%) | 0 (0.0%) |
| 5-Person Households | 17 (5.0%) | 0 (0.0%) |
| 6-Person Households | 3 (0.9%) | 0 (0.0%) |
| 7+ Person Households | 1 (0.3%) | 0 (0.0%) |
| Total | 210 (61.8%) | 130 (38.2%) |
Female Fertility in Brownsdale
Fertility by Age in Brownsdale
Average fertility rate in Brownsdale is 119.0 births per 1,000 women. Women in the age bracket of 20 to 34 years have the highest fertility rate with 293.0 births per 1,000 women. Women in the age bracket of 20 to 34 years acount for 89.5% of all women with births.
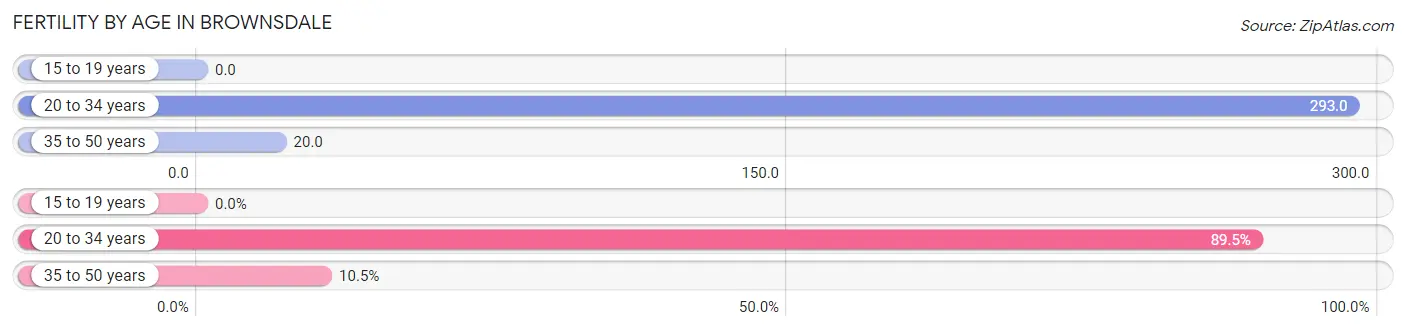
| Age Bracket | Women with Births | Births / 1,000 Women |
| 15 to 19 years | 0 (0.0%) | 0.0 |
| 20 to 34 years | 17 (89.5%) | 293.0 |
| 35 to 50 years | 2 (10.5%) | 20.0 |
| Total | 19 (100.0%) | 119.0 |
Fertility by Age by Marriage Status in Brownsdale
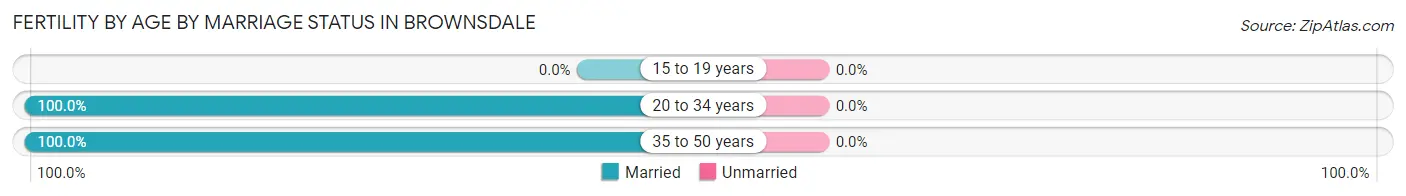
| Age Bracket | Married | Unmarried |
| 15 to 19 years | 0 (0.0%) | 0 (0.0%) |
| 20 to 34 years | 17 (100.0%) | 0 (0.0%) |
| 35 to 50 years | 2 (100.0%) | 0 (0.0%) |
| Total | 19 (100.0%) | 0 (0.0%) |
Fertility by Education in Brownsdale
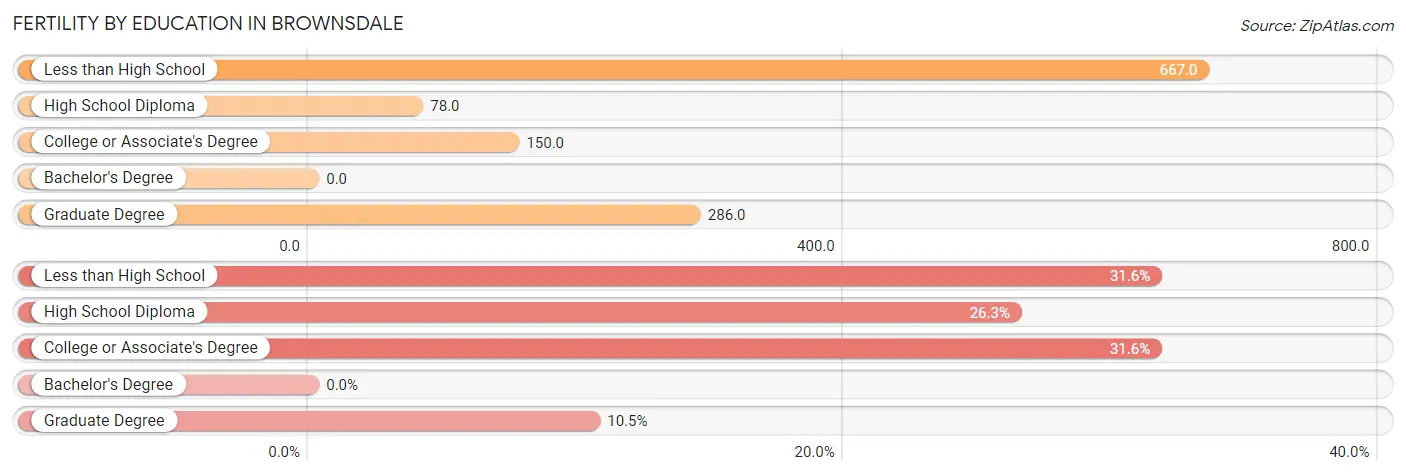
| Educational Attainment | Women with Births | Births / 1,000 Women |
| Less than High School | 6 (31.6%) | 667.0 |
| High School Diploma | 5 (26.3%) | 78.0 |
| College or Associate's Degree | 6 (31.6%) | 150.0 |
| Bachelor's Degree | 0 (0.0%) | 0.0 |
| Graduate Degree | 2 (10.5%) | 286.0 |
| Total | 19 (100.0%) | 119.0 |
Fertility by Education by Marriage Status in Brownsdale
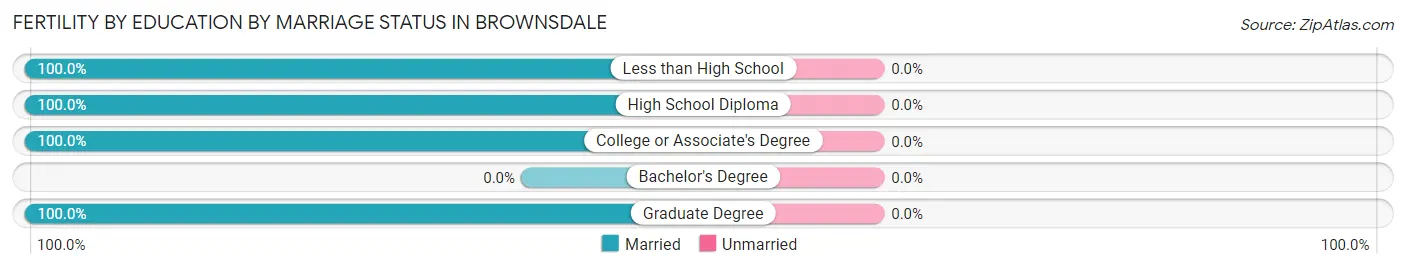
| Educational Attainment | Married | Unmarried |
| Less than High School | 6 (100.0%) | 0 (0.0%) |
| High School Diploma | 5 (100.0%) | 0 (0.0%) |
| College or Associate's Degree | 6 (100.0%) | 0 (0.0%) |
| Bachelor's Degree | 0 (0.0%) | 0 (0.0%) |
| Graduate Degree | 2 (100.0%) | 0 (0.0%) |
| Total | 19 (100.0%) | 0 (0.0%) |
Income in Brownsdale
Income Overview in Brownsdale
Per Capita Income in Brownsdale is $30,523, while median incomes of families and households are $75,000 and $63,750 respectively.
| Characteristic | Number | Measure |
| Per Capita Income | 797 | $30,523 |
| Median Family Income | 210 | $75,000 |
| Mean Family Income | 210 | $79,286 |
| Median Household Income | 340 | $63,750 |
| Mean Household Income | 340 | $71,607 |
| Income Deficit | 210 | $0 |
| Wage / Income Gap (%) | 797 | 18.18% |
| Wage / Income Gap ($) | 797 | 81.82¢ per $1 |
| Gini / Inequality Index | 797 | 0.32 |
Earnings by Sex in Brownsdale
Average Earnings in Brownsdale are $31,979, $29,455 for men and $36,000 for women, a difference of 18.2%.
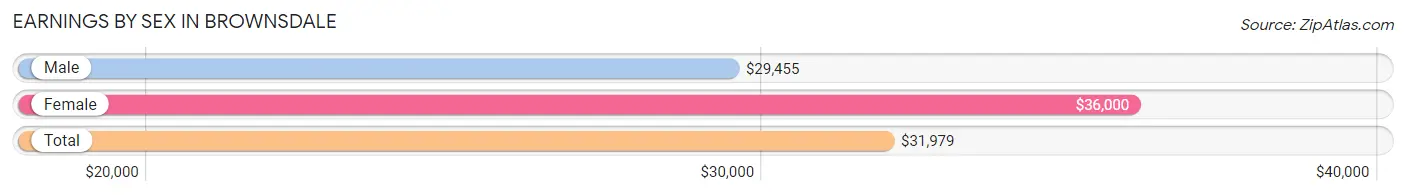
| Sex | Number | Average Earnings |
| Male | 297 (59.8%) | $29,455 |
| Female | 200 (40.2%) | $36,000 |
| Total | 497 (100.0%) | $31,979 |
Earnings by Sex by Income Bracket in Brownsdale
The most common earnings brackets in Brownsdale are $25,000 to $29,999 for men (52 | 17.5%) and $30,000 to $34,999 for women (35 | 17.5%).
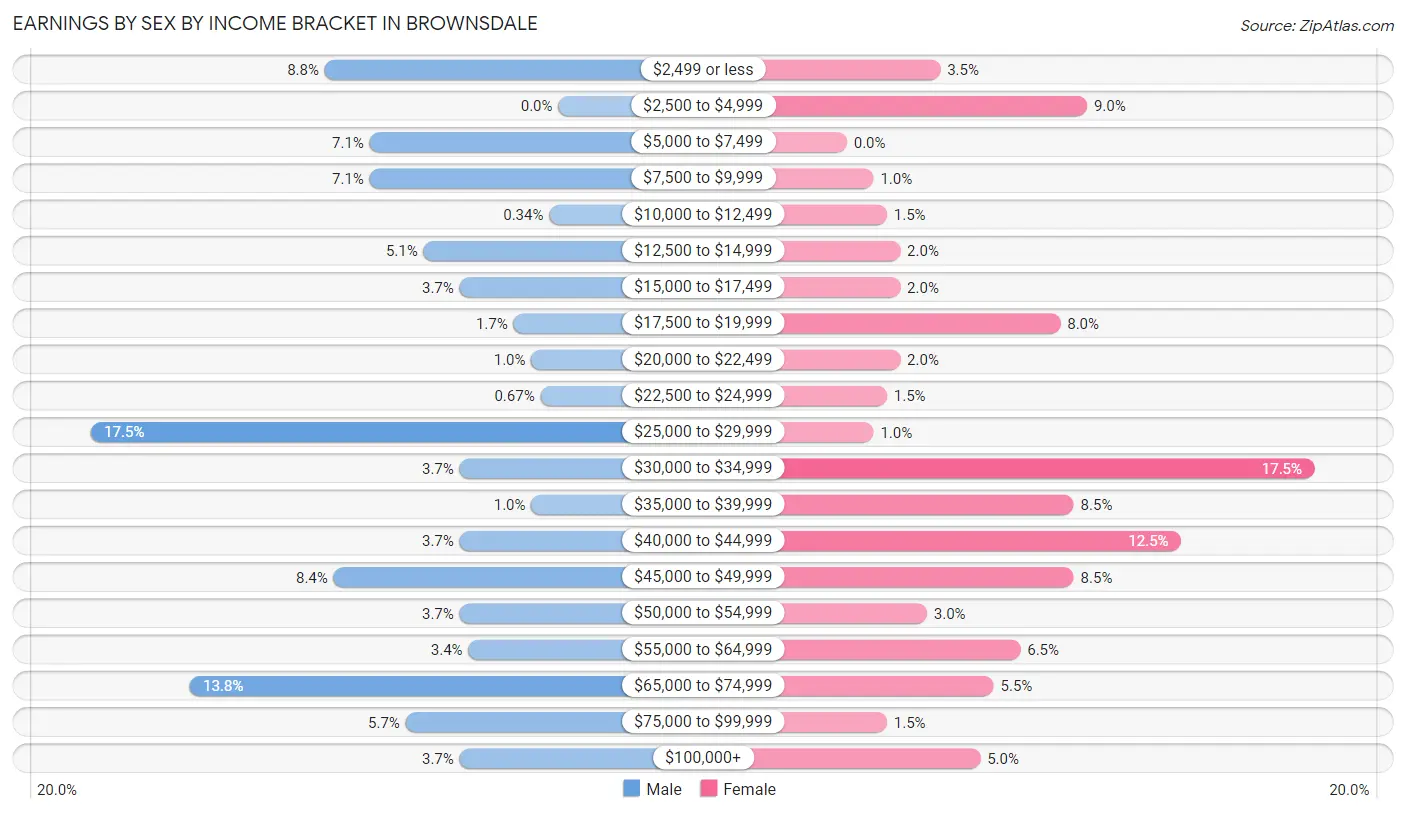
| Income | Male | Female |
| $2,499 or less | 26 (8.7%) | 7 (3.5%) |
| $2,500 to $4,999 | 0 (0.0%) | 18 (9.0%) |
| $5,000 to $7,499 | 21 (7.1%) | 0 (0.0%) |
| $7,500 to $9,999 | 21 (7.1%) | 2 (1.0%) |
| $10,000 to $12,499 | 1 (0.3%) | 3 (1.5%) |
| $12,500 to $14,999 | 15 (5.1%) | 4 (2.0%) |
| $15,000 to $17,499 | 11 (3.7%) | 4 (2.0%) |
| $17,500 to $19,999 | 5 (1.7%) | 16 (8.0%) |
| $20,000 to $22,499 | 3 (1.0%) | 4 (2.0%) |
| $22,500 to $24,999 | 2 (0.7%) | 3 (1.5%) |
| $25,000 to $29,999 | 52 (17.5%) | 2 (1.0%) |
| $30,000 to $34,999 | 11 (3.7%) | 35 (17.5%) |
| $35,000 to $39,999 | 3 (1.0%) | 17 (8.5%) |
| $40,000 to $44,999 | 11 (3.7%) | 25 (12.5%) |
| $45,000 to $49,999 | 25 (8.4%) | 17 (8.5%) |
| $50,000 to $54,999 | 11 (3.7%) | 6 (3.0%) |
| $55,000 to $64,999 | 10 (3.4%) | 13 (6.5%) |
| $65,000 to $74,999 | 41 (13.8%) | 11 (5.5%) |
| $75,000 to $99,999 | 17 (5.7%) | 3 (1.5%) |
| $100,000+ | 11 (3.7%) | 10 (5.0%) |
| Total | 297 (100.0%) | 200 (100.0%) |
Earnings by Sex by Educational Attainment in Brownsdale
Average earnings in Brownsdale are $35,417 for men and $38,854 for women, a difference of 8.8%. Men with an educational attainment of graduate degree enjoy the highest average annual earnings of $71,875, while those with college or associate's degree education earn the least with $29,000. Women with an educational attainment of graduate degree earn the most with the average annual earnings of $61,875, while those with high school diploma education have the smallest earnings of $31,389.
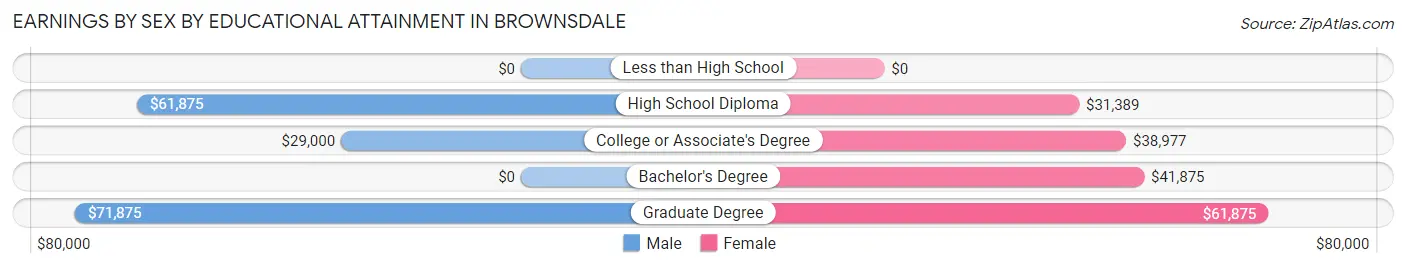
| Educational Attainment | Male Income | Female Income |
| Less than High School | - | - |
| High School Diploma | $61,875 | $31,389 |
| College or Associate's Degree | $29,000 | $38,977 |
| Bachelor's Degree | - | - |
| Graduate Degree | $71,875 | $61,875 |
| Total | $35,417 | $38,854 |
Family Income in Brownsdale
Family Income Brackets in Brownsdale
According to the Brownsdale family income data, there are 69 families falling into the $50,000 to $74,999 income range, which is the most common income bracket and makes up 32.9% of all families.
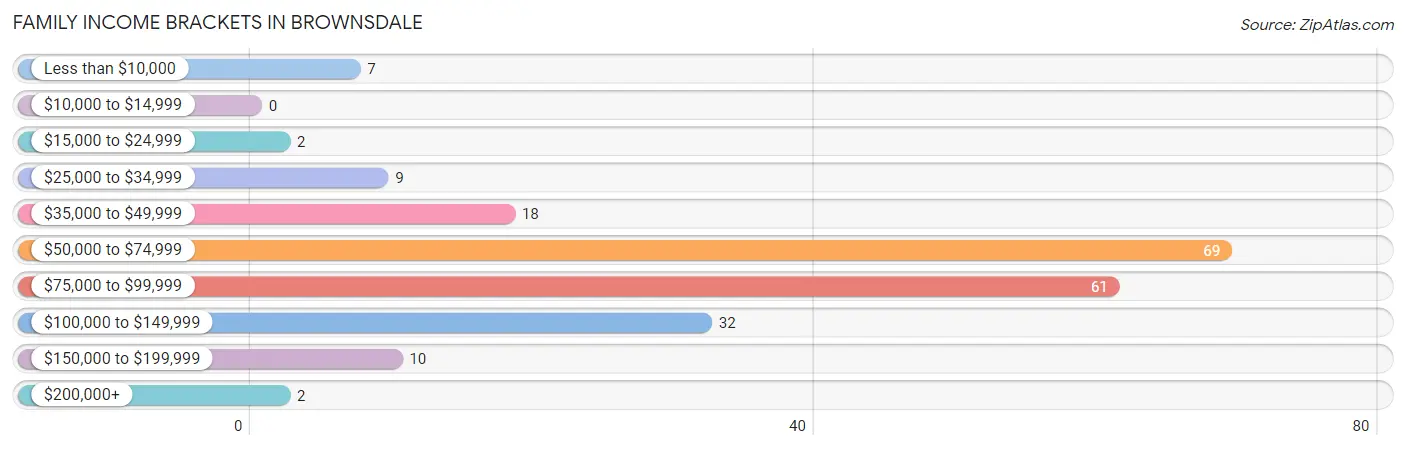
| Income Bracket | # Families | % Families |
| Less than $10,000 | 7 | 3.3% |
| $10,000 to $14,999 | 0 | 0.0% |
| $15,000 to $24,999 | 2 | 1.0% |
| $25,000 to $34,999 | 9 | 4.3% |
| $35,000 to $49,999 | 18 | 8.6% |
| $50,000 to $74,999 | 69 | 32.9% |
| $75,000 to $99,999 | 61 | 29.0% |
| $100,000 to $149,999 | 32 | 15.2% |
| $150,000 to $199,999 | 10 | 4.8% |
| $200,000+ | 2 | 1.0% |
Family Income by Famaliy Size in Brownsdale
5-person families (15 | 7.1%) account for the highest median family income in Brownsdale with $121,719 per family, while 2-person families (97 | 46.2%) have the highest median income of $39,453 per family member.
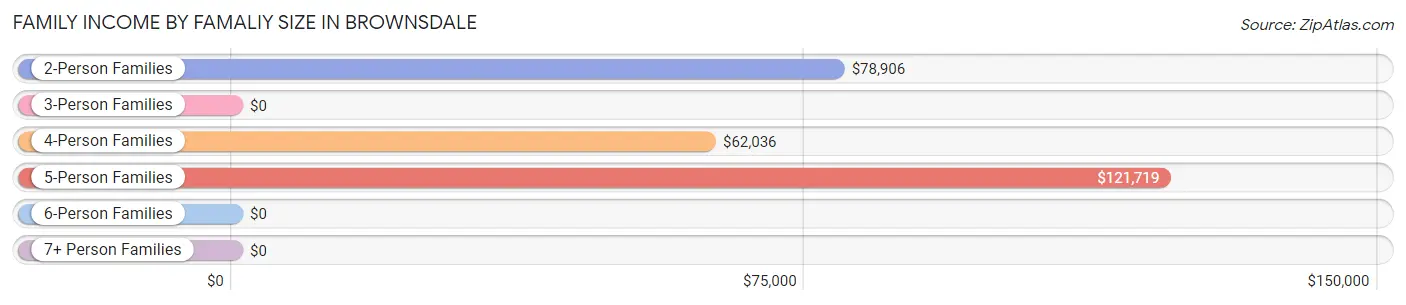
| Income Bracket | # Families | Median Income |
| 2-Person Families | 97 (46.2%) | $78,906 |
| 3-Person Families | 33 (15.7%) | $0 |
| 4-Person Families | 61 (29.0%) | $62,036 |
| 5-Person Families | 15 (7.1%) | $121,719 |
| 6-Person Families | 3 (1.4%) | $0 |
| 7+ Person Families | 1 (0.5%) | $0 |
| Total | 210 (100.0%) | $75,000 |
Family Income by Number of Earners in Brownsdale
The median family income in Brownsdale is $75,000, with families comprising 2 earners (71) having the highest median family income of $93,125, while families with 3+ earners (50) have the lowest median family income of $61,786, accounting for 33.8% and 23.8% of families, respectively.
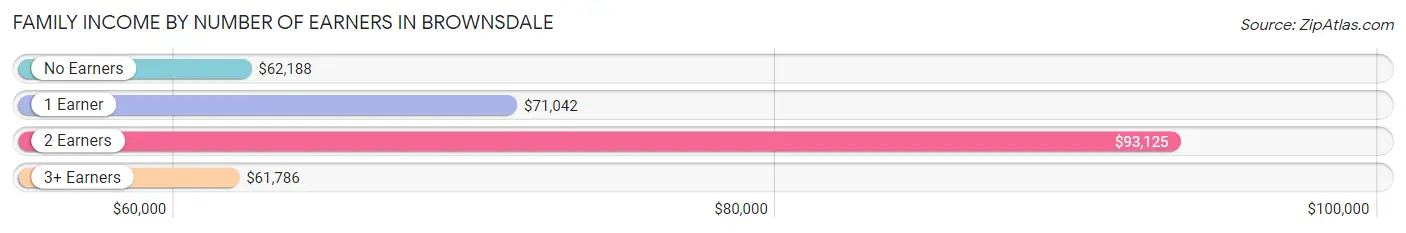
| Number of Earners | # Families | Median Income |
| No Earners | 26 (12.4%) | $62,188 |
| 1 Earner | 63 (30.0%) | $71,042 |
| 2 Earners | 71 (33.8%) | $93,125 |
| 3+ Earners | 50 (23.8%) | $61,786 |
| Total | 210 (100.0%) | $75,000 |
Household Income in Brownsdale
Household Income Brackets in Brownsdale
With 88 households falling in the category, the $75,000 to $99,999 income range is the most frequent in Brownsdale, accounting for 25.9% of all households. In contrast, only 2 households (0.6%) fall into the $200,000+ income bracket, making it the least populous group.
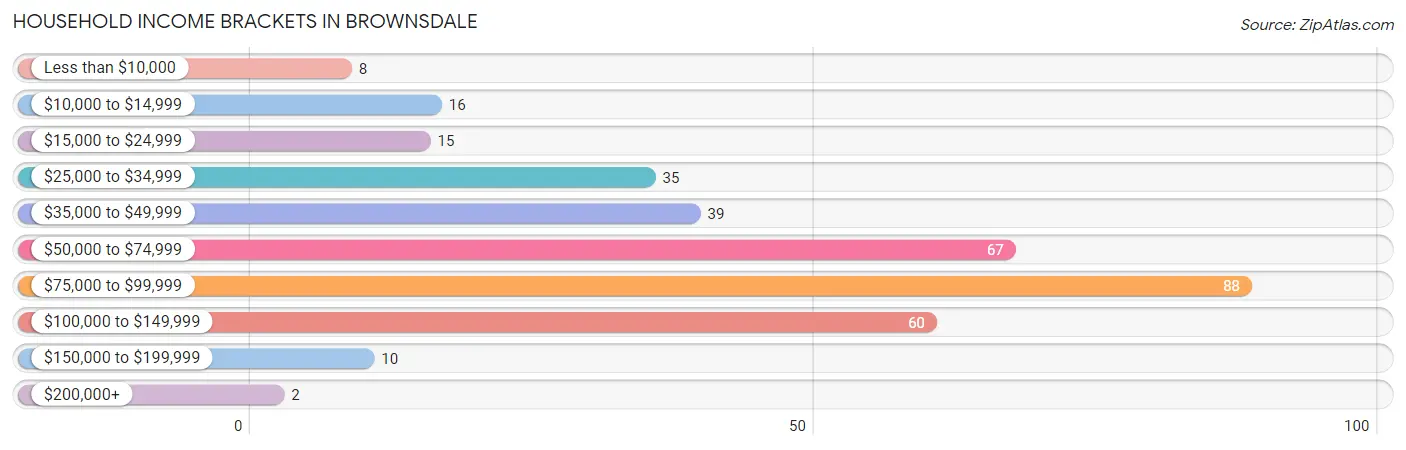
| Income Bracket | # Households | % Households |
| Less than $10,000 | 8 | 2.4% |
| $10,000 to $14,999 | 16 | 4.7% |
| $15,000 to $24,999 | 15 | 4.4% |
| $25,000 to $34,999 | 35 | 10.3% |
| $35,000 to $49,999 | 39 | 11.5% |
| $50,000 to $74,999 | 67 | 19.7% |
| $75,000 to $99,999 | 88 | 25.9% |
| $100,000 to $149,999 | 60 | 17.6% |
| $150,000 to $199,999 | 10 | 2.9% |
| $200,000+ | 2 | 0.6% |
Household Income by Householder Age in Brownsdale
The median household income in Brownsdale is $63,750, with the highest median household income of $78,750 found in the 45 to 64 years age bracket for the primary householder. A total of 147 households (43.2%) fall into this category. Meanwhile, the 15 to 24 years age bracket for the primary householder has the lowest median household income of $0, with 7 households (2.1%) in this group.
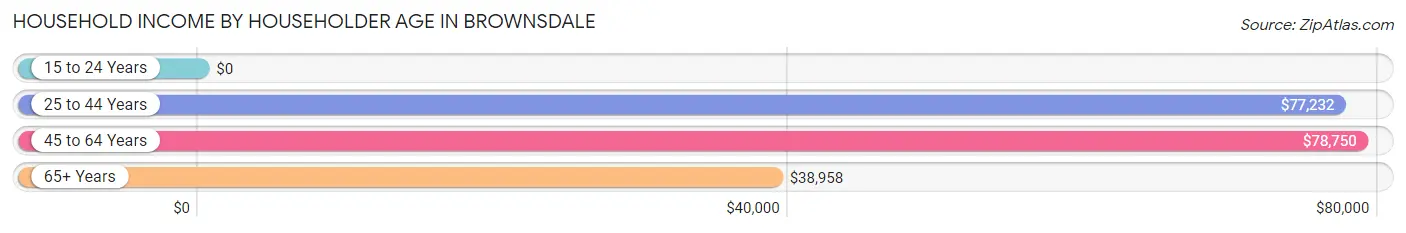
| Income Bracket | # Households | Median Income |
| 15 to 24 Years | 7 (2.1%) | $0 |
| 25 to 44 Years | 95 (27.9%) | $77,232 |
| 45 to 64 Years | 147 (43.2%) | $78,750 |
| 65+ Years | 91 (26.8%) | $38,958 |
| Total | 340 (100.0%) | $63,750 |
Poverty in Brownsdale
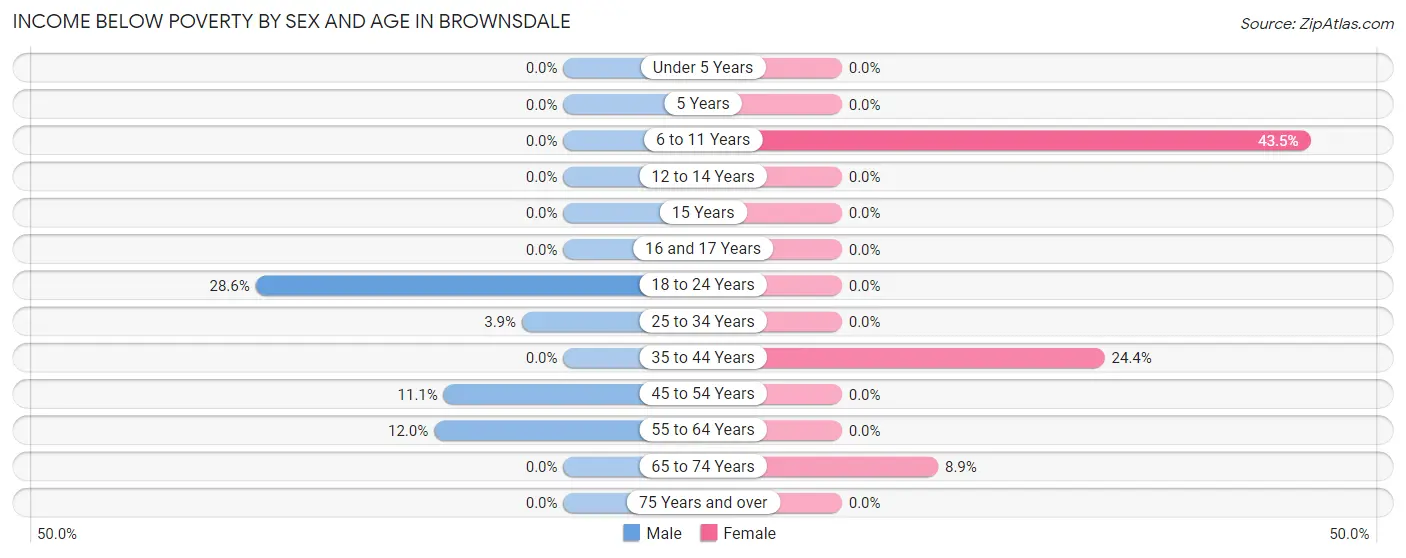
Income Below Poverty by Sex and Age in Brownsdale
With 6.9% poverty level for males and 10.1% for females among the residents of Brownsdale, 18 to 24 year old males and 6 to 11 year old females are the most vulnerable to poverty, with 12 males (28.6%) and 10 females (43.5%) in their respective age groups living below the poverty level.
| Age Bracket | Male | Female |
| Under 5 Years | 0 (0.0%) | 0 (0.0%) |
| 5 Years | 0 (0.0%) | 0 (0.0%) |
| 6 to 11 Years | 0 (0.0%) | 10 (43.5%) |
| 12 to 14 Years | 0 (0.0%) | 0 (0.0%) |
| 15 Years | 0 (0.0%) | 0 (0.0%) |
| 16 and 17 Years | 0 (0.0%) | 0 (0.0%) |
| 18 to 24 Years | 12 (28.6%) | 0 (0.0%) |
| 25 to 34 Years | 2 (3.8%) | 0 (0.0%) |
| 35 to 44 Years | 0 (0.0%) | 20 (24.4%) |
| 45 to 54 Years | 8 (11.1%) | 0 (0.0%) |
| 55 to 64 Years | 9 (12.0%) | 0 (0.0%) |
| 65 to 74 Years | 0 (0.0%) | 5 (8.9%) |
| 75 Years and over | 0 (0.0%) | 0 (0.0%) |
| Total | 31 (6.9%) | 35 (10.1%) |
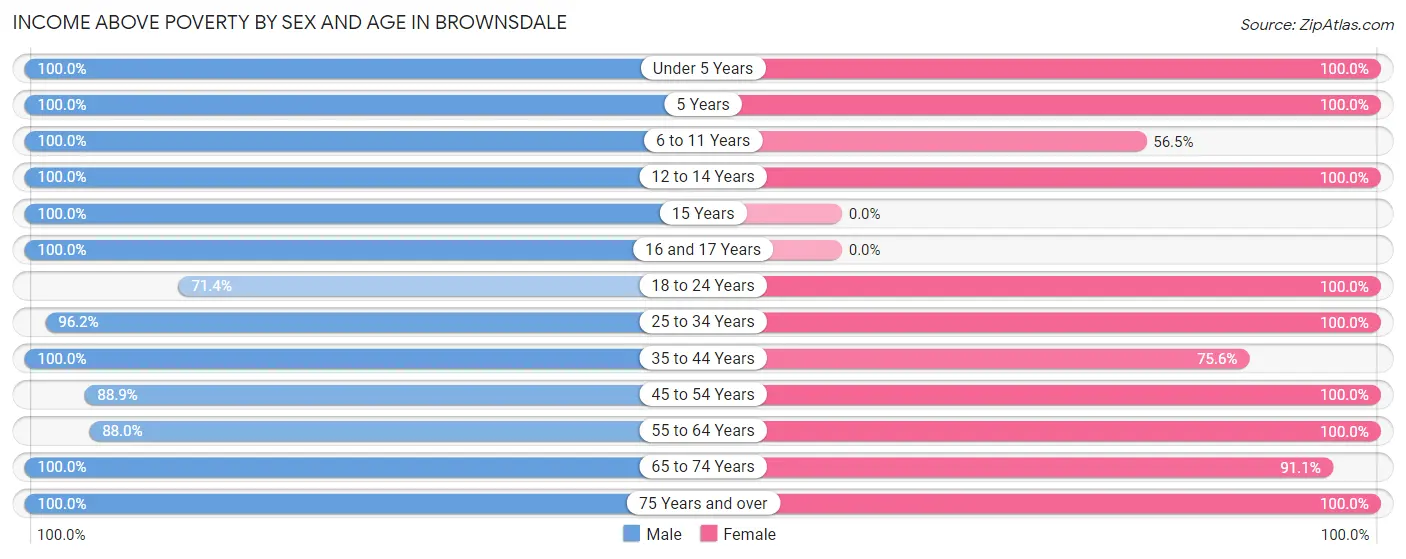
Income Above Poverty by Sex and Age in Brownsdale
According to the poverty statistics in Brownsdale, males aged under 5 years and females aged under 5 years are the age groups that are most secure financially, with 100.0% of males and 100.0% of females in these age groups living above the poverty line.
| Age Bracket | Male | Female |
| Under 5 Years | 9 (100.0%) | 5 (100.0%) |
| 5 Years | 17 (100.0%) | 4 (100.0%) |
| 6 to 11 Years | 41 (100.0%) | 13 (56.5%) |
| 12 to 14 Years | 16 (100.0%) | 22 (100.0%) |
| 15 Years | 2 (100.0%) | 0 (0.0%) |
| 16 and 17 Years | 4 (100.0%) | 0 (0.0%) |
| 18 to 24 Years | 30 (71.4%) | 25 (100.0%) |
| 25 to 34 Years | 50 (96.2%) | 36 (100.0%) |
| 35 to 44 Years | 32 (100.0%) | 62 (75.6%) |
| 45 to 54 Years | 64 (88.9%) | 20 (100.0%) |
| 55 to 64 Years | 66 (88.0%) | 48 (100.0%) |
| 65 to 74 Years | 66 (100.0%) | 51 (91.1%) |
| 75 Years and over | 21 (100.0%) | 27 (100.0%) |
| Total | 418 (93.1%) | 313 (89.9%) |
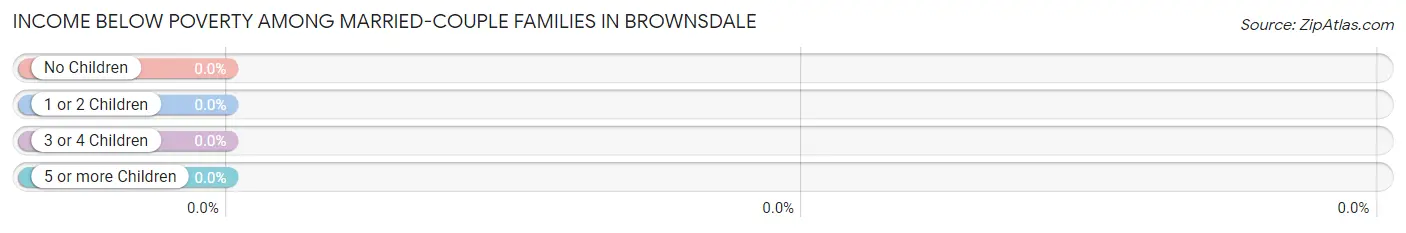
Income Below Poverty Among Married-Couple Families in Brownsdale
| Children | Above Poverty | Below Poverty |
| No Children | 103 (100.0%) | 0 (0.0%) |
| 1 or 2 Children | 74 (100.0%) | 0 (0.0%) |
| 3 or 4 Children | 13 (100.0%) | 0 (0.0%) |
| 5 or more Children | 0 (0.0%) | 0 (0.0%) |
| Total | 190 (100.0%) | 0 (0.0%) |
Income Below Poverty Among Single-Parent Households in Brownsdale

| Children | Single Father | Single Mother |
| No Children | 0 (0.0%) | 0 (0.0%) |
| 1 or 2 Children | 0 (0.0%) | 7 (46.7%) |
| 3 or 4 Children | 0 (0.0%) | 0 (0.0%) |
| 5 or more Children | 0 (0.0%) | 0 (0.0%) |
| Total | 0 (0.0%) | 7 (41.2%) |
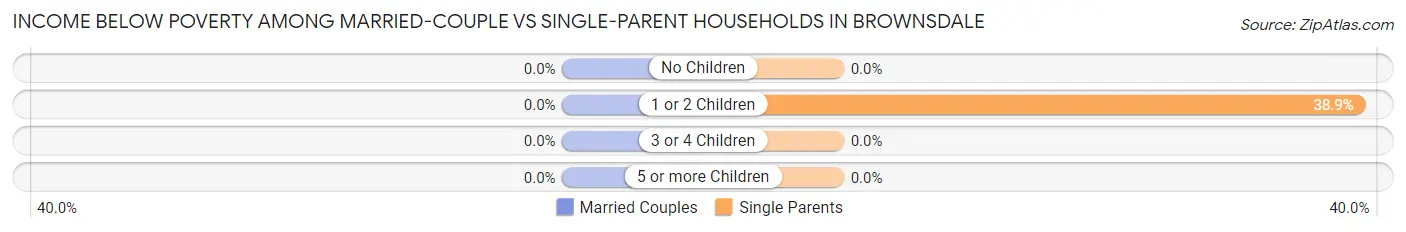
Income Below Poverty Among Married-Couple vs Single-Parent Households in Brownsdale
| Children | Married-Couple Families | Single-Parent Households |
| No Children | 0 (0.0%) | 0 (0.0%) |
| 1 or 2 Children | 0 (0.0%) | 7 (38.9%) |
| 3 or 4 Children | 0 (0.0%) | 0 (0.0%) |
| 5 or more Children | 0 (0.0%) | 0 (0.0%) |
| Total | 0 (0.0%) | 7 (35.0%) |
Employment Characteristics in Brownsdale
Employment by Class of Employer in Brownsdale
Among the 401 employed individuals in Brownsdale, private company employees (255 | 63.6%), not-for-profit organizations (62 | 15.5%), and self-employed (incorporated) (28 | 7.0%) make up the most common classes of employment.
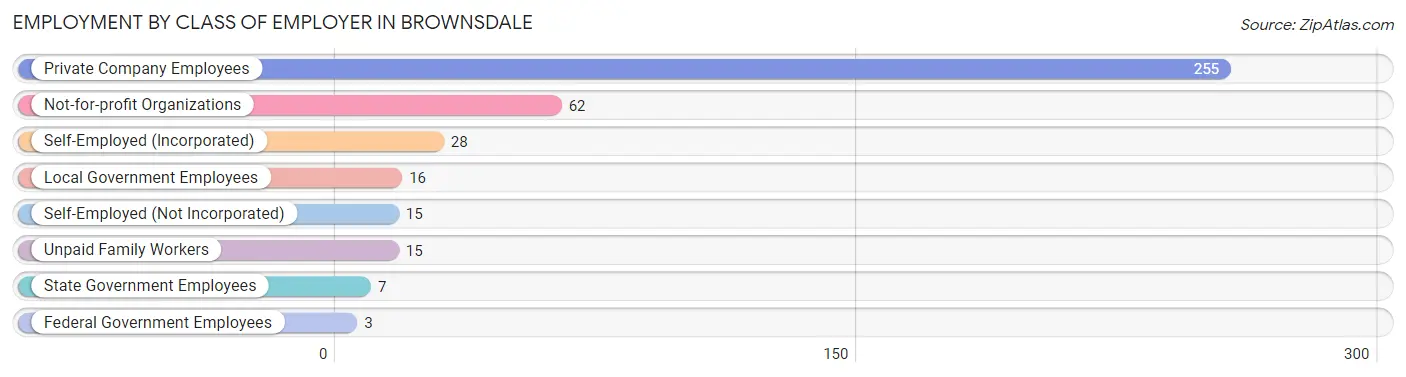
| Employer Class | # Employees | % Employees |
| Private Company Employees | 255 | 63.6% |
| Self-Employed (Incorporated) | 28 | 7.0% |
| Self-Employed (Not Incorporated) | 15 | 3.7% |
| Not-for-profit Organizations | 62 | 15.5% |
| Local Government Employees | 16 | 4.0% |
| State Government Employees | 7 | 1.8% |
| Federal Government Employees | 3 | 0.7% |
| Unpaid Family Workers | 15 | 3.7% |
| Total | 401 | 100.0% |
Employment Status by Age in Brownsdale
According to the labor force statistics for Brownsdale, out of the total population over 16 years of age (658), 71.3% or 469 individuals are in the labor force, with 4.9% or 23 of them unemployed. The age group with the highest labor force participation rate is 45 to 54 years, with 97.8% or 90 individuals in the labor force. Within the labor force, the 25 to 29 years age range has the highest percentage of unemployed individuals, with 15.8% or 6 of them being unemployed.
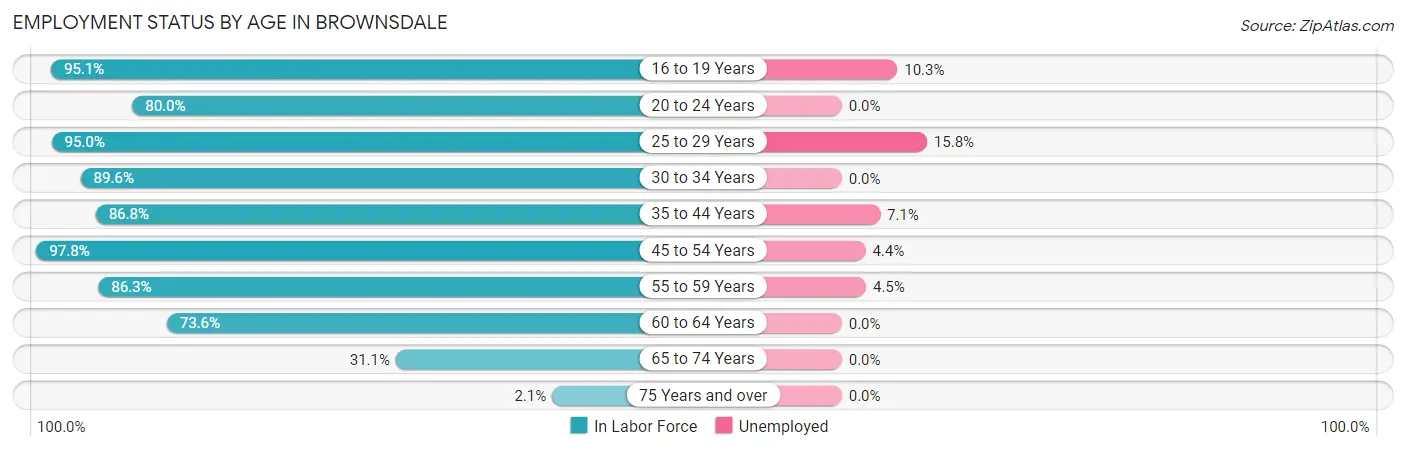
| Age Bracket | In Labor Force | Unemployed |
| 16 to 19 Years | 39 (95.1%) | 4 (10.3%) |
| 20 to 24 Years | 24 (80.0%) | 0 (0.0%) |
| 25 to 29 Years | 38 (95.0%) | 6 (15.8%) |
| 30 to 34 Years | 43 (89.6%) | 0 (0.0%) |
| 35 to 44 Years | 99 (86.8%) | 7 (7.1%) |
| 45 to 54 Years | 90 (97.8%) | 4 (4.4%) |
| 55 to 59 Years | 44 (86.3%) | 2 (4.5%) |
| 60 to 64 Years | 53 (73.6%) | 0 (0.0%) |
| 65 to 74 Years | 38 (31.1%) | 0 (0.0%) |
| 75 Years and over | 1 (2.1%) | 0 (0.0%) |
| Total | 469 (71.3%) | 23 (4.9%) |
Employment Status by Educational Attainment in Brownsdale
According to labor force statistics for Brownsdale, 88.0% of individuals (367) out of the total population between 25 and 64 years of age (417) are in the labor force, with 5.2% or 19 of them being unemployed. The group with the highest labor force participation rate are those with the educational attainment of college / associate degree, with 94.3% or 150 individuals in the labor force. Within the labor force, individuals with high school diploma education have the highest percentage of unemployment, with 7.1% or 9 of them being unemployed.
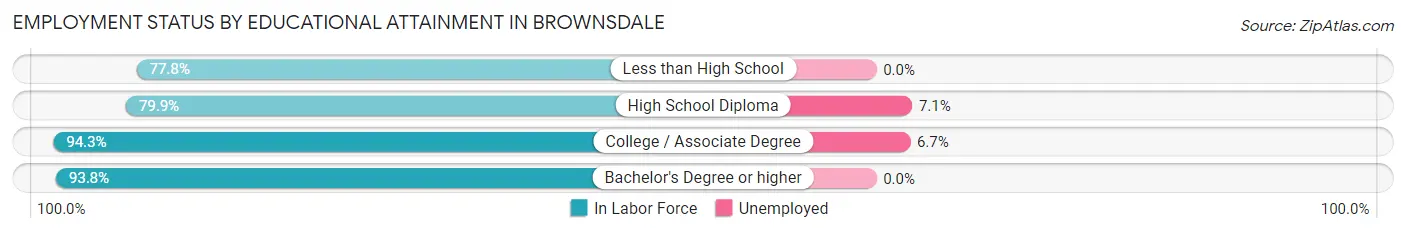
| Educational Attainment | In Labor Force | Unemployed |
| Less than High School | 14 (77.8%) | 0 (0.0%) |
| High School Diploma | 127 (79.9%) | 11 (7.1%) |
| College / Associate Degree | 150 (94.3%) | 11 (6.7%) |
| Bachelor's Degree or higher | 76 (93.8%) | 0 (0.0%) |
| Total | 367 (88.0%) | 22 (5.2%) |
Employment Occupations by Sex in Brownsdale
Management, Business, Science and Arts Occupations
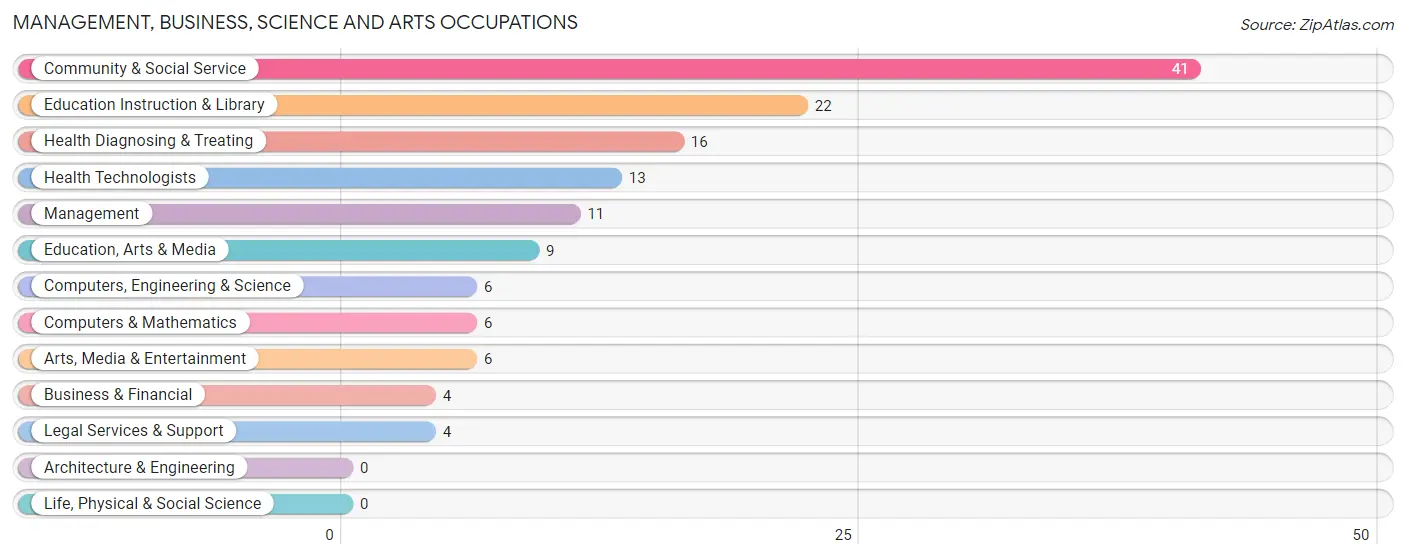
The most common Management, Business, Science and Arts occupations in Brownsdale are Community & Social Service (41 | 9.2%), Education Instruction & Library (22 | 4.9%), Health Diagnosing & Treating (16 | 3.6%), Health Technologists (13 | 2.9%), and Management (11 | 2.5%).
Management, Business, Science and Arts Occupations by Sex
Within the Management, Business, Science and Arts occupations in Brownsdale, the most male-oriented occupations are Computers, Engineering & Science (66.7%), Computers & Mathematics (66.7%), and Education, Arts & Media (55.6%), while the most female-oriented occupations are Legal Services & Support (100.0%), Health Diagnosing & Treating (100.0%), and Health Technologists (100.0%).
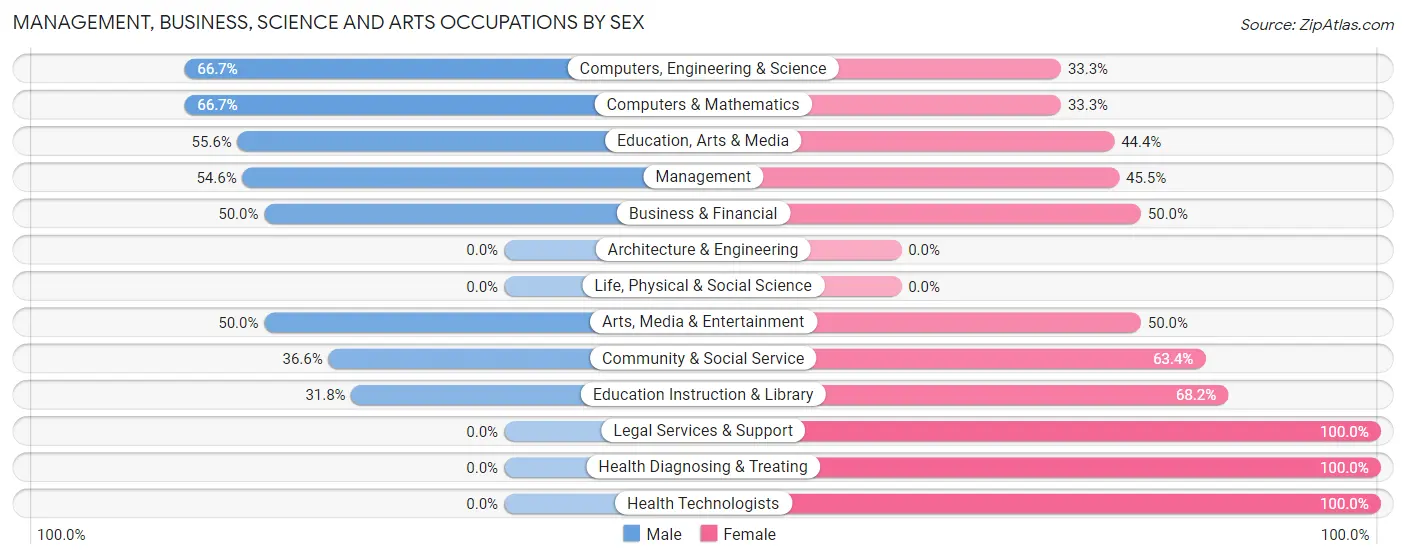
| Occupation | Male | Female |
| Management | 6 (54.5%) | 5 (45.5%) |
| Business & Financial | 2 (50.0%) | 2 (50.0%) |
| Computers, Engineering & Science | 4 (66.7%) | 2 (33.3%) |
| Computers & Mathematics | 4 (66.7%) | 2 (33.3%) |
| Architecture & Engineering | 0 (0.0%) | 0 (0.0%) |
| Life, Physical & Social Science | 0 (0.0%) | 0 (0.0%) |
| Community & Social Service | 15 (36.6%) | 26 (63.4%) |
| Education, Arts & Media | 5 (55.6%) | 4 (44.4%) |
| Legal Services & Support | 0 (0.0%) | 4 (100.0%) |
| Education Instruction & Library | 7 (31.8%) | 15 (68.2%) |
| Arts, Media & Entertainment | 3 (50.0%) | 3 (50.0%) |
| Health Diagnosing & Treating | 0 (0.0%) | 16 (100.0%) |
| Health Technologists | 0 (0.0%) | 13 (100.0%) |
| Total (Category) | 27 (34.6%) | 51 (65.4%) |
| Total (Overall) | 270 (60.5%) | 176 (39.5%) |
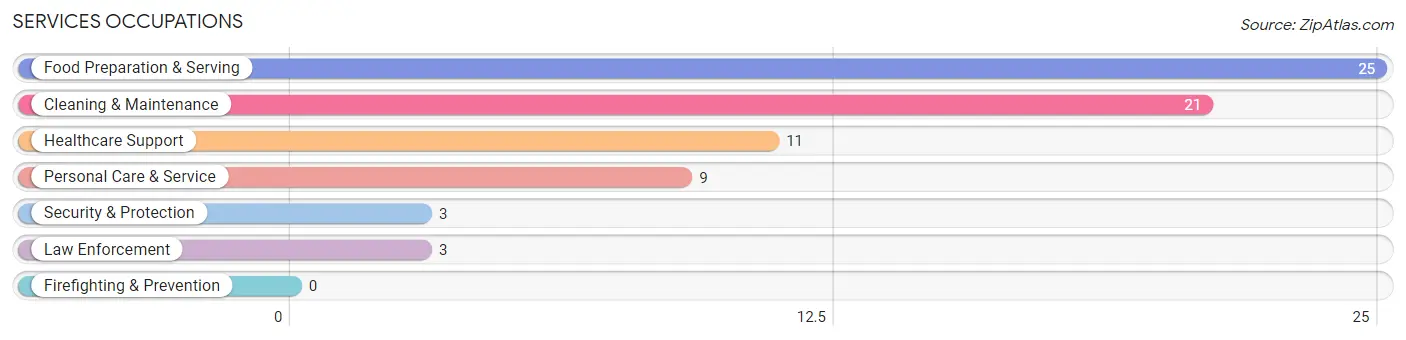
Services Occupations
The most common Services occupations in Brownsdale are Food Preparation & Serving (25 | 5.6%), Cleaning & Maintenance (21 | 4.7%), Healthcare Support (11 | 2.5%), Personal Care & Service (9 | 2.0%), and Security & Protection (3 | 0.7%).
Services Occupations by Sex
Within the Services occupations in Brownsdale, the most male-oriented occupations are Security & Protection (100.0%), Law Enforcement (100.0%), and Cleaning & Maintenance (90.5%), while the most female-oriented occupations are Personal Care & Service (100.0%), Healthcare Support (81.8%), and Food Preparation & Serving (20.0%).
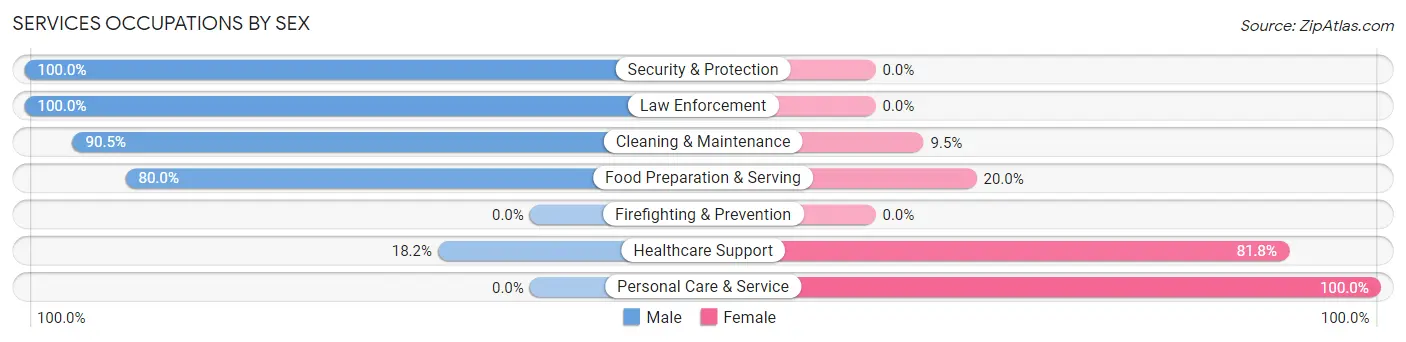
| Occupation | Male | Female |
| Healthcare Support | 2 (18.2%) | 9 (81.8%) |
| Security & Protection | 3 (100.0%) | 0 (0.0%) |
| Firefighting & Prevention | 0 (0.0%) | 0 (0.0%) |
| Law Enforcement | 3 (100.0%) | 0 (0.0%) |
| Food Preparation & Serving | 20 (80.0%) | 5 (20.0%) |
| Cleaning & Maintenance | 19 (90.5%) | 2 (9.5%) |
| Personal Care & Service | 0 (0.0%) | 9 (100.0%) |
| Total (Category) | 44 (63.8%) | 25 (36.2%) |
| Total (Overall) | 270 (60.5%) | 176 (39.5%) |
Sales and Office Occupations
The most common Sales and Office occupations in Brownsdale are Office & Administration (63 | 14.1%), and Sales & Related (39 | 8.7%).
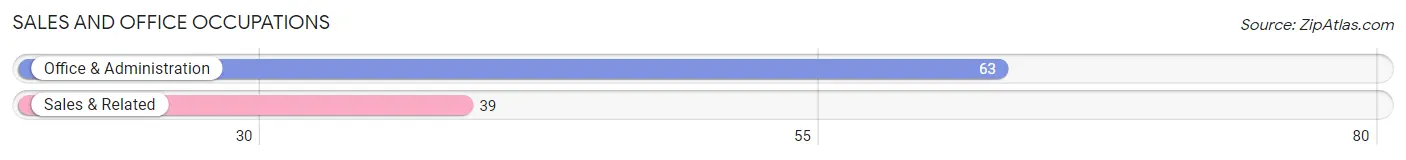
Sales and Office Occupations by Sex
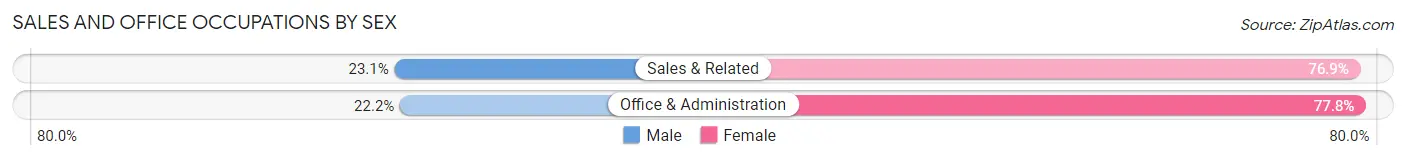
| Occupation | Male | Female |
| Sales & Related | 9 (23.1%) | 30 (76.9%) |
| Office & Administration | 14 (22.2%) | 49 (77.8%) |
| Total (Category) | 23 (22.6%) | 79 (77.4%) |
| Total (Overall) | 270 (60.5%) | 176 (39.5%) |
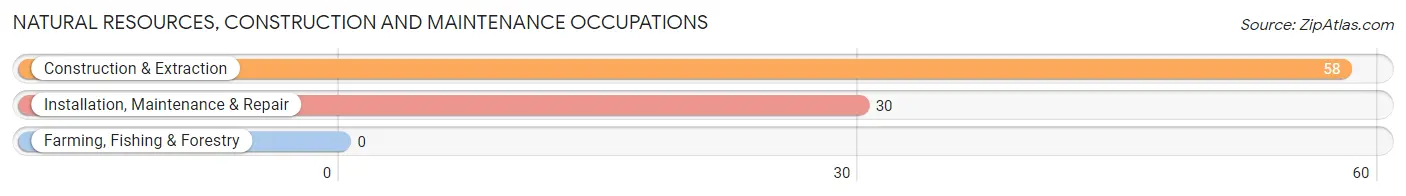
Natural Resources, Construction and Maintenance Occupations
The most common Natural Resources, Construction and Maintenance occupations in Brownsdale are Construction & Extraction (58 | 13.0%), and Installation, Maintenance & Repair (30 | 6.7%).
Natural Resources, Construction and Maintenance Occupations by Sex
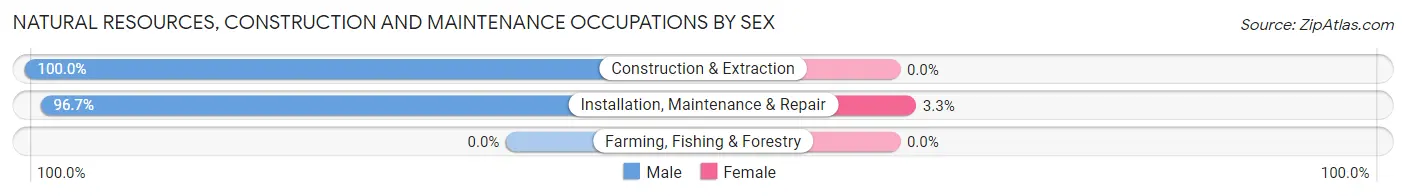
| Occupation | Male | Female |
| Farming, Fishing & Forestry | 0 (0.0%) | 0 (0.0%) |
| Construction & Extraction | 58 (100.0%) | 0 (0.0%) |
| Installation, Maintenance & Repair | 29 (96.7%) | 1 (3.3%) |
| Total (Category) | 87 (98.9%) | 1 (1.1%) |
| Total (Overall) | 270 (60.5%) | 176 (39.5%) |
Production, Transportation and Moving Occupations
The most common Production, Transportation and Moving occupations in Brownsdale are Production (48 | 10.8%), Material Moving (45 | 10.1%), and Transportation (16 | 3.6%).
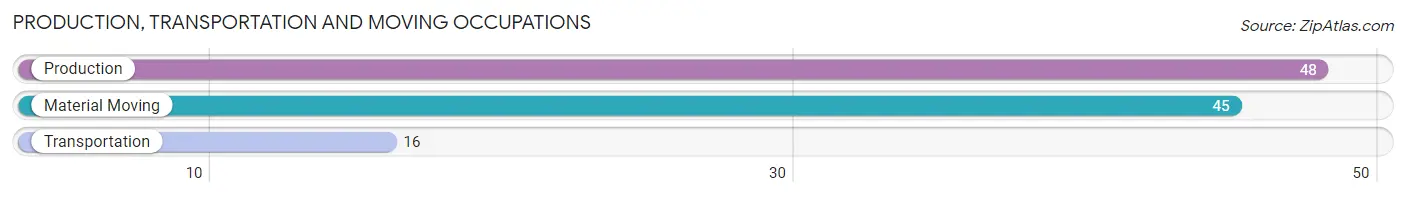
Production, Transportation and Moving Occupations by Sex
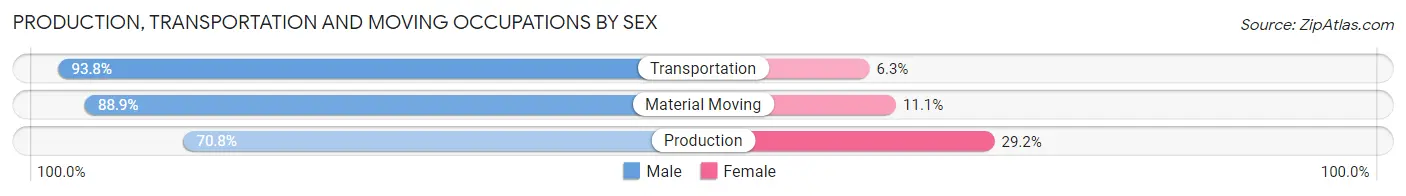
| Occupation | Male | Female |
| Production | 34 (70.8%) | 14 (29.2%) |
| Transportation | 15 (93.8%) | 1 (6.2%) |
| Material Moving | 40 (88.9%) | 5 (11.1%) |
| Total (Category) | 89 (81.7%) | 20 (18.3%) |
| Total (Overall) | 270 (60.5%) | 176 (39.5%) |
Employment Industries by Sex in Brownsdale
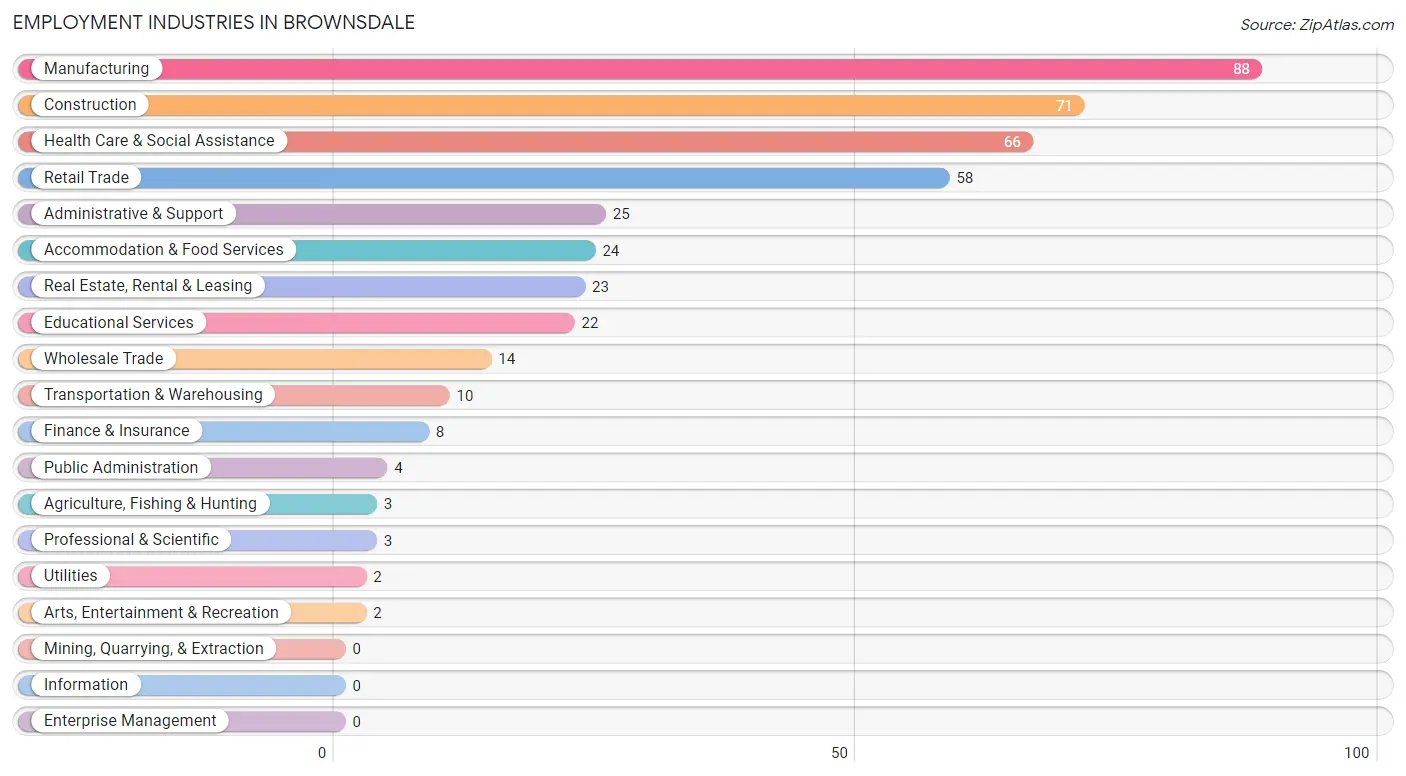
Employment Industries in Brownsdale
The major employment industries in Brownsdale include Manufacturing (88 | 19.7%), Construction (71 | 15.9%), Health Care & Social Assistance (66 | 14.8%), Retail Trade (58 | 13.0%), and Administrative & Support (25 | 5.6%).
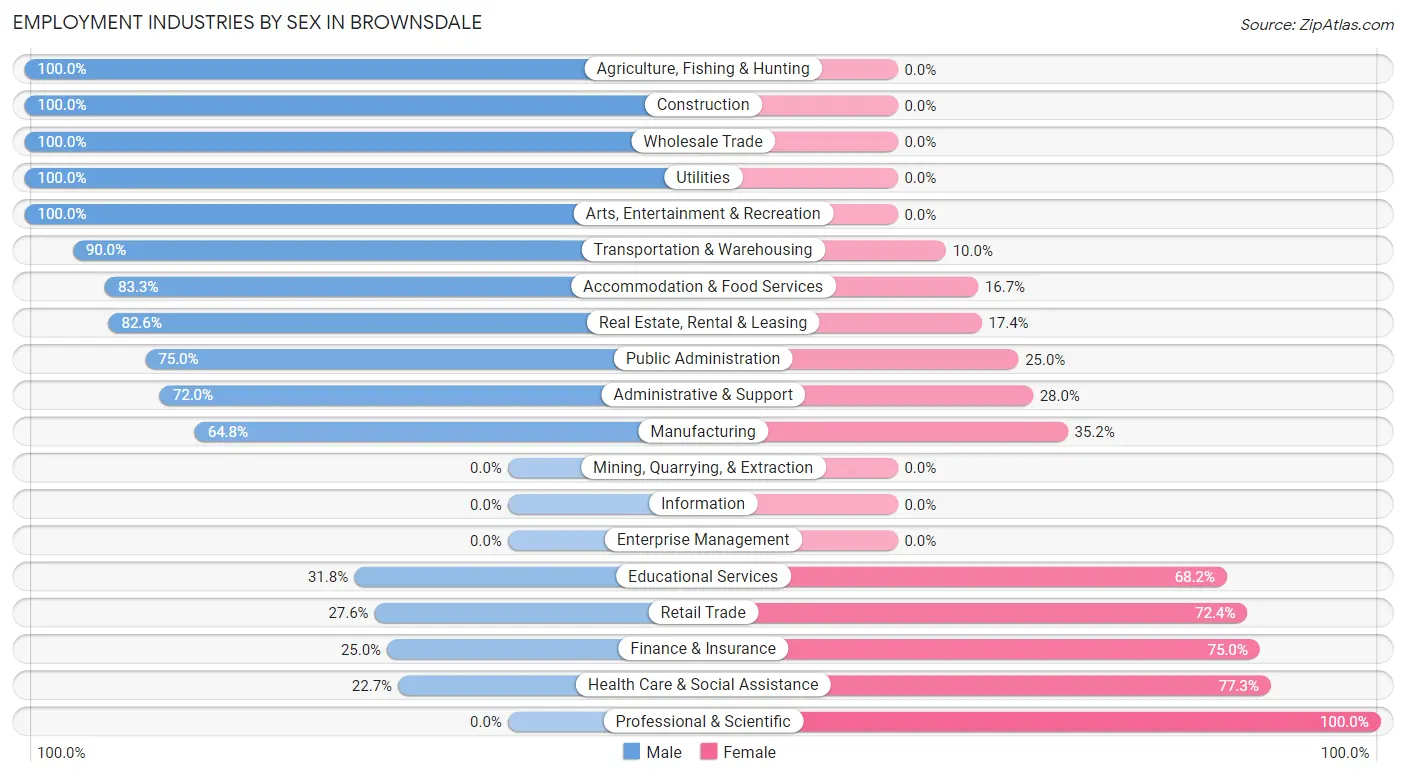
Employment Industries by Sex in Brownsdale
The Brownsdale industries that see more men than women are Agriculture, Fishing & Hunting (100.0%), Construction (100.0%), and Wholesale Trade (100.0%), whereas the industries that tend to have a higher number of women are Professional & Scientific (100.0%), Health Care & Social Assistance (77.3%), and Finance & Insurance (75.0%).
| Industry | Male | Female |
| Agriculture, Fishing & Hunting | 3 (100.0%) | 0 (0.0%) |
| Mining, Quarrying, & Extraction | 0 (0.0%) | 0 (0.0%) |
| Construction | 71 (100.0%) | 0 (0.0%) |
| Manufacturing | 57 (64.8%) | 31 (35.2%) |
| Wholesale Trade | 14 (100.0%) | 0 (0.0%) |
| Retail Trade | 16 (27.6%) | 42 (72.4%) |
| Transportation & Warehousing | 9 (90.0%) | 1 (10.0%) |
| Utilities | 2 (100.0%) | 0 (0.0%) |
| Information | 0 (0.0%) | 0 (0.0%) |
| Finance & Insurance | 2 (25.0%) | 6 (75.0%) |
| Real Estate, Rental & Leasing | 19 (82.6%) | 4 (17.4%) |
| Professional & Scientific | 0 (0.0%) | 3 (100.0%) |
| Enterprise Management | 0 (0.0%) | 0 (0.0%) |
| Administrative & Support | 18 (72.0%) | 7 (28.0%) |
| Educational Services | 7 (31.8%) | 15 (68.2%) |
| Health Care & Social Assistance | 15 (22.7%) | 51 (77.3%) |
| Arts, Entertainment & Recreation | 2 (100.0%) | 0 (0.0%) |
| Accommodation & Food Services | 20 (83.3%) | 4 (16.7%) |
| Public Administration | 3 (75.0%) | 1 (25.0%) |
| Total | 270 (60.5%) | 176 (39.5%) |
Education in Brownsdale
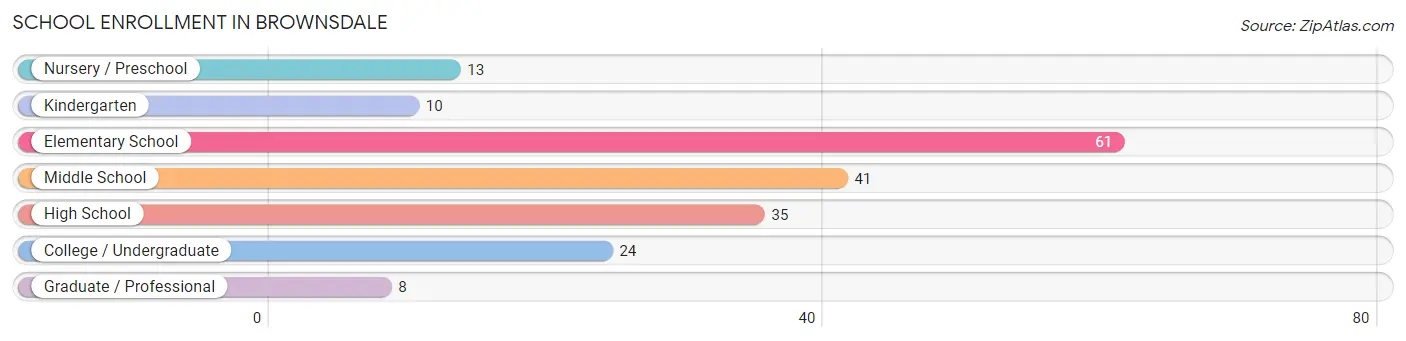
School Enrollment in Brownsdale
The most common levels of schooling among the 192 students in Brownsdale are elementary school (61 | 31.8%), middle school (41 | 21.3%), and high school (35 | 18.2%).
| School Level | # Students | % Students |
| Nursery / Preschool | 13 | 6.8% |
| Kindergarten | 10 | 5.2% |
| Elementary School | 61 | 31.8% |
| Middle School | 41 | 21.3% |
| High School | 35 | 18.2% |
| College / Undergraduate | 24 | 12.5% |
| Graduate / Professional | 8 | 4.2% |
| Total | 192 | 100.0% |
School Enrollment by Age by Funding Source in Brownsdale
Out of a total of 192 students who are enrolled in schools in Brownsdale, 28 (14.6%) attend a private institution, while the remaining 164 (85.4%) are enrolled in public schools. The age group of 35 years and over has the highest likelihood of being enrolled in private schools, with 12 (75.0% in the age bracket) enrolled. Conversely, the age group of 3 to 4 year olds has the lowest likelihood of being enrolled in a private school, with 2 (100.0% in the age bracket) attending a public institution.
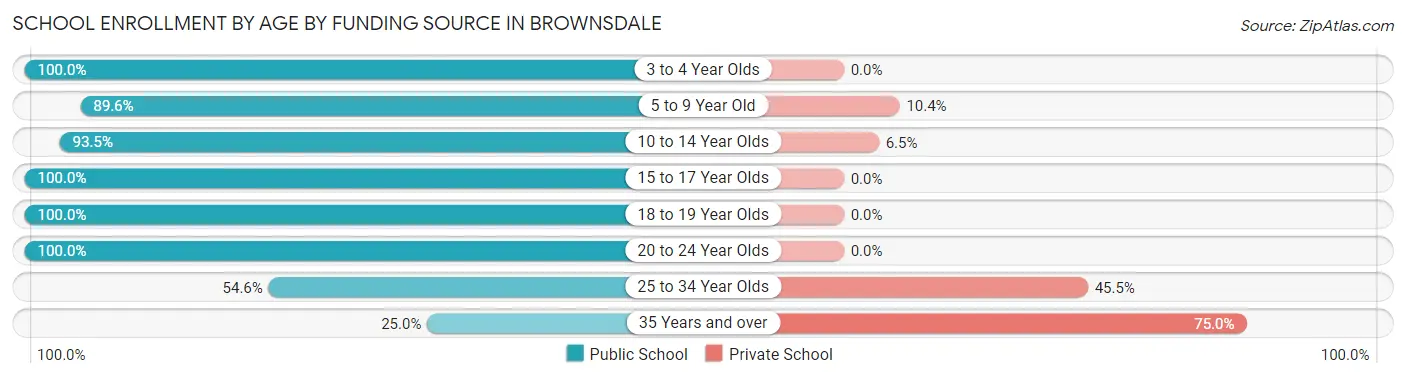
| Age Bracket | Public School | Private School |
| 3 to 4 Year Olds | 2 (100.0%) | 0 (0.0%) |
| 5 to 9 Year Old | 69 (89.6%) | 8 (10.4%) |
| 10 to 14 Year Olds | 43 (93.5%) | 3 (6.5%) |
| 15 to 17 Year Olds | 2 (100.0%) | 0 (0.0%) |
| 18 to 19 Year Olds | 35 (100.0%) | 0 (0.0%) |
| 20 to 24 Year Olds | 3 (100.0%) | 0 (0.0%) |
| 25 to 34 Year Olds | 6 (54.5%) | 5 (45.5%) |
| 35 Years and over | 4 (25.0%) | 12 (75.0%) |
| Total | 164 (85.4%) | 28 (14.6%) |
Educational Attainment by Field of Study in Brownsdale
Business (26 | 25.5%), education (26 | 25.5%), science & technology (14 | 13.7%), psychology (12 | 11.8%), and engineering (8 | 7.8%) are the most common fields of study among 102 individuals in Brownsdale who have obtained a bachelor's degree or higher.
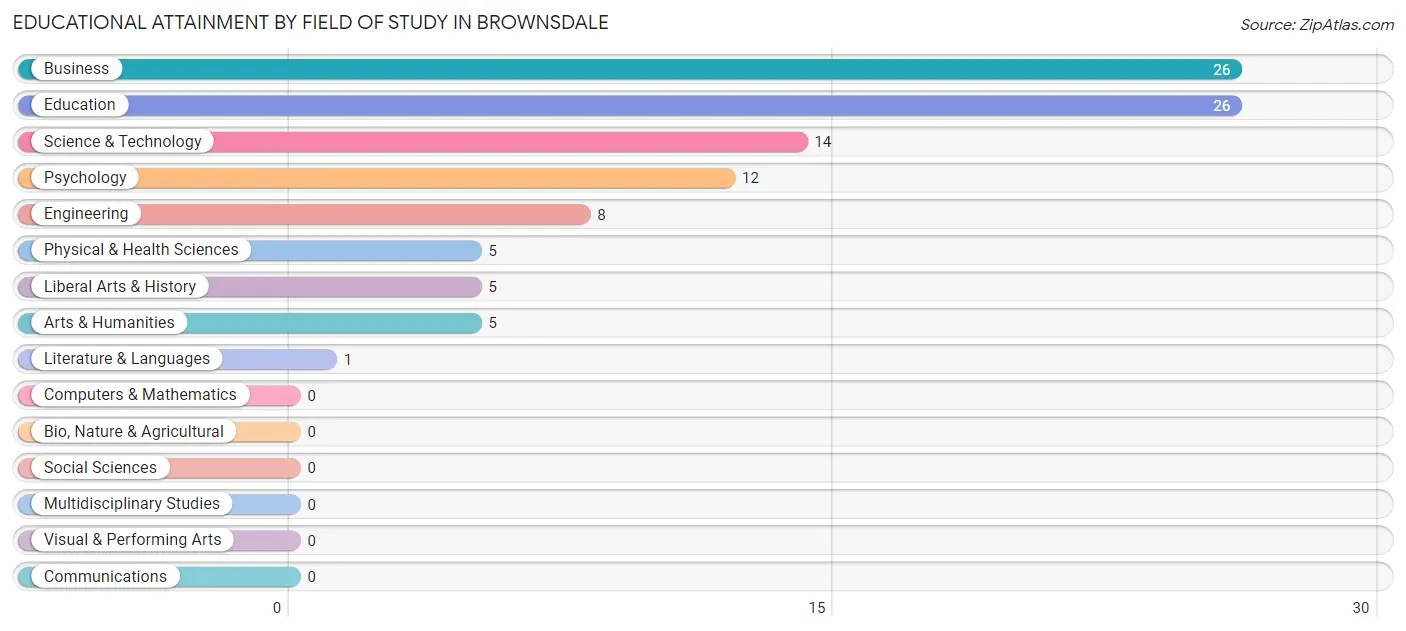
| Field of Study | # Graduates | % Graduates |
| Computers & Mathematics | 0 | 0.0% |
| Bio, Nature & Agricultural | 0 | 0.0% |
| Physical & Health Sciences | 5 | 4.9% |
| Psychology | 12 | 11.8% |
| Social Sciences | 0 | 0.0% |
| Engineering | 8 | 7.8% |
| Multidisciplinary Studies | 0 | 0.0% |
| Science & Technology | 14 | 13.7% |
| Business | 26 | 25.5% |
| Education | 26 | 25.5% |
| Literature & Languages | 1 | 1.0% |
| Liberal Arts & History | 5 | 4.9% |
| Visual & Performing Arts | 0 | 0.0% |
| Communications | 0 | 0.0% |
| Arts & Humanities | 5 | 4.9% |
| Total | 102 | 100.0% |
Transportation & Commute in Brownsdale
Vehicle Availability by Sex in Brownsdale
The most prevalent vehicle ownership categories in Brownsdale are males with 2 vehicles (103, accounting for 44.6%) and females with 2 vehicles (60, making up 60.6%).
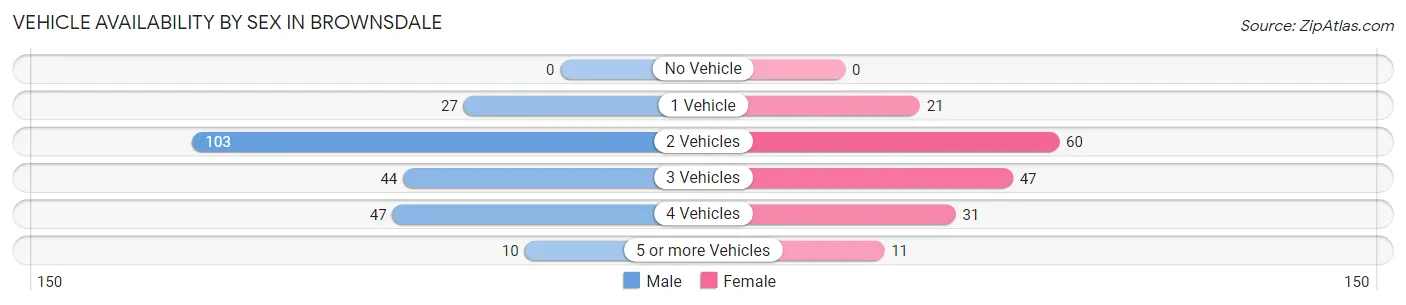
| Vehicles Available | Male | Female |
| No Vehicle | 0 (0.0%) | 0 (0.0%) |
| 1 Vehicle | 27 (11.7%) | 21 (12.3%) |
| 2 Vehicles | 103 (44.6%) | 60 (35.3%) |
| 3 Vehicles | 44 (19.1%) | 47 (27.7%) |
| 4 Vehicles | 47 (20.3%) | 31 (18.2%) |
| 5 or more Vehicles | 10 (4.3%) | 11 (6.5%) |
| Total | 231 (100.0%) | 170 (100.0%) |
Commute Time in Brownsdale
The most frequently occuring commute durations in Brownsdale are 15 to 19 minutes (66 commuters, 19.2%), 20 to 24 minutes (57 commuters, 16.6%), and less than 5 minutes (46 commuters, 13.4%).
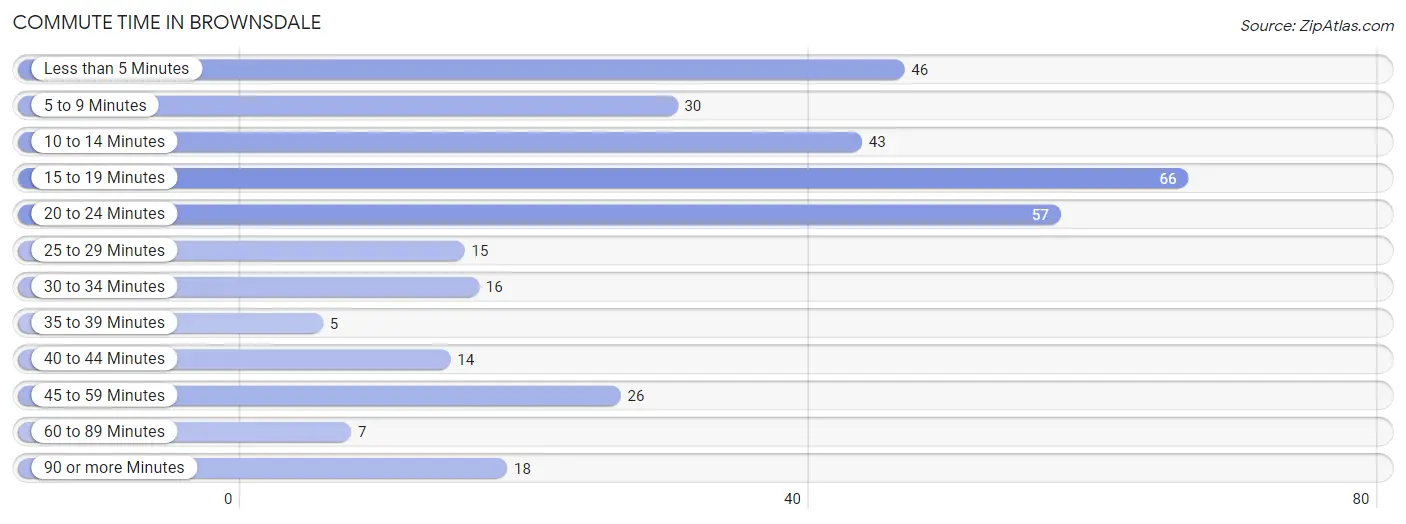
| Commute Time | # Commuters | % Commuters |
| Less than 5 Minutes | 46 | 13.4% |
| 5 to 9 Minutes | 30 | 8.7% |
| 10 to 14 Minutes | 43 | 12.5% |
| 15 to 19 Minutes | 66 | 19.2% |
| 20 to 24 Minutes | 57 | 16.6% |
| 25 to 29 Minutes | 15 | 4.4% |
| 30 to 34 Minutes | 16 | 4.7% |
| 35 to 39 Minutes | 5 | 1.5% |
| 40 to 44 Minutes | 14 | 4.1% |
| 45 to 59 Minutes | 26 | 7.6% |
| 60 to 89 Minutes | 7 | 2.0% |
| 90 or more Minutes | 18 | 5.2% |
Commute Time by Sex in Brownsdale
The most common commute times in Brownsdale are 10 to 14 minutes (39 commuters, 19.7%) for males and 15 to 19 minutes (45 commuters, 31.0%) for females.
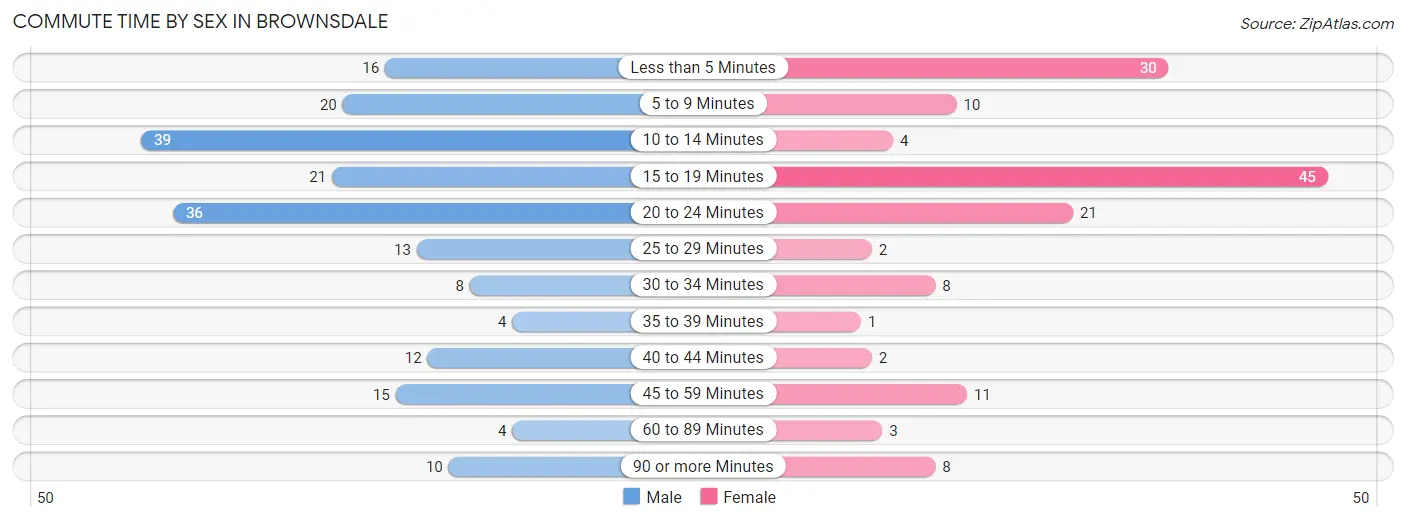
| Commute Time | Male | Female |
| Less than 5 Minutes | 16 (8.1%) | 30 (20.7%) |
| 5 to 9 Minutes | 20 (10.1%) | 10 (6.9%) |
| 10 to 14 Minutes | 39 (19.7%) | 4 (2.8%) |
| 15 to 19 Minutes | 21 (10.6%) | 45 (31.0%) |
| 20 to 24 Minutes | 36 (18.2%) | 21 (14.5%) |
| 25 to 29 Minutes | 13 (6.6%) | 2 (1.4%) |
| 30 to 34 Minutes | 8 (4.0%) | 8 (5.5%) |
| 35 to 39 Minutes | 4 (2.0%) | 1 (0.7%) |
| 40 to 44 Minutes | 12 (6.1%) | 2 (1.4%) |
| 45 to 59 Minutes | 15 (7.6%) | 11 (7.6%) |
| 60 to 89 Minutes | 4 (2.0%) | 3 (2.1%) |
| 90 or more Minutes | 10 (5.1%) | 8 (5.5%) |
Time of Departure to Work by Sex in Brownsdale
The most frequent times of departure to work in Brownsdale are 12:00 PM to 3:59 PM (36, 18.2%) for males and 9:00 AM to 9:59 AM (26, 17.9%) for females.
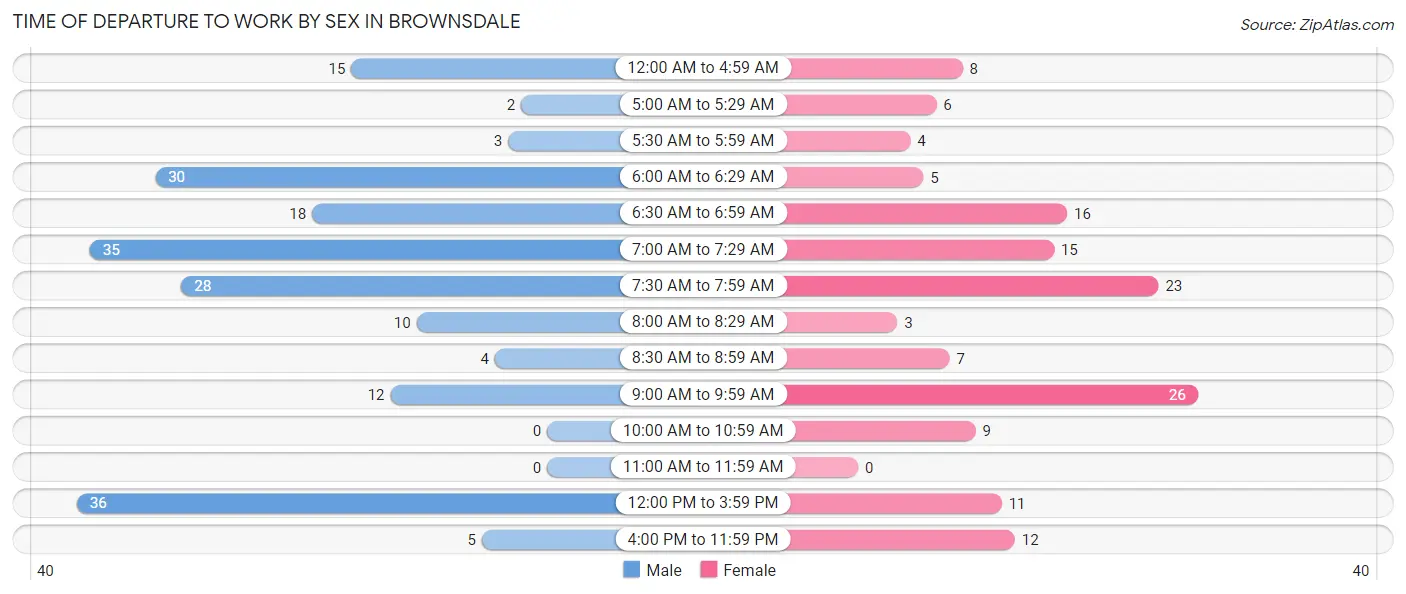
| Time of Departure | Male | Female |
| 12:00 AM to 4:59 AM | 15 (7.6%) | 8 (5.5%) |
| 5:00 AM to 5:29 AM | 2 (1.0%) | 6 (4.1%) |
| 5:30 AM to 5:59 AM | 3 (1.5%) | 4 (2.8%) |
| 6:00 AM to 6:29 AM | 30 (15.1%) | 5 (3.5%) |
| 6:30 AM to 6:59 AM | 18 (9.1%) | 16 (11.0%) |
| 7:00 AM to 7:29 AM | 35 (17.7%) | 15 (10.3%) |
| 7:30 AM to 7:59 AM | 28 (14.1%) | 23 (15.9%) |
| 8:00 AM to 8:29 AM | 10 (5.1%) | 3 (2.1%) |
| 8:30 AM to 8:59 AM | 4 (2.0%) | 7 (4.8%) |
| 9:00 AM to 9:59 AM | 12 (6.1%) | 26 (17.9%) |
| 10:00 AM to 10:59 AM | 0 (0.0%) | 9 (6.2%) |
| 11:00 AM to 11:59 AM | 0 (0.0%) | 0 (0.0%) |
| 12:00 PM to 3:59 PM | 36 (18.2%) | 11 (7.6%) |
| 4:00 PM to 11:59 PM | 5 (2.5%) | 12 (8.3%) |
| Total | 198 (100.0%) | 145 (100.0%) |
Housing Occupancy in Brownsdale
Occupancy by Ownership in Brownsdale
Of the total 340 dwellings in Brownsdale, owner-occupied units account for 290 (85.3%), while renter-occupied units make up 50 (14.7%).
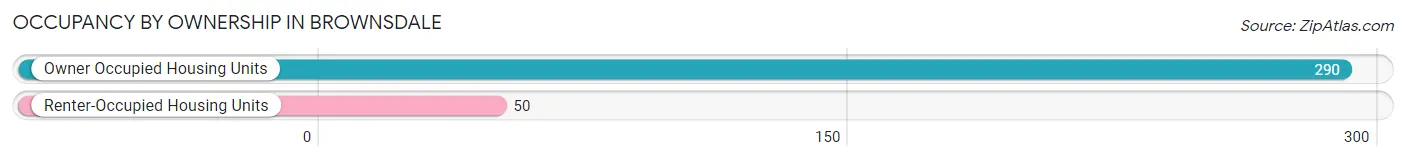
| Occupancy | # Housing Units | % Housing Units |
| Owner Occupied Housing Units | 290 | 85.3% |
| Renter-Occupied Housing Units | 50 | 14.7% |
| Total Occupied Housing Units | 340 | 100.0% |
Occupancy by Household Size in Brownsdale
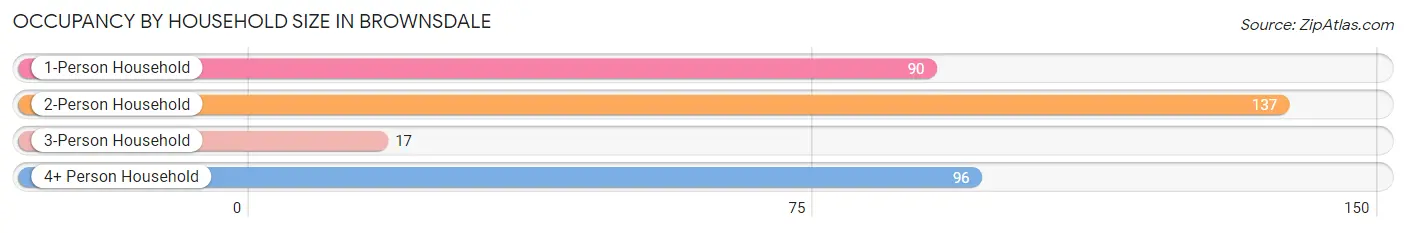
| Household Size | # Housing Units | % Housing Units |
| 1-Person Household | 90 | 26.5% |
| 2-Person Household | 137 | 40.3% |
| 3-Person Household | 17 | 5.0% |
| 4+ Person Household | 96 | 28.2% |
| Total Housing Units | 340 | 100.0% |
Occupancy by Ownership by Household Size in Brownsdale
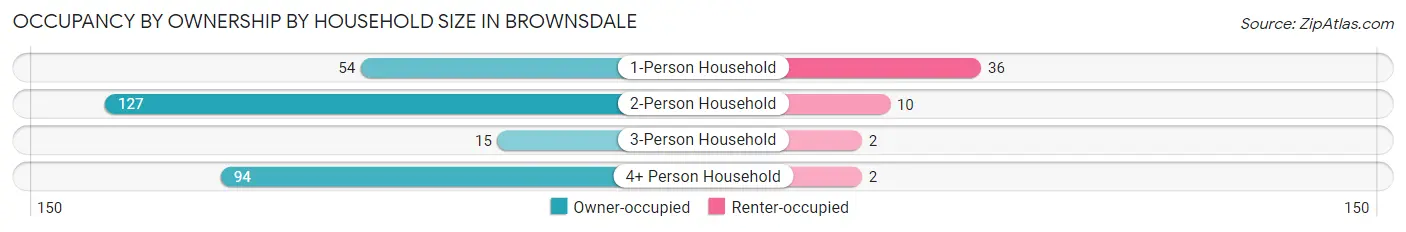
| Household Size | Owner-occupied | Renter-occupied |
| 1-Person Household | 54 (60.0%) | 36 (40.0%) |
| 2-Person Household | 127 (92.7%) | 10 (7.3%) |
| 3-Person Household | 15 (88.2%) | 2 (11.8%) |
| 4+ Person Household | 94 (97.9%) | 2 (2.1%) |
| Total Housing Units | 290 (85.3%) | 50 (14.7%) |
Occupancy by Educational Attainment in Brownsdale
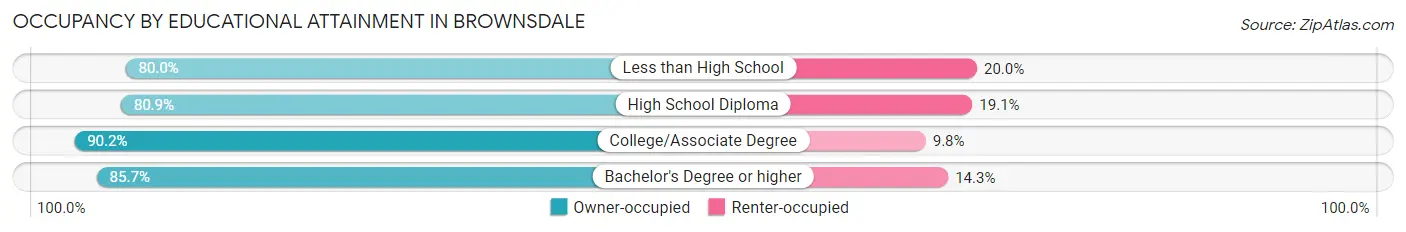
| Household Size | Owner-occupied | Renter-occupied |
| Less than High School | 8 (80.0%) | 2 (20.0%) |
| High School Diploma | 106 (80.9%) | 25 (19.1%) |
| College/Associate Degree | 110 (90.2%) | 12 (9.8%) |
| Bachelor's Degree or higher | 66 (85.7%) | 11 (14.3%) |
Occupancy by Age of Householder in Brownsdale
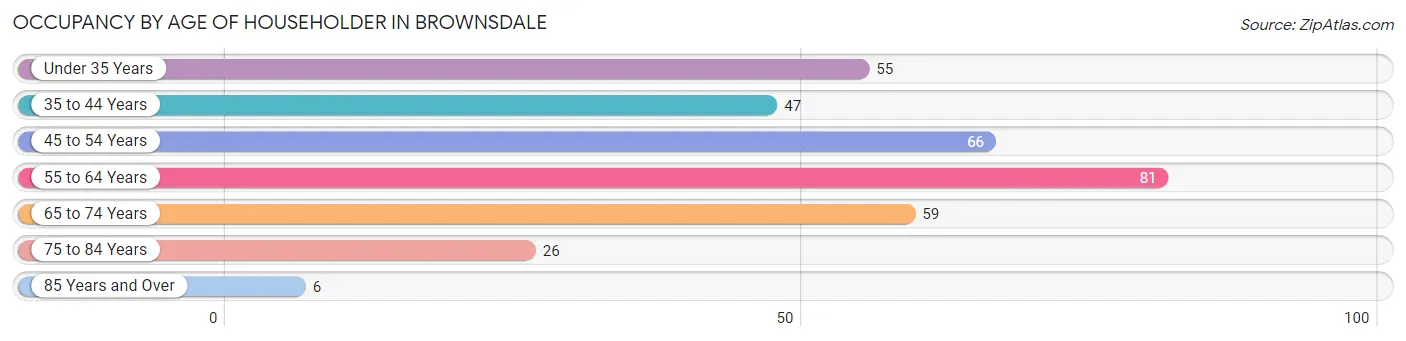
| Age Bracket | # Households | % Households |
| Under 35 Years | 55 | 16.2% |
| 35 to 44 Years | 47 | 13.8% |
| 45 to 54 Years | 66 | 19.4% |
| 55 to 64 Years | 81 | 23.8% |
| 65 to 74 Years | 59 | 17.3% |
| 75 to 84 Years | 26 | 7.6% |
| 85 Years and Over | 6 | 1.8% |
| Total | 340 | 100.0% |
Housing Finances in Brownsdale
Median Income by Occupancy in Brownsdale
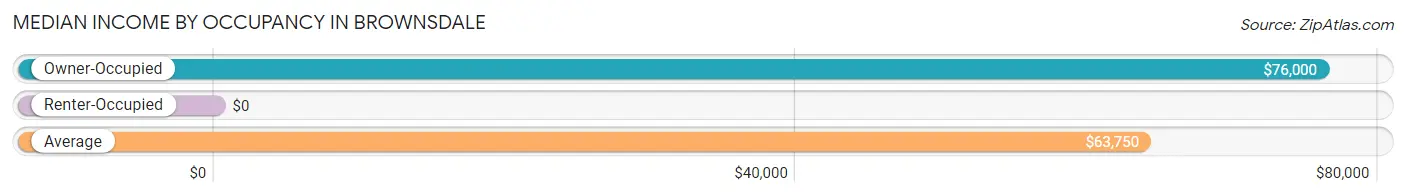
| Occupancy Type | # Households | Median Income |
| Owner-Occupied | 290 (85.3%) | $76,000 |
| Renter-Occupied | 50 (14.7%) | $0 |
| Average | 340 (100.0%) | $63,750 |
Occupancy by Householder Income Bracket in Brownsdale
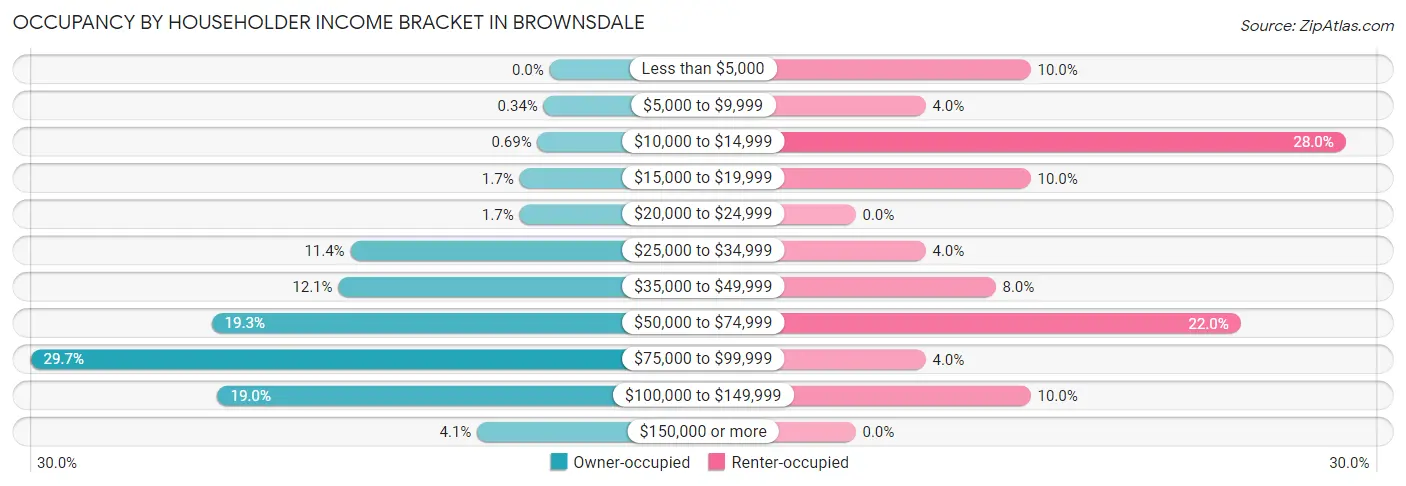
| Income Bracket | Owner-occupied | Renter-occupied |
| Less than $5,000 | 0 (0.0%) | 5 (10.0%) |
| $5,000 to $9,999 | 1 (0.3%) | 2 (4.0%) |
| $10,000 to $14,999 | 2 (0.7%) | 14 (28.0%) |
| $15,000 to $19,999 | 5 (1.7%) | 5 (10.0%) |
| $20,000 to $24,999 | 5 (1.7%) | 0 (0.0%) |
| $25,000 to $34,999 | 33 (11.4%) | 2 (4.0%) |
| $35,000 to $49,999 | 35 (12.1%) | 4 (8.0%) |
| $50,000 to $74,999 | 56 (19.3%) | 11 (22.0%) |
| $75,000 to $99,999 | 86 (29.7%) | 2 (4.0%) |
| $100,000 to $149,999 | 55 (19.0%) | 5 (10.0%) |
| $150,000 or more | 12 (4.1%) | 0 (0.0%) |
| Total | 290 (100.0%) | 50 (100.0%) |
Monthly Housing Cost Tiers in Brownsdale
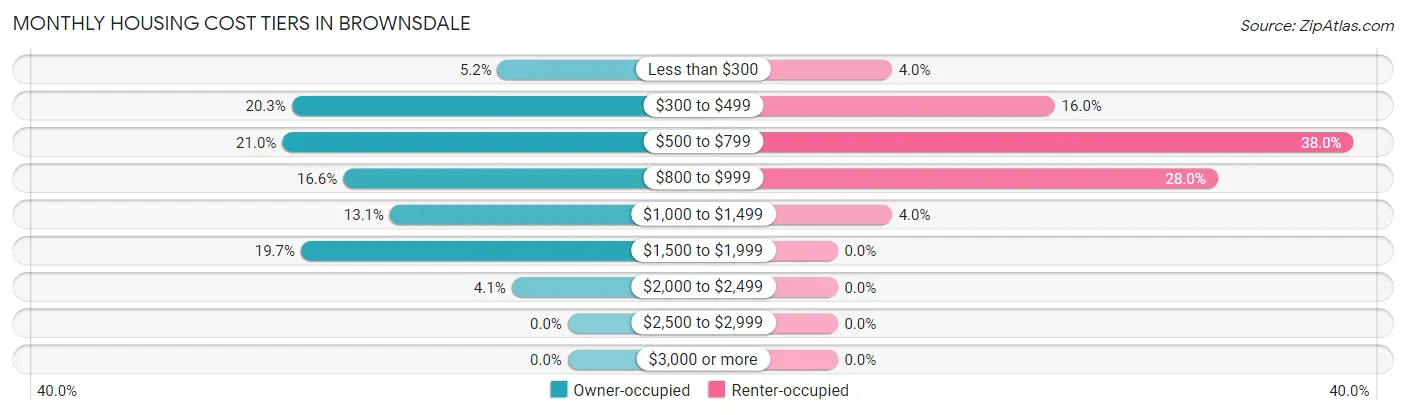
| Monthly Cost | Owner-occupied | Renter-occupied |
| Less than $300 | 15 (5.2%) | 2 (4.0%) |
| $300 to $499 | 59 (20.3%) | 8 (16.0%) |
| $500 to $799 | 61 (21.0%) | 19 (38.0%) |
| $800 to $999 | 48 (16.6%) | 14 (28.0%) |
| $1,000 to $1,499 | 38 (13.1%) | 2 (4.0%) |
| $1,500 to $1,999 | 57 (19.7%) | 0 (0.0%) |
| $2,000 to $2,499 | 12 (4.1%) | 0 (0.0%) |
| $2,500 to $2,999 | 0 (0.0%) | 0 (0.0%) |
| $3,000 or more | 0 (0.0%) | 0 (0.0%) |
| Total | 290 (100.0%) | 50 (100.0%) |
Physical Housing Characteristics in Brownsdale
Housing Structures in Brownsdale
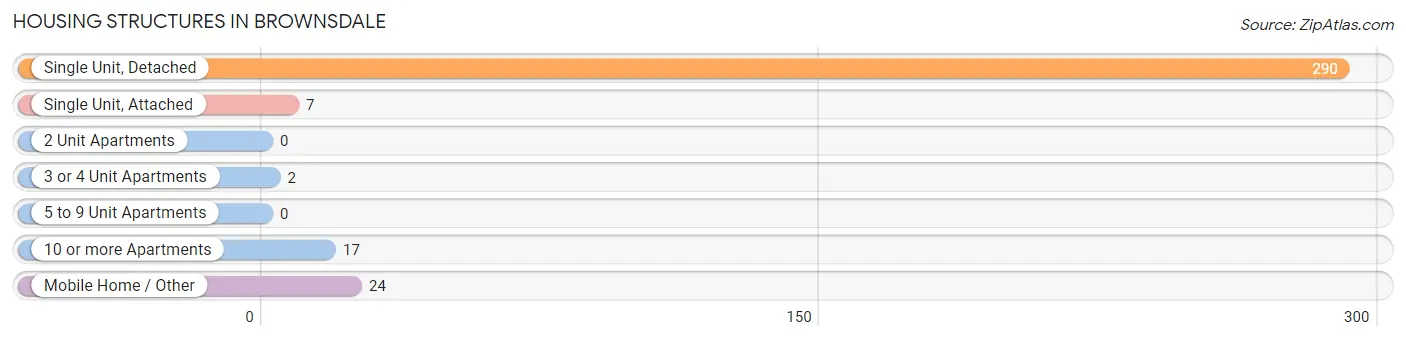
| Structure Type | # Housing Units | % Housing Units |
| Single Unit, Detached | 290 | 85.3% |
| Single Unit, Attached | 7 | 2.1% |
| 2 Unit Apartments | 0 | 0.0% |
| 3 or 4 Unit Apartments | 2 | 0.6% |
| 5 to 9 Unit Apartments | 0 | 0.0% |
| 10 or more Apartments | 17 | 5.0% |
| Mobile Home / Other | 24 | 7.1% |
| Total | 340 | 100.0% |
Housing Structures by Occupancy in Brownsdale
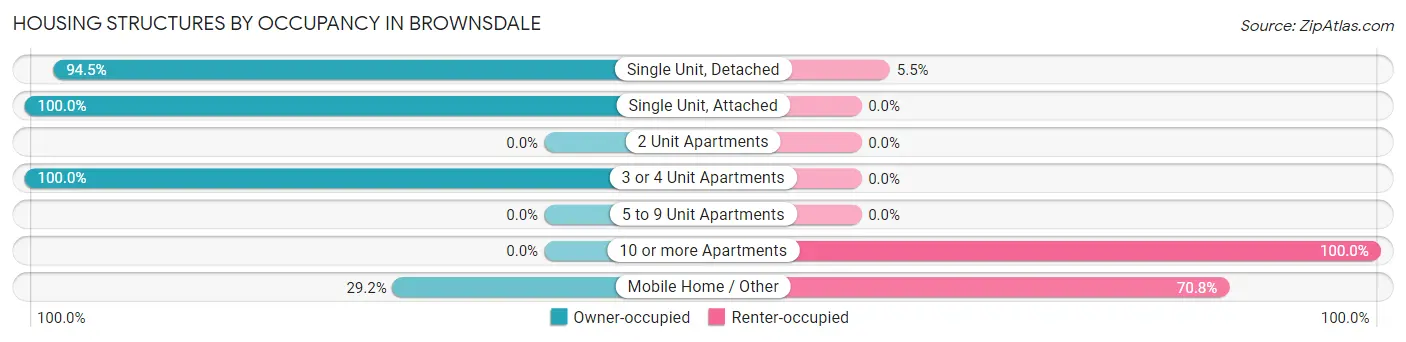
| Structure Type | Owner-occupied | Renter-occupied |
| Single Unit, Detached | 274 (94.5%) | 16 (5.5%) |
| Single Unit, Attached | 7 (100.0%) | 0 (0.0%) |
| 2 Unit Apartments | 0 (0.0%) | 0 (0.0%) |
| 3 or 4 Unit Apartments | 2 (100.0%) | 0 (0.0%) |
| 5 to 9 Unit Apartments | 0 (0.0%) | 0 (0.0%) |
| 10 or more Apartments | 0 (0.0%) | 17 (100.0%) |
| Mobile Home / Other | 7 (29.2%) | 17 (70.8%) |
| Total | 290 (85.3%) | 50 (14.7%) |
Housing Structures by Number of Rooms in Brownsdale
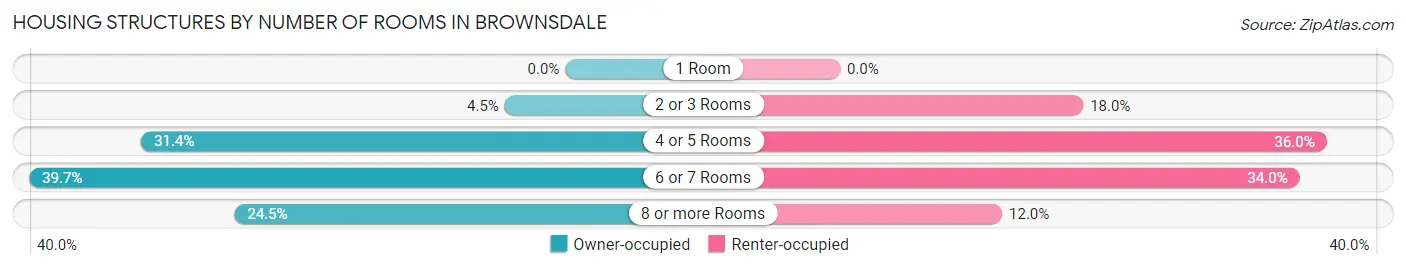
| Number of Rooms | Owner-occupied | Renter-occupied |
| 1 Room | 0 (0.0%) | 0 (0.0%) |
| 2 or 3 Rooms | 13 (4.5%) | 9 (18.0%) |
| 4 or 5 Rooms | 91 (31.4%) | 18 (36.0%) |
| 6 or 7 Rooms | 115 (39.7%) | 17 (34.0%) |
| 8 or more Rooms | 71 (24.5%) | 6 (12.0%) |
| Total | 290 (100.0%) | 50 (100.0%) |
Housing Structure by Heating Type in Brownsdale
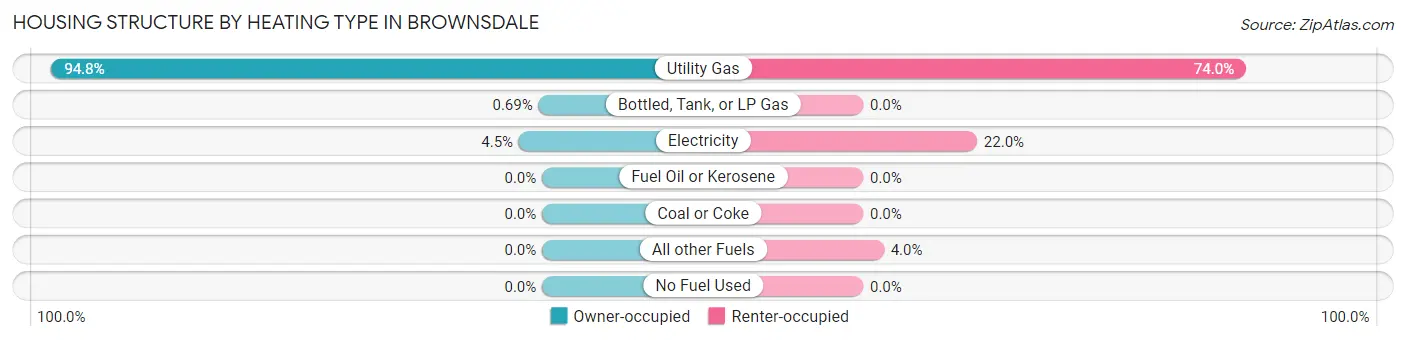
| Heating Type | Owner-occupied | Renter-occupied |
| Utility Gas | 275 (94.8%) | 37 (74.0%) |
| Bottled, Tank, or LP Gas | 2 (0.7%) | 0 (0.0%) |
| Electricity | 13 (4.5%) | 11 (22.0%) |
| Fuel Oil or Kerosene | 0 (0.0%) | 0 (0.0%) |
| Coal or Coke | 0 (0.0%) | 0 (0.0%) |
| All other Fuels | 0 (0.0%) | 2 (4.0%) |
| No Fuel Used | 0 (0.0%) | 0 (0.0%) |
| Total | 290 (100.0%) | 50 (100.0%) |
Household Vehicle Usage in Brownsdale
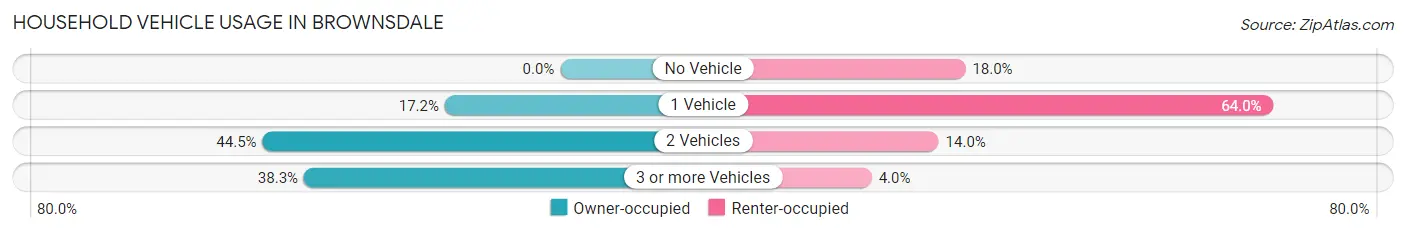
| Vehicles per Household | Owner-occupied | Renter-occupied |
| No Vehicle | 0 (0.0%) | 9 (18.0%) |
| 1 Vehicle | 50 (17.2%) | 32 (64.0%) |
| 2 Vehicles | 129 (44.5%) | 7 (14.0%) |
| 3 or more Vehicles | 111 (38.3%) | 2 (4.0%) |
| Total | 290 (100.0%) | 50 (100.0%) |
Real Estate & Mortgages in Brownsdale
Real Estate and Mortgage Overview in Brownsdale
| Characteristic | Without Mortgage | With Mortgage |
| Housing Units | 105 | 185 |
| Median Property Value | $130,500 | $131,800 |
| Median Household Income | $80,625 | $5 |
| Monthly Housing Costs | $452 | $0 |
| Real Estate Taxes | $1,368 | $0 |
Property Value by Mortgage Status in Brownsdale
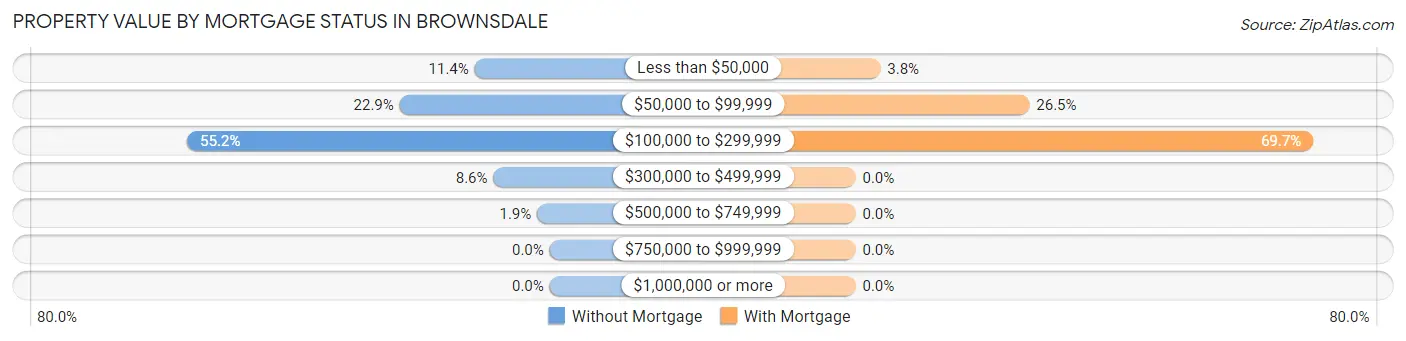
| Property Value | Without Mortgage | With Mortgage |
| Less than $50,000 | 12 (11.4%) | 7 (3.8%) |
| $50,000 to $99,999 | 24 (22.9%) | 49 (26.5%) |
| $100,000 to $299,999 | 58 (55.2%) | 129 (69.7%) |
| $300,000 to $499,999 | 9 (8.6%) | 0 (0.0%) |
| $500,000 to $749,999 | 2 (1.9%) | 0 (0.0%) |
| $750,000 to $999,999 | 0 (0.0%) | 0 (0.0%) |
| $1,000,000 or more | 0 (0.0%) | 0 (0.0%) |
| Total | 105 (100.0%) | 185 (100.0%) |
Household Income by Mortgage Status in Brownsdale
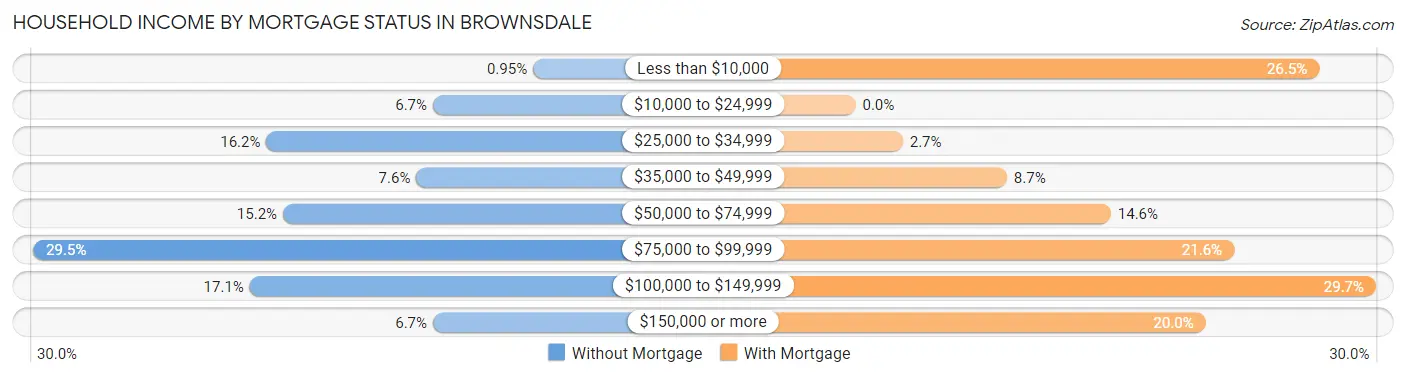
| Household Income | Without Mortgage | With Mortgage |
| Less than $10,000 | 1 (0.9%) | 49 (26.5%) |
| $10,000 to $24,999 | 7 (6.7%) | 0 (0.0%) |
| $25,000 to $34,999 | 17 (16.2%) | 5 (2.7%) |
| $35,000 to $49,999 | 8 (7.6%) | 16 (8.6%) |
| $50,000 to $74,999 | 16 (15.2%) | 27 (14.6%) |
| $75,000 to $99,999 | 31 (29.5%) | 40 (21.6%) |
| $100,000 to $149,999 | 18 (17.1%) | 55 (29.7%) |
| $150,000 or more | 7 (6.7%) | 37 (20.0%) |
| Total | 105 (100.0%) | 185 (100.0%) |
Property Value to Household Income Ratio in Brownsdale
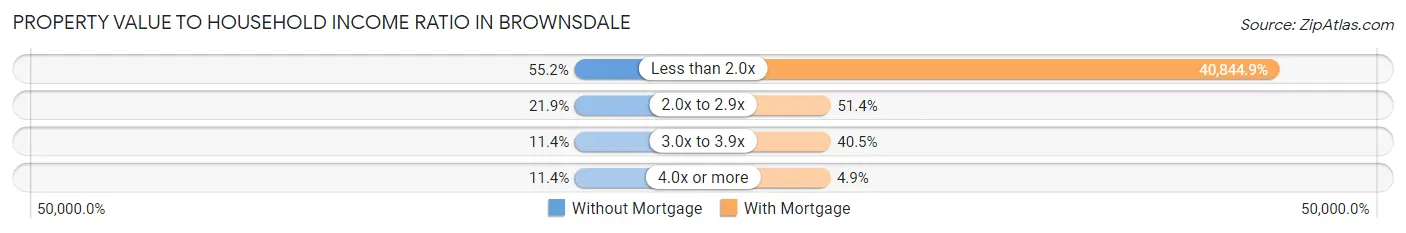
| Value-to-Income Ratio | Without Mortgage | With Mortgage |
| Less than 2.0x | 58 (55.2%) | 75,563 (40,844.9%) |
| 2.0x to 2.9x | 23 (21.9%) | 95 (51.3%) |
| 3.0x to 3.9x | 12 (11.4%) | 75 (40.5%) |
| 4.0x or more | 12 (11.4%) | 9 (4.9%) |
| Total | 105 (100.0%) | 185 (100.0%) |
Real Estate Taxes by Mortgage Status in Brownsdale
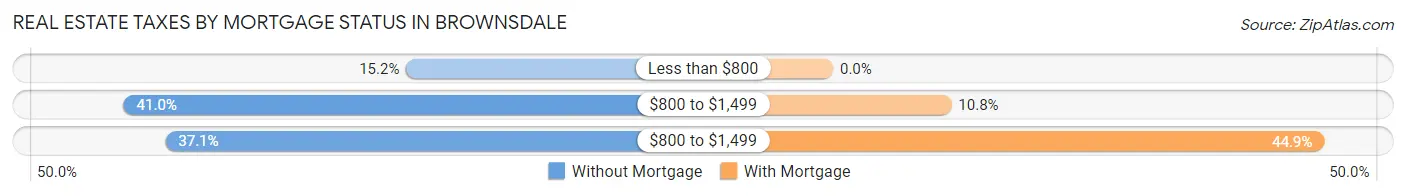
| Property Taxes | Without Mortgage | With Mortgage |
| Less than $800 | 16 (15.2%) | 0 (0.0%) |
| $800 to $1,499 | 43 (40.9%) | 20 (10.8%) |
| $800 to $1,499 | 39 (37.1%) | 83 (44.9%) |
| Total | 105 (100.0%) | 185 (100.0%) |
Health & Disability in Brownsdale
Health Insurance Coverage by Age in Brownsdale
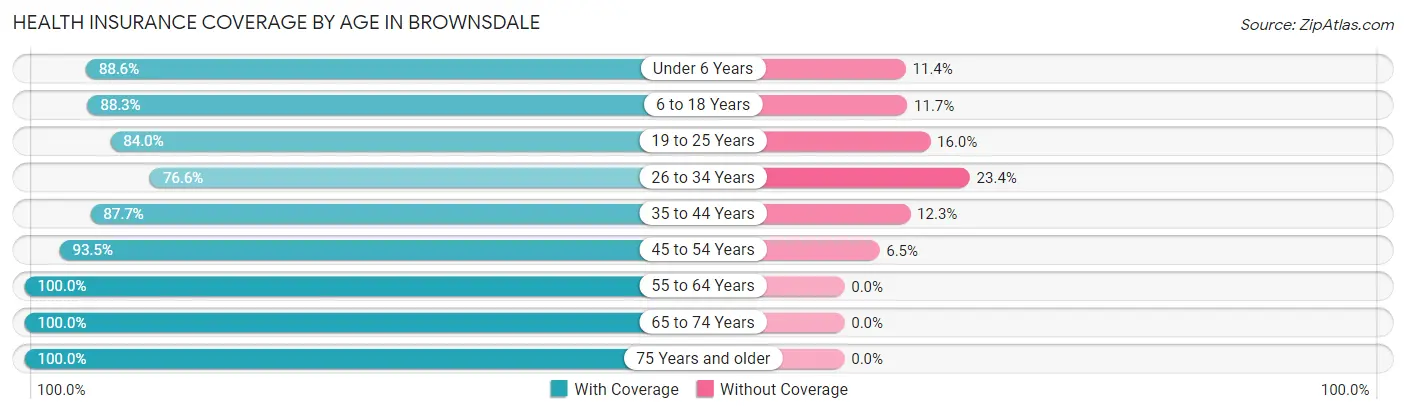
| Age Bracket | With Coverage | Without Coverage |
| Under 6 Years | 31 (88.6%) | 4 (11.4%) |
| 6 to 18 Years | 98 (88.3%) | 13 (11.7%) |
| 19 to 25 Years | 63 (84.0%) | 12 (16.0%) |
| 26 to 34 Years | 59 (76.6%) | 18 (23.4%) |
| 35 to 44 Years | 100 (87.7%) | 14 (12.3%) |
| 45 to 54 Years | 86 (93.5%) | 6 (6.5%) |
| 55 to 64 Years | 123 (100.0%) | 0 (0.0%) |
| 65 to 74 Years | 122 (100.0%) | 0 (0.0%) |
| 75 Years and older | 48 (100.0%) | 0 (0.0%) |
| Total | 730 (91.6%) | 67 (8.4%) |
Health Insurance Coverage by Citizenship Status in Brownsdale

| Citizenship Status | With Coverage | Without Coverage |
| Native Born | 31 (88.6%) | 4 (11.4%) |
| Foreign Born, Citizen | 98 (88.3%) | 13 (11.7%) |
| Foreign Born, not a Citizen | 63 (84.0%) | 12 (16.0%) |
Health Insurance Coverage by Household Income in Brownsdale

| Household Income | With Coverage | Without Coverage |
| Under $25,000 | 43 (100.0%) | 0 (0.0%) |
| $25,000 to $49,999 | 106 (83.5%) | 21 (16.5%) |
| $50,000 to $74,999 | 157 (98.7%) | 2 (1.3%) |
| $75,000 to $99,999 | 223 (98.7%) | 3 (1.3%) |
| $100,000 and over | 201 (83.1%) | 41 (16.9%) |
Public vs Private Health Insurance Coverage by Age in Brownsdale
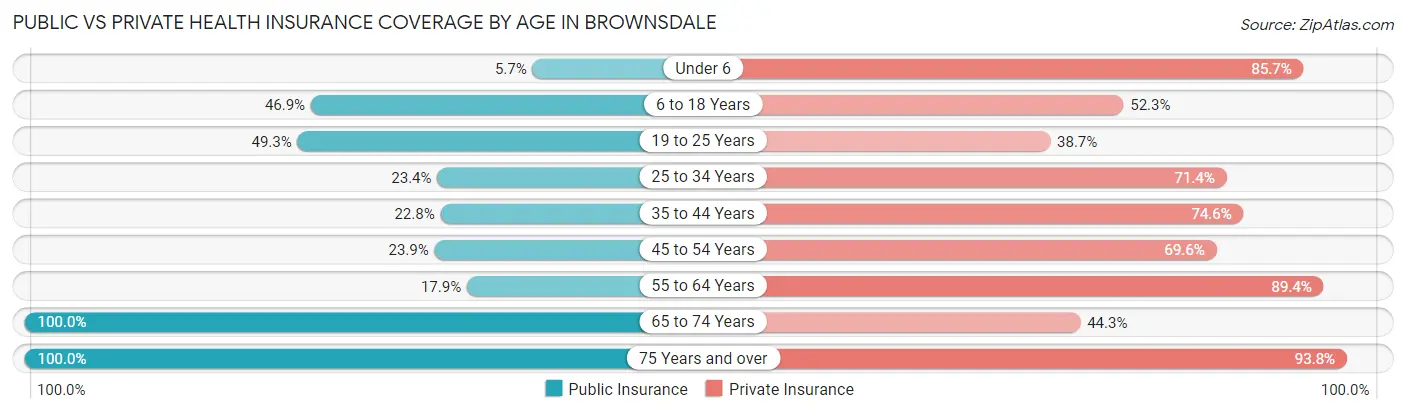
| Age Bracket | Public Insurance | Private Insurance |
| Under 6 | 2 (5.7%) | 30 (85.7%) |
| 6 to 18 Years | 52 (46.9%) | 58 (52.2%) |
| 19 to 25 Years | 37 (49.3%) | 29 (38.7%) |
| 25 to 34 Years | 18 (23.4%) | 55 (71.4%) |
| 35 to 44 Years | 26 (22.8%) | 85 (74.6%) |
| 45 to 54 Years | 22 (23.9%) | 64 (69.6%) |
| 55 to 64 Years | 22 (17.9%) | 110 (89.4%) |
| 65 to 74 Years | 122 (100.0%) | 54 (44.3%) |
| 75 Years and over | 48 (100.0%) | 45 (93.8%) |
| Total | 349 (43.8%) | 530 (66.5%) |
Disability Status by Sex by Age in Brownsdale
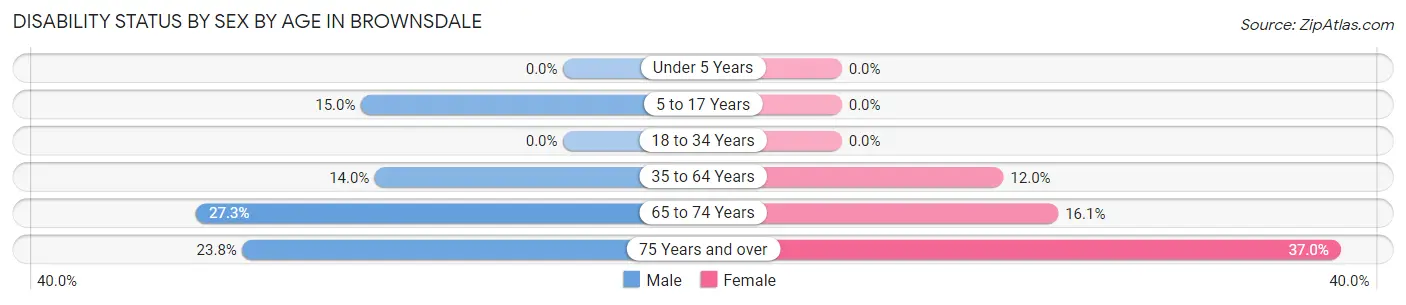
| Age Bracket | Male | Female |
| Under 5 Years | 0 (0.0%) | 0 (0.0%) |
| 5 to 17 Years | 12 (15.0%) | 0 (0.0%) |
| 18 to 34 Years | 0 (0.0%) | 0 (0.0%) |
| 35 to 64 Years | 25 (14.0%) | 18 (12.0%) |
| 65 to 74 Years | 18 (27.3%) | 9 (16.1%) |
| 75 Years and over | 5 (23.8%) | 10 (37.0%) |
Disability Class by Sex by Age in Brownsdale
Disability Class: Hearing Difficulty

| Age Bracket | Male | Female |
| Under 5 Years | 0 (0.0%) | 0 (0.0%) |
| 5 to 17 Years | 0 (0.0%) | 0 (0.0%) |
| 18 to 34 Years | 0 (0.0%) | 0 (0.0%) |
| 35 to 64 Years | 7 (3.9%) | 7 (4.7%) |
| 65 to 74 Years | 12 (18.2%) | 3 (5.4%) |
| 75 Years and over | 5 (23.8%) | 3 (11.1%) |
Disability Class: Vision Difficulty
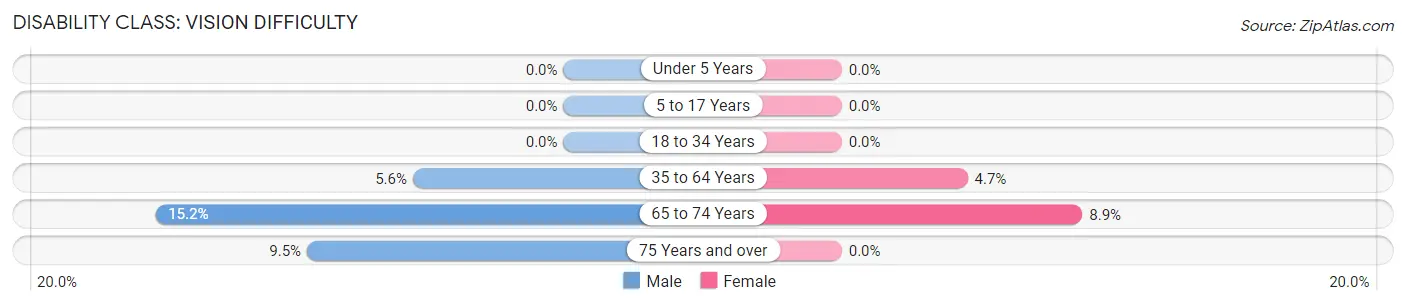
| Age Bracket | Male | Female |
| Under 5 Years | 0 (0.0%) | 0 (0.0%) |
| 5 to 17 Years | 0 (0.0%) | 0 (0.0%) |
| 18 to 34 Years | 0 (0.0%) | 0 (0.0%) |
| 35 to 64 Years | 10 (5.6%) | 7 (4.7%) |
| 65 to 74 Years | 10 (15.1%) | 5 (8.9%) |
| 75 Years and over | 2 (9.5%) | 0 (0.0%) |
Disability Class: Cognitive Difficulty
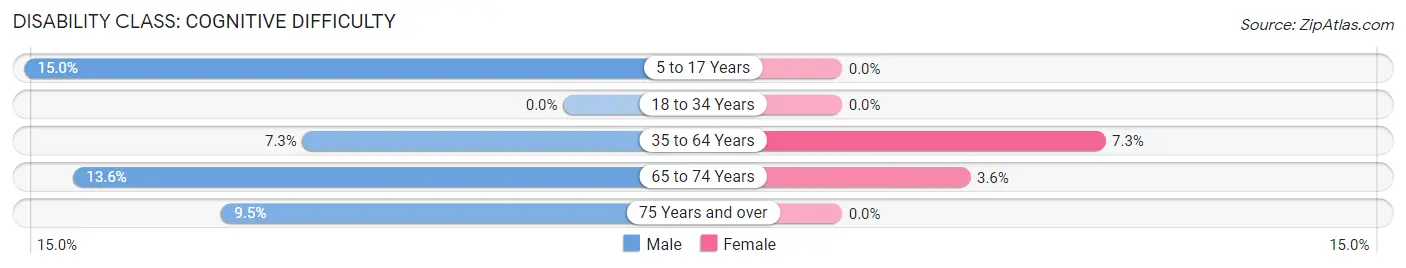
| Age Bracket | Male | Female |
| 5 to 17 Years | 12 (15.0%) | 0 (0.0%) |
| 18 to 34 Years | 0 (0.0%) | 0 (0.0%) |
| 35 to 64 Years | 13 (7.3%) | 11 (7.3%) |
| 65 to 74 Years | 9 (13.6%) | 2 (3.6%) |
| 75 Years and over | 2 (9.5%) | 0 (0.0%) |
Disability Class: Ambulatory Difficulty
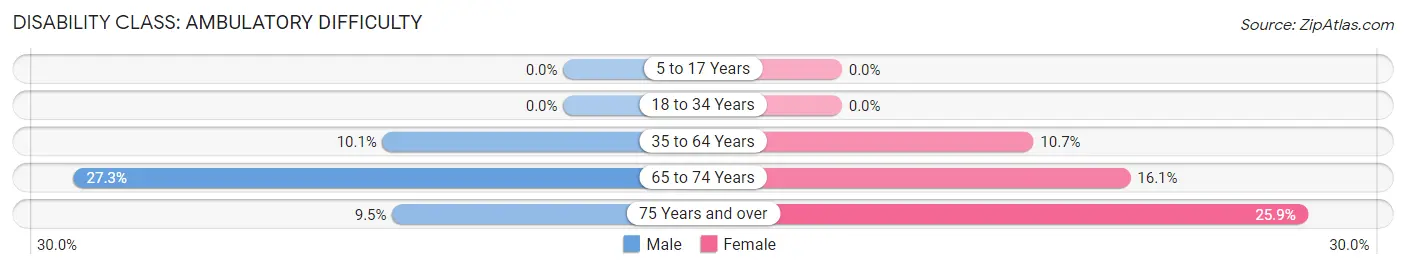
| Age Bracket | Male | Female |
| 5 to 17 Years | 0 (0.0%) | 0 (0.0%) |
| 18 to 34 Years | 0 (0.0%) | 0 (0.0%) |
| 35 to 64 Years | 18 (10.1%) | 16 (10.7%) |
| 65 to 74 Years | 18 (27.3%) | 9 (16.1%) |
| 75 Years and over | 2 (9.5%) | 7 (25.9%) |
Disability Class: Self-Care Difficulty
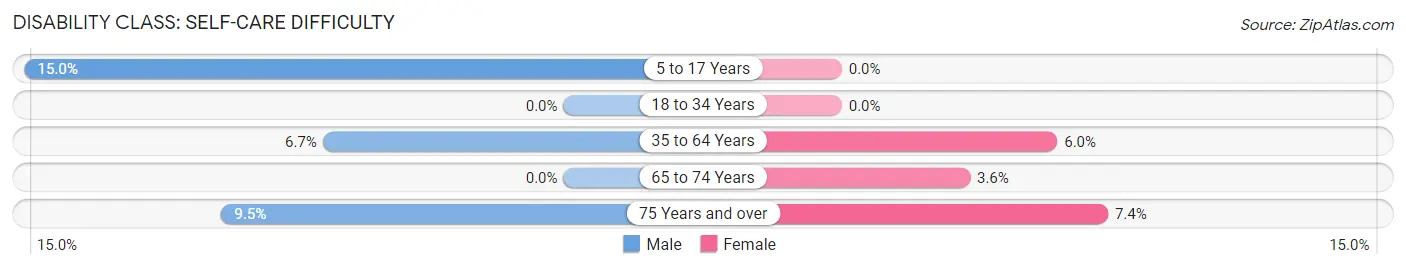
| Age Bracket | Male | Female |
| 5 to 17 Years | 12 (15.0%) | 0 (0.0%) |
| 18 to 34 Years | 0 (0.0%) | 0 (0.0%) |
| 35 to 64 Years | 12 (6.7%) | 9 (6.0%) |
| 65 to 74 Years | 0 (0.0%) | 2 (3.6%) |
| 75 Years and over | 2 (9.5%) | 2 (7.4%) |
Technology Access in Brownsdale
Computing Device Access in Brownsdale
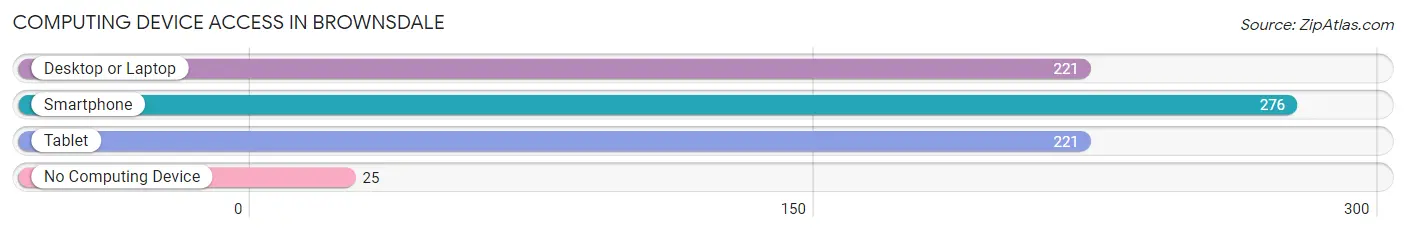
| Device Type | # Households | % Households |
| Desktop or Laptop | 221 | 65.0% |
| Smartphone | 276 | 81.2% |
| Tablet | 221 | 65.0% |
| No Computing Device | 25 | 7.3% |
| Total | 340 | 100.0% |
Internet Access in Brownsdale
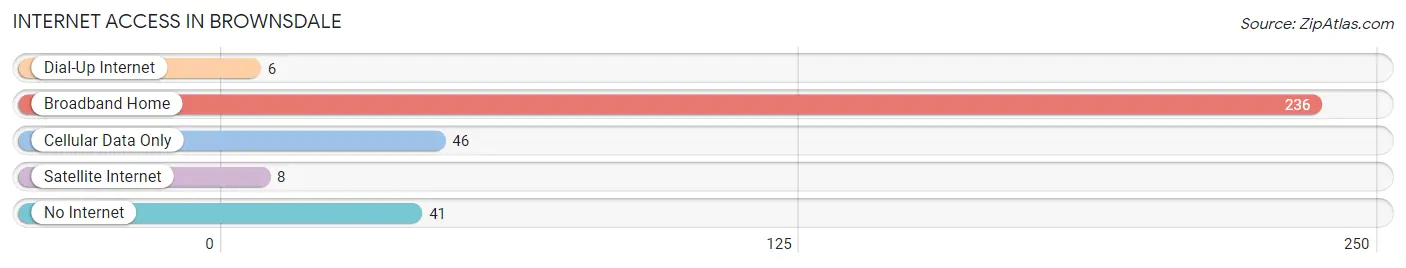
| Internet Type | # Households | % Households |
| Dial-Up Internet | 6 | 1.8% |
| Broadband Home | 236 | 69.4% |
| Cellular Data Only | 46 | 13.5% |
| Satellite Internet | 8 | 2.4% |
| No Internet | 41 | 12.1% |
| Total | 340 | 100.0% |
Brownsdale Summary
Brownsdale, Minnesota is a small city located in Mower County, Minnesota, United States. The city is situated on the banks of the Root River, and is part of the Austin-Albert Lea-Rochester metropolitan area. The population of Brownsdale was 1,093 at the 2010 census.
History
Brownsdale was founded in 1856 by William Brown, a settler from New York. Brown had purchased the land from the government and began to build a small settlement. The settlement was named Brownsdale in his honor. The town grew slowly, but steadily, and by the late 19th century, it had become a thriving community.
In the early 20th century, Brownsdale was a major center for the production of agricultural products, such as wheat, oats, and corn. The town also had a number of small businesses, including a general store, a blacksmith shop, and a hotel.
In the 1950s, Brownsdale began to experience a decline in population as people moved away to larger cities. However, the town has managed to remain a vibrant community, and today it is home to a number of small businesses, including a grocery store, a hardware store, and a restaurant.
Geography
Brownsdale is located at 43°45'17" North, 92°59'45" West (43.754722, -92.995833). The city is situated on the banks of the Root River, and is part of the Austin-Albert Lea-Rochester metropolitan area.
The city has a total area of 0.9 square miles, all of which is land. The terrain is mostly flat, with some rolling hills. The climate is humid continental, with cold winters and hot summers.
Economy
The economy of Brownsdale is largely based on agriculture. The town is home to a number of small farms, which produce a variety of crops, including wheat, oats, corn, and soybeans. The town also has a number of small businesses, including a grocery store, a hardware store, and a restaurant.
Demographics
As of the 2010 census, there were 1,093 people, 441 households, and 287 families residing in the city. The population density was 1,203.3 people per square mile. The racial makeup of the city was 97.2% White, 0.2% African American, 0.2% Native American, 0.2% Asian, 0.2% from other races, and 1.9% from two or more races. Hispanic or Latino of any race were 1.3% of the population.
The median age in the city was 41.2 years. 24.2% of residents were under the age of 18; 6.7% were between the ages of 18 and 24; 22.7% were from 25 to 44; 28.2% were from 45 to 64; and 18.2% were 65 years of age or older. The gender makeup of the city was 48.7% male and 51.3% female.
The median income for a household in the city was $41,250, and the median income for a family was $50,000. Males had a median income of $35,000 versus $25,000 for females. The per capita income for the city was $20,845. About 5.2% of families and 8.2% of the population were below the poverty line, including 10.2% of those under age 18 and 8.3% of those age 65 or over.
Common Questions
What is the Total Population of Brownsdale?
Total Population of Brownsdale is 797.
What is the Total Male Population of Brownsdale?
Total Male Population of Brownsdale is 449.
What is the Total Female Population of Brownsdale?
Total Female Population of Brownsdale is 348.
What is the Ratio of Males per 100 Females in Brownsdale?
There are 129.02 Males per 100 Females in Brownsdale.
What is the Ratio of Females per 100 Males in Brownsdale?
There are 77.51 Females per 100 Males in Brownsdale.
What is the Median Population Age in Brownsdale?
Median Population Age in Brownsdale is 43.8 Years.
What is the Average Family Size in Brownsdale
Average Family Size in Brownsdale is 2.9 People.
What is the Average Household Size in Brownsdale
Average Household Size in Brownsdale is 2.3 People.
What is Per Capita Income in Brownsdale?
Per Capita income in Brownsdale is $30,523.
What is the Median Family Income in Brownsdale?
Median Family Income in Brownsdale is $75,000.
What is the Median Household income in Brownsdale?
Median Household Income in Brownsdale is $63,750.
What is Income or Wage Gap in Brownsdale?
Income or Wage Gap in Brownsdale is 18.2%.
Women in Brownsdale earn 81.8 cents for every dollar earned by a man.
What is Inequality or Gini Index in Brownsdale?
Inequality or Gini Index in Brownsdale is 0.32.
How Large is the Labor Force in Brownsdale?
There are 469 People in the Labor Forcein in Brownsdale.
What is the Percentage of People in the Labor Force in Brownsdale?
71.3% of People are in the Labor Force in Brownsdale.
What is the Unemployment Rate in Brownsdale?
Unemployment Rate in Brownsdale is 4.9%.