Wilton, MN
Wilton Map
Wilton Overview
242
TOTAL POPULATION
115
MALE POPULATION
127
FEMALE POPULATION
90.55
MALES / 100 FEMALES
110.43
FEMALES / 100 MALES
37.6
MEDIAN AGE
3.1
AVG FAMILY SIZE
3.1
AVG HOUSEHOLD SIZE
$22,349
PER CAPITA INCOME
$54,318
AVG FAMILY INCOME
$54,943
AVG HOUSEHOLD INCOME
27.5%
WAGE / INCOME GAP [ % ]
72.5¢/ $1
WAGE / INCOME GAP [ $ ]
$17,800
FAMILY INCOME DEFICIT
0.30
INEQUALITY / GINI INDEX
107
LABOR FORCE [ PEOPLE ]
63.7%
PERCENT IN LABOR FORCE
27.1%
UNEMPLOYMENT RATE
Wilton Area Codes
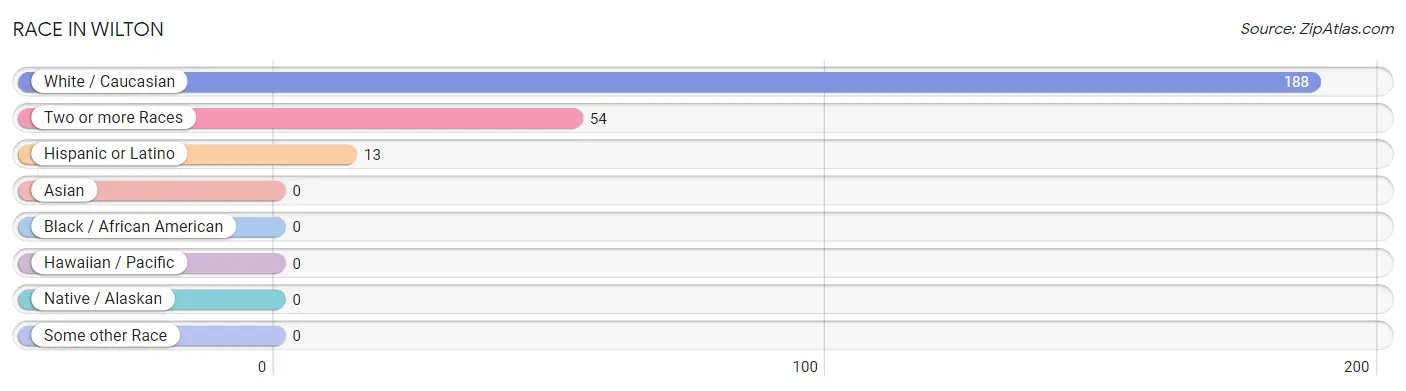
Race in Wilton
The most populous races in Wilton are White / Caucasian (188 | 77.7%), Two or more Races (54 | 22.3%), and Hispanic or Latino (13 | 5.4%).
| Race | # Population | % Population |
| Asian | 0 | 0.0% |
| Black / African American | 0 | 0.0% |
| Hawaiian / Pacific | 0 | 0.0% |
| Hispanic or Latino | 13 | 5.4% |
| Native / Alaskan | 0 | 0.0% |
| White / Caucasian | 188 | 77.7% |
| Two or more Races | 54 | 22.3% |
| Some other Race | 0 | 0.0% |
| Total | 242 | 100.0% |
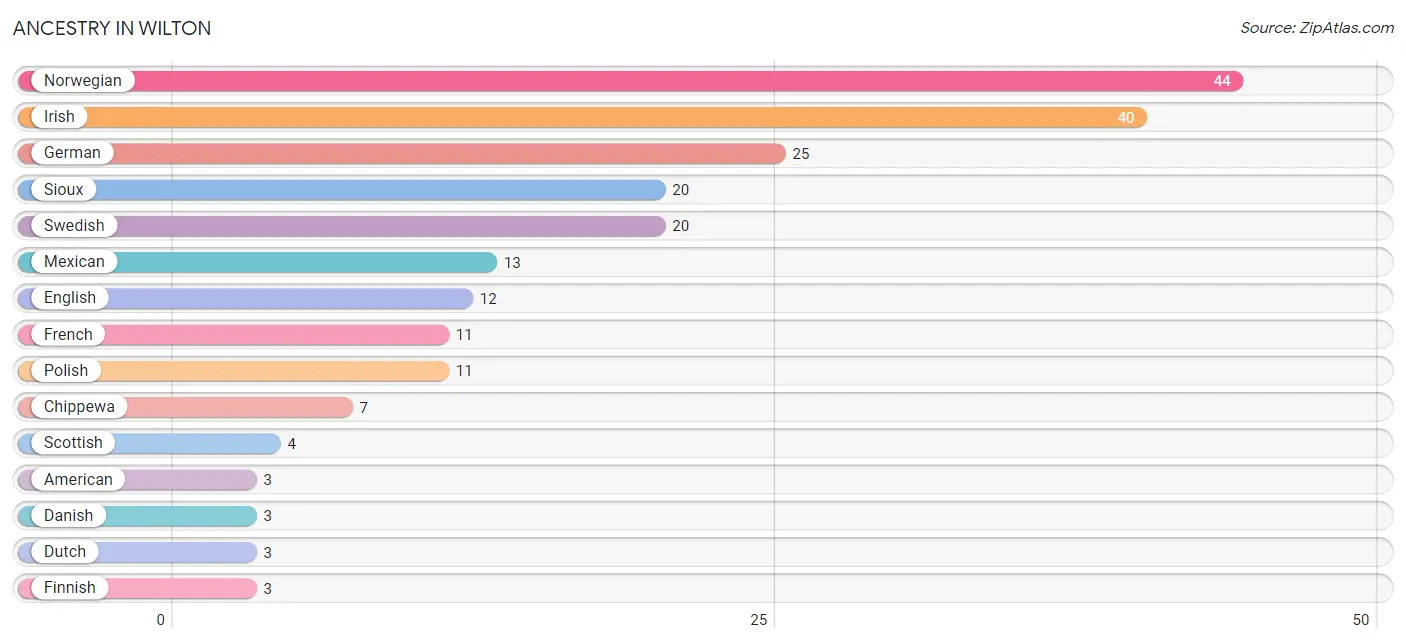
Ancestry in Wilton
The most populous ancestries reported in Wilton are Norwegian (44 | 18.2%), Irish (40 | 16.5%), German (25 | 10.3%), Sioux (20 | 8.3%), and Swedish (20 | 8.3%), together accounting for 61.6% of all Wilton residents.
| Ancestry | # Population | % Population |
| American | 3 | 1.2% |
| Chippewa | 7 | 2.9% |
| Czechoslovakian | 1 | 0.4% |
| Danish | 3 | 1.2% |
| Dutch | 3 | 1.2% |
| Eastern European | 2 | 0.8% |
| English | 12 | 5.0% |
| Finnish | 3 | 1.2% |
| French | 11 | 4.5% |
| French Canadian | 2 | 0.8% |
| German | 25 | 10.3% |
| Greek | 1 | 0.4% |
| Hungarian | 1 | 0.4% |
| Indian (Asian) | 1 | 0.4% |
| Irish | 40 | 16.5% |
| Korean | 3 | 1.2% |
| Mexican | 13 | 5.4% |
| Norwegian | 44 | 18.2% |
| Polish | 11 | 4.5% |
| Russian | 2 | 0.8% |
| Scotch-Irish | 3 | 1.2% |
| Scottish | 4 | 1.7% |
| Sioux | 20 | 8.3% |
| Swedish | 20 | 8.3% | View All 24 Rows |
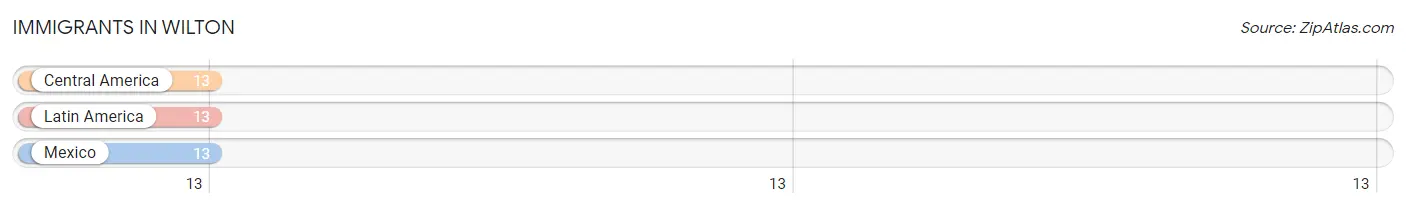
Immigrants in Wilton
The most numerous immigrant groups reported in Wilton came from Central America (13 | 5.4%), Latin America (13 | 5.4%), and Mexico (13 | 5.4%), together accounting for 16.1% of all Wilton residents.
| Immigration Origin | # Population | % Population |
| Central America | 13 | 5.4% |
| Latin America | 13 | 5.4% |
| Mexico | 13 | 5.4% | View All 3 Rows |
Sex and Age in Wilton
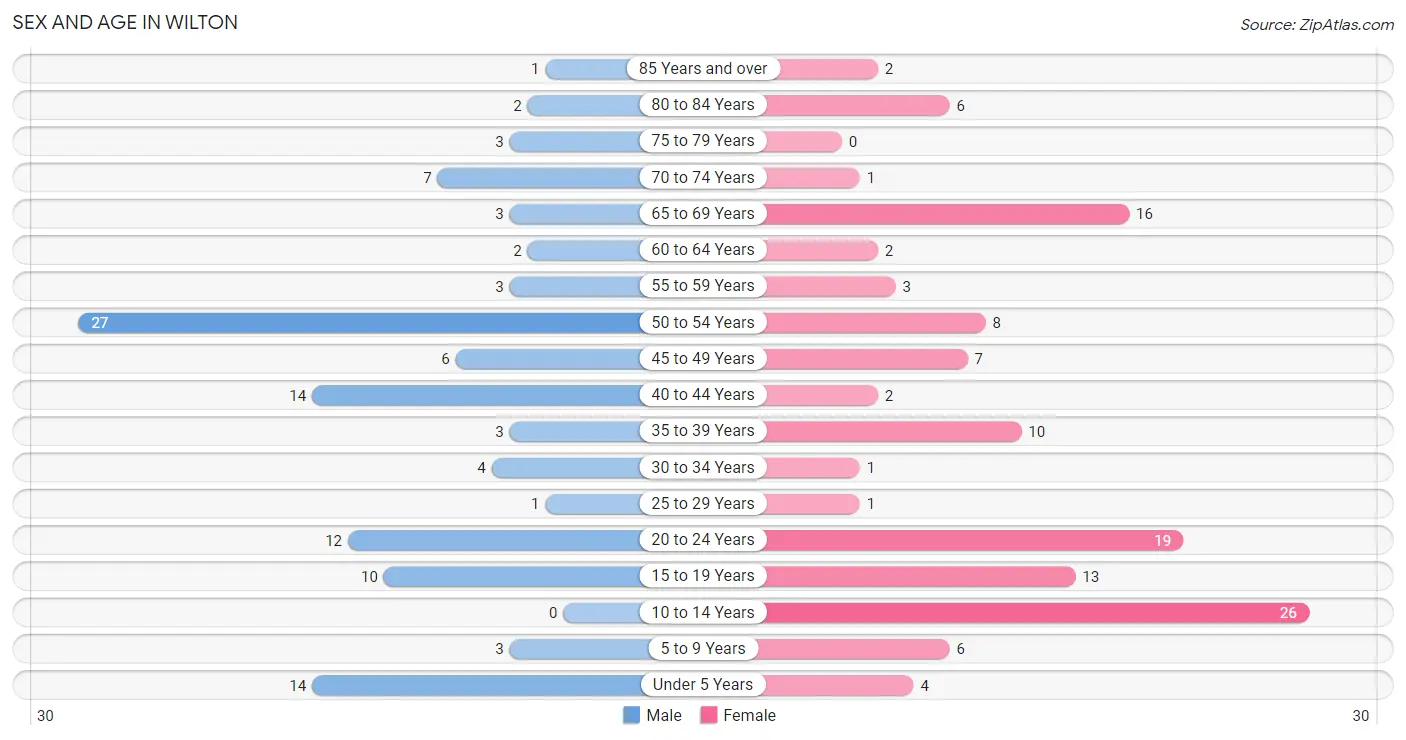
Sex and Age in Wilton
The most populous age groups in Wilton are 50 to 54 Years (27 | 23.5%) for men and 10 to 14 Years (26 | 20.5%) for women.
| Age Bracket | Male | Female |
| Under 5 Years | 14 (12.2%) | 4 (3.2%) |
| 5 to 9 Years | 3 (2.6%) | 6 (4.7%) |
| 10 to 14 Years | 0 (0.0%) | 26 (20.5%) |
| 15 to 19 Years | 10 (8.7%) | 13 (10.2%) |
| 20 to 24 Years | 12 (10.4%) | 19 (15.0%) |
| 25 to 29 Years | 1 (0.9%) | 1 (0.8%) |
| 30 to 34 Years | 4 (3.5%) | 1 (0.8%) |
| 35 to 39 Years | 3 (2.6%) | 10 (7.9%) |
| 40 to 44 Years | 14 (12.2%) | 2 (1.6%) |
| 45 to 49 Years | 6 (5.2%) | 7 (5.5%) |
| 50 to 54 Years | 27 (23.5%) | 8 (6.3%) |
| 55 to 59 Years | 3 (2.6%) | 3 (2.4%) |
| 60 to 64 Years | 2 (1.7%) | 2 (1.6%) |
| 65 to 69 Years | 3 (2.6%) | 16 (12.6%) |
| 70 to 74 Years | 7 (6.1%) | 1 (0.8%) |
| 75 to 79 Years | 3 (2.6%) | 0 (0.0%) |
| 80 to 84 Years | 2 (1.7%) | 6 (4.7%) |
| 85 Years and over | 1 (0.9%) | 2 (1.6%) |
| Total | 115 (100.0%) | 127 (100.0%) |
Families and Households in Wilton
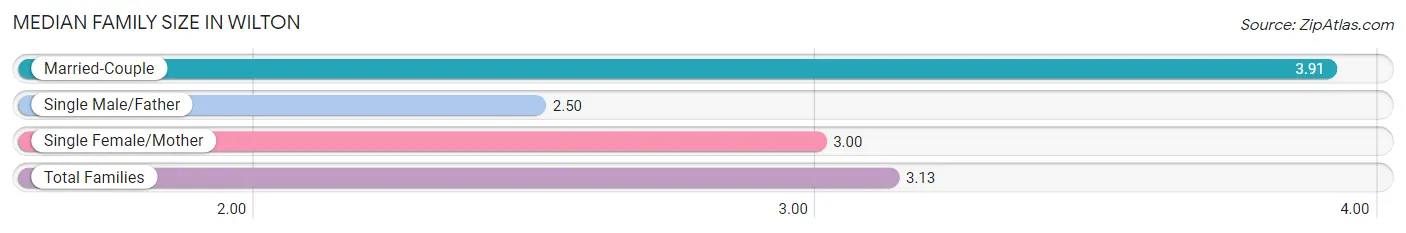
Median Family Size in Wilton
The median family size in Wilton is 3.13 persons per family, with married-couple families (22 | 35.5%) accounting for the largest median family size of 3.91 persons per family. On the other hand, single male/father families (24 | 38.7%) represent the smallest median family size with 2.50 persons per family.
| Family Type | # Families | Family Size |
| Married-Couple | 22 (35.5%) | 3.91 |
| Single Male/Father | 24 (38.7%) | 2.50 |
| Single Female/Mother | 16 (25.8%) | 3.00 |
| Total Families | 62 (100.0%) | 3.13 |
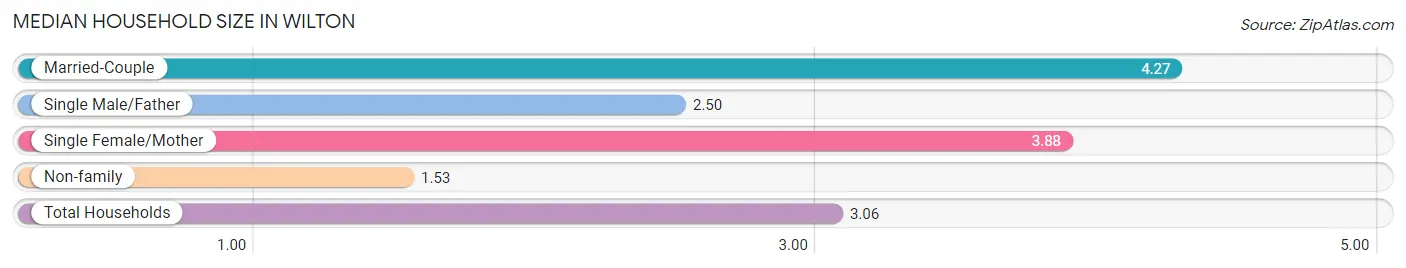
Median Household Size in Wilton
The median household size in Wilton is 3.06 persons per household, with married-couple households (22 | 27.9%) accounting for the largest median household size of 4.27 persons per household. non-family households (17 | 21.5%) represent the smallest median household size with 1.53 persons per household.
| Household Type | # Households | Household Size |
| Married-Couple | 22 (27.9%) | 4.27 |
| Single Male/Father | 24 (30.4%) | 2.50 |
| Single Female/Mother | 16 (20.3%) | 3.88 |
| Non-family | 17 (21.5%) | 1.53 |
| Total Households | 79 (100.0%) | 3.06 |
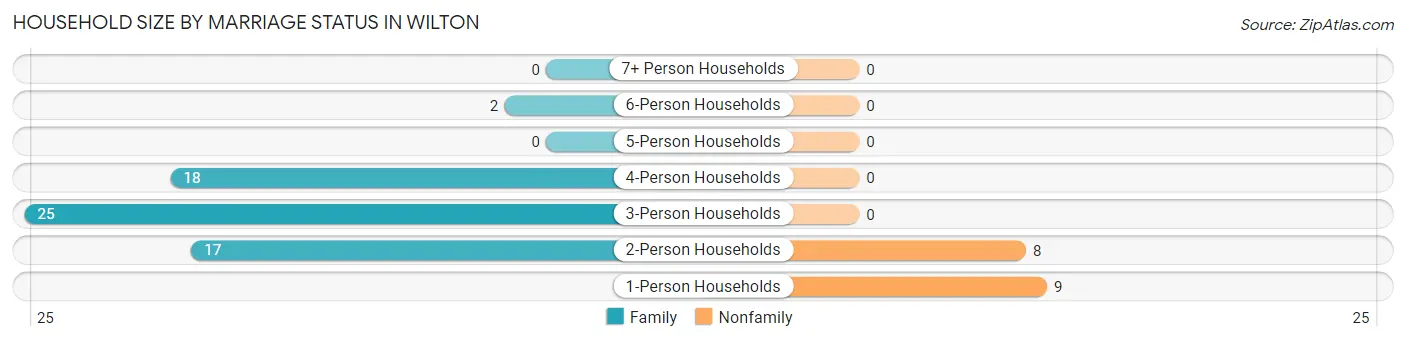
Household Size by Marriage Status in Wilton
Out of a total of 79 households in Wilton, 62 (78.5%) are family households, while 17 (21.5%) are nonfamily households. The most numerous type of family households are 3-person households, comprising 25, and the most common type of nonfamily households are 1-person households, comprising 9.
| Household Size | Family Households | Nonfamily Households |
| 1-Person Households | - | 9 (11.4%) |
| 2-Person Households | 17 (21.5%) | 8 (10.1%) |
| 3-Person Households | 25 (31.7%) | 0 (0.0%) |
| 4-Person Households | 18 (22.8%) | 0 (0.0%) |
| 5-Person Households | 0 (0.0%) | 0 (0.0%) |
| 6-Person Households | 2 (2.5%) | 0 (0.0%) |
| 7+ Person Households | 0 (0.0%) | 0 (0.0%) |
| Total | 62 (78.5%) | 17 (21.5%) |
Female Fertility in Wilton
Fertility by Age in Wilton
| Age Bracket | Women with Births | Births / 1,000 Women |
| 15 to 19 years | 0 (0.0%) | 0.0 |
| 20 to 34 years | 0 (0.0%) | 0.0 |
| 35 to 50 years | 0 (0.0%) | 0.0 |
| Total | 0 (0.0%) | 0.0 |
Fertility by Age by Marriage Status in Wilton
| Age Bracket | Married | Unmarried |
| 15 to 19 years | 0 (0.0%) | 0 (0.0%) |
| 20 to 34 years | 0 (0.0%) | 0 (0.0%) |
| 35 to 50 years | 0 (0.0%) | 0 (0.0%) |
| Total | 0 (0.0%) | 0 (0.0%) |
Fertility by Education in Wilton
| Educational Attainment | Women with Births | Births / 1,000 Women |
| Less than High School | 0 (0.0%) | 0.0 |
| High School Diploma | 0 (0.0%) | 0.0 |
| College or Associate's Degree | 0 (0.0%) | 0.0 |
| Bachelor's Degree | 0 (0.0%) | 0.0 |
| Graduate Degree | 0 (0.0%) | 0.0 |
| Total | 0 (0.0%) | 0.0 |
Fertility by Education by Marriage Status in Wilton
| Educational Attainment | Married | Unmarried |
| Less than High School | 0 (0.0%) | 0 (0.0%) |
| High School Diploma | 0 (0.0%) | 0 (0.0%) |
| College or Associate's Degree | 0 (0.0%) | 0 (0.0%) |
| Bachelor's Degree | 0 (0.0%) | 0 (0.0%) |
| Graduate Degree | 0 (0.0%) | 0 (0.0%) |
| Total | 0 (0.0%) | 0 (0.0%) |
Income in Wilton
Income Overview in Wilton
Per Capita Income in Wilton is $22,349, while median incomes of families and households are $54,318 and $54,943 respectively.
| Characteristic | Number | Measure |
| Per Capita Income | 242 | $22,349 |
| Median Family Income | 62 | $54,318 |
| Mean Family Income | 62 | $61,965 |
| Median Household Income | 79 | $54,943 |
| Mean Household Income | 79 | $63,142 |
| Income Deficit | 62 | $17,800 |
| Wage / Income Gap (%) | 242 | 27.47% |
| Wage / Income Gap ($) | 242 | 72.53¢ per $1 |
| Gini / Inequality Index | 242 | 0.30 |
Earnings by Sex in Wilton
Average Earnings in Wilton are $41,875, $52,850 for men and $38,333 for women, a difference of 27.5%.
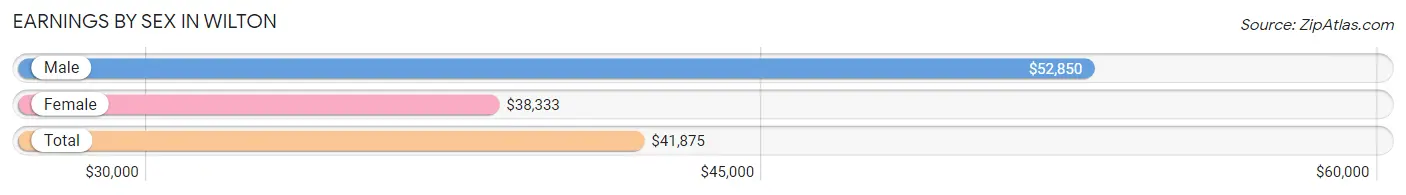
| Sex | Number | Average Earnings |
| Male | 61 (64.2%) | $52,850 |
| Female | 34 (35.8%) | $38,333 |
| Total | 95 (100.0%) | $41,875 |
Earnings by Sex by Income Bracket in Wilton
The most common earnings brackets in Wilton are $50,000 to $54,999 for men (27 | 44.3%) and $12,500 to $14,999 for women (6 | 17.6%).
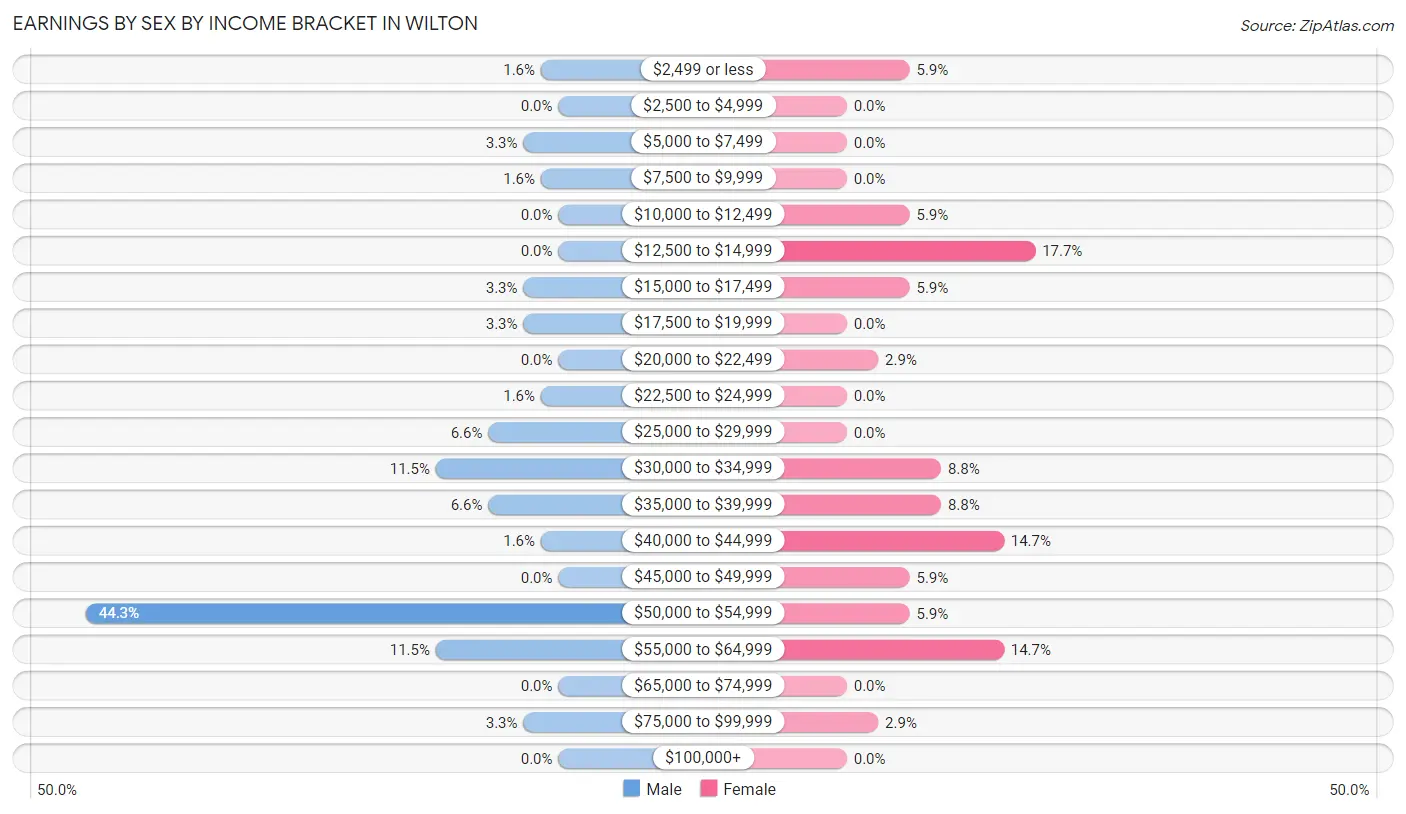
| Income | Male | Female |
| $2,499 or less | 1 (1.6%) | 2 (5.9%) |
| $2,500 to $4,999 | 0 (0.0%) | 0 (0.0%) |
| $5,000 to $7,499 | 2 (3.3%) | 0 (0.0%) |
| $7,500 to $9,999 | 1 (1.6%) | 0 (0.0%) |
| $10,000 to $12,499 | 0 (0.0%) | 2 (5.9%) |
| $12,500 to $14,999 | 0 (0.0%) | 6 (17.6%) |
| $15,000 to $17,499 | 2 (3.3%) | 2 (5.9%) |
| $17,500 to $19,999 | 2 (3.3%) | 0 (0.0%) |
| $20,000 to $22,499 | 0 (0.0%) | 1 (2.9%) |
| $22,500 to $24,999 | 1 (1.6%) | 0 (0.0%) |
| $25,000 to $29,999 | 4 (6.6%) | 0 (0.0%) |
| $30,000 to $34,999 | 7 (11.5%) | 3 (8.8%) |
| $35,000 to $39,999 | 4 (6.6%) | 3 (8.8%) |
| $40,000 to $44,999 | 1 (1.6%) | 5 (14.7%) |
| $45,000 to $49,999 | 0 (0.0%) | 2 (5.9%) |
| $50,000 to $54,999 | 27 (44.3%) | 2 (5.9%) |
| $55,000 to $64,999 | 7 (11.5%) | 5 (14.7%) |
| $65,000 to $74,999 | 0 (0.0%) | 0 (0.0%) |
| $75,000 to $99,999 | 2 (3.3%) | 1 (2.9%) |
| $100,000+ | 0 (0.0%) | 0 (0.0%) |
| Total | 61 (100.0%) | 34 (100.0%) |
Earnings by Sex by Educational Attainment in Wilton
Average earnings in Wilton are $53,550 for men and $41,250 for women, a difference of 23.0%. Men with an educational attainment of high school diploma enjoy the highest average annual earnings of $53,859, while those with college or associate's degree education earn the least with $52,500. Women with an educational attainment of college or associate's degree earn the most with the average annual earnings of $48,750, while those with college or associate's degree education have the smallest earnings of $48,750.
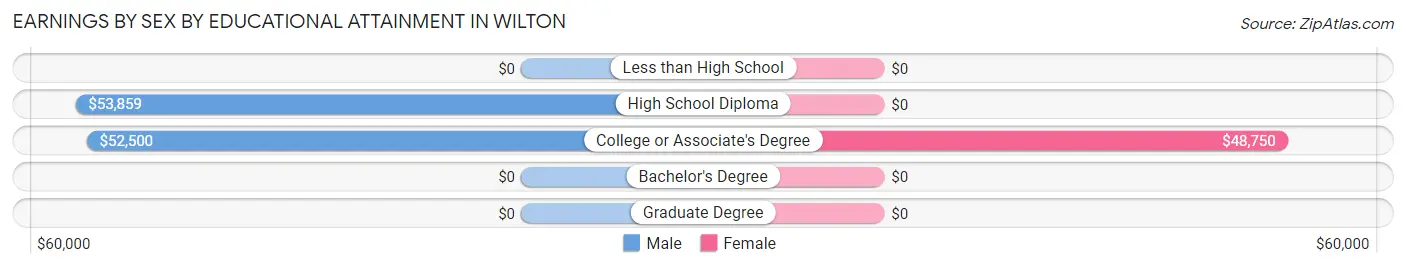
| Educational Attainment | Male Income | Female Income |
| Less than High School | - | - |
| High School Diploma | $53,859 | $0 |
| College or Associate's Degree | $52,500 | $48,750 |
| Bachelor's Degree | - | - |
| Graduate Degree | - | - |
| Total | $53,550 | $41,250 |
Family Income in Wilton
Family Income Brackets in Wilton
According to the Wilton family income data, there are 31 families falling into the $50,000 to $74,999 income range, which is the most common income bracket and makes up 50.0% of all families.
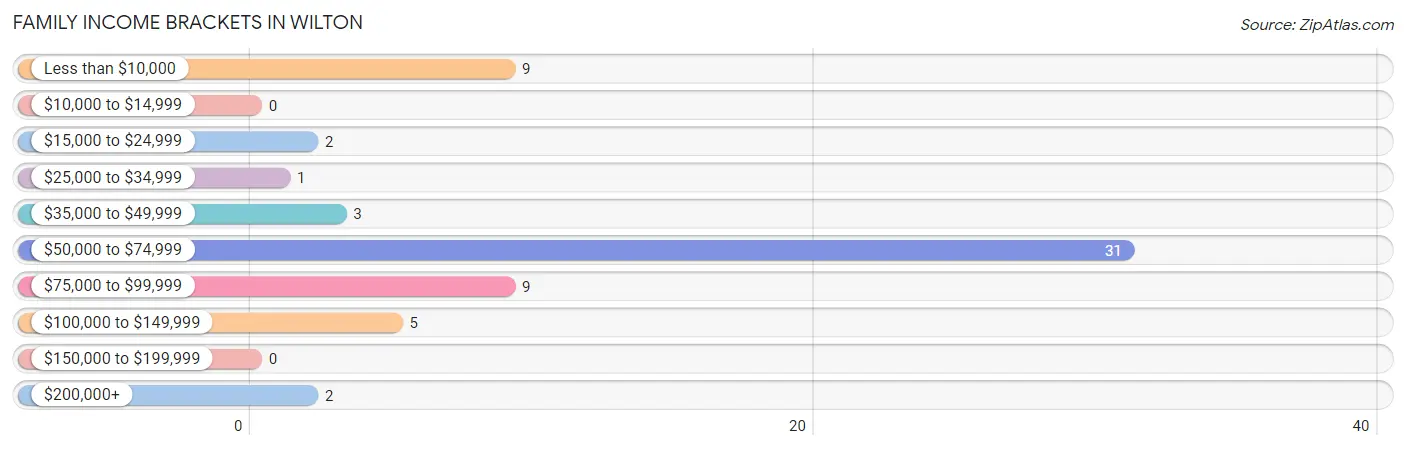
| Income Bracket | # Families | % Families |
| Less than $10,000 | 9 | 14.5% |
| $10,000 to $14,999 | 0 | 0.0% |
| $15,000 to $24,999 | 2 | 3.2% |
| $25,000 to $34,999 | 1 | 1.6% |
| $35,000 to $49,999 | 3 | 4.8% |
| $50,000 to $74,999 | 31 | 50.0% |
| $75,000 to $99,999 | 9 | 14.5% |
| $100,000 to $149,999 | 5 | 8.1% |
| $150,000 to $199,999 | 0 | 0.0% |
| $200,000+ | 2 | 3.2% |
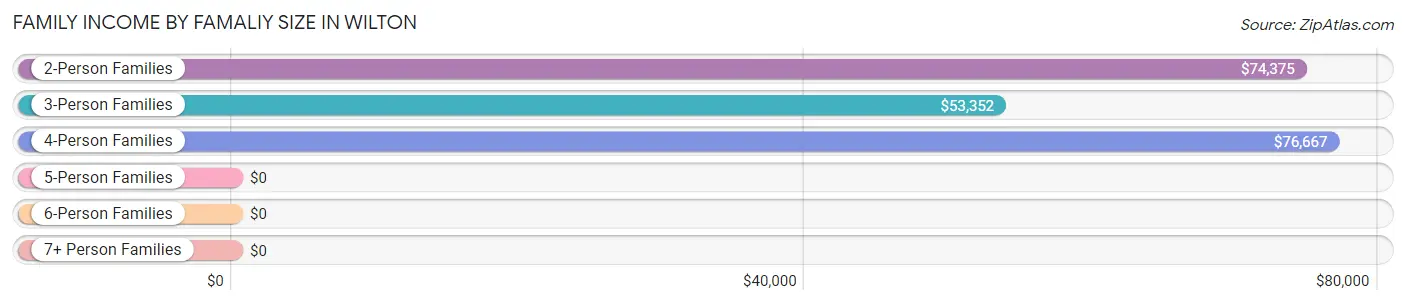
Family Income by Famaliy Size in Wilton
4-person families (10 | 16.1%) account for the highest median family income in Wilton with $76,667 per family, while 2-person families (17 | 27.4%) have the highest median income of $37,188 per family member.
| Income Bracket | # Families | Median Income |
| 2-Person Families | 17 (27.4%) | $74,375 |
| 3-Person Families | 35 (56.5%) | $53,352 |
| 4-Person Families | 10 (16.1%) | $76,667 |
| 5-Person Families | 0 (0.0%) | $0 |
| 6-Person Families | 0 (0.0%) | $0 |
| 7+ Person Families | 0 (0.0%) | $0 |
| Total | 62 (100.0%) | $54,318 |
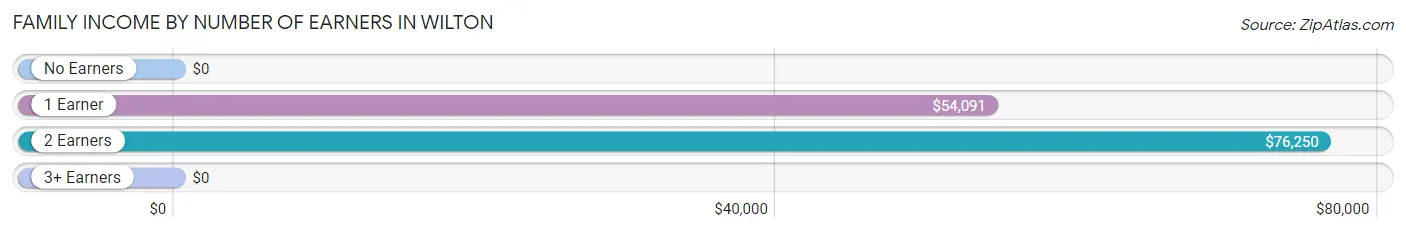
Family Income by Number of Earners in Wilton
| Number of Earners | # Families | Median Income |
| No Earners | 14 (22.6%) | $0 |
| 1 Earner | 34 (54.8%) | $54,091 |
| 2 Earners | 11 (17.7%) | $76,250 |
| 3+ Earners | 3 (4.8%) | $0 |
| Total | 62 (100.0%) | $54,318 |
Household Income in Wilton
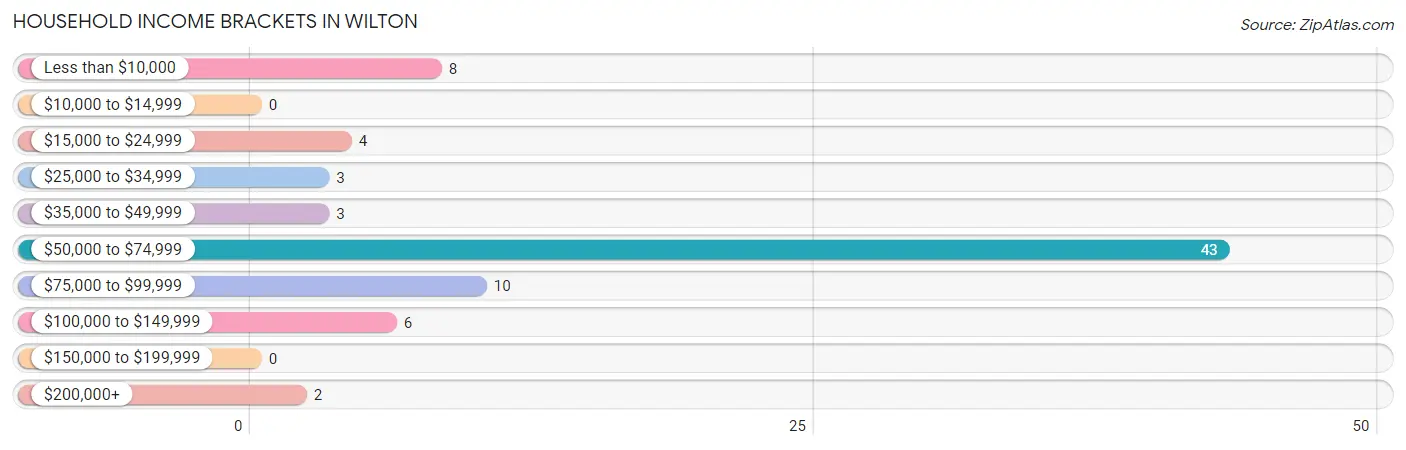
Household Income Brackets in Wilton
With 43 households falling in the category, the $50,000 to $74,999 income range is the most frequent in Wilton, accounting for 54.4% of all households.
| Income Bracket | # Households | % Households |
| Less than $10,000 | 8 | 10.1% |
| $10,000 to $14,999 | 0 | 0.0% |
| $15,000 to $24,999 | 4 | 5.1% |
| $25,000 to $34,999 | 3 | 3.8% |
| $35,000 to $49,999 | 3 | 3.8% |
| $50,000 to $74,999 | 43 | 54.4% |
| $75,000 to $99,999 | 10 | 12.7% |
| $100,000 to $149,999 | 6 | 7.6% |
| $150,000 to $199,999 | 0 | 0.0% |
| $200,000+ | 2 | 2.5% |
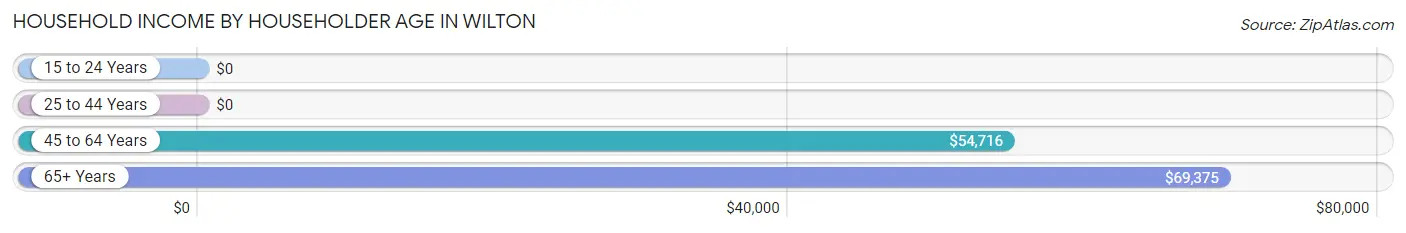
Household Income by Householder Age in Wilton
The median household income in Wilton is $54,943, with the highest median household income of $69,375 found in the 65+ years age bracket for the primary householder. A total of 19 households (24.0%) fall into this category. Meanwhile, the 15 to 24 years age bracket for the primary householder has the lowest median household income of $0, with 6 households (7.6%) in this group.
| Income Bracket | # Households | Median Income |
| 15 to 24 Years | 6 (7.6%) | $0 |
| 25 to 44 Years | 15 (19.0%) | $0 |
| 45 to 64 Years | 39 (49.4%) | $54,716 |
| 65+ Years | 19 (24.0%) | $69,375 |
| Total | 79 (100.0%) | $54,943 |
Poverty in Wilton
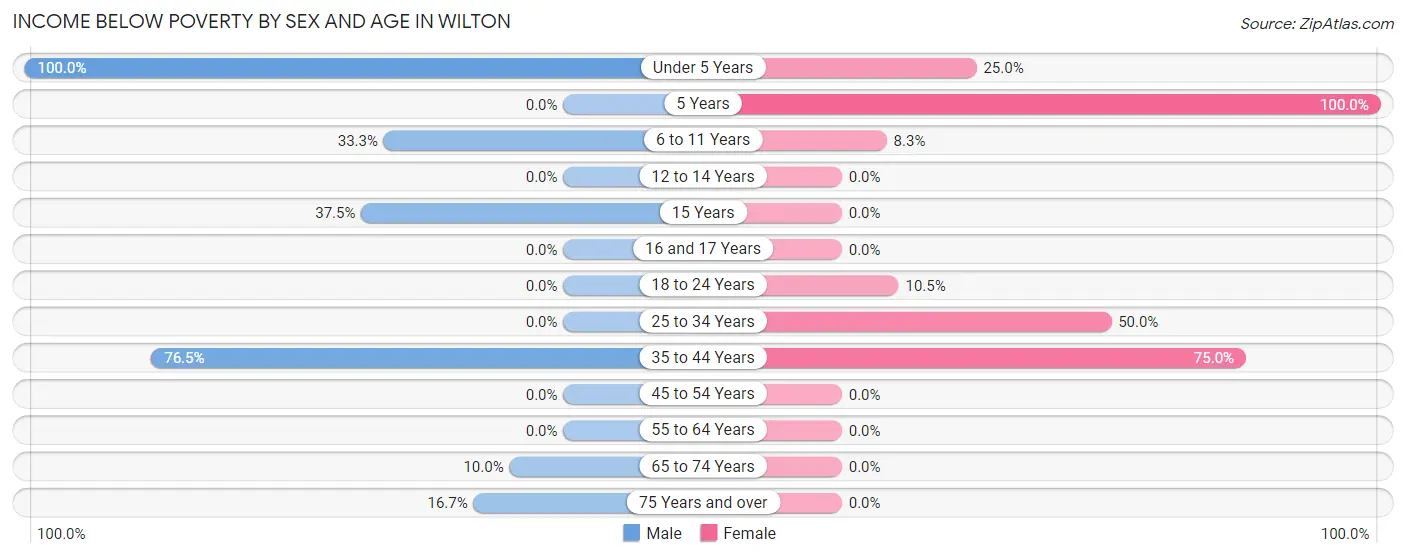
Income Below Poverty by Sex and Age in Wilton
With 28.7% poverty level for males and 14.7% for females among the residents of Wilton, under 5 year old males and 5 year old females are the most vulnerable to poverty, with 14 males (100.0%) and 3 females (100.0%) in their respective age groups living below the poverty level.
| Age Bracket | Male | Female |
| Under 5 Years | 14 (100.0%) | 1 (25.0%) |
| 5 Years | 0 (0.0%) | 3 (100.0%) |
| 6 to 11 Years | 1 (33.3%) | 2 (8.3%) |
| 12 to 14 Years | 0 (0.0%) | 0 (0.0%) |
| 15 Years | 3 (37.5%) | 0 (0.0%) |
| 16 and 17 Years | 0 (0.0%) | 0 (0.0%) |
| 18 to 24 Years | 0 (0.0%) | 2 (10.5%) |
| 25 to 34 Years | 0 (0.0%) | 1 (50.0%) |
| 35 to 44 Years | 13 (76.5%) | 9 (75.0%) |
| 45 to 54 Years | 0 (0.0%) | 0 (0.0%) |
| 55 to 64 Years | 0 (0.0%) | 0 (0.0%) |
| 65 to 74 Years | 1 (10.0%) | 0 (0.0%) |
| 75 Years and over | 1 (16.7%) | 0 (0.0%) |
| Total | 33 (28.7%) | 18 (14.7%) |
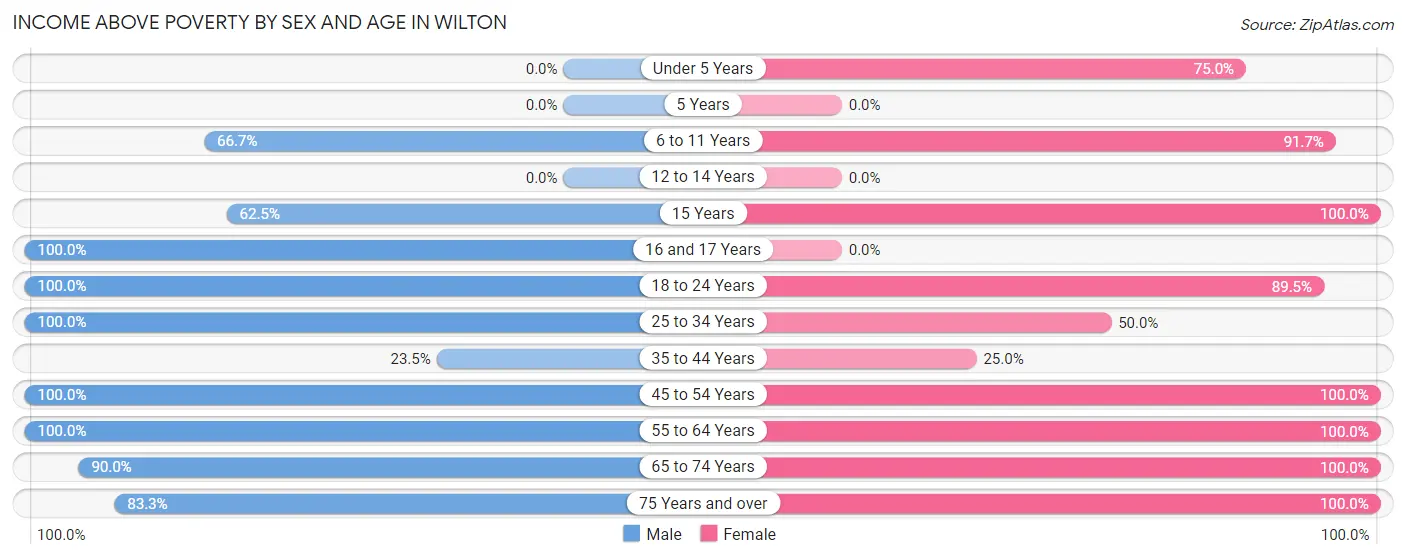
Income Above Poverty by Sex and Age in Wilton
According to the poverty statistics in Wilton, males aged 16 and 17 years and females aged 15 years are the age groups that are most secure financially, with 100.0% of males and 100.0% of females in these age groups living above the poverty line.
| Age Bracket | Male | Female |
| Under 5 Years | 0 (0.0%) | 3 (75.0%) |
| 5 Years | 0 (0.0%) | 0 (0.0%) |
| 6 to 11 Years | 2 (66.7%) | 22 (91.7%) |
| 12 to 14 Years | 0 (0.0%) | 0 (0.0%) |
| 15 Years | 5 (62.5%) | 13 (100.0%) |
| 16 and 17 Years | 2 (100.0%) | 0 (0.0%) |
| 18 to 24 Years | 12 (100.0%) | 17 (89.5%) |
| 25 to 34 Years | 5 (100.0%) | 1 (50.0%) |
| 35 to 44 Years | 4 (23.5%) | 3 (25.0%) |
| 45 to 54 Years | 33 (100.0%) | 15 (100.0%) |
| 55 to 64 Years | 5 (100.0%) | 5 (100.0%) |
| 65 to 74 Years | 9 (90.0%) | 17 (100.0%) |
| 75 Years and over | 5 (83.3%) | 8 (100.0%) |
| Total | 82 (71.3%) | 104 (85.3%) |
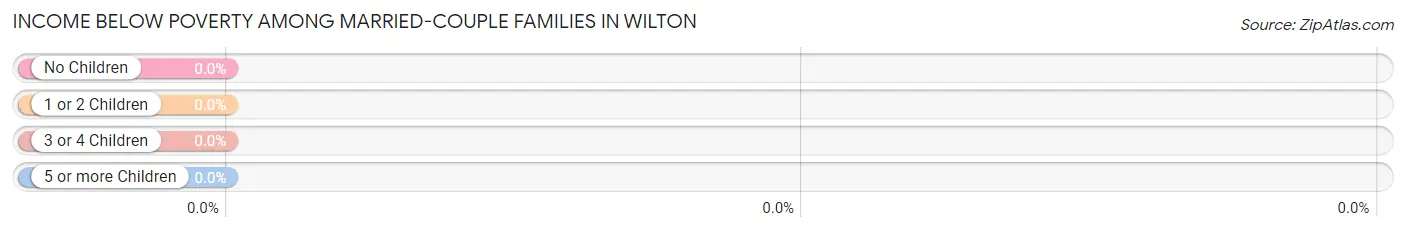
Income Below Poverty Among Married-Couple Families in Wilton
| Children | Above Poverty | Below Poverty |
| No Children | 19 (100.0%) | 0 (0.0%) |
| 1 or 2 Children | 3 (100.0%) | 0 (0.0%) |
| 3 or 4 Children | 0 (0.0%) | 0 (0.0%) |
| 5 or more Children | 0 (0.0%) | 0 (0.0%) |
| Total | 22 (100.0%) | 0 (0.0%) |
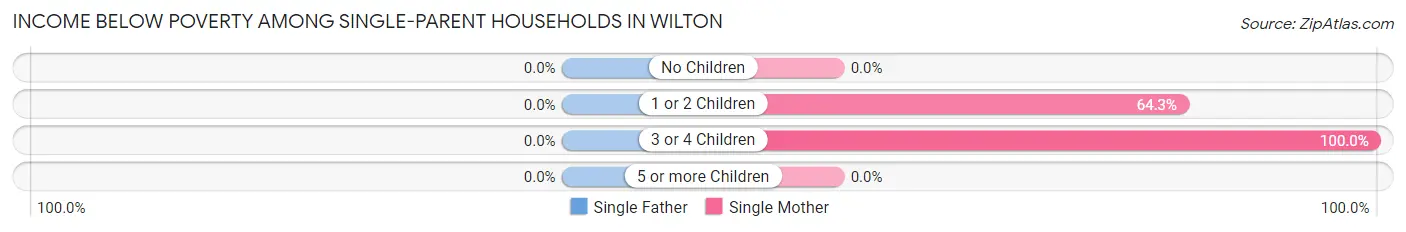
Income Below Poverty Among Single-Parent Households in Wilton
| Children | Single Father | Single Mother |
| No Children | 0 (0.0%) | 0 (0.0%) |
| 1 or 2 Children | 0 (0.0%) | 9 (64.3%) |
| 3 or 4 Children | 0 (0.0%) | 1 (100.0%) |
| 5 or more Children | 0 (0.0%) | 0 (0.0%) |
| Total | 0 (0.0%) | 10 (62.5%) |
Income Below Poverty Among Married-Couple vs Single-Parent Households in Wilton
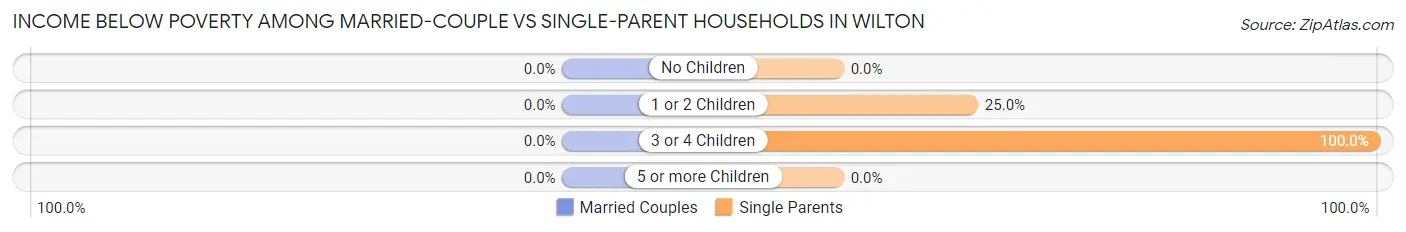
| Children | Married-Couple Families | Single-Parent Households |
| No Children | 0 (0.0%) | 0 (0.0%) |
| 1 or 2 Children | 0 (0.0%) | 9 (25.0%) |
| 3 or 4 Children | 0 (0.0%) | 1 (100.0%) |
| 5 or more Children | 0 (0.0%) | 0 (0.0%) |
| Total | 0 (0.0%) | 10 (25.0%) |
Employment Characteristics in Wilton
Employment by Class of Employer in Wilton
Among the 78 employed individuals in Wilton, private company employees (32 | 41.0%), unpaid family workers (24 | 30.8%), and local government employees (9 | 11.5%) make up the most common classes of employment.
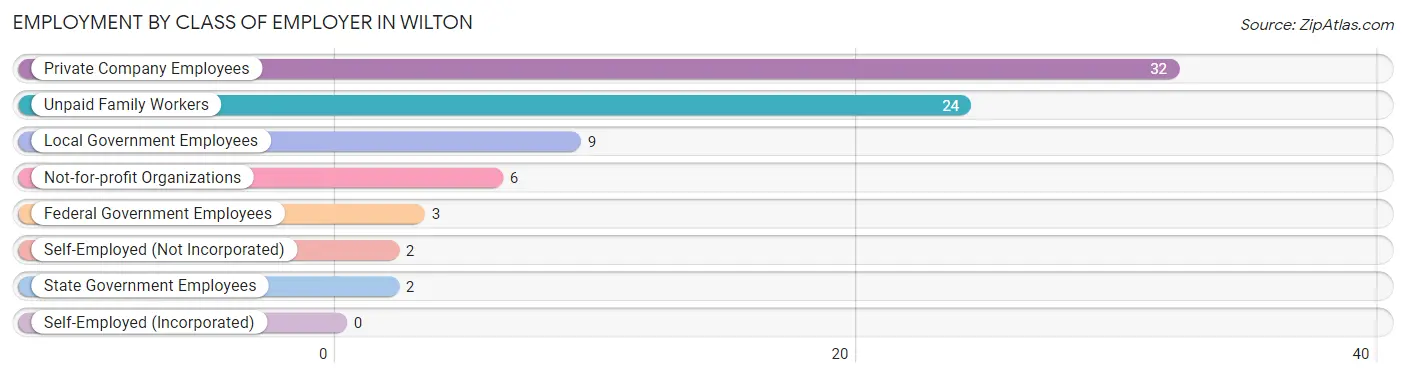
| Employer Class | # Employees | % Employees |
| Private Company Employees | 32 | 41.0% |
| Self-Employed (Incorporated) | 0 | 0.0% |
| Self-Employed (Not Incorporated) | 2 | 2.6% |
| Not-for-profit Organizations | 6 | 7.7% |
| Local Government Employees | 9 | 11.5% |
| State Government Employees | 2 | 2.6% |
| Federal Government Employees | 3 | 3.8% |
| Unpaid Family Workers | 24 | 30.8% |
| Total | 78 | 100.0% |
Employment Status by Age in Wilton
According to the labor force statistics for Wilton, out of the total population over 16 years of age (168), 63.7% or 107 individuals are in the labor force, with 27.1% or 29 of them unemployed. The age group with the highest labor force participation rate is 16 to 19 years, with 100.0% or 2 individuals in the labor force. Within the labor force, the 35 to 44 years age range has the highest percentage of unemployed individuals, with 84.0% or 21 of them being unemployed.
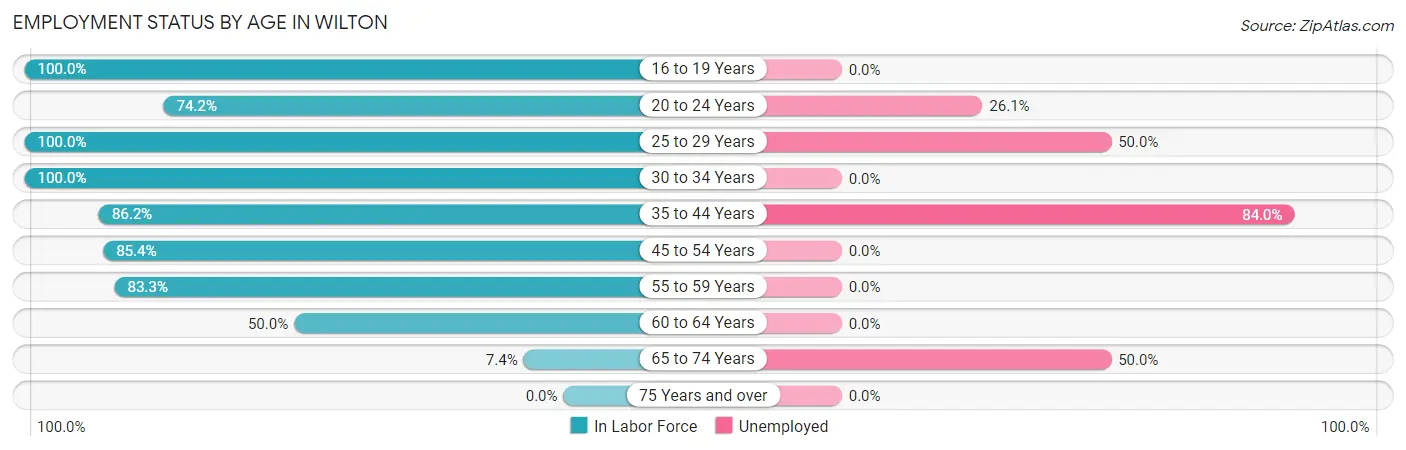
| Age Bracket | In Labor Force | Unemployed |
| 16 to 19 Years | 2 (100.0%) | 0 (0.0%) |
| 20 to 24 Years | 23 (74.2%) | 6 (26.1%) |
| 25 to 29 Years | 2 (100.0%) | 1 (50.0%) |
| 30 to 34 Years | 5 (100.0%) | 0 (0.0%) |
| 35 to 44 Years | 25 (86.2%) | 21 (84.0%) |
| 45 to 54 Years | 41 (85.4%) | 0 (0.0%) |
| 55 to 59 Years | 5 (83.3%) | 0 (0.0%) |
| 60 to 64 Years | 2 (50.0%) | 0 (0.0%) |
| 65 to 74 Years | 2 (7.4%) | 1 (50.0%) |
| 75 Years and over | 0 (0.0%) | 0 (0.0%) |
| Total | 107 (63.7%) | 29 (27.1%) |
Employment Status by Educational Attainment in Wilton
According to labor force statistics for Wilton, 85.1% of individuals (80) out of the total population between 25 and 64 years of age (94) are in the labor force, with 27.5% or 22 of them being unemployed. The group with the highest labor force participation rate are those with the educational attainment of bachelor's degree or higher, with 93.3% or 14 individuals in the labor force. Within the labor force, individuals with less than high school education have the highest percentage of unemployment, with 90.9% or 10 of them being unemployed.
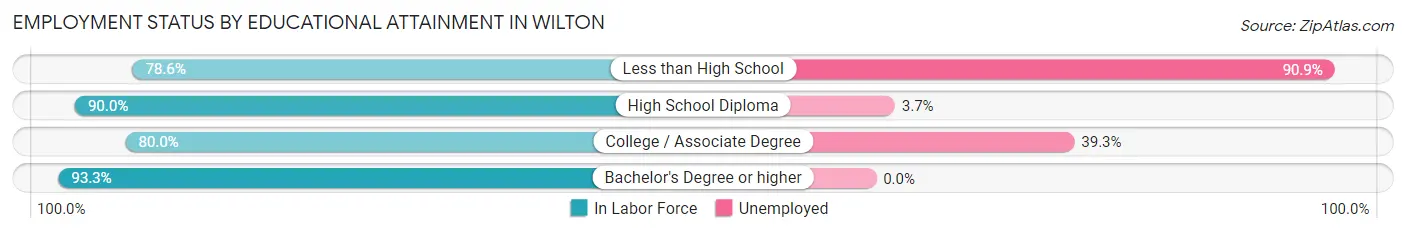
| Educational Attainment | In Labor Force | Unemployed |
| Less than High School | 11 (78.6%) | 13 (90.9%) |
| High School Diploma | 27 (90.0%) | 1 (3.7%) |
| College / Associate Degree | 28 (80.0%) | 14 (39.3%) |
| Bachelor's Degree or higher | 14 (93.3%) | 0 (0.0%) |
| Total | 80 (85.1%) | 26 (27.5%) |
Employment Occupations by Sex in Wilton
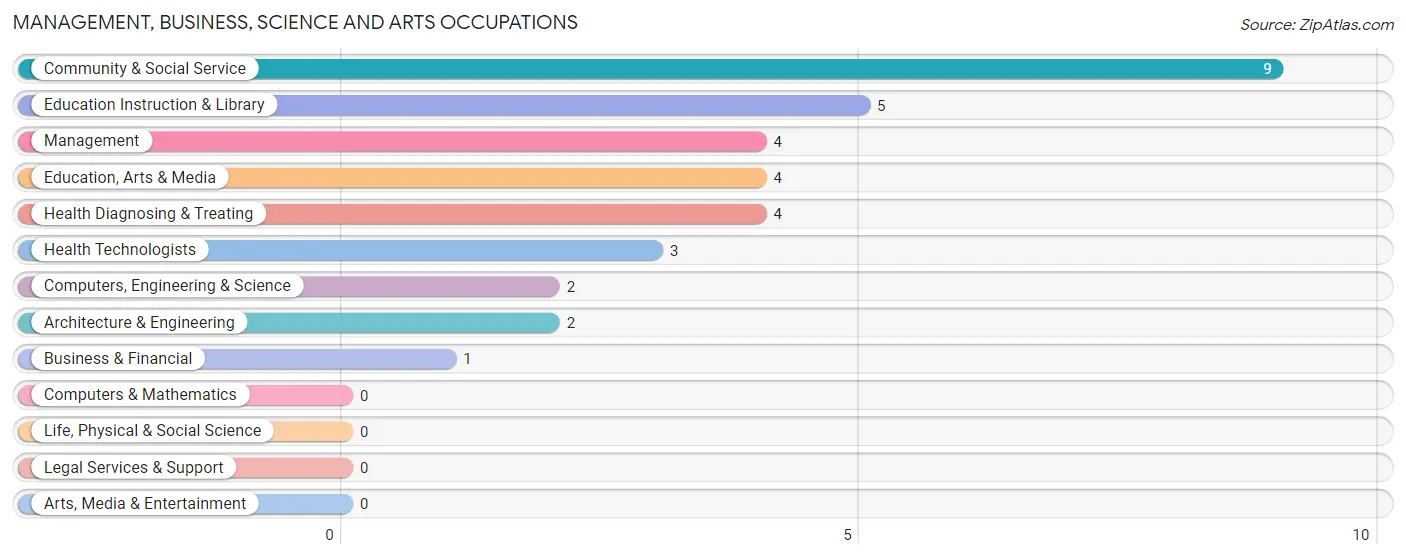
Management, Business, Science and Arts Occupations
The most common Management, Business, Science and Arts occupations in Wilton are Community & Social Service (9 | 11.5%), Education Instruction & Library (5 | 6.4%), Management (4 | 5.1%), Education, Arts & Media (4 | 5.1%), and Health Diagnosing & Treating (4 | 5.1%).
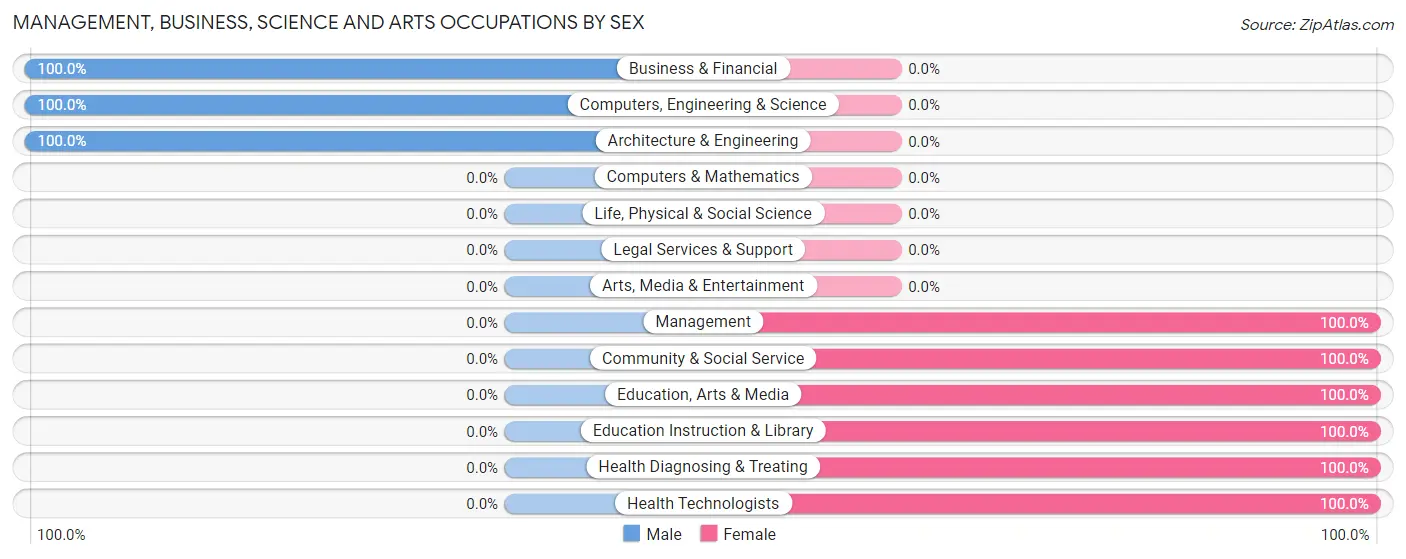
Management, Business, Science and Arts Occupations by Sex
Within the Management, Business, Science and Arts occupations in Wilton, the most male-oriented occupations are Business & Financial (100.0%), Computers, Engineering & Science (100.0%), and Architecture & Engineering (100.0%), while the most female-oriented occupations are Management (100.0%), Community & Social Service (100.0%), and Education, Arts & Media (100.0%).
| Occupation | Male | Female |
| Management | 0 (0.0%) | 4 (100.0%) |
| Business & Financial | 1 (100.0%) | 0 (0.0%) |
| Computers, Engineering & Science | 2 (100.0%) | 0 (0.0%) |
| Computers & Mathematics | 0 (0.0%) | 0 (0.0%) |
| Architecture & Engineering | 2 (100.0%) | 0 (0.0%) |
| Life, Physical & Social Science | 0 (0.0%) | 0 (0.0%) |
| Community & Social Service | 0 (0.0%) | 9 (100.0%) |
| Education, Arts & Media | 0 (0.0%) | 4 (100.0%) |
| Legal Services & Support | 0 (0.0%) | 0 (0.0%) |
| Education Instruction & Library | 0 (0.0%) | 5 (100.0%) |
| Arts, Media & Entertainment | 0 (0.0%) | 0 (0.0%) |
| Health Diagnosing & Treating | 0 (0.0%) | 4 (100.0%) |
| Health Technologists | 0 (0.0%) | 3 (100.0%) |
| Total (Category) | 3 (15.0%) | 17 (85.0%) |
| Total (Overall) | 46 (59.0%) | 32 (41.0%) |
Services Occupations
The most common Services occupations in Wilton are Healthcare Support (10 | 12.8%), Security & Protection (2 | 2.6%), Firefighting & Prevention (2 | 2.6%), Cleaning & Maintenance (1 | 1.3%), and Personal Care & Service (1 | 1.3%).

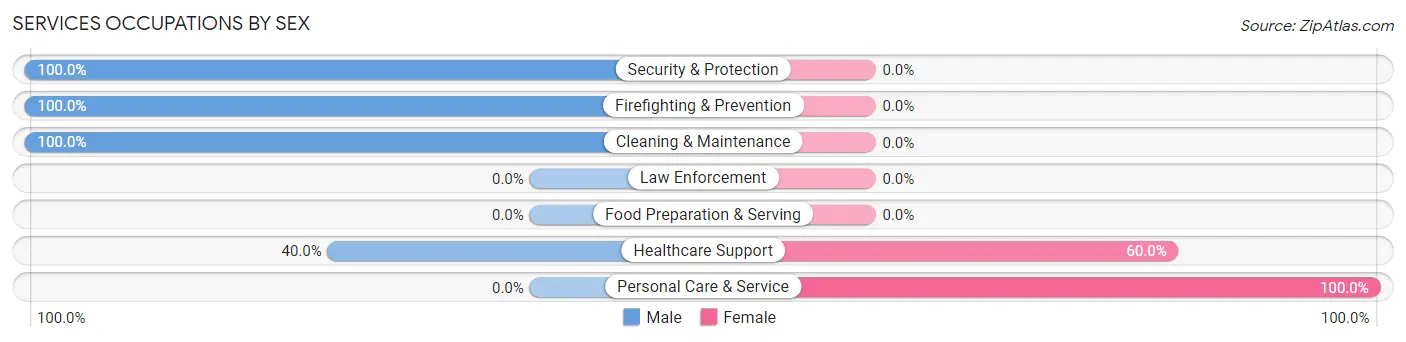
Services Occupations by Sex
Within the Services occupations in Wilton, the most male-oriented occupations are Security & Protection (100.0%), Firefighting & Prevention (100.0%), and Cleaning & Maintenance (100.0%), while the most female-oriented occupations are Personal Care & Service (100.0%), and Healthcare Support (60.0%).
| Occupation | Male | Female |
| Healthcare Support | 4 (40.0%) | 6 (60.0%) |
| Security & Protection | 2 (100.0%) | 0 (0.0%) |
| Firefighting & Prevention | 2 (100.0%) | 0 (0.0%) |
| Law Enforcement | 0 (0.0%) | 0 (0.0%) |
| Food Preparation & Serving | 0 (0.0%) | 0 (0.0%) |
| Cleaning & Maintenance | 1 (100.0%) | 0 (0.0%) |
| Personal Care & Service | 0 (0.0%) | 1 (100.0%) |
| Total (Category) | 7 (50.0%) | 7 (50.0%) |
| Total (Overall) | 46 (59.0%) | 32 (41.0%) |
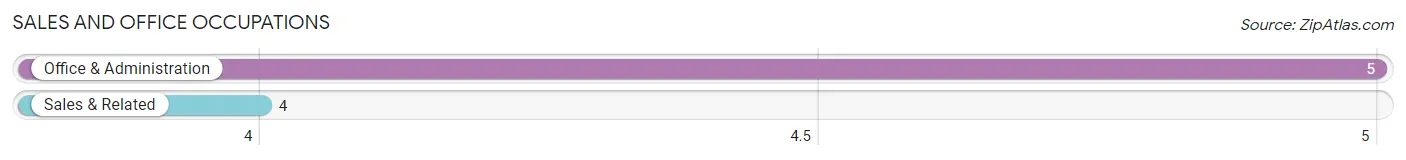
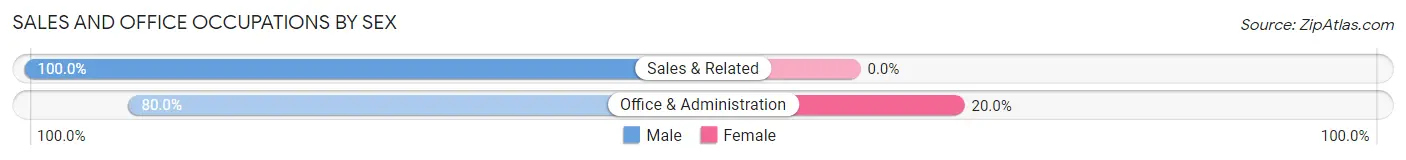
Sales and Office Occupations
The most common Sales and Office occupations in Wilton are Office & Administration (5 | 6.4%), and Sales & Related (4 | 5.1%).
Sales and Office Occupations by Sex
| Occupation | Male | Female |
| Sales & Related | 4 (100.0%) | 0 (0.0%) |
| Office & Administration | 4 (80.0%) | 1 (20.0%) |
| Total (Category) | 8 (88.9%) | 1 (11.1%) |
| Total (Overall) | 46 (59.0%) | 32 (41.0%) |
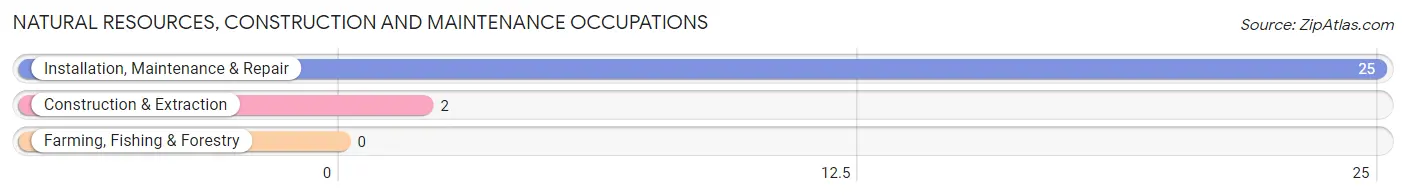
Natural Resources, Construction and Maintenance Occupations
The most common Natural Resources, Construction and Maintenance occupations in Wilton are Installation, Maintenance & Repair (25 | 32.1%), and Construction & Extraction (2 | 2.6%).
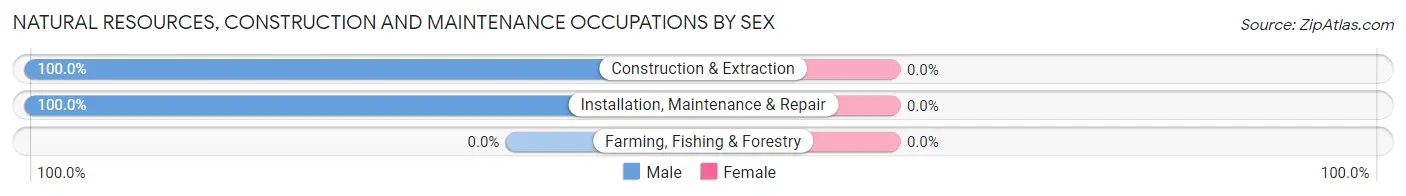
Natural Resources, Construction and Maintenance Occupations by Sex
| Occupation | Male | Female |
| Farming, Fishing & Forestry | 0 (0.0%) | 0 (0.0%) |
| Construction & Extraction | 2 (100.0%) | 0 (0.0%) |
| Installation, Maintenance & Repair | 25 (100.0%) | 0 (0.0%) |
| Total (Category) | 27 (100.0%) | 0 (0.0%) |
| Total (Overall) | 46 (59.0%) | 32 (41.0%) |
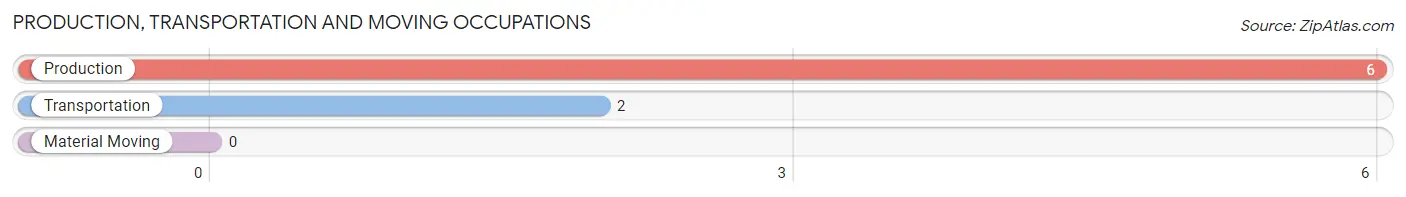
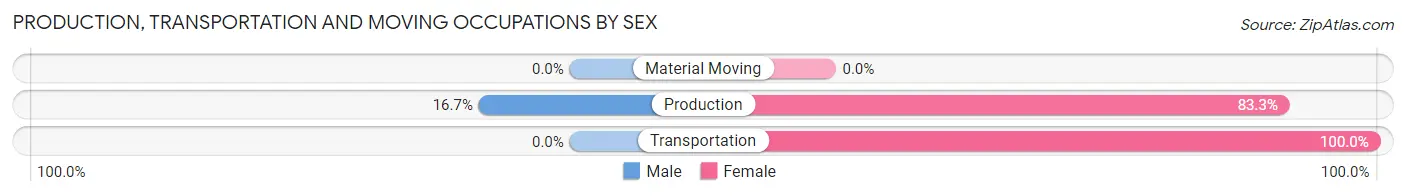
Production, Transportation and Moving Occupations
The most common Production, Transportation and Moving occupations in Wilton are Production (6 | 7.7%), and Transportation (2 | 2.6%).
Production, Transportation and Moving Occupations by Sex
| Occupation | Male | Female |
| Production | 1 (16.7%) | 5 (83.3%) |
| Transportation | 0 (0.0%) | 2 (100.0%) |
| Material Moving | 0 (0.0%) | 0 (0.0%) |
| Total (Category) | 1 (12.5%) | 7 (87.5%) |
| Total (Overall) | 46 (59.0%) | 32 (41.0%) |
Employment Industries by Sex in Wilton
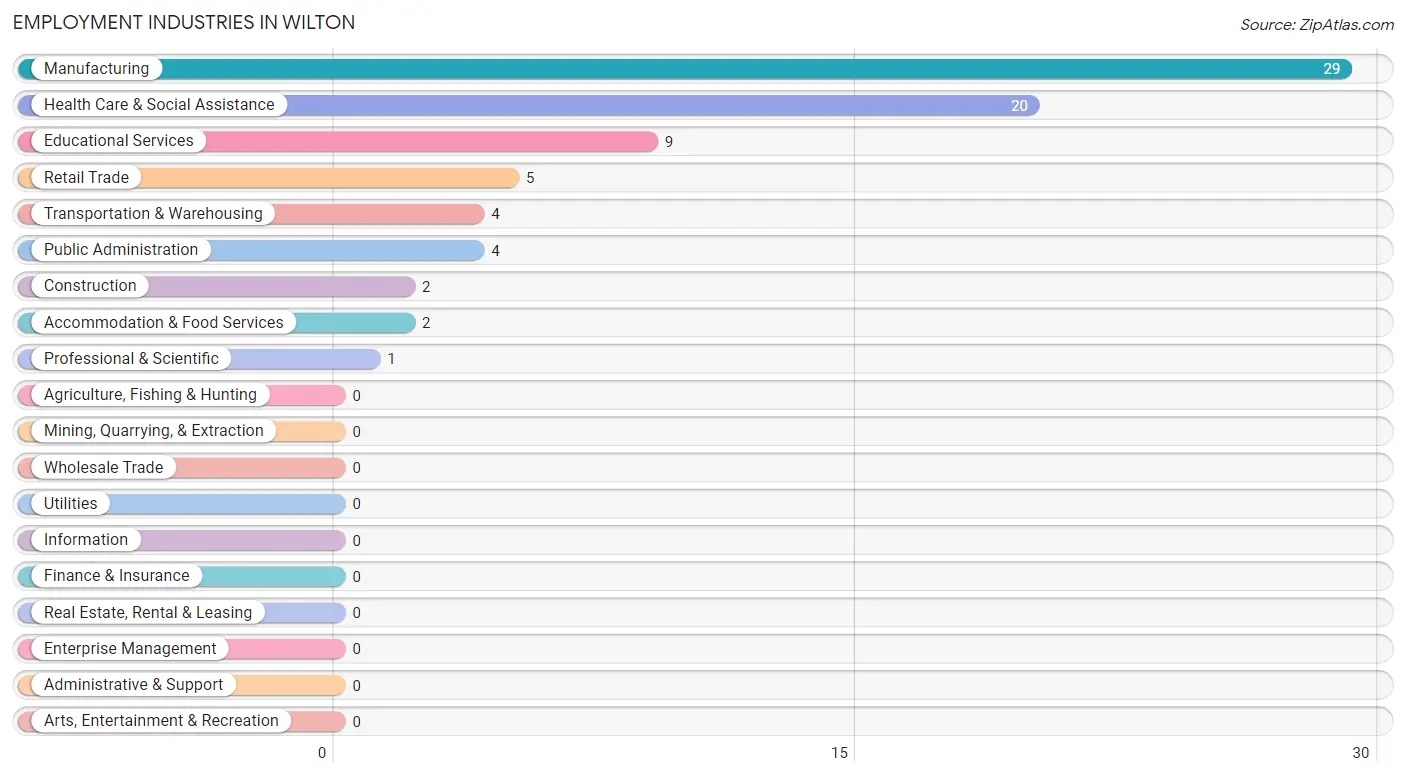
Employment Industries in Wilton
The major employment industries in Wilton include Manufacturing (29 | 37.2%), Health Care & Social Assistance (20 | 25.6%), Educational Services (9 | 11.5%), Retail Trade (5 | 6.4%), and Transportation & Warehousing (4 | 5.1%).
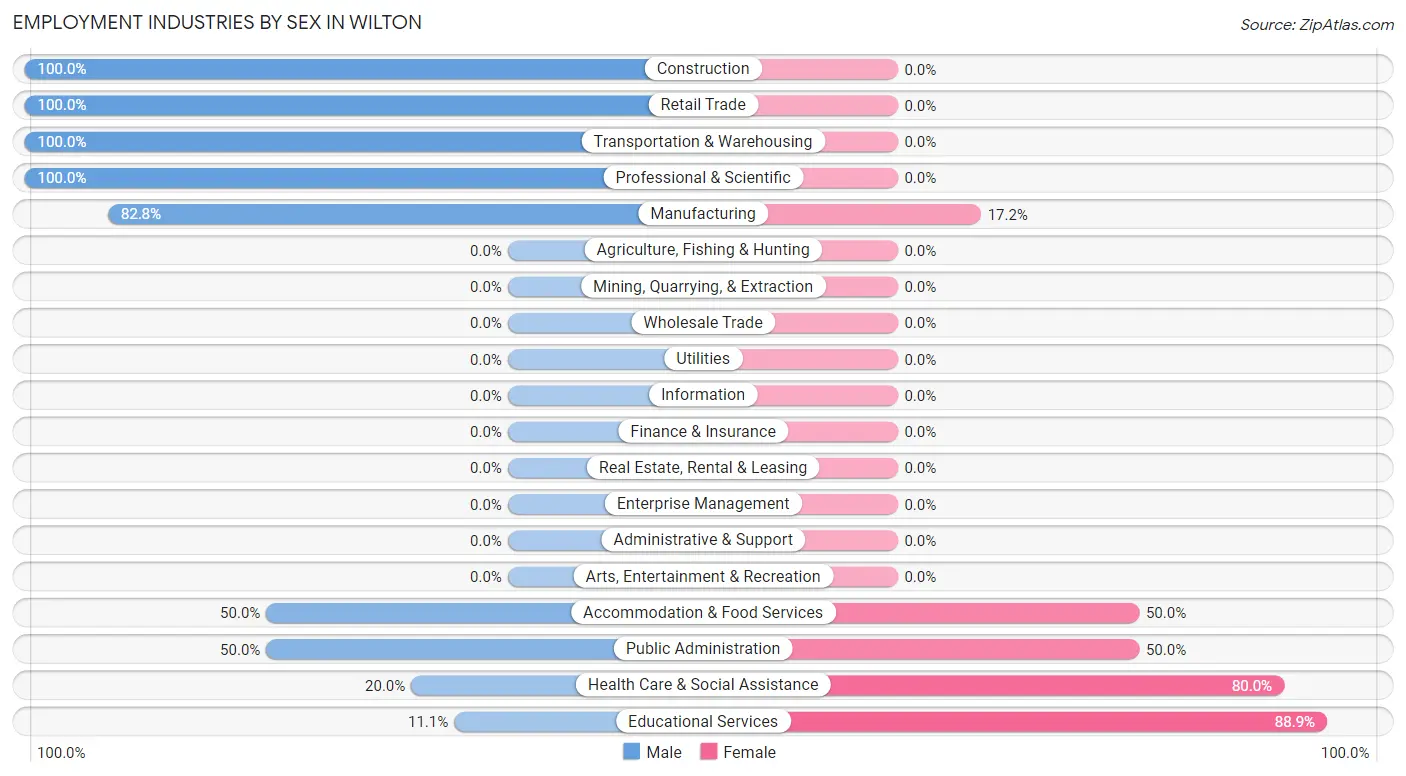
Employment Industries by Sex in Wilton
The Wilton industries that see more men than women are Construction (100.0%), Retail Trade (100.0%), and Transportation & Warehousing (100.0%), whereas the industries that tend to have a higher number of women are Educational Services (88.9%), Health Care & Social Assistance (80.0%), and Accommodation & Food Services (50.0%).
| Industry | Male | Female |
| Agriculture, Fishing & Hunting | 0 (0.0%) | 0 (0.0%) |
| Mining, Quarrying, & Extraction | 0 (0.0%) | 0 (0.0%) |
| Construction | 2 (100.0%) | 0 (0.0%) |
| Manufacturing | 24 (82.8%) | 5 (17.2%) |
| Wholesale Trade | 0 (0.0%) | 0 (0.0%) |
| Retail Trade | 5 (100.0%) | 0 (0.0%) |
| Transportation & Warehousing | 4 (100.0%) | 0 (0.0%) |
| Utilities | 0 (0.0%) | 0 (0.0%) |
| Information | 0 (0.0%) | 0 (0.0%) |
| Finance & Insurance | 0 (0.0%) | 0 (0.0%) |
| Real Estate, Rental & Leasing | 0 (0.0%) | 0 (0.0%) |
| Professional & Scientific | 1 (100.0%) | 0 (0.0%) |
| Enterprise Management | 0 (0.0%) | 0 (0.0%) |
| Administrative & Support | 0 (0.0%) | 0 (0.0%) |
| Educational Services | 1 (11.1%) | 8 (88.9%) |
| Health Care & Social Assistance | 4 (20.0%) | 16 (80.0%) |
| Arts, Entertainment & Recreation | 0 (0.0%) | 0 (0.0%) |
| Accommodation & Food Services | 1 (50.0%) | 1 (50.0%) |
| Public Administration | 2 (50.0%) | 2 (50.0%) |
| Total | 46 (59.0%) | 32 (41.0%) |
Education in Wilton
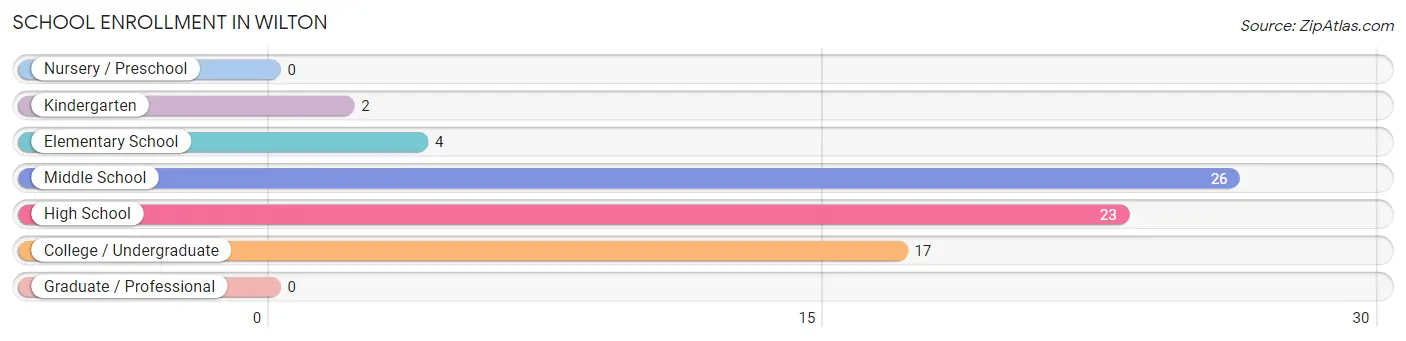
School Enrollment in Wilton
The most common levels of schooling among the 72 students in Wilton are middle school (26 | 36.1%), high school (23 | 31.9%), and college / undergraduate (17 | 23.6%).
| School Level | # Students | % Students |
| Nursery / Preschool | 0 | 0.0% |
| Kindergarten | 2 | 2.8% |
| Elementary School | 4 | 5.6% |
| Middle School | 26 | 36.1% |
| High School | 23 | 31.9% |
| College / Undergraduate | 17 | 23.6% |
| Graduate / Professional | 0 | 0.0% |
| Total | 72 | 100.0% |
School Enrollment by Age by Funding Source in Wilton
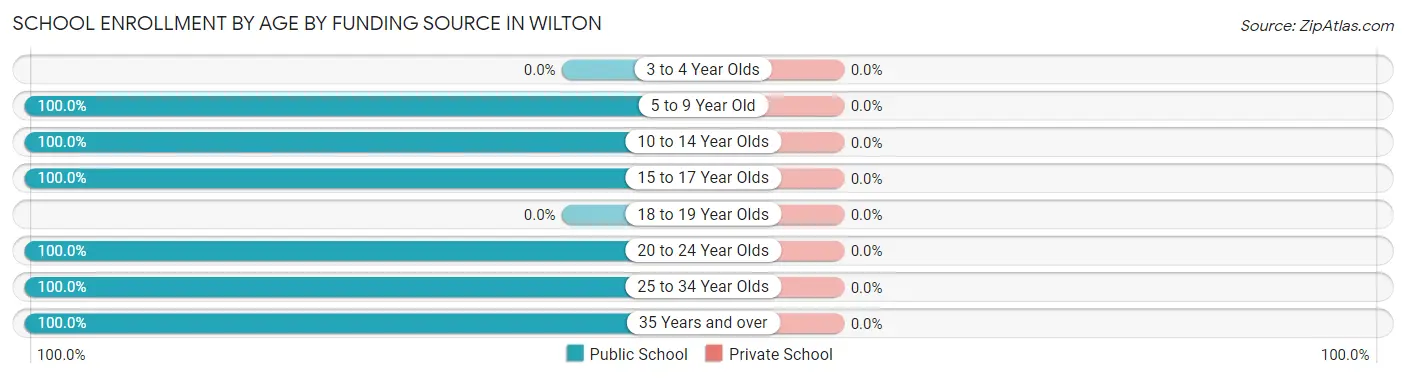
| Age Bracket | Public School | Private School |
| 3 to 4 Year Olds | 0 (0.0%) | 0 (0.0%) |
| 5 to 9 Year Old | 6 (100.0%) | 0 (0.0%) |
| 10 to 14 Year Olds | 26 (100.0%) | 0 (0.0%) |
| 15 to 17 Year Olds | 23 (100.0%) | 0 (0.0%) |
| 18 to 19 Year Olds | 0 (0.0%) | 0 (0.0%) |
| 20 to 24 Year Olds | 14 (100.0%) | 0 (0.0%) |
| 25 to 34 Year Olds | 1 (100.0%) | 0 (0.0%) |
| 35 Years and over | 2 (100.0%) | 0 (0.0%) |
| Total | 72 (100.0%) | 0 (0.0%) |
Educational Attainment by Field of Study in Wilton
Visual & performing arts (10 | 43.5%), education (3 | 13.0%), bio, nature & agricultural (2 | 8.7%), science & technology (2 | 8.7%), and liberal arts & history (2 | 8.7%) are the most common fields of study among 23 individuals in Wilton who have obtained a bachelor's degree or higher.
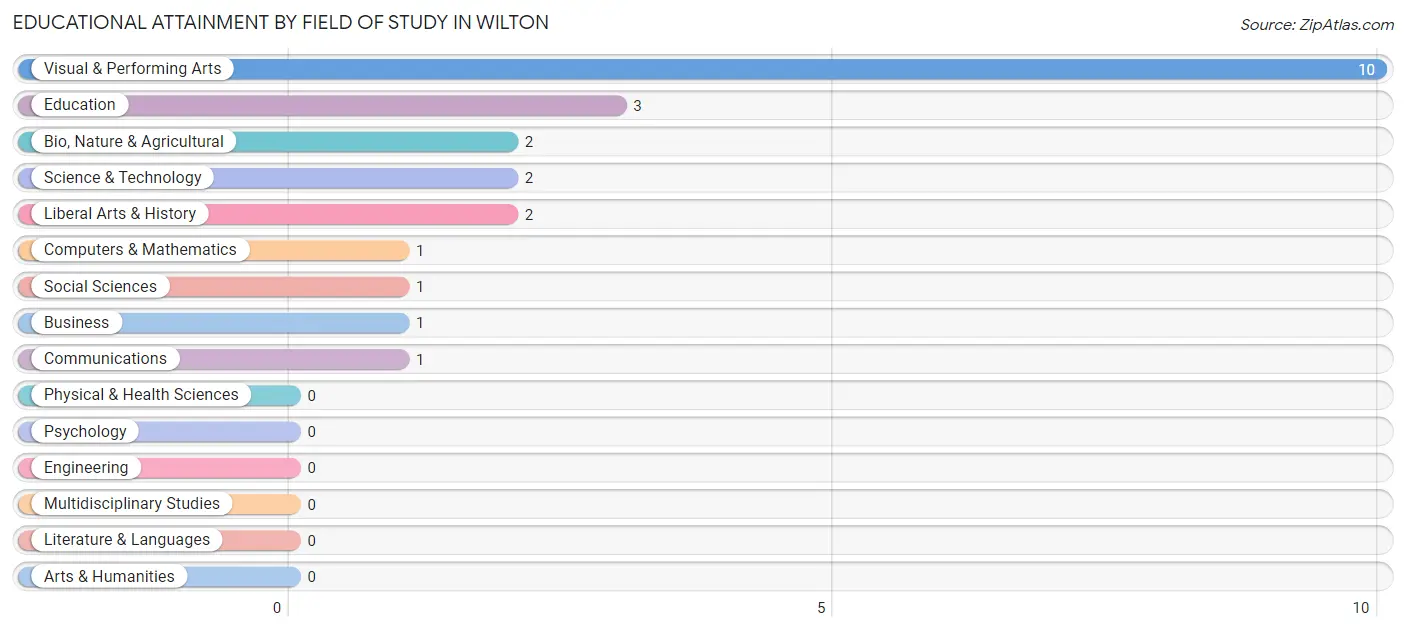
| Field of Study | # Graduates | % Graduates |
| Computers & Mathematics | 1 | 4.3% |
| Bio, Nature & Agricultural | 2 | 8.7% |
| Physical & Health Sciences | 0 | 0.0% |
| Psychology | 0 | 0.0% |
| Social Sciences | 1 | 4.3% |
| Engineering | 0 | 0.0% |
| Multidisciplinary Studies | 0 | 0.0% |
| Science & Technology | 2 | 8.7% |
| Business | 1 | 4.3% |
| Education | 3 | 13.0% |
| Literature & Languages | 0 | 0.0% |
| Liberal Arts & History | 2 | 8.7% |
| Visual & Performing Arts | 10 | 43.5% |
| Communications | 1 | 4.3% |
| Arts & Humanities | 0 | 0.0% |
| Total | 23 | 100.0% |
Transportation & Commute in Wilton
Vehicle Availability by Sex in Wilton
The most prevalent vehicle ownership categories in Wilton are males with 1 vehicle (22, accounting for 47.8%) and females with 1 vehicle (3, making up 68.8%).
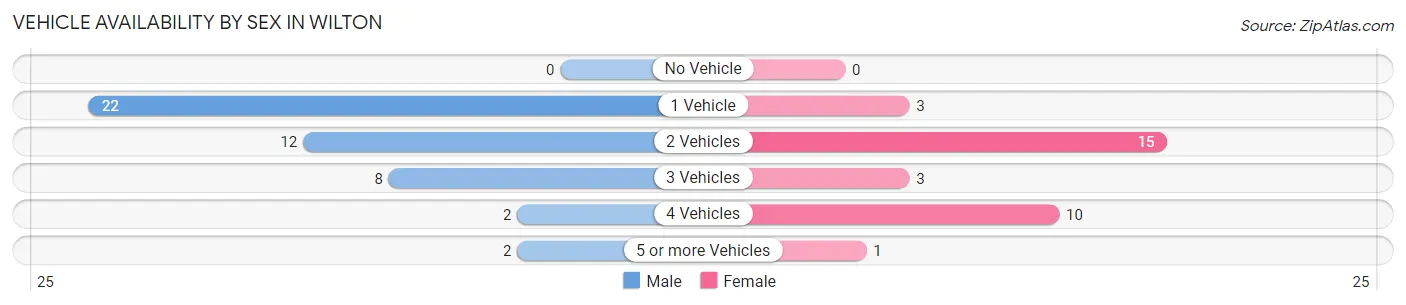
| Vehicles Available | Male | Female |
| No Vehicle | 0 (0.0%) | 0 (0.0%) |
| 1 Vehicle | 22 (47.8%) | 3 (9.4%) |
| 2 Vehicles | 12 (26.1%) | 15 (46.9%) |
| 3 Vehicles | 8 (17.4%) | 3 (9.4%) |
| 4 Vehicles | 2 (4.3%) | 10 (31.2%) |
| 5 or more Vehicles | 2 (4.3%) | 1 (3.1%) |
| Total | 46 (100.0%) | 32 (100.0%) |
Commute Time in Wilton
The most frequently occuring commute durations in Wilton are 10 to 14 minutes (34 commuters, 47.2%), 15 to 19 minutes (18 commuters, 25.0%), and 5 to 9 minutes (9 commuters, 12.5%).
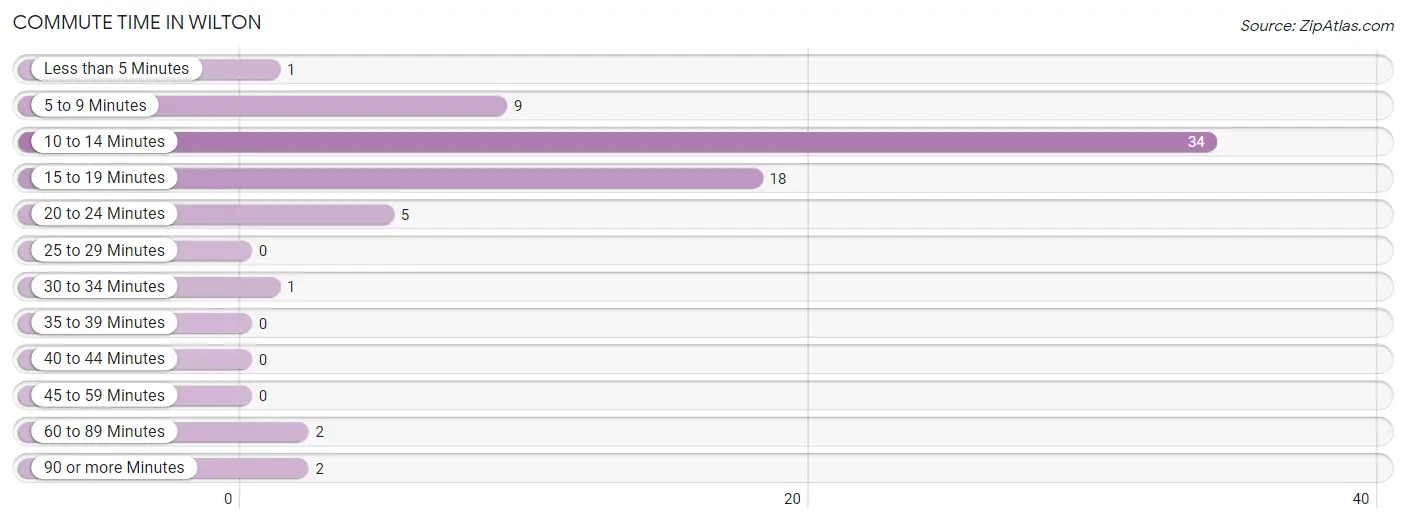
| Commute Time | # Commuters | % Commuters |
| Less than 5 Minutes | 1 | 1.4% |
| 5 to 9 Minutes | 9 | 12.5% |
| 10 to 14 Minutes | 34 | 47.2% |
| 15 to 19 Minutes | 18 | 25.0% |
| 20 to 24 Minutes | 5 | 6.9% |
| 25 to 29 Minutes | 0 | 0.0% |
| 30 to 34 Minutes | 1 | 1.4% |
| 35 to 39 Minutes | 0 | 0.0% |
| 40 to 44 Minutes | 0 | 0.0% |
| 45 to 59 Minutes | 0 | 0.0% |
| 60 to 89 Minutes | 2 | 2.8% |
| 90 or more Minutes | 2 | 2.8% |
Commute Time by Sex in Wilton
The most common commute times in Wilton are 10 to 14 minutes (26 commuters, 56.5%) for males and 15 to 19 minutes (12 commuters, 46.2%) for females.
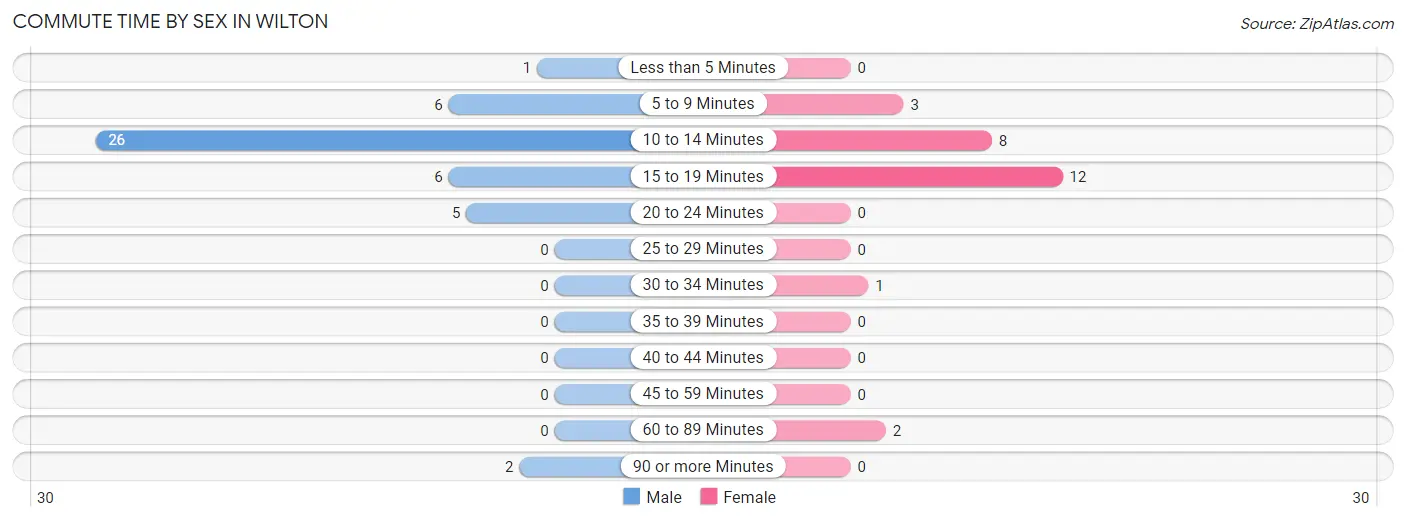
| Commute Time | Male | Female |
| Less than 5 Minutes | 1 (2.2%) | 0 (0.0%) |
| 5 to 9 Minutes | 6 (13.0%) | 3 (11.5%) |
| 10 to 14 Minutes | 26 (56.5%) | 8 (30.8%) |
| 15 to 19 Minutes | 6 (13.0%) | 12 (46.2%) |
| 20 to 24 Minutes | 5 (10.9%) | 0 (0.0%) |
| 25 to 29 Minutes | 0 (0.0%) | 0 (0.0%) |
| 30 to 34 Minutes | 0 (0.0%) | 1 (3.8%) |
| 35 to 39 Minutes | 0 (0.0%) | 0 (0.0%) |
| 40 to 44 Minutes | 0 (0.0%) | 0 (0.0%) |
| 45 to 59 Minutes | 0 (0.0%) | 0 (0.0%) |
| 60 to 89 Minutes | 0 (0.0%) | 2 (7.7%) |
| 90 or more Minutes | 2 (4.3%) | 0 (0.0%) |
Time of Departure to Work by Sex in Wilton
The most frequent times of departure to work in Wilton are 8:00 AM to 8:29 AM (22, 47.8%) for males and 7:30 AM to 7:59 AM (7, 26.9%) for females.
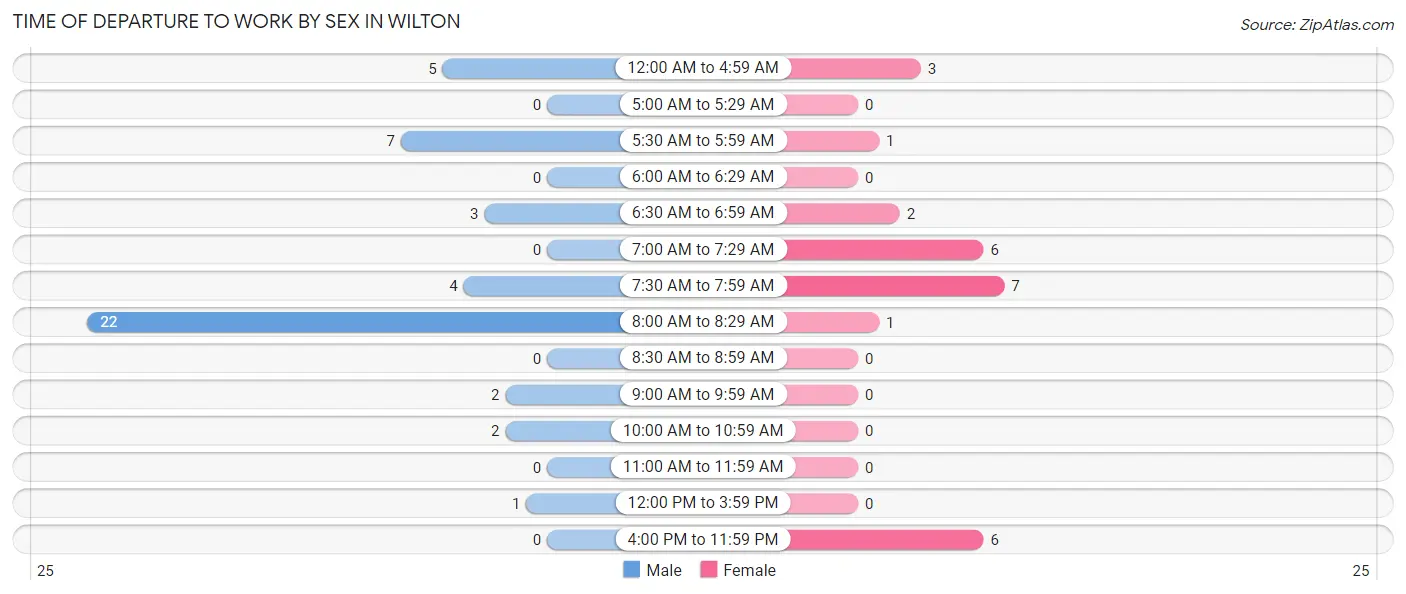
| Time of Departure | Male | Female |
| 12:00 AM to 4:59 AM | 5 (10.9%) | 3 (11.5%) |
| 5:00 AM to 5:29 AM | 0 (0.0%) | 0 (0.0%) |
| 5:30 AM to 5:59 AM | 7 (15.2%) | 1 (3.8%) |
| 6:00 AM to 6:29 AM | 0 (0.0%) | 0 (0.0%) |
| 6:30 AM to 6:59 AM | 3 (6.5%) | 2 (7.7%) |
| 7:00 AM to 7:29 AM | 0 (0.0%) | 6 (23.1%) |
| 7:30 AM to 7:59 AM | 4 (8.7%) | 7 (26.9%) |
| 8:00 AM to 8:29 AM | 22 (47.8%) | 1 (3.8%) |
| 8:30 AM to 8:59 AM | 0 (0.0%) | 0 (0.0%) |
| 9:00 AM to 9:59 AM | 2 (4.3%) | 0 (0.0%) |
| 10:00 AM to 10:59 AM | 2 (4.3%) | 0 (0.0%) |
| 11:00 AM to 11:59 AM | 0 (0.0%) | 0 (0.0%) |
| 12:00 PM to 3:59 PM | 1 (2.2%) | 0 (0.0%) |
| 4:00 PM to 11:59 PM | 0 (0.0%) | 6 (23.1%) |
| Total | 46 (100.0%) | 26 (100.0%) |
Housing Occupancy in Wilton
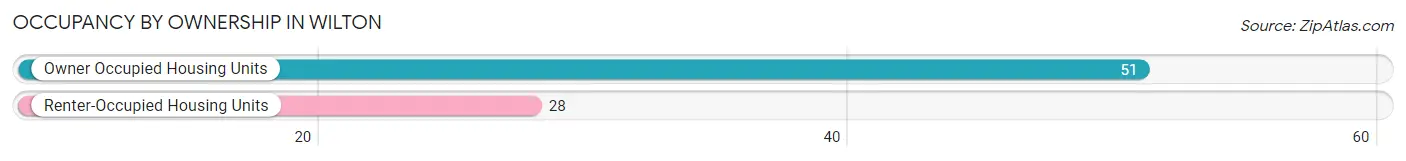
Occupancy by Ownership in Wilton
Of the total 79 dwellings in Wilton, owner-occupied units account for 51 (64.6%), while renter-occupied units make up 28 (35.4%).
| Occupancy | # Housing Units | % Housing Units |
| Owner Occupied Housing Units | 51 | 64.6% |
| Renter-Occupied Housing Units | 28 | 35.4% |
| Total Occupied Housing Units | 79 | 100.0% |
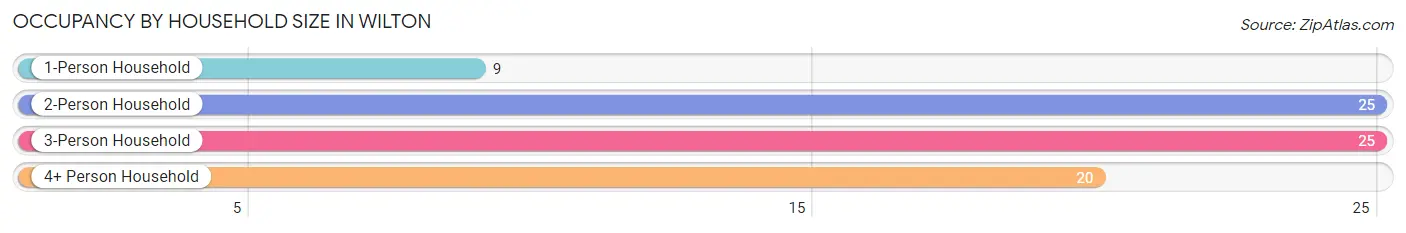
Occupancy by Household Size in Wilton
| Household Size | # Housing Units | % Housing Units |
| 1-Person Household | 9 | 11.4% |
| 2-Person Household | 25 | 31.7% |
| 3-Person Household | 25 | 31.7% |
| 4+ Person Household | 20 | 25.3% |
| Total Housing Units | 79 | 100.0% |
Occupancy by Ownership by Household Size in Wilton
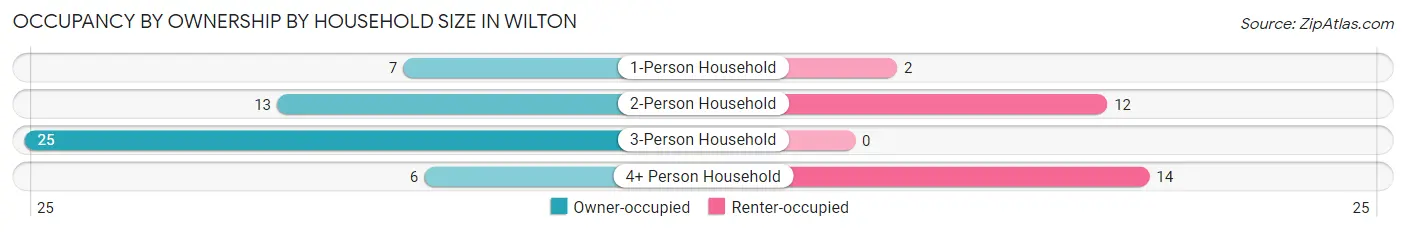
| Household Size | Owner-occupied | Renter-occupied |
| 1-Person Household | 7 (77.8%) | 2 (22.2%) |
| 2-Person Household | 13 (52.0%) | 12 (48.0%) |
| 3-Person Household | 25 (100.0%) | 0 (0.0%) |
| 4+ Person Household | 6 (30.0%) | 14 (70.0%) |
| Total Housing Units | 51 (64.6%) | 28 (35.4%) |
Occupancy by Educational Attainment in Wilton
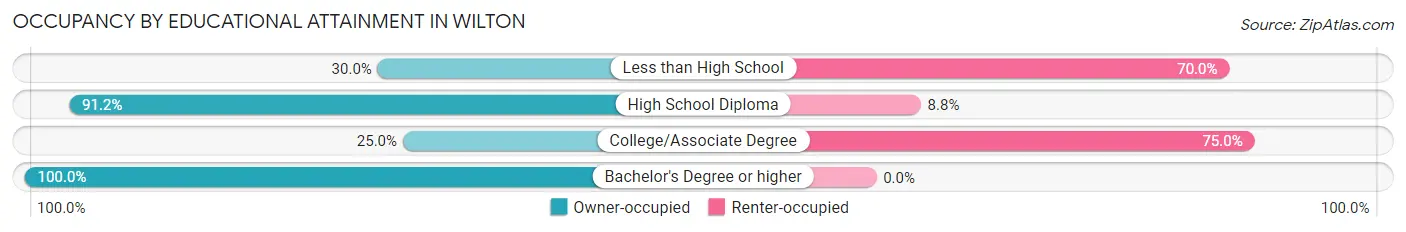
| Household Size | Owner-occupied | Renter-occupied |
| Less than High School | 3 (30.0%) | 7 (70.0%) |
| High School Diploma | 31 (91.2%) | 3 (8.8%) |
| College/Associate Degree | 6 (25.0%) | 18 (75.0%) |
| Bachelor's Degree or higher | 11 (100.0%) | 0 (0.0%) |
Occupancy by Age of Householder in Wilton
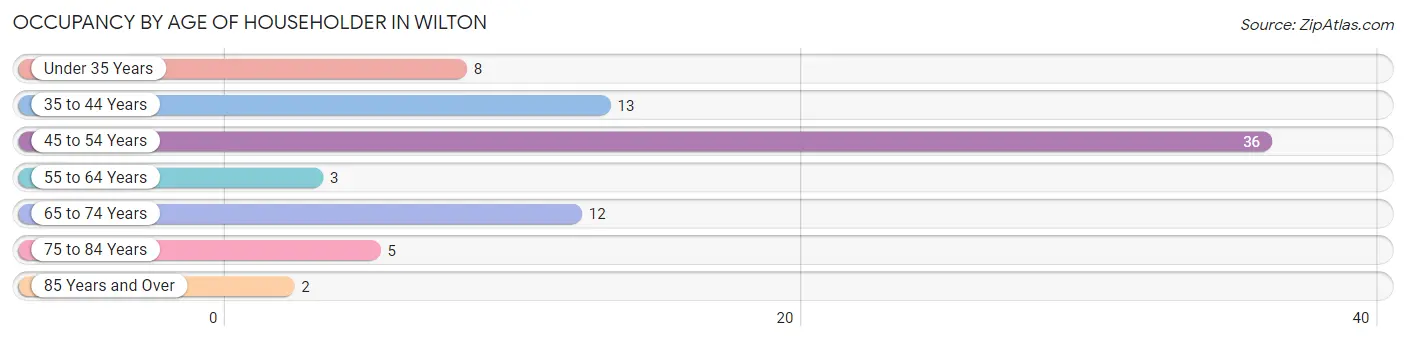
| Age Bracket | # Households | % Households |
| Under 35 Years | 8 | 10.1% |
| 35 to 44 Years | 13 | 16.5% |
| 45 to 54 Years | 36 | 45.6% |
| 55 to 64 Years | 3 | 3.8% |
| 65 to 74 Years | 12 | 15.2% |
| 75 to 84 Years | 5 | 6.3% |
| 85 Years and Over | 2 | 2.5% |
| Total | 79 | 100.0% |
Housing Finances in Wilton
Median Income by Occupancy in Wilton
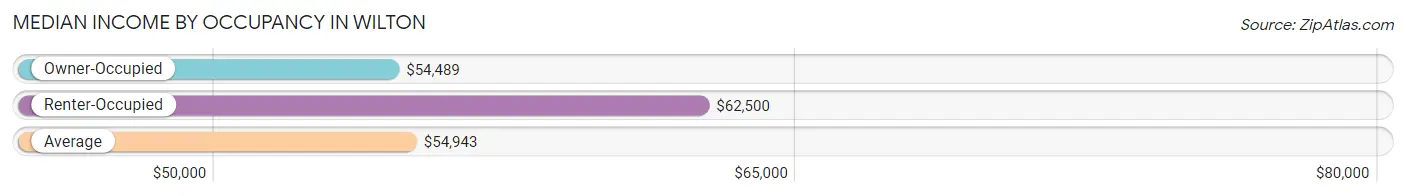
| Occupancy Type | # Households | Median Income |
| Owner-Occupied | 51 (64.6%) | $54,489 |
| Renter-Occupied | 28 (35.4%) | $62,500 |
| Average | 79 (100.0%) | $54,943 |
Occupancy by Householder Income Bracket in Wilton
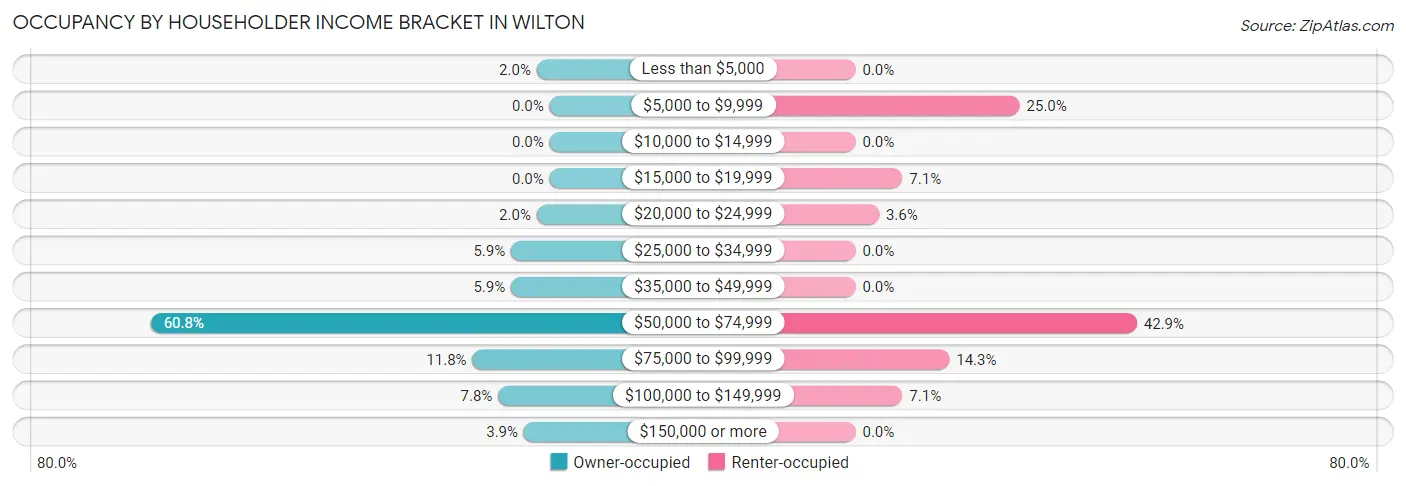
| Income Bracket | Owner-occupied | Renter-occupied |
| Less than $5,000 | 1 (2.0%) | 0 (0.0%) |
| $5,000 to $9,999 | 0 (0.0%) | 7 (25.0%) |
| $10,000 to $14,999 | 0 (0.0%) | 0 (0.0%) |
| $15,000 to $19,999 | 0 (0.0%) | 2 (7.1%) |
| $20,000 to $24,999 | 1 (2.0%) | 1 (3.6%) |
| $25,000 to $34,999 | 3 (5.9%) | 0 (0.0%) |
| $35,000 to $49,999 | 3 (5.9%) | 0 (0.0%) |
| $50,000 to $74,999 | 31 (60.8%) | 12 (42.9%) |
| $75,000 to $99,999 | 6 (11.8%) | 4 (14.3%) |
| $100,000 to $149,999 | 4 (7.8%) | 2 (7.1%) |
| $150,000 or more | 2 (3.9%) | 0 (0.0%) |
| Total | 51 (100.0%) | 28 (100.0%) |
Monthly Housing Cost Tiers in Wilton
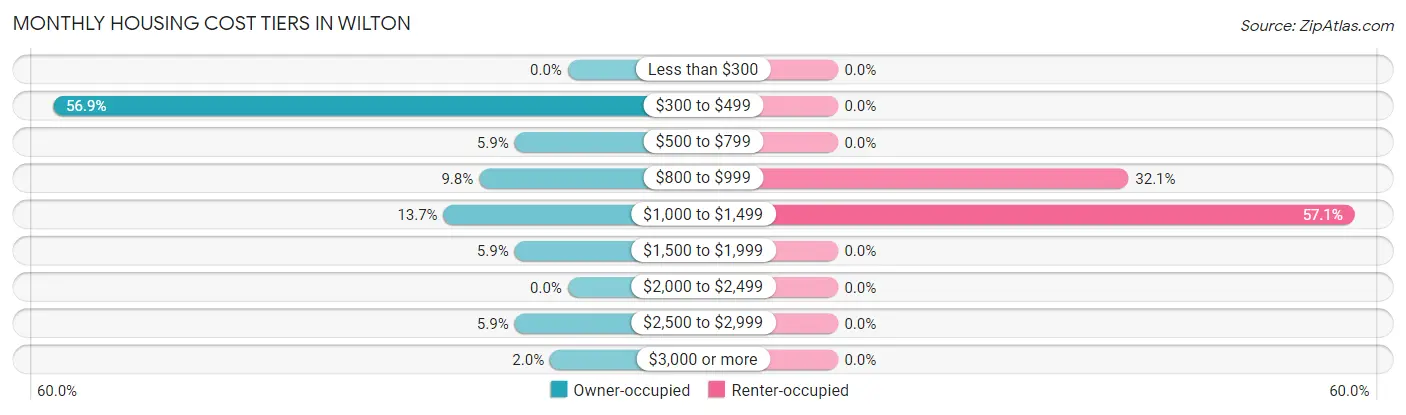
| Monthly Cost | Owner-occupied | Renter-occupied |
| Less than $300 | 0 (0.0%) | 0 (0.0%) |
| $300 to $499 | 29 (56.9%) | 0 (0.0%) |
| $500 to $799 | 3 (5.9%) | 0 (0.0%) |
| $800 to $999 | 5 (9.8%) | 9 (32.1%) |
| $1,000 to $1,499 | 7 (13.7%) | 16 (57.1%) |
| $1,500 to $1,999 | 3 (5.9%) | 0 (0.0%) |
| $2,000 to $2,499 | 0 (0.0%) | 0 (0.0%) |
| $2,500 to $2,999 | 3 (5.9%) | 0 (0.0%) |
| $3,000 or more | 1 (2.0%) | 0 (0.0%) |
| Total | 51 (100.0%) | 28 (100.0%) |
Physical Housing Characteristics in Wilton
Housing Structures in Wilton
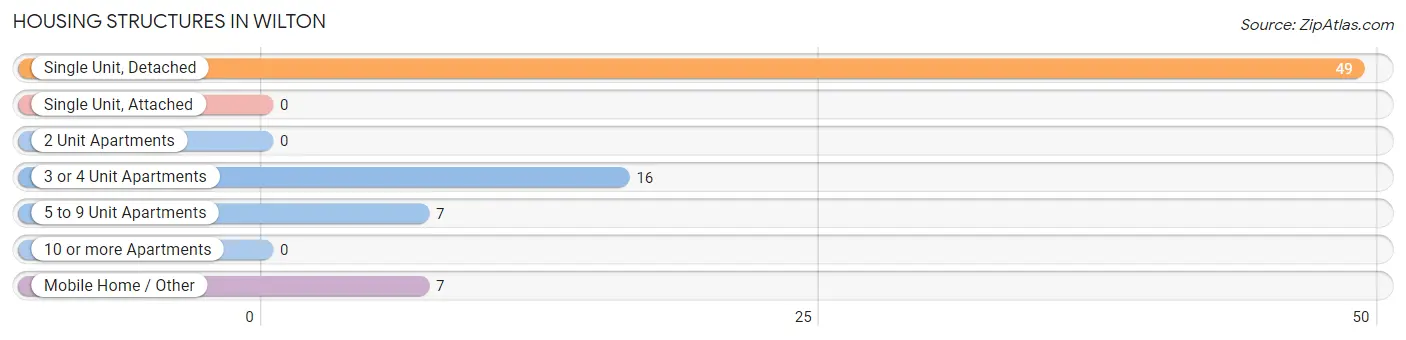
| Structure Type | # Housing Units | % Housing Units |
| Single Unit, Detached | 49 | 62.0% |
| Single Unit, Attached | 0 | 0.0% |
| 2 Unit Apartments | 0 | 0.0% |
| 3 or 4 Unit Apartments | 16 | 20.3% |
| 5 to 9 Unit Apartments | 7 | 8.9% |
| 10 or more Apartments | 0 | 0.0% |
| Mobile Home / Other | 7 | 8.9% |
| Total | 79 | 100.0% |
Housing Structures by Occupancy in Wilton
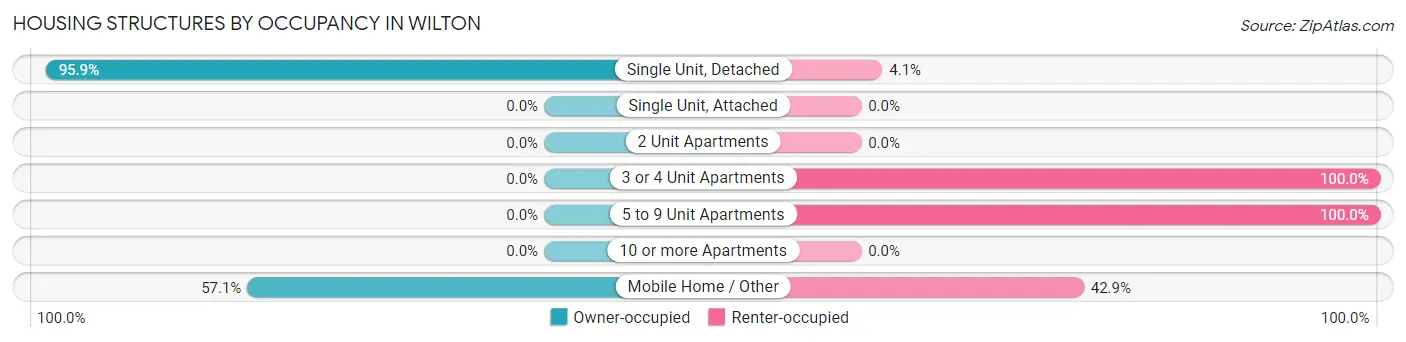
| Structure Type | Owner-occupied | Renter-occupied |
| Single Unit, Detached | 47 (95.9%) | 2 (4.1%) |
| Single Unit, Attached | 0 (0.0%) | 0 (0.0%) |
| 2 Unit Apartments | 0 (0.0%) | 0 (0.0%) |
| 3 or 4 Unit Apartments | 0 (0.0%) | 16 (100.0%) |
| 5 to 9 Unit Apartments | 0 (0.0%) | 7 (100.0%) |
| 10 or more Apartments | 0 (0.0%) | 0 (0.0%) |
| Mobile Home / Other | 4 (57.1%) | 3 (42.9%) |
| Total | 51 (64.6%) | 28 (35.4%) |
Housing Structures by Number of Rooms in Wilton
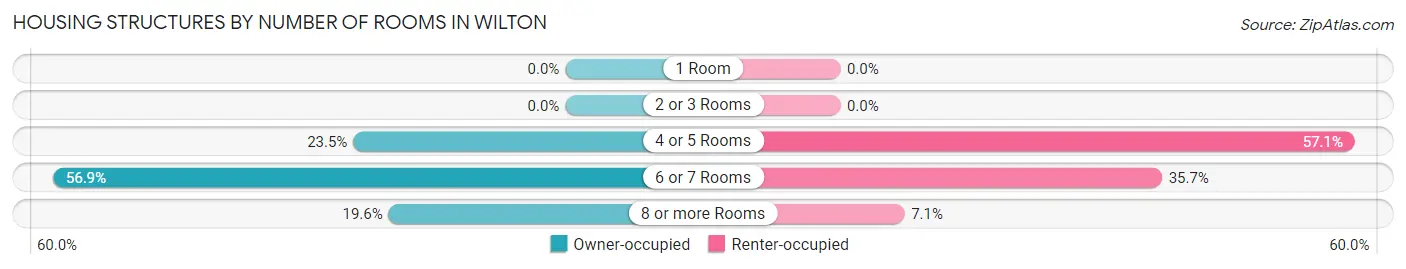
| Number of Rooms | Owner-occupied | Renter-occupied |
| 1 Room | 0 (0.0%) | 0 (0.0%) |
| 2 or 3 Rooms | 0 (0.0%) | 0 (0.0%) |
| 4 or 5 Rooms | 12 (23.5%) | 16 (57.1%) |
| 6 or 7 Rooms | 29 (56.9%) | 10 (35.7%) |
| 8 or more Rooms | 10 (19.6%) | 2 (7.1%) |
| Total | 51 (100.0%) | 28 (100.0%) |
Housing Structure by Heating Type in Wilton
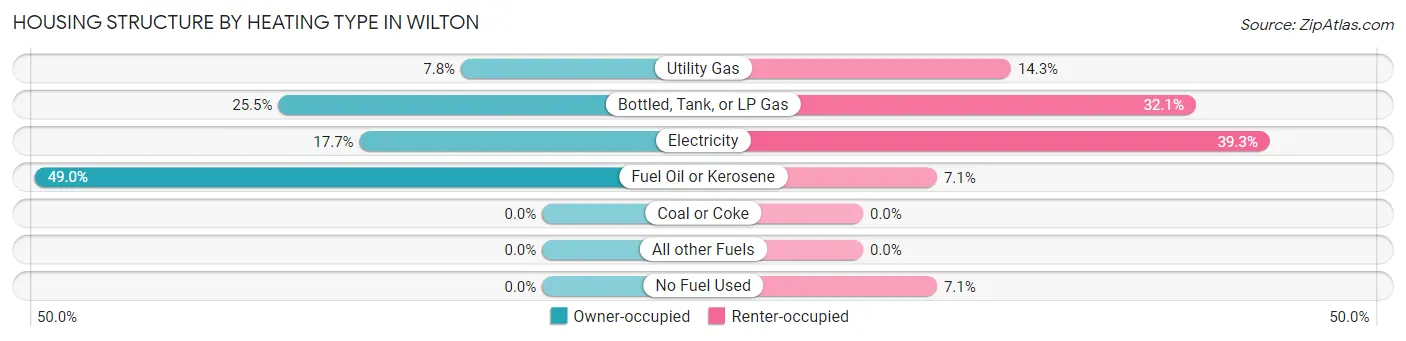
| Heating Type | Owner-occupied | Renter-occupied |
| Utility Gas | 4 (7.8%) | 4 (14.3%) |
| Bottled, Tank, or LP Gas | 13 (25.5%) | 9 (32.1%) |
| Electricity | 9 (17.6%) | 11 (39.3%) |
| Fuel Oil or Kerosene | 25 (49.0%) | 2 (7.1%) |
| Coal or Coke | 0 (0.0%) | 0 (0.0%) |
| All other Fuels | 0 (0.0%) | 0 (0.0%) |
| No Fuel Used | 0 (0.0%) | 2 (7.1%) |
| Total | 51 (100.0%) | 28 (100.0%) |
Household Vehicle Usage in Wilton
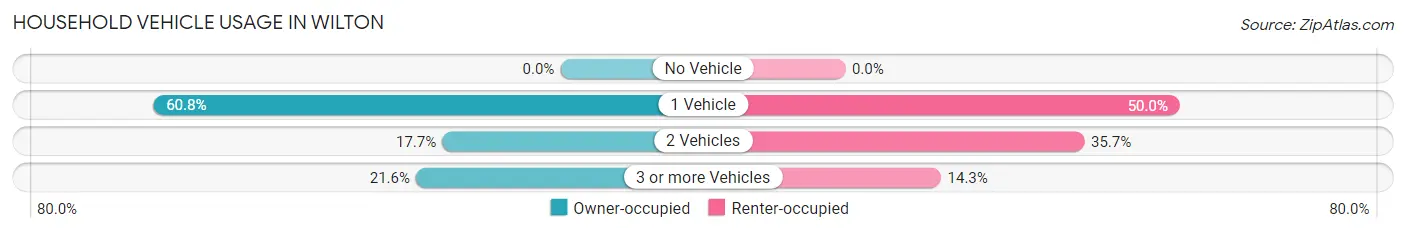
| Vehicles per Household | Owner-occupied | Renter-occupied |
| No Vehicle | 0 (0.0%) | 0 (0.0%) |
| 1 Vehicle | 31 (60.8%) | 14 (50.0%) |
| 2 Vehicles | 9 (17.6%) | 10 (35.7%) |
| 3 or more Vehicles | 11 (21.6%) | 4 (14.3%) |
| Total | 51 (100.0%) | 28 (100.0%) |
Real Estate & Mortgages in Wilton
Real Estate and Mortgage Overview in Wilton
| Characteristic | Without Mortgage | With Mortgage |
| Housing Units | 31 | 20 |
| Median Property Value | $9,999 | $171,400 |
| Median Household Income | $53,920 | $0 |
| Monthly Housing Costs | $335 | $1 |
| Real Estate Taxes | $199 | $0 |
Property Value by Mortgage Status in Wilton
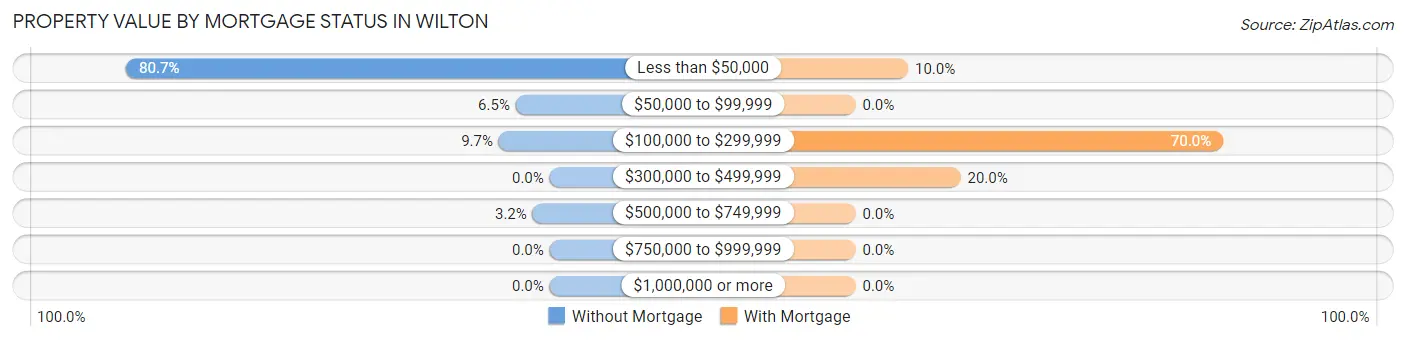
| Property Value | Without Mortgage | With Mortgage |
| Less than $50,000 | 25 (80.6%) | 2 (10.0%) |
| $50,000 to $99,999 | 2 (6.5%) | 0 (0.0%) |
| $100,000 to $299,999 | 3 (9.7%) | 14 (70.0%) |
| $300,000 to $499,999 | 0 (0.0%) | 4 (20.0%) |
| $500,000 to $749,999 | 1 (3.2%) | 0 (0.0%) |
| $750,000 to $999,999 | 0 (0.0%) | 0 (0.0%) |
| $1,000,000 or more | 0 (0.0%) | 0 (0.0%) |
| Total | 31 (100.0%) | 20 (100.0%) |
Household Income by Mortgage Status in Wilton
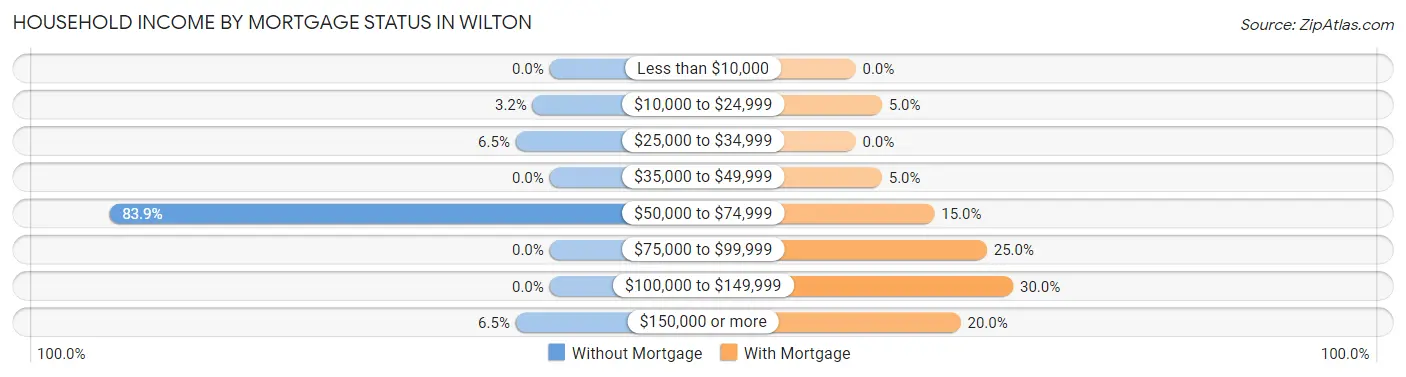
| Household Income | Without Mortgage | With Mortgage |
| Less than $10,000 | 0 (0.0%) | 0 (0.0%) |
| $10,000 to $24,999 | 1 (3.2%) | 1 (5.0%) |
| $25,000 to $34,999 | 2 (6.5%) | 0 (0.0%) |
| $35,000 to $49,999 | 0 (0.0%) | 1 (5.0%) |
| $50,000 to $74,999 | 26 (83.9%) | 3 (15.0%) |
| $75,000 to $99,999 | 0 (0.0%) | 5 (25.0%) |
| $100,000 to $149,999 | 0 (0.0%) | 6 (30.0%) |
| $150,000 or more | 2 (6.5%) | 4 (20.0%) |
| Total | 31 (100.0%) | 20 (100.0%) |
Property Value to Household Income Ratio in Wilton
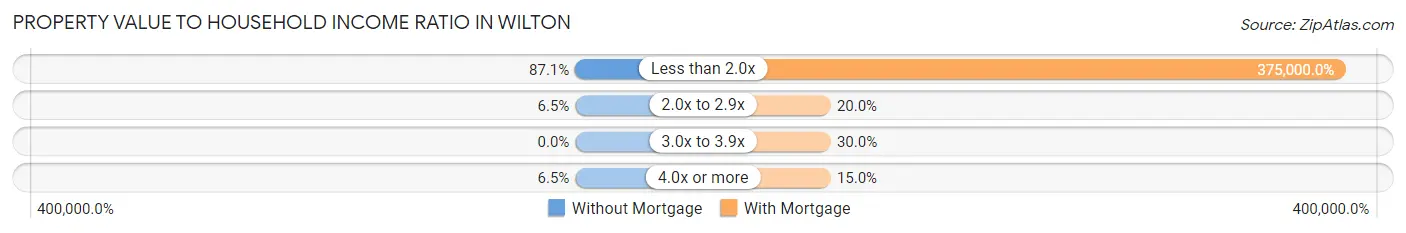
| Value-to-Income Ratio | Without Mortgage | With Mortgage |
| Less than 2.0x | 27 (87.1%) | 75,000 (375,000.0%) |
| 2.0x to 2.9x | 2 (6.5%) | 4 (20.0%) |
| 3.0x to 3.9x | 0 (0.0%) | 6 (30.0%) |
| 4.0x or more | 2 (6.5%) | 3 (15.0%) |
| Total | 31 (100.0%) | 20 (100.0%) |
Real Estate Taxes by Mortgage Status in Wilton
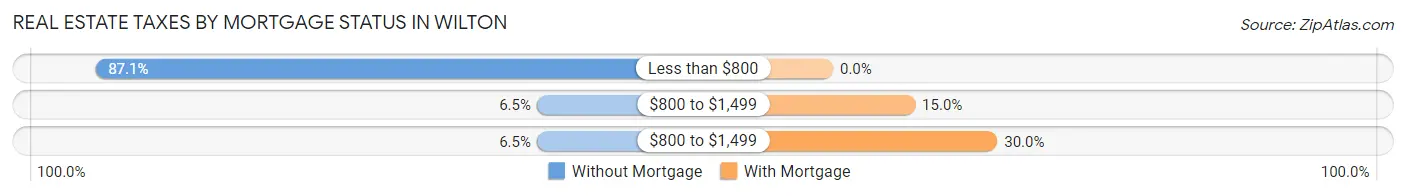
| Property Taxes | Without Mortgage | With Mortgage |
| Less than $800 | 27 (87.1%) | 0 (0.0%) |
| $800 to $1,499 | 2 (6.5%) | 3 (15.0%) |
| $800 to $1,499 | 2 (6.5%) | 6 (30.0%) |
| Total | 31 (100.0%) | 20 (100.0%) |
Health & Disability in Wilton
Health Insurance Coverage by Age in Wilton
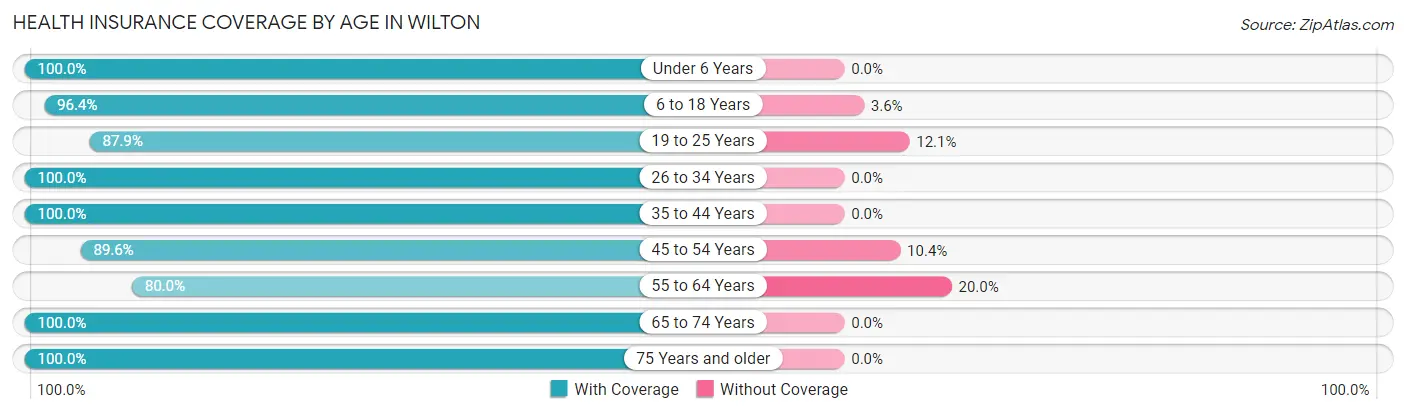
| Age Bracket | With Coverage | Without Coverage |
| Under 6 Years | 21 (100.0%) | 0 (0.0%) |
| 6 to 18 Years | 53 (96.4%) | 2 (3.6%) |
| 19 to 25 Years | 29 (87.9%) | 4 (12.1%) |
| 26 to 34 Years | 5 (100.0%) | 0 (0.0%) |
| 35 to 44 Years | 29 (100.0%) | 0 (0.0%) |
| 45 to 54 Years | 43 (89.6%) | 5 (10.4%) |
| 55 to 64 Years | 8 (80.0%) | 2 (20.0%) |
| 65 to 74 Years | 27 (100.0%) | 0 (0.0%) |
| 75 Years and older | 14 (100.0%) | 0 (0.0%) |
| Total | 229 (94.6%) | 13 (5.4%) |
Health Insurance Coverage by Citizenship Status in Wilton
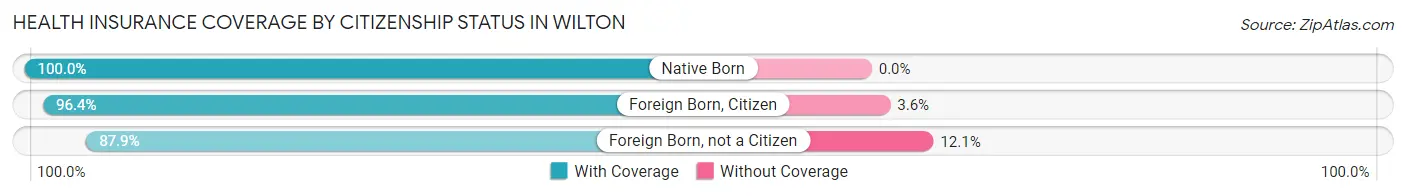
| Citizenship Status | With Coverage | Without Coverage |
| Native Born | 21 (100.0%) | 0 (0.0%) |
| Foreign Born, Citizen | 53 (96.4%) | 2 (3.6%) |
| Foreign Born, not a Citizen | 29 (87.9%) | 4 (12.1%) |
Health Insurance Coverage by Household Income in Wilton
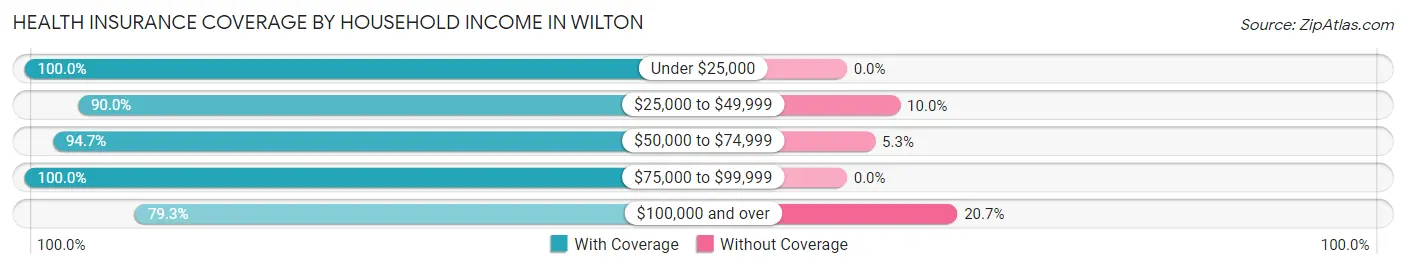
| Household Income | With Coverage | Without Coverage |
| Under $25,000 | 47 (100.0%) | 0 (0.0%) |
| $25,000 to $49,999 | 9 (90.0%) | 1 (10.0%) |
| $50,000 to $74,999 | 107 (94.7%) | 6 (5.3%) |
| $75,000 to $99,999 | 43 (100.0%) | 0 (0.0%) |
| $100,000 and over | 23 (79.3%) | 6 (20.7%) |
Public vs Private Health Insurance Coverage by Age in Wilton
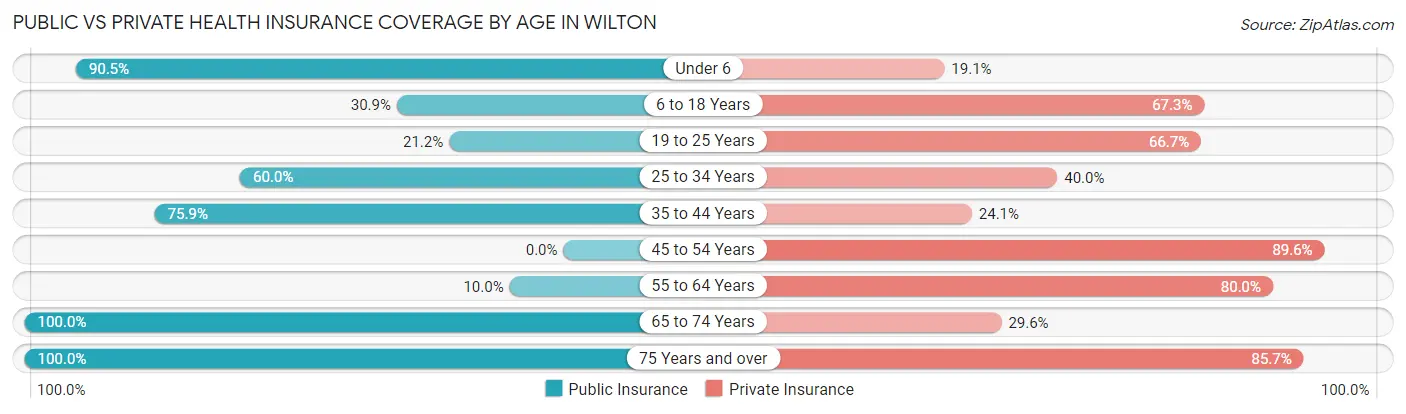
| Age Bracket | Public Insurance | Private Insurance |
| Under 6 | 19 (90.5%) | 4 (19.1%) |
| 6 to 18 Years | 17 (30.9%) | 37 (67.3%) |
| 19 to 25 Years | 7 (21.2%) | 22 (66.7%) |
| 25 to 34 Years | 3 (60.0%) | 2 (40.0%) |
| 35 to 44 Years | 22 (75.9%) | 7 (24.1%) |
| 45 to 54 Years | 0 (0.0%) | 43 (89.6%) |
| 55 to 64 Years | 1 (10.0%) | 8 (80.0%) |
| 65 to 74 Years | 27 (100.0%) | 8 (29.6%) |
| 75 Years and over | 14 (100.0%) | 12 (85.7%) |
| Total | 110 (45.5%) | 143 (59.1%) |
Disability Status by Sex by Age in Wilton
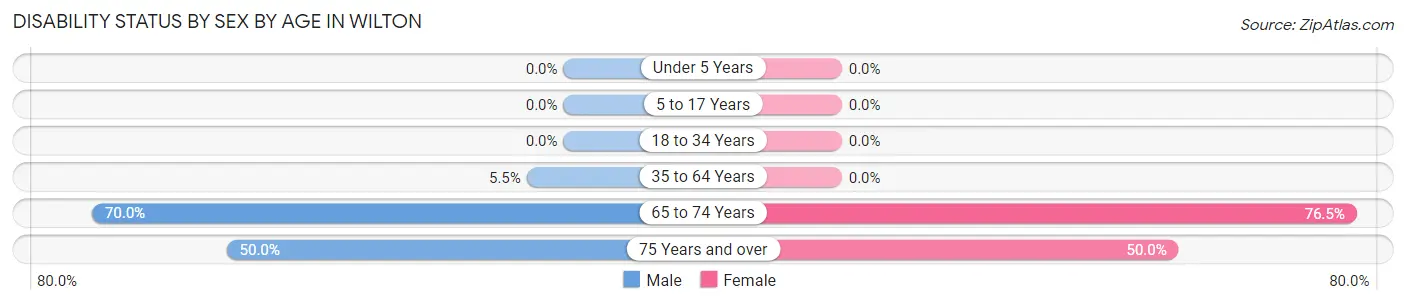
| Age Bracket | Male | Female |
| Under 5 Years | 0 (0.0%) | 0 (0.0%) |
| 5 to 17 Years | 0 (0.0%) | 0 (0.0%) |
| 18 to 34 Years | 0 (0.0%) | 0 (0.0%) |
| 35 to 64 Years | 3 (5.4%) | 0 (0.0%) |
| 65 to 74 Years | 7 (70.0%) | 13 (76.5%) |
| 75 Years and over | 3 (50.0%) | 4 (50.0%) |
Disability Class by Sex by Age in Wilton
Disability Class: Hearing Difficulty
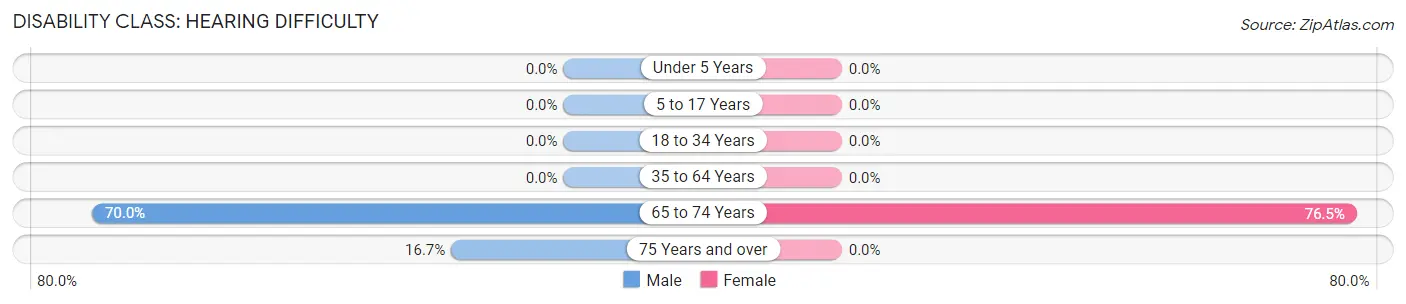
| Age Bracket | Male | Female |
| Under 5 Years | 0 (0.0%) | 0 (0.0%) |
| 5 to 17 Years | 0 (0.0%) | 0 (0.0%) |
| 18 to 34 Years | 0 (0.0%) | 0 (0.0%) |
| 35 to 64 Years | 0 (0.0%) | 0 (0.0%) |
| 65 to 74 Years | 7 (70.0%) | 13 (76.5%) |
| 75 Years and over | 1 (16.7%) | 0 (0.0%) |
Disability Class: Vision Difficulty
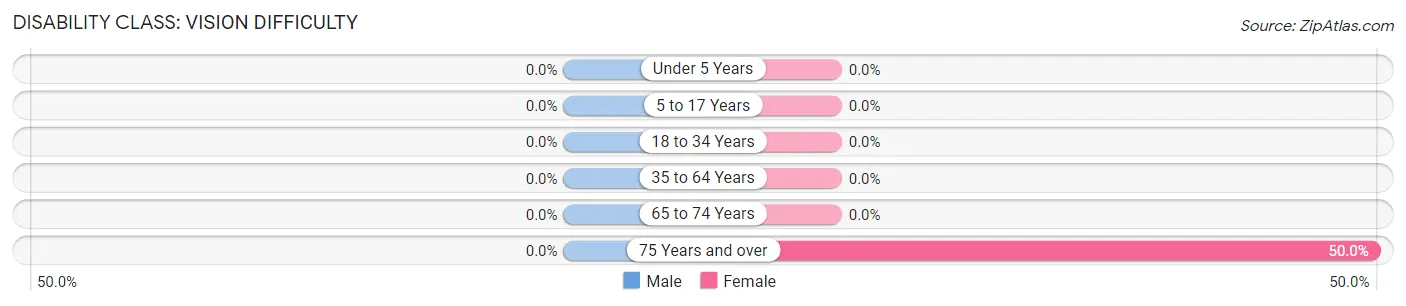
| Age Bracket | Male | Female |
| Under 5 Years | 0 (0.0%) | 0 (0.0%) |
| 5 to 17 Years | 0 (0.0%) | 0 (0.0%) |
| 18 to 34 Years | 0 (0.0%) | 0 (0.0%) |
| 35 to 64 Years | 0 (0.0%) | 0 (0.0%) |
| 65 to 74 Years | 0 (0.0%) | 0 (0.0%) |
| 75 Years and over | 0 (0.0%) | 4 (50.0%) |
Disability Class: Cognitive Difficulty

| Age Bracket | Male | Female |
| 5 to 17 Years | 0 (0.0%) | 0 (0.0%) |
| 18 to 34 Years | 0 (0.0%) | 0 (0.0%) |
| 35 to 64 Years | 3 (5.4%) | 0 (0.0%) |
| 65 to 74 Years | 2 (20.0%) | 0 (0.0%) |
| 75 Years and over | 0 (0.0%) | 0 (0.0%) |
Disability Class: Ambulatory Difficulty
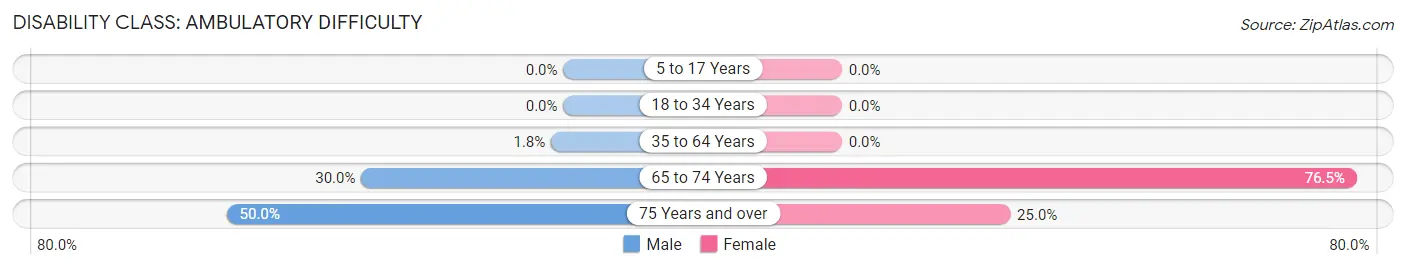
| Age Bracket | Male | Female |
| 5 to 17 Years | 0 (0.0%) | 0 (0.0%) |
| 18 to 34 Years | 0 (0.0%) | 0 (0.0%) |
| 35 to 64 Years | 1 (1.8%) | 0 (0.0%) |
| 65 to 74 Years | 3 (30.0%) | 13 (76.5%) |
| 75 Years and over | 3 (50.0%) | 2 (25.0%) |
Disability Class: Self-Care Difficulty
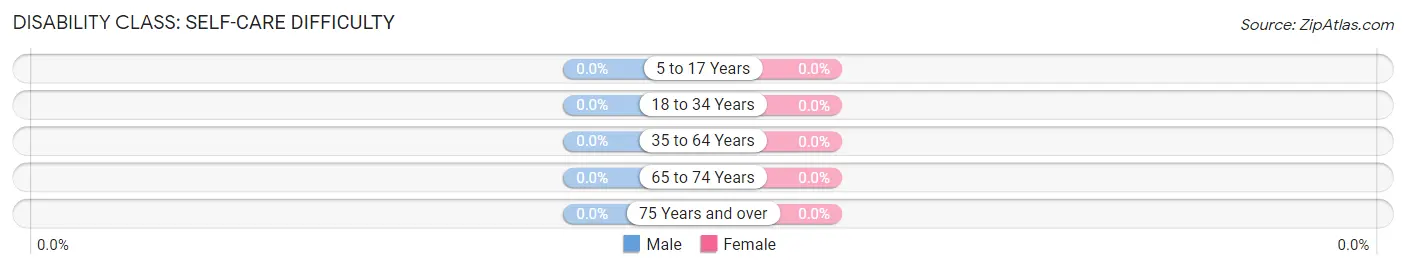
| Age Bracket | Male | Female |
| 5 to 17 Years | 0 (0.0%) | 0 (0.0%) |
| 18 to 34 Years | 0 (0.0%) | 0 (0.0%) |
| 35 to 64 Years | 0 (0.0%) | 0 (0.0%) |
| 65 to 74 Years | 0 (0.0%) | 0 (0.0%) |
| 75 Years and over | 0 (0.0%) | 0 (0.0%) |
Technology Access in Wilton
Computing Device Access in Wilton
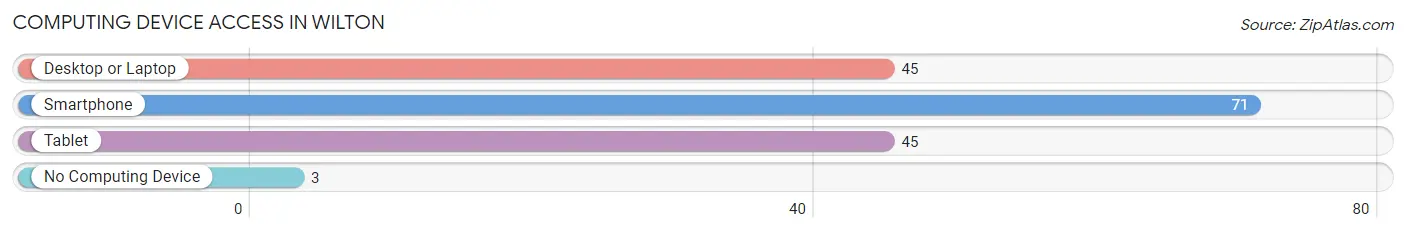
| Device Type | # Households | % Households |
| Desktop or Laptop | 45 | 57.0% |
| Smartphone | 71 | 89.9% |
| Tablet | 45 | 57.0% |
| No Computing Device | 3 | 3.8% |
| Total | 79 | 100.0% |
Internet Access in Wilton
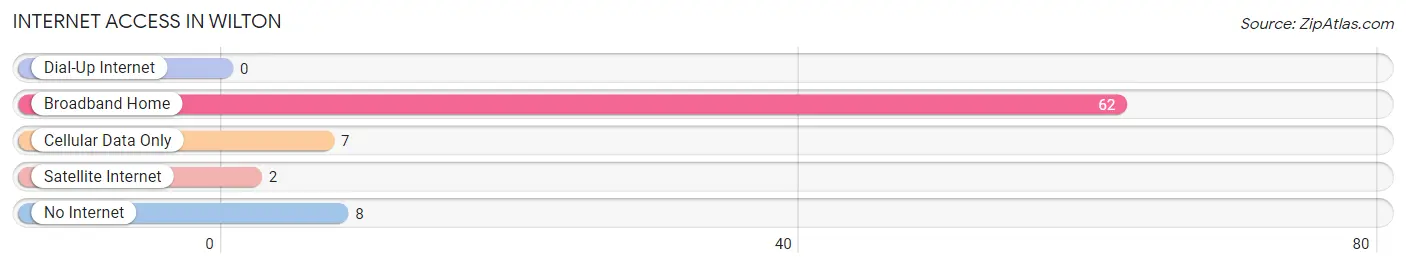
| Internet Type | # Households | % Households |
| Dial-Up Internet | 0 | 0.0% |
| Broadband Home | 62 | 78.5% |
| Cellular Data Only | 7 | 8.9% |
| Satellite Internet | 2 | 2.5% |
| No Internet | 8 | 10.1% |
| Total | 79 | 100.0% |
Wilton Summary
Wilton is a small city located in the state of Minnesota, United States. It is situated in the southwestern part of the state, in the county of Wilton. The city has a population of approximately 1,400 people, according to the 2010 census.
Geography
Wilton is located in the southwestern part of Minnesota, in the county of Wilton. It is situated at the intersection of U.S. Route 10 and Minnesota State Highway 27. The city is located on the banks of the Mississippi River, and is surrounded by rolling hills and wooded areas. The city has a total area of 1.2 square miles, all of which is land.
History
Wilton was founded in 1856 by a group of settlers from Wisconsin. The city was named after Wilton, Wisconsin, the hometown of the settlers. The city was incorporated in 1872, and the first mayor was elected in 1873.
The city grew rapidly in the late 19th century, and by the early 20th century, it had become a major center for the lumber industry. The city was also home to several other industries, including a flour mill, a creamery, and a brickyard.
In the late 20th century, the city began to decline as the lumber industry moved away. The city has since become a bedroom community for the larger cities in the region.
Economy
The economy of Wilton is largely based on agriculture and tourism. The city is home to several farms, which produce a variety of crops, including corn, soybeans, and wheat. The city is also home to several tourist attractions, including the Wilton Historical Society Museum, the Wilton Wildlife Area, and the Wilton Golf Course.
Demographics
According to the 2010 census, the population of Wilton was 1,400. The racial makeup of the city was 97.6% White, 0.4% African American, 0.3% Native American, 0.3% Asian, 0.1% Pacific Islander, 0.3% from other races, and 0.9% from two or more races. Hispanic or Latino of any race were 1.3% of the population.
The median household income in Wilton was $45,000, and the median family income was $50,000. The per capita income for the city was $20,000. About 10.3% of families and 12.3% of the population were below the poverty line, including 16.7% of those under age 18 and 8.3% of those age 65 or over.
Conclusion
Wilton is a small city located in the southwestern part of Minnesota. It has a population of approximately 1,400 people, and is largely based on agriculture and tourism. The city has a rich history, and is home to several tourist attractions. The economy of Wilton is largely based on agriculture and tourism, and the median household income is $45,000.
Common Questions
What is the Total Population of Wilton?
Total Population of Wilton is 242.
What is the Total Male Population of Wilton?
Total Male Population of Wilton is 115.
What is the Total Female Population of Wilton?
Total Female Population of Wilton is 127.
What is the Ratio of Males per 100 Females in Wilton?
There are 90.55 Males per 100 Females in Wilton.
What is the Ratio of Females per 100 Males in Wilton?
There are 110.43 Females per 100 Males in Wilton.
What is the Median Population Age in Wilton?
Median Population Age in Wilton is 37.6 Years.
What is the Average Family Size in Wilton
Average Family Size in Wilton is 3.1 People.
What is the Average Household Size in Wilton
Average Household Size in Wilton is 3.1 People.
What is Per Capita Income in Wilton?
Per Capita income in Wilton is $22,349.
What is the Median Family Income in Wilton?
Median Family Income in Wilton is $54,318.
What is the Median Household income in Wilton?
Median Household Income in Wilton is $54,943.
What is Income or Wage Gap in Wilton?
Income or Wage Gap in Wilton is 27.5%.
Women in Wilton earn 72.5 cents for every dollar earned by a man.
What is Family Income Deficit in Wilton?
Family Income Deficit in Wilton is $17,800.
Families that are below poverty line in Wilton earn $17,800 less on average than the poverty threshold level.
What is Inequality or Gini Index in Wilton?
Inequality or Gini Index in Wilton is 0.30.
How Large is the Labor Force in Wilton?
There are 107 People in the Labor Forcein in Wilton.
What is the Percentage of People in the Labor Force in Wilton?
63.7% of People are in the Labor Force in Wilton.
What is the Unemployment Rate in Wilton?
Unemployment Rate in Wilton is 27.1%.