Cities with the Highest Percentage of Salvadoran Population in Iowa
RELATED REPORTS & OPTIONS
Salvadoran
Iowa
Compare Cities
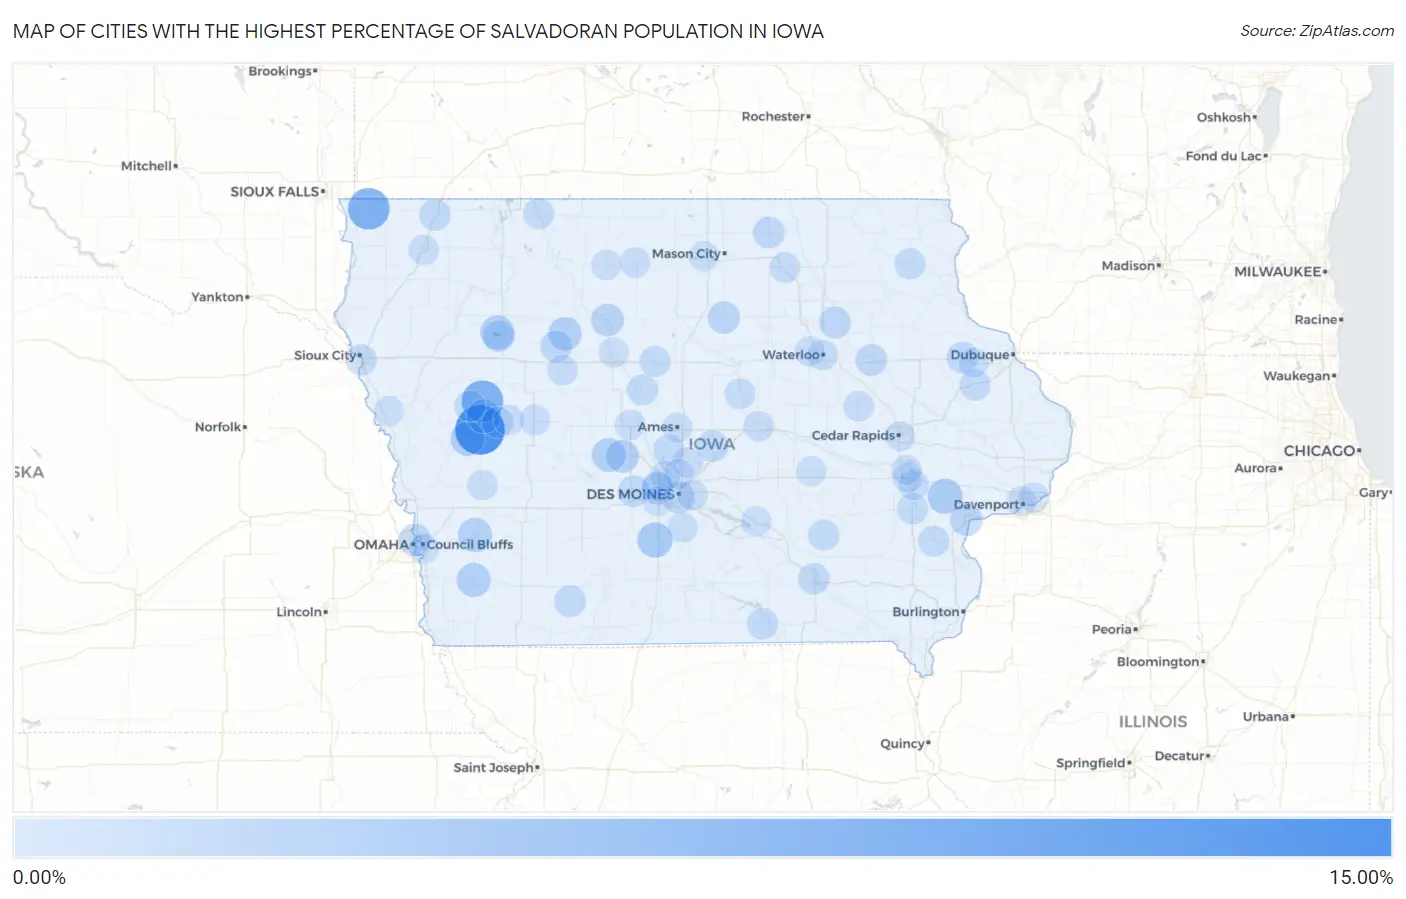
Map of Cities with the Highest Percentage of Salvadoran Population in Iowa
0.00%
15.00%
Cities with the Highest Percentage of Salvadoran Population in Iowa
| City | Salvadoran | vs State | vs National | |
| 1. | Denison | 14.25% | 0.26%(+14.0)#1 | 0.72%(+13.5)#84 |
| 2. | Kiron | 8.30% | 0.26%(+8.04)#2 | 0.72%(+7.58)#178 |
| 3. | Lester | 8.25% | 0.26%(+7.99)#3 | 0.72%(+7.53)#179 |
| 4. | St Charles | 3.54% | 0.26%(+3.28)#4 | 0.72%(+2.82)#519 |
| 5. | West Liberty | 3.43% | 0.26%(+3.16)#5 | 0.72%(+2.71)#539 |
| 6. | Storm Lake | 2.90% | 0.26%(+2.64)#6 | 0.72%(+2.18)#640 |
| 7. | Arion | 2.80% | 0.26%(+2.54)#7 | 0.72%(+2.08)#671 |
| 8. | Deloit | 2.78% | 0.26%(+2.51)#8 | 0.72%(+2.06)#678 |
| 9. | Emerson | 2.76% | 0.26%(+2.49)#9 | 0.72%(+2.03)#684 |
| 10. | Oakland | 2.74% | 0.26%(+2.48)#10 | 0.72%(+2.02)#689 |
| 11. | Dawson | 2.52% | 0.26%(+2.26)#11 | 0.72%(+1.80)#743 |
| 12. | Palmer | 2.36% | 0.26%(+2.10)#12 | 0.72%(+1.64)#797 |
| 13. | Perry | 2.07% | 0.26%(+1.81)#13 | 0.72%(+1.35)#887 |
| 14. | Humboldt | 1.89% | 0.26%(+1.62)#14 | 0.72%(+1.16)#967 |
| 15. | Carter Lake | 1.61% | 0.26%(+1.35)#15 | 0.72%(+0.892)#1,110 |
| 16. | Hampton | 1.55% | 0.26%(+1.28)#16 | 0.72%(+0.826)#1,152 |
| 17. | Muscatine | 1.45% | 0.26%(+1.19)#17 | 0.72%(+0.732)#1,216 |
| 18. | Readlyn | 1.32% | 0.26%(+1.06)#18 | 0.72%(+0.598)#1,311 |
| 19. | Des Moines | 1.25% | 0.26%(+0.986)#19 | 0.72%(+0.528)#1,369 |
| 20. | Clive | 1.18% | 0.26%(+0.915)#20 | 0.72%(+0.457)#1,421 |
| 21. | Osage | 1.17% | 0.26%(+0.906)#21 | 0.72%(+0.448)#1,432 |
| 22. | Pomeroy | 1.14% | 0.26%(+0.875)#22 | 0.72%(+0.417)#1,455 |
| 23. | Independence | 1.11% | 0.26%(+0.850)#23 | 0.72%(+0.392)#1,477 |
| 24. | Lenox | 1.08% | 0.26%(+0.812)#24 | 0.72%(+0.354)#1,522 |
| 25. | Dyersville | 1.07% | 0.26%(+0.802)#25 | 0.72%(+0.344)#1,532 |
| 26. | Lakeside | 1.05% | 0.26%(+0.787)#26 | 0.72%(+0.329)#1,546 |
| 27. | Collins | 1.04% | 0.26%(+0.771)#27 | 0.72%(+0.314)#1,569 |
| 28. | Ottumwa | 0.99% | 0.26%(+0.726)#28 | 0.72%(+0.268)#1,630 |
| 29. | Sibley | 0.88% | 0.26%(+0.620)#29 | 0.72%(+0.162)#1,757 |
| 30. | Adel | 0.87% | 0.26%(+0.607)#30 | 0.72%(+0.149)#1,770 |
| 31. | Vail | 0.78% | 0.26%(+0.518)#31 | 0.72%(+0.060)#1,908 |
| 32. | Centerville | 0.78% | 0.26%(+0.515)#32 | 0.72%(+0.057)#1,913 |
| 33. | Riverside | 0.73% | 0.26%(+0.470)#33 | 0.72%(+0.012)#1,992 |
| 34. | Stratford | 0.73% | 0.26%(+0.466)#34 | 0.72%(+0.008)#2,000 |
| 35. | Slater | 0.71% | 0.26%(+0.448)#35 | 0.72%(-0.010)#2,038 |
| 36. | Sioux City | 0.67% | 0.26%(+0.409)#36 | 0.72%(-0.049)#2,097 |
| 37. | Webster City | 0.67% | 0.26%(+0.404)#37 | 0.72%(-0.054)#2,108 |
| 38. | Cascade | 0.65% | 0.26%(+0.385)#38 | 0.72%(-0.073)#2,151 |
| 39. | Schleswig | 0.64% | 0.26%(+0.379)#39 | 0.72%(-0.079)#2,161 |
| 40. | Delta | 0.64% | 0.26%(+0.379)#40 | 0.72%(-0.079)#2,162 |
| 41. | Postville | 0.64% | 0.26%(+0.377)#41 | 0.72%(-0.081)#2,164 |
| 42. | Columbus Junction | 0.64% | 0.26%(+0.377)#42 | 0.72%(-0.081)#2,165 |
| 43. | Charles City | 0.56% | 0.26%(+0.293)#43 | 0.72%(-0.165)#2,348 |
| 44. | Estherville | 0.53% | 0.26%(+0.263)#44 | 0.72%(-0.195)#2,424 |
| 45. | Union | 0.48% | 0.26%(+0.211)#45 | 0.72%(-0.247)#2,543 |
| 46. | Rockwell City | 0.42% | 0.26%(+0.155)#46 | 0.72%(-0.303)#2,708 |
| 47. | Pleasant Hill | 0.38% | 0.26%(+0.119)#47 | 0.72%(-0.339)#2,822 |
| 48. | Vinton | 0.36% | 0.26%(+0.100)#48 | 0.72%(-0.358)#2,897 |
| 49. | Elkhart | 0.36% | 0.26%(+0.098)#49 | 0.72%(-0.360)#2,901 |
| 50. | Carroll | 0.36% | 0.26%(+0.097)#50 | 0.72%(-0.361)#2,907 |
| 51. | Westside | 0.34% | 0.26%(+0.074)#51 | 0.72%(-0.384)#2,994 |
| 52. | Waterloo | 0.33% | 0.26%(+0.069)#52 | 0.72%(-0.389)#3,017 |
| 53. | Sheldon | 0.33% | 0.26%(+0.069)#53 | 0.72%(-0.389)#3,022 |
| 54. | Iowa City | 0.29% | 0.26%(+0.025)#54 | 0.72%(-0.433)#3,192 |
| 55. | Wesley | 0.28% | 0.26%(+0.018)#55 | 0.72%(-0.440)#3,220 |
| 56. | Harlan | 0.25% | 0.26%(-0.019)#56 | 0.72%(-0.477)#3,374 |
| 57. | Ogden | 0.21% | 0.26%(-0.051)#57 | 0.72%(-0.509)#3,540 |
| 58. | Bettendorf | 0.21% | 0.26%(-0.051)#58 | 0.72%(-0.509)#3,543 |
| 59. | Urbandale | 0.21% | 0.26%(-0.058)#59 | 0.72%(-0.515)#3,580 |
| 60. | Marshalltown | 0.18% | 0.26%(-0.082)#60 | 0.72%(-0.540)#3,691 |
| 61. | Coralville | 0.15% | 0.26%(-0.113)#61 | 0.72%(-0.571)#3,823 |
| 62. | Algona | 0.15% | 0.26%(-0.117)#62 | 0.72%(-0.575)#3,843 |
| 63. | Ankeny | 0.14% | 0.26%(-0.126)#63 | 0.72%(-0.584)#3,925 |
| 64. | Davenport | 0.13% | 0.26%(-0.137)#64 | 0.72%(-0.595)#3,987 |
| 65. | Brooklyn | 0.13% | 0.26%(-0.139)#65 | 0.72%(-0.597)#3,999 |
| 66. | Clear Lake | 0.12% | 0.26%(-0.146)#66 | 0.72%(-0.604)#4,043 |
| 67. | Whiting | 0.11% | 0.26%(-0.152)#67 | 0.72%(-0.610)#4,082 |
| 68. | Farley | 0.11% | 0.26%(-0.155)#68 | 0.72%(-0.613)#4,113 |
| 69. | Indianola | 0.10% | 0.26%(-0.163)#69 | 0.72%(-0.621)#4,164 |
| 70. | Cedar Falls | 0.10% | 0.26%(-0.163)#70 | 0.72%(-0.621)#4,168 |
| 71. | Council Bluffs | 0.093% | 0.26%(-0.171)#71 | 0.72%(-0.629)#4,217 |
| 72. | West Des Moines | 0.090% | 0.26%(-0.174)#72 | 0.72%(-0.631)#4,233 |
| 73. | Fort Dodge | 0.089% | 0.26%(-0.175)#73 | 0.72%(-0.633)#4,248 |
| 74. | North Liberty | 0.083% | 0.26%(-0.180)#74 | 0.72%(-0.638)#4,286 |
| 75. | Pella | 0.047% | 0.26%(-0.216)#75 | 0.72%(-0.674)#4,550 |
| 76. | Ames | 0.047% | 0.26%(-0.217)#76 | 0.72%(-0.675)#4,556 |
| 77. | Cedar Rapids | 0.044% | 0.26%(-0.220)#77 | 0.72%(-0.678)#4,574 |
| 78. | Johnston | 0.034% | 0.26%(-0.230)#78 | 0.72%(-0.688)#4,645 |
Common Questions
What are the Top 10 Cities with the Highest Percentage of Salvadoran Population in Iowa?
Top 10 Cities with the Highest Percentage of Salvadoran Population in Iowa are:
#1
14.25%
#2
8.30%
#3
8.25%
#4
3.54%
#5
3.43%
#6
2.90%
#7
2.80%
#8
2.78%
#9
2.76%
#10
2.74%
What city has the Highest Percentage of Salvadoran Population in Iowa?
Denison has the Highest Percentage of Salvadoran Population in Iowa with 14.25%.
What is the Percentage of Salvadoran Population in the State of Iowa?
Percentage of Salvadoran Population in Iowa is 0.26%.
What is the Percentage of Salvadoran Population in the United States?
Percentage of Salvadoran Population in the United States is 0.72%.