Folkston, GA
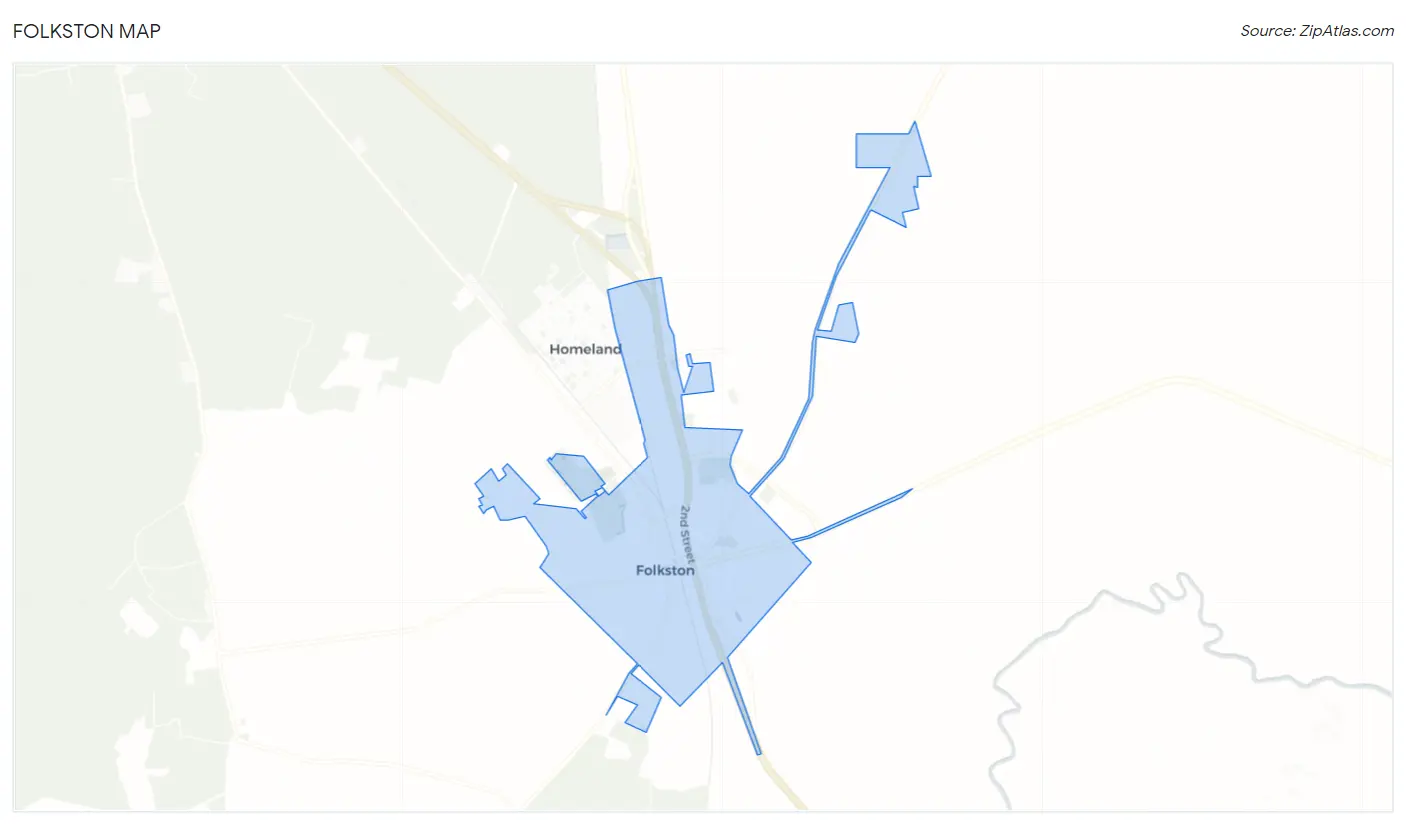
Folkston Map
Folkston Overview
4,544
TOTAL POPULATION
2,760
MALE POPULATION
1,784
FEMALE POPULATION
154.71
MALES / 100 FEMALES
64.64
FEMALES / 100 MALES
36.9
MEDIAN AGE
3.3
AVG FAMILY SIZE
2.6
AVG HOUSEHOLD SIZE
$17,021
PER CAPITA INCOME
$31,276
AVG FAMILY INCOME
$36,712
AVG HOUSEHOLD INCOME
31.9%
WAGE / INCOME GAP [ % ]
68.1¢/ $1
WAGE / INCOME GAP [ $ ]
0.45
INEQUALITY / GINI INDEX
1,869
LABOR FORCE [ PEOPLE ]
47.8%
PERCENT IN LABOR FORCE
17.1%
UNEMPLOYMENT RATE
Folkston Zip Codes
Folkston Area Codes
Race in Folkston
The most populous races in Folkston are Black / African American (2,445 | 53.8%), White / Caucasian (1,731 | 38.1%), and Hispanic or Latino (367 | 8.1%).
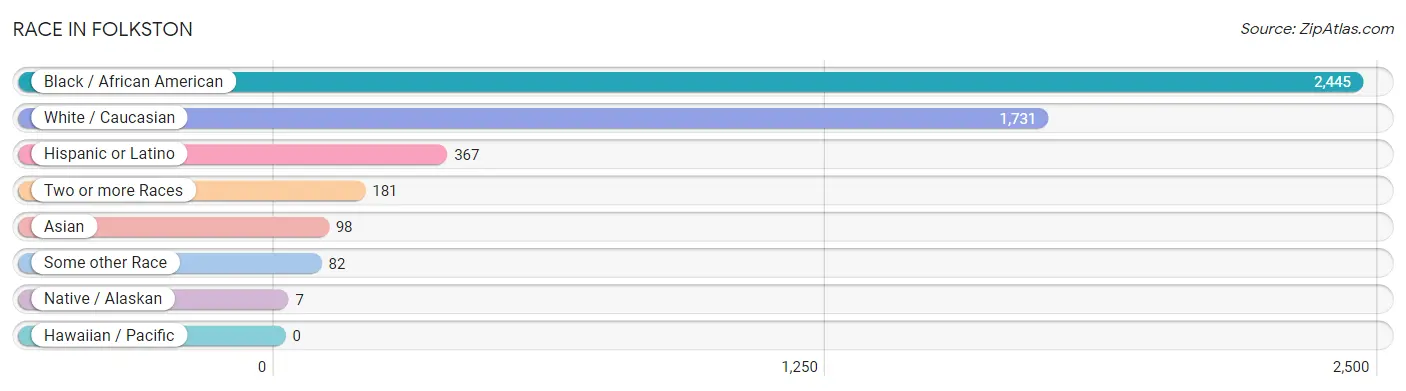
| Race | # Population | % Population |
| Asian | 98 | 2.2% |
| Black / African American | 2,445 | 53.8% |
| Hawaiian / Pacific | 0 | 0.0% |
| Hispanic or Latino | 367 | 8.1% |
| Native / Alaskan | 7 | 0.2% |
| White / Caucasian | 1,731 | 38.1% |
| Two or more Races | 181 | 4.0% |
| Some other Race | 82 | 1.8% |
| Total | 4,544 | 100.0% |
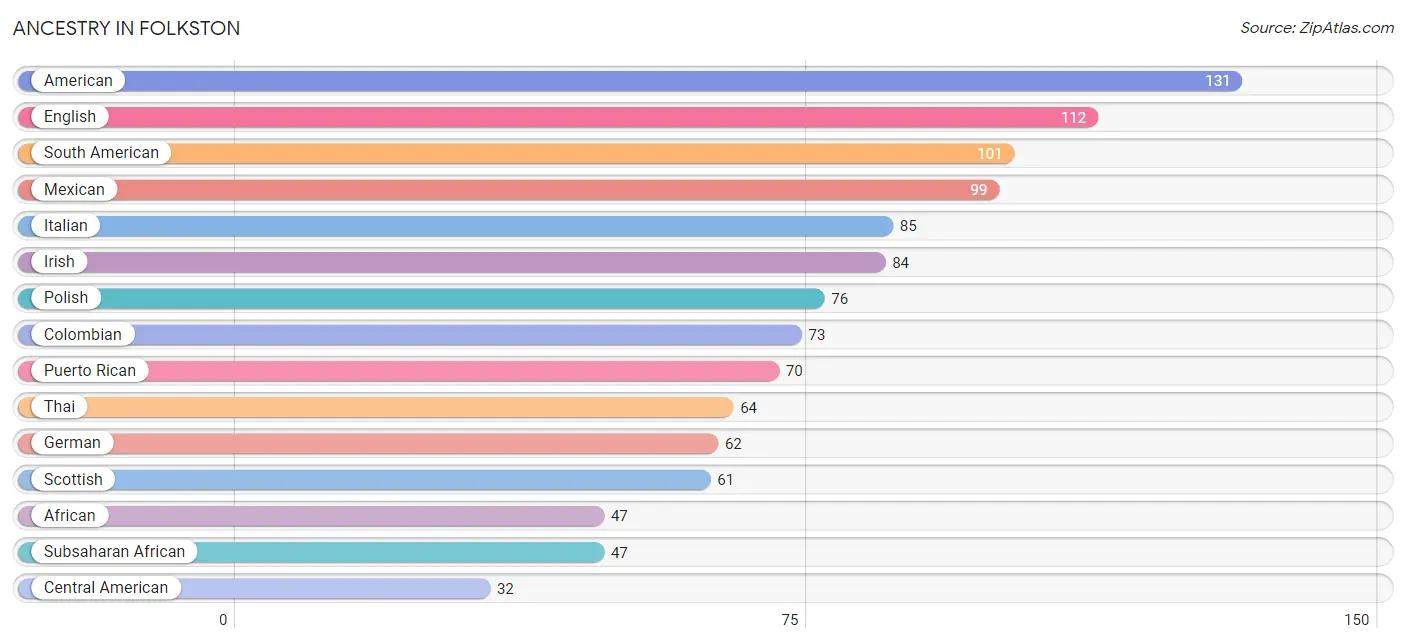
Ancestry in Folkston
The most populous ancestries reported in Folkston are American (131 | 2.9%), English (112 | 2.5%), South American (101 | 2.2%), Mexican (99 | 2.2%), and Italian (85 | 1.9%), together accounting for 11.6% of all Folkston residents.
| Ancestry | # Population | % Population |
| African | 47 | 1.0% |
| American | 131 | 2.9% |
| Arab | 16 | 0.4% |
| Burmese | 13 | 0.3% |
| Central American | 32 | 0.7% |
| Colombian | 73 | 1.6% |
| Cuban | 17 | 0.4% |
| Dominican | 22 | 0.5% |
| Dutch | 8 | 0.2% |
| Eastern European | 4 | 0.1% |
| Ecuadorian | 28 | 0.6% |
| English | 112 | 2.5% |
| German | 62 | 1.4% |
| Haitian | 21 | 0.5% |
| Honduran | 22 | 0.5% |
| Irish | 84 | 1.8% |
| Italian | 85 | 1.9% |
| Korean | 32 | 0.7% |
| Mexican | 99 | 2.2% |
| Native Hawaiian | 29 | 0.6% |
| Polish | 76 | 1.7% |
| Puerto Rican | 70 | 1.5% |
| Salvadoran | 10 | 0.2% |
| Scottish | 61 | 1.3% |
| South American | 101 | 2.2% |
| Subsaharan African | 47 | 1.0% |
| Swedish | 6 | 0.1% |
| Thai | 64 | 1.4% | View All 28 Rows |
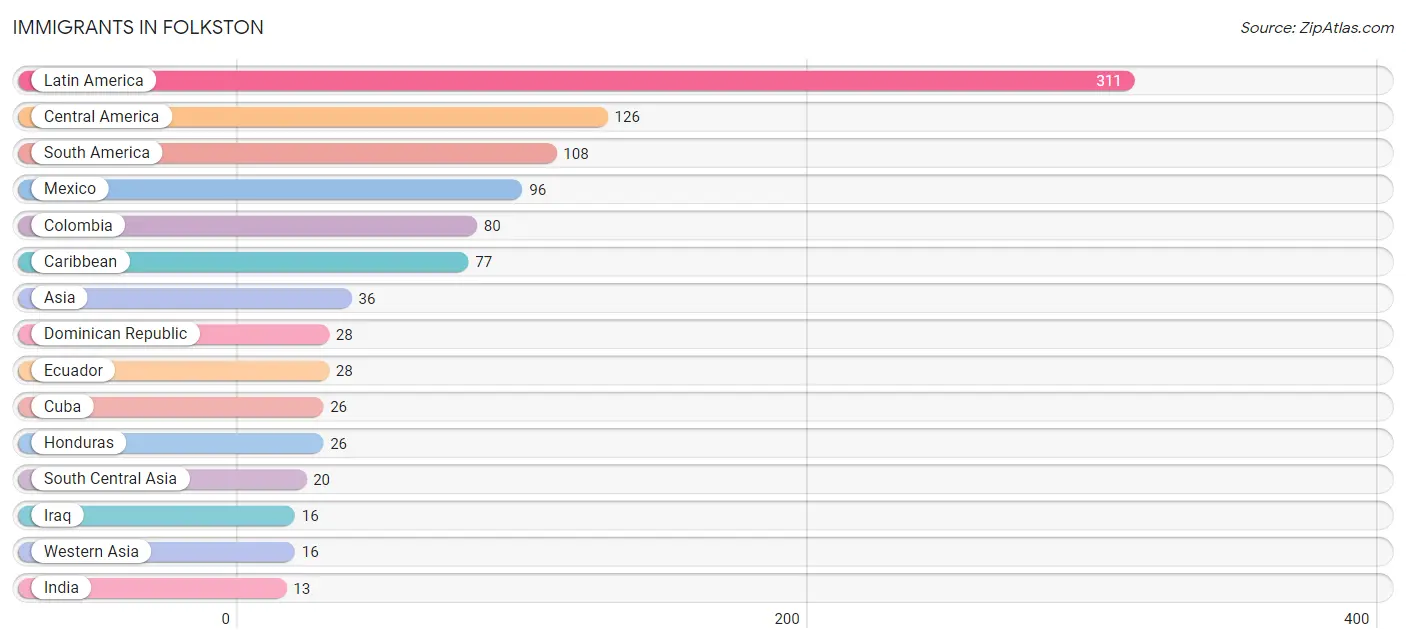
Immigrants in Folkston
The most numerous immigrant groups reported in Folkston came from Latin America (311 | 6.8%), Central America (126 | 2.8%), South America (108 | 2.4%), Mexico (96 | 2.1%), and Colombia (80 | 1.8%), together accounting for 15.9% of all Folkston residents.
| Immigration Origin | # Population | % Population |
| Asia | 36 | 0.8% |
| Caribbean | 77 | 1.7% |
| Central America | 126 | 2.8% |
| Colombia | 80 | 1.8% |
| Cuba | 26 | 0.6% |
| Dominican Republic | 28 | 0.6% |
| Ecuador | 28 | 0.6% |
| Europe | 6 | 0.1% |
| Germany | 6 | 0.1% |
| Guatemala | 4 | 0.1% |
| Haiti | 10 | 0.2% |
| Honduras | 26 | 0.6% |
| India | 13 | 0.3% |
| Iraq | 16 | 0.4% |
| Jamaica | 13 | 0.3% |
| Latin America | 311 | 6.8% |
| Mexico | 96 | 2.1% |
| Pakistan | 7 | 0.2% |
| South America | 108 | 2.4% |
| South Central Asia | 20 | 0.4% |
| Western Asia | 16 | 0.4% |
| Western Europe | 6 | 0.1% | View All 22 Rows |
Sex and Age in Folkston
Sex and Age in Folkston
The most populous age groups in Folkston are 25 to 29 Years (534 | 19.4%) for men and 35 to 39 Years (241 | 13.5%) for women.
| Age Bracket | Male | Female |
| Under 5 Years | 67 (2.4%) | 201 (11.3%) |
| 5 to 9 Years | 40 (1.5%) | 164 (9.2%) |
| 10 to 14 Years | 55 (2.0%) | 97 (5.4%) |
| 15 to 19 Years | 37 (1.3%) | 78 (4.4%) |
| 20 to 24 Years | 101 (3.7%) | 92 (5.2%) |
| 25 to 29 Years | 534 (19.4%) | 100 (5.6%) |
| 30 to 34 Years | 421 (15.2%) | 61 (3.4%) |
| 35 to 39 Years | 176 (6.4%) | 241 (13.5%) |
| 40 to 44 Years | 381 (13.8%) | 20 (1.1%) |
| 45 to 49 Years | 222 (8.0%) | 20 (1.1%) |
| 50 to 54 Years | 159 (5.8%) | 105 (5.9%) |
| 55 to 59 Years | 120 (4.3%) | 128 (7.2%) |
| 60 to 64 Years | 132 (4.8%) | 212 (11.9%) |
| 65 to 69 Years | 154 (5.6%) | 112 (6.3%) |
| 70 to 74 Years | 53 (1.9%) | 23 (1.3%) |
| 75 to 79 Years | 84 (3.0%) | 72 (4.0%) |
| 80 to 84 Years | 2 (0.1%) | 32 (1.8%) |
| 85 Years and over | 22 (0.8%) | 26 (1.5%) |
| Total | 2,760 (100.0%) | 1,784 (100.0%) |
Families and Households in Folkston
Median Family Size in Folkston
The median family size in Folkston is 3.34 persons per family, with single female/mother families (215 | 24.3%) accounting for the largest median family size of 5.7 persons per family. On the other hand, single male/father families (340 | 38.5%) represent the smallest median family size with 1.50 persons per family.
| Family Type | # Families | Family Size |
| Married-Couple | 328 (37.1%) | 3.70 |
| Single Male/Father | 340 (38.5%) | 1.50 |
| Single Female/Mother | 215 (24.3%) | 5.70 |
| Total Families | 883 (100.0%) | 3.34 |
Median Household Size in Folkston
The median household size in Folkston is 2.64 persons per household, with single female/mother households (215 | 15.3%) accounting for the largest median household size of 6.03 persons per household. non-family households (521 | 37.1%) represent the smallest median household size with 1.24 persons per household.
| Household Type | # Households | Household Size |
| Married-Couple | 328 (23.4%) | 3.70 |
| Single Male/Father | 340 (24.2%) | 1.63 |
| Single Female/Mother | 215 (15.3%) | 6.03 |
| Non-family | 521 (37.1%) | 1.24 |
| Total Households | 1,404 (100.0%) | 2.64 |
Household Size by Marriage Status in Folkston
Out of a total of 1,404 households in Folkston, 883 (62.9%) are family households, while 521 (37.1%) are nonfamily households. The most numerous type of family households are 4-person households, comprising 394, and the most common type of nonfamily households are 1-person households, comprising 407.
| Household Size | Family Households | Nonfamily Households |
| 1-Person Households | - | 407 (29.0%) |
| 2-Person Households | 237 (16.9%) | 114 (8.1%) |
| 3-Person Households | 131 (9.3%) | 0 (0.0%) |
| 4-Person Households | 394 (28.1%) | 0 (0.0%) |
| 5-Person Households | 117 (8.3%) | 0 (0.0%) |
| 6-Person Households | 4 (0.3%) | 0 (0.0%) |
| 7+ Person Households | 0 (0.0%) | 0 (0.0%) |
| Total | 883 (62.9%) | 521 (37.1%) |
Female Fertility in Folkston
Fertility by Age in Folkston
Average fertility rate in Folkston is 173.0 births per 1,000 women. Women in the age bracket of 35 to 50 years have the highest fertility rate with 214.0 births per 1,000 women. Women in the age bracket of 35 to 50 years acount for 56.6% of all women with births.
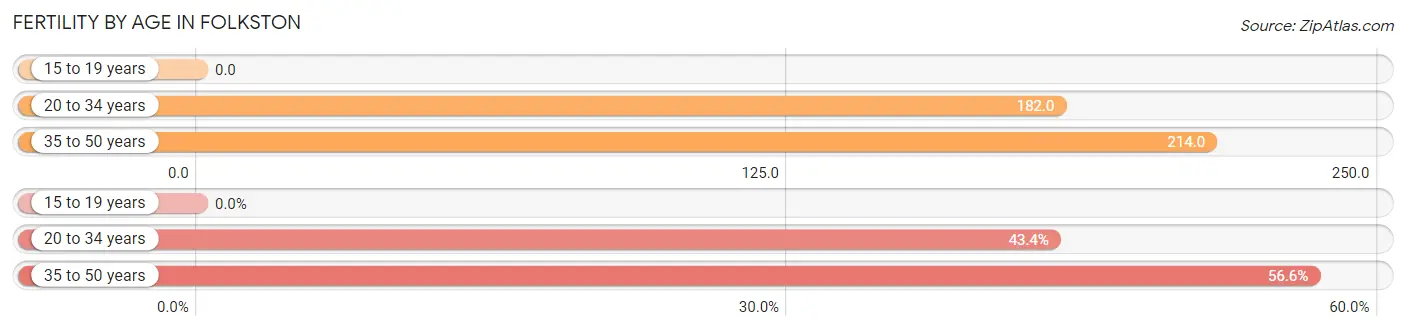
| Age Bracket | Women with Births | Births / 1,000 Women |
| 15 to 19 years | 0 (0.0%) | 0.0 |
| 20 to 34 years | 46 (43.4%) | 182.0 |
| 35 to 50 years | 60 (56.6%) | 214.0 |
| Total | 106 (100.0%) | 173.0 |
Fertility by Age by Marriage Status in Folkston
3.8% of women with births (106) in Folkston are married. The highest percentage of unmarried women with births falls into 20 to 34 years age bracket with 100.0% of them unmarried at the time of birth, while the lowest percentage of unmarried women with births belong to 35 to 50 years age bracket with 93.3% of them unmarried.
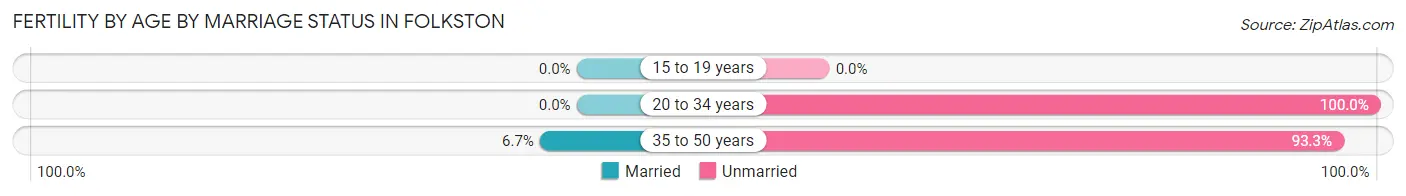
| Age Bracket | Married | Unmarried |
| 15 to 19 years | 0 (0.0%) | 0 (0.0%) |
| 20 to 34 years | 0 (0.0%) | 46 (100.0%) |
| 35 to 50 years | 4 (6.7%) | 56 (93.3%) |
| Total | 4 (3.8%) | 102 (96.2%) |
Fertility by Education in Folkston
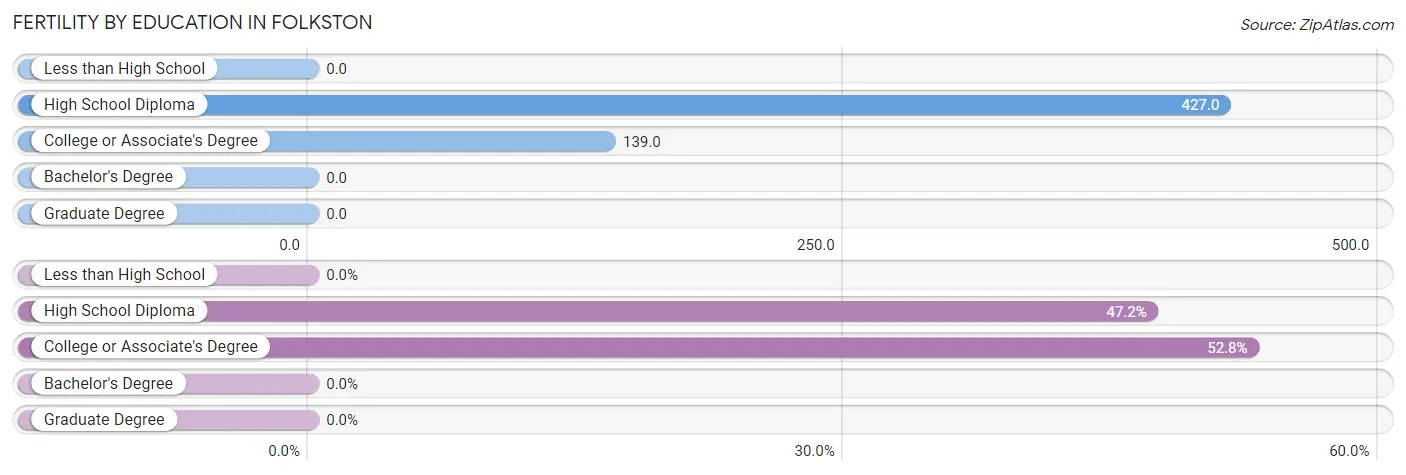
| Educational Attainment | Women with Births | Births / 1,000 Women |
| Less than High School | 0 (0.0%) | 0.0 |
| High School Diploma | 50 (47.2%) | 427.0 |
| College or Associate's Degree | 56 (52.8%) | 139.0 |
| Bachelor's Degree | 0 (0.0%) | 0.0 |
| Graduate Degree | 0 (0.0%) | 0.0 |
| Total | 106 (100.0%) | 173.0 |
Fertility by Education by Marriage Status in Folkston
96.2% of women with births in Folkston are unmarried. Women with the educational attainment of high school diploma are most likely to be married with 8.0% of them married at childbirth, while women with the educational attainment of college or associate's degree are least likely to be married with 100.0% of them unmarried at childbirth.
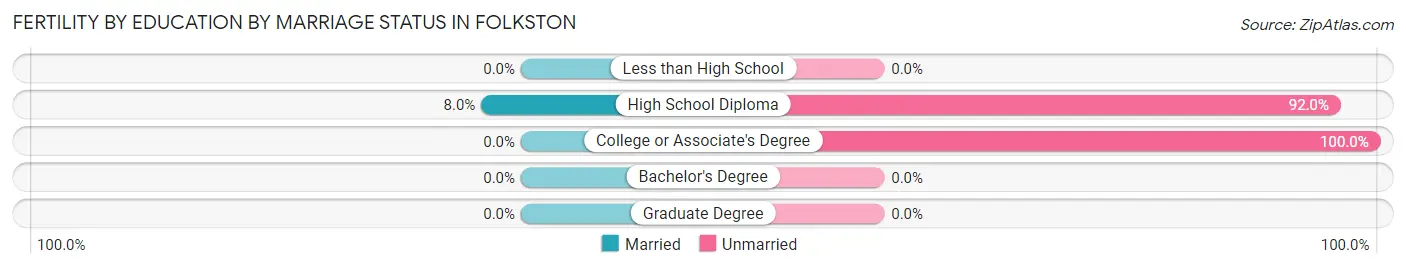
| Educational Attainment | Married | Unmarried |
| Less than High School | 0 (0.0%) | 0 (0.0%) |
| High School Diploma | 4 (8.0%) | 46 (92.0%) |
| College or Associate's Degree | 0 (0.0%) | 56 (100.0%) |
| Bachelor's Degree | 0 (0.0%) | 0 (0.0%) |
| Graduate Degree | 0 (0.0%) | 0 (0.0%) |
| Total | 4 (3.8%) | 102 (96.2%) |
Income in Folkston
Income Overview in Folkston
Per Capita Income in Folkston is $17,021, while median incomes of families and households are $31,276 and $36,712 respectively.
| Characteristic | Number | Measure |
| Per Capita Income | 4,544 | $17,021 |
| Median Family Income | 883 | $31,276 |
| Mean Family Income | 883 | $48,698 |
| Median Household Income | 1,404 | $36,712 |
| Mean Household Income | 1,404 | $46,326 |
| Income Deficit | 883 | $0 |
| Wage / Income Gap (%) | 4,544 | 31.90% |
| Wage / Income Gap ($) | 4,544 | 68.10¢ per $1 |
| Gini / Inequality Index | 4,544 | 0.45 |
Earnings by Sex in Folkston
Average Earnings in Folkston are $27,500, $28,909 for men and $19,688 for women, a difference of 31.9%.
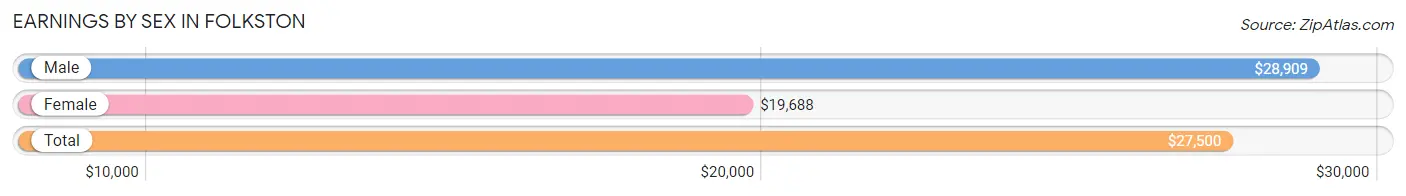
| Sex | Number | Average Earnings |
| Male | 1,468 (72.8%) | $28,909 |
| Female | 548 (27.2%) | $19,688 |
| Total | 2,016 (100.0%) | $27,500 |
Earnings by Sex by Income Bracket in Folkston
The most common earnings brackets in Folkston are $30,000 to $34,999 for men (343 | 23.4%) and $15,000 to $17,499 for women (150 | 27.4%).
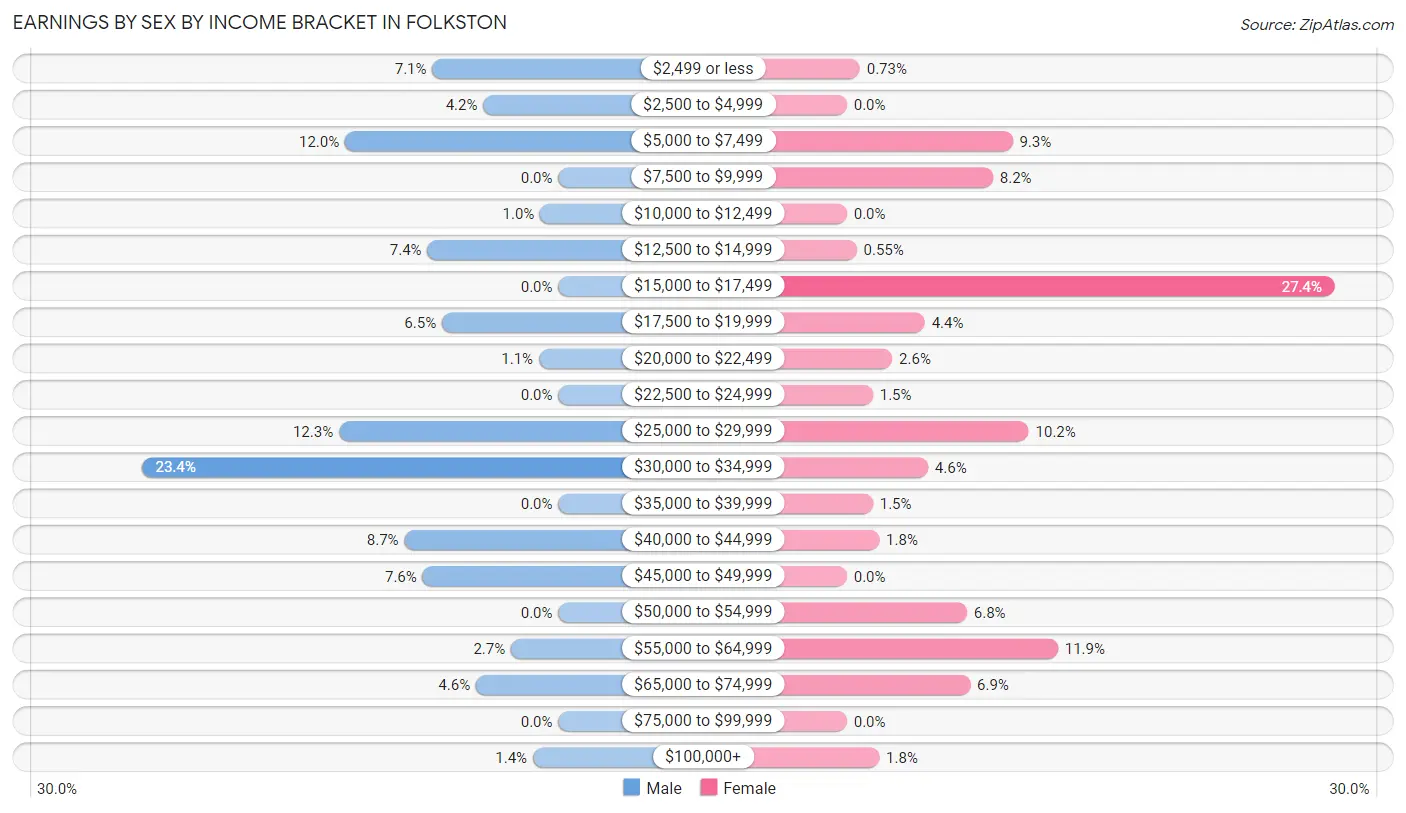
| Income | Male | Female |
| $2,499 or less | 104 (7.1%) | 4 (0.7%) |
| $2,500 to $4,999 | 62 (4.2%) | 0 (0.0%) |
| $5,000 to $7,499 | 176 (12.0%) | 51 (9.3%) |
| $7,500 to $9,999 | 0 (0.0%) | 45 (8.2%) |
| $10,000 to $12,499 | 15 (1.0%) | 0 (0.0%) |
| $12,500 to $14,999 | 108 (7.4%) | 3 (0.5%) |
| $15,000 to $17,499 | 0 (0.0%) | 150 (27.4%) |
| $17,500 to $19,999 | 96 (6.5%) | 24 (4.4%) |
| $20,000 to $22,499 | 16 (1.1%) | 14 (2.5%) |
| $22,500 to $24,999 | 0 (0.0%) | 8 (1.5%) |
| $25,000 to $29,999 | 181 (12.3%) | 56 (10.2%) |
| $30,000 to $34,999 | 343 (23.4%) | 25 (4.6%) |
| $35,000 to $39,999 | 0 (0.0%) | 8 (1.5%) |
| $40,000 to $44,999 | 127 (8.6%) | 10 (1.8%) |
| $45,000 to $49,999 | 112 (7.6%) | 0 (0.0%) |
| $50,000 to $54,999 | 0 (0.0%) | 37 (6.8%) |
| $55,000 to $64,999 | 39 (2.7%) | 65 (11.9%) |
| $65,000 to $74,999 | 68 (4.6%) | 38 (6.9%) |
| $75,000 to $99,999 | 0 (0.0%) | 0 (0.0%) |
| $100,000+ | 21 (1.4%) | 10 (1.8%) |
| Total | 1,468 (100.0%) | 548 (100.0%) |
Earnings by Sex by Educational Attainment in Folkston
Average earnings in Folkston are $30,095 for men and $21,875 for women, a difference of 27.3%. Men with an educational attainment of high school diploma enjoy the highest average annual earnings of $31,134, while those with less than high school education earn the least with $14,511. Women with an educational attainment of less than high school earn the most with the average annual earnings of $60,741, while those with bachelor's degree education have the smallest earnings of $30,000.
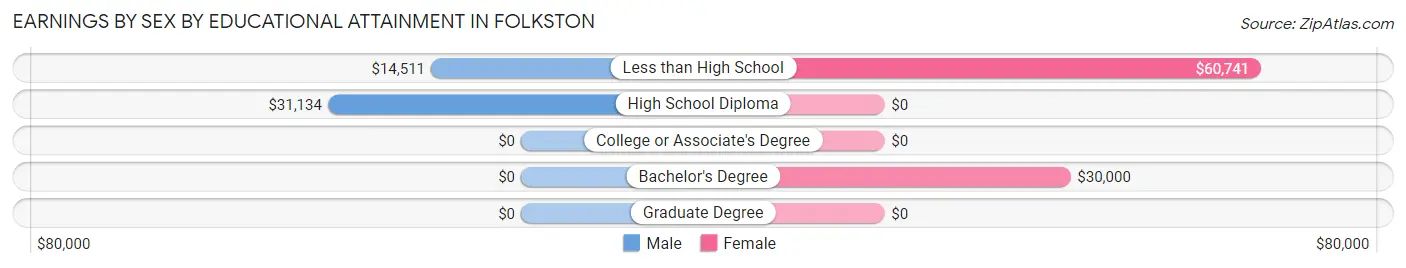
| Educational Attainment | Male Income | Female Income |
| Less than High School | $14,511 | $60,741 |
| High School Diploma | $31,134 | $0 |
| College or Associate's Degree | - | - |
| Bachelor's Degree | - | - |
| Graduate Degree | - | - |
| Total | $30,095 | $21,875 |
Family Income in Folkston
Family Income Brackets in Folkston
According to the Folkston family income data, there are 284 families falling into the $25,000 to $34,999 income range, which is the most common income bracket and makes up 32.2% of all families. Conversely, the $10,000 to $14,999 income bracket is the least frequent group with only 13 families (1.5%) belonging to this category.
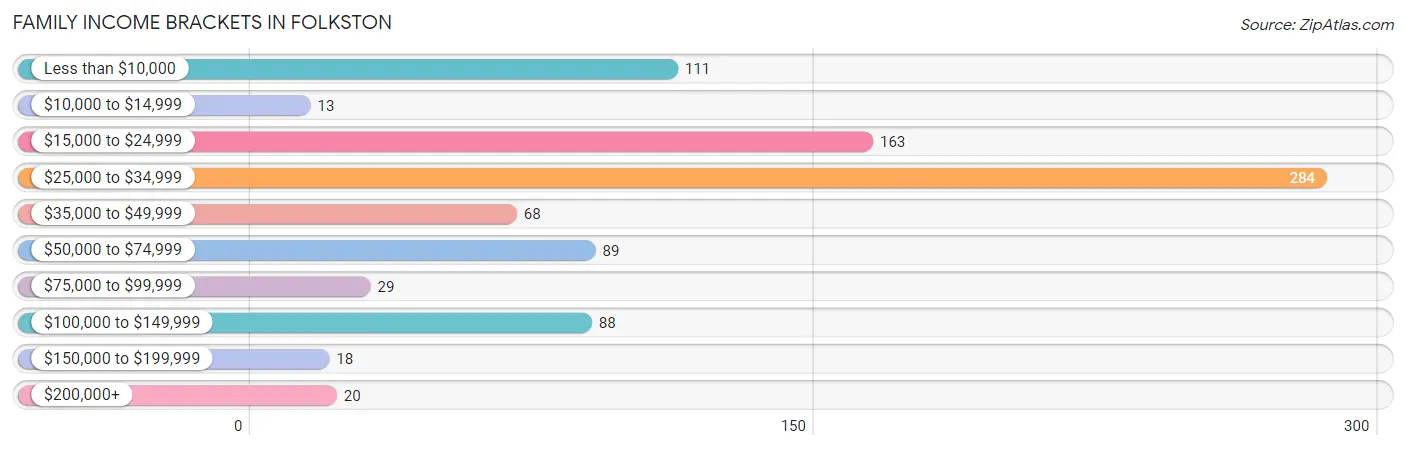
| Income Bracket | # Families | % Families |
| Less than $10,000 | 111 | 12.6% |
| $10,000 to $14,999 | 13 | 1.5% |
| $15,000 to $24,999 | 163 | 18.5% |
| $25,000 to $34,999 | 284 | 32.2% |
| $35,000 to $49,999 | 68 | 7.7% |
| $50,000 to $74,999 | 89 | 10.1% |
| $75,000 to $99,999 | 29 | 3.3% |
| $100,000 to $149,999 | 88 | 10.0% |
| $150,000 to $199,999 | 18 | 2.0% |
| $200,000+ | 20 | 2.3% |
Family Income by Famaliy Size in Folkston
3-person families (362 | 41.0%) account for the highest median family income in Folkston with $31,472 per family, while 2-person families (242 | 27.4%) have the highest median income of $11,875 per family member.
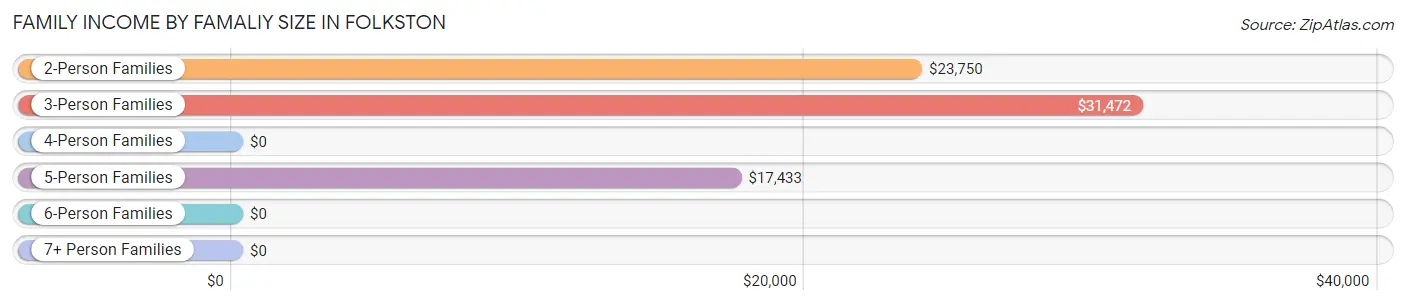
| Income Bracket | # Families | Median Income |
| 2-Person Families | 242 (27.4%) | $23,750 |
| 3-Person Families | 362 (41.0%) | $31,472 |
| 4-Person Families | 158 (17.9%) | $0 |
| 5-Person Families | 117 (13.3%) | $17,433 |
| 6-Person Families | 4 (0.4%) | $0 |
| 7+ Person Families | 0 (0.0%) | $0 |
| Total | 883 (100.0%) | $31,276 |
Family Income by Number of Earners in Folkston
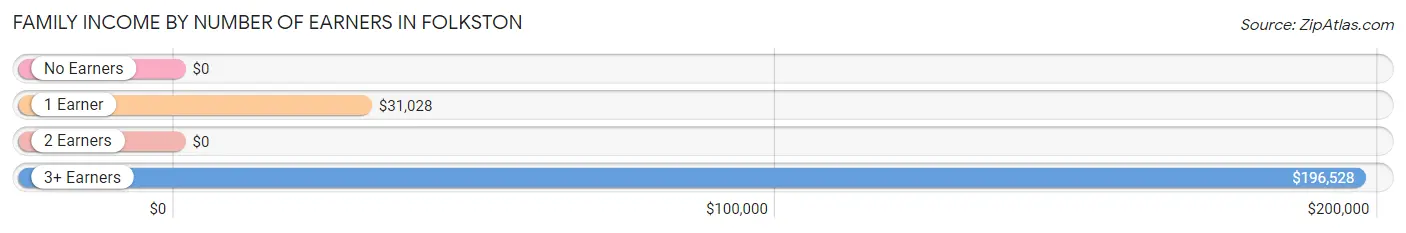
| Number of Earners | # Families | Median Income |
| No Earners | 218 (24.7%) | $0 |
| 1 Earner | 384 (43.5%) | $31,028 |
| 2 Earners | 227 (25.7%) | $0 |
| 3+ Earners | 54 (6.1%) | $196,528 |
| Total | 883 (100.0%) | $31,276 |
Household Income in Folkston
Household Income Brackets in Folkston
With 423 households falling in the category, the $35,000 to $49,999 income range is the most frequent in Folkston, accounting for 30.1% of all households. In contrast, only 18 households (1.3%) fall into the $150,000 to $199,999 income bracket, making it the least populous group.
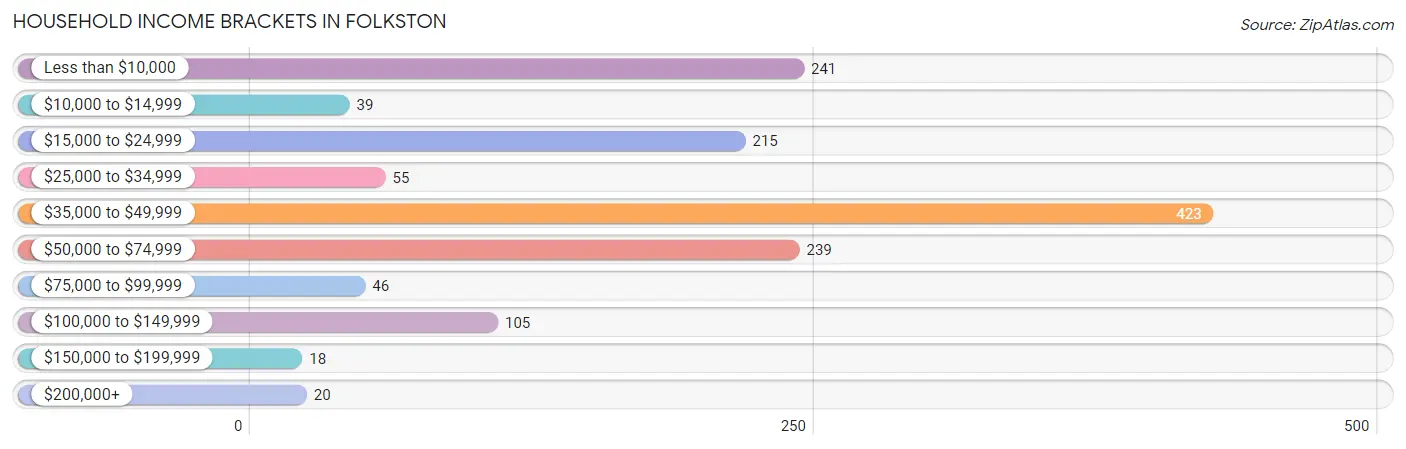
| Income Bracket | # Households | % Households |
| Less than $10,000 | 241 | 17.2% |
| $10,000 to $14,999 | 39 | 2.8% |
| $15,000 to $24,999 | 215 | 15.3% |
| $25,000 to $34,999 | 55 | 3.9% |
| $35,000 to $49,999 | 423 | 30.1% |
| $50,000 to $74,999 | 239 | 17.0% |
| $75,000 to $99,999 | 46 | 3.3% |
| $100,000 to $149,999 | 105 | 7.5% |
| $150,000 to $199,999 | 18 | 1.3% |
| $200,000+ | 20 | 1.4% |
Household Income by Householder Age in Folkston
The median household income in Folkston is $36,712, with the highest median household income of $58,079 found in the 65+ years age bracket for the primary householder. A total of 346 households (24.6%) fall into this category. Meanwhile, the 15 to 24 years age bracket for the primary householder has the lowest median household income of $0, with 19 households (1.3%) in this group.
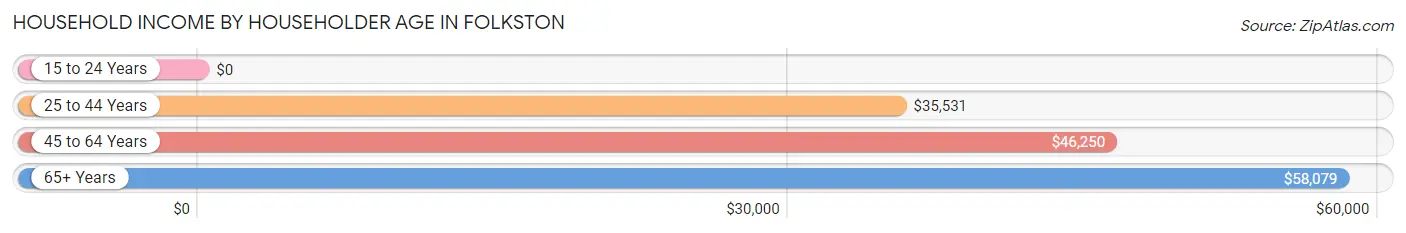
| Income Bracket | # Households | Median Income |
| 15 to 24 Years | 19 (1.3%) | $0 |
| 25 to 44 Years | 645 (45.9%) | $35,531 |
| 45 to 64 Years | 394 (28.1%) | $46,250 |
| 65+ Years | 346 (24.6%) | $58,079 |
| Total | 1,404 (100.0%) | $36,712 |
Poverty in Folkston
Income Below Poverty by Sex and Age in Folkston
With 17.9% poverty level for males and 56.8% for females among the residents of Folkston, 12 to 14 year old males and 5 year old females are the most vulnerable to poverty, with 20 males (74.1%) and 43 females (100.0%) in their respective age groups living below the poverty level.
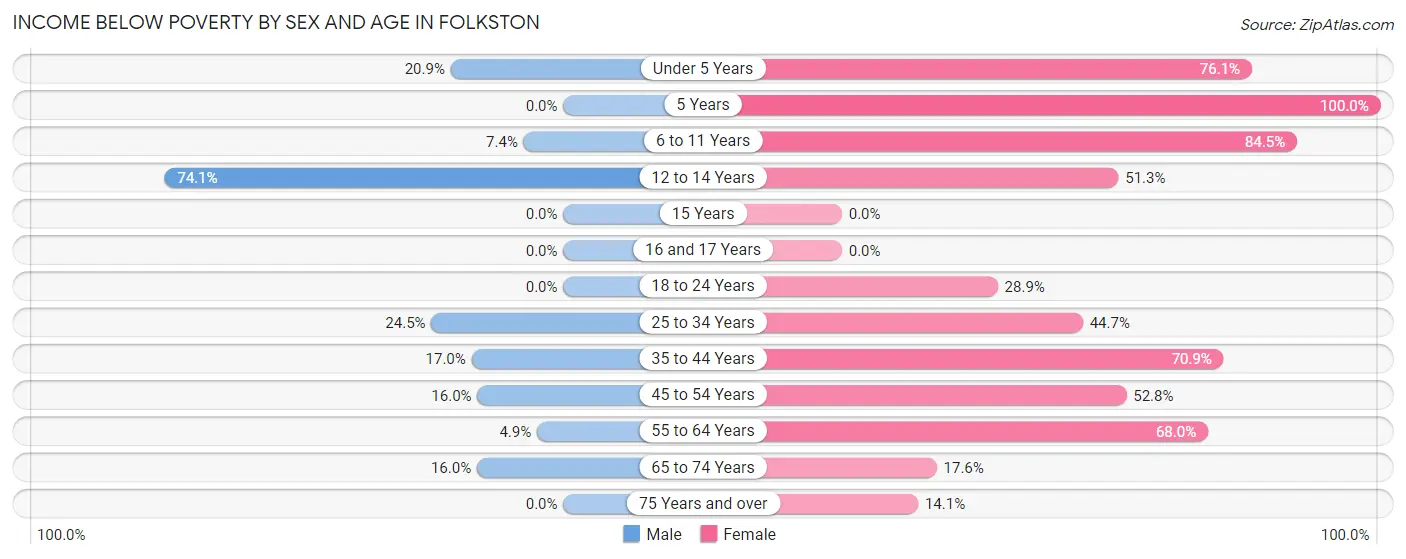
| Age Bracket | Male | Female |
| Under 5 Years | 14 (20.9%) | 153 (76.1%) |
| 5 Years | 0 (0.0%) | 43 (100.0%) |
| 6 to 11 Years | 5 (7.3%) | 120 (84.5%) |
| 12 to 14 Years | 20 (74.1%) | 39 (51.3%) |
| 15 Years | 0 (0.0%) | 0 (0.0%) |
| 16 and 17 Years | 0 (0.0%) | 0 (0.0%) |
| 18 to 24 Years | 0 (0.0%) | 46 (28.9%) |
| 25 to 34 Years | 193 (24.5%) | 72 (44.7%) |
| 35 to 44 Years | 62 (17.0%) | 185 (70.9%) |
| 45 to 54 Years | 26 (16.0%) | 66 (52.8%) |
| 55 to 64 Years | 8 (4.9%) | 227 (68.0%) |
| 65 to 74 Years | 25 (16.0%) | 22 (17.6%) |
| 75 Years and over | 0 (0.0%) | 14 (14.1%) |
| Total | 353 (17.9%) | 987 (56.8%) |
Income Above Poverty by Sex and Age in Folkston
According to the poverty statistics in Folkston, males aged 18 to 24 years and females aged 15 years are the age groups that are most secure financially, with 100.0% of males and 100.0% of females in these age groups living above the poverty line.
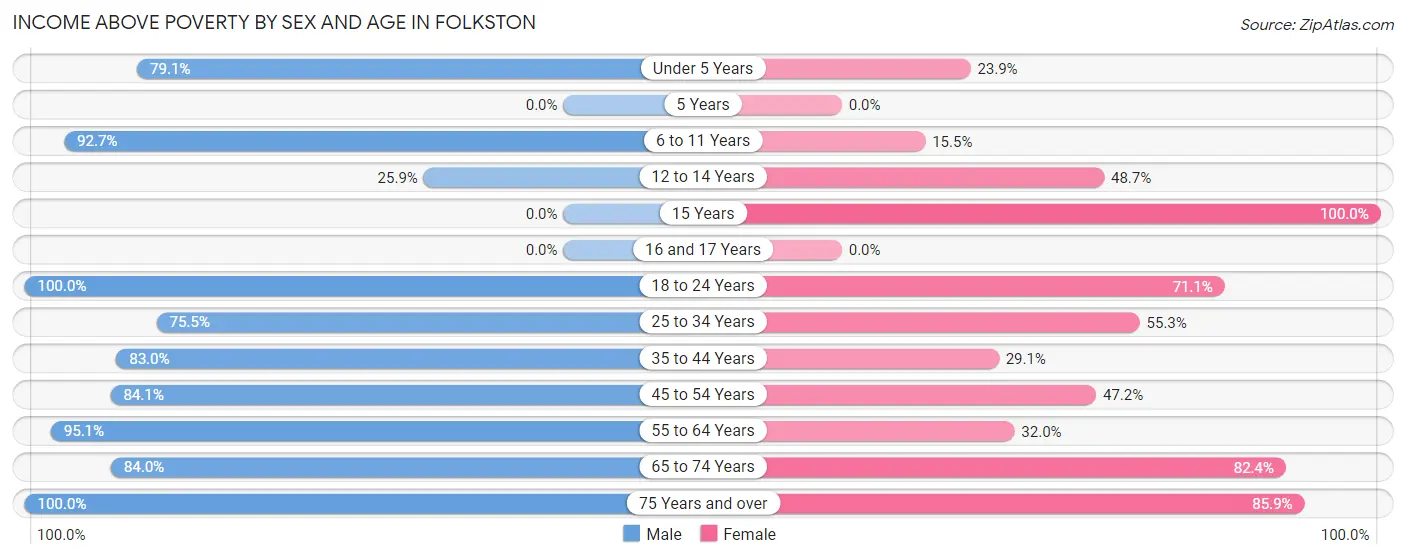
| Age Bracket | Male | Female |
| Under 5 Years | 53 (79.1%) | 48 (23.9%) |
| 5 Years | 0 (0.0%) | 0 (0.0%) |
| 6 to 11 Years | 63 (92.6%) | 22 (15.5%) |
| 12 to 14 Years | 7 (25.9%) | 37 (48.7%) |
| 15 Years | 0 (0.0%) | 11 (100.0%) |
| 16 and 17 Years | 0 (0.0%) | 0 (0.0%) |
| 18 to 24 Years | 72 (100.0%) | 113 (71.1%) |
| 25 to 34 Years | 595 (75.5%) | 89 (55.3%) |
| 35 to 44 Years | 302 (83.0%) | 76 (29.1%) |
| 45 to 54 Years | 137 (84.1%) | 59 (47.2%) |
| 55 to 64 Years | 156 (95.1%) | 107 (32.0%) |
| 65 to 74 Years | 131 (84.0%) | 103 (82.4%) |
| 75 Years and over | 103 (100.0%) | 85 (85.9%) |
| Total | 1,619 (82.1%) | 750 (43.2%) |
Income Below Poverty Among Married-Couple Families in Folkston
The poverty statistics for married-couple families in Folkston show that 18.6% or 61 of the total 328 families live below the poverty line. Families with 3 or 4 children have the highest poverty rate of 100.0%, comprising of 4 families. On the other hand, families with no children have the lowest poverty rate of 0.0%, which includes 0 families.
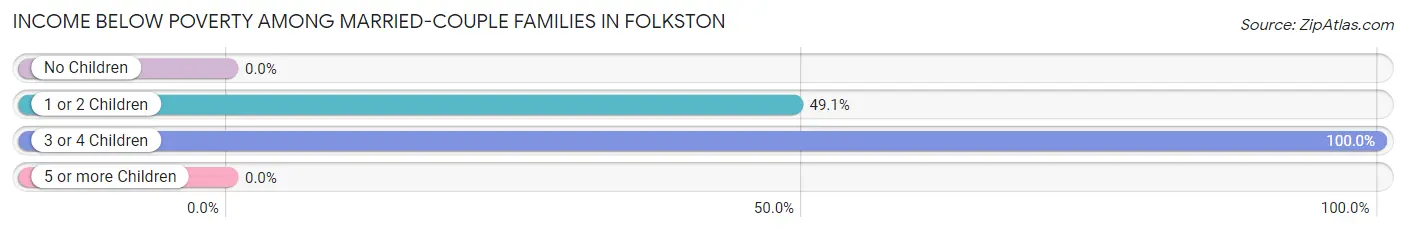
| Children | Above Poverty | Below Poverty |
| No Children | 208 (100.0%) | 0 (0.0%) |
| 1 or 2 Children | 59 (50.9%) | 57 (49.1%) |
| 3 or 4 Children | 0 (0.0%) | 4 (100.0%) |
| 5 or more Children | 0 (0.0%) | 0 (0.0%) |
| Total | 267 (81.4%) | 61 (18.6%) |
Income Below Poverty Among Single-Parent Households in Folkston
According to the poverty data in Folkston, 21.2% or 72 single-father households and 61.9% or 133 single-mother households are living below the poverty line. Among single-father households, those with no children have the highest poverty rate, with 72 households (80.9%) experiencing poverty. Likewise, among single-mother households, those with 3 or 4 children have the highest poverty rate, with 4 households (100.0%) falling below the poverty line.
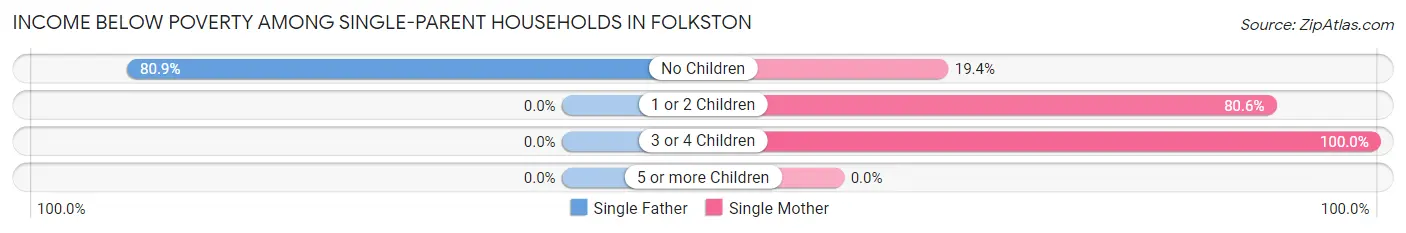
| Children | Single Father | Single Mother |
| No Children | 72 (80.9%) | 13 (19.4%) |
| 1 or 2 Children | 0 (0.0%) | 116 (80.6%) |
| 3 or 4 Children | 0 (0.0%) | 4 (100.0%) |
| 5 or more Children | 0 (0.0%) | 0 (0.0%) |
| Total | 72 (21.2%) | 133 (61.9%) |
Income Below Poverty Among Married-Couple vs Single-Parent Households in Folkston
The poverty data for Folkston shows that 61 of the married-couple family households (18.6%) and 205 of the single-parent households (36.9%) are living below the poverty level. Within the married-couple family households, those with 3 or 4 children have the highest poverty rate, with 4 households (100.0%) falling below the poverty line. Among the single-parent households, those with 3 or 4 children have the highest poverty rate, with 4 household (100.0%) living below poverty.
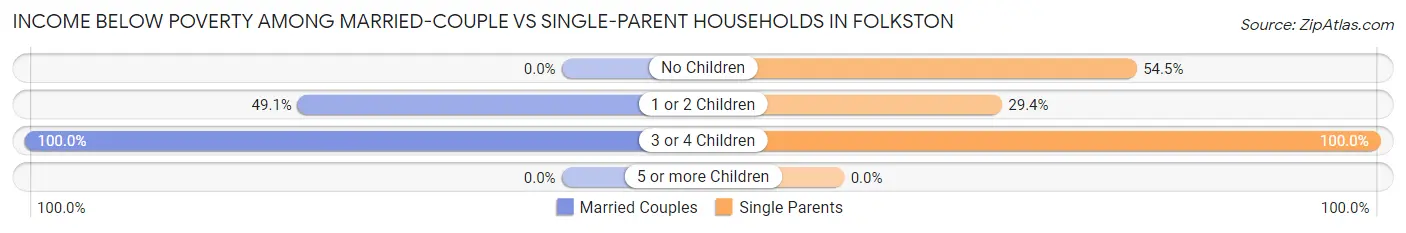
| Children | Married-Couple Families | Single-Parent Households |
| No Children | 0 (0.0%) | 85 (54.5%) |
| 1 or 2 Children | 57 (49.1%) | 116 (29.4%) |
| 3 or 4 Children | 4 (100.0%) | 4 (100.0%) |
| 5 or more Children | 0 (0.0%) | 0 (0.0%) |
| Total | 61 (18.6%) | 205 (36.9%) |
Employment Characteristics in Folkston
Employment by Class of Employer in Folkston
Among the 1,540 employed individuals in Folkston, private company employees (1,173 | 76.2%), local government employees (151 | 9.8%), and state government employees (117 | 7.6%) make up the most common classes of employment.
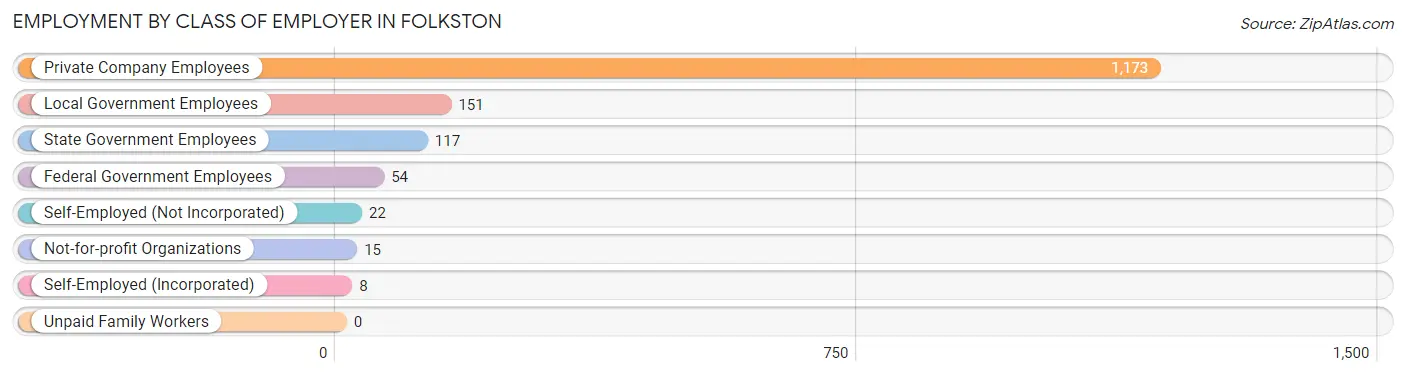
| Employer Class | # Employees | % Employees |
| Private Company Employees | 1,173 | 76.2% |
| Self-Employed (Incorporated) | 8 | 0.5% |
| Self-Employed (Not Incorporated) | 22 | 1.4% |
| Not-for-profit Organizations | 15 | 1.0% |
| Local Government Employees | 151 | 9.8% |
| State Government Employees | 117 | 7.6% |
| Federal Government Employees | 54 | 3.5% |
| Unpaid Family Workers | 0 | 0.0% |
| Total | 1,540 | 100.0% |
Employment Status by Age in Folkston
According to the labor force statistics for Folkston, out of the total population over 16 years of age (3,909), 47.8% or 1,869 individuals are in the labor force, with 17.1% or 320 of them unemployed. The age group with the highest labor force participation rate is 25 to 29 years, with 76.8% or 487 individuals in the labor force. Within the labor force, the 16 to 19 years age range has the highest percentage of unemployed individuals, with 100.0% or 37 of them being unemployed.
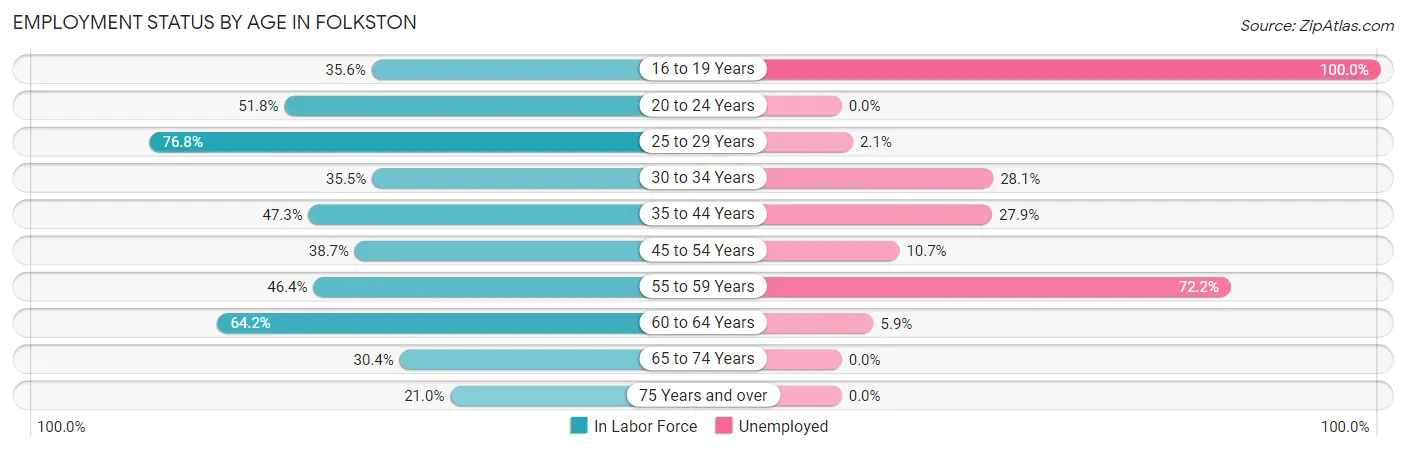
| Age Bracket | In Labor Force | Unemployed |
| 16 to 19 Years | 37 (35.6%) | 37 (100.0%) |
| 20 to 24 Years | 100 (51.8%) | 0 (0.0%) |
| 25 to 29 Years | 487 (76.8%) | 10 (2.1%) |
| 30 to 34 Years | 171 (35.5%) | 48 (28.1%) |
| 35 to 44 Years | 387 (47.3%) | 108 (27.9%) |
| 45 to 54 Years | 196 (38.7%) | 21 (10.7%) |
| 55 to 59 Years | 115 (46.4%) | 83 (72.2%) |
| 60 to 64 Years | 221 (64.2%) | 13 (5.9%) |
| 65 to 74 Years | 104 (30.4%) | 0 (0.0%) |
| 75 Years and over | 50 (21.0%) | 0 (0.0%) |
| Total | 1,869 (47.8%) | 320 (17.1%) |
Employment Status by Educational Attainment in Folkston
According to labor force statistics for Folkston, 52.0% of individuals (1,577) out of the total population between 25 and 64 years of age (3,032) are in the labor force, with 17.9% or 282 of them being unemployed. The group with the highest labor force participation rate are those with the educational attainment of bachelor's degree or higher, with 65.1% or 71 individuals in the labor force. Within the labor force, individuals with less than high school education have the highest percentage of unemployment, with 40.7% or 79 of them being unemployed.
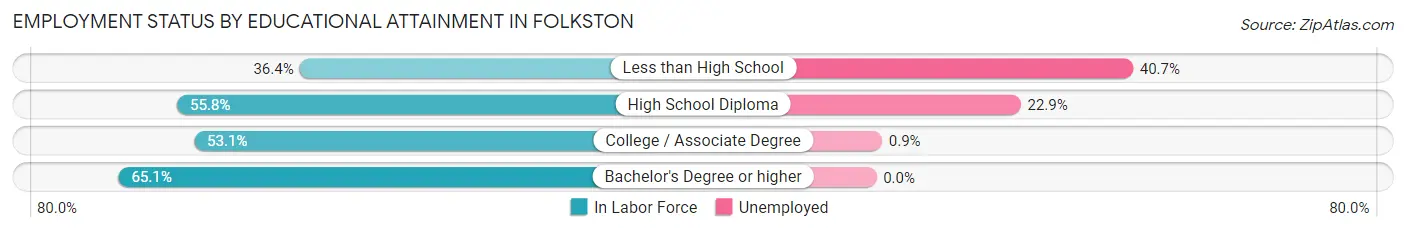
| Educational Attainment | In Labor Force | Unemployed |
| Less than High School | 194 (36.4%) | 217 (40.7%) |
| High School Diploma | 872 (55.8%) | 358 (22.9%) |
| College / Associate Degree | 440 (53.1%) | 7 (0.9%) |
| Bachelor's Degree or higher | 71 (65.1%) | 0 (0.0%) |
| Total | 1,577 (52.0%) | 543 (17.9%) |
Employment Occupations by Sex in Folkston
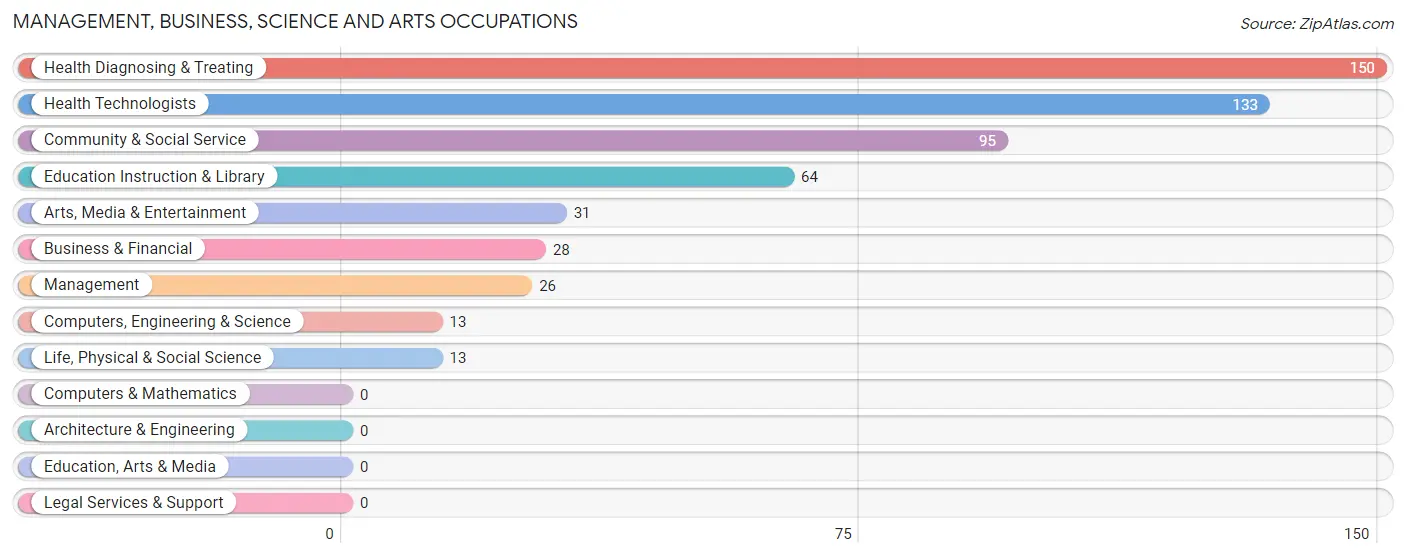
Management, Business, Science and Arts Occupations
The most common Management, Business, Science and Arts occupations in Folkston are Health Diagnosing & Treating (150 | 9.7%), Health Technologists (133 | 8.6%), Community & Social Service (95 | 6.1%), Education Instruction & Library (64 | 4.1%), and Arts, Media & Entertainment (31 | 2.0%).
Management, Business, Science and Arts Occupations by Sex
Within the Management, Business, Science and Arts occupations in Folkston, the most male-oriented occupations are Arts, Media & Entertainment (100.0%), Management (76.9%), and Community & Social Service (32.6%), while the most female-oriented occupations are Computers, Engineering & Science (100.0%), Life, Physical & Social Science (100.0%), and Education Instruction & Library (100.0%).
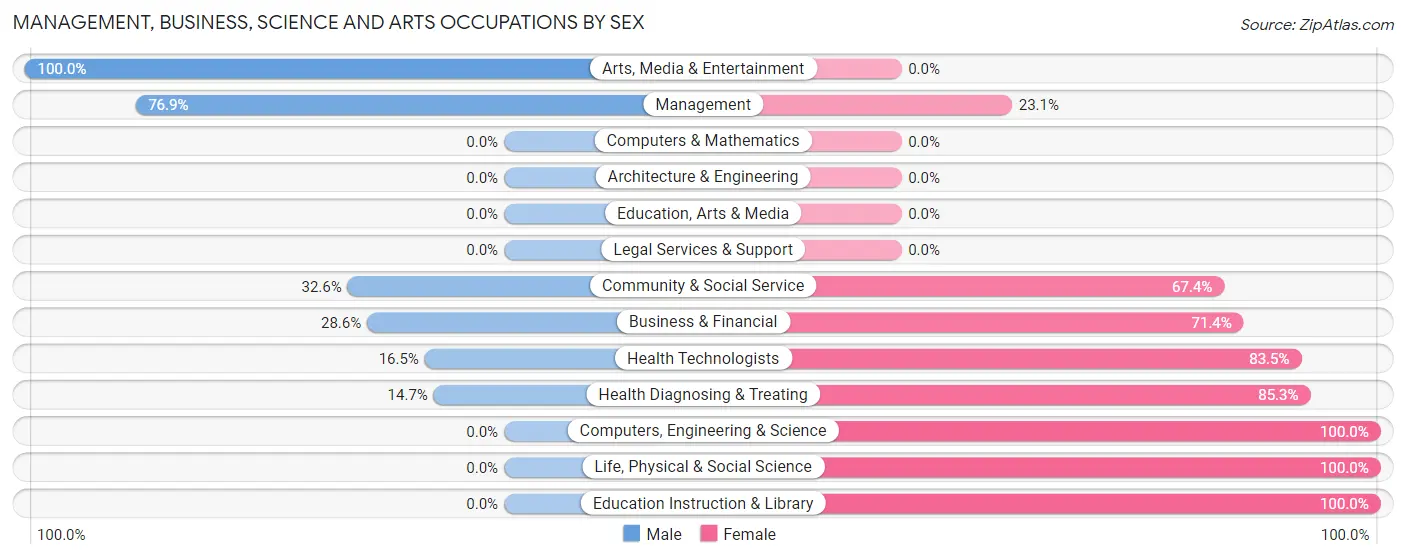
| Occupation | Male | Female |
| Management | 20 (76.9%) | 6 (23.1%) |
| Business & Financial | 8 (28.6%) | 20 (71.4%) |
| Computers, Engineering & Science | 0 (0.0%) | 13 (100.0%) |
| Computers & Mathematics | 0 (0.0%) | 0 (0.0%) |
| Architecture & Engineering | 0 (0.0%) | 0 (0.0%) |
| Life, Physical & Social Science | 0 (0.0%) | 13 (100.0%) |
| Community & Social Service | 31 (32.6%) | 64 (67.4%) |
| Education, Arts & Media | 0 (0.0%) | 0 (0.0%) |
| Legal Services & Support | 0 (0.0%) | 0 (0.0%) |
| Education Instruction & Library | 0 (0.0%) | 64 (100.0%) |
| Arts, Media & Entertainment | 31 (100.0%) | 0 (0.0%) |
| Health Diagnosing & Treating | 22 (14.7%) | 128 (85.3%) |
| Health Technologists | 22 (16.5%) | 111 (83.5%) |
| Total (Category) | 81 (26.0%) | 231 (74.0%) |
| Total (Overall) | 1,059 (68.4%) | 489 (31.6%) |
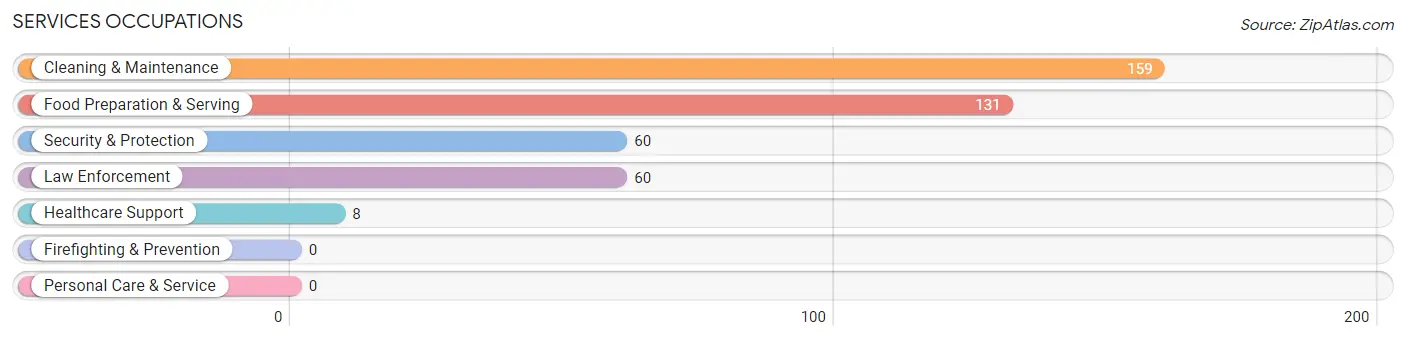
Services Occupations
The most common Services occupations in Folkston are Cleaning & Maintenance (159 | 10.3%), Food Preparation & Serving (131 | 8.5%), Security & Protection (60 | 3.9%), Law Enforcement (60 | 3.9%), and Healthcare Support (8 | 0.5%).
Services Occupations by Sex
Within the Services occupations in Folkston, the most male-oriented occupations are Security & Protection (100.0%), Law Enforcement (100.0%), and Cleaning & Maintenance (98.1%), while the most female-oriented occupations are Healthcare Support (100.0%), Food Preparation & Serving (39.7%), and Cleaning & Maintenance (1.9%).
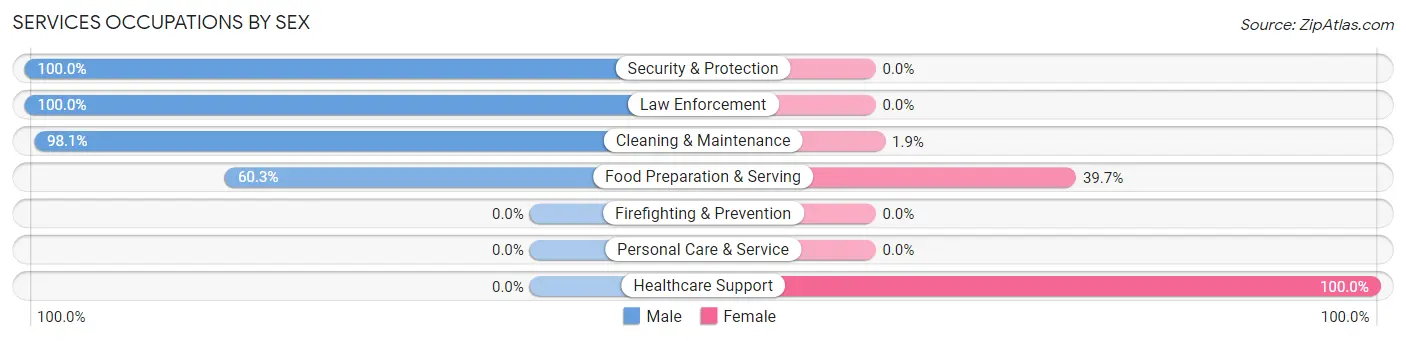
| Occupation | Male | Female |
| Healthcare Support | 0 (0.0%) | 8 (100.0%) |
| Security & Protection | 60 (100.0%) | 0 (0.0%) |
| Firefighting & Prevention | 0 (0.0%) | 0 (0.0%) |
| Law Enforcement | 60 (100.0%) | 0 (0.0%) |
| Food Preparation & Serving | 79 (60.3%) | 52 (39.7%) |
| Cleaning & Maintenance | 156 (98.1%) | 3 (1.9%) |
| Personal Care & Service | 0 (0.0%) | 0 (0.0%) |
| Total (Category) | 295 (82.4%) | 63 (17.6%) |
| Total (Overall) | 1,059 (68.4%) | 489 (31.6%) |
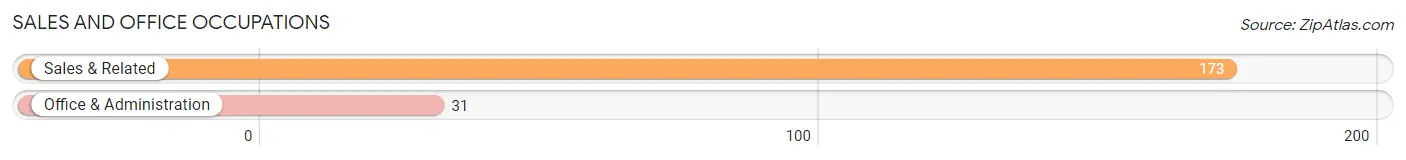
Sales and Office Occupations
The most common Sales and Office occupations in Folkston are Sales & Related (173 | 11.2%), and Office & Administration (31 | 2.0%).
Sales and Office Occupations by Sex
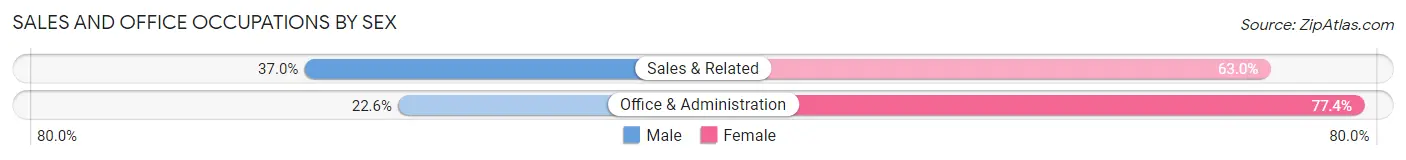
| Occupation | Male | Female |
| Sales & Related | 64 (37.0%) | 109 (63.0%) |
| Office & Administration | 7 (22.6%) | 24 (77.4%) |
| Total (Category) | 71 (34.8%) | 133 (65.2%) |
| Total (Overall) | 1,059 (68.4%) | 489 (31.6%) |
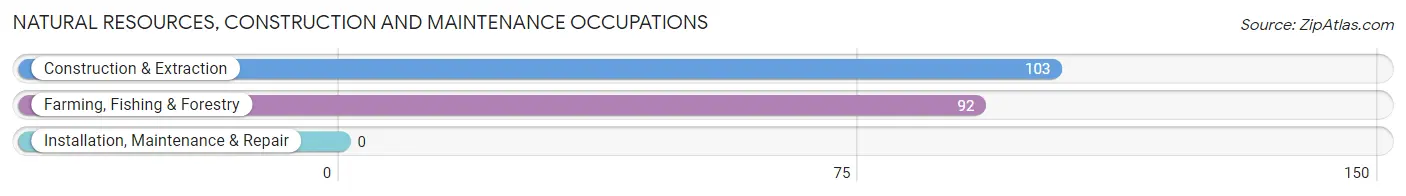
Natural Resources, Construction and Maintenance Occupations
The most common Natural Resources, Construction and Maintenance occupations in Folkston are Construction & Extraction (103 | 6.7%), and Farming, Fishing & Forestry (92 | 5.9%).
Natural Resources, Construction and Maintenance Occupations by Sex
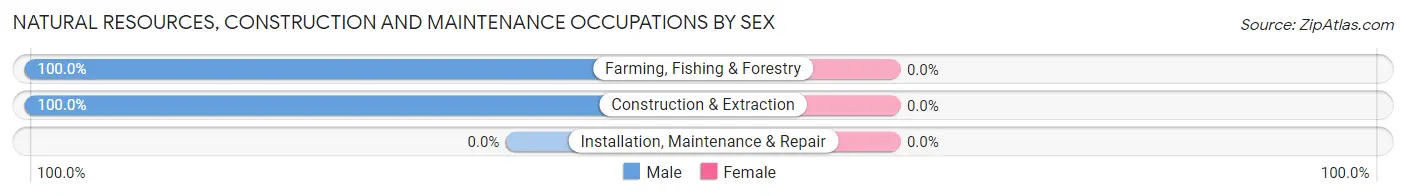
| Occupation | Male | Female |
| Farming, Fishing & Forestry | 92 (100.0%) | 0 (0.0%) |
| Construction & Extraction | 103 (100.0%) | 0 (0.0%) |
| Installation, Maintenance & Repair | 0 (0.0%) | 0 (0.0%) |
| Total (Category) | 195 (100.0%) | 0 (0.0%) |
| Total (Overall) | 1,059 (68.4%) | 489 (31.6%) |
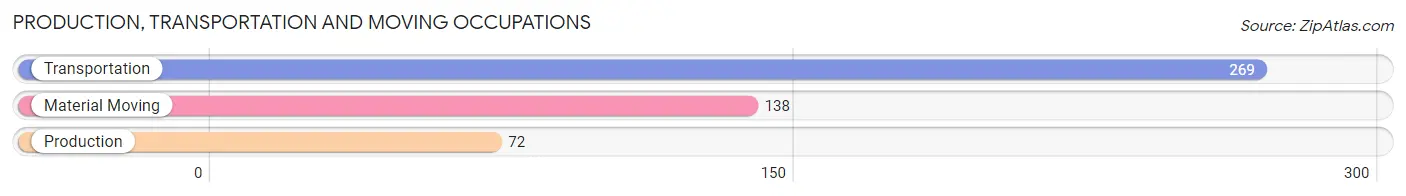
Production, Transportation and Moving Occupations
The most common Production, Transportation and Moving occupations in Folkston are Transportation (269 | 17.4%), Material Moving (138 | 8.9%), and Production (72 | 4.6%).
Production, Transportation and Moving Occupations by Sex
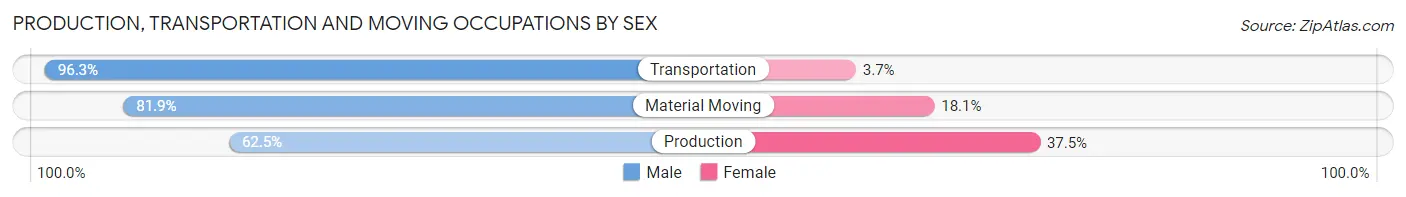
| Occupation | Male | Female |
| Production | 45 (62.5%) | 27 (37.5%) |
| Transportation | 259 (96.3%) | 10 (3.7%) |
| Material Moving | 113 (81.9%) | 25 (18.1%) |
| Total (Category) | 417 (87.1%) | 62 (12.9%) |
| Total (Overall) | 1,059 (68.4%) | 489 (31.6%) |
Employment Industries by Sex in Folkston
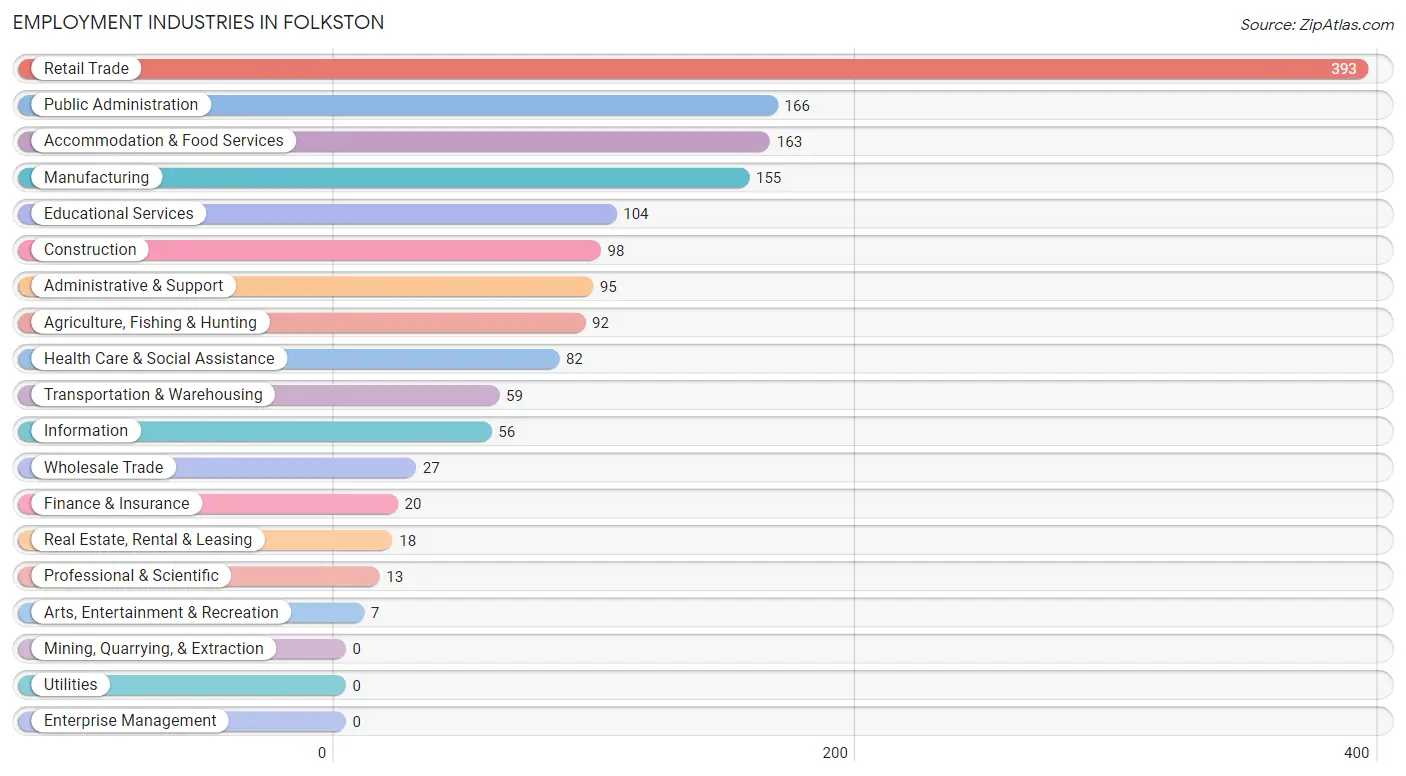
Employment Industries in Folkston
The major employment industries in Folkston include Retail Trade (393 | 25.4%), Public Administration (166 | 10.7%), Accommodation & Food Services (163 | 10.5%), Manufacturing (155 | 10.0%), and Educational Services (104 | 6.7%).
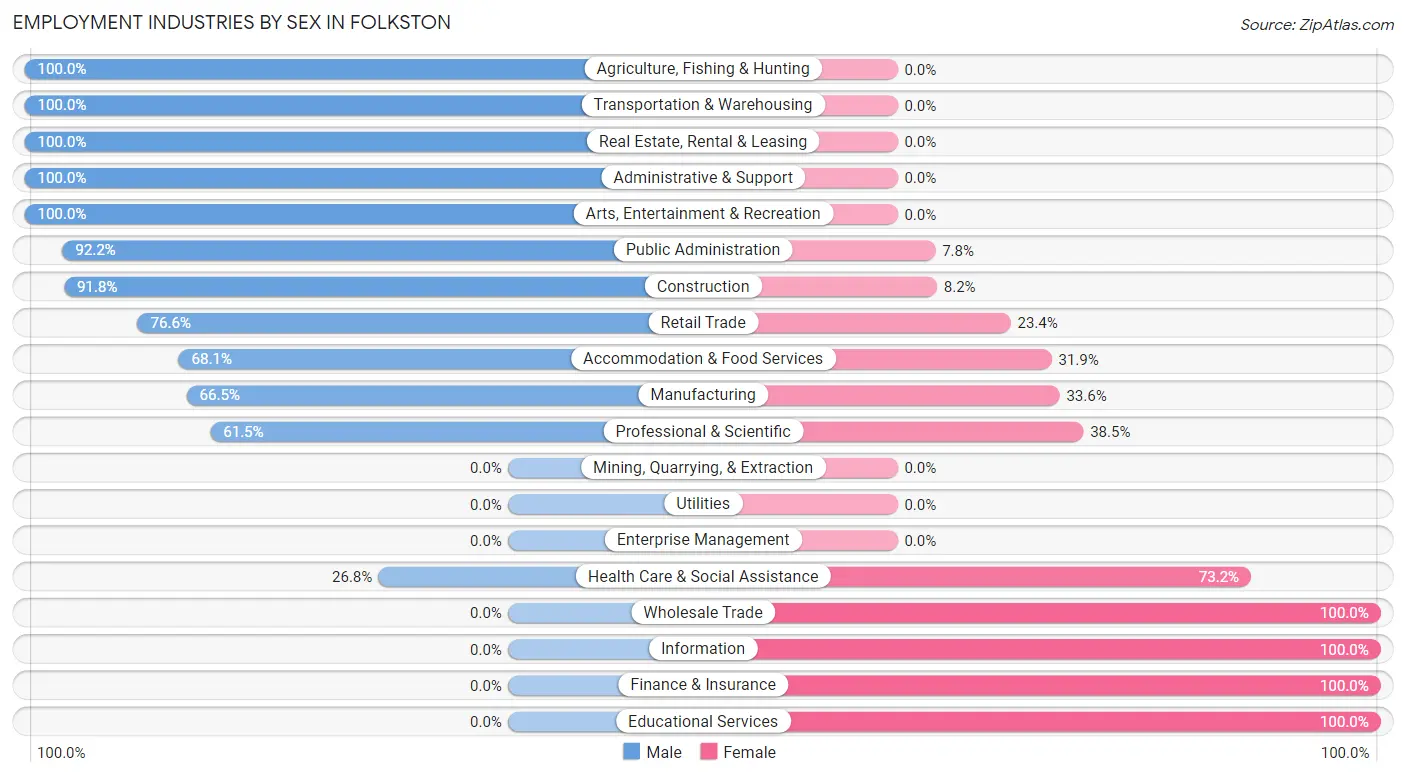
Employment Industries by Sex in Folkston
The Folkston industries that see more men than women are Agriculture, Fishing & Hunting (100.0%), Transportation & Warehousing (100.0%), and Real Estate, Rental & Leasing (100.0%), whereas the industries that tend to have a higher number of women are Wholesale Trade (100.0%), Information (100.0%), and Finance & Insurance (100.0%).
| Industry | Male | Female |
| Agriculture, Fishing & Hunting | 92 (100.0%) | 0 (0.0%) |
| Mining, Quarrying, & Extraction | 0 (0.0%) | 0 (0.0%) |
| Construction | 90 (91.8%) | 8 (8.2%) |
| Manufacturing | 103 (66.4%) | 52 (33.6%) |
| Wholesale Trade | 0 (0.0%) | 27 (100.0%) |
| Retail Trade | 301 (76.6%) | 92 (23.4%) |
| Transportation & Warehousing | 59 (100.0%) | 0 (0.0%) |
| Utilities | 0 (0.0%) | 0 (0.0%) |
| Information | 0 (0.0%) | 56 (100.0%) |
| Finance & Insurance | 0 (0.0%) | 20 (100.0%) |
| Real Estate, Rental & Leasing | 18 (100.0%) | 0 (0.0%) |
| Professional & Scientific | 8 (61.5%) | 5 (38.5%) |
| Enterprise Management | 0 (0.0%) | 0 (0.0%) |
| Administrative & Support | 95 (100.0%) | 0 (0.0%) |
| Educational Services | 0 (0.0%) | 104 (100.0%) |
| Health Care & Social Assistance | 22 (26.8%) | 60 (73.2%) |
| Arts, Entertainment & Recreation | 7 (100.0%) | 0 (0.0%) |
| Accommodation & Food Services | 111 (68.1%) | 52 (31.9%) |
| Public Administration | 153 (92.2%) | 13 (7.8%) |
| Total | 1,059 (68.4%) | 489 (31.6%) |
Education in Folkston
School Enrollment in Folkston
The most common levels of schooling among the 758 students in Folkston are college / undergraduate (218 | 28.8%), elementary school (152 | 20.1%), and middle school (136 | 17.9%).
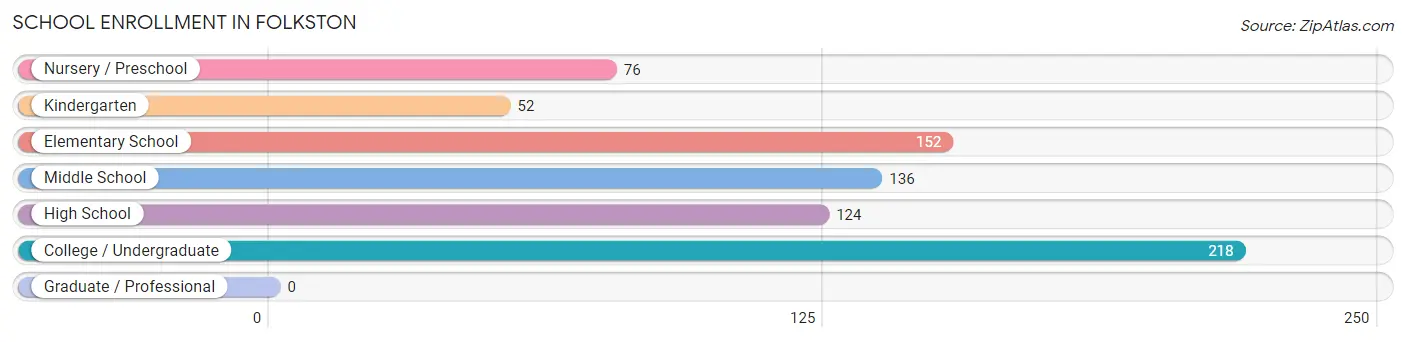
| School Level | # Students | % Students |
| Nursery / Preschool | 76 | 10.0% |
| Kindergarten | 52 | 6.9% |
| Elementary School | 152 | 20.1% |
| Middle School | 136 | 17.9% |
| High School | 124 | 16.4% |
| College / Undergraduate | 218 | 28.8% |
| Graduate / Professional | 0 | 0.0% |
| Total | 758 | 100.0% |
School Enrollment by Age by Funding Source in Folkston
Out of a total of 758 students who are enrolled in schools in Folkston, 59 (7.8%) attend a private institution, while the remaining 699 (92.2%) are enrolled in public schools. The age group of 20 to 24 year olds has the highest likelihood of being enrolled in private schools, with 27 (27.8% in the age bracket) enrolled. Conversely, the age group of 3 to 4 year olds has the lowest likelihood of being enrolled in a private school, with 76 (100.0% in the age bracket) attending a public institution.
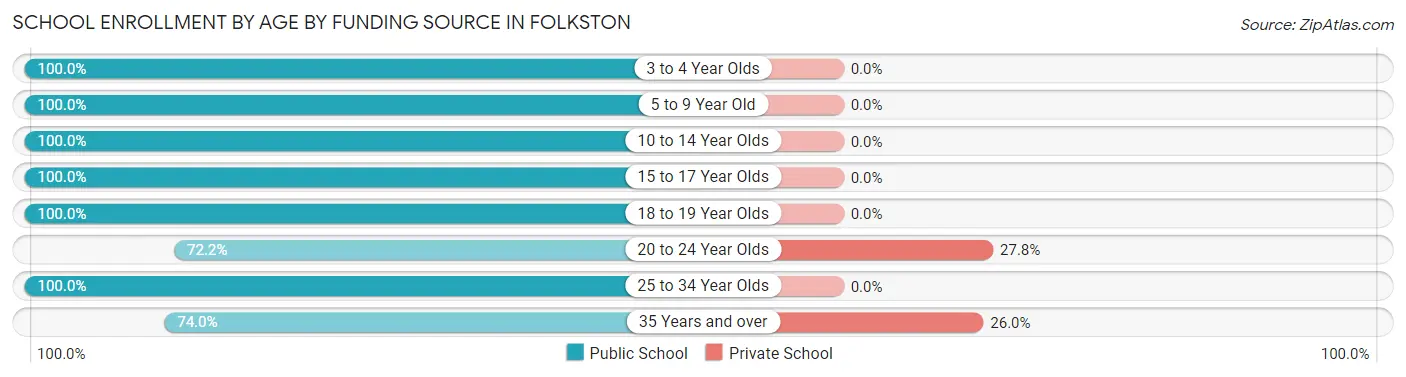
| Age Bracket | Public School | Private School |
| 3 to 4 Year Olds | 76 (100.0%) | 0 (0.0%) |
| 5 to 9 Year Old | 204 (100.0%) | 0 (0.0%) |
| 10 to 14 Year Olds | 115 (100.0%) | 0 (0.0%) |
| 15 to 17 Year Olds | 11 (100.0%) | 0 (0.0%) |
| 18 to 19 Year Olds | 104 (100.0%) | 0 (0.0%) |
| 20 to 24 Year Olds | 70 (72.2%) | 27 (27.8%) |
| 25 to 34 Year Olds | 28 (100.0%) | 0 (0.0%) |
| 35 Years and over | 91 (74.0%) | 32 (26.0%) |
| Total | 699 (92.2%) | 59 (7.8%) |
Educational Attainment by Field of Study in Folkston
Education (69 | 36.3%), science & technology (44 | 23.2%), business (39 | 20.5%), bio, nature & agricultural (12 | 6.3%), and engineering (8 | 4.2%) are the most common fields of study among 190 individuals in Folkston who have obtained a bachelor's degree or higher.
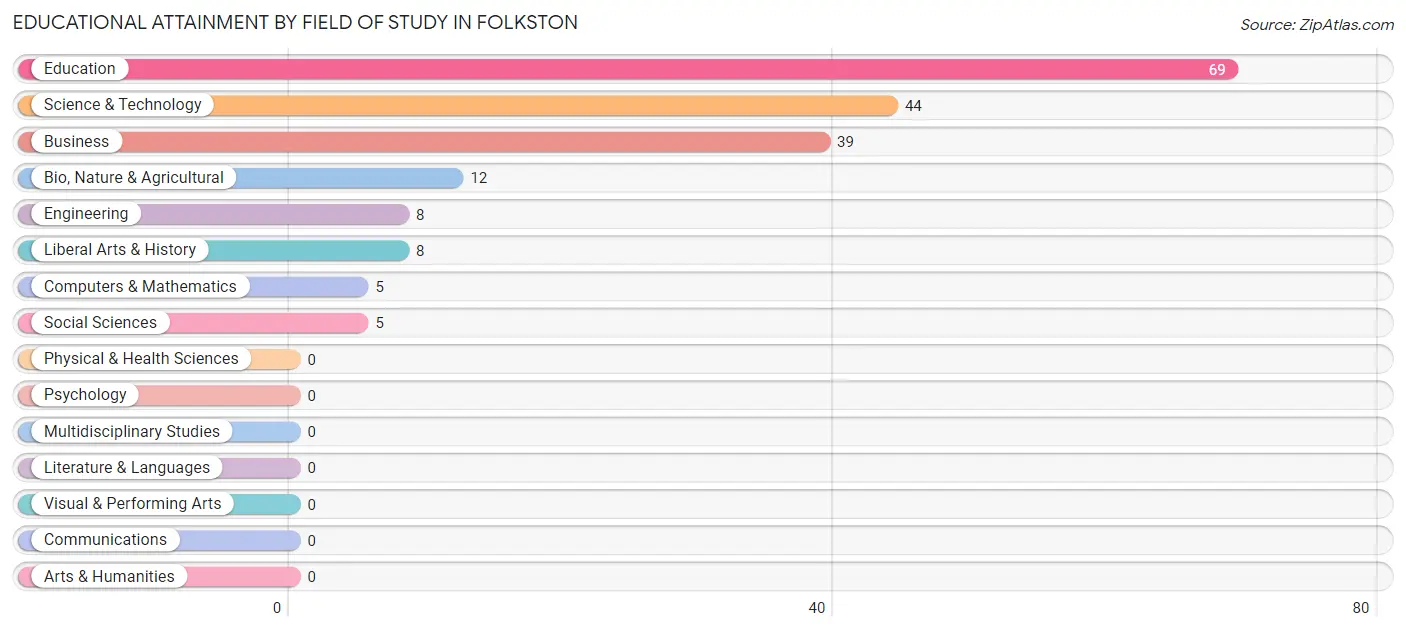
| Field of Study | # Graduates | % Graduates |
| Computers & Mathematics | 5 | 2.6% |
| Bio, Nature & Agricultural | 12 | 6.3% |
| Physical & Health Sciences | 0 | 0.0% |
| Psychology | 0 | 0.0% |
| Social Sciences | 5 | 2.6% |
| Engineering | 8 | 4.2% |
| Multidisciplinary Studies | 0 | 0.0% |
| Science & Technology | 44 | 23.2% |
| Business | 39 | 20.5% |
| Education | 69 | 36.3% |
| Literature & Languages | 0 | 0.0% |
| Liberal Arts & History | 8 | 4.2% |
| Visual & Performing Arts | 0 | 0.0% |
| Communications | 0 | 0.0% |
| Arts & Humanities | 0 | 0.0% |
| Total | 190 | 100.0% |
Transportation & Commute in Folkston
Vehicle Availability by Sex in Folkston
The most prevalent vehicle ownership categories in Folkston are males with 3 vehicles (392, accounting for 37.0%) and females with 3 vehicles (113, making up 81.5%).
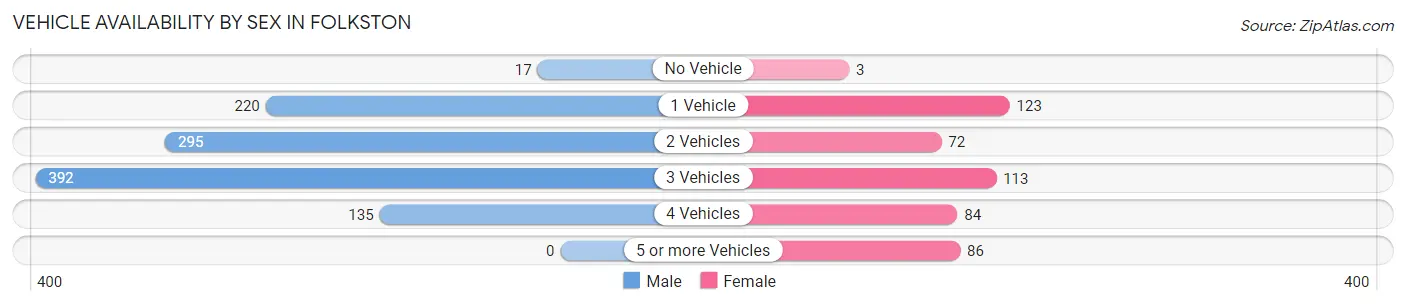
| Vehicles Available | Male | Female |
| No Vehicle | 17 (1.6%) | 3 (0.6%) |
| 1 Vehicle | 220 (20.8%) | 123 (25.6%) |
| 2 Vehicles | 295 (27.9%) | 72 (15.0%) |
| 3 Vehicles | 392 (37.0%) | 113 (23.5%) |
| 4 Vehicles | 135 (12.8%) | 84 (17.5%) |
| 5 or more Vehicles | 0 (0.0%) | 86 (17.9%) |
| Total | 1,059 (100.0%) | 481 (100.0%) |
Commute Time in Folkston
The most frequently occuring commute durations in Folkston are 5 to 9 minutes (516 commuters, 33.9%), 45 to 59 minutes (357 commuters, 23.4%), and 10 to 14 minutes (251 commuters, 16.5%).
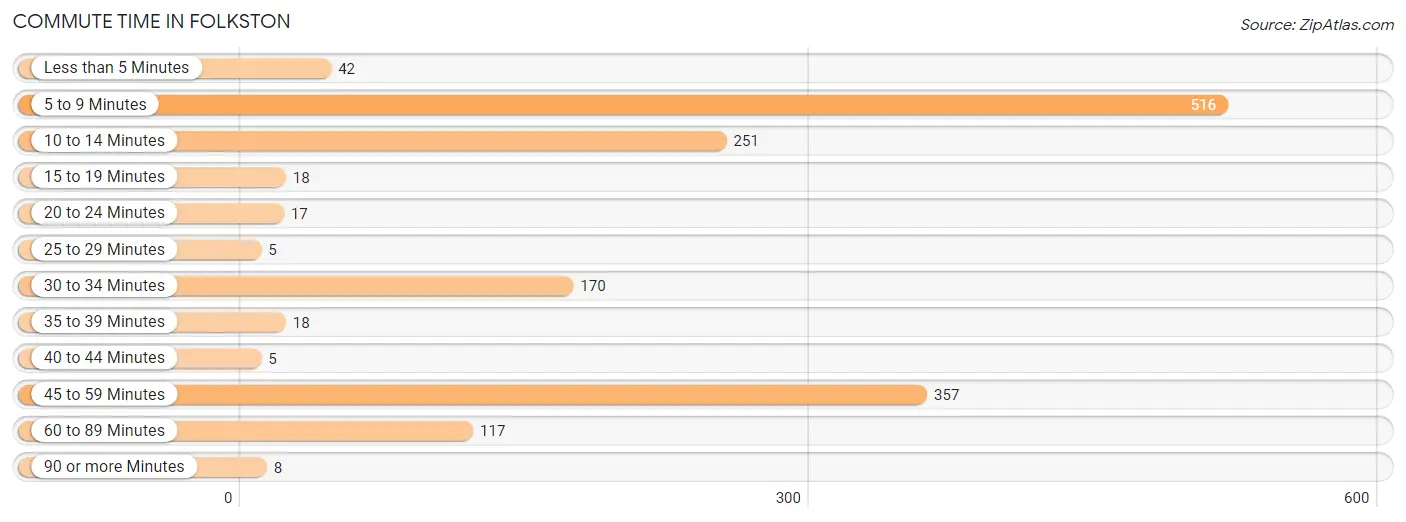
| Commute Time | # Commuters | % Commuters |
| Less than 5 Minutes | 42 | 2.8% |
| 5 to 9 Minutes | 516 | 33.9% |
| 10 to 14 Minutes | 251 | 16.5% |
| 15 to 19 Minutes | 18 | 1.2% |
| 20 to 24 Minutes | 17 | 1.1% |
| 25 to 29 Minutes | 5 | 0.3% |
| 30 to 34 Minutes | 170 | 11.2% |
| 35 to 39 Minutes | 18 | 1.2% |
| 40 to 44 Minutes | 5 | 0.3% |
| 45 to 59 Minutes | 357 | 23.4% |
| 60 to 89 Minutes | 117 | 7.7% |
| 90 or more Minutes | 8 | 0.5% |
Commute Time by Sex in Folkston
The most common commute times in Folkston are 45 to 59 minutes (337 commuters, 32.1%) for males and 5 to 9 minutes (234 commuters, 49.5%) for females.
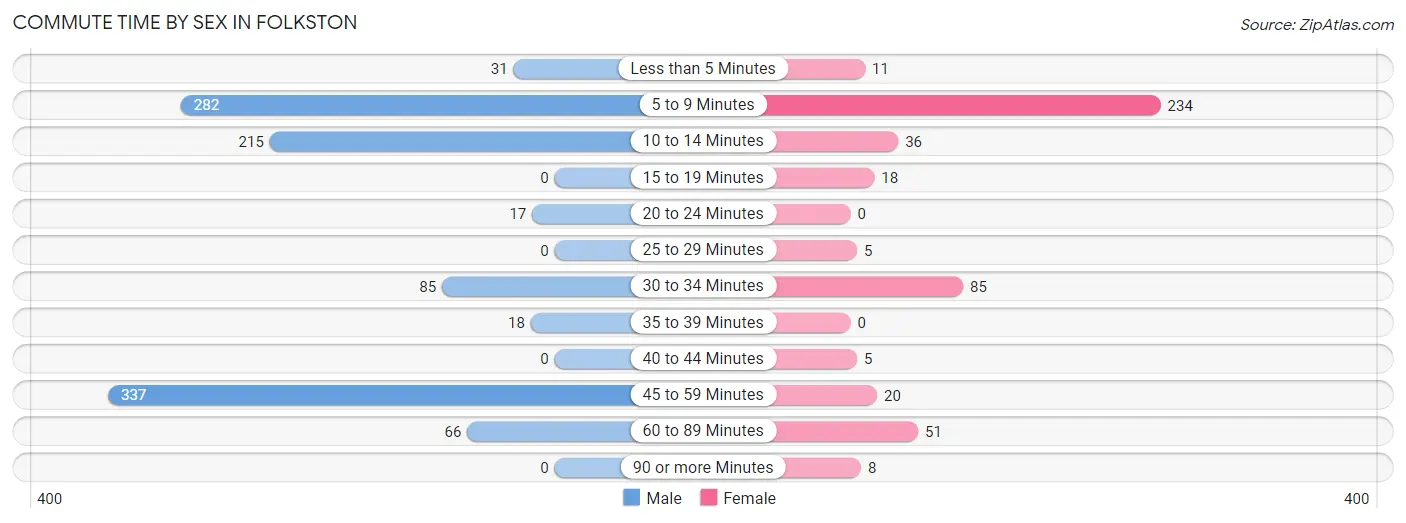
| Commute Time | Male | Female |
| Less than 5 Minutes | 31 (2.9%) | 11 (2.3%) |
| 5 to 9 Minutes | 282 (26.8%) | 234 (49.5%) |
| 10 to 14 Minutes | 215 (20.5%) | 36 (7.6%) |
| 15 to 19 Minutes | 0 (0.0%) | 18 (3.8%) |
| 20 to 24 Minutes | 17 (1.6%) | 0 (0.0%) |
| 25 to 29 Minutes | 0 (0.0%) | 5 (1.1%) |
| 30 to 34 Minutes | 85 (8.1%) | 85 (18.0%) |
| 35 to 39 Minutes | 18 (1.7%) | 0 (0.0%) |
| 40 to 44 Minutes | 0 (0.0%) | 5 (1.1%) |
| 45 to 59 Minutes | 337 (32.1%) | 20 (4.2%) |
| 60 to 89 Minutes | 66 (6.3%) | 51 (10.8%) |
| 90 or more Minutes | 0 (0.0%) | 8 (1.7%) |
Time of Departure to Work by Sex in Folkston
The most frequent times of departure to work in Folkston are 8:00 AM to 8:29 AM (268, 25.5%) for males and 7:00 AM to 7:29 AM (171, 36.1%) for females.
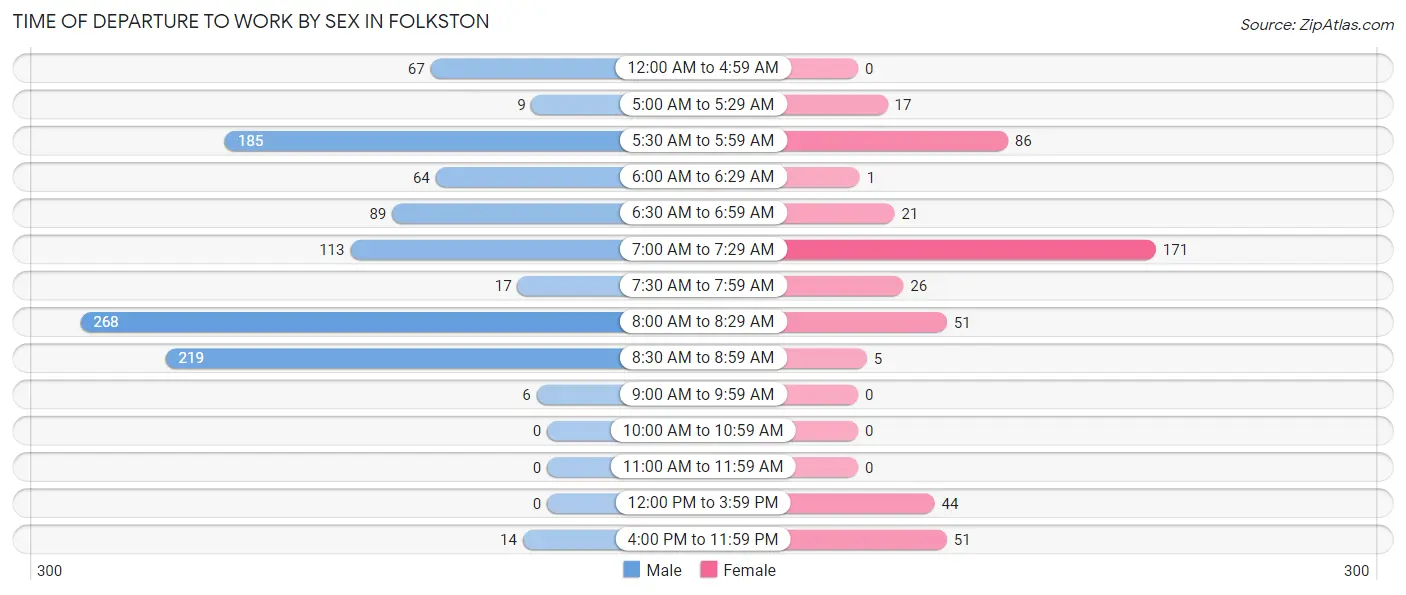
| Time of Departure | Male | Female |
| 12:00 AM to 4:59 AM | 67 (6.4%) | 0 (0.0%) |
| 5:00 AM to 5:29 AM | 9 (0.9%) | 17 (3.6%) |
| 5:30 AM to 5:59 AM | 185 (17.6%) | 86 (18.2%) |
| 6:00 AM to 6:29 AM | 64 (6.1%) | 1 (0.2%) |
| 6:30 AM to 6:59 AM | 89 (8.5%) | 21 (4.4%) |
| 7:00 AM to 7:29 AM | 113 (10.7%) | 171 (36.1%) |
| 7:30 AM to 7:59 AM | 17 (1.6%) | 26 (5.5%) |
| 8:00 AM to 8:29 AM | 268 (25.5%) | 51 (10.8%) |
| 8:30 AM to 8:59 AM | 219 (20.8%) | 5 (1.1%) |
| 9:00 AM to 9:59 AM | 6 (0.6%) | 0 (0.0%) |
| 10:00 AM to 10:59 AM | 0 (0.0%) | 0 (0.0%) |
| 11:00 AM to 11:59 AM | 0 (0.0%) | 0 (0.0%) |
| 12:00 PM to 3:59 PM | 0 (0.0%) | 44 (9.3%) |
| 4:00 PM to 11:59 PM | 14 (1.3%) | 51 (10.8%) |
| Total | 1,051 (100.0%) | 473 (100.0%) |
Housing Occupancy in Folkston
Occupancy by Ownership in Folkston
Of the total 1,404 dwellings in Folkston, owner-occupied units account for 731 (52.1%), while renter-occupied units make up 673 (47.9%).
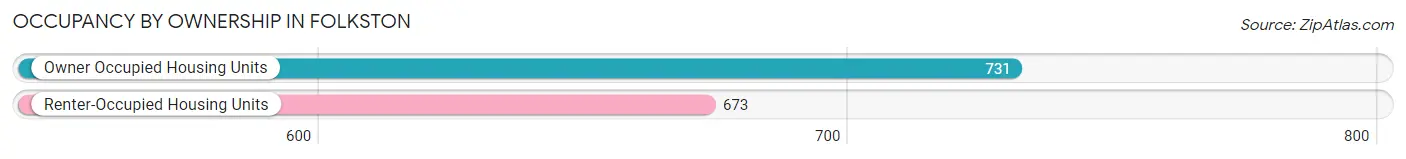
| Occupancy | # Housing Units | % Housing Units |
| Owner Occupied Housing Units | 731 | 52.1% |
| Renter-Occupied Housing Units | 673 | 47.9% |
| Total Occupied Housing Units | 1,404 | 100.0% |
Occupancy by Household Size in Folkston
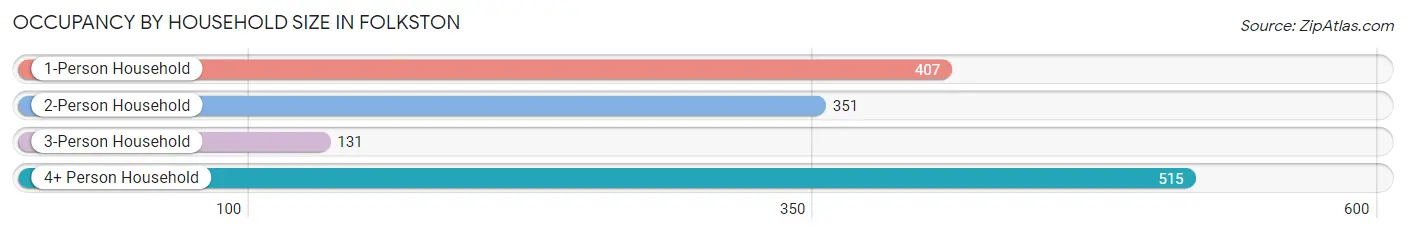
| Household Size | # Housing Units | % Housing Units |
| 1-Person Household | 407 | 29.0% |
| 2-Person Household | 351 | 25.0% |
| 3-Person Household | 131 | 9.3% |
| 4+ Person Household | 515 | 36.7% |
| Total Housing Units | 1,404 | 100.0% |
Occupancy by Ownership by Household Size in Folkston
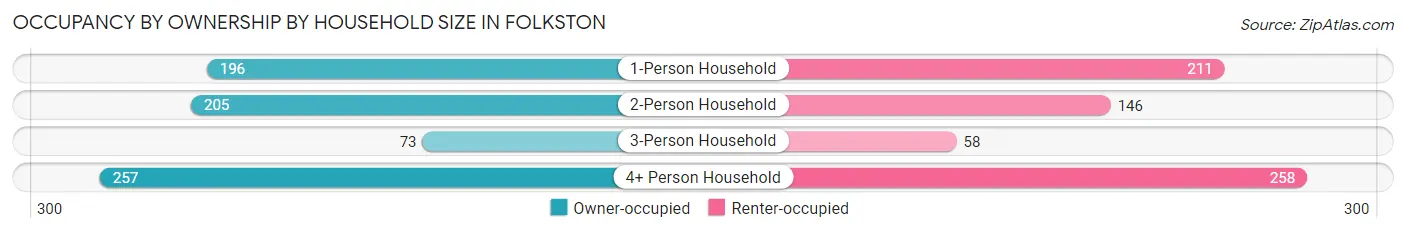
| Household Size | Owner-occupied | Renter-occupied |
| 1-Person Household | 196 (48.2%) | 211 (51.8%) |
| 2-Person Household | 205 (58.4%) | 146 (41.6%) |
| 3-Person Household | 73 (55.7%) | 58 (44.3%) |
| 4+ Person Household | 257 (49.9%) | 258 (50.1%) |
| Total Housing Units | 731 (52.1%) | 673 (47.9%) |
Occupancy by Educational Attainment in Folkston
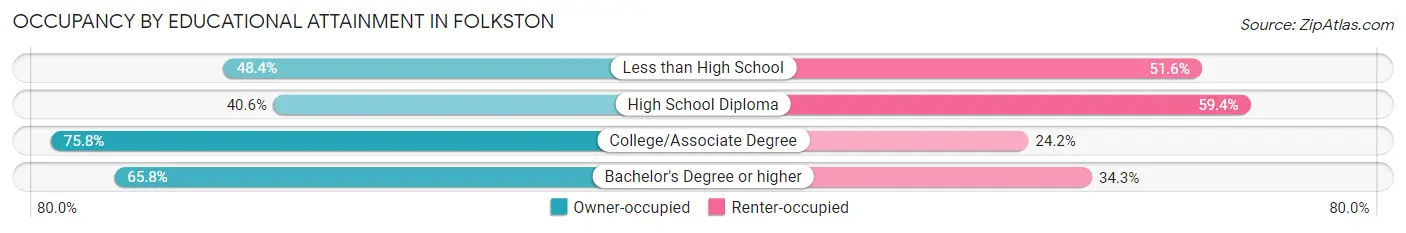
| Household Size | Owner-occupied | Renter-occupied |
| Less than High School | 151 (48.4%) | 161 (51.6%) |
| High School Diploma | 278 (40.6%) | 406 (59.4%) |
| College/Associate Degree | 254 (75.8%) | 81 (24.2%) |
| Bachelor's Degree or higher | 48 (65.7%) | 25 (34.3%) |
Occupancy by Age of Householder in Folkston
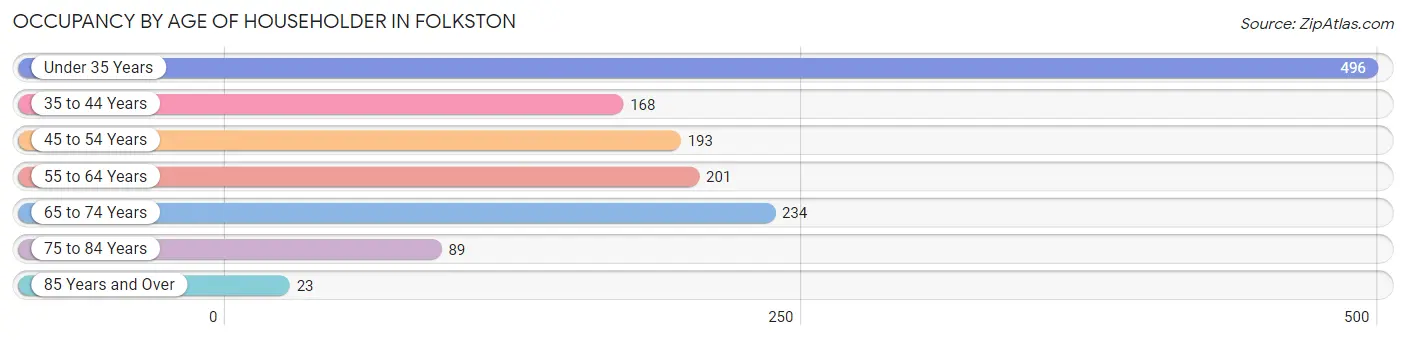
| Age Bracket | # Households | % Households |
| Under 35 Years | 496 | 35.3% |
| 35 to 44 Years | 168 | 12.0% |
| 45 to 54 Years | 193 | 13.8% |
| 55 to 64 Years | 201 | 14.3% |
| 65 to 74 Years | 234 | 16.7% |
| 75 to 84 Years | 89 | 6.3% |
| 85 Years and Over | 23 | 1.6% |
| Total | 1,404 | 100.0% |
Housing Finances in Folkston
Median Income by Occupancy in Folkston
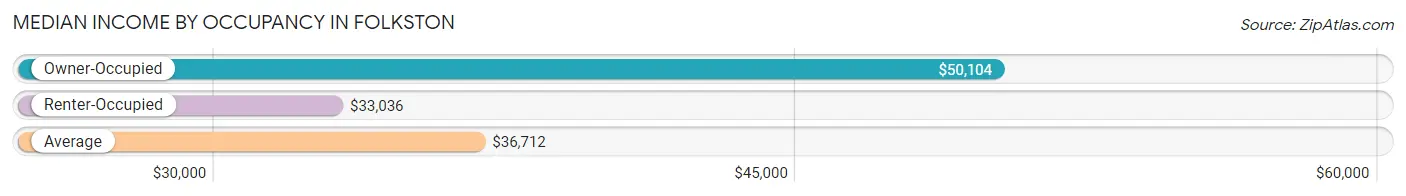
| Occupancy Type | # Households | Median Income |
| Owner-Occupied | 731 (52.1%) | $50,104 |
| Renter-Occupied | 673 (47.9%) | $33,036 |
| Average | 1,404 (100.0%) | $36,712 |
Occupancy by Householder Income Bracket in Folkston
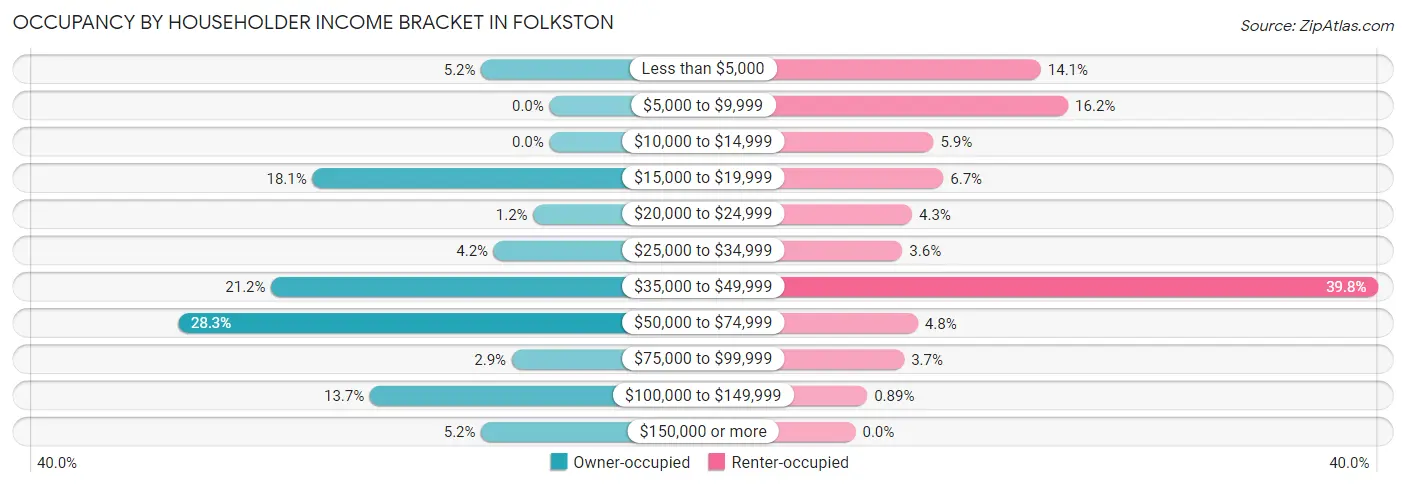
| Income Bracket | Owner-occupied | Renter-occupied |
| Less than $5,000 | 38 (5.2%) | 95 (14.1%) |
| $5,000 to $9,999 | 0 (0.0%) | 109 (16.2%) |
| $10,000 to $14,999 | 0 (0.0%) | 40 (5.9%) |
| $15,000 to $19,999 | 132 (18.1%) | 45 (6.7%) |
| $20,000 to $24,999 | 9 (1.2%) | 29 (4.3%) |
| $25,000 to $34,999 | 31 (4.2%) | 24 (3.6%) |
| $35,000 to $49,999 | 155 (21.2%) | 268 (39.8%) |
| $50,000 to $74,999 | 207 (28.3%) | 32 (4.8%) |
| $75,000 to $99,999 | 21 (2.9%) | 25 (3.7%) |
| $100,000 to $149,999 | 100 (13.7%) | 6 (0.9%) |
| $150,000 or more | 38 (5.2%) | 0 (0.0%) |
| Total | 731 (100.0%) | 673 (100.0%) |
Monthly Housing Cost Tiers in Folkston
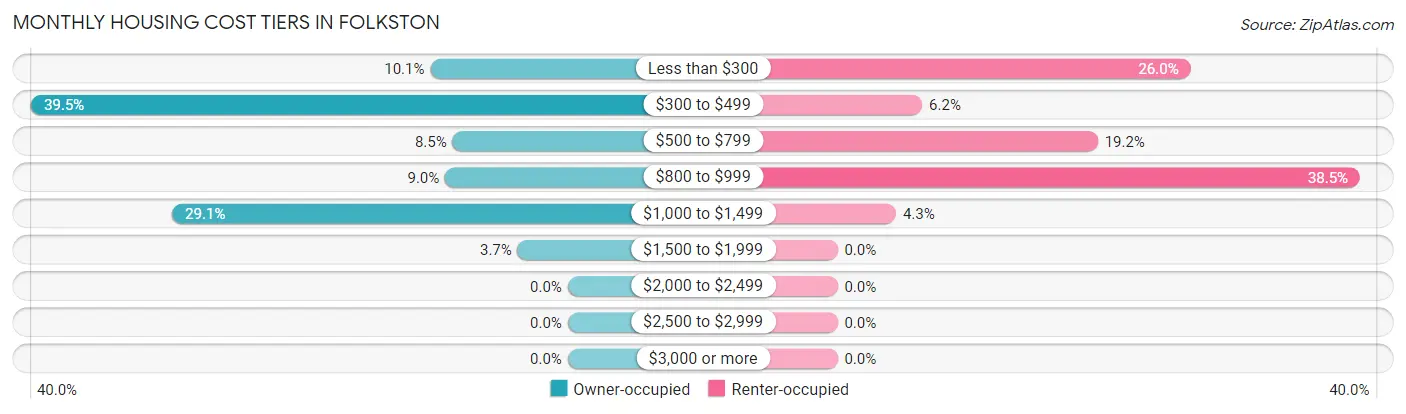
| Monthly Cost | Owner-occupied | Renter-occupied |
| Less than $300 | 74 (10.1%) | 175 (26.0%) |
| $300 to $499 | 289 (39.5%) | 42 (6.2%) |
| $500 to $799 | 62 (8.5%) | 129 (19.2%) |
| $800 to $999 | 66 (9.0%) | 259 (38.5%) |
| $1,000 to $1,499 | 213 (29.1%) | 29 (4.3%) |
| $1,500 to $1,999 | 27 (3.7%) | 0 (0.0%) |
| $2,000 to $2,499 | 0 (0.0%) | 0 (0.0%) |
| $2,500 to $2,999 | 0 (0.0%) | 0 (0.0%) |
| $3,000 or more | 0 (0.0%) | 0 (0.0%) |
| Total | 731 (100.0%) | 673 (100.0%) |
Physical Housing Characteristics in Folkston
Housing Structures in Folkston
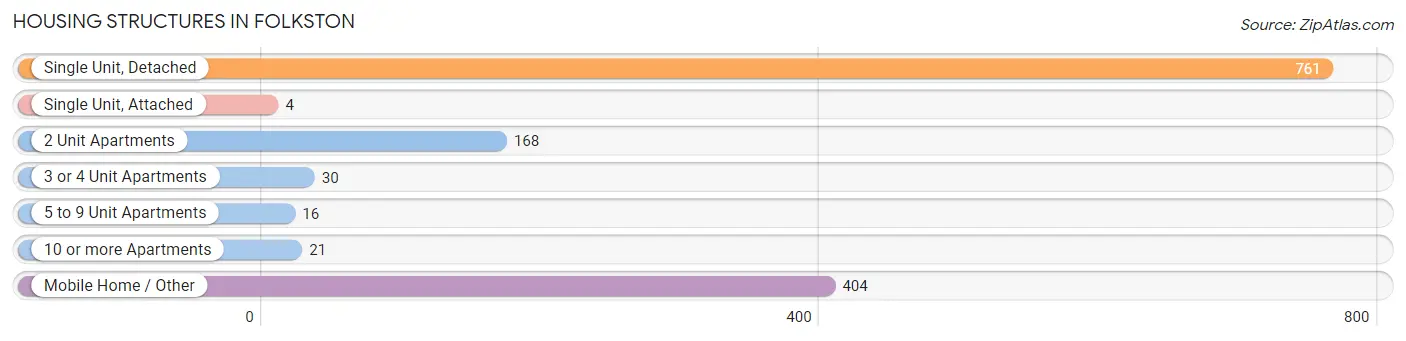
| Structure Type | # Housing Units | % Housing Units |
| Single Unit, Detached | 761 | 54.2% |
| Single Unit, Attached | 4 | 0.3% |
| 2 Unit Apartments | 168 | 12.0% |
| 3 or 4 Unit Apartments | 30 | 2.1% |
| 5 to 9 Unit Apartments | 16 | 1.1% |
| 10 or more Apartments | 21 | 1.5% |
| Mobile Home / Other | 404 | 28.8% |
| Total | 1,404 | 100.0% |
Housing Structures by Occupancy in Folkston
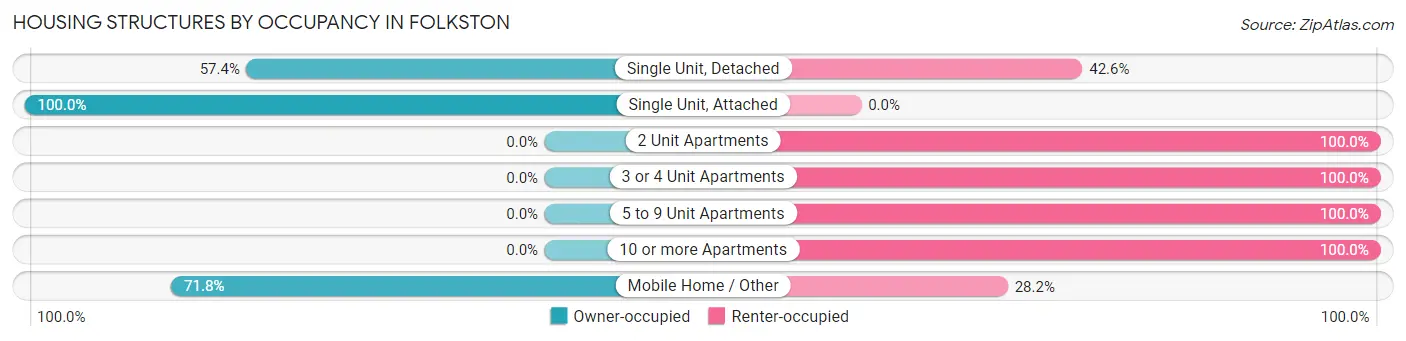
| Structure Type | Owner-occupied | Renter-occupied |
| Single Unit, Detached | 437 (57.4%) | 324 (42.6%) |
| Single Unit, Attached | 4 (100.0%) | 0 (0.0%) |
| 2 Unit Apartments | 0 (0.0%) | 168 (100.0%) |
| 3 or 4 Unit Apartments | 0 (0.0%) | 30 (100.0%) |
| 5 to 9 Unit Apartments | 0 (0.0%) | 16 (100.0%) |
| 10 or more Apartments | 0 (0.0%) | 21 (100.0%) |
| Mobile Home / Other | 290 (71.8%) | 114 (28.2%) |
| Total | 731 (52.1%) | 673 (47.9%) |
Housing Structures by Number of Rooms in Folkston
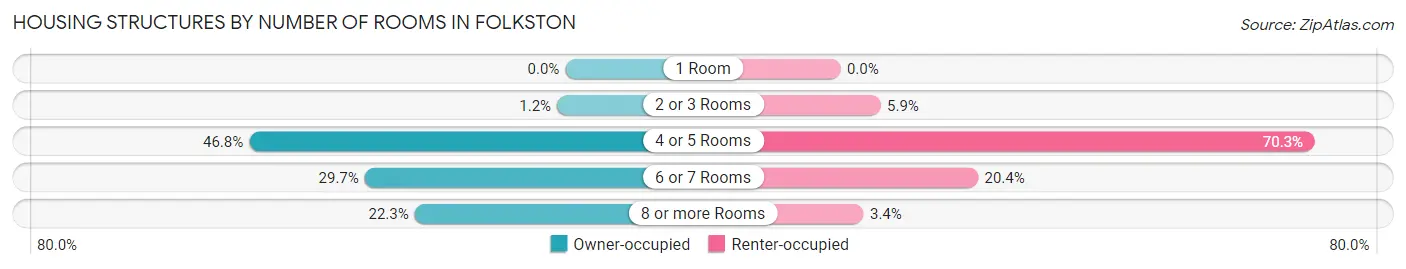
| Number of Rooms | Owner-occupied | Renter-occupied |
| 1 Room | 0 (0.0%) | 0 (0.0%) |
| 2 or 3 Rooms | 9 (1.2%) | 40 (5.9%) |
| 4 or 5 Rooms | 342 (46.8%) | 473 (70.3%) |
| 6 or 7 Rooms | 217 (29.7%) | 137 (20.4%) |
| 8 or more Rooms | 163 (22.3%) | 23 (3.4%) |
| Total | 731 (100.0%) | 673 (100.0%) |
Housing Structure by Heating Type in Folkston
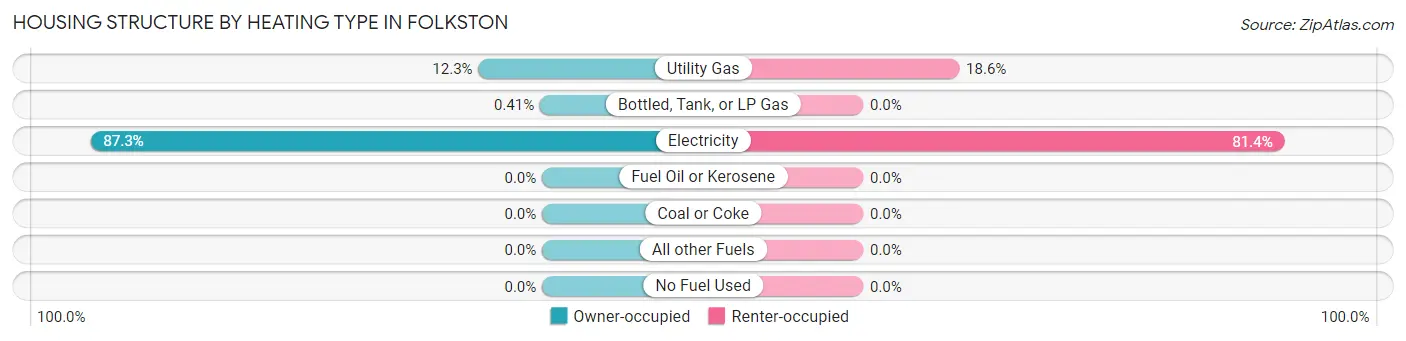
| Heating Type | Owner-occupied | Renter-occupied |
| Utility Gas | 90 (12.3%) | 125 (18.6%) |
| Bottled, Tank, or LP Gas | 3 (0.4%) | 0 (0.0%) |
| Electricity | 638 (87.3%) | 548 (81.4%) |
| Fuel Oil or Kerosene | 0 (0.0%) | 0 (0.0%) |
| Coal or Coke | 0 (0.0%) | 0 (0.0%) |
| All other Fuels | 0 (0.0%) | 0 (0.0%) |
| No Fuel Used | 0 (0.0%) | 0 (0.0%) |
| Total | 731 (100.0%) | 673 (100.0%) |
Household Vehicle Usage in Folkston
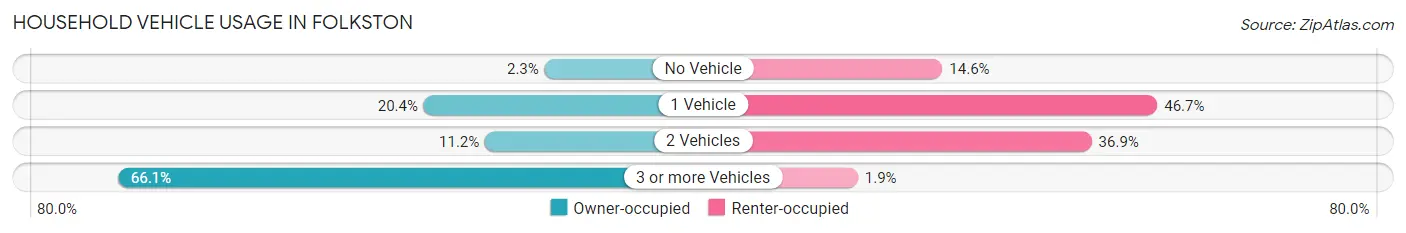
| Vehicles per Household | Owner-occupied | Renter-occupied |
| No Vehicle | 17 (2.3%) | 98 (14.6%) |
| 1 Vehicle | 149 (20.4%) | 314 (46.7%) |
| 2 Vehicles | 82 (11.2%) | 248 (36.8%) |
| 3 or more Vehicles | 483 (66.1%) | 13 (1.9%) |
| Total | 731 (100.0%) | 673 (100.0%) |
Real Estate & Mortgages in Folkston
Real Estate and Mortgage Overview in Folkston
| Characteristic | Without Mortgage | With Mortgage |
| Housing Units | 379 | 352 |
| Median Property Value | $33,000 | $180,200 |
| Median Household Income | $59,039 | $20 |
| Monthly Housing Costs | $426 | $0 |
| Real Estate Taxes | $250 | $54 |
Property Value by Mortgage Status in Folkston
| Property Value | Without Mortgage | With Mortgage |
| Less than $50,000 | 246 (64.9%) | 63 (17.9%) |
| $50,000 to $99,999 | 75 (19.8%) | 75 (21.3%) |
| $100,000 to $299,999 | 58 (15.3%) | 128 (36.4%) |
| $300,000 to $499,999 | 0 (0.0%) | 5 (1.4%) |
| $500,000 to $749,999 | 0 (0.0%) | 81 (23.0%) |
| $750,000 to $999,999 | 0 (0.0%) | 0 (0.0%) |
| $1,000,000 or more | 0 (0.0%) | 0 (0.0%) |
| Total | 379 (100.0%) | 352 (100.0%) |
Household Income by Mortgage Status in Folkston
| Household Income | Without Mortgage | With Mortgage |
| Less than $10,000 | 4 (1.1%) | 5 (1.4%) |
| $10,000 to $24,999 | 84 (22.2%) | 34 (9.7%) |
| $25,000 to $34,999 | 25 (6.6%) | 57 (16.2%) |
| $35,000 to $49,999 | 6 (1.6%) | 6 (1.7%) |
| $50,000 to $74,999 | 184 (48.5%) | 149 (42.3%) |
| $75,000 to $99,999 | 15 (4.0%) | 23 (6.5%) |
| $100,000 to $149,999 | 43 (11.4%) | 6 (1.7%) |
| $150,000 or more | 18 (4.8%) | 57 (16.2%) |
| Total | 379 (100.0%) | 352 (100.0%) |
Property Value to Household Income Ratio in Folkston
| Value-to-Income Ratio | Without Mortgage | With Mortgage |
| Less than 2.0x | 320 (84.4%) | 45,772 (13,003.4%) |
| 2.0x to 2.9x | 20 (5.3%) | 101 (28.7%) |
| 3.0x to 3.9x | 29 (7.6%) | 82 (23.3%) |
| 4.0x or more | 10 (2.6%) | 0 (0.0%) |
| Total | 379 (100.0%) | 352 (100.0%) |
Real Estate Taxes by Mortgage Status in Folkston
| Property Taxes | Without Mortgage | With Mortgage |
| Less than $800 | 213 (56.2%) | 34 (9.7%) |
| $800 to $1,499 | 50 (13.2%) | 80 (22.7%) |
| $800 to $1,499 | 43 (11.4%) | 183 (52.0%) |
| Total | 379 (100.0%) | 352 (100.0%) |
Health & Disability in Folkston
Health Insurance Coverage by Age in Folkston
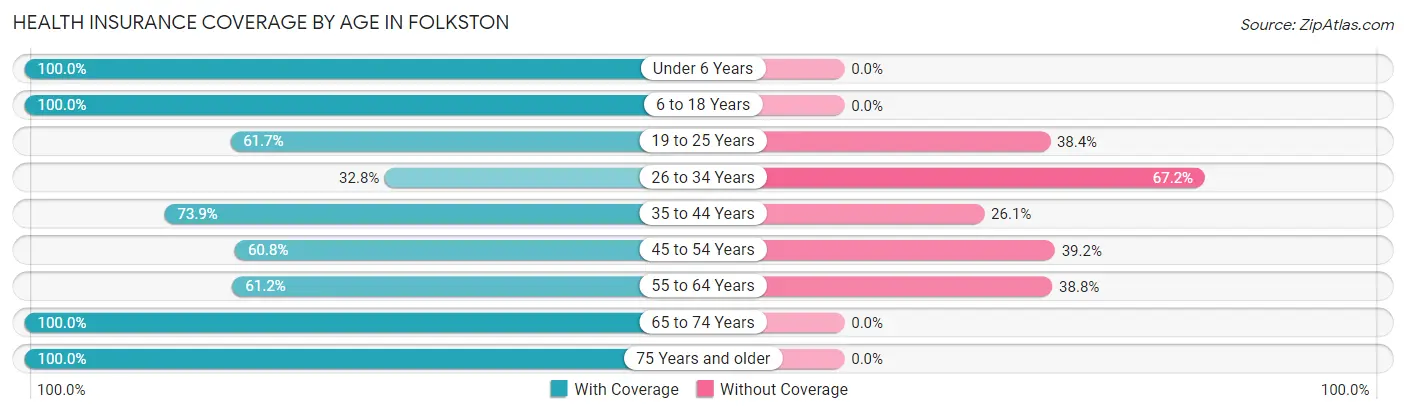
| Age Bracket | With Coverage | Without Coverage |
| Under 6 Years | 311 (100.0%) | 0 (0.0%) |
| 6 to 18 Years | 428 (100.0%) | 0 (0.0%) |
| 19 to 25 Years | 127 (61.7%) | 79 (38.4%) |
| 26 to 34 Years | 285 (32.8%) | 585 (67.2%) |
| 35 to 44 Years | 462 (73.9%) | 163 (26.1%) |
| 45 to 54 Years | 175 (60.8%) | 113 (39.2%) |
| 55 to 64 Years | 305 (61.2%) | 193 (38.8%) |
| 65 to 74 Years | 281 (100.0%) | 0 (0.0%) |
| 75 Years and older | 202 (100.0%) | 0 (0.0%) |
| Total | 2,576 (69.5%) | 1,133 (30.5%) |
Health Insurance Coverage by Citizenship Status in Folkston
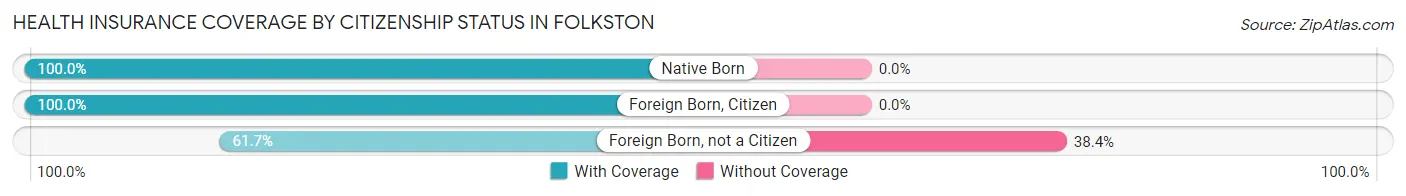
| Citizenship Status | With Coverage | Without Coverage |
| Native Born | 311 (100.0%) | 0 (0.0%) |
| Foreign Born, Citizen | 428 (100.0%) | 0 (0.0%) |
| Foreign Born, not a Citizen | 127 (61.7%) | 79 (38.4%) |
Health Insurance Coverage by Household Income in Folkston
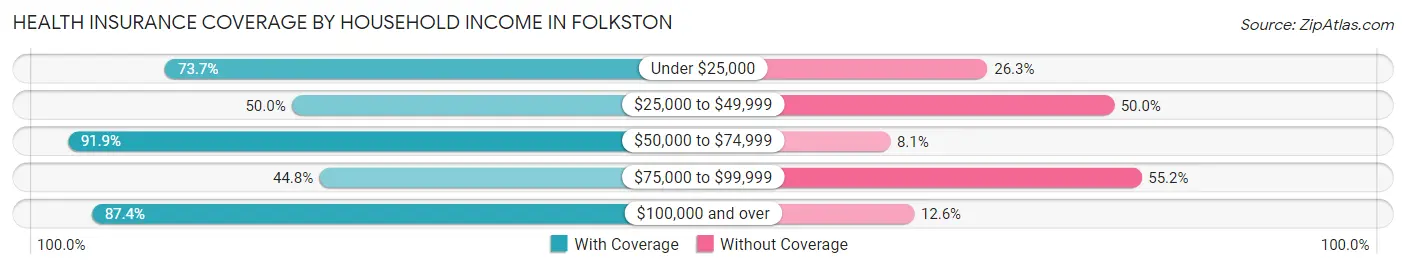
| Household Income | With Coverage | Without Coverage |
| Under $25,000 | 977 (73.7%) | 349 (26.3%) |
| $25,000 to $49,999 | 565 (50.0%) | 565 (50.0%) |
| $50,000 to $74,999 | 512 (91.9%) | 45 (8.1%) |
| $75,000 to $99,999 | 91 (44.8%) | 112 (55.2%) |
| $100,000 and over | 431 (87.4%) | 62 (12.6%) |
Public vs Private Health Insurance Coverage by Age in Folkston
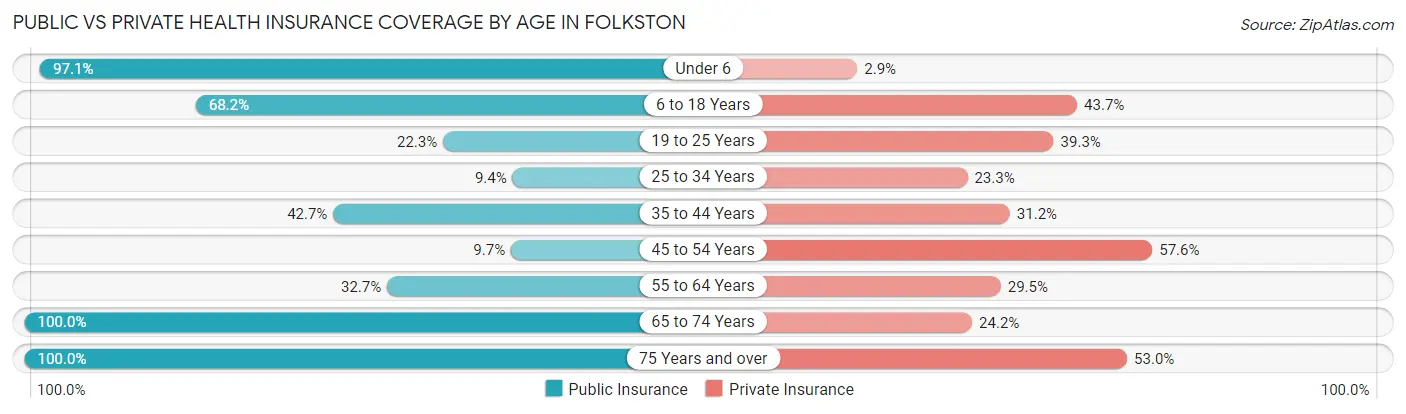
| Age Bracket | Public Insurance | Private Insurance |
| Under 6 | 302 (97.1%) | 9 (2.9%) |
| 6 to 18 Years | 292 (68.2%) | 187 (43.7%) |
| 19 to 25 Years | 46 (22.3%) | 81 (39.3%) |
| 25 to 34 Years | 82 (9.4%) | 203 (23.3%) |
| 35 to 44 Years | 267 (42.7%) | 195 (31.2%) |
| 45 to 54 Years | 28 (9.7%) | 166 (57.6%) |
| 55 to 64 Years | 163 (32.7%) | 147 (29.5%) |
| 65 to 74 Years | 281 (100.0%) | 68 (24.2%) |
| 75 Years and over | 202 (100.0%) | 107 (53.0%) |
| Total | 1,663 (44.8%) | 1,163 (31.4%) |
Disability Status by Sex by Age in Folkston
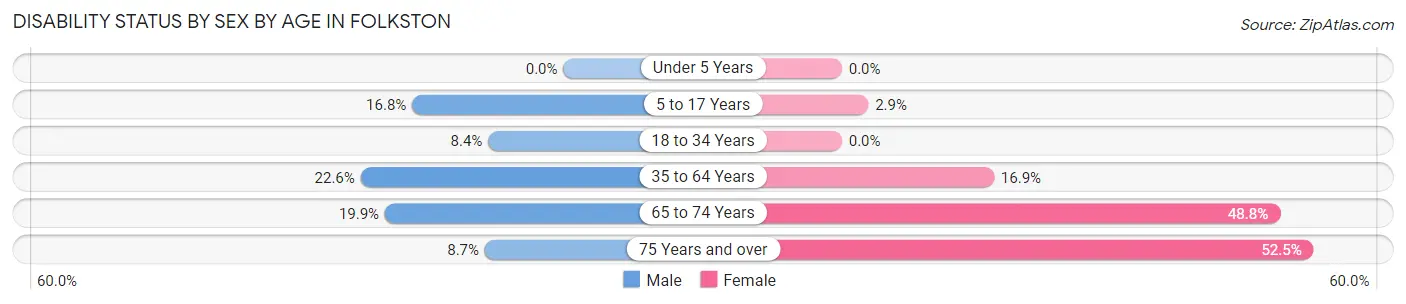
| Age Bracket | Male | Female |
| Under 5 Years | 0 (0.0%) | 0 (0.0%) |
| 5 to 17 Years | 16 (16.8%) | 8 (2.9%) |
| 18 to 34 Years | 72 (8.4%) | 0 (0.0%) |
| 35 to 64 Years | 156 (22.6%) | 122 (16.9%) |
| 65 to 74 Years | 31 (19.9%) | 61 (48.8%) |
| 75 Years and over | 9 (8.7%) | 52 (52.5%) |
Disability Class by Sex by Age in Folkston
Disability Class: Hearing Difficulty
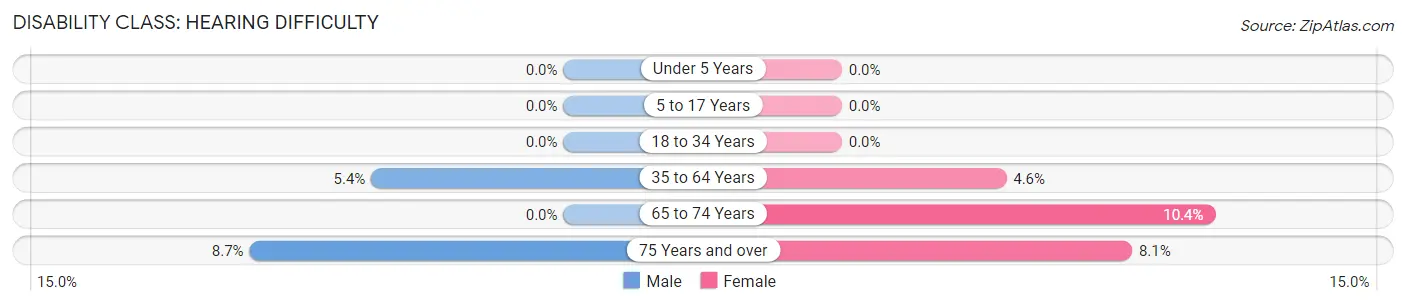
| Age Bracket | Male | Female |
| Under 5 Years | 0 (0.0%) | 0 (0.0%) |
| 5 to 17 Years | 0 (0.0%) | 0 (0.0%) |
| 18 to 34 Years | 0 (0.0%) | 0 (0.0%) |
| 35 to 64 Years | 37 (5.3%) | 33 (4.6%) |
| 65 to 74 Years | 0 (0.0%) | 13 (10.4%) |
| 75 Years and over | 9 (8.7%) | 8 (8.1%) |
Disability Class: Vision Difficulty
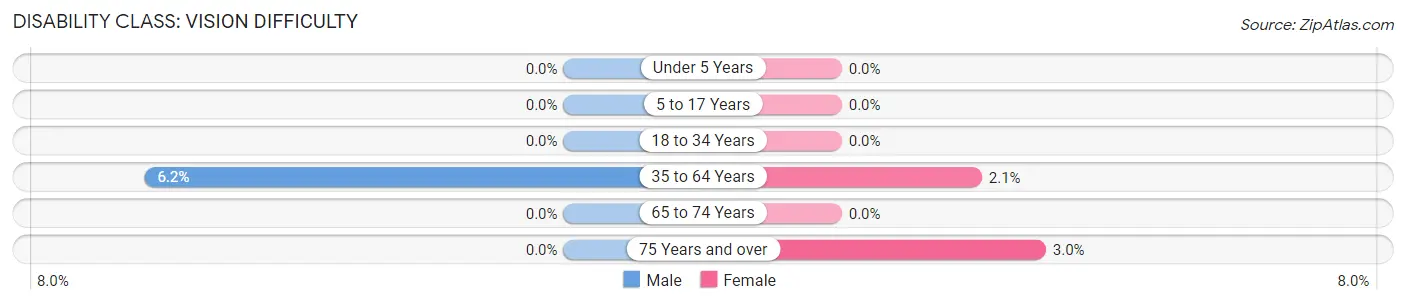
| Age Bracket | Male | Female |
| Under 5 Years | 0 (0.0%) | 0 (0.0%) |
| 5 to 17 Years | 0 (0.0%) | 0 (0.0%) |
| 18 to 34 Years | 0 (0.0%) | 0 (0.0%) |
| 35 to 64 Years | 43 (6.2%) | 15 (2.1%) |
| 65 to 74 Years | 0 (0.0%) | 0 (0.0%) |
| 75 Years and over | 0 (0.0%) | 3 (3.0%) |
Disability Class: Cognitive Difficulty
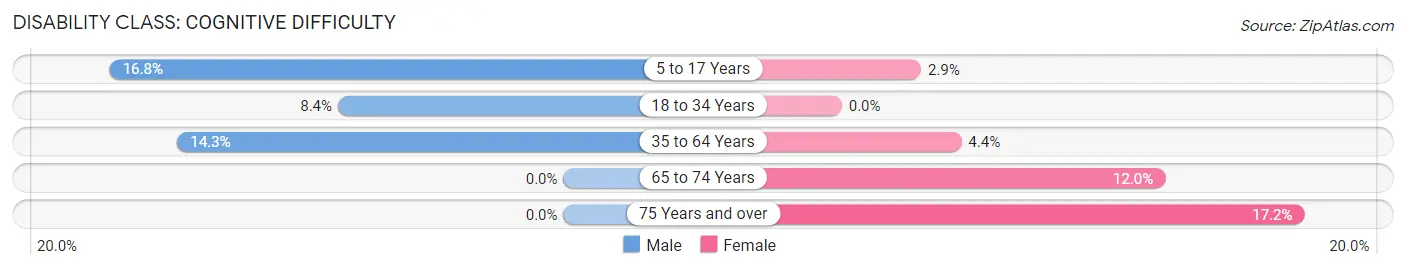
| Age Bracket | Male | Female |
| 5 to 17 Years | 16 (16.8%) | 8 (2.9%) |
| 18 to 34 Years | 72 (8.4%) | 0 (0.0%) |
| 35 to 64 Years | 99 (14.3%) | 32 (4.4%) |
| 65 to 74 Years | 0 (0.0%) | 15 (12.0%) |
| 75 Years and over | 0 (0.0%) | 17 (17.2%) |
Disability Class: Ambulatory Difficulty
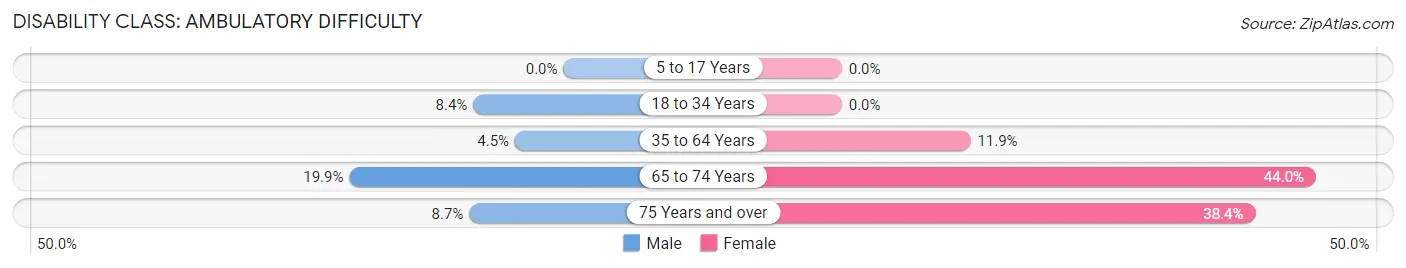
| Age Bracket | Male | Female |
| 5 to 17 Years | 0 (0.0%) | 0 (0.0%) |
| 18 to 34 Years | 72 (8.4%) | 0 (0.0%) |
| 35 to 64 Years | 31 (4.5%) | 86 (11.9%) |
| 65 to 74 Years | 31 (19.9%) | 55 (44.0%) |
| 75 Years and over | 9 (8.7%) | 38 (38.4%) |
Disability Class: Self-Care Difficulty
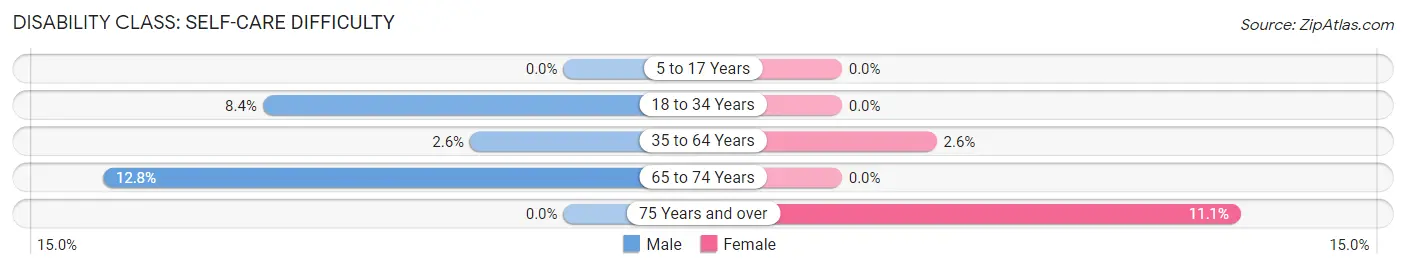
| Age Bracket | Male | Female |
| 5 to 17 Years | 0 (0.0%) | 0 (0.0%) |
| 18 to 34 Years | 72 (8.4%) | 0 (0.0%) |
| 35 to 64 Years | 18 (2.6%) | 19 (2.6%) |
| 65 to 74 Years | 20 (12.8%) | 0 (0.0%) |
| 75 Years and over | 0 (0.0%) | 11 (11.1%) |
Technology Access in Folkston
Computing Device Access in Folkston
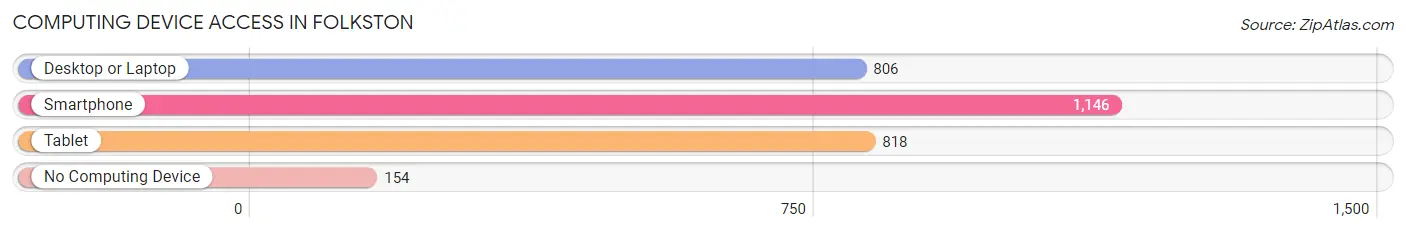
| Device Type | # Households | % Households |
| Desktop or Laptop | 806 | 57.4% |
| Smartphone | 1,146 | 81.6% |
| Tablet | 818 | 58.3% |
| No Computing Device | 154 | 11.0% |
| Total | 1,404 | 100.0% |
Internet Access in Folkston
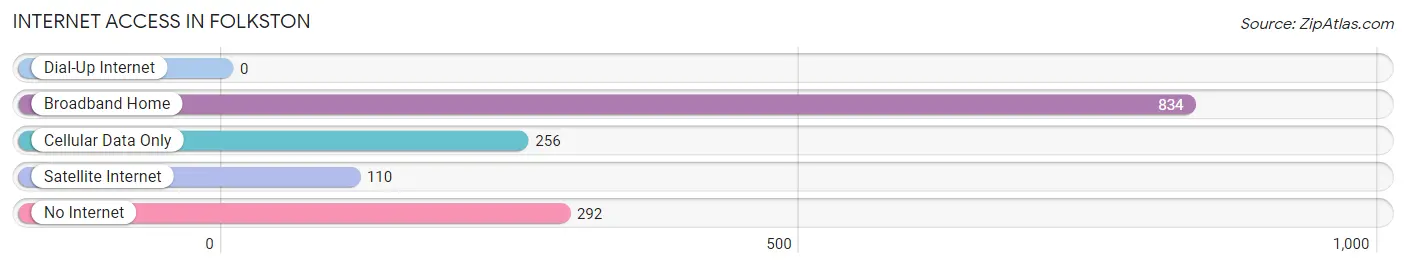
| Internet Type | # Households | % Households |
| Dial-Up Internet | 0 | 0.0% |
| Broadband Home | 834 | 59.4% |
| Cellular Data Only | 256 | 18.2% |
| Satellite Internet | 110 | 7.8% |
| No Internet | 292 | 20.8% |
| Total | 1,404 | 100.0% |
Folkston Summary
Folkston is a small city located in Charlton County, Georgia, United States. It is the county seat of Charlton County and is located along the St. Marys River. The population was 2,171 at the 2010 census.
History
Folkston was founded in 1891 by the Seaboard Air Line Railway. The town was named after the railroad's president, William T. Folk. The town was incorporated in 1895.
Geography
Folkston is located at 30°48'45" North, 82°2'45" West (30.8125, -82.0458). According to the United States Census Bureau, the city has a total area of 2.2 square miles (5.7 km2), all land.
Economy
Folkston is the economic center of Charlton County. The city is home to several businesses, including a lumber mill, a sawmill, a feed mill, a cotton gin, and a pecan processing plant. The city also has a number of retail stores, restaurants, and other businesses.
Demographics
As of the census of 2000, there were 2,072 people, 790 households, and 545 families residing in the city. The population density was 945.2 people per square mile (364.7/km2). There were 890 housing units at an average density of 405.2 per square mile (156.3/km2). The racial makeup of the city was 68.90% White, 28.90% African American, 0.29% Native American, 0.29% Asian, 0.10% Pacific Islander, 0.58% from other races, and 0.94% from two or more races. Hispanic or Latino of any race were 1.17% of the population.
There were 790 households, out of which 33.3% had children under the age of 18 living with them, 46.1% were married couples living together, 19.5% had a female householder with no husband present, and 30.1% were non-families. 27.3% of all households were made up of individuals, and 13.3% had someone living alone who was 65 years of age or older. The average household size was 2.60 and the average family size was 3.14.
In the city, the population was spread out, with 28.2% under the age of 18, 8.2% from 18 to 24, 25.7% from 25 to 44, 22.2% from 45 to 64, and 15.7% who were 65 years of age or older. The median age was 36 years. For every 100 females, there were 87.2 males. For every 100 females age 18 and over, there were 81.2 males.
The median income for a household in the city was $25,938, and the median income for a family was $31,250. Males had a median income of $27,500 versus $20,000 for females. The per capita income for the city was $13,845. About 18.2% of families and 22.2% of the population were below the poverty line, including 28.2% of those under age 18 and 20.2% of those age 65 or over.
Common Questions
What is the Total Population of Folkston?
Total Population of Folkston is 4,544.
What is the Total Male Population of Folkston?
Total Male Population of Folkston is 2,760.
What is the Total Female Population of Folkston?
Total Female Population of Folkston is 1,784.
What is the Ratio of Males per 100 Females in Folkston?
There are 154.71 Males per 100 Females in Folkston.
What is the Ratio of Females per 100 Males in Folkston?
There are 64.64 Females per 100 Males in Folkston.
What is the Median Population Age in Folkston?
Median Population Age in Folkston is 36.9 Years.
What is the Average Family Size in Folkston
Average Family Size in Folkston is 3.3 People.
What is the Average Household Size in Folkston
Average Household Size in Folkston is 2.6 People.
What is Per Capita Income in Folkston?
Per Capita income in Folkston is $17,021.
What is the Median Family Income in Folkston?
Median Family Income in Folkston is $31,276.
What is the Median Household income in Folkston?
Median Household Income in Folkston is $36,712.
What is Income or Wage Gap in Folkston?
Income or Wage Gap in Folkston is 31.9%.
Women in Folkston earn 68.1 cents for every dollar earned by a man.
What is Inequality or Gini Index in Folkston?
Inequality or Gini Index in Folkston is 0.45.
How Large is the Labor Force in Folkston?
There are 1,869 People in the Labor Forcein in Folkston.
What is the Percentage of People in the Labor Force in Folkston?
47.8% of People are in the Labor Force in Folkston.
What is the Unemployment Rate in Folkston?
Unemployment Rate in Folkston is 17.1%.