Bal Harbour, FL
Bal Harbour Map
Bal Harbour Overview
3,035
TOTAL POPULATION
1,590
MALE POPULATION
1,445
FEMALE POPULATION
110.03
MALES / 100 FEMALES
90.88
FEMALES / 100 MALES
49.6
MEDIAN AGE
3.1
AVG FAMILY SIZE
2.3
AVG HOUSEHOLD SIZE
$101,899
PER CAPITA INCOME
$138,396
AVG FAMILY INCOME
$86,172
AVG HOUSEHOLD INCOME
0.65
INEQUALITY / GINI INDEX
1,312
LABOR FORCE [ PEOPLE ]
51.3%
PERCENT IN LABOR FORCE
7.9%
UNEMPLOYMENT RATE
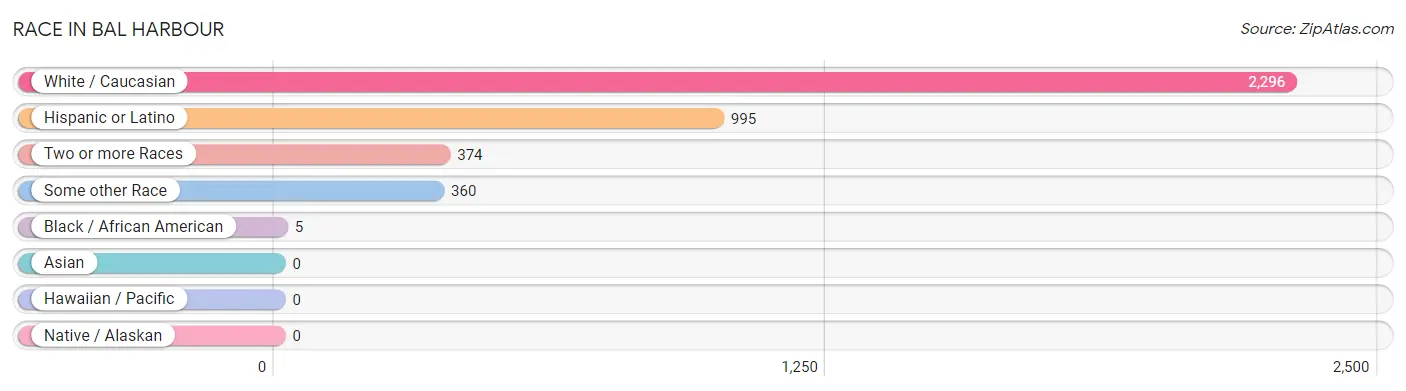
Race in Bal Harbour
The most populous races in Bal Harbour are White / Caucasian (2,296 | 75.6%), Hispanic or Latino (995 | 32.8%), and Two or more Races (374 | 12.3%).
| Race | # Population | % Population |
| Asian | 0 | 0.0% |
| Black / African American | 5 | 0.2% |
| Hawaiian / Pacific | 0 | 0.0% |
| Hispanic or Latino | 995 | 32.8% |
| Native / Alaskan | 0 | 0.0% |
| White / Caucasian | 2,296 | 75.6% |
| Two or more Races | 374 | 12.3% |
| Some other Race | 360 | 11.9% |
| Total | 3,035 | 100.0% |
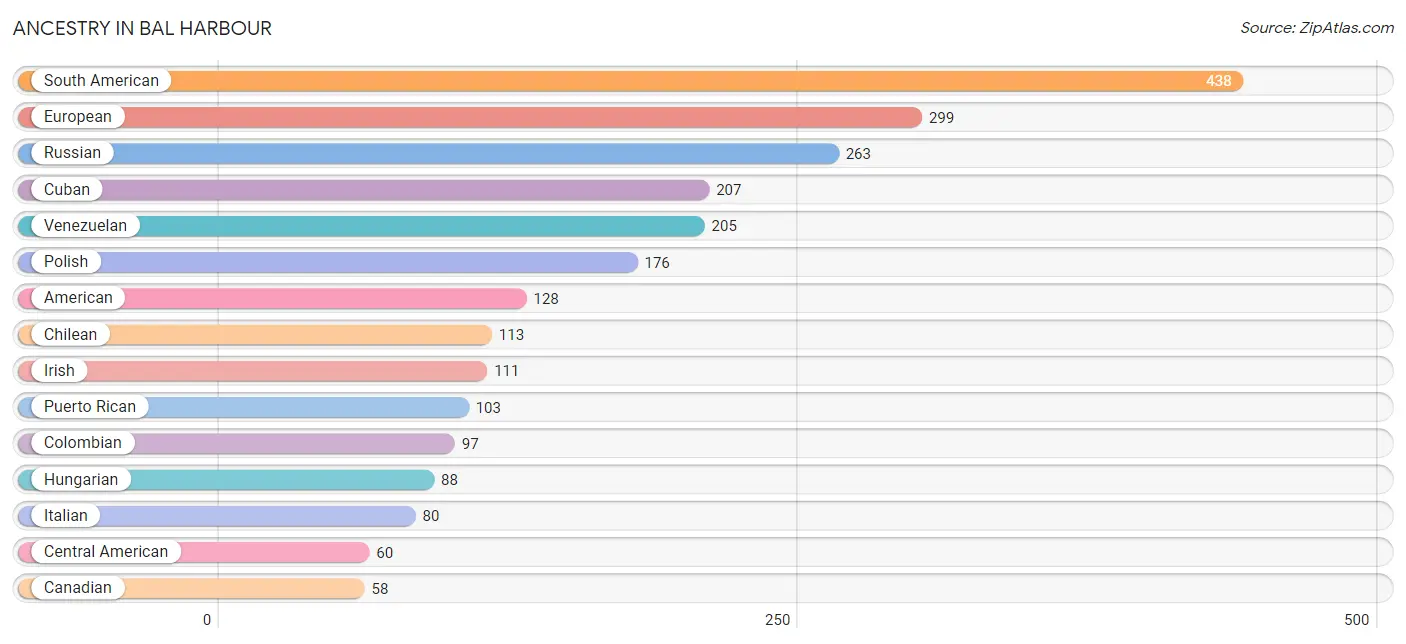
Ancestry in Bal Harbour
The most populous ancestries reported in Bal Harbour are South American (438 | 14.4%), European (299 | 9.9%), Russian (263 | 8.7%), Cuban (207 | 6.8%), and Venezuelan (205 | 6.8%), together accounting for 46.5% of all Bal Harbour residents.
| Ancestry | # Population | % Population |
| American | 128 | 4.2% |
| Arab | 45 | 1.5% |
| Austrian | 43 | 1.4% |
| Canadian | 58 | 1.9% |
| Central American | 60 | 2.0% |
| Central American Indian | 13 | 0.4% |
| Chilean | 113 | 3.7% |
| Colombian | 97 | 3.2% |
| Cuban | 207 | 6.8% |
| Czech | 52 | 1.7% |
| Dutch | 29 | 1.0% |
| Eastern European | 10 | 0.3% |
| Ecuadorian | 23 | 0.8% |
| English | 35 | 1.1% |
| European | 299 | 9.9% |
| French | 38 | 1.3% |
| German | 49 | 1.6% |
| Greek | 19 | 0.6% |
| Hungarian | 88 | 2.9% |
| Irish | 111 | 3.7% |
| Israeli | 32 | 1.1% |
| Italian | 80 | 2.6% |
| Mexican | 22 | 0.7% |
| Nicaraguan | 25 | 0.8% |
| Panamanian | 35 | 1.1% |
| Polish | 176 | 5.8% |
| Puerto Rican | 103 | 3.4% |
| Russian | 263 | 8.7% |
| Scandinavian | 13 | 0.4% |
| Scottish | 20 | 0.7% |
| South American | 438 | 14.4% |
| Spaniard | 22 | 0.7% |
| Swedish | 29 | 1.0% |
| Syrian | 35 | 1.1% |
| Trinidadian and Tobagonian | 3 | 0.1% |
| Venezuelan | 205 | 6.8% | View All 36 Rows |
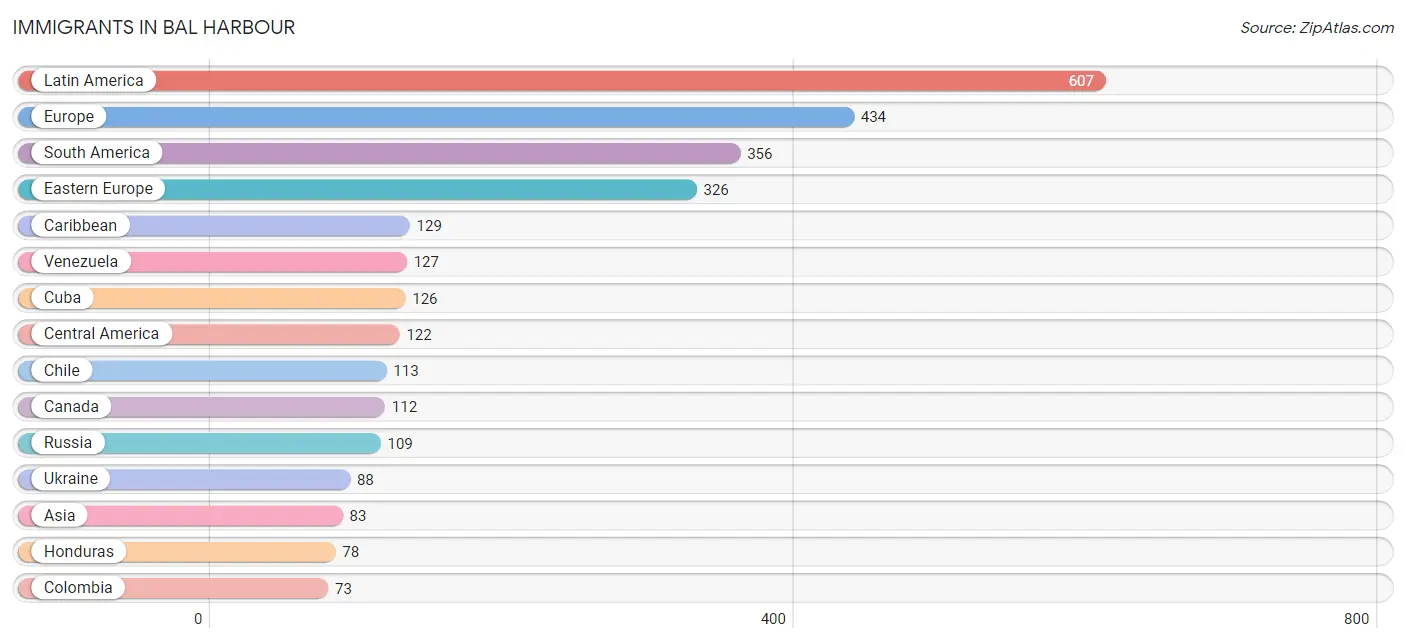
Immigrants in Bal Harbour
The most numerous immigrant groups reported in Bal Harbour came from Latin America (607 | 20.0%), Europe (434 | 14.3%), South America (356 | 11.7%), Eastern Europe (326 | 10.7%), and Caribbean (129 | 4.3%), together accounting for 61.0% of all Bal Harbour residents.
| Immigration Origin | # Population | % Population |
| Africa | 33 | 1.1% |
| Asia | 83 | 2.7% |
| Brazil | 20 | 0.7% |
| Canada | 112 | 3.7% |
| Caribbean | 129 | 4.3% |
| Central America | 122 | 4.0% |
| Chile | 113 | 3.7% |
| Colombia | 73 | 2.4% |
| Cuba | 126 | 4.2% |
| Czechoslovakia | 4 | 0.1% |
| Eastern Europe | 326 | 10.7% |
| Ecuador | 23 | 0.8% |
| England | 11 | 0.4% |
| Europe | 434 | 14.3% |
| France | 26 | 0.9% |
| Germany | 18 | 0.6% |
| Greece | 19 | 0.6% |
| Honduras | 78 | 2.6% |
| Hungary | 63 | 2.1% |
| India | 56 | 1.8% |
| Israel | 27 | 0.9% |
| Latin America | 607 | 20.0% |
| Mexico | 9 | 0.3% |
| Morocco | 23 | 0.8% |
| Northern Africa | 33 | 1.1% |
| Northern Europe | 23 | 0.8% |
| Oceania | 35 | 1.1% |
| Panama | 35 | 1.1% |
| Poland | 62 | 2.0% |
| Russia | 109 | 3.6% |
| South America | 356 | 11.7% |
| South Central Asia | 56 | 1.8% |
| Southern Europe | 41 | 1.3% |
| Spain | 22 | 0.7% |
| Trinidad and Tobago | 3 | 0.1% |
| Ukraine | 88 | 2.9% |
| Venezuela | 127 | 4.2% |
| Western Asia | 27 | 0.9% |
| Western Europe | 44 | 1.5% | View All 39 Rows |
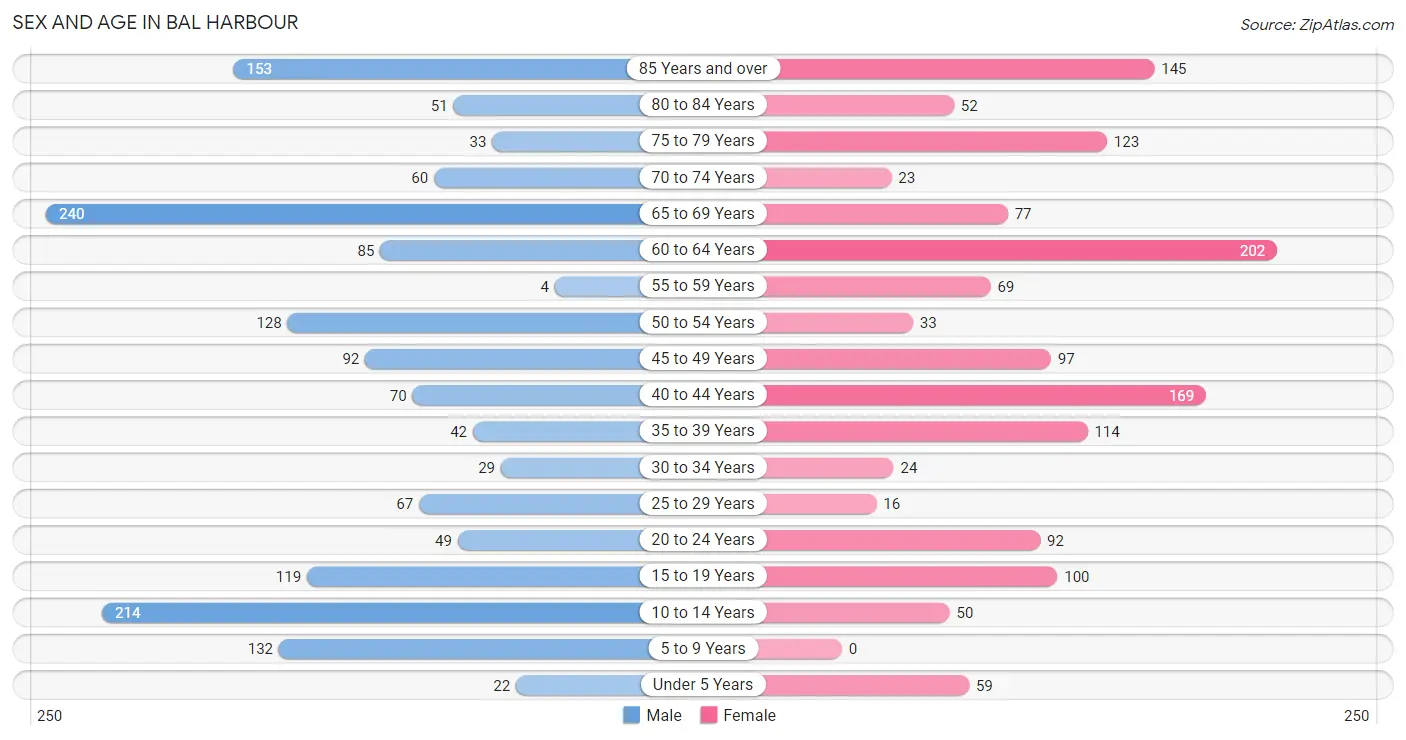
Sex and Age in Bal Harbour
Sex and Age in Bal Harbour
The most populous age groups in Bal Harbour are 65 to 69 Years (240 | 15.1%) for men and 60 to 64 Years (202 | 14.0%) for women.
| Age Bracket | Male | Female |
| Under 5 Years | 22 (1.4%) | 59 (4.1%) |
| 5 to 9 Years | 132 (8.3%) | 0 (0.0%) |
| 10 to 14 Years | 214 (13.5%) | 50 (3.5%) |
| 15 to 19 Years | 119 (7.5%) | 100 (6.9%) |
| 20 to 24 Years | 49 (3.1%) | 92 (6.4%) |
| 25 to 29 Years | 67 (4.2%) | 16 (1.1%) |
| 30 to 34 Years | 29 (1.8%) | 24 (1.7%) |
| 35 to 39 Years | 42 (2.6%) | 114 (7.9%) |
| 40 to 44 Years | 70 (4.4%) | 169 (11.7%) |
| 45 to 49 Years | 92 (5.8%) | 97 (6.7%) |
| 50 to 54 Years | 128 (8.1%) | 33 (2.3%) |
| 55 to 59 Years | 4 (0.3%) | 69 (4.8%) |
| 60 to 64 Years | 85 (5.3%) | 202 (14.0%) |
| 65 to 69 Years | 240 (15.1%) | 77 (5.3%) |
| 70 to 74 Years | 60 (3.8%) | 23 (1.6%) |
| 75 to 79 Years | 33 (2.1%) | 123 (8.5%) |
| 80 to 84 Years | 51 (3.2%) | 52 (3.6%) |
| 85 Years and over | 153 (9.6%) | 145 (10.0%) |
| Total | 1,590 (100.0%) | 1,445 (100.0%) |
Families and Households in Bal Harbour
Median Family Size in Bal Harbour
The median family size in Bal Harbour is 3.14 persons per family, with married-couple families (706 | 91.2%) accounting for the largest median family size of 3.21 persons per family. On the other hand, single male/father families (37 | 4.8%) represent the smallest median family size with 2.11 persons per family.
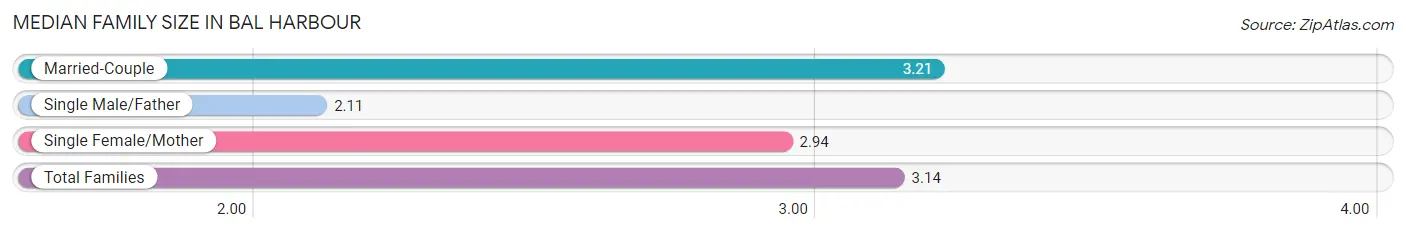
| Family Type | # Families | Family Size |
| Married-Couple | 706 (91.2%) | 3.21 |
| Single Male/Father | 37 (4.8%) | 2.11 |
| Single Female/Mother | 31 (4.0%) | 2.94 |
| Total Families | 774 (100.0%) | 3.14 |
Median Household Size in Bal Harbour
The median household size in Bal Harbour is 2.29 persons per household, with married-couple households (706 | 53.3%) accounting for the largest median household size of 3.21 persons per household. non-family households (551 | 41.6%) represent the smallest median household size with 1.03 persons per household.
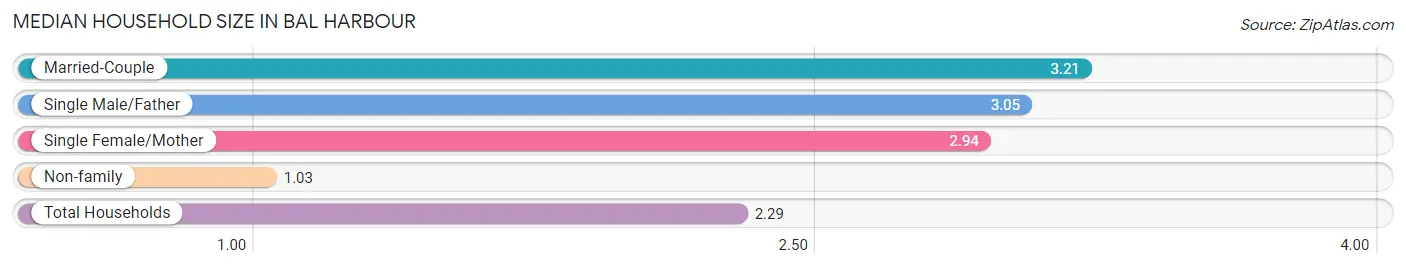
| Household Type | # Households | Household Size |
| Married-Couple | 706 (53.3%) | 3.21 |
| Single Male/Father | 37 (2.8%) | 3.05 |
| Single Female/Mother | 31 (2.3%) | 2.94 |
| Non-family | 551 (41.6%) | 1.03 |
| Total Households | 1,325 (100.0%) | 2.29 |
Household Size by Marriage Status in Bal Harbour
Out of a total of 1,325 households in Bal Harbour, 774 (58.4%) are family households, while 551 (41.6%) are nonfamily households. The most numerous type of family households are 2-person households, comprising 440, and the most common type of nonfamily households are 1-person households, comprising 539.
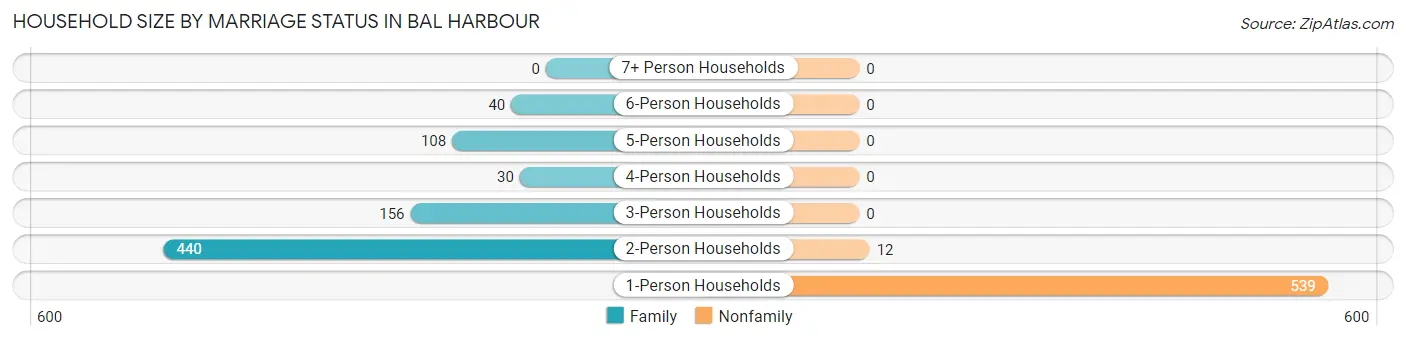
| Household Size | Family Households | Nonfamily Households |
| 1-Person Households | - | 539 (40.7%) |
| 2-Person Households | 440 (33.2%) | 12 (0.9%) |
| 3-Person Households | 156 (11.8%) | 0 (0.0%) |
| 4-Person Households | 30 (2.3%) | 0 (0.0%) |
| 5-Person Households | 108 (8.2%) | 0 (0.0%) |
| 6-Person Households | 40 (3.0%) | 0 (0.0%) |
| 7+ Person Households | 0 (0.0%) | 0 (0.0%) |
| Total | 774 (58.4%) | 551 (41.6%) |
Female Fertility in Bal Harbour
Fertility by Age in Bal Harbour
Average fertility rate in Bal Harbour is 3.0 births per 1,000 women. Women in the age bracket of 35 to 50 years have the highest fertility rate with 5.0 births per 1,000 women. Women in the age bracket of 35 to 50 years acount for 100.0% of all women with births.
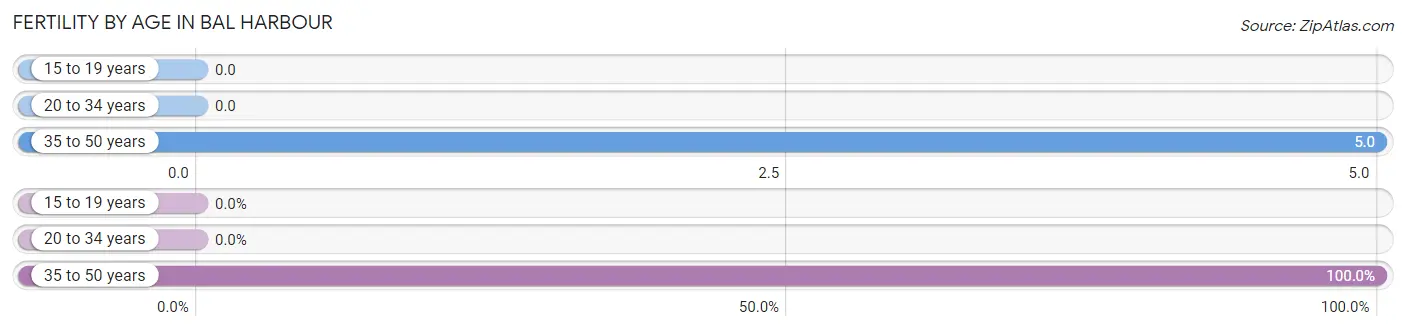
| Age Bracket | Women with Births | Births / 1,000 Women |
| 15 to 19 years | 0 (0.0%) | 0.0 |
| 20 to 34 years | 0 (0.0%) | 0.0 |
| 35 to 50 years | 2 (100.0%) | 5.0 |
| Total | 2 (100.0%) | 3.0 |
Fertility by Age by Marriage Status in Bal Harbour
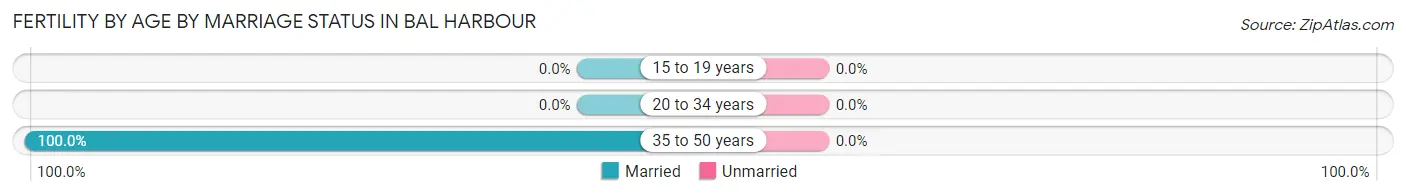
| Age Bracket | Married | Unmarried |
| 15 to 19 years | 0 (0.0%) | 0 (0.0%) |
| 20 to 34 years | 0 (0.0%) | 0 (0.0%) |
| 35 to 50 years | 2 (100.0%) | 0 (0.0%) |
| Total | 2 (100.0%) | 0 (0.0%) |
Fertility by Education in Bal Harbour
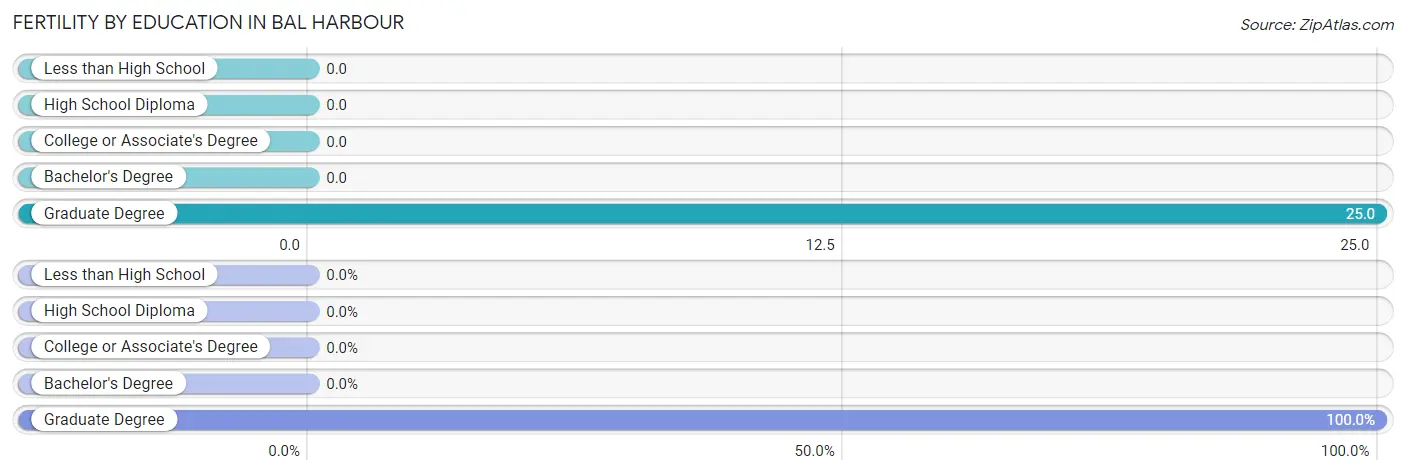
| Educational Attainment | Women with Births | Births / 1,000 Women |
| Less than High School | 0 (0.0%) | 0.0 |
| High School Diploma | 0 (0.0%) | 0.0 |
| College or Associate's Degree | 0 (0.0%) | 0.0 |
| Bachelor's Degree | 0 (0.0%) | 0.0 |
| Graduate Degree | 2 (100.0%) | 25.0 |
| Total | 2 (100.0%) | 3.0 |
Fertility by Education by Marriage Status in Bal Harbour
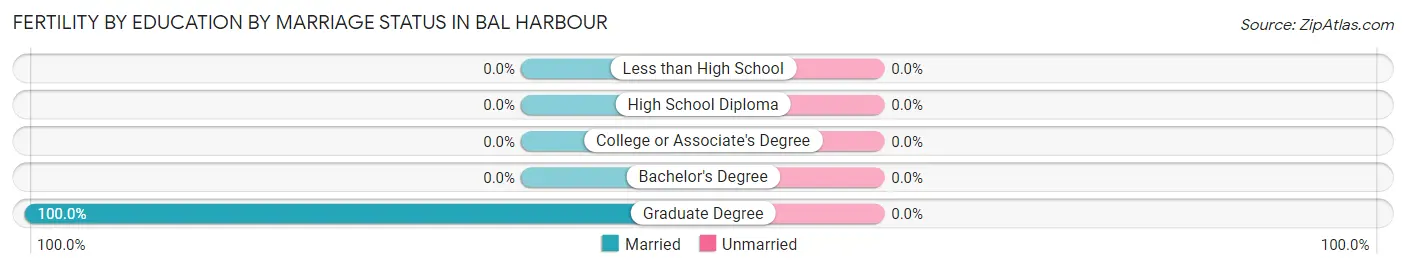
| Educational Attainment | Married | Unmarried |
| Less than High School | 0 (0.0%) | 0 (0.0%) |
| High School Diploma | 0 (0.0%) | 0 (0.0%) |
| College or Associate's Degree | 0 (0.0%) | 0 (0.0%) |
| Bachelor's Degree | 0 (0.0%) | 0 (0.0%) |
| Graduate Degree | 2 (100.0%) | 0 (0.0%) |
| Total | 2 (100.0%) | 0 (0.0%) |
Income in Bal Harbour
Income Overview in Bal Harbour
Per Capita Income in Bal Harbour is $101,899, while median incomes of families and households are $138,396 and $86,172 respectively.
| Characteristic | Number | Measure |
| Per Capita Income | 3,035 | $101,899 |
| Median Family Income | 774 | $138,396 |
| Mean Family Income | 774 | $312,447 |
| Median Household Income | 1,325 | $86,172 |
| Mean Household Income | 1,325 | $236,165 |
| Income Deficit | 774 | $0 |
| Wage / Income Gap (%) | 3,035 | 0.00% |
| Wage / Income Gap ($) | 3,035 | 100.00¢ per $1 |
| Gini / Inequality Index | 3,035 | 0.65 |
Earnings by Sex in Bal Harbour
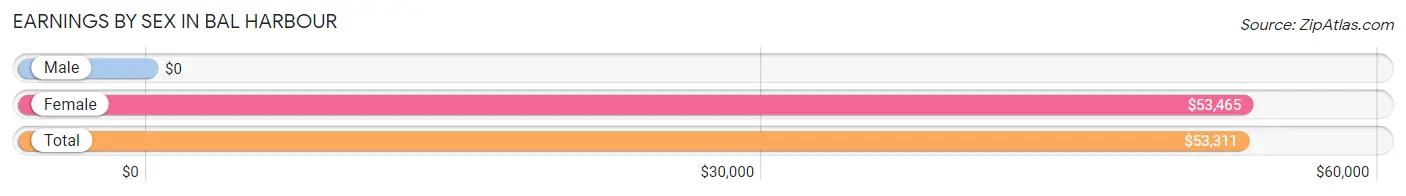
| Sex | Number | Average Earnings |
| Male | 797 (56.1%) | $0 |
| Female | 624 (43.9%) | $53,465 |
| Total | 1,421 (100.0%) | $53,311 |
Earnings by Sex by Income Bracket in Bal Harbour
The most common earnings brackets in Bal Harbour are $100,000+ for men (355 | 44.5%) and $100,000+ for women (121 | 19.4%).
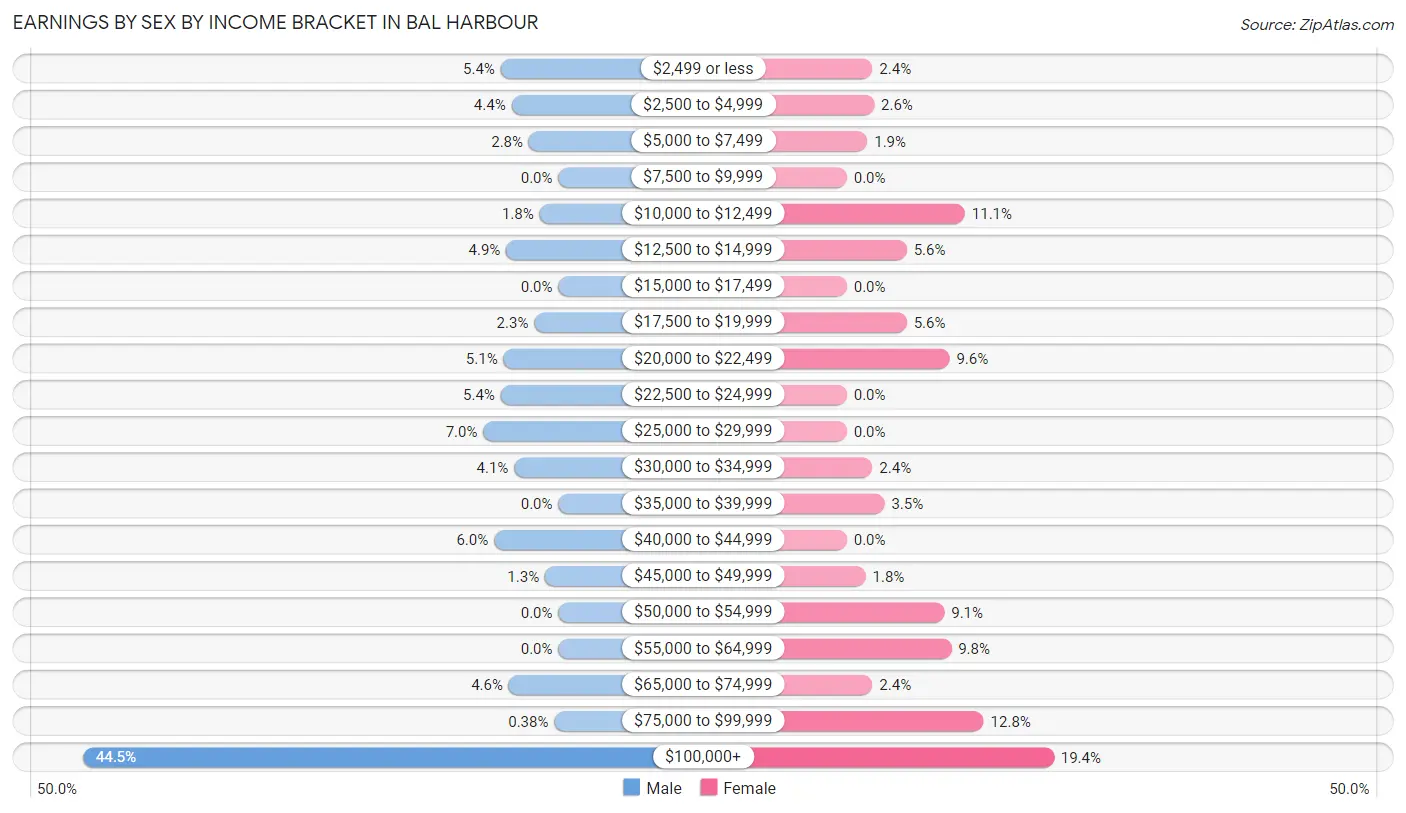
| Income | Male | Female |
| $2,499 or less | 43 (5.4%) | 15 (2.4%) |
| $2,500 to $4,999 | 35 (4.4%) | 16 (2.6%) |
| $5,000 to $7,499 | 22 (2.8%) | 12 (1.9%) |
| $7,500 to $9,999 | 0 (0.0%) | 0 (0.0%) |
| $10,000 to $12,499 | 14 (1.8%) | 69 (11.1%) |
| $12,500 to $14,999 | 39 (4.9%) | 35 (5.6%) |
| $15,000 to $17,499 | 0 (0.0%) | 0 (0.0%) |
| $17,500 to $19,999 | 18 (2.3%) | 35 (5.6%) |
| $20,000 to $22,499 | 41 (5.1%) | 60 (9.6%) |
| $22,500 to $24,999 | 43 (5.4%) | 0 (0.0%) |
| $25,000 to $29,999 | 56 (7.0%) | 0 (0.0%) |
| $30,000 to $34,999 | 33 (4.1%) | 15 (2.4%) |
| $35,000 to $39,999 | 0 (0.0%) | 22 (3.5%) |
| $40,000 to $44,999 | 48 (6.0%) | 0 (0.0%) |
| $45,000 to $49,999 | 10 (1.3%) | 11 (1.8%) |
| $50,000 to $54,999 | 0 (0.0%) | 57 (9.1%) |
| $55,000 to $64,999 | 0 (0.0%) | 61 (9.8%) |
| $65,000 to $74,999 | 37 (4.6%) | 15 (2.4%) |
| $75,000 to $99,999 | 3 (0.4%) | 80 (12.8%) |
| $100,000+ | 355 (44.5%) | 121 (19.4%) |
| Total | 797 (100.0%) | 624 (100.0%) |
Earnings by Sex by Educational Attainment in Bal Harbour
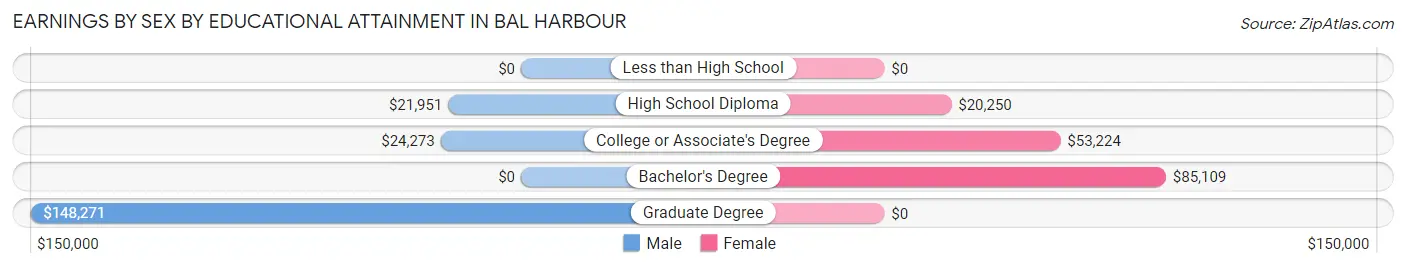
| Educational Attainment | Male Income | Female Income |
| Less than High School | - | - |
| High School Diploma | $21,951 | $20,250 |
| College or Associate's Degree | $24,273 | $53,224 |
| Bachelor's Degree | - | - |
| Graduate Degree | $148,271 | $0 |
| Total | - | - |
Family Income in Bal Harbour
Family Income Brackets in Bal Harbour
According to the Bal Harbour family income data, there are 353 families falling into the $200,000+ income range, which is the most common income bracket and makes up 45.6% of all families.
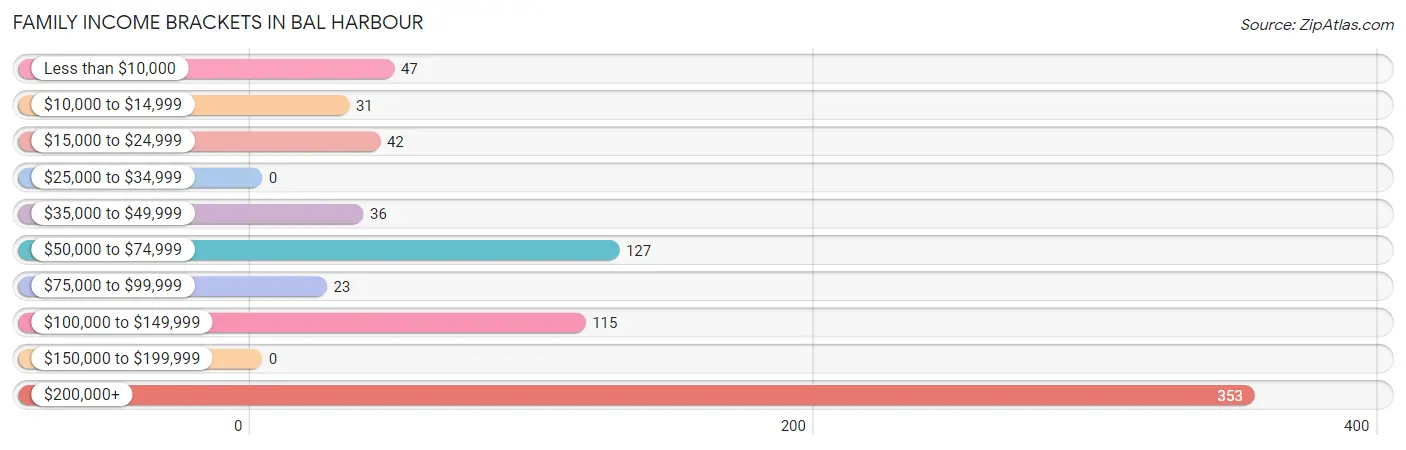
| Income Bracket | # Families | % Families |
| Less than $10,000 | 47 | 6.1% |
| $10,000 to $14,999 | 31 | 4.0% |
| $15,000 to $24,999 | 42 | 5.4% |
| $25,000 to $34,999 | 0 | 0.0% |
| $35,000 to $49,999 | 36 | 4.7% |
| $50,000 to $74,999 | 127 | 16.4% |
| $75,000 to $99,999 | 23 | 3.0% |
| $100,000 to $149,999 | 115 | 14.9% |
| $150,000 to $199,999 | 0 | 0.0% |
| $200,000+ | 353 | 45.6% |
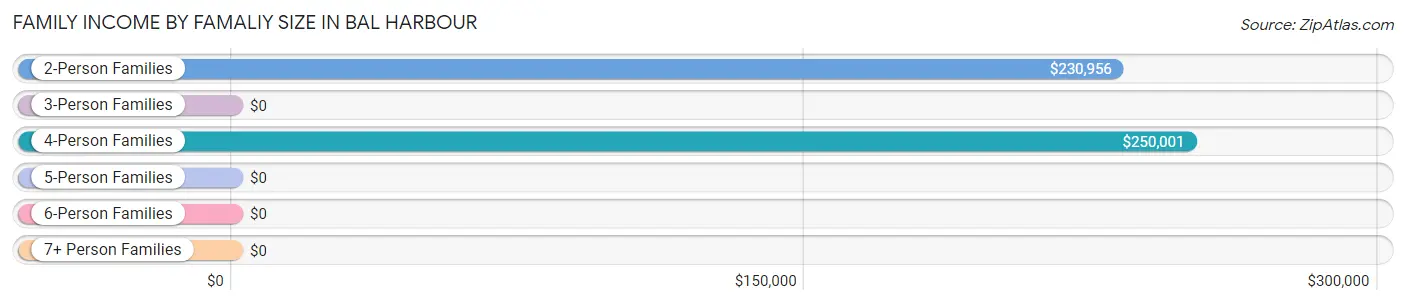
Family Income by Famaliy Size in Bal Harbour
4-person families (32 | 4.1%) account for the highest median family income in Bal Harbour with $250,001 per family, while 2-person families (477 | 61.6%) have the highest median income of $115,478 per family member.
| Income Bracket | # Families | Median Income |
| 2-Person Families | 477 (61.6%) | $230,956 |
| 3-Person Families | 119 (15.4%) | $0 |
| 4-Person Families | 32 (4.1%) | $250,001 |
| 5-Person Families | 106 (13.7%) | $0 |
| 6-Person Families | 40 (5.2%) | $0 |
| 7+ Person Families | 0 (0.0%) | $0 |
| Total | 774 (100.0%) | $138,396 |
Family Income by Number of Earners in Bal Harbour
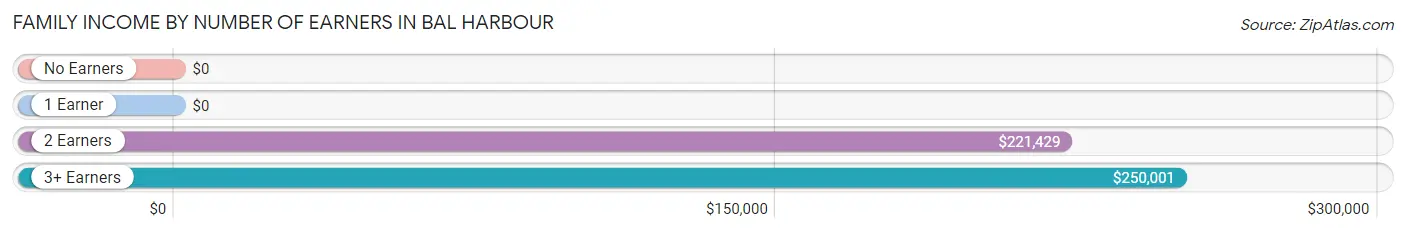
| Number of Earners | # Families | Median Income |
| No Earners | 159 (20.5%) | $0 |
| 1 Earner | 290 (37.5%) | $0 |
| 2 Earners | 248 (32.0%) | $221,429 |
| 3+ Earners | 77 (10.0%) | $250,001 |
| Total | 774 (100.0%) | $138,396 |
Household Income in Bal Harbour
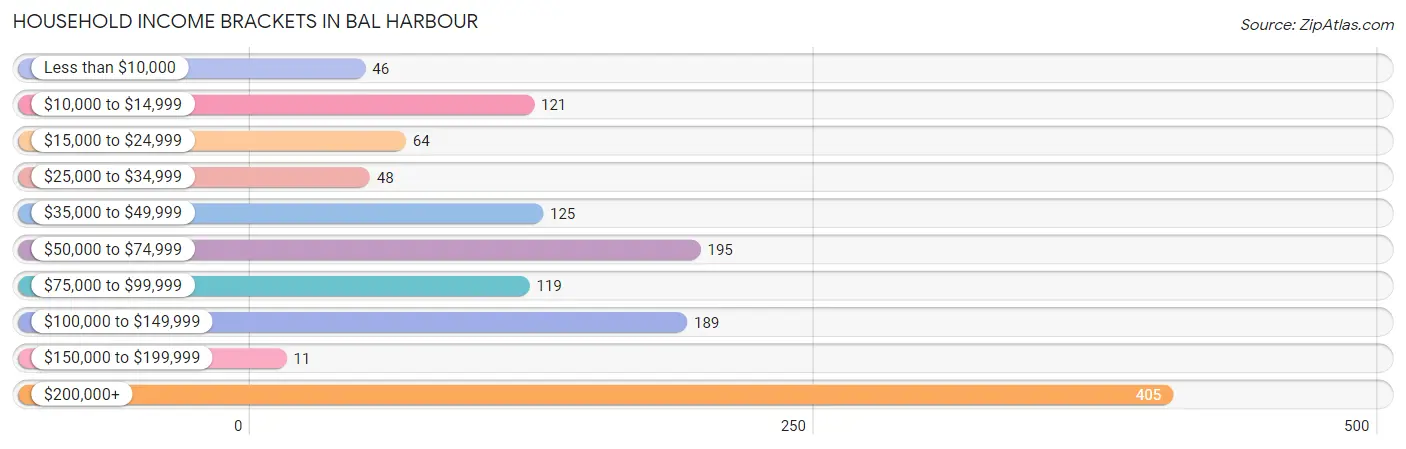
Household Income Brackets in Bal Harbour
With 405 households falling in the category, the $200,000+ income range is the most frequent in Bal Harbour, accounting for 30.6% of all households. In contrast, only 11 households (0.8%) fall into the $150,000 to $199,999 income bracket, making it the least populous group.
| Income Bracket | # Households | % Households |
| Less than $10,000 | 46 | 3.5% |
| $10,000 to $14,999 | 121 | 9.1% |
| $15,000 to $24,999 | 64 | 4.8% |
| $25,000 to $34,999 | 48 | 3.6% |
| $35,000 to $49,999 | 125 | 9.4% |
| $50,000 to $74,999 | 195 | 14.7% |
| $75,000 to $99,999 | 119 | 9.0% |
| $100,000 to $149,999 | 189 | 14.3% |
| $150,000 to $199,999 | 11 | 0.8% |
| $200,000+ | 405 | 30.6% |
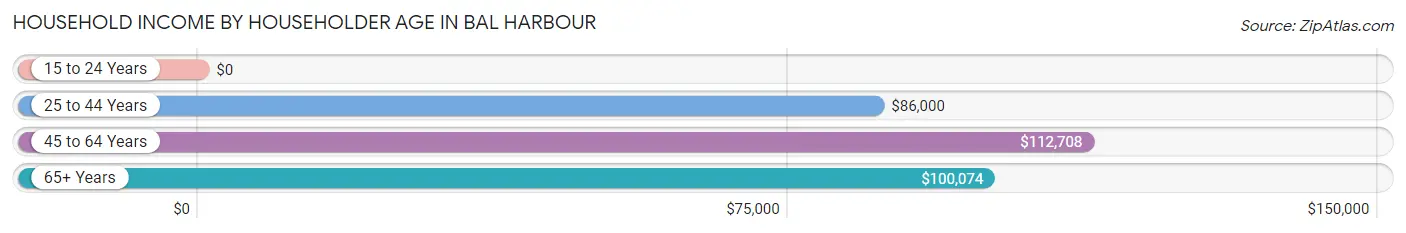
Household Income by Householder Age in Bal Harbour
The median household income in Bal Harbour is $86,172, with the highest median household income of $112,708 found in the 45 to 64 years age bracket for the primary householder. A total of 370 households (27.9%) fall into this category.
| Income Bracket | # Households | Median Income |
| 15 to 24 Years | 0 (0.0%) | $0 |
| 25 to 44 Years | 266 (20.1%) | $86,000 |
| 45 to 64 Years | 370 (27.9%) | $112,708 |
| 65+ Years | 689 (52.0%) | $100,074 |
| Total | 1,325 (100.0%) | $86,172 |
Poverty in Bal Harbour
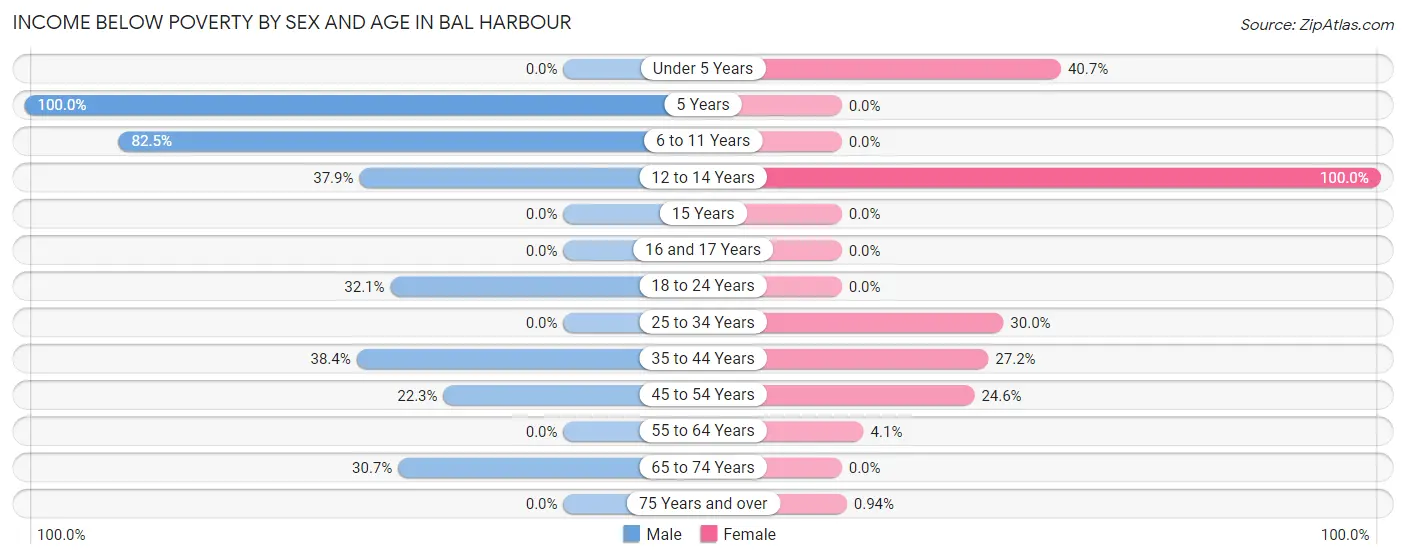
Income Below Poverty by Sex and Age in Bal Harbour
With 28.5% poverty level for males and 12.0% for females among the residents of Bal Harbour, 5 year old males and 12 to 14 year old females are the most vulnerable to poverty, with 48 males (100.0%) and 14 females (100.0%) in their respective age groups living below the poverty level.
| Age Bracket | Male | Female |
| Under 5 Years | 0 (0.0%) | 24 (40.7%) |
| 5 Years | 48 (100.0%) | 0 (0.0%) |
| 6 to 11 Years | 137 (82.5%) | 0 (0.0%) |
| 12 to 14 Years | 50 (37.9%) | 14 (100.0%) |
| 15 Years | 0 (0.0%) | 0 (0.0%) |
| 16 and 17 Years | 0 (0.0%) | 0 (0.0%) |
| 18 to 24 Years | 35 (32.1%) | 0 (0.0%) |
| 25 to 34 Years | 0 (0.0%) | 12 (30.0%) |
| 35 to 44 Years | 43 (38.4%) | 77 (27.2%) |
| 45 to 54 Years | 49 (22.3%) | 32 (24.6%) |
| 55 to 64 Years | 0 (0.0%) | 11 (4.1%) |
| 65 to 74 Years | 92 (30.7%) | 0 (0.0%) |
| 75 Years and over | 0 (0.0%) | 3 (0.9%) |
| Total | 454 (28.5%) | 173 (12.0%) |
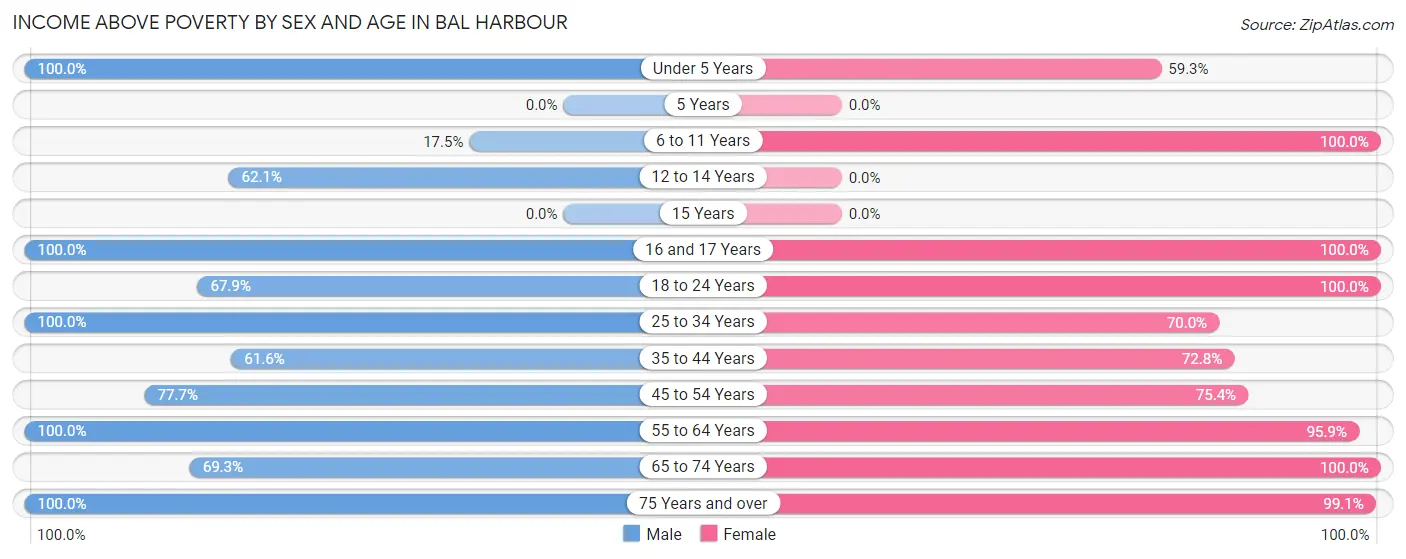
Income Above Poverty by Sex and Age in Bal Harbour
According to the poverty statistics in Bal Harbour, males aged under 5 years and females aged 6 to 11 years are the age groups that are most secure financially, with 100.0% of males and 100.0% of females in these age groups living above the poverty line.
| Age Bracket | Male | Female |
| Under 5 Years | 22 (100.0%) | 35 (59.3%) |
| 5 Years | 0 (0.0%) | 0 (0.0%) |
| 6 to 11 Years | 29 (17.5%) | 36 (100.0%) |
| 12 to 14 Years | 82 (62.1%) | 0 (0.0%) |
| 15 Years | 0 (0.0%) | 0 (0.0%) |
| 16 and 17 Years | 59 (100.0%) | 17 (100.0%) |
| 18 to 24 Years | 74 (67.9%) | 175 (100.0%) |
| 25 to 34 Years | 96 (100.0%) | 28 (70.0%) |
| 35 to 44 Years | 69 (61.6%) | 206 (72.8%) |
| 45 to 54 Years | 171 (77.7%) | 98 (75.4%) |
| 55 to 64 Years | 89 (100.0%) | 260 (95.9%) |
| 65 to 74 Years | 208 (69.3%) | 100 (100.0%) |
| 75 Years and over | 237 (100.0%) | 317 (99.1%) |
| Total | 1,136 (71.5%) | 1,272 (88.0%) |
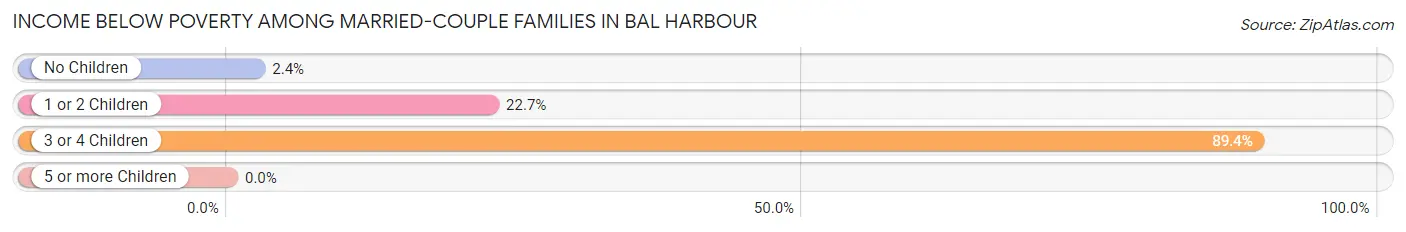
Income Below Poverty Among Married-Couple Families in Bal Harbour
The poverty statistics for married-couple families in Bal Harbour show that 12.6% or 89 of the total 706 families live below the poverty line. Families with 3 or 4 children have the highest poverty rate of 89.4%, comprising of 42 families. On the other hand, families with no children have the lowest poverty rate of 2.4%, which includes 12 families.
| Children | Above Poverty | Below Poverty |
| No Children | 493 (97.6%) | 12 (2.4%) |
| 1 or 2 Children | 119 (77.3%) | 35 (22.7%) |
| 3 or 4 Children | 5 (10.6%) | 42 (89.4%) |
| 5 or more Children | 0 (0.0%) | 0 (0.0%) |
| Total | 617 (87.4%) | 89 (12.6%) |
Income Below Poverty Among Single-Parent Households in Bal Harbour
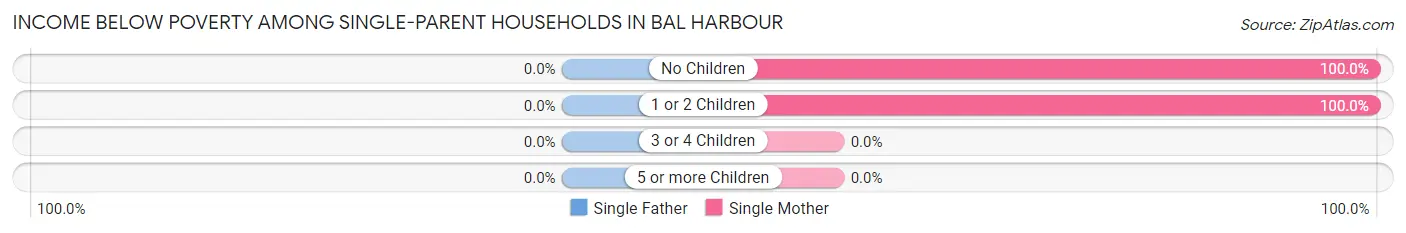
| Children | Single Father | Single Mother |
| No Children | 0 (0.0%) | 11 (100.0%) |
| 1 or 2 Children | 0 (0.0%) | 20 (100.0%) |
| 3 or 4 Children | 0 (0.0%) | 0 (0.0%) |
| 5 or more Children | 0 (0.0%) | 0 (0.0%) |
| Total | 0 (0.0%) | 31 (100.0%) |
Income Below Poverty Among Married-Couple vs Single-Parent Households in Bal Harbour
The poverty data for Bal Harbour shows that 89 of the married-couple family households (12.6%) and 31 of the single-parent households (45.6%) are living below the poverty level. Within the married-couple family households, those with 3 or 4 children have the highest poverty rate, with 42 households (89.4%) falling below the poverty line. Among the single-parent households, those with 1 or 2 children have the highest poverty rate, with 20 household (100.0%) living below poverty.
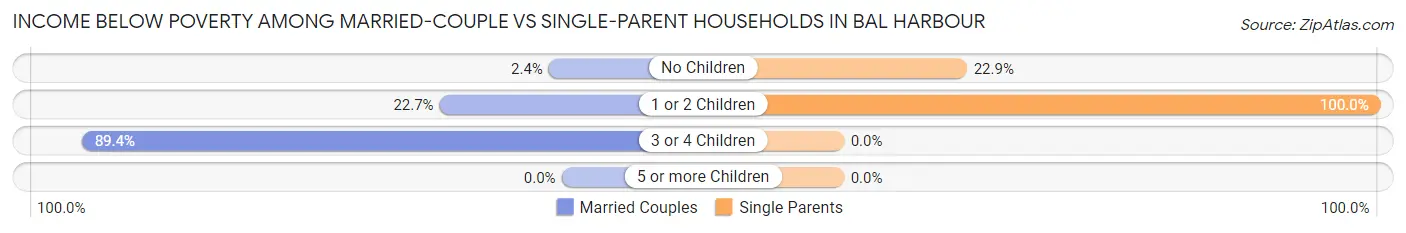
| Children | Married-Couple Families | Single-Parent Households |
| No Children | 12 (2.4%) | 11 (22.9%) |
| 1 or 2 Children | 35 (22.7%) | 20 (100.0%) |
| 3 or 4 Children | 42 (89.4%) | 0 (0.0%) |
| 5 or more Children | 0 (0.0%) | 0 (0.0%) |
| Total | 89 (12.6%) | 31 (45.6%) |
Employment Characteristics in Bal Harbour
Employment by Class of Employer in Bal Harbour
Among the 1,209 employed individuals in Bal Harbour, private company employees (629 | 52.0%), self-employed (incorporated) (364 | 30.1%), and not-for-profit organizations (95 | 7.9%) make up the most common classes of employment.
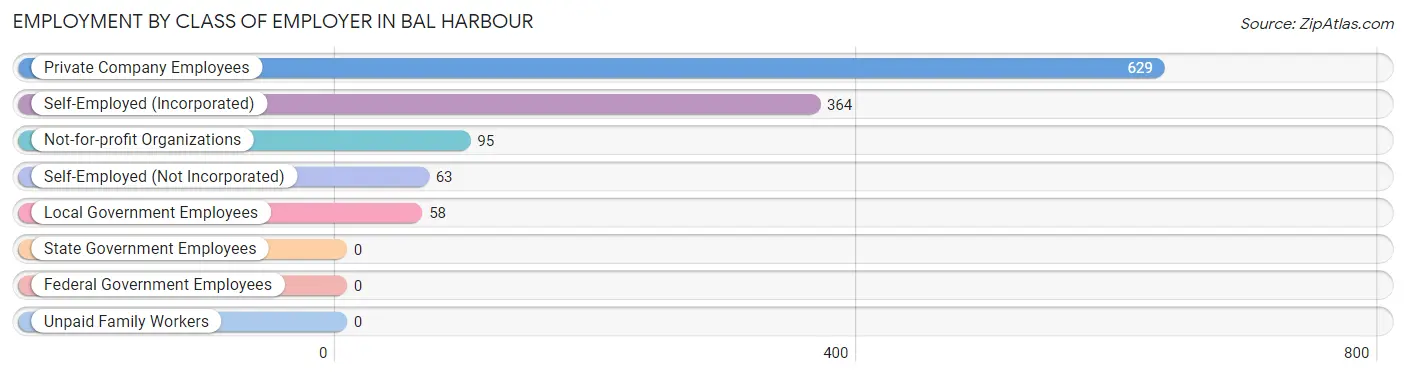
| Employer Class | # Employees | % Employees |
| Private Company Employees | 629 | 52.0% |
| Self-Employed (Incorporated) | 364 | 30.1% |
| Self-Employed (Not Incorporated) | 63 | 5.2% |
| Not-for-profit Organizations | 95 | 7.9% |
| Local Government Employees | 58 | 4.8% |
| State Government Employees | 0 | 0.0% |
| Federal Government Employees | 0 | 0.0% |
| Unpaid Family Workers | 0 | 0.0% |
| Total | 1,209 | 100.0% |
Employment Status by Age in Bal Harbour
According to the labor force statistics for Bal Harbour, out of the total population over 16 years of age (2,558), 51.3% or 1,312 individuals are in the labor force, with 7.9% or 104 of them unemployed. The age group with the highest labor force participation rate is 20 to 24 years, with 100.0% or 141 individuals in the labor force. Within the labor force, the 20 to 24 years age range has the highest percentage of unemployed individuals, with 27.7% or 39 of them being unemployed.
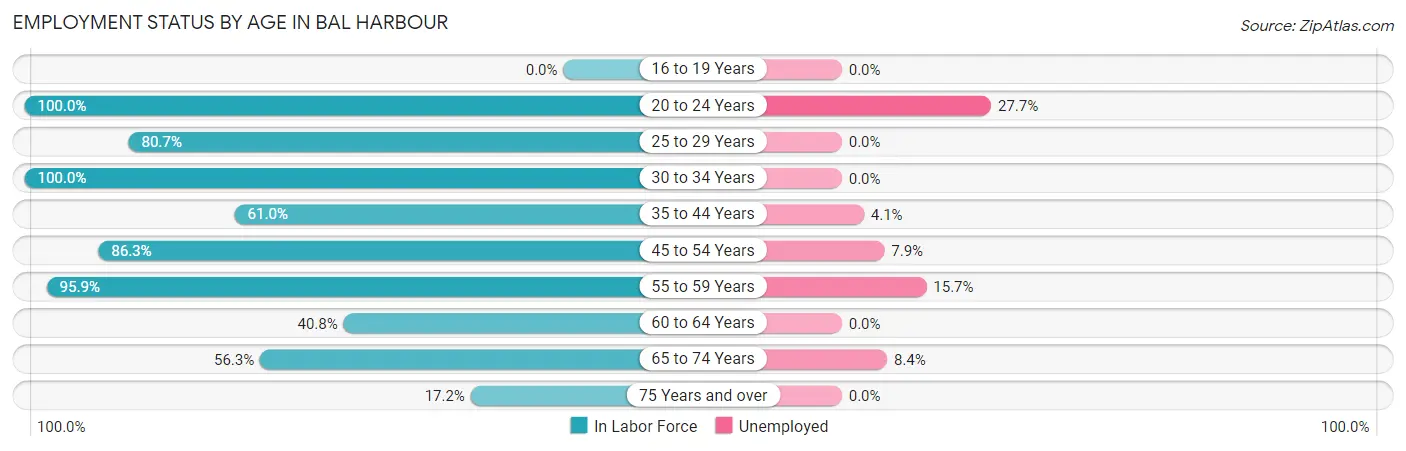
| Age Bracket | In Labor Force | Unemployed |
| 16 to 19 Years | 0 (0.0%) | 0 (0.0%) |
| 20 to 24 Years | 141 (100.0%) | 39 (27.7%) |
| 25 to 29 Years | 67 (80.7%) | 0 (0.0%) |
| 30 to 34 Years | 53 (100.0%) | 0 (0.0%) |
| 35 to 44 Years | 241 (61.0%) | 10 (4.1%) |
| 45 to 54 Years | 302 (86.3%) | 24 (7.9%) |
| 55 to 59 Years | 70 (95.9%) | 11 (15.7%) |
| 60 to 64 Years | 117 (40.8%) | 0 (0.0%) |
| 65 to 74 Years | 225 (56.3%) | 19 (8.4%) |
| 75 Years and over | 96 (17.2%) | 0 (0.0%) |
| Total | 1,312 (51.3%) | 104 (7.9%) |
Employment Status by Educational Attainment in Bal Harbour
According to labor force statistics for Bal Harbour, 68.5% of individuals (850) out of the total population between 25 and 64 years of age (1,241) are in the labor force, with 5.3% or 45 of them being unemployed. The group with the highest labor force participation rate are those with the educational attainment of high school diploma, with 78.0% or 138 individuals in the labor force. Within the labor force, individuals with less than high school education have the highest percentage of unemployment, with 100.0% or 10 of them being unemployed.
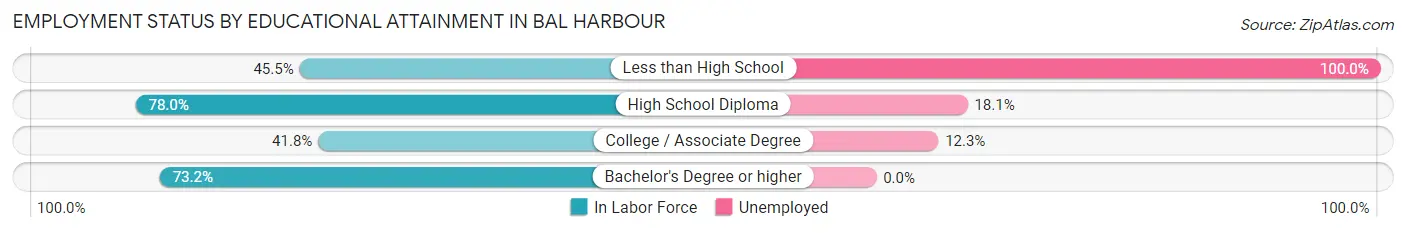
| Educational Attainment | In Labor Force | Unemployed |
| Less than High School | 10 (45.5%) | 22 (100.0%) |
| High School Diploma | 138 (78.0%) | 32 (18.1%) |
| College / Associate Degree | 81 (41.8%) | 24 (12.3%) |
| Bachelor's Degree or higher | 621 (73.2%) | 0 (0.0%) |
| Total | 850 (68.5%) | 66 (5.3%) |
Employment Occupations by Sex in Bal Harbour
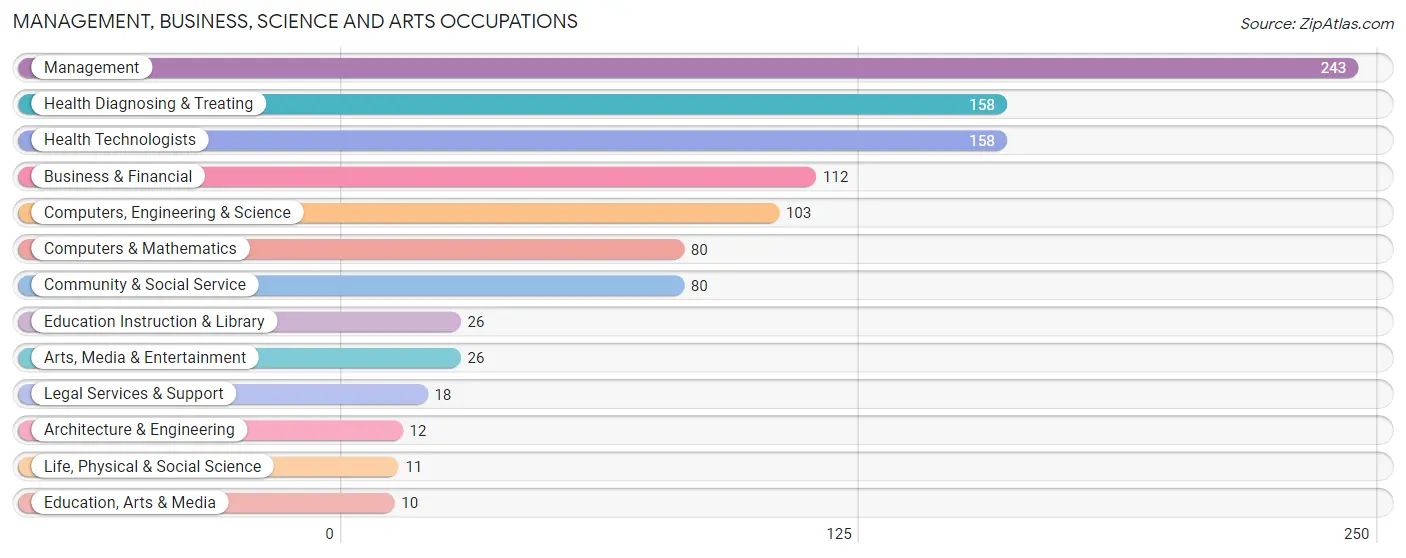
Management, Business, Science and Arts Occupations
The most common Management, Business, Science and Arts occupations in Bal Harbour are Management (243 | 20.1%), Health Diagnosing & Treating (158 | 13.1%), Health Technologists (158 | 13.1%), Business & Financial (112 | 9.3%), and Computers, Engineering & Science (103 | 8.5%).
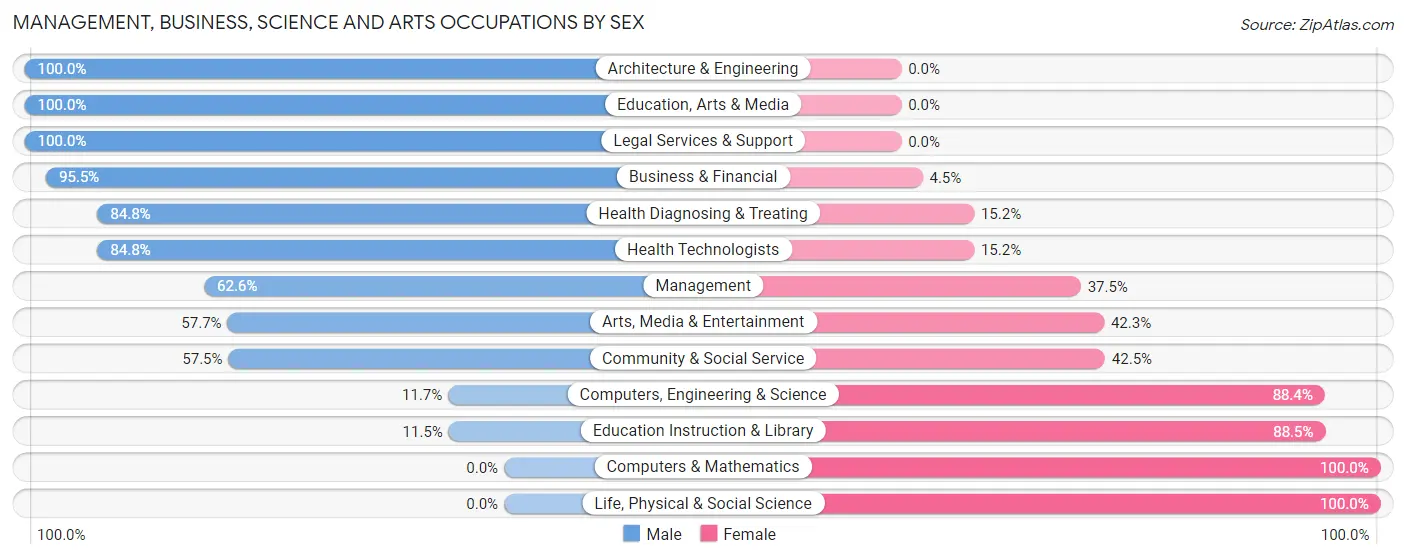
Management, Business, Science and Arts Occupations by Sex
Within the Management, Business, Science and Arts occupations in Bal Harbour, the most male-oriented occupations are Architecture & Engineering (100.0%), Education, Arts & Media (100.0%), and Legal Services & Support (100.0%), while the most female-oriented occupations are Computers & Mathematics (100.0%), Life, Physical & Social Science (100.0%), and Education Instruction & Library (88.5%).
| Occupation | Male | Female |
| Management | 152 (62.5%) | 91 (37.4%) |
| Business & Financial | 107 (95.5%) | 5 (4.5%) |
| Computers, Engineering & Science | 12 (11.7%) | 91 (88.3%) |
| Computers & Mathematics | 0 (0.0%) | 80 (100.0%) |
| Architecture & Engineering | 12 (100.0%) | 0 (0.0%) |
| Life, Physical & Social Science | 0 (0.0%) | 11 (100.0%) |
| Community & Social Service | 46 (57.5%) | 34 (42.5%) |
| Education, Arts & Media | 10 (100.0%) | 0 (0.0%) |
| Legal Services & Support | 18 (100.0%) | 0 (0.0%) |
| Education Instruction & Library | 3 (11.5%) | 23 (88.5%) |
| Arts, Media & Entertainment | 15 (57.7%) | 11 (42.3%) |
| Health Diagnosing & Treating | 134 (84.8%) | 24 (15.2%) |
| Health Technologists | 134 (84.8%) | 24 (15.2%) |
| Total (Category) | 451 (64.8%) | 245 (35.2%) |
| Total (Overall) | 658 (54.4%) | 551 (45.6%) |
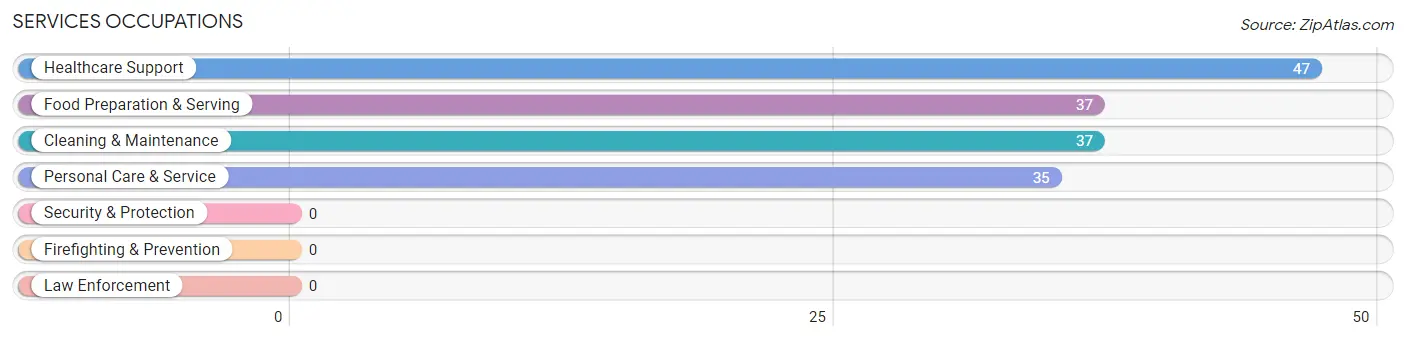
Services Occupations
The most common Services occupations in Bal Harbour are Healthcare Support (47 | 3.9%), Food Preparation & Serving (37 | 3.1%), Cleaning & Maintenance (37 | 3.1%), and Personal Care & Service (35 | 2.9%).
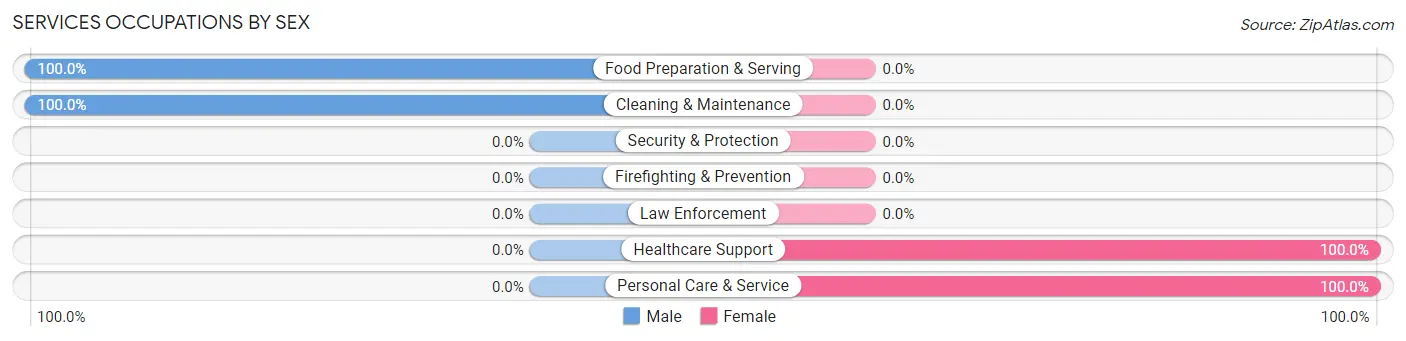
Services Occupations by Sex
Within the Services occupations in Bal Harbour, the most male-oriented occupations are Food Preparation & Serving (100.0%), and Cleaning & Maintenance (100.0%), while the most female-oriented occupations are Healthcare Support (100.0%), and Personal Care & Service (100.0%).
| Occupation | Male | Female |
| Healthcare Support | 0 (0.0%) | 47 (100.0%) |
| Security & Protection | 0 (0.0%) | 0 (0.0%) |
| Firefighting & Prevention | 0 (0.0%) | 0 (0.0%) |
| Law Enforcement | 0 (0.0%) | 0 (0.0%) |
| Food Preparation & Serving | 37 (100.0%) | 0 (0.0%) |
| Cleaning & Maintenance | 37 (100.0%) | 0 (0.0%) |
| Personal Care & Service | 0 (0.0%) | 35 (100.0%) |
| Total (Category) | 74 (47.4%) | 82 (52.6%) |
| Total (Overall) | 658 (54.4%) | 551 (45.6%) |
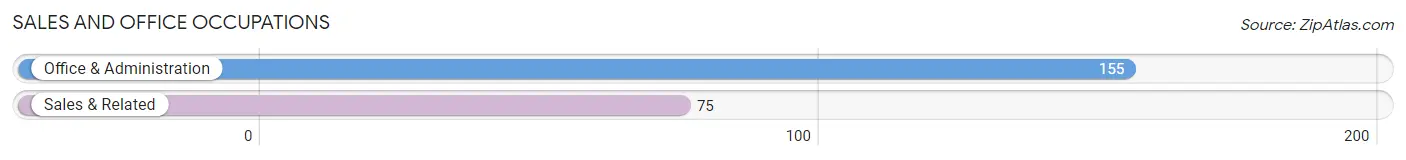
Sales and Office Occupations
The most common Sales and Office occupations in Bal Harbour are Office & Administration (155 | 12.8%), and Sales & Related (75 | 6.2%).
Sales and Office Occupations by Sex
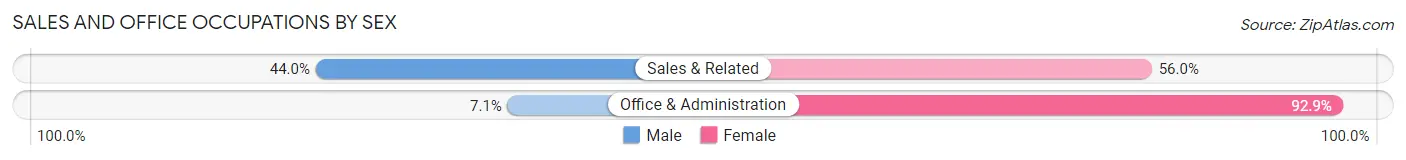
| Occupation | Male | Female |
| Sales & Related | 33 (44.0%) | 42 (56.0%) |
| Office & Administration | 11 (7.1%) | 144 (92.9%) |
| Total (Category) | 44 (19.1%) | 186 (80.9%) |
| Total (Overall) | 658 (54.4%) | 551 (45.6%) |
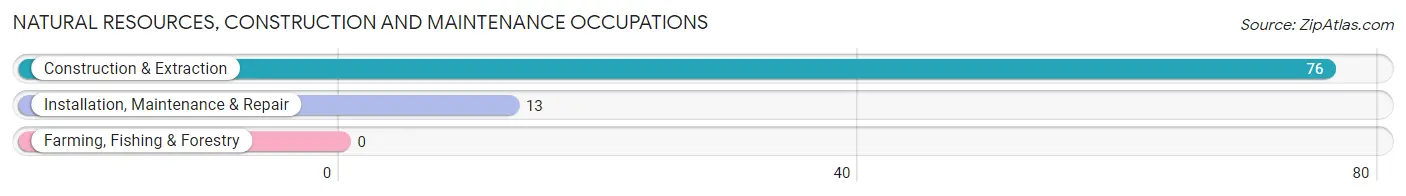
Natural Resources, Construction and Maintenance Occupations
The most common Natural Resources, Construction and Maintenance occupations in Bal Harbour are Construction & Extraction (76 | 6.3%), and Installation, Maintenance & Repair (13 | 1.1%).
Natural Resources, Construction and Maintenance Occupations by Sex
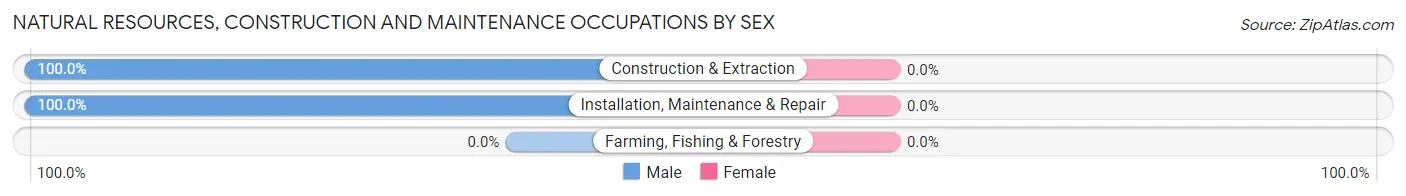
| Occupation | Male | Female |
| Farming, Fishing & Forestry | 0 (0.0%) | 0 (0.0%) |
| Construction & Extraction | 76 (100.0%) | 0 (0.0%) |
| Installation, Maintenance & Repair | 13 (100.0%) | 0 (0.0%) |
| Total (Category) | 89 (100.0%) | 0 (0.0%) |
| Total (Overall) | 658 (54.4%) | 551 (45.6%) |
Production, Transportation and Moving Occupations
The most common Production, Transportation and Moving occupations in Bal Harbour are , and Production (38 | 3.1%).
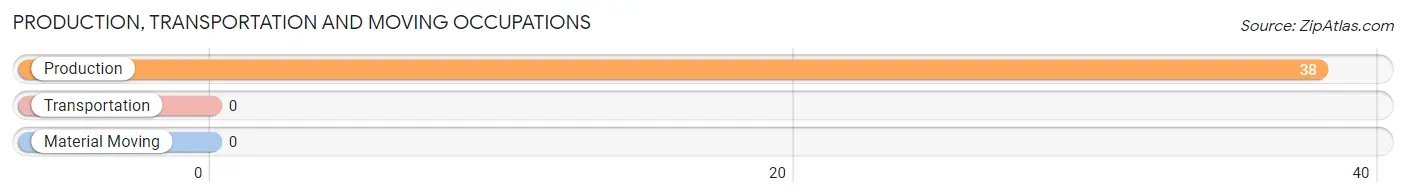
Production, Transportation and Moving Occupations by Sex
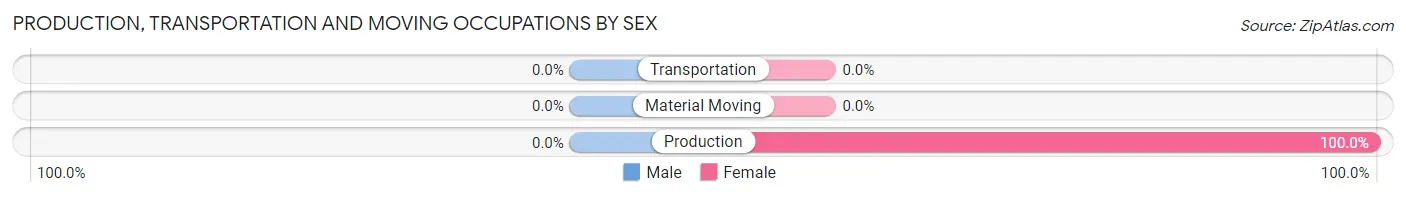
| Occupation | Male | Female |
| Production | 0 (0.0%) | 38 (100.0%) |
| Transportation | 0 (0.0%) | 0 (0.0%) |
| Material Moving | 0 (0.0%) | 0 (0.0%) |
| Total (Category) | 0 (0.0%) | 38 (100.0%) |
| Total (Overall) | 658 (54.4%) | 551 (45.6%) |
Employment Industries by Sex in Bal Harbour
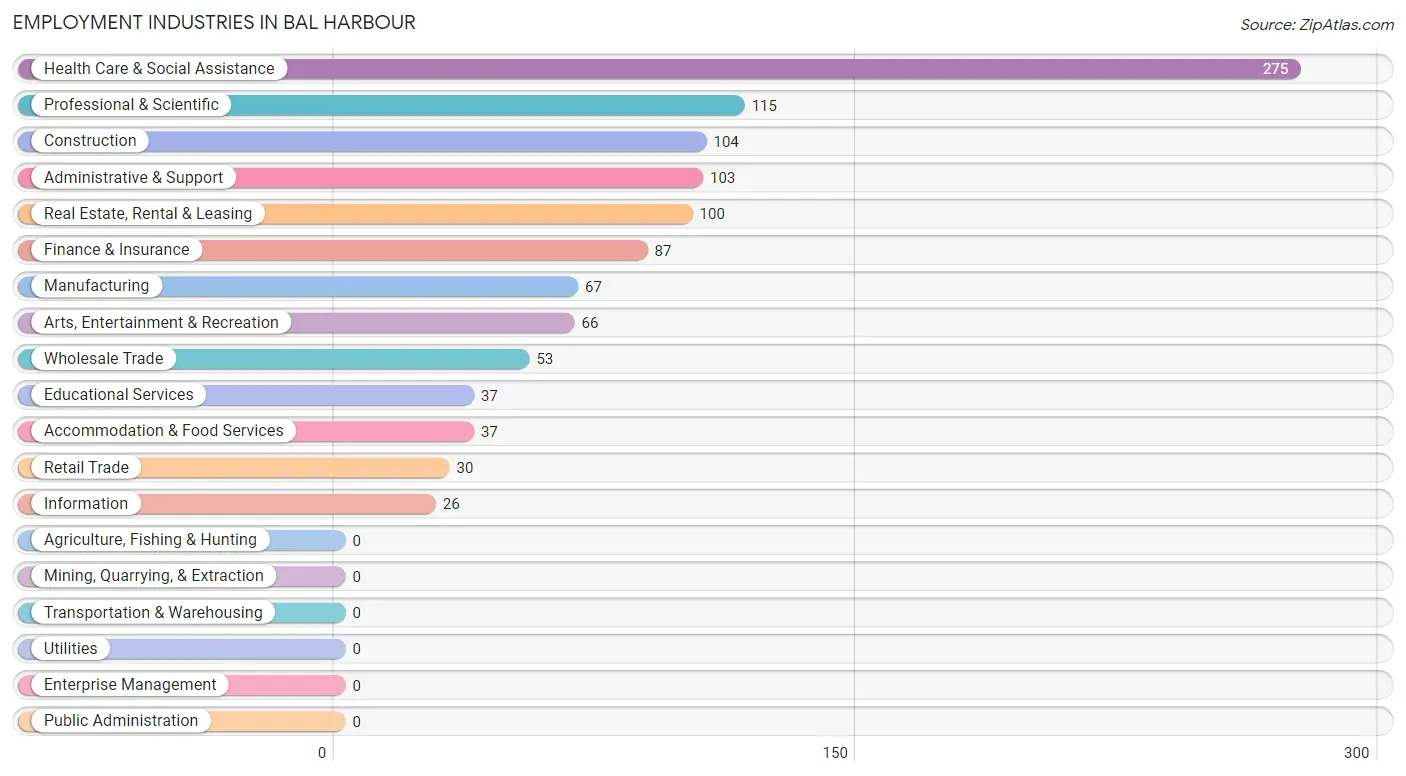
Employment Industries in Bal Harbour
The major employment industries in Bal Harbour include Health Care & Social Assistance (275 | 22.8%), Professional & Scientific (115 | 9.5%), Construction (104 | 8.6%), Administrative & Support (103 | 8.5%), and Real Estate, Rental & Leasing (100 | 8.3%).
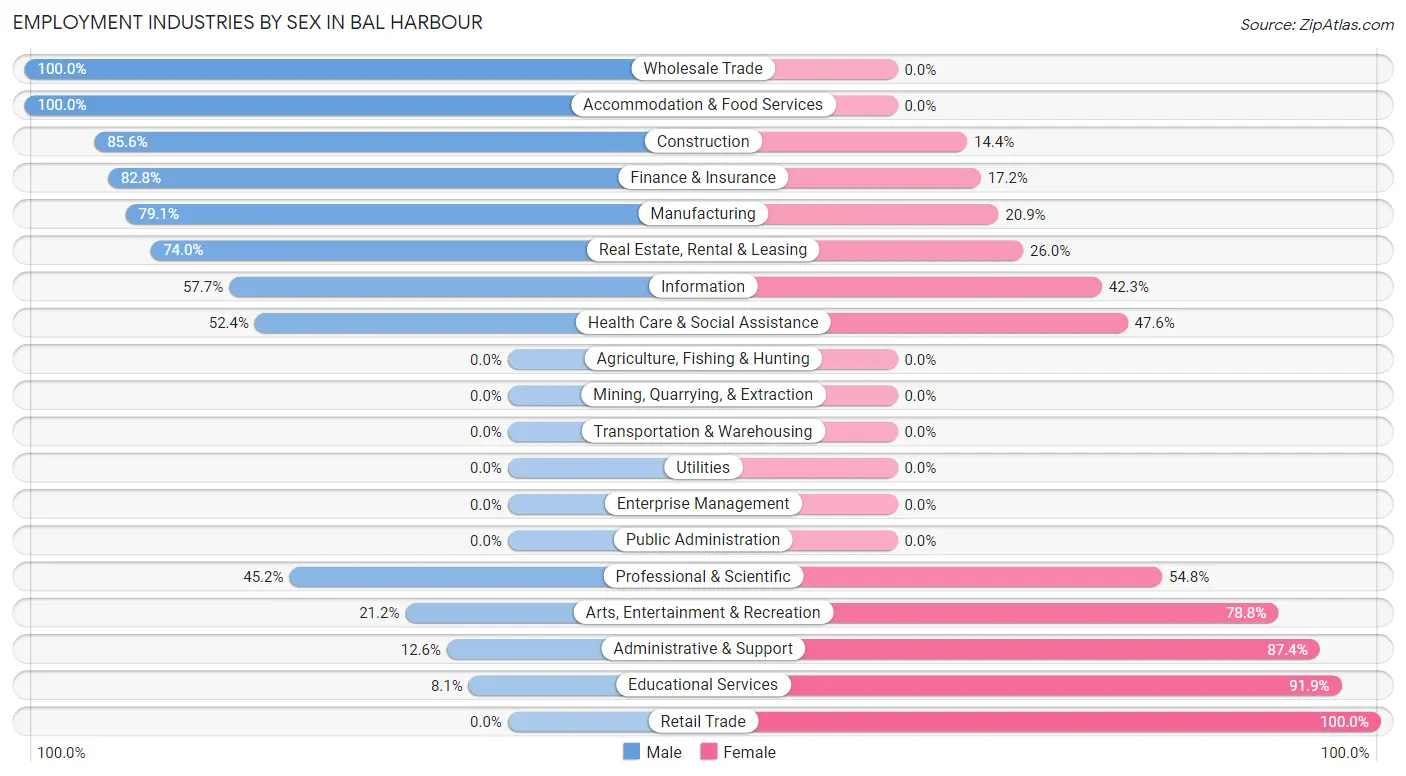
Employment Industries by Sex in Bal Harbour
The Bal Harbour industries that see more men than women are Wholesale Trade (100.0%), Accommodation & Food Services (100.0%), and Construction (85.6%), whereas the industries that tend to have a higher number of women are Retail Trade (100.0%), Educational Services (91.9%), and Administrative & Support (87.4%).
| Industry | Male | Female |
| Agriculture, Fishing & Hunting | 0 (0.0%) | 0 (0.0%) |
| Mining, Quarrying, & Extraction | 0 (0.0%) | 0 (0.0%) |
| Construction | 89 (85.6%) | 15 (14.4%) |
| Manufacturing | 53 (79.1%) | 14 (20.9%) |
| Wholesale Trade | 53 (100.0%) | 0 (0.0%) |
| Retail Trade | 0 (0.0%) | 30 (100.0%) |
| Transportation & Warehousing | 0 (0.0%) | 0 (0.0%) |
| Utilities | 0 (0.0%) | 0 (0.0%) |
| Information | 15 (57.7%) | 11 (42.3%) |
| Finance & Insurance | 72 (82.8%) | 15 (17.2%) |
| Real Estate, Rental & Leasing | 74 (74.0%) | 26 (26.0%) |
| Professional & Scientific | 52 (45.2%) | 63 (54.8%) |
| Enterprise Management | 0 (0.0%) | 0 (0.0%) |
| Administrative & Support | 13 (12.6%) | 90 (87.4%) |
| Educational Services | 3 (8.1%) | 34 (91.9%) |
| Health Care & Social Assistance | 144 (52.4%) | 131 (47.6%) |
| Arts, Entertainment & Recreation | 14 (21.2%) | 52 (78.8%) |
| Accommodation & Food Services | 37 (100.0%) | 0 (0.0%) |
| Public Administration | 0 (0.0%) | 0 (0.0%) |
| Total | 658 (54.4%) | 551 (45.6%) |
Education in Bal Harbour
School Enrollment in Bal Harbour
The most common levels of schooling among the 668 students in Bal Harbour are middle school (220 | 32.9%), elementary school (128 | 19.2%), and high school (124 | 18.6%).
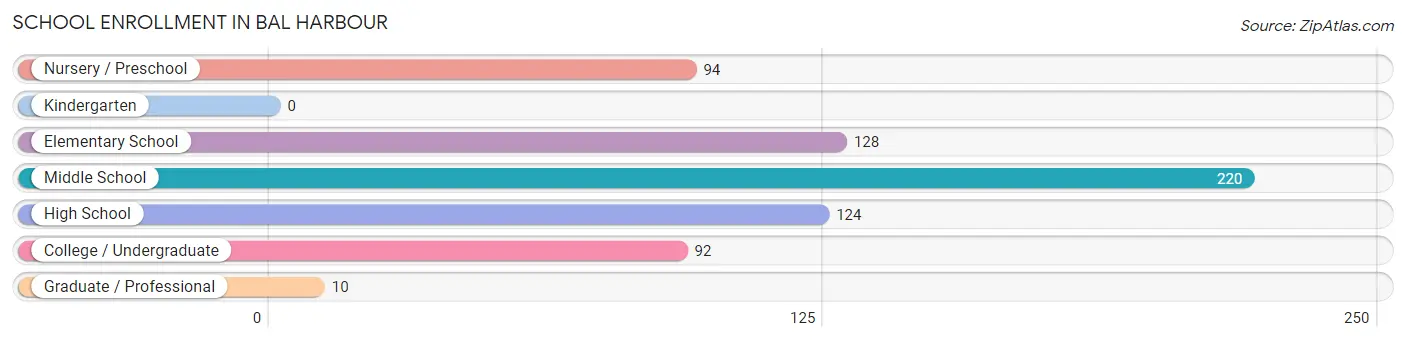
| School Level | # Students | % Students |
| Nursery / Preschool | 94 | 14.1% |
| Kindergarten | 0 | 0.0% |
| Elementary School | 128 | 19.2% |
| Middle School | 220 | 32.9% |
| High School | 124 | 18.6% |
| College / Undergraduate | 92 | 13.8% |
| Graduate / Professional | 10 | 1.5% |
| Total | 668 | 100.0% |
School Enrollment by Age by Funding Source in Bal Harbour
Out of a total of 668 students who are enrolled in schools in Bal Harbour, 459 (68.7%) attend a private institution, while the remaining 209 (31.3%) are enrolled in public schools. The age group of 3 to 4 year olds has the highest likelihood of being enrolled in private schools, with 46 (100.0% in the age bracket) enrolled. Conversely, the age group of 25 to 34 year olds has the lowest likelihood of being enrolled in a private school, with 26 (100.0% in the age bracket) attending a public institution.
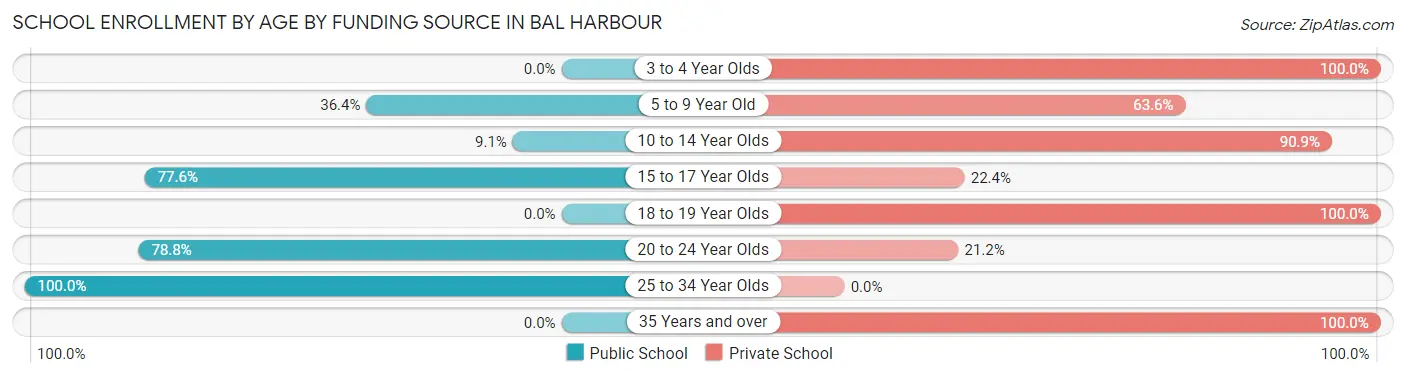
| Age Bracket | Public School | Private School |
| 3 to 4 Year Olds | 0 (0.0%) | 46 (100.0%) |
| 5 to 9 Year Old | 48 (36.4%) | 84 (63.6%) |
| 10 to 14 Year Olds | 24 (9.1%) | 240 (90.9%) |
| 15 to 17 Year Olds | 59 (77.6%) | 17 (22.4%) |
| 18 to 19 Year Olds | 0 (0.0%) | 48 (100.0%) |
| 20 to 24 Year Olds | 52 (78.8%) | 14 (21.2%) |
| 25 to 34 Year Olds | 26 (100.0%) | 0 (0.0%) |
| 35 Years and over | 0 (0.0%) | 10 (100.0%) |
| Total | 209 (31.3%) | 459 (68.7%) |
Educational Attainment by Field of Study in Bal Harbour
Education (307 | 20.9%), business (251 | 17.1%), social sciences (153 | 10.4%), literature & languages (149 | 10.2%), and psychology (122 | 8.3%) are the most common fields of study among 1,468 individuals in Bal Harbour who have obtained a bachelor's degree or higher.
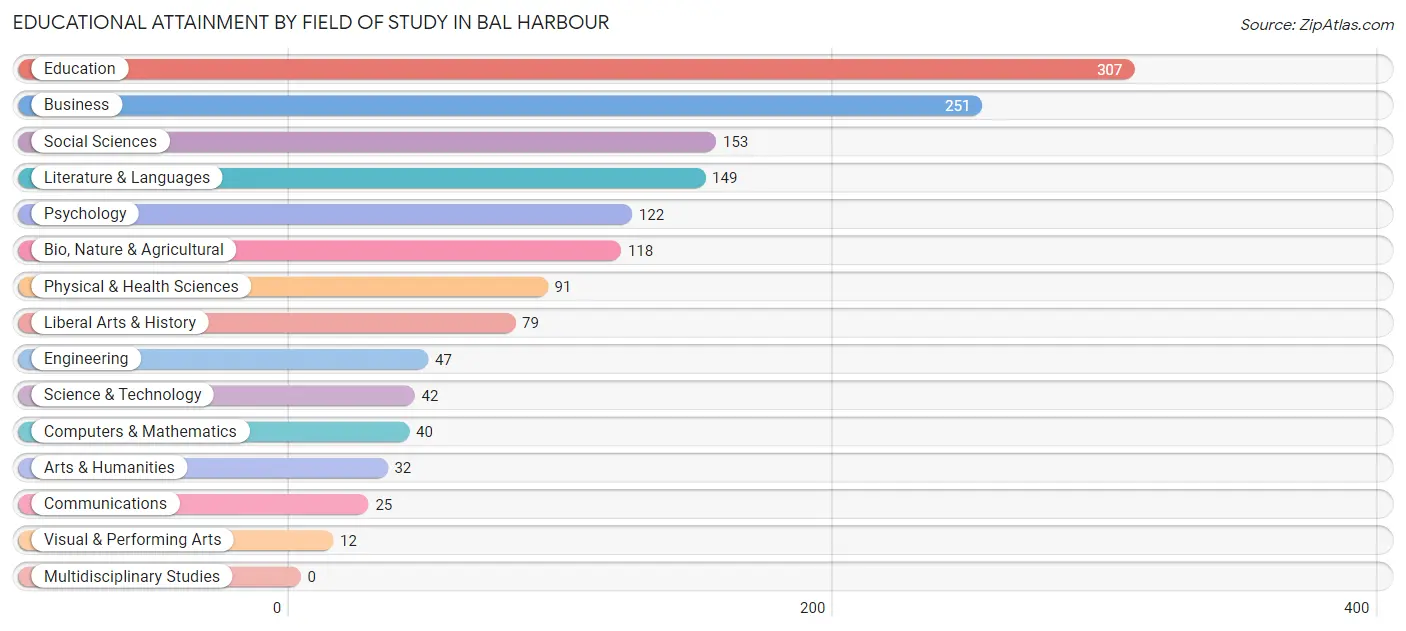
| Field of Study | # Graduates | % Graduates |
| Computers & Mathematics | 40 | 2.7% |
| Bio, Nature & Agricultural | 118 | 8.0% |
| Physical & Health Sciences | 91 | 6.2% |
| Psychology | 122 | 8.3% |
| Social Sciences | 153 | 10.4% |
| Engineering | 47 | 3.2% |
| Multidisciplinary Studies | 0 | 0.0% |
| Science & Technology | 42 | 2.9% |
| Business | 251 | 17.1% |
| Education | 307 | 20.9% |
| Literature & Languages | 149 | 10.2% |
| Liberal Arts & History | 79 | 5.4% |
| Visual & Performing Arts | 12 | 0.8% |
| Communications | 25 | 1.7% |
| Arts & Humanities | 32 | 2.2% |
| Total | 1,468 | 100.0% |
Transportation & Commute in Bal Harbour
Vehicle Availability by Sex in Bal Harbour
The most prevalent vehicle ownership categories in Bal Harbour are males with 2 vehicles (249, accounting for 37.8%) and females with 2 vehicles (111, making up 45.2%).
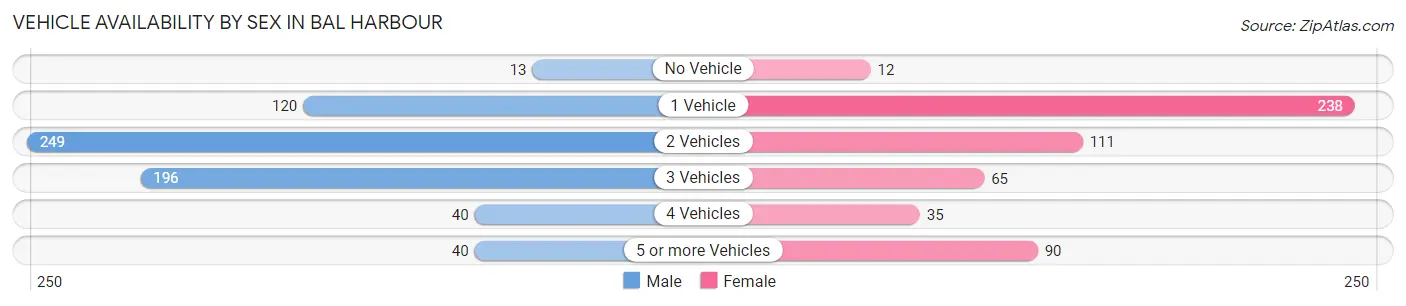
| Vehicles Available | Male | Female |
| No Vehicle | 13 (2.0%) | 12 (2.2%) |
| 1 Vehicle | 120 (18.2%) | 238 (43.2%) |
| 2 Vehicles | 249 (37.8%) | 111 (20.2%) |
| 3 Vehicles | 196 (29.8%) | 65 (11.8%) |
| 4 Vehicles | 40 (6.1%) | 35 (6.4%) |
| 5 or more Vehicles | 40 (6.1%) | 90 (16.3%) |
| Total | 658 (100.0%) | 551 (100.0%) |
Commute Time in Bal Harbour
The most frequently occuring commute durations in Bal Harbour are 60 to 89 minutes (183 commuters, 18.9%), 30 to 34 minutes (127 commuters, 13.1%), and 5 to 9 minutes (125 commuters, 12.9%).
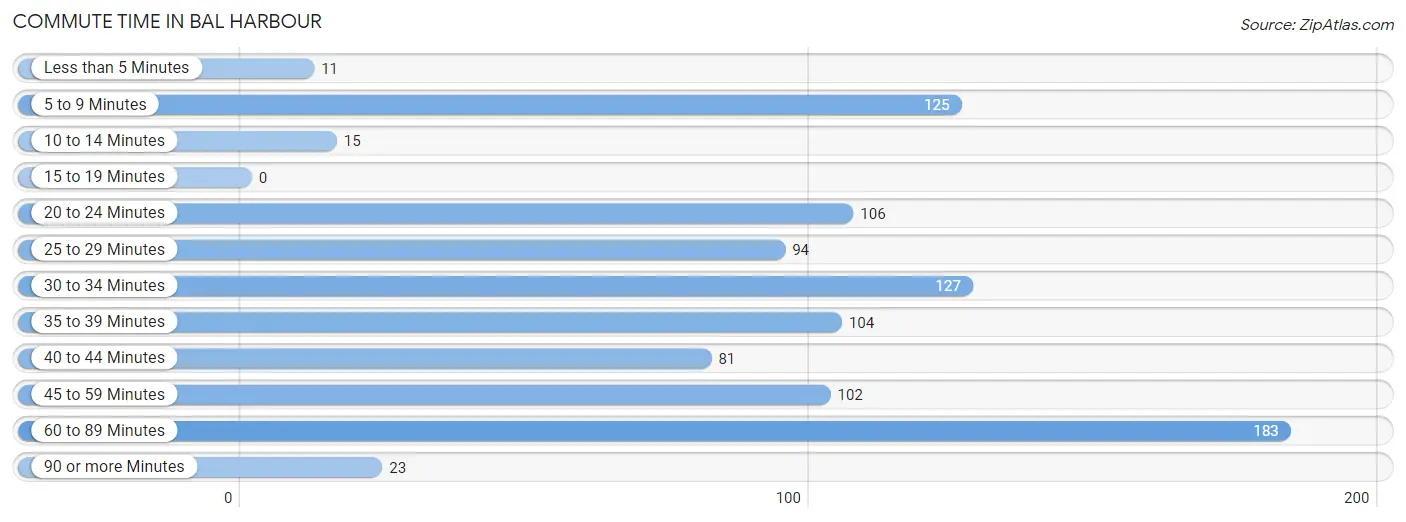
| Commute Time | # Commuters | % Commuters |
| Less than 5 Minutes | 11 | 1.1% |
| 5 to 9 Minutes | 125 | 12.9% |
| 10 to 14 Minutes | 15 | 1.5% |
| 15 to 19 Minutes | 0 | 0.0% |
| 20 to 24 Minutes | 106 | 10.9% |
| 25 to 29 Minutes | 94 | 9.7% |
| 30 to 34 Minutes | 127 | 13.1% |
| 35 to 39 Minutes | 104 | 10.7% |
| 40 to 44 Minutes | 81 | 8.3% |
| 45 to 59 Minutes | 102 | 10.5% |
| 60 to 89 Minutes | 183 | 18.9% |
| 90 or more Minutes | 23 | 2.4% |
Commute Time by Sex in Bal Harbour
The most common commute times in Bal Harbour are 30 to 34 minutes (110 commuters, 23.0%) for males and 60 to 89 minutes (134 commuters, 27.2%) for females.
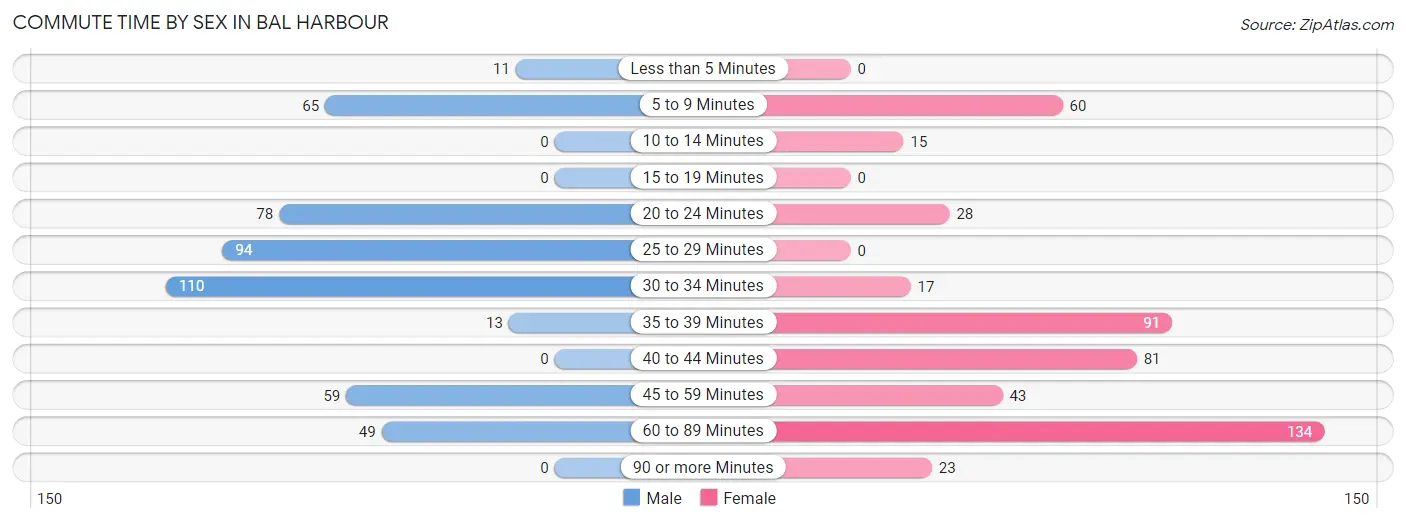
| Commute Time | Male | Female |
| Less than 5 Minutes | 11 (2.3%) | 0 (0.0%) |
| 5 to 9 Minutes | 65 (13.6%) | 60 (12.2%) |
| 10 to 14 Minutes | 0 (0.0%) | 15 (3.0%) |
| 15 to 19 Minutes | 0 (0.0%) | 0 (0.0%) |
| 20 to 24 Minutes | 78 (16.3%) | 28 (5.7%) |
| 25 to 29 Minutes | 94 (19.6%) | 0 (0.0%) |
| 30 to 34 Minutes | 110 (23.0%) | 17 (3.5%) |
| 35 to 39 Minutes | 13 (2.7%) | 91 (18.5%) |
| 40 to 44 Minutes | 0 (0.0%) | 81 (16.5%) |
| 45 to 59 Minutes | 59 (12.3%) | 43 (8.7%) |
| 60 to 89 Minutes | 49 (10.2%) | 134 (27.2%) |
| 90 or more Minutes | 0 (0.0%) | 23 (4.7%) |
Time of Departure to Work by Sex in Bal Harbour
The most frequent times of departure to work in Bal Harbour are 8:00 AM to 8:29 AM (200, 41.7%) for males and 9:00 AM to 9:59 AM (142, 28.9%) for females.
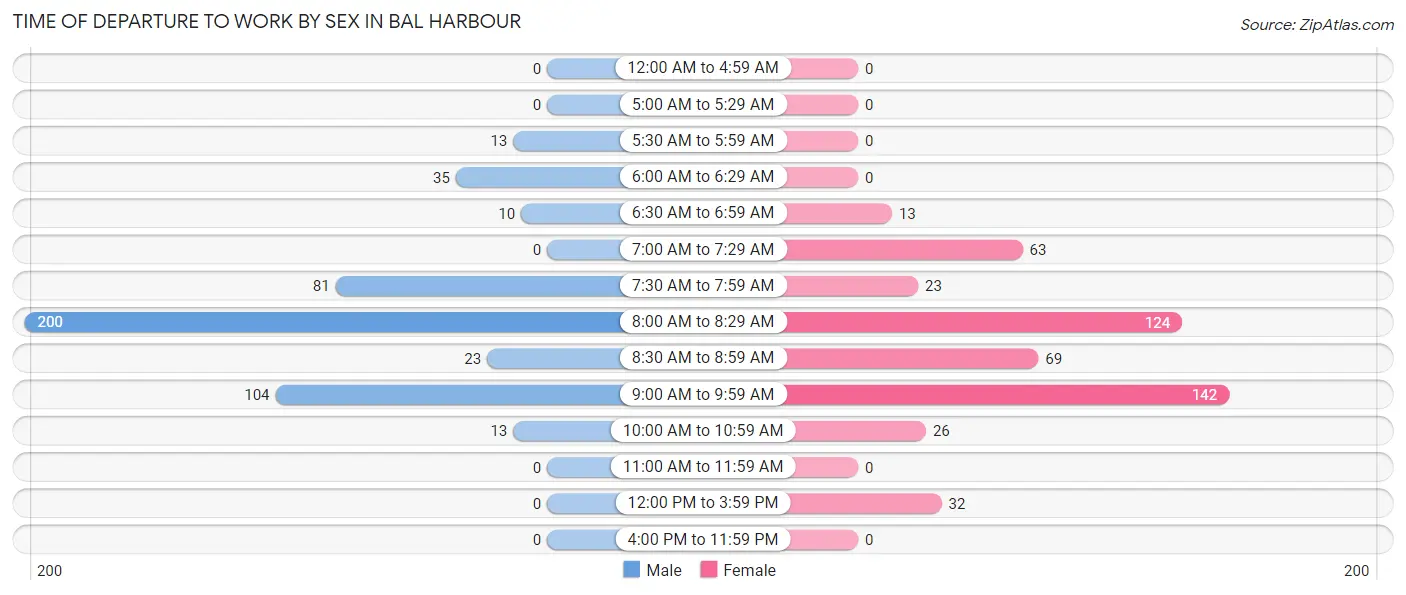
| Time of Departure | Male | Female |
| 12:00 AM to 4:59 AM | 0 (0.0%) | 0 (0.0%) |
| 5:00 AM to 5:29 AM | 0 (0.0%) | 0 (0.0%) |
| 5:30 AM to 5:59 AM | 13 (2.7%) | 0 (0.0%) |
| 6:00 AM to 6:29 AM | 35 (7.3%) | 0 (0.0%) |
| 6:30 AM to 6:59 AM | 10 (2.1%) | 13 (2.6%) |
| 7:00 AM to 7:29 AM | 0 (0.0%) | 63 (12.8%) |
| 7:30 AM to 7:59 AM | 81 (16.9%) | 23 (4.7%) |
| 8:00 AM to 8:29 AM | 200 (41.7%) | 124 (25.2%) |
| 8:30 AM to 8:59 AM | 23 (4.8%) | 69 (14.0%) |
| 9:00 AM to 9:59 AM | 104 (21.7%) | 142 (28.9%) |
| 10:00 AM to 10:59 AM | 13 (2.7%) | 26 (5.3%) |
| 11:00 AM to 11:59 AM | 0 (0.0%) | 0 (0.0%) |
| 12:00 PM to 3:59 PM | 0 (0.0%) | 32 (6.5%) |
| 4:00 PM to 11:59 PM | 0 (0.0%) | 0 (0.0%) |
| Total | 479 (100.0%) | 492 (100.0%) |
Housing Occupancy in Bal Harbour
Occupancy by Ownership in Bal Harbour
Of the total 1,325 dwellings in Bal Harbour, owner-occupied units account for 972 (73.4%), while renter-occupied units make up 353 (26.6%).
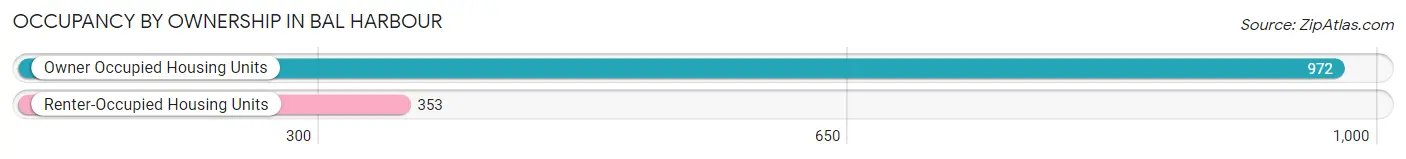
| Occupancy | # Housing Units | % Housing Units |
| Owner Occupied Housing Units | 972 | 73.4% |
| Renter-Occupied Housing Units | 353 | 26.6% |
| Total Occupied Housing Units | 1,325 | 100.0% |
Occupancy by Household Size in Bal Harbour
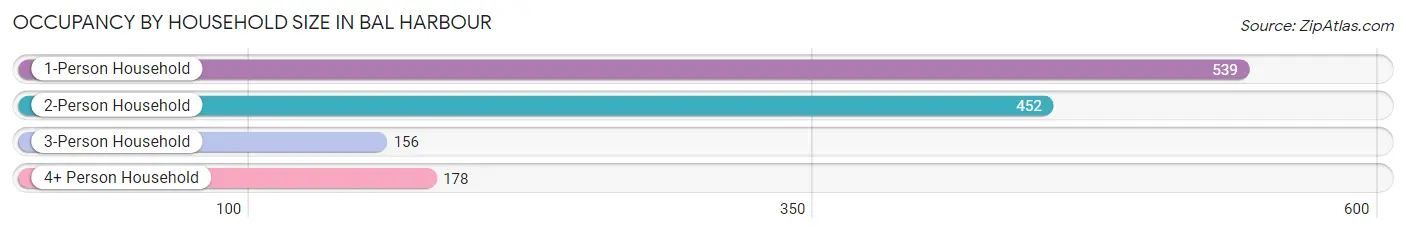
| Household Size | # Housing Units | % Housing Units |
| 1-Person Household | 539 | 40.7% |
| 2-Person Household | 452 | 34.1% |
| 3-Person Household | 156 | 11.8% |
| 4+ Person Household | 178 | 13.4% |
| Total Housing Units | 1,325 | 100.0% |
Occupancy by Ownership by Household Size in Bal Harbour
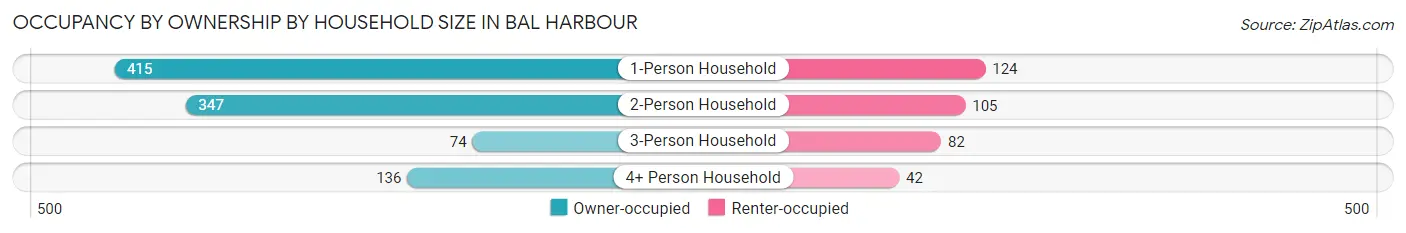
| Household Size | Owner-occupied | Renter-occupied |
| 1-Person Household | 415 (77.0%) | 124 (23.0%) |
| 2-Person Household | 347 (76.8%) | 105 (23.2%) |
| 3-Person Household | 74 (47.4%) | 82 (52.6%) |
| 4+ Person Household | 136 (76.4%) | 42 (23.6%) |
| Total Housing Units | 972 (73.4%) | 353 (26.6%) |
Occupancy by Educational Attainment in Bal Harbour
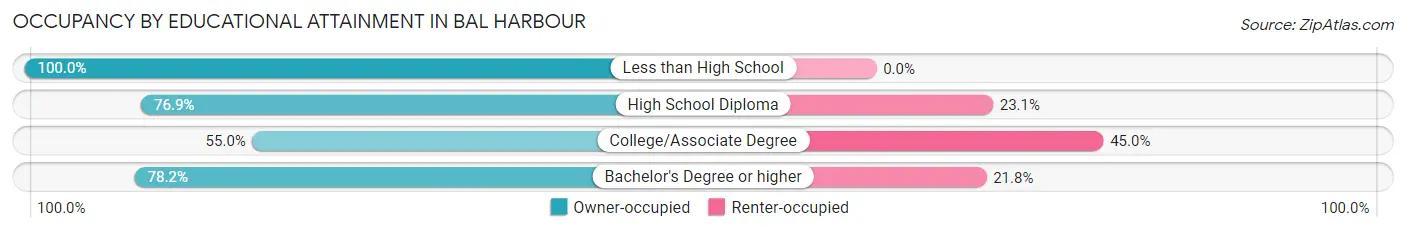
| Household Size | Owner-occupied | Renter-occupied |
| Less than High School | 26 (100.0%) | 0 (0.0%) |
| High School Diploma | 123 (76.9%) | 37 (23.1%) |
| College/Associate Degree | 160 (55.0%) | 131 (45.0%) |
| Bachelor's Degree or higher | 663 (78.2%) | 185 (21.8%) |
Occupancy by Age of Householder in Bal Harbour
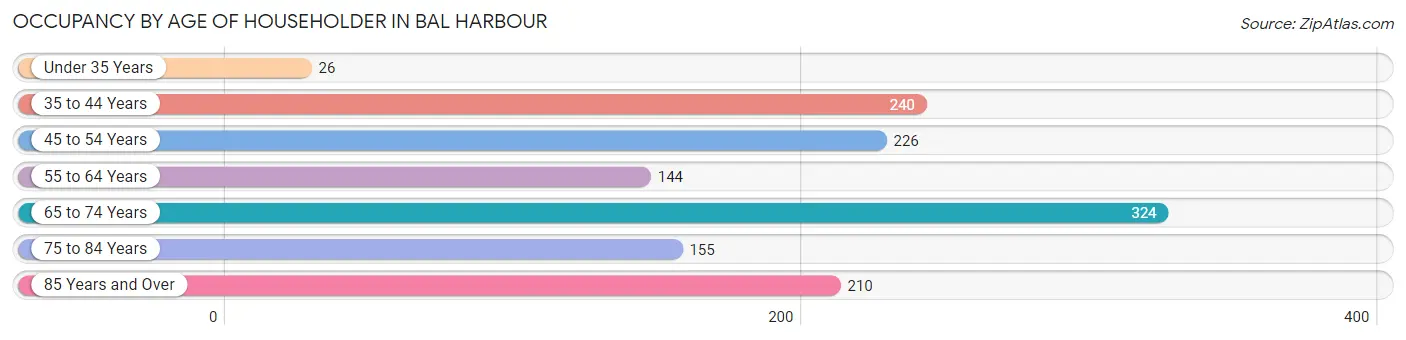
| Age Bracket | # Households | % Households |
| Under 35 Years | 26 | 2.0% |
| 35 to 44 Years | 240 | 18.1% |
| 45 to 54 Years | 226 | 17.1% |
| 55 to 64 Years | 144 | 10.9% |
| 65 to 74 Years | 324 | 24.4% |
| 75 to 84 Years | 155 | 11.7% |
| 85 Years and Over | 210 | 15.9% |
| Total | 1,325 | 100.0% |
Housing Finances in Bal Harbour
Median Income by Occupancy in Bal Harbour
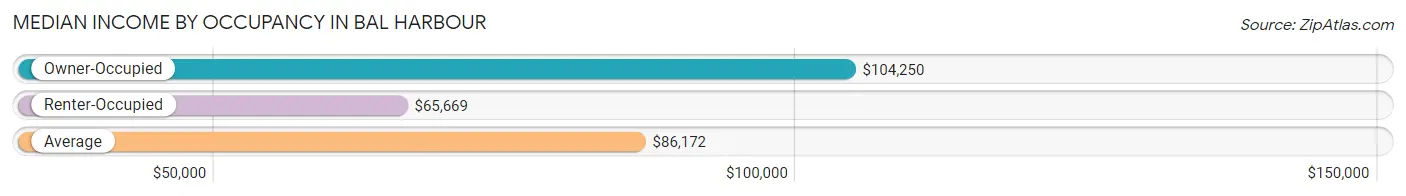
| Occupancy Type | # Households | Median Income |
| Owner-Occupied | 972 (73.4%) | $104,250 |
| Renter-Occupied | 353 (26.6%) | $65,669 |
| Average | 1,325 (100.0%) | $86,172 |
Occupancy by Householder Income Bracket in Bal Harbour
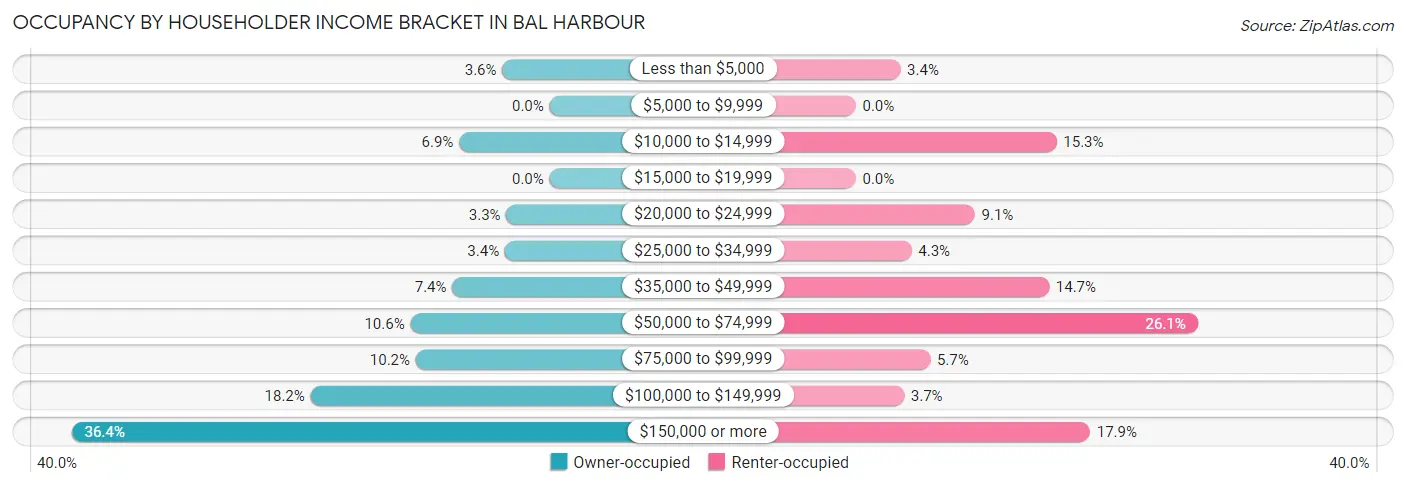
| Income Bracket | Owner-occupied | Renter-occupied |
| Less than $5,000 | 35 (3.6%) | 12 (3.4%) |
| $5,000 to $9,999 | 0 (0.0%) | 0 (0.0%) |
| $10,000 to $14,999 | 67 (6.9%) | 54 (15.3%) |
| $15,000 to $19,999 | 0 (0.0%) | 0 (0.0%) |
| $20,000 to $24,999 | 32 (3.3%) | 32 (9.1%) |
| $25,000 to $34,999 | 33 (3.4%) | 15 (4.3%) |
| $35,000 to $49,999 | 72 (7.4%) | 52 (14.7%) |
| $50,000 to $74,999 | 103 (10.6%) | 92 (26.1%) |
| $75,000 to $99,999 | 99 (10.2%) | 20 (5.7%) |
| $100,000 to $149,999 | 177 (18.2%) | 13 (3.7%) |
| $150,000 or more | 354 (36.4%) | 63 (17.8%) |
| Total | 972 (100.0%) | 353 (100.0%) |
Monthly Housing Cost Tiers in Bal Harbour
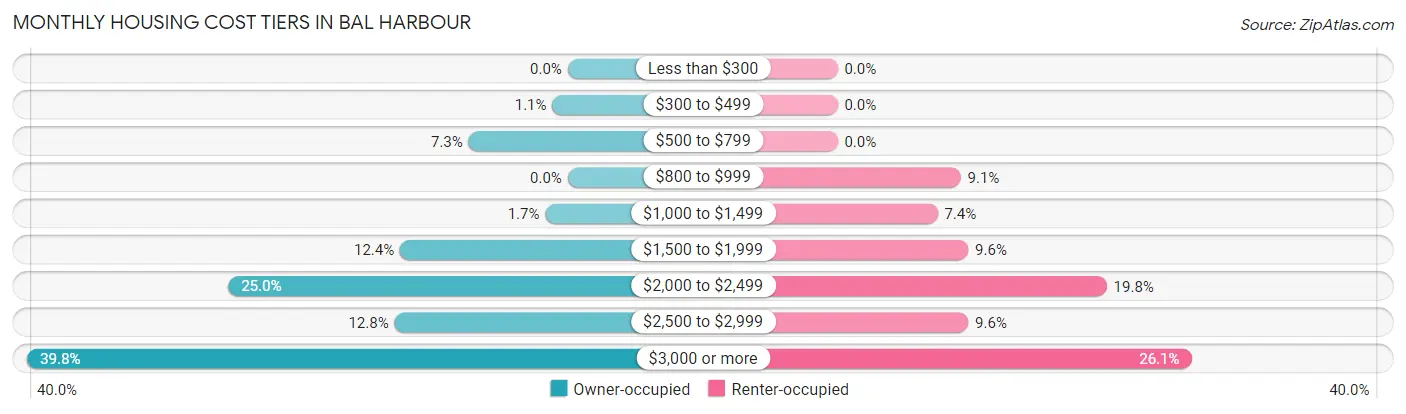
| Monthly Cost | Owner-occupied | Renter-occupied |
| Less than $300 | 0 (0.0%) | 0 (0.0%) |
| $300 to $499 | 11 (1.1%) | 0 (0.0%) |
| $500 to $799 | 71 (7.3%) | 0 (0.0%) |
| $800 to $999 | 0 (0.0%) | 32 (9.1%) |
| $1,000 to $1,499 | 16 (1.7%) | 26 (7.4%) |
| $1,500 to $1,999 | 120 (12.3%) | 34 (9.6%) |
| $2,000 to $2,499 | 243 (25.0%) | 70 (19.8%) |
| $2,500 to $2,999 | 124 (12.8%) | 34 (9.6%) |
| $3,000 or more | 387 (39.8%) | 92 (26.1%) |
| Total | 972 (100.0%) | 353 (100.0%) |
Physical Housing Characteristics in Bal Harbour
Housing Structures in Bal Harbour
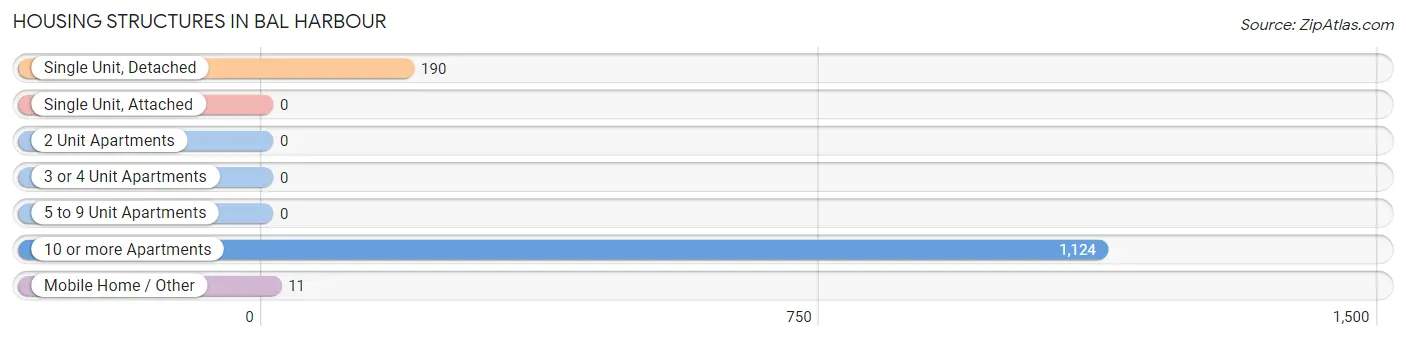
| Structure Type | # Housing Units | % Housing Units |
| Single Unit, Detached | 190 | 14.3% |
| Single Unit, Attached | 0 | 0.0% |
| 2 Unit Apartments | 0 | 0.0% |
| 3 or 4 Unit Apartments | 0 | 0.0% |
| 5 to 9 Unit Apartments | 0 | 0.0% |
| 10 or more Apartments | 1,124 | 84.8% |
| Mobile Home / Other | 11 | 0.8% |
| Total | 1,325 | 100.0% |
Housing Structures by Occupancy in Bal Harbour
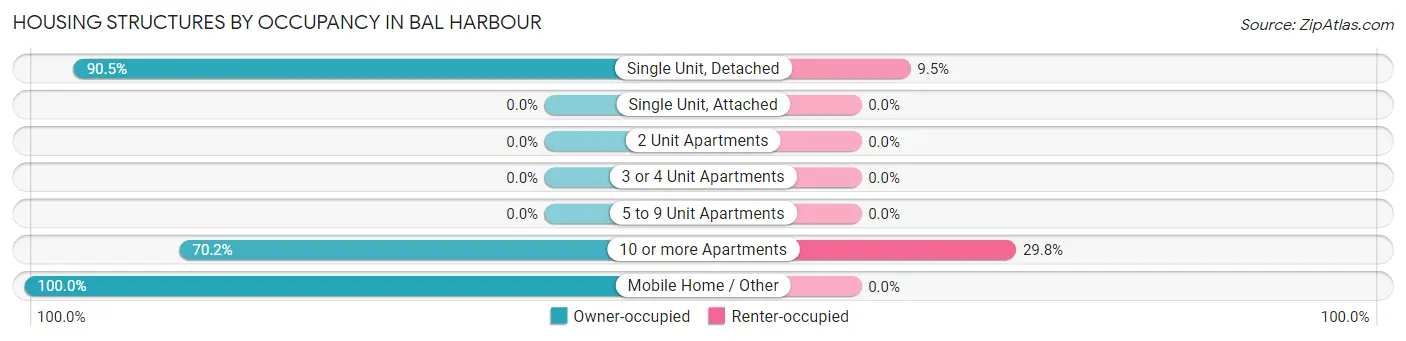
| Structure Type | Owner-occupied | Renter-occupied |
| Single Unit, Detached | 172 (90.5%) | 18 (9.5%) |
| Single Unit, Attached | 0 (0.0%) | 0 (0.0%) |
| 2 Unit Apartments | 0 (0.0%) | 0 (0.0%) |
| 3 or 4 Unit Apartments | 0 (0.0%) | 0 (0.0%) |
| 5 to 9 Unit Apartments | 0 (0.0%) | 0 (0.0%) |
| 10 or more Apartments | 789 (70.2%) | 335 (29.8%) |
| Mobile Home / Other | 11 (100.0%) | 0 (0.0%) |
| Total | 972 (73.4%) | 353 (26.6%) |
Housing Structures by Number of Rooms in Bal Harbour
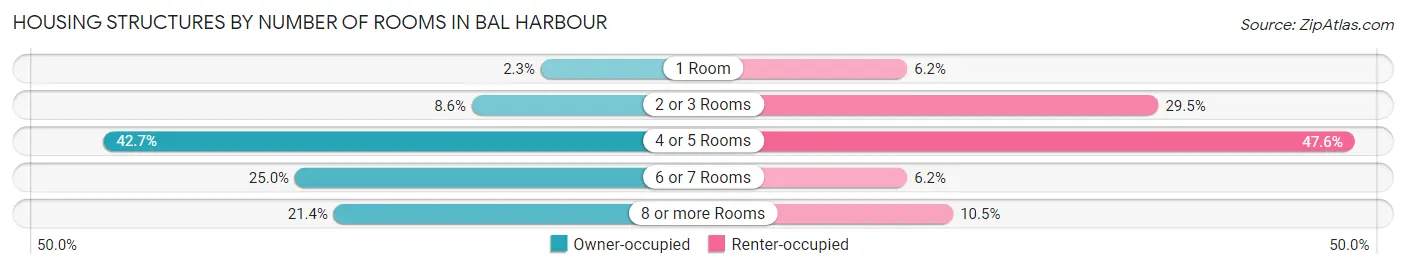
| Number of Rooms | Owner-occupied | Renter-occupied |
| 1 Room | 22 (2.3%) | 22 (6.2%) |
| 2 or 3 Rooms | 84 (8.6%) | 104 (29.5%) |
| 4 or 5 Rooms | 415 (42.7%) | 168 (47.6%) |
| 6 or 7 Rooms | 243 (25.0%) | 22 (6.2%) |
| 8 or more Rooms | 208 (21.4%) | 37 (10.5%) |
| Total | 972 (100.0%) | 353 (100.0%) |
Housing Structure by Heating Type in Bal Harbour
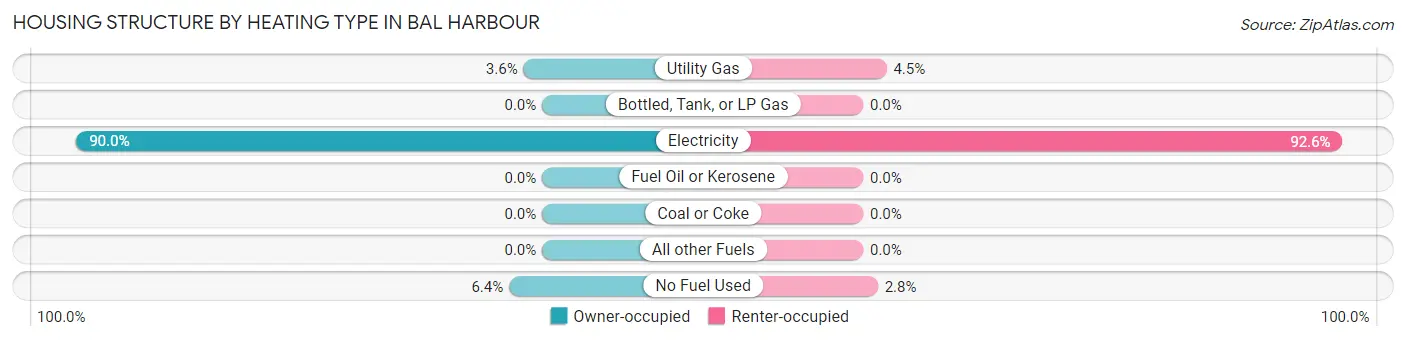
| Heating Type | Owner-occupied | Renter-occupied |
| Utility Gas | 35 (3.6%) | 16 (4.5%) |
| Bottled, Tank, or LP Gas | 0 (0.0%) | 0 (0.0%) |
| Electricity | 875 (90.0%) | 327 (92.6%) |
| Fuel Oil or Kerosene | 0 (0.0%) | 0 (0.0%) |
| Coal or Coke | 0 (0.0%) | 0 (0.0%) |
| All other Fuels | 0 (0.0%) | 0 (0.0%) |
| No Fuel Used | 62 (6.4%) | 10 (2.8%) |
| Total | 972 (100.0%) | 353 (100.0%) |
Household Vehicle Usage in Bal Harbour
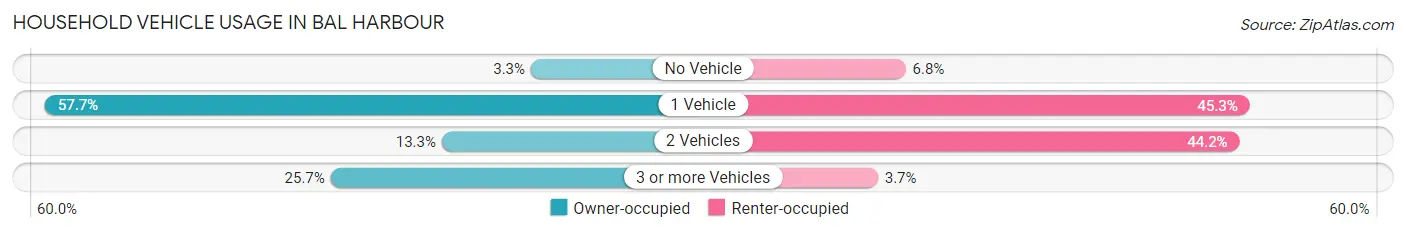
| Vehicles per Household | Owner-occupied | Renter-occupied |
| No Vehicle | 32 (3.3%) | 24 (6.8%) |
| 1 Vehicle | 561 (57.7%) | 160 (45.3%) |
| 2 Vehicles | 129 (13.3%) | 156 (44.2%) |
| 3 or more Vehicles | 250 (25.7%) | 13 (3.7%) |
| Total | 972 (100.0%) | 353 (100.0%) |
Real Estate & Mortgages in Bal Harbour
Real Estate and Mortgage Overview in Bal Harbour
| Characteristic | Without Mortgage | With Mortgage |
| Housing Units | 670 | 302 |
| Median Property Value | $1,541,700 | $1,703,900 |
| Median Household Income | $113,333 | $118 |
| Monthly Housing Costs | $1,501 | $246 |
| Real Estate Taxes | $10,001 | $0 |
Property Value by Mortgage Status in Bal Harbour
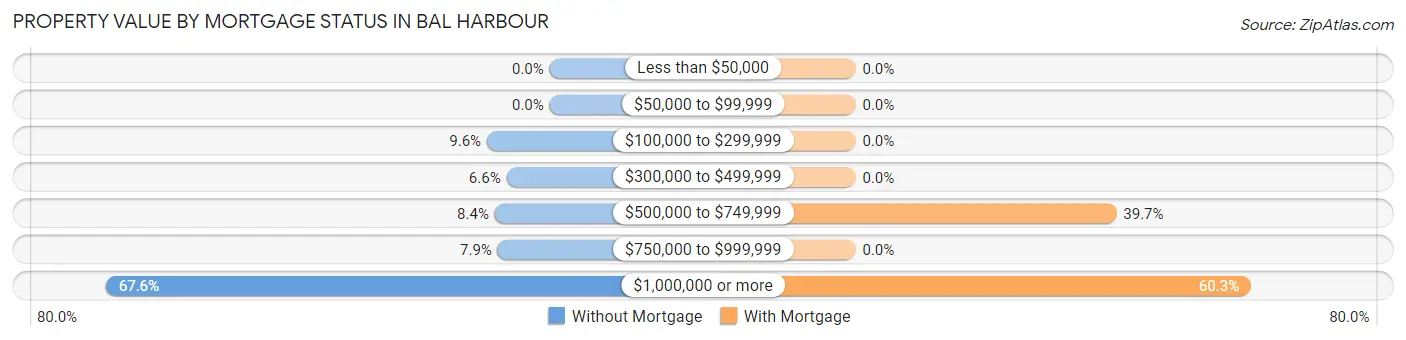
| Property Value | Without Mortgage | With Mortgage |
| Less than $50,000 | 0 (0.0%) | 0 (0.0%) |
| $50,000 to $99,999 | 0 (0.0%) | 0 (0.0%) |
| $100,000 to $299,999 | 64 (9.6%) | 0 (0.0%) |
| $300,000 to $499,999 | 44 (6.6%) | 0 (0.0%) |
| $500,000 to $749,999 | 56 (8.4%) | 120 (39.7%) |
| $750,000 to $999,999 | 53 (7.9%) | 0 (0.0%) |
| $1,000,000 or more | 453 (67.6%) | 182 (60.3%) |
| Total | 670 (100.0%) | 302 (100.0%) |
Household Income by Mortgage Status in Bal Harbour
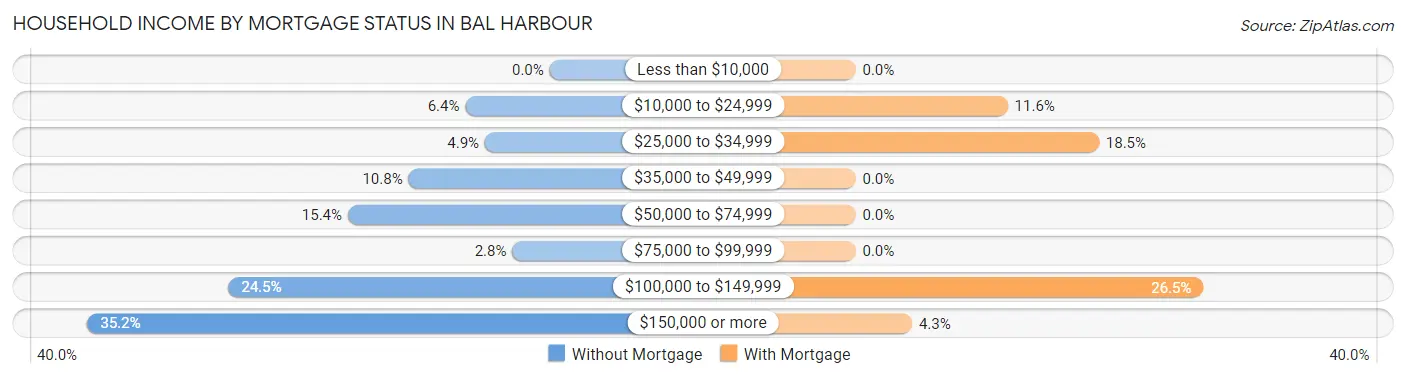
| Household Income | Without Mortgage | With Mortgage |
| Less than $10,000 | 0 (0.0%) | 0 (0.0%) |
| $10,000 to $24,999 | 43 (6.4%) | 35 (11.6%) |
| $25,000 to $34,999 | 33 (4.9%) | 56 (18.5%) |
| $35,000 to $49,999 | 72 (10.7%) | 0 (0.0%) |
| $50,000 to $74,999 | 103 (15.4%) | 0 (0.0%) |
| $75,000 to $99,999 | 19 (2.8%) | 0 (0.0%) |
| $100,000 to $149,999 | 164 (24.5%) | 80 (26.5%) |
| $150,000 or more | 236 (35.2%) | 13 (4.3%) |
| Total | 670 (100.0%) | 302 (100.0%) |
Property Value to Household Income Ratio in Bal Harbour
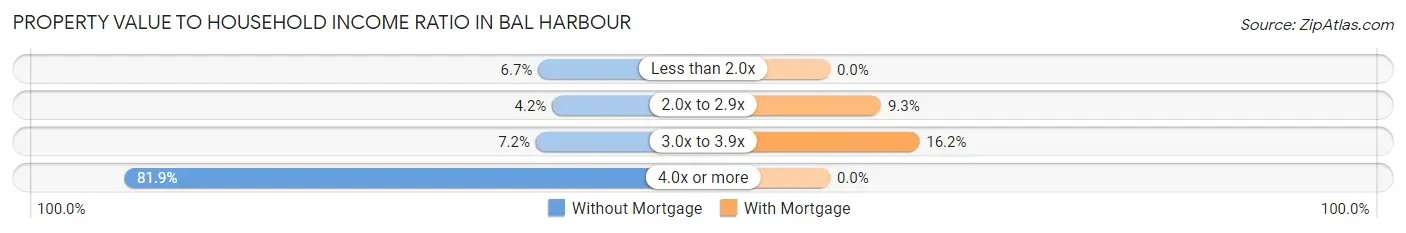
| Value-to-Income Ratio | Without Mortgage | With Mortgage |
| Less than 2.0x | 45 (6.7%) | 0 (0.0%) |
| 2.0x to 2.9x | 28 (4.2%) | 28 (9.3%) |
| 3.0x to 3.9x | 48 (7.2%) | 49 (16.2%) |
| 4.0x or more | 549 (81.9%) | 0 (0.0%) |
| Total | 670 (100.0%) | 302 (100.0%) |
Real Estate Taxes by Mortgage Status in Bal Harbour
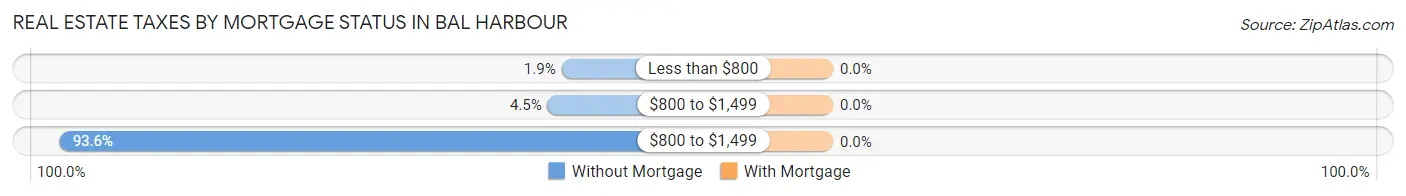
| Property Taxes | Without Mortgage | With Mortgage |
| Less than $800 | 13 (1.9%) | 0 (0.0%) |
| $800 to $1,499 | 30 (4.5%) | 0 (0.0%) |
| $800 to $1,499 | 627 (93.6%) | 0 (0.0%) |
| Total | 670 (100.0%) | 302 (100.0%) |
Health & Disability in Bal Harbour
Health Insurance Coverage by Age in Bal Harbour
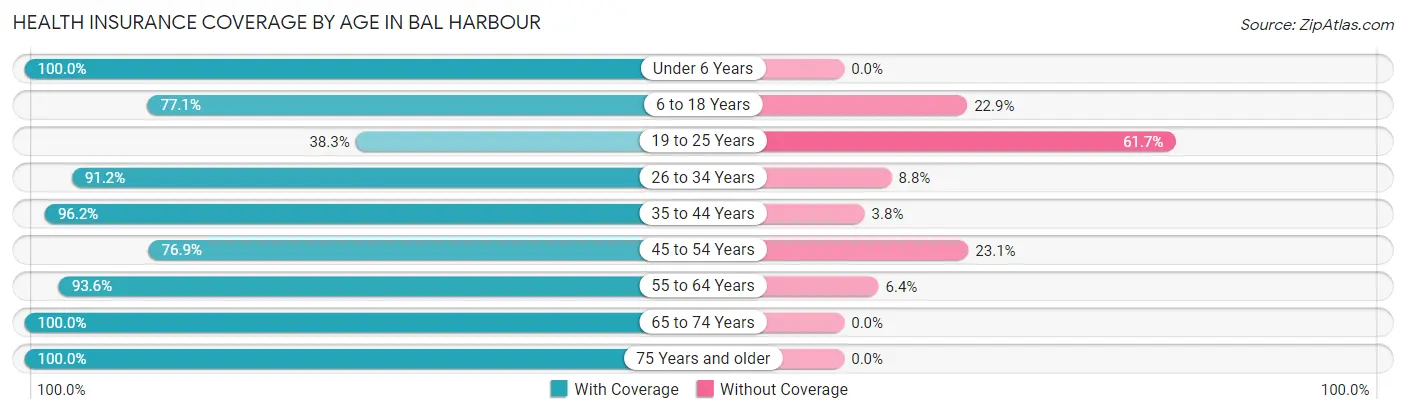
| Age Bracket | With Coverage | Without Coverage |
| Under 6 Years | 129 (100.0%) | 0 (0.0%) |
| 6 to 18 Years | 437 (77.1%) | 130 (22.9%) |
| 19 to 25 Years | 54 (38.3%) | 87 (61.7%) |
| 26 to 34 Years | 124 (91.2%) | 12 (8.8%) |
| 35 to 44 Years | 380 (96.2%) | 15 (3.8%) |
| 45 to 54 Years | 269 (76.9%) | 81 (23.1%) |
| 55 to 64 Years | 337 (93.6%) | 23 (6.4%) |
| 65 to 74 Years | 400 (100.0%) | 0 (0.0%) |
| 75 Years and older | 557 (100.0%) | 0 (0.0%) |
| Total | 2,687 (88.5%) | 348 (11.5%) |
Health Insurance Coverage by Citizenship Status in Bal Harbour
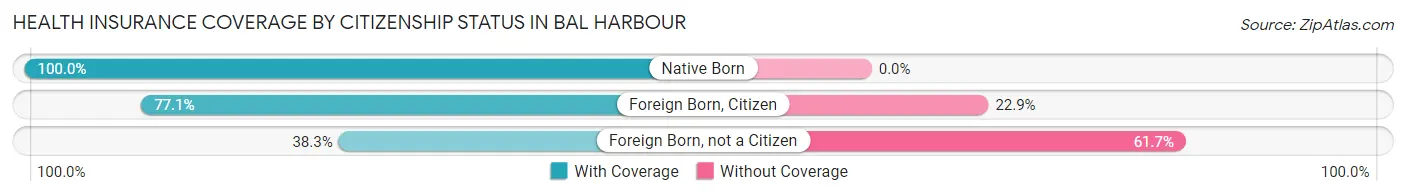
| Citizenship Status | With Coverage | Without Coverage |
| Native Born | 129 (100.0%) | 0 (0.0%) |
| Foreign Born, Citizen | 437 (77.1%) | 130 (22.9%) |
| Foreign Born, not a Citizen | 54 (38.3%) | 87 (61.7%) |
Health Insurance Coverage by Household Income in Bal Harbour
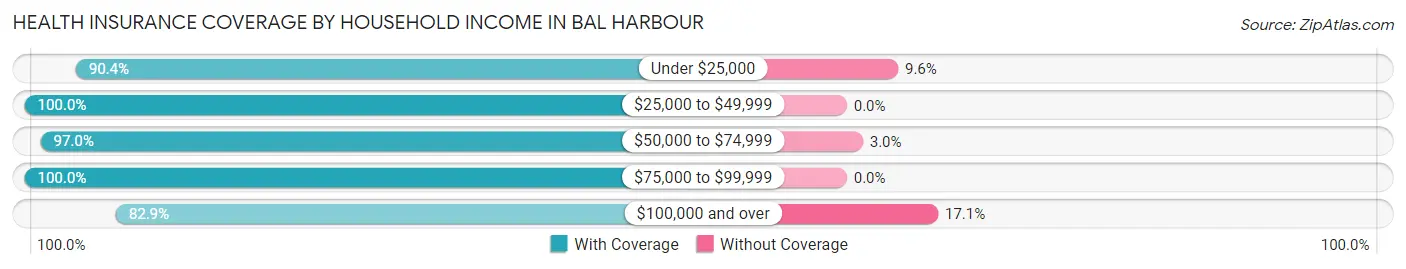
| Household Income | With Coverage | Without Coverage |
| Under $25,000 | 584 (90.4%) | 62 (9.6%) |
| $25,000 to $49,999 | 206 (100.0%) | 0 (0.0%) |
| $50,000 to $74,999 | 388 (97.0%) | 12 (3.0%) |
| $75,000 to $99,999 | 181 (100.0%) | 0 (0.0%) |
| $100,000 and over | 1,328 (82.9%) | 274 (17.1%) |
Public vs Private Health Insurance Coverage by Age in Bal Harbour
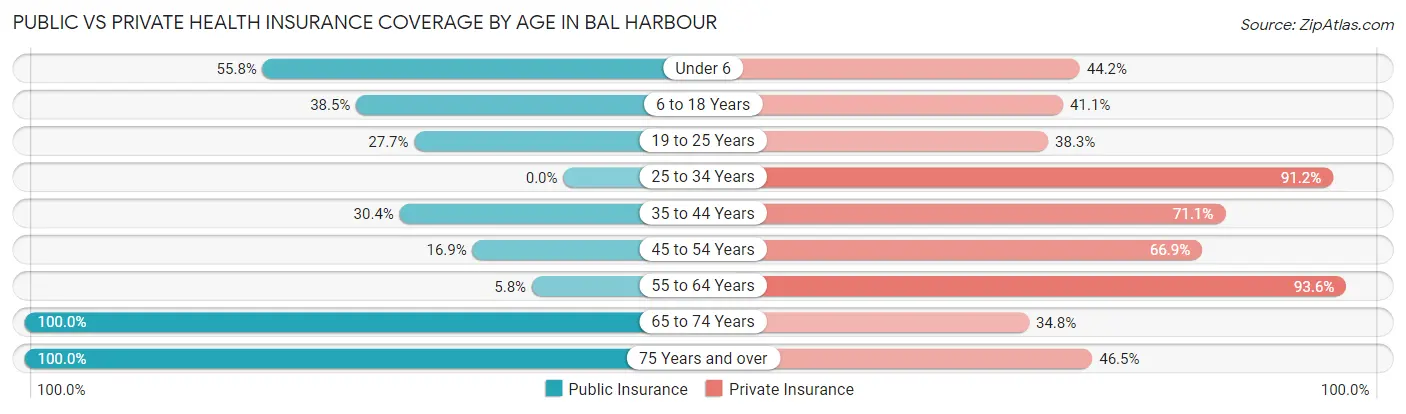
| Age Bracket | Public Insurance | Private Insurance |
| Under 6 | 72 (55.8%) | 57 (44.2%) |
| 6 to 18 Years | 218 (38.5%) | 233 (41.1%) |
| 19 to 25 Years | 39 (27.7%) | 54 (38.3%) |
| 25 to 34 Years | 0 (0.0%) | 124 (91.2%) |
| 35 to 44 Years | 120 (30.4%) | 281 (71.1%) |
| 45 to 54 Years | 59 (16.9%) | 234 (66.9%) |
| 55 to 64 Years | 21 (5.8%) | 337 (93.6%) |
| 65 to 74 Years | 400 (100.0%) | 139 (34.7%) |
| 75 Years and over | 557 (100.0%) | 259 (46.5%) |
| Total | 1,486 (49.0%) | 1,718 (56.6%) |
Disability Status by Sex by Age in Bal Harbour
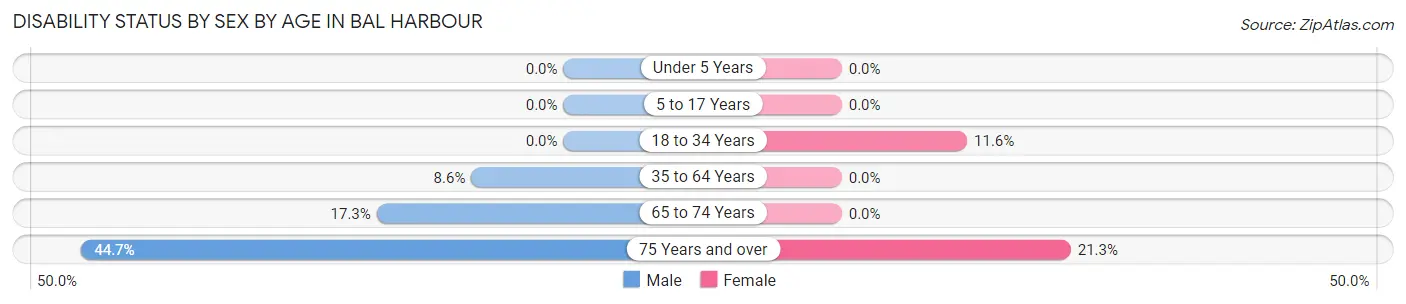
| Age Bracket | Male | Female |
| Under 5 Years | 0 (0.0%) | 0 (0.0%) |
| 5 to 17 Years | 0 (0.0%) | 0 (0.0%) |
| 18 to 34 Years | 0 (0.0%) | 25 (11.6%) |
| 35 to 64 Years | 36 (8.6%) | 0 (0.0%) |
| 65 to 74 Years | 52 (17.3%) | 0 (0.0%) |
| 75 Years and over | 106 (44.7%) | 68 (21.2%) |
Disability Class by Sex by Age in Bal Harbour
Disability Class: Hearing Difficulty
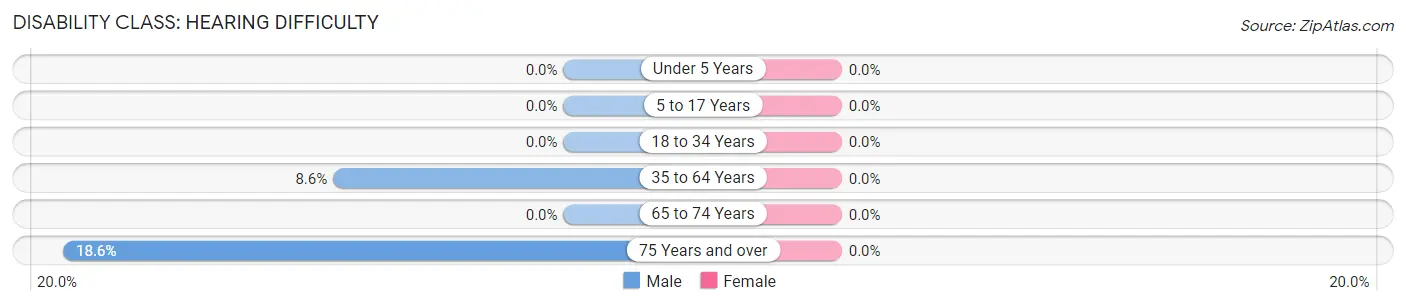
| Age Bracket | Male | Female |
| Under 5 Years | 0 (0.0%) | 0 (0.0%) |
| 5 to 17 Years | 0 (0.0%) | 0 (0.0%) |
| 18 to 34 Years | 0 (0.0%) | 0 (0.0%) |
| 35 to 64 Years | 36 (8.6%) | 0 (0.0%) |
| 65 to 74 Years | 0 (0.0%) | 0 (0.0%) |
| 75 Years and over | 44 (18.6%) | 0 (0.0%) |
Disability Class: Vision Difficulty
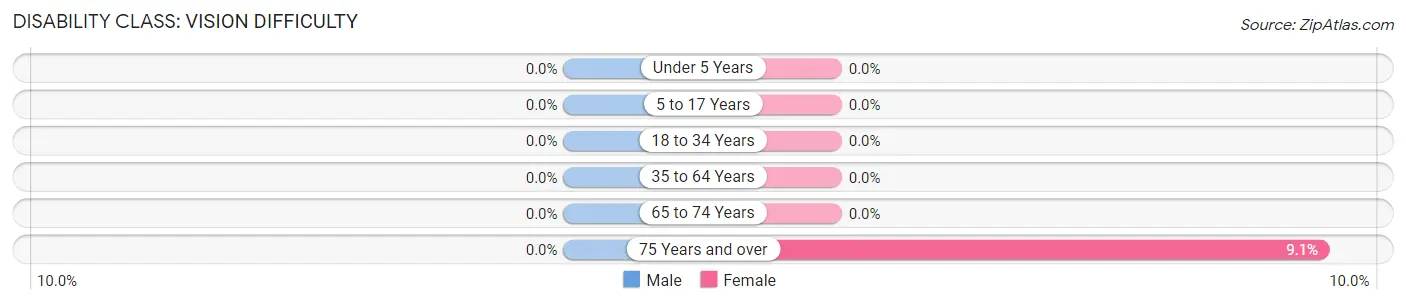
| Age Bracket | Male | Female |
| Under 5 Years | 0 (0.0%) | 0 (0.0%) |
| 5 to 17 Years | 0 (0.0%) | 0 (0.0%) |
| 18 to 34 Years | 0 (0.0%) | 0 (0.0%) |
| 35 to 64 Years | 0 (0.0%) | 0 (0.0%) |
| 65 to 74 Years | 0 (0.0%) | 0 (0.0%) |
| 75 Years and over | 0 (0.0%) | 29 (9.1%) |
Disability Class: Cognitive Difficulty
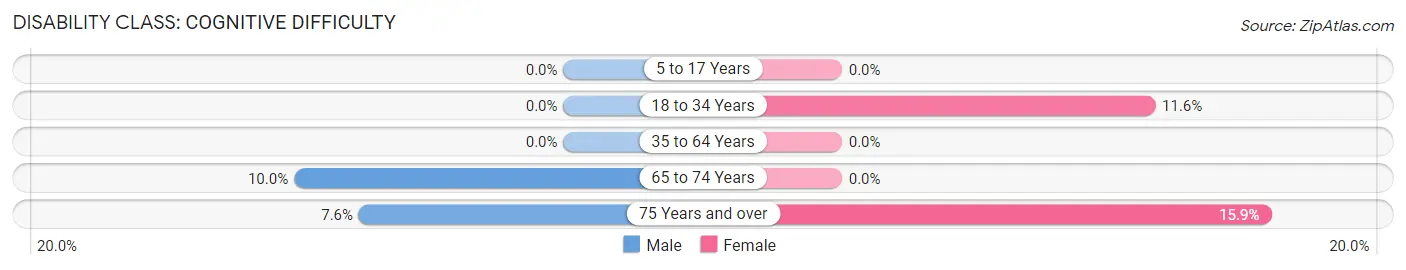
| Age Bracket | Male | Female |
| 5 to 17 Years | 0 (0.0%) | 0 (0.0%) |
| 18 to 34 Years | 0 (0.0%) | 25 (11.6%) |
| 35 to 64 Years | 0 (0.0%) | 0 (0.0%) |
| 65 to 74 Years | 30 (10.0%) | 0 (0.0%) |
| 75 Years and over | 18 (7.6%) | 51 (15.9%) |
Disability Class: Ambulatory Difficulty
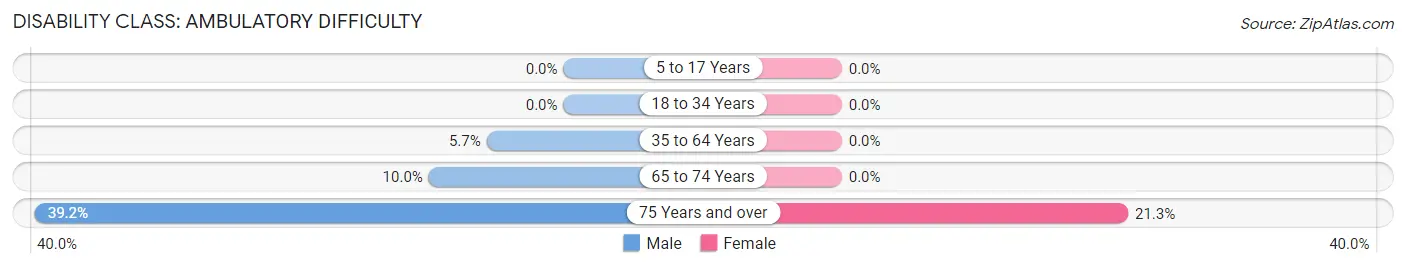
| Age Bracket | Male | Female |
| 5 to 17 Years | 0 (0.0%) | 0 (0.0%) |
| 18 to 34 Years | 0 (0.0%) | 0 (0.0%) |
| 35 to 64 Years | 24 (5.7%) | 0 (0.0%) |
| 65 to 74 Years | 30 (10.0%) | 0 (0.0%) |
| 75 Years and over | 93 (39.2%) | 68 (21.2%) |
Disability Class: Self-Care Difficulty
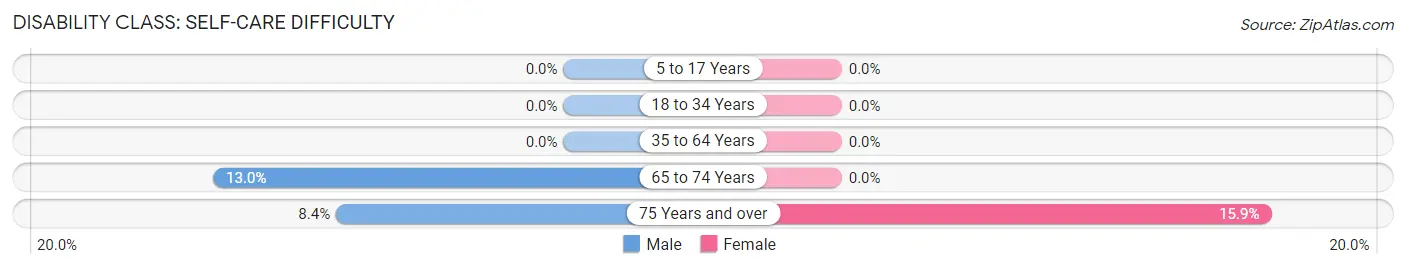
| Age Bracket | Male | Female |
| 5 to 17 Years | 0 (0.0%) | 0 (0.0%) |
| 18 to 34 Years | 0 (0.0%) | 0 (0.0%) |
| 35 to 64 Years | 0 (0.0%) | 0 (0.0%) |
| 65 to 74 Years | 39 (13.0%) | 0 (0.0%) |
| 75 Years and over | 20 (8.4%) | 51 (15.9%) |
Technology Access in Bal Harbour
Computing Device Access in Bal Harbour
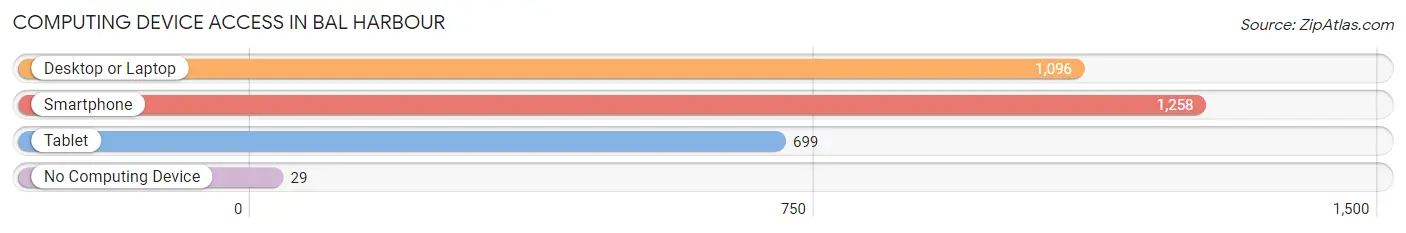
| Device Type | # Households | % Households |
| Desktop or Laptop | 1,096 | 82.7% |
| Smartphone | 1,258 | 94.9% |
| Tablet | 699 | 52.7% |
| No Computing Device | 29 | 2.2% |
| Total | 1,325 | 100.0% |
Internet Access in Bal Harbour
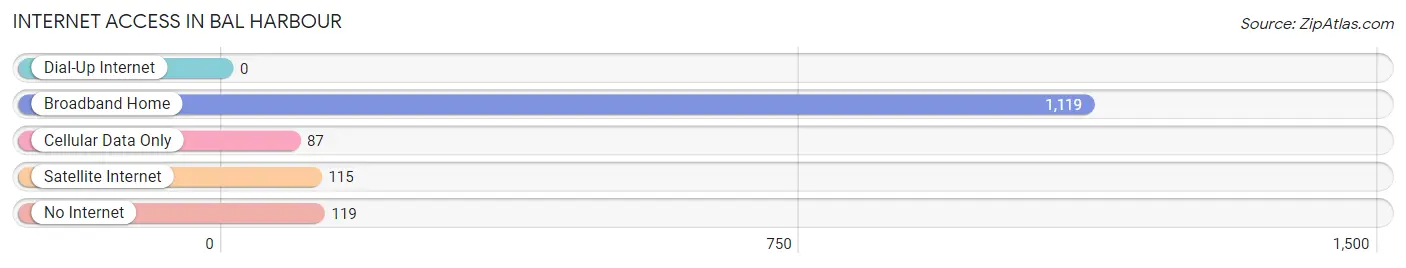
| Internet Type | # Households | % Households |
| Dial-Up Internet | 0 | 0.0% |
| Broadband Home | 1,119 | 84.5% |
| Cellular Data Only | 87 | 6.6% |
| Satellite Internet | 115 | 8.7% |
| No Internet | 119 | 9.0% |
| Total | 1,325 | 100.0% |
Bal Harbour Summary
Harbour Bal Harbour is a village located in Miami-Dade County, Florida, United States. It is located on the northern tip of Miami Beach, between the Atlantic Ocean and Biscayne Bay. The village is known for its upscale shopping, dining, and luxury hotels. As of the 2010 census, the village had a population of 2,513.
History
The area that is now Bal Harbour was originally inhabited by the Tequesta Indians. The first recorded European contact with the area was in 1513, when Spanish explorer Juan Ponce de Leon landed on the shores of Biscayne Bay. The area remained largely undeveloped until the early 20th century, when it was purchased by a group of investors led by Paris Singer, the son of sewing machine magnate Isaac Singer. The group developed the area as a resort destination, and in 1925, the Bal Harbour Club was opened. The club was a popular destination for celebrities and the wealthy, and it attracted many famous visitors, including the Duke and Duchess of Windsor, Clark Gable, and the Vanderbilts.
In 1947, the area was incorporated as the Village of Bal Harbour. The village was developed as a residential community, and in the 1950s, it became a popular destination for wealthy snowbirds from the Northeast. In the 1960s, the village began to attract more permanent residents, and it became a popular destination for retirees.
Geography
Bal Harbour is located at 25°53'25" North, 80°7'45" West (25.8903, -80.1292). It is bordered to the north by the Atlantic Ocean, to the east by Biscayne Bay, to the south by Surfside, and to the west by Bay Harbor Islands. The village has a total area of 0.9 square miles, all of which is land.
Economy
The economy of Bal Harbour is largely driven by tourism and retail. The village is home to the Bal Harbour Shops, an upscale shopping mall that features luxury retailers such as Gucci, Prada, and Louis Vuitton. The mall attracts many tourists and is a major source of revenue for the village. In addition, the village is home to several luxury hotels, including the St. Regis Bal Harbour Resort and the Ritz-Carlton Bal Harbour.
Demographics
As of the 2010 census, there were 2,513 people, 1,093 households, and 645 families residing in the village. The population density was 2,817.3 people per square mile. The racial makeup of the village was 79.2% White, 8.3% African American, 0.2% Native American, 8.3% Asian, 0.1% Pacific Islander, 1.3% from other races, and 2.6% from two or more races. Hispanic or Latino of any race were 11.3% of the population.
The median income for a household in the village was $87,917, and the median income for a family was $101,917. The per capita income for the village was $67,917. About 4.3% of families and 6.2% of the population were below the poverty line, including 8.3% of those under age 18 and 4.3% of those age 65 or over.
Common Questions
What is the Total Population of Bal Harbour?
Total Population of Bal Harbour is 3,035.
What is the Total Male Population of Bal Harbour?
Total Male Population of Bal Harbour is 1,590.
What is the Total Female Population of Bal Harbour?
Total Female Population of Bal Harbour is 1,445.
What is the Ratio of Males per 100 Females in Bal Harbour?
There are 110.03 Males per 100 Females in Bal Harbour.
What is the Ratio of Females per 100 Males in Bal Harbour?
There are 90.88 Females per 100 Males in Bal Harbour.
What is the Median Population Age in Bal Harbour?
Median Population Age in Bal Harbour is 49.6 Years.
What is the Average Family Size in Bal Harbour
Average Family Size in Bal Harbour is 3.1 People.
What is the Average Household Size in Bal Harbour
Average Household Size in Bal Harbour is 2.3 People.
What is Per Capita Income in Bal Harbour?
Per Capita income in Bal Harbour is $101,899.
What is the Median Family Income in Bal Harbour?
Median Family Income in Bal Harbour is $138,396.
What is the Median Household income in Bal Harbour?
Median Household Income in Bal Harbour is $86,172.
What is Inequality or Gini Index in Bal Harbour?
Inequality or Gini Index in Bal Harbour is 0.65.
How Large is the Labor Force in Bal Harbour?
There are 1,312 People in the Labor Forcein in Bal Harbour.
What is the Percentage of People in the Labor Force in Bal Harbour?
51.3% of People are in the Labor Force in Bal Harbour.
What is the Unemployment Rate in Bal Harbour?
Unemployment Rate in Bal Harbour is 7.9%.