Indian River Estates, FL
Indian River Estates Map
Indian River Estates Overview
6,965
TOTAL POPULATION
3,220
MALE POPULATION
3,745
FEMALE POPULATION
85.98
MALES / 100 FEMALES
116.30
FEMALES / 100 MALES
49.4
MEDIAN AGE
3.2
AVG FAMILY SIZE
2.4
AVG HOUSEHOLD SIZE
$28,591
PER CAPITA INCOME
$72,303
AVG FAMILY INCOME
$47,023
AVG HOUSEHOLD INCOME
29.0%
WAGE / INCOME GAP [ % ]
71.0¢/ $1
WAGE / INCOME GAP [ $ ]
0.43
INEQUALITY / GINI INDEX
3,061
LABOR FORCE [ PEOPLE ]
54.2%
PERCENT IN LABOR FORCE
4.7%
UNEMPLOYMENT RATE
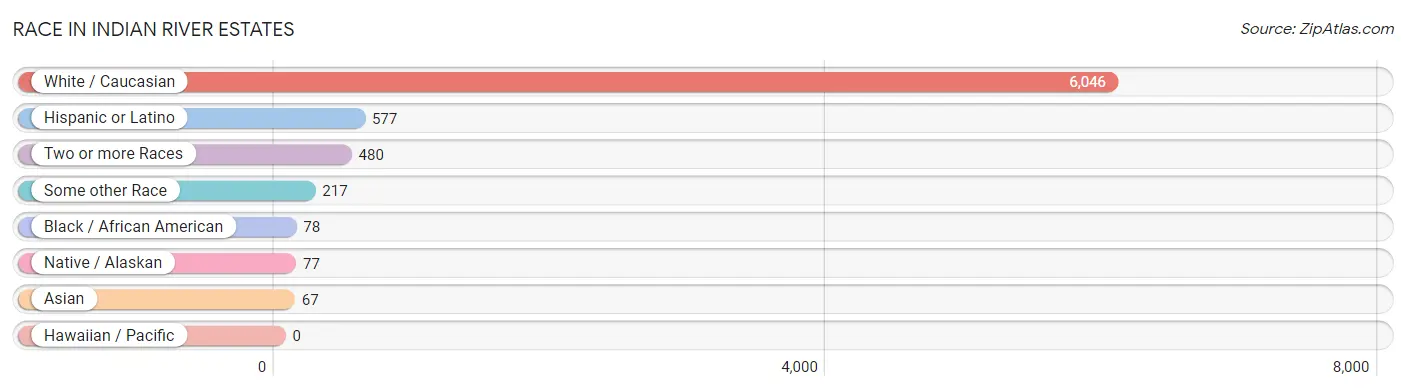
Race in Indian River Estates
The most populous races in Indian River Estates are White / Caucasian (6,046 | 86.8%), Hispanic or Latino (577 | 8.3%), and Two or more Races (480 | 6.9%).
| Race | # Population | % Population |
| Asian | 67 | 1.0% |
| Black / African American | 78 | 1.1% |
| Hawaiian / Pacific | 0 | 0.0% |
| Hispanic or Latino | 577 | 8.3% |
| Native / Alaskan | 77 | 1.1% |
| White / Caucasian | 6,046 | 86.8% |
| Two or more Races | 480 | 6.9% |
| Some other Race | 217 | 3.1% |
| Total | 6,965 | 100.0% |
Ancestry in Indian River Estates
The most populous ancestries reported in Indian River Estates are American (1,778 | 25.5%), Irish (798 | 11.5%), German (657 | 9.4%), European (627 | 9.0%), and English (551 | 7.9%), together accounting for 63.3% of all Indian River Estates residents.

| Ancestry | # Population | % Population |
| American | 1,778 | 25.5% |
| Arab | 28 | 0.4% |
| British | 58 | 0.8% |
| Central American | 284 | 4.1% |
| Central American Indian | 53 | 0.8% |
| Costa Rican | 153 | 2.2% |
| Cuban | 59 | 0.9% |
| Czech | 8 | 0.1% |
| Danish | 46 | 0.7% |
| Dutch | 171 | 2.5% |
| Eastern European | 43 | 0.6% |
| English | 551 | 7.9% |
| European | 627 | 9.0% |
| French | 123 | 1.8% |
| French Canadian | 112 | 1.6% |
| German | 657 | 9.4% |
| Guatemalan | 109 | 1.6% |
| Haitian | 15 | 0.2% |
| Honduran | 22 | 0.3% |
| Hungarian | 124 | 1.8% |
| Indian (Asian) | 9 | 0.1% |
| Irish | 798 | 11.5% |
| Israeli | 28 | 0.4% |
| Italian | 550 | 7.9% |
| Latvian | 14 | 0.2% |
| Lebanese | 12 | 0.2% |
| Mexican | 103 | 1.5% |
| Mexican American Indian | 24 | 0.3% |
| Moroccan | 16 | 0.2% |
| Norwegian | 27 | 0.4% |
| Peruvian | 14 | 0.2% |
| Polish | 90 | 1.3% |
| Portuguese | 27 | 0.4% |
| Puerto Rican | 88 | 1.3% |
| Romanian | 16 | 0.2% |
| Russian | 47 | 0.7% |
| Scandinavian | 39 | 0.6% |
| Scotch-Irish | 46 | 0.7% |
| Scottish | 62 | 0.9% |
| Slovak | 18 | 0.3% |
| South American | 29 | 0.4% |
| Swedish | 58 | 0.8% |
| Ukrainian | 12 | 0.2% |
| Venezuelan | 15 | 0.2% |
| Welsh | 24 | 0.3% |
| Yugoslavian | 13 | 0.2% | View All 46 Rows |
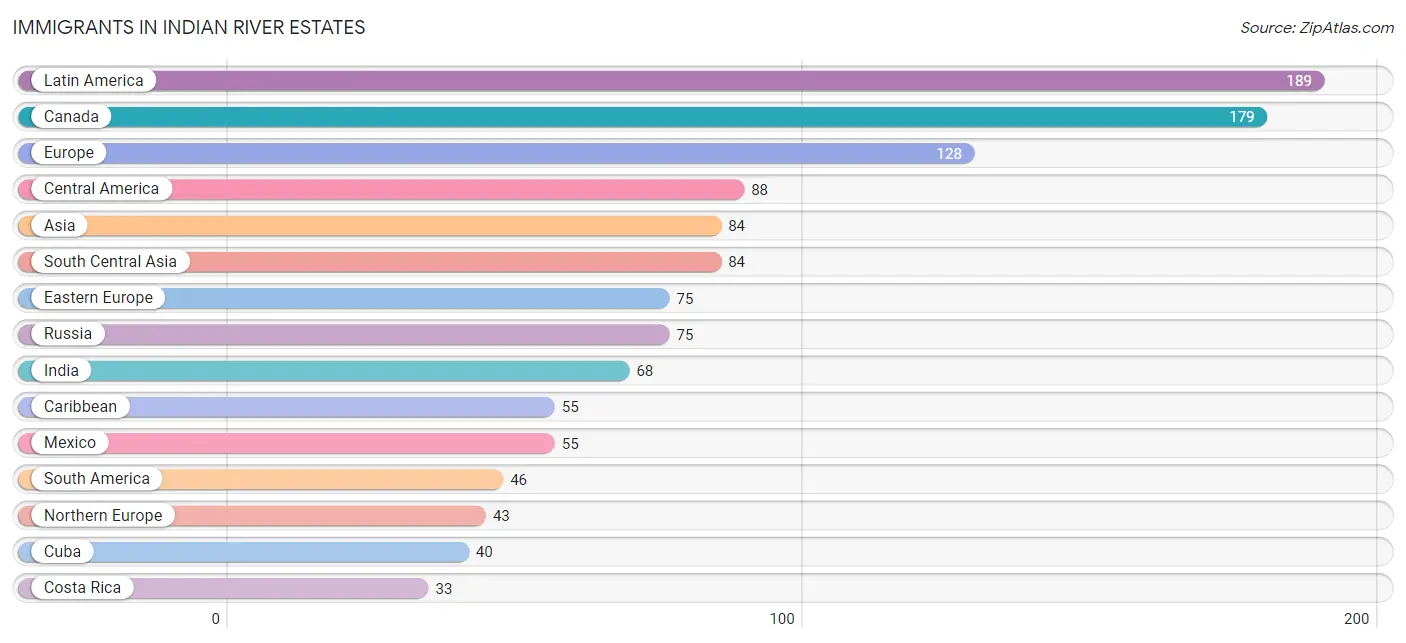
Immigrants in Indian River Estates
The most numerous immigrant groups reported in Indian River Estates came from Latin America (189 | 2.7%), Canada (179 | 2.6%), Europe (128 | 1.8%), Central America (88 | 1.3%), and Asia (84 | 1.2%), together accounting for 9.6% of all Indian River Estates residents.
| Immigration Origin | # Population | % Population |
| Africa | 16 | 0.2% |
| Asia | 84 | 1.2% |
| Canada | 179 | 2.6% |
| Caribbean | 55 | 0.8% |
| Central America | 88 | 1.3% |
| Colombia | 14 | 0.2% |
| Costa Rica | 33 | 0.5% |
| Cuba | 40 | 0.6% |
| Eastern Europe | 75 | 1.1% |
| Ecuador | 3 | 0.0% |
| Europe | 128 | 1.8% |
| Germany | 10 | 0.1% |
| Haiti | 15 | 0.2% |
| India | 68 | 1.0% |
| Latin America | 189 | 2.7% |
| Mexico | 55 | 0.8% |
| Morocco | 16 | 0.2% |
| Northern Africa | 16 | 0.2% |
| Northern Europe | 43 | 0.6% |
| Norway | 18 | 0.3% |
| Pakistan | 16 | 0.2% |
| Peru | 14 | 0.2% |
| Russia | 75 | 1.1% |
| Scotland | 10 | 0.1% |
| South America | 46 | 0.7% |
| South Central Asia | 84 | 1.2% |
| Venezuela | 15 | 0.2% |
| Western Europe | 10 | 0.1% | View All 28 Rows |
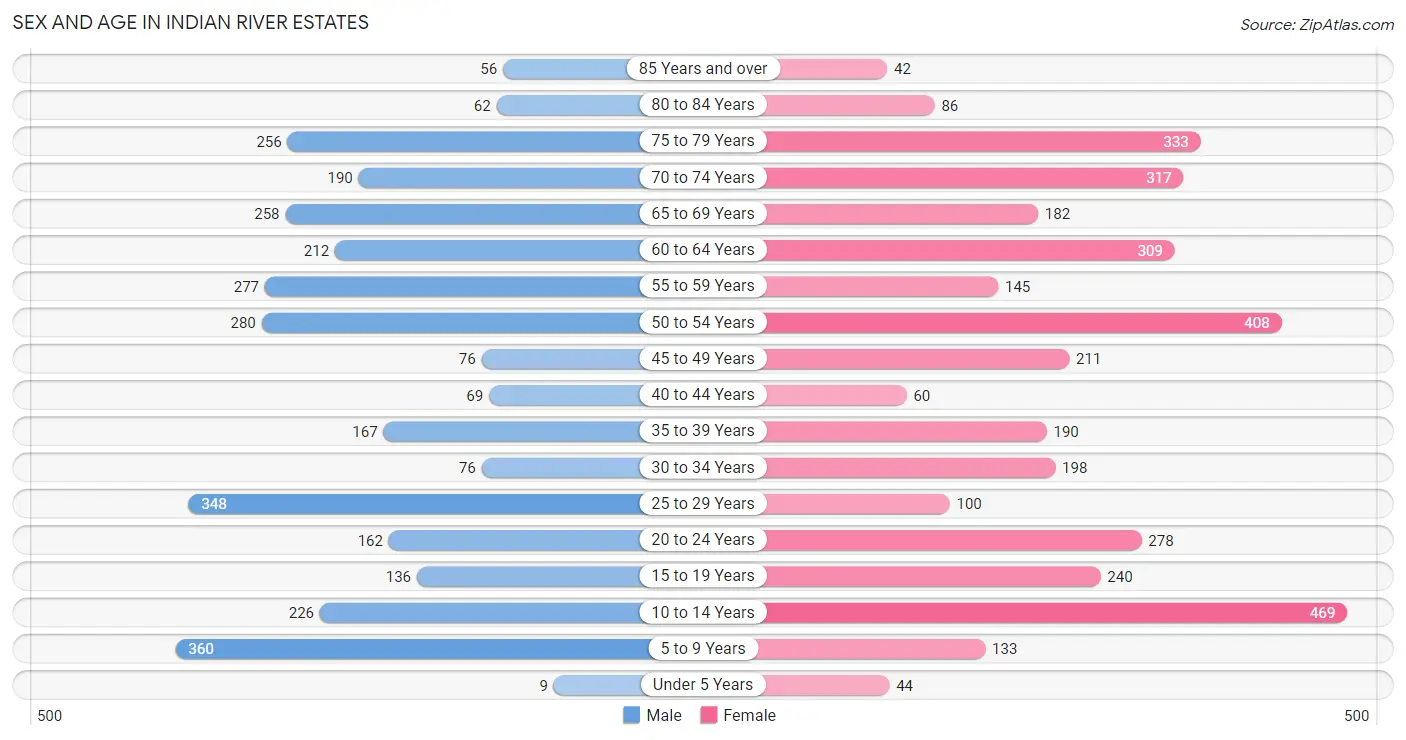
Sex and Age in Indian River Estates
Sex and Age in Indian River Estates
The most populous age groups in Indian River Estates are 5 to 9 Years (360 | 11.2%) for men and 10 to 14 Years (469 | 12.5%) for women.
| Age Bracket | Male | Female |
| Under 5 Years | 9 (0.3%) | 44 (1.2%) |
| 5 to 9 Years | 360 (11.2%) | 133 (3.5%) |
| 10 to 14 Years | 226 (7.0%) | 469 (12.5%) |
| 15 to 19 Years | 136 (4.2%) | 240 (6.4%) |
| 20 to 24 Years | 162 (5.0%) | 278 (7.4%) |
| 25 to 29 Years | 348 (10.8%) | 100 (2.7%) |
| 30 to 34 Years | 76 (2.4%) | 198 (5.3%) |
| 35 to 39 Years | 167 (5.2%) | 190 (5.1%) |
| 40 to 44 Years | 69 (2.1%) | 60 (1.6%) |
| 45 to 49 Years | 76 (2.4%) | 211 (5.6%) |
| 50 to 54 Years | 280 (8.7%) | 408 (10.9%) |
| 55 to 59 Years | 277 (8.6%) | 145 (3.9%) |
| 60 to 64 Years | 212 (6.6%) | 309 (8.3%) |
| 65 to 69 Years | 258 (8.0%) | 182 (4.9%) |
| 70 to 74 Years | 190 (5.9%) | 317 (8.5%) |
| 75 to 79 Years | 256 (8.0%) | 333 (8.9%) |
| 80 to 84 Years | 62 (1.9%) | 86 (2.3%) |
| 85 Years and over | 56 (1.7%) | 42 (1.1%) |
| Total | 3,220 (100.0%) | 3,745 (100.0%) |
Families and Households in Indian River Estates
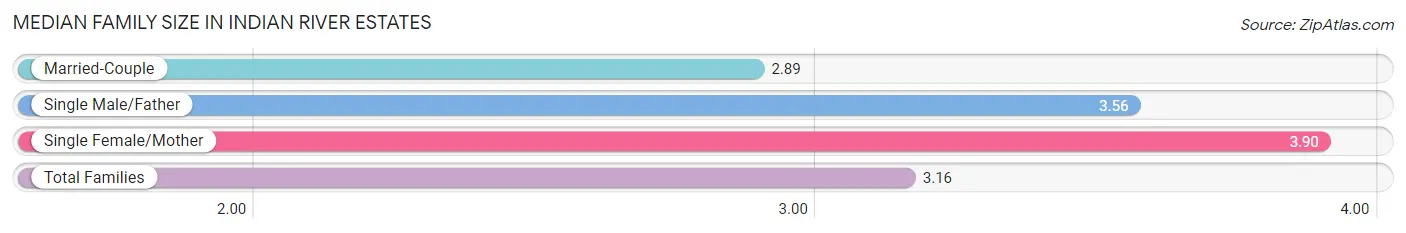
Median Family Size in Indian River Estates
The median family size in Indian River Estates is 3.16 persons per family, with single female/mother families (376 | 22.2%) accounting for the largest median family size of 3.9 persons per family. On the other hand, married-couple families (1,197 | 70.7%) represent the smallest median family size with 2.89 persons per family.
| Family Type | # Families | Family Size |
| Married-Couple | 1,197 (70.7%) | 2.89 |
| Single Male/Father | 120 (7.1%) | 3.56 |
| Single Female/Mother | 376 (22.2%) | 3.90 |
| Total Families | 1,693 (100.0%) | 3.16 |
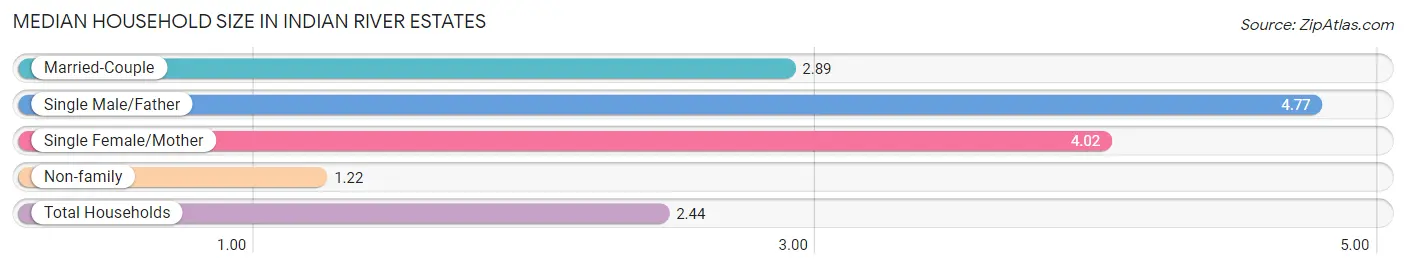
Median Household Size in Indian River Estates
The median household size in Indian River Estates is 2.44 persons per household, with single male/father households (120 | 4.2%) accounting for the largest median household size of 4.77 persons per household. non-family households (1,162 | 40.7%) represent the smallest median household size with 1.22 persons per household.
| Household Type | # Households | Household Size |
| Married-Couple | 1,197 (41.9%) | 2.89 |
| Single Male/Father | 120 (4.2%) | 4.77 |
| Single Female/Mother | 376 (13.2%) | 4.02 |
| Non-family | 1,162 (40.7%) | 1.22 |
| Total Households | 2,855 (100.0%) | 2.44 |
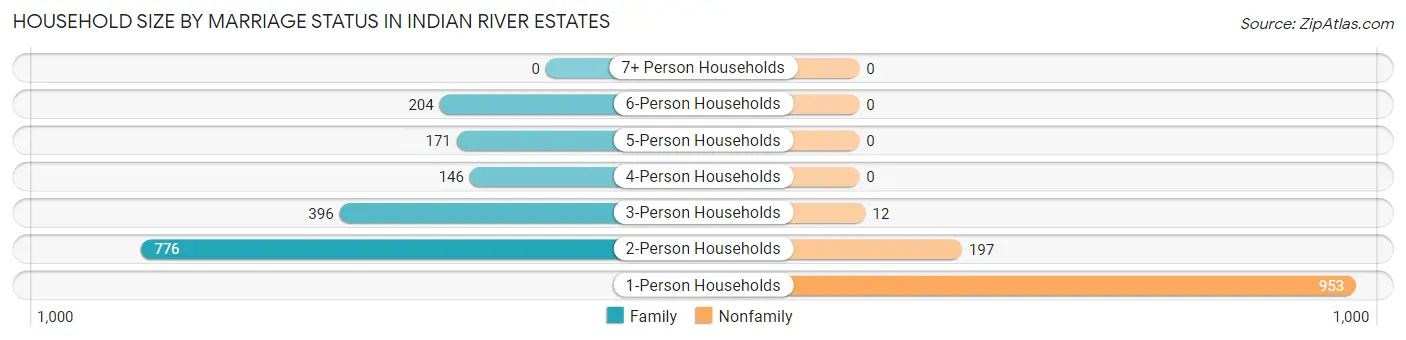
Household Size by Marriage Status in Indian River Estates
Out of a total of 2,855 households in Indian River Estates, 1,693 (59.3%) are family households, while 1,162 (40.7%) are nonfamily households. The most numerous type of family households are 2-person households, comprising 776, and the most common type of nonfamily households are 1-person households, comprising 953.
| Household Size | Family Households | Nonfamily Households |
| 1-Person Households | - | 953 (33.4%) |
| 2-Person Households | 776 (27.2%) | 197 (6.9%) |
| 3-Person Households | 396 (13.9%) | 12 (0.4%) |
| 4-Person Households | 146 (5.1%) | 0 (0.0%) |
| 5-Person Households | 171 (6.0%) | 0 (0.0%) |
| 6-Person Households | 204 (7.1%) | 0 (0.0%) |
| 7+ Person Households | 0 (0.0%) | 0 (0.0%) |
| Total | 1,693 (59.3%) | 1,162 (40.7%) |
Female Fertility in Indian River Estates
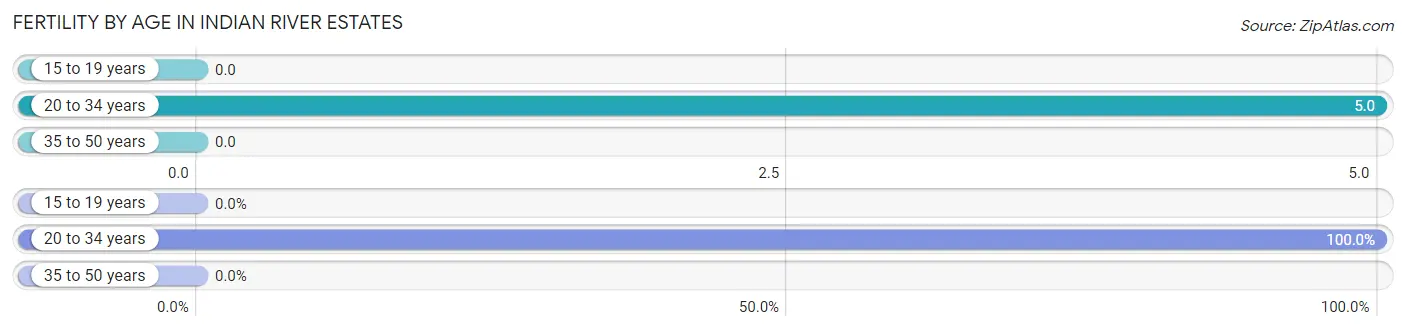
Fertility by Age in Indian River Estates
Average fertility rate in Indian River Estates is 2.0 births per 1,000 women. Women in the age bracket of 20 to 34 years have the highest fertility rate with 5.0 births per 1,000 women. Women in the age bracket of 20 to 34 years acount for 100.0% of all women with births.
| Age Bracket | Women with Births | Births / 1,000 Women |
| 15 to 19 years | 0 (0.0%) | 0.0 |
| 20 to 34 years | 3 (100.0%) | 5.0 |
| 35 to 50 years | 0 (0.0%) | 0.0 |
| Total | 3 (100.0%) | 2.0 |
Fertility by Age by Marriage Status in Indian River Estates
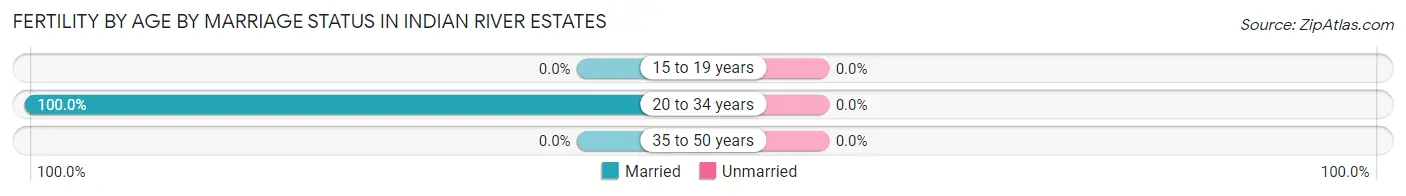
| Age Bracket | Married | Unmarried |
| 15 to 19 years | 0 (0.0%) | 0 (0.0%) |
| 20 to 34 years | 3 (100.0%) | 0 (0.0%) |
| 35 to 50 years | 0 (0.0%) | 0 (0.0%) |
| Total | 3 (100.0%) | 0 (0.0%) |
Fertility by Education in Indian River Estates
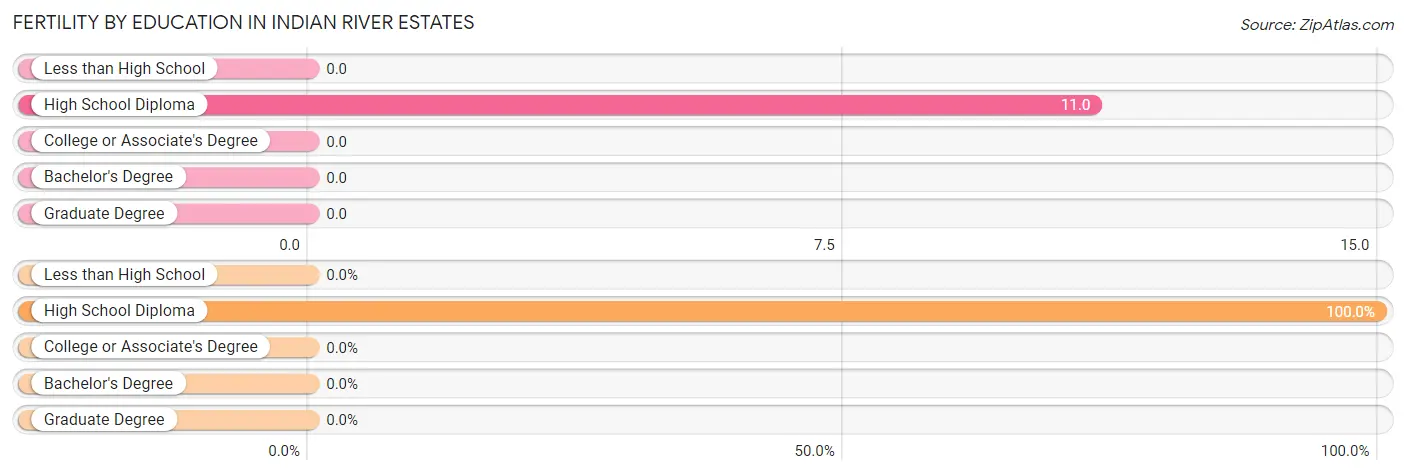
| Educational Attainment | Women with Births | Births / 1,000 Women |
| Less than High School | 0 (0.0%) | 0.0 |
| High School Diploma | 3 (100.0%) | 11.0 |
| College or Associate's Degree | 0 (0.0%) | 0.0 |
| Bachelor's Degree | 0 (0.0%) | 0.0 |
| Graduate Degree | 0 (0.0%) | 0.0 |
| Total | 3 (100.0%) | 2.0 |
Fertility by Education by Marriage Status in Indian River Estates
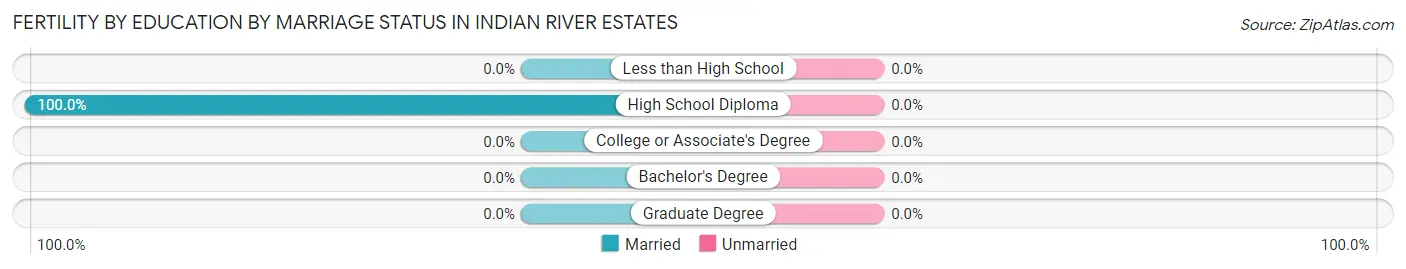
| Educational Attainment | Married | Unmarried |
| Less than High School | 0 (0.0%) | 0 (0.0%) |
| High School Diploma | 3 (100.0%) | 0 (0.0%) |
| College or Associate's Degree | 0 (0.0%) | 0 (0.0%) |
| Bachelor's Degree | 0 (0.0%) | 0 (0.0%) |
| Graduate Degree | 0 (0.0%) | 0 (0.0%) |
| Total | 3 (100.0%) | 0 (0.0%) |
Income in Indian River Estates
Income Overview in Indian River Estates
Per Capita Income in Indian River Estates is $28,591, while median incomes of families and households are $72,303 and $47,023 respectively.
| Characteristic | Number | Measure |
| Per Capita Income | 6,965 | $28,591 |
| Median Family Income | 1,693 | $72,303 |
| Mean Family Income | 1,693 | $83,654 |
| Median Household Income | 2,855 | $47,023 |
| Mean Household Income | 2,855 | $66,997 |
| Income Deficit | 1,693 | $0 |
| Wage / Income Gap (%) | 6,965 | 29.01% |
| Wage / Income Gap ($) | 6,965 | 70.99¢ per $1 |
| Gini / Inequality Index | 6,965 | 0.43 |
Earnings by Sex in Indian River Estates
Average Earnings in Indian River Estates are $34,096, $39,615 for men and $28,122 for women, a difference of 29.0%.
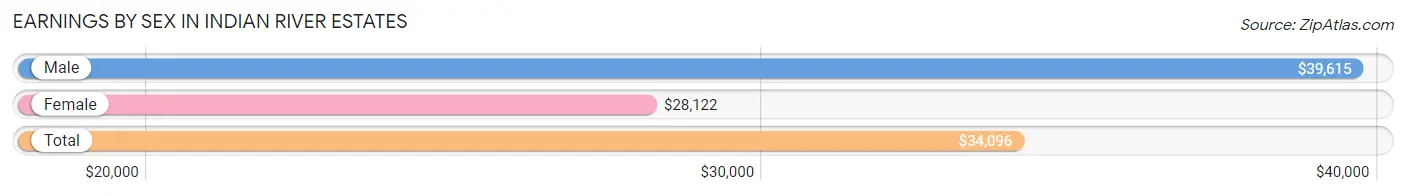
| Sex | Number | Average Earnings |
| Male | 1,470 (44.9%) | $39,615 |
| Female | 1,807 (55.1%) | $28,122 |
| Total | 3,277 (100.0%) | $34,096 |
Earnings by Sex by Income Bracket in Indian River Estates
The most common earnings brackets in Indian River Estates are $35,000 to $39,999 for men (215 | 14.6%) and $25,000 to $29,999 for women (287 | 15.9%).
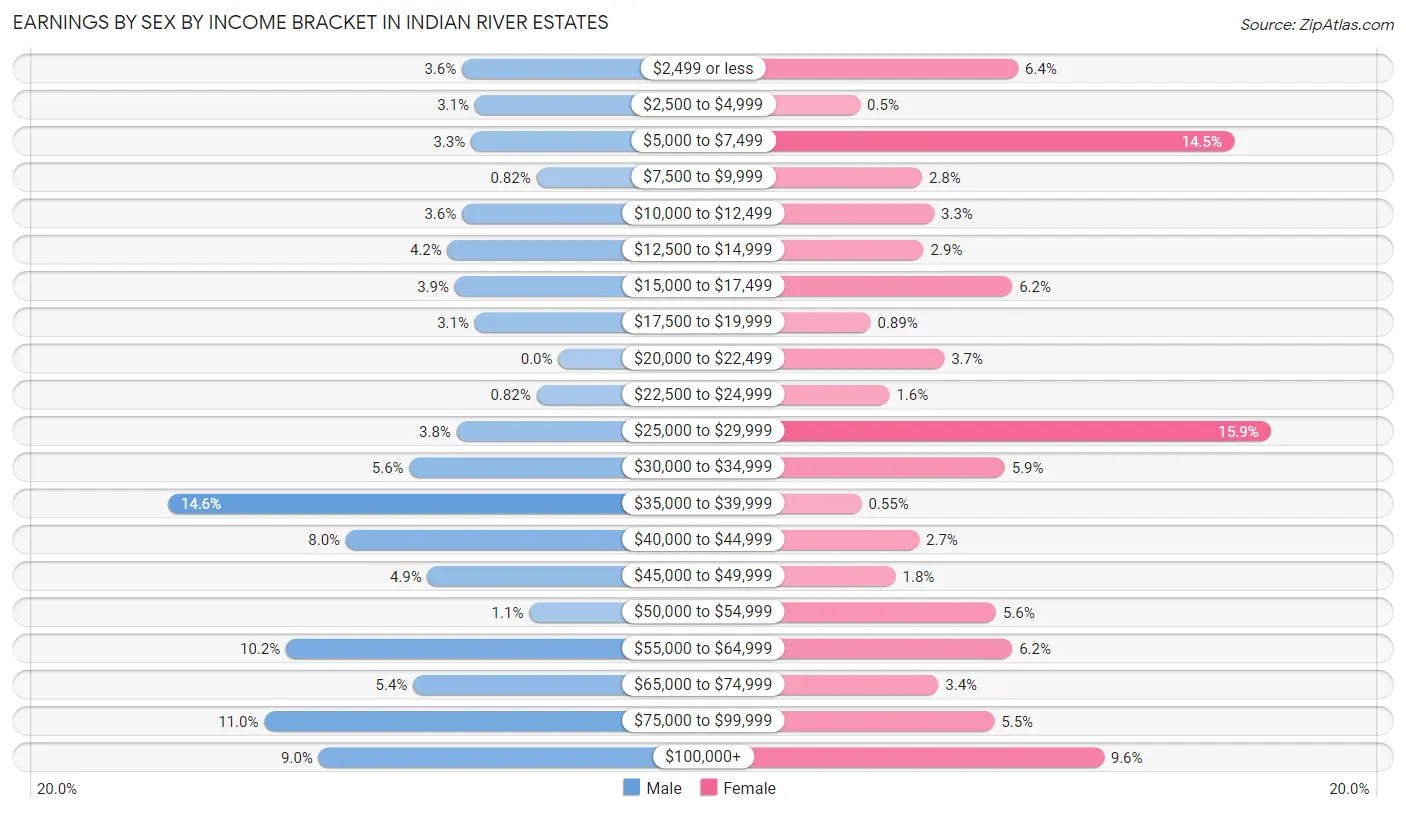
| Income | Male | Female |
| $2,499 or less | 53 (3.6%) | 116 (6.4%) |
| $2,500 to $4,999 | 46 (3.1%) | 9 (0.5%) |
| $5,000 to $7,499 | 48 (3.3%) | 262 (14.5%) |
| $7,500 to $9,999 | 12 (0.8%) | 51 (2.8%) |
| $10,000 to $12,499 | 53 (3.6%) | 59 (3.3%) |
| $12,500 to $14,999 | 61 (4.2%) | 52 (2.9%) |
| $15,000 to $17,499 | 57 (3.9%) | 112 (6.2%) |
| $17,500 to $19,999 | 46 (3.1%) | 16 (0.9%) |
| $20,000 to $22,499 | 0 (0.0%) | 66 (3.6%) |
| $22,500 to $24,999 | 12 (0.8%) | 29 (1.6%) |
| $25,000 to $29,999 | 56 (3.8%) | 287 (15.9%) |
| $30,000 to $34,999 | 82 (5.6%) | 107 (5.9%) |
| $35,000 to $39,999 | 215 (14.6%) | 10 (0.5%) |
| $40,000 to $44,999 | 117 (8.0%) | 49 (2.7%) |
| $45,000 to $49,999 | 72 (4.9%) | 33 (1.8%) |
| $50,000 to $54,999 | 16 (1.1%) | 101 (5.6%) |
| $55,000 to $64,999 | 150 (10.2%) | 112 (6.2%) |
| $65,000 to $74,999 | 80 (5.4%) | 62 (3.4%) |
| $75,000 to $99,999 | 162 (11.0%) | 100 (5.5%) |
| $100,000+ | 132 (9.0%) | 174 (9.6%) |
| Total | 1,470 (100.0%) | 1,807 (100.0%) |
Earnings by Sex by Educational Attainment in Indian River Estates
Average earnings in Indian River Estates are $41,978 for men and $33,853 for women, a difference of 19.4%. Men with an educational attainment of high school diploma enjoy the highest average annual earnings of $65,357, while those with less than high school education earn the least with $29,420. Women with an educational attainment of graduate degree earn the most with the average annual earnings of $66,369, while those with high school diploma education have the smallest earnings of $25,368.
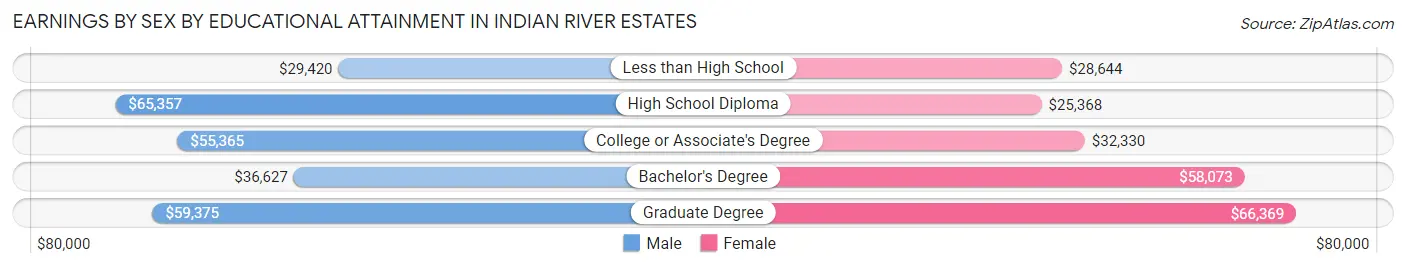
| Educational Attainment | Male Income | Female Income |
| Less than High School | $29,420 | $28,644 |
| High School Diploma | $65,357 | $25,368 |
| College or Associate's Degree | $55,365 | $32,330 |
| Bachelor's Degree | $36,627 | $58,073 |
| Graduate Degree | $59,375 | $66,369 |
| Total | $41,978 | $33,853 |
Family Income in Indian River Estates
Family Income Brackets in Indian River Estates
According to the Indian River Estates family income data, there are 405 families falling into the $100,000 to $149,999 income range, which is the most common income bracket and makes up 23.9% of all families. Conversely, the $10,000 to $14,999 income bracket is the least frequent group with only 15 families (0.9%) belonging to this category.
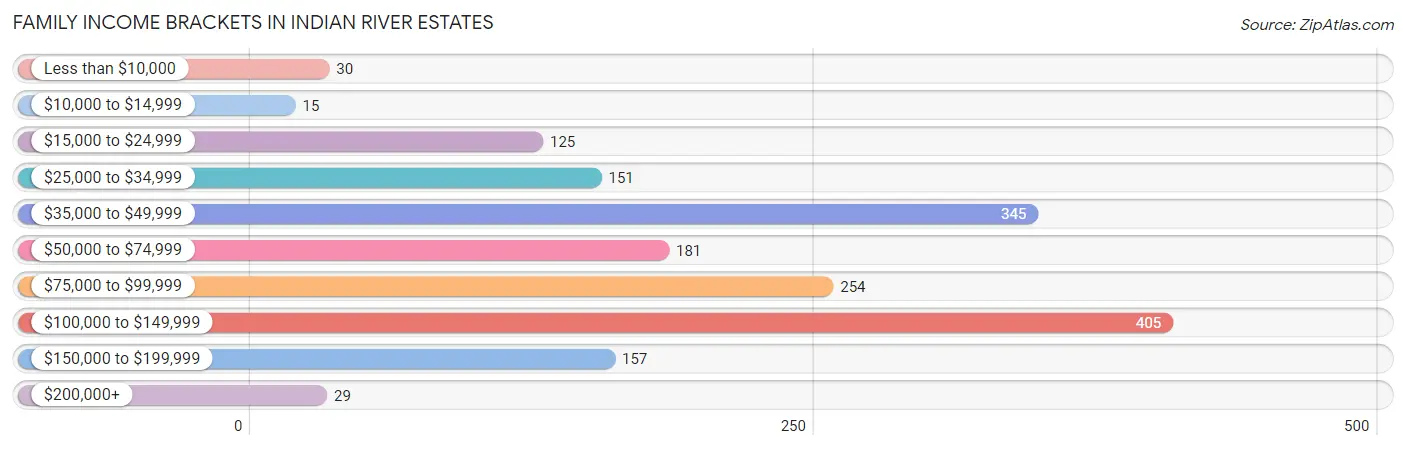
| Income Bracket | # Families | % Families |
| Less than $10,000 | 30 | 1.8% |
| $10,000 to $14,999 | 15 | 0.9% |
| $15,000 to $24,999 | 125 | 7.4% |
| $25,000 to $34,999 | 151 | 8.9% |
| $35,000 to $49,999 | 345 | 20.4% |
| $50,000 to $74,999 | 181 | 10.7% |
| $75,000 to $99,999 | 254 | 15.0% |
| $100,000 to $149,999 | 405 | 23.9% |
| $150,000 to $199,999 | 157 | 9.3% |
| $200,000+ | 29 | 1.7% |
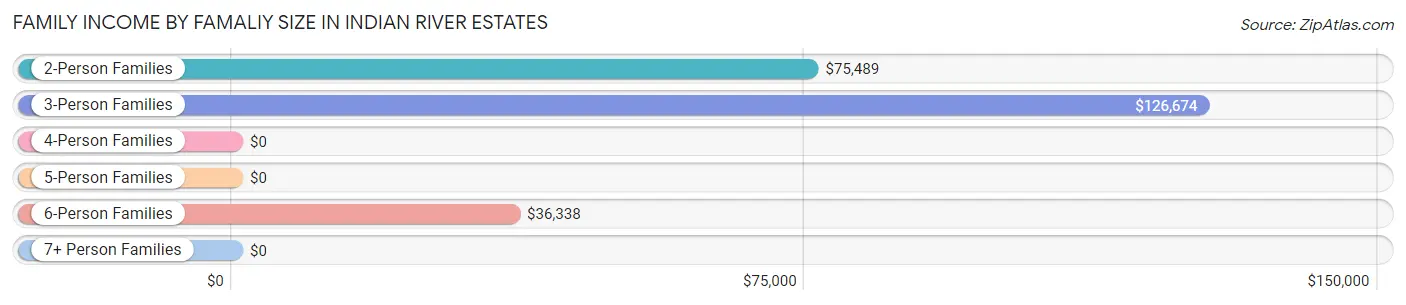
Family Income by Famaliy Size in Indian River Estates
3-person families (349 | 20.6%) account for the highest median family income in Indian River Estates with $126,674 per family, while 3-person families (349 | 20.6%) have the highest median income of $42,225 per family member.
| Income Bracket | # Families | Median Income |
| 2-Person Families | 848 (50.1%) | $75,489 |
| 3-Person Families | 349 (20.6%) | $126,674 |
| 4-Person Families | 146 (8.6%) | $0 |
| 5-Person Families | 166 (9.8%) | $0 |
| 6-Person Families | 184 (10.9%) | $36,338 |
| 7+ Person Families | 0 (0.0%) | $0 |
| Total | 1,693 (100.0%) | $72,303 |
Family Income by Number of Earners in Indian River Estates
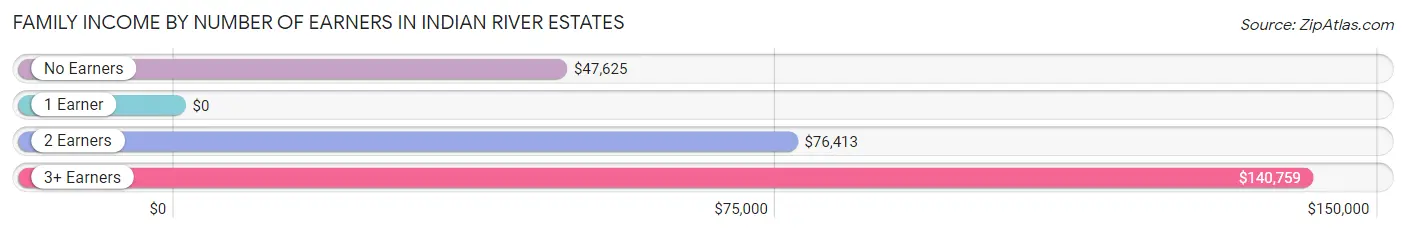
| Number of Earners | # Families | Median Income |
| No Earners | 437 (25.8%) | $47,625 |
| 1 Earner | 408 (24.1%) | $0 |
| 2 Earners | 598 (35.3%) | $76,413 |
| 3+ Earners | 250 (14.8%) | $140,759 |
| Total | 1,693 (100.0%) | $72,303 |
Household Income in Indian River Estates
Household Income Brackets in Indian River Estates
With 520 households falling in the category, the $100,000 to $149,999 income range is the most frequent in Indian River Estates, accounting for 18.2% of all households. In contrast, only 29 households (1.0%) fall into the $200,000+ income bracket, making it the least populous group.
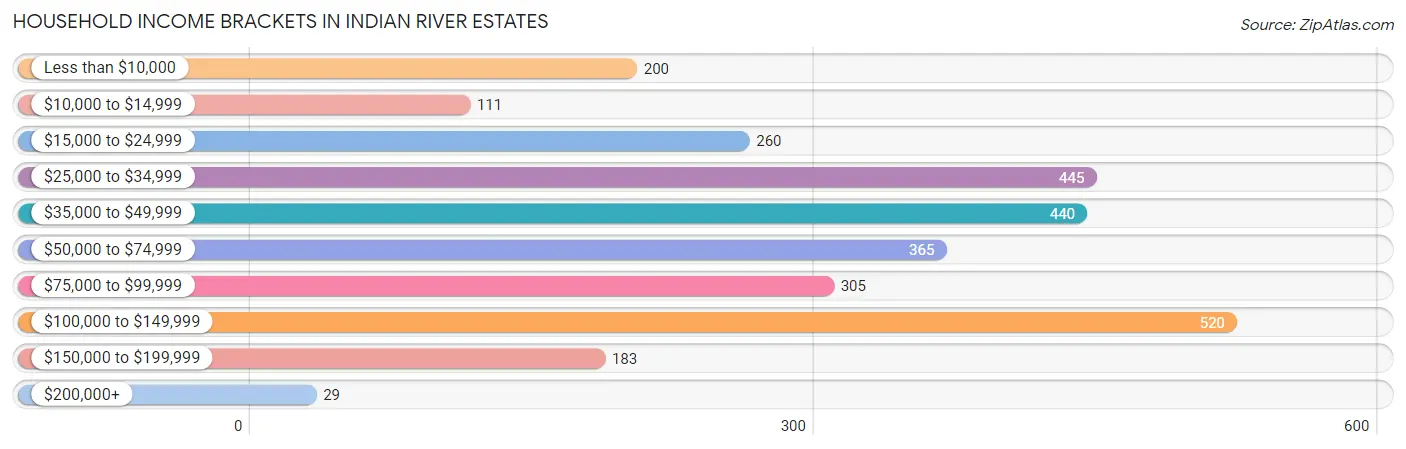
| Income Bracket | # Households | % Households |
| Less than $10,000 | 200 | 7.0% |
| $10,000 to $14,999 | 111 | 3.9% |
| $15,000 to $24,999 | 260 | 9.1% |
| $25,000 to $34,999 | 445 | 15.6% |
| $35,000 to $49,999 | 440 | 15.4% |
| $50,000 to $74,999 | 365 | 12.8% |
| $75,000 to $99,999 | 305 | 10.7% |
| $100,000 to $149,999 | 520 | 18.2% |
| $150,000 to $199,999 | 183 | 6.4% |
| $200,000+ | 29 | 1.0% |
Household Income by Householder Age in Indian River Estates
The median household income in Indian River Estates is $47,023, with the highest median household income of $64,052 found in the 45 to 64 years age bracket for the primary householder. A total of 1,106 households (38.7%) fall into this category.
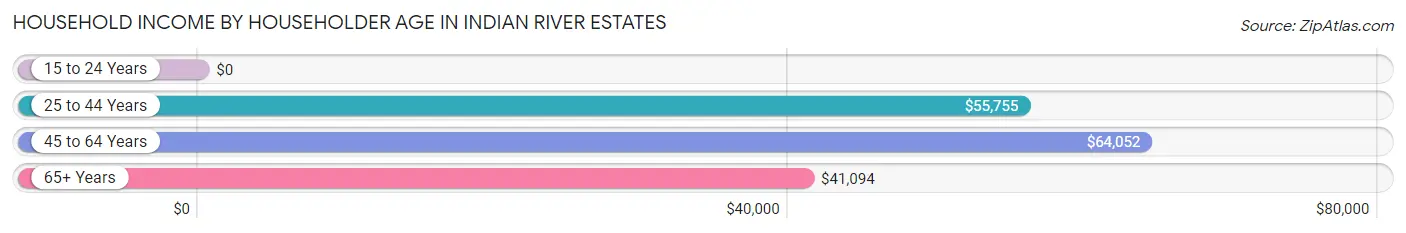
| Income Bracket | # Households | Median Income |
| 15 to 24 Years | 0 (0.0%) | $0 |
| 25 to 44 Years | 499 (17.5%) | $55,755 |
| 45 to 64 Years | 1,106 (38.7%) | $64,052 |
| 65+ Years | 1,250 (43.8%) | $41,094 |
| Total | 2,855 (100.0%) | $47,023 |
Poverty in Indian River Estates
Income Below Poverty by Sex and Age in Indian River Estates
With 24.8% poverty level for males and 26.5% for females among the residents of Indian River Estates, under 5 year old males and 6 to 11 year old females are the most vulnerable to poverty, with 9 males (100.0%) and 182 females (54.0%) in their respective age groups living below the poverty level.
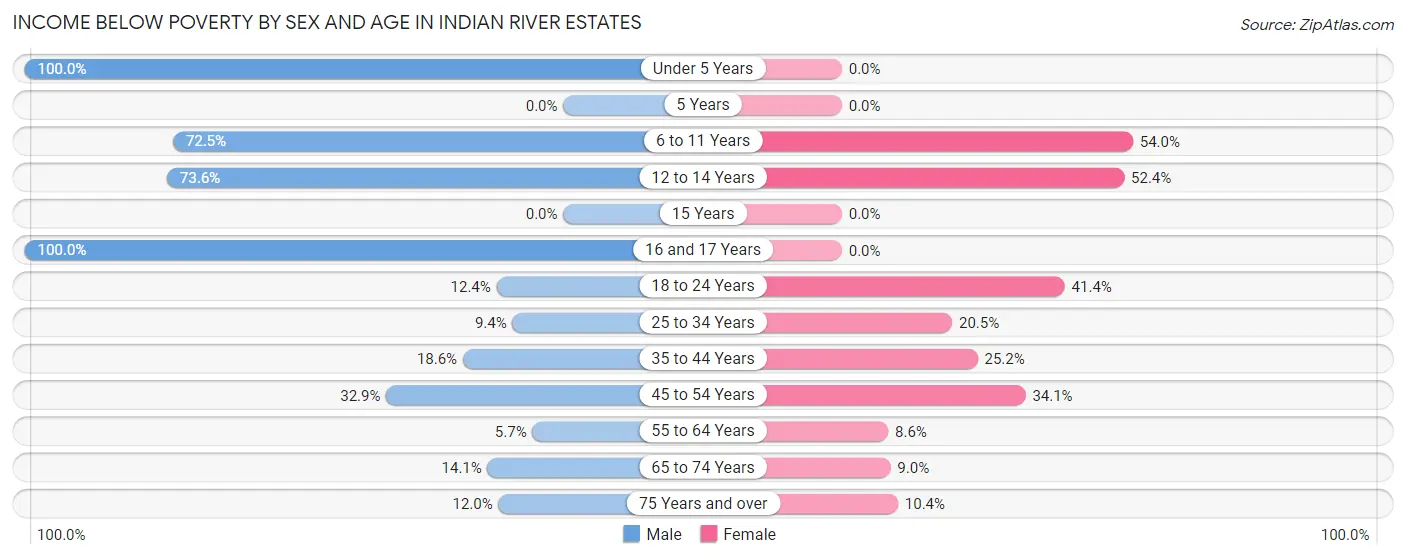
| Age Bracket | Male | Female |
| Under 5 Years | 9 (100.0%) | 0 (0.0%) |
| 5 Years | 0 (0.0%) | 0 (0.0%) |
| 6 to 11 Years | 258 (72.5%) | 182 (54.0%) |
| 12 to 14 Years | 156 (73.6%) | 131 (52.4%) |
| 15 Years | 0 (0.0%) | 0 (0.0%) |
| 16 and 17 Years | 11 (100.0%) | 0 (0.0%) |
| 18 to 24 Years | 27 (12.4%) | 211 (41.4%) |
| 25 to 34 Years | 40 (9.4%) | 61 (20.5%) |
| 35 to 44 Years | 44 (18.6%) | 63 (25.2%) |
| 45 to 54 Years | 117 (32.9%) | 211 (34.1%) |
| 55 to 64 Years | 28 (5.7%) | 39 (8.6%) |
| 65 to 74 Years | 63 (14.1%) | 45 (9.0%) |
| 75 Years and over | 45 (12.0%) | 48 (10.4%) |
| Total | 798 (24.8%) | 991 (26.5%) |
Income Above Poverty by Sex and Age in Indian River Estates
According to the poverty statistics in Indian River Estates, males aged 5 years and females aged under 5 years are the age groups that are most secure financially, with 100.0% of males and 100.0% of females in these age groups living above the poverty line.
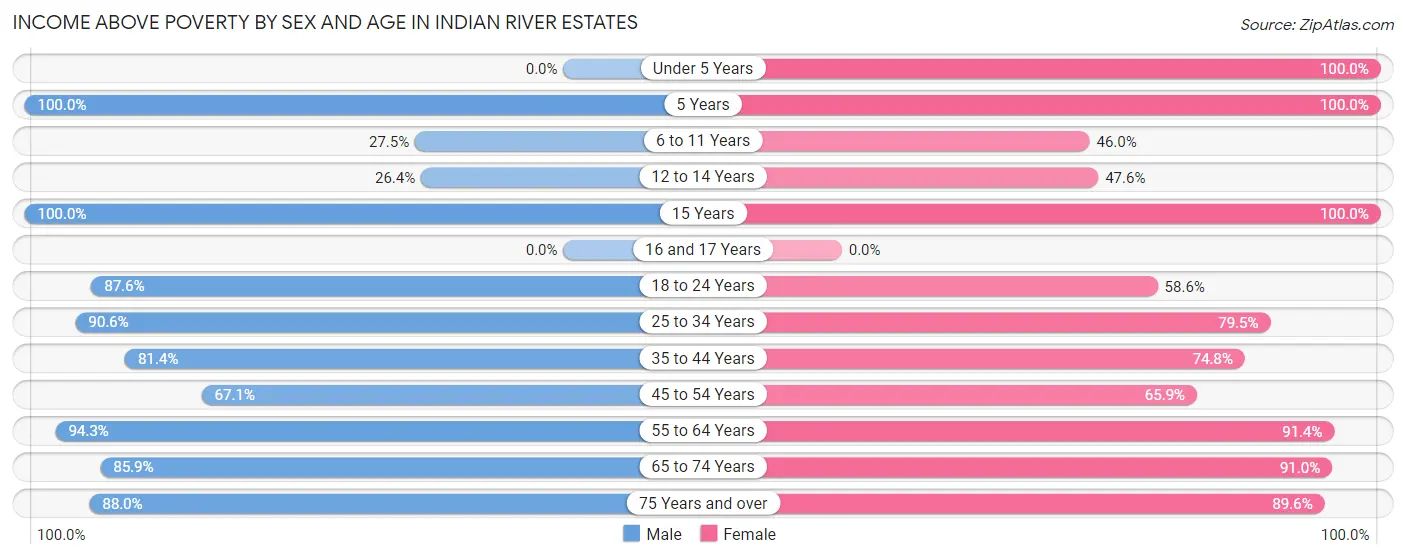
| Age Bracket | Male | Female |
| Under 5 Years | 0 (0.0%) | 44 (100.0%) |
| 5 Years | 18 (100.0%) | 15 (100.0%) |
| 6 to 11 Years | 98 (27.5%) | 155 (46.0%) |
| 12 to 14 Years | 56 (26.4%) | 119 (47.6%) |
| 15 Years | 69 (100.0%) | 8 (100.0%) |
| 16 and 17 Years | 0 (0.0%) | 0 (0.0%) |
| 18 to 24 Years | 191 (87.6%) | 299 (58.6%) |
| 25 to 34 Years | 384 (90.6%) | 237 (79.5%) |
| 35 to 44 Years | 192 (81.4%) | 187 (74.8%) |
| 45 to 54 Years | 239 (67.1%) | 408 (65.9%) |
| 55 to 64 Years | 461 (94.3%) | 415 (91.4%) |
| 65 to 74 Years | 385 (85.9%) | 454 (91.0%) |
| 75 Years and over | 329 (88.0%) | 413 (89.6%) |
| Total | 2,422 (75.2%) | 2,754 (73.5%) |
Income Below Poverty Among Married-Couple Families in Indian River Estates
The poverty statistics for married-couple families in Indian River Estates show that 8.5% or 102 of the total 1,197 families live below the poverty line. Families with 1 or 2 children have the highest poverty rate of 24.6%, comprising of 29 families. On the other hand, families with no children have the lowest poverty rate of 6.0%, which includes 57 families.
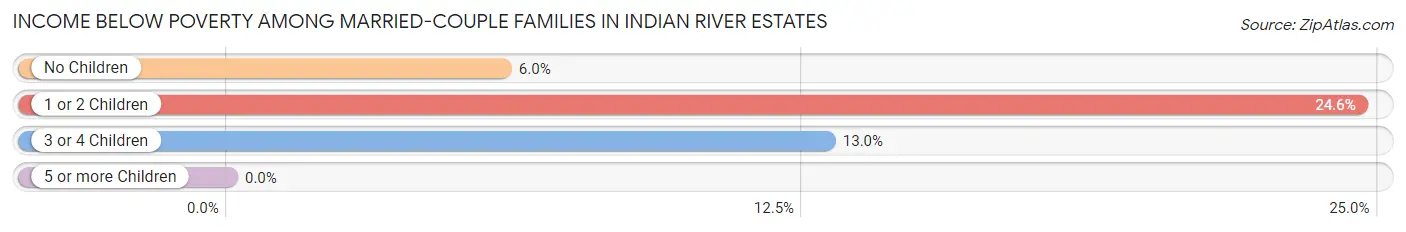
| Children | Above Poverty | Below Poverty |
| No Children | 899 (94.0%) | 57 (6.0%) |
| 1 or 2 Children | 89 (75.4%) | 29 (24.6%) |
| 3 or 4 Children | 107 (87.0%) | 16 (13.0%) |
| 5 or more Children | 0 (0.0%) | 0 (0.0%) |
| Total | 1,095 (91.5%) | 102 (8.5%) |
Income Below Poverty Among Single-Parent Households in Indian River Estates
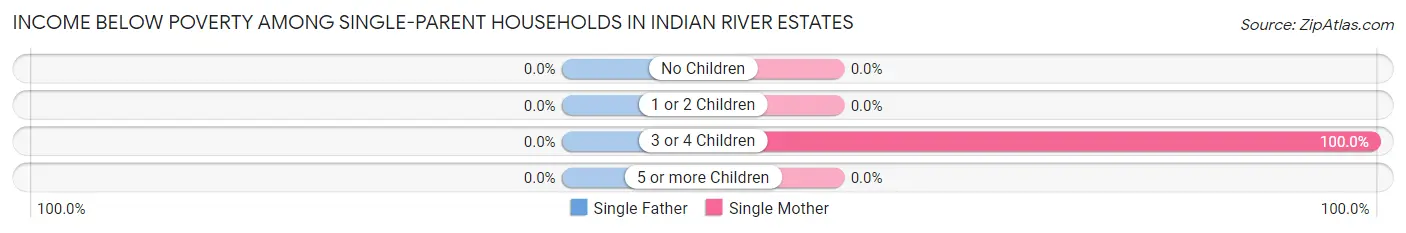
| Children | Single Father | Single Mother |
| No Children | 0 (0.0%) | 0 (0.0%) |
| 1 or 2 Children | 0 (0.0%) | 0 (0.0%) |
| 3 or 4 Children | 0 (0.0%) | 203 (100.0%) |
| 5 or more Children | 0 (0.0%) | 0 (0.0%) |
| Total | 0 (0.0%) | 203 (54.0%) |
Income Below Poverty Among Married-Couple vs Single-Parent Households in Indian River Estates
The poverty data for Indian River Estates shows that 102 of the married-couple family households (8.5%) and 203 of the single-parent households (40.9%) are living below the poverty level. Within the married-couple family households, those with 1 or 2 children have the highest poverty rate, with 29 households (24.6%) falling below the poverty line. Among the single-parent households, those with 3 or 4 children have the highest poverty rate, with 203 household (91.0%) living below poverty.
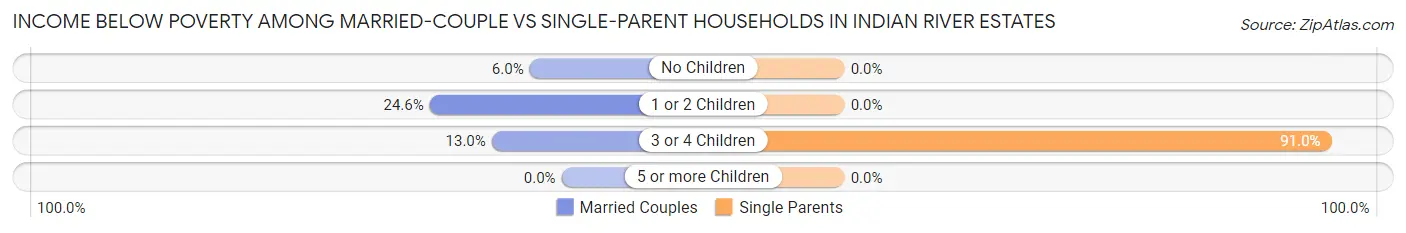
| Children | Married-Couple Families | Single-Parent Households |
| No Children | 57 (6.0%) | 0 (0.0%) |
| 1 or 2 Children | 29 (24.6%) | 0 (0.0%) |
| 3 or 4 Children | 16 (13.0%) | 203 (91.0%) |
| 5 or more Children | 0 (0.0%) | 0 (0.0%) |
| Total | 102 (8.5%) | 203 (40.9%) |
Employment Characteristics in Indian River Estates
Employment by Class of Employer in Indian River Estates
Among the 2,848 employed individuals in Indian River Estates, private company employees (1,822 | 64.0%), local government employees (352 | 12.4%), and not-for-profit organizations (184 | 6.5%) make up the most common classes of employment.
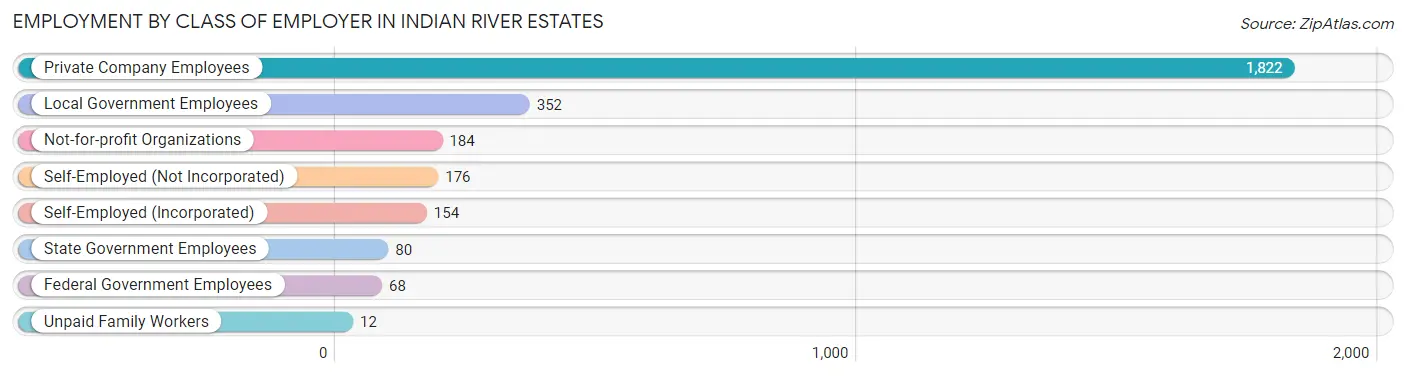
| Employer Class | # Employees | % Employees |
| Private Company Employees | 1,822 | 64.0% |
| Self-Employed (Incorporated) | 154 | 5.4% |
| Self-Employed (Not Incorporated) | 176 | 6.2% |
| Not-for-profit Organizations | 184 | 6.5% |
| Local Government Employees | 352 | 12.4% |
| State Government Employees | 80 | 2.8% |
| Federal Government Employees | 68 | 2.4% |
| Unpaid Family Workers | 12 | 0.4% |
| Total | 2,848 | 100.0% |
Employment Status by Age in Indian River Estates
According to the labor force statistics for Indian River Estates, out of the total population over 16 years of age (5,647), 54.2% or 3,061 individuals are in the labor force, with 4.7% or 144 of them unemployed. The age group with the highest labor force participation rate is 30 to 34 years, with 95.6% or 262 individuals in the labor force. Within the labor force, the 25 to 29 years age range has the highest percentage of unemployed individuals, with 12.6% or 39 of them being unemployed.
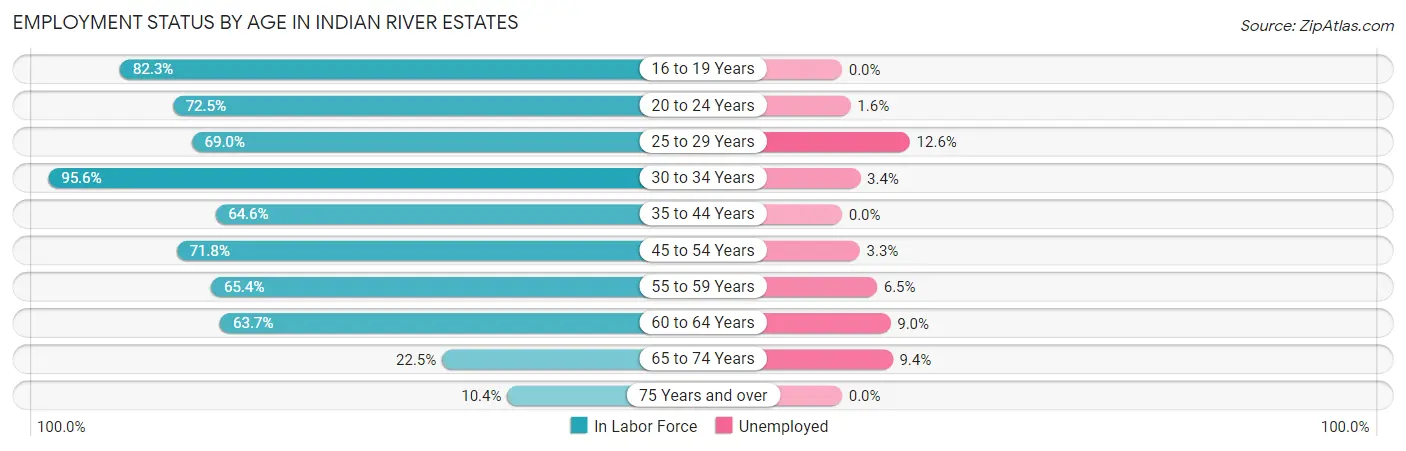
| Age Bracket | In Labor Force | Unemployed |
| 16 to 19 Years | 246 (82.3%) | 0 (0.0%) |
| 20 to 24 Years | 319 (72.5%) | 5 (1.6%) |
| 25 to 29 Years | 309 (69.0%) | 39 (12.6%) |
| 30 to 34 Years | 262 (95.6%) | 9 (3.4%) |
| 35 to 44 Years | 314 (64.6%) | 0 (0.0%) |
| 45 to 54 Years | 700 (71.8%) | 23 (3.3%) |
| 55 to 59 Years | 276 (65.4%) | 18 (6.5%) |
| 60 to 64 Years | 332 (63.7%) | 30 (9.0%) |
| 65 to 74 Years | 213 (22.5%) | 20 (9.4%) |
| 75 Years and over | 87 (10.4%) | 0 (0.0%) |
| Total | 3,061 (54.2%) | 144 (4.7%) |
Employment Status by Educational Attainment in Indian River Estates
According to labor force statistics for Indian River Estates, 70.2% of individuals (2,194) out of the total population between 25 and 64 years of age (3,126) are in the labor force, with 5.4% or 118 of them being unemployed. The group with the highest labor force participation rate are those with the educational attainment of less than high school, with 92.7% or 393 individuals in the labor force. Within the labor force, individuals with bachelor's degree or higher education have the highest percentage of unemployment, with 12.2% or 57 of them being unemployed.
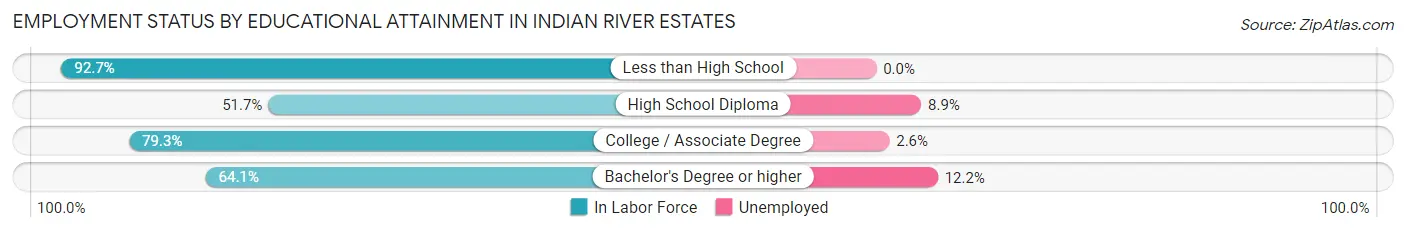
| Educational Attainment | In Labor Force | Unemployed |
| Less than High School | 393 (92.7%) | 0 (0.0%) |
| High School Diploma | 436 (51.7%) | 75 (8.9%) |
| College / Associate Degree | 898 (79.3%) | 29 (2.6%) |
| Bachelor's Degree or higher | 466 (64.1%) | 89 (12.2%) |
| Total | 2,194 (70.2%) | 169 (5.4%) |
Employment Occupations by Sex in Indian River Estates
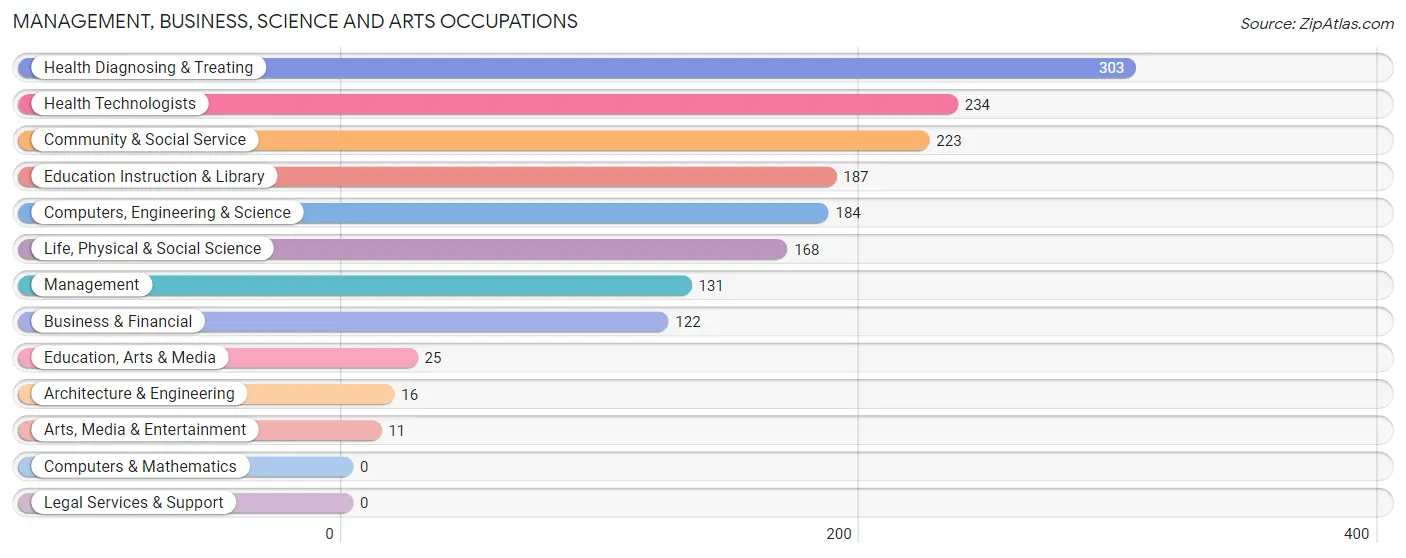
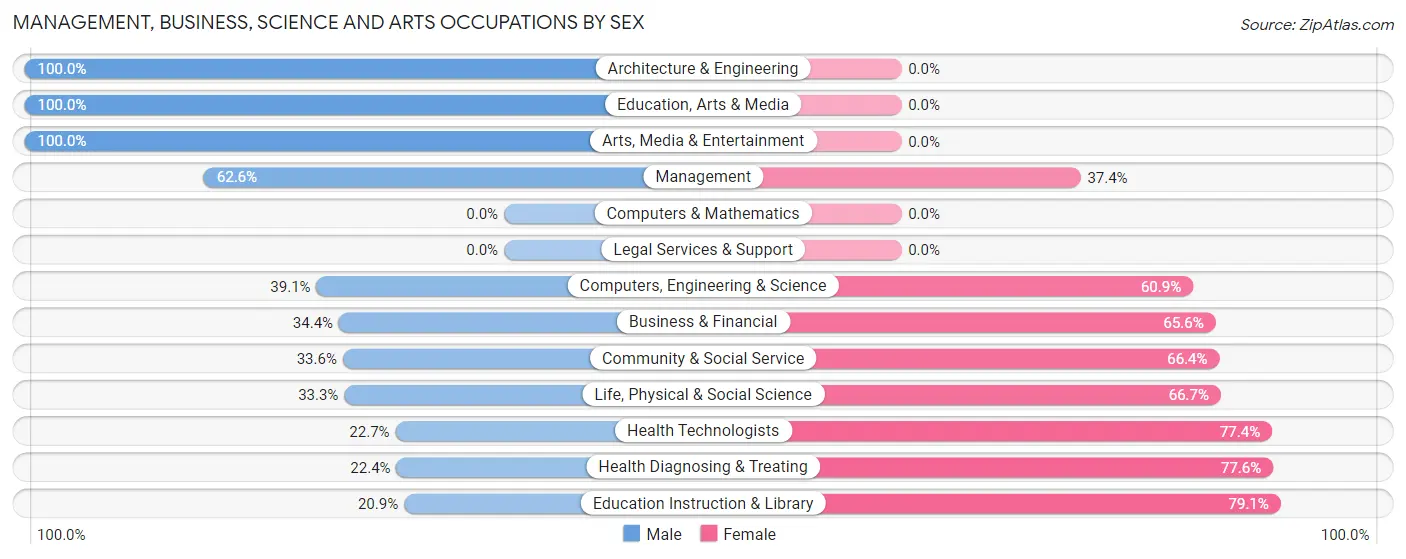
Management, Business, Science and Arts Occupations
The most common Management, Business, Science and Arts occupations in Indian River Estates are Health Diagnosing & Treating (303 | 10.4%), Health Technologists (234 | 8.0%), Community & Social Service (223 | 7.6%), Education Instruction & Library (187 | 6.4%), and Computers, Engineering & Science (184 | 6.3%).
Management, Business, Science and Arts Occupations by Sex
Within the Management, Business, Science and Arts occupations in Indian River Estates, the most male-oriented occupations are Architecture & Engineering (100.0%), Education, Arts & Media (100.0%), and Arts, Media & Entertainment (100.0%), while the most female-oriented occupations are Education Instruction & Library (79.1%), Health Diagnosing & Treating (77.6%), and Health Technologists (77.3%).
| Occupation | Male | Female |
| Management | 82 (62.6%) | 49 (37.4%) |
| Business & Financial | 42 (34.4%) | 80 (65.6%) |
| Computers, Engineering & Science | 72 (39.1%) | 112 (60.9%) |
| Computers & Mathematics | 0 (0.0%) | 0 (0.0%) |
| Architecture & Engineering | 16 (100.0%) | 0 (0.0%) |
| Life, Physical & Social Science | 56 (33.3%) | 112 (66.7%) |
| Community & Social Service | 75 (33.6%) | 148 (66.4%) |
| Education, Arts & Media | 25 (100.0%) | 0 (0.0%) |
| Legal Services & Support | 0 (0.0%) | 0 (0.0%) |
| Education Instruction & Library | 39 (20.9%) | 148 (79.1%) |
| Arts, Media & Entertainment | 11 (100.0%) | 0 (0.0%) |
| Health Diagnosing & Treating | 68 (22.4%) | 235 (77.6%) |
| Health Technologists | 53 (22.7%) | 181 (77.3%) |
| Total (Category) | 339 (35.2%) | 624 (64.8%) |
| Total (Overall) | 1,235 (42.4%) | 1,679 (57.6%) |
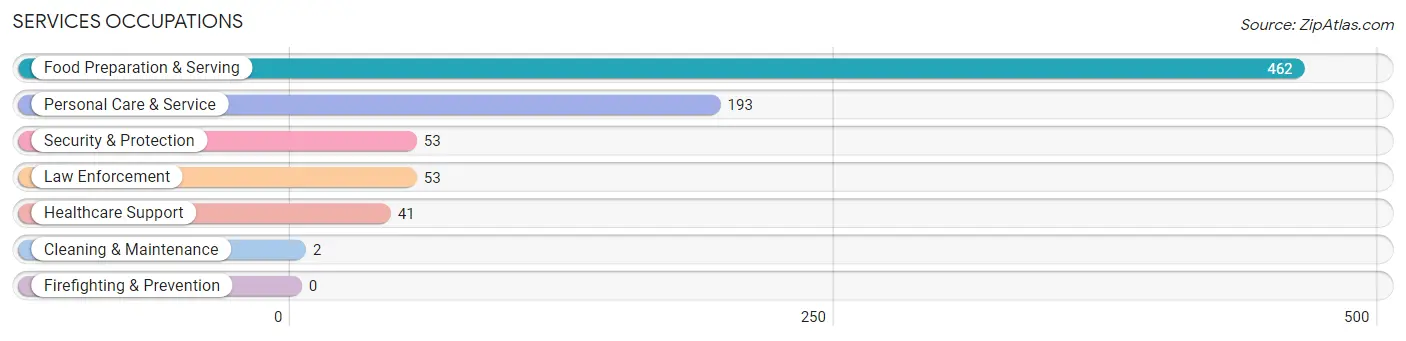
Services Occupations
The most common Services occupations in Indian River Estates are Food Preparation & Serving (462 | 15.9%), Personal Care & Service (193 | 6.6%), Security & Protection (53 | 1.8%), Law Enforcement (53 | 1.8%), and Healthcare Support (41 | 1.4%).
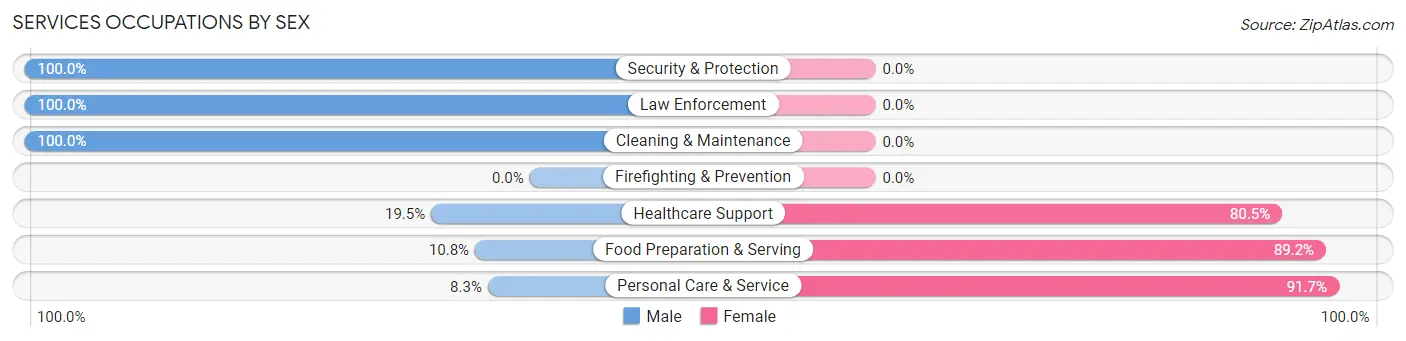
Services Occupations by Sex
Within the Services occupations in Indian River Estates, the most male-oriented occupations are Security & Protection (100.0%), Law Enforcement (100.0%), and Cleaning & Maintenance (100.0%), while the most female-oriented occupations are Personal Care & Service (91.7%), Food Preparation & Serving (89.2%), and Healthcare Support (80.5%).
| Occupation | Male | Female |
| Healthcare Support | 8 (19.5%) | 33 (80.5%) |
| Security & Protection | 53 (100.0%) | 0 (0.0%) |
| Firefighting & Prevention | 0 (0.0%) | 0 (0.0%) |
| Law Enforcement | 53 (100.0%) | 0 (0.0%) |
| Food Preparation & Serving | 50 (10.8%) | 412 (89.2%) |
| Cleaning & Maintenance | 2 (100.0%) | 0 (0.0%) |
| Personal Care & Service | 16 (8.3%) | 177 (91.7%) |
| Total (Category) | 129 (17.2%) | 622 (82.8%) |
| Total (Overall) | 1,235 (42.4%) | 1,679 (57.6%) |
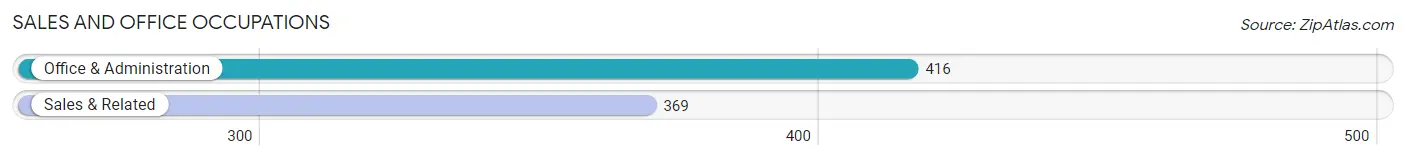
Sales and Office Occupations
The most common Sales and Office occupations in Indian River Estates are Office & Administration (416 | 14.3%), and Sales & Related (369 | 12.7%).
Sales and Office Occupations by Sex
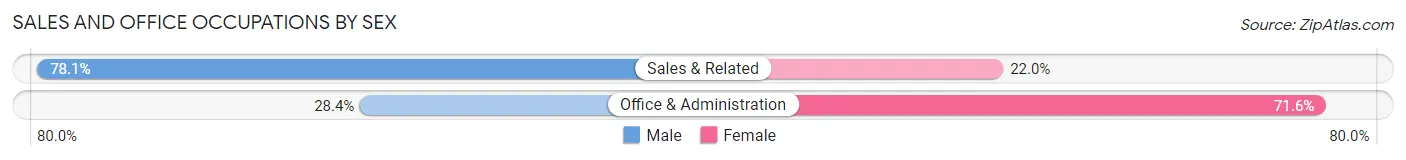
| Occupation | Male | Female |
| Sales & Related | 288 (78.0%) | 81 (22.0%) |
| Office & Administration | 118 (28.4%) | 298 (71.6%) |
| Total (Category) | 406 (51.7%) | 379 (48.3%) |
| Total (Overall) | 1,235 (42.4%) | 1,679 (57.6%) |
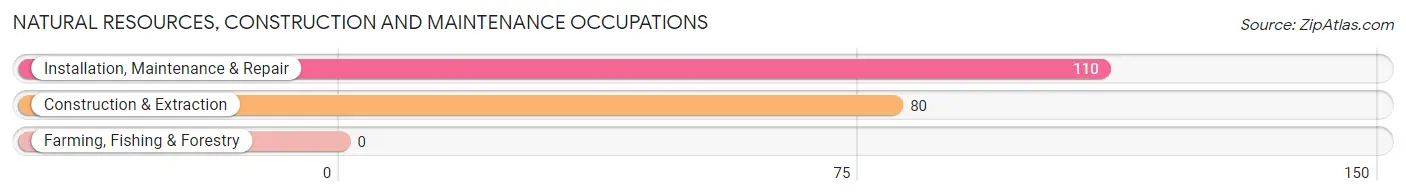
Natural Resources, Construction and Maintenance Occupations
The most common Natural Resources, Construction and Maintenance occupations in Indian River Estates are Installation, Maintenance & Repair (110 | 3.8%), and Construction & Extraction (80 | 2.8%).
Natural Resources, Construction and Maintenance Occupations by Sex
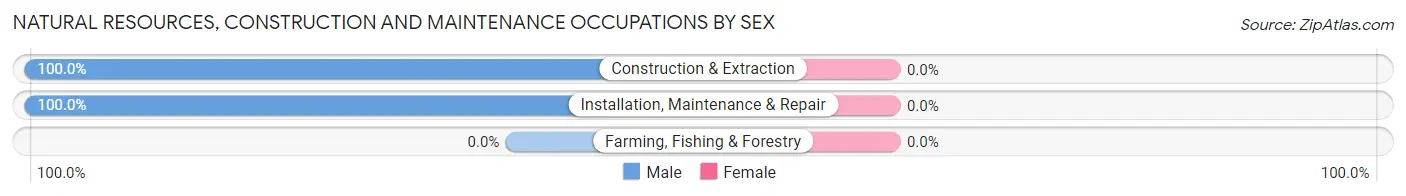
| Occupation | Male | Female |
| Farming, Fishing & Forestry | 0 (0.0%) | 0 (0.0%) |
| Construction & Extraction | 80 (100.0%) | 0 (0.0%) |
| Installation, Maintenance & Repair | 110 (100.0%) | 0 (0.0%) |
| Total (Category) | 190 (100.0%) | 0 (0.0%) |
| Total (Overall) | 1,235 (42.4%) | 1,679 (57.6%) |
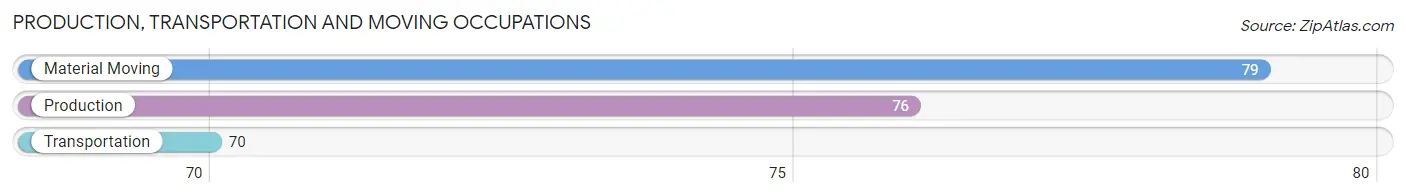
Production, Transportation and Moving Occupations
The most common Production, Transportation and Moving occupations in Indian River Estates are Material Moving (79 | 2.7%), Production (76 | 2.6%), and Transportation (70 | 2.4%).
Production, Transportation and Moving Occupations by Sex
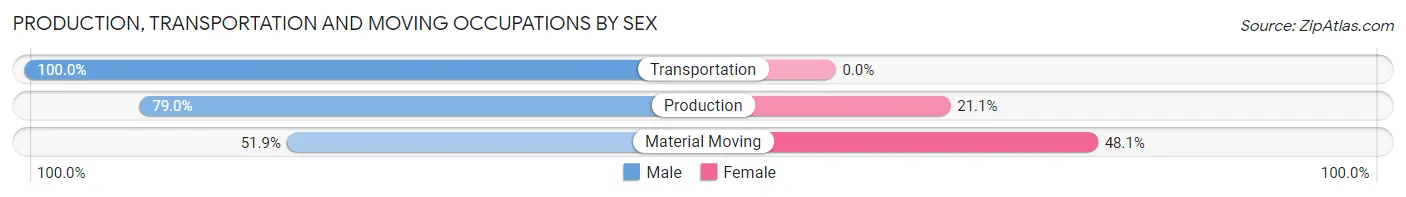
| Occupation | Male | Female |
| Production | 60 (78.9%) | 16 (21.0%) |
| Transportation | 70 (100.0%) | 0 (0.0%) |
| Material Moving | 41 (51.9%) | 38 (48.1%) |
| Total (Category) | 171 (76.0%) | 54 (24.0%) |
| Total (Overall) | 1,235 (42.4%) | 1,679 (57.6%) |
Employment Industries by Sex in Indian River Estates
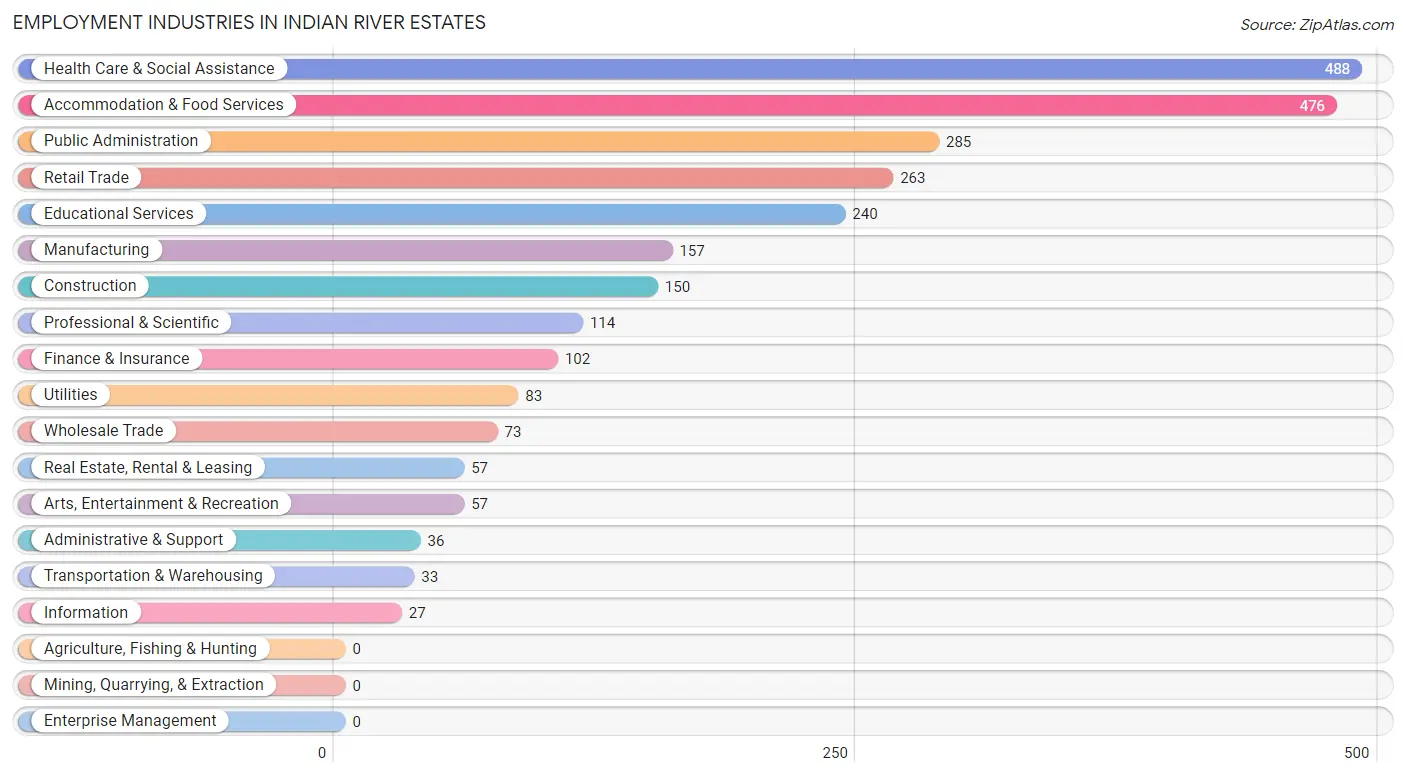
Employment Industries in Indian River Estates
The major employment industries in Indian River Estates include Health Care & Social Assistance (488 | 16.8%), Accommodation & Food Services (476 | 16.3%), Public Administration (285 | 9.8%), Retail Trade (263 | 9.0%), and Educational Services (240 | 8.2%).
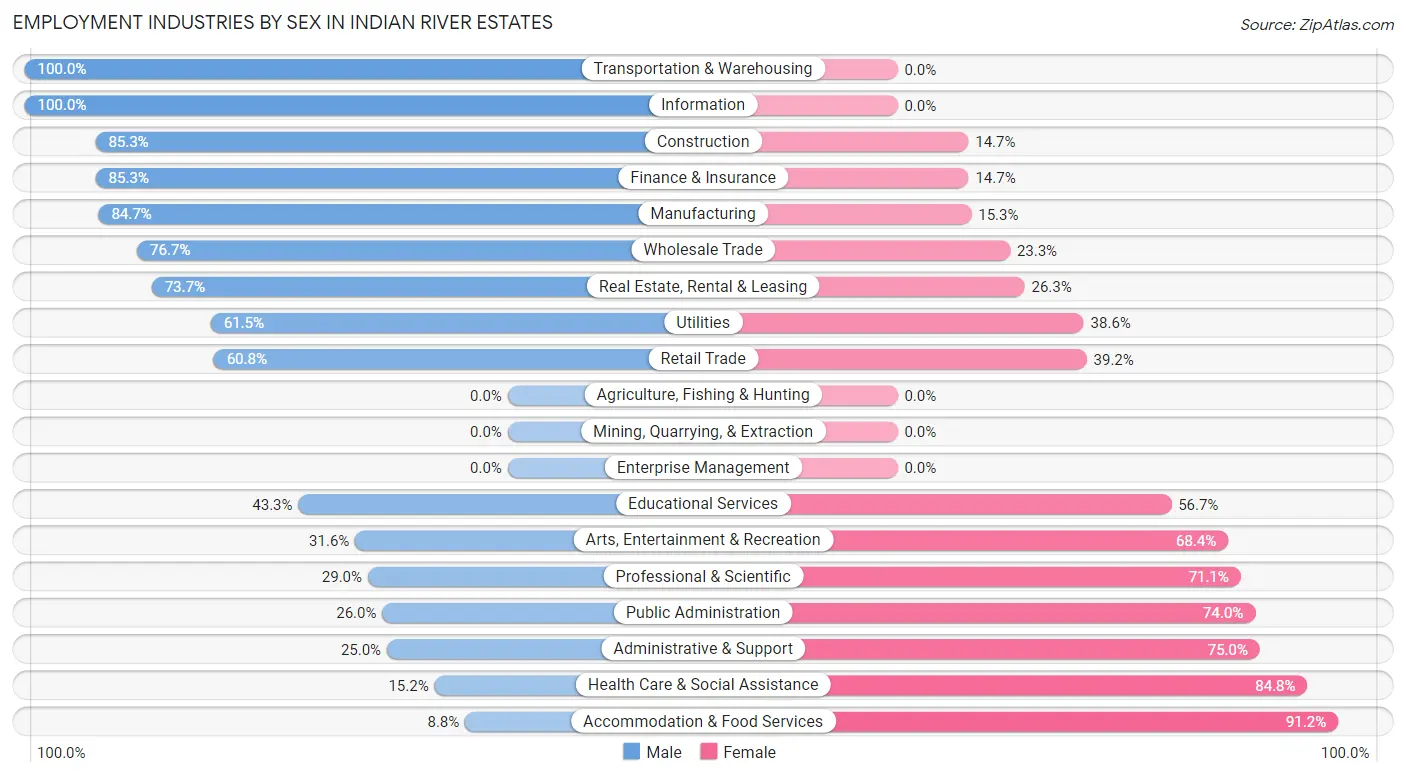
Employment Industries by Sex in Indian River Estates
The Indian River Estates industries that see more men than women are Transportation & Warehousing (100.0%), Information (100.0%), and Construction (85.3%), whereas the industries that tend to have a higher number of women are Accommodation & Food Services (91.2%), Health Care & Social Assistance (84.8%), and Administrative & Support (75.0%).
| Industry | Male | Female |
| Agriculture, Fishing & Hunting | 0 (0.0%) | 0 (0.0%) |
| Mining, Quarrying, & Extraction | 0 (0.0%) | 0 (0.0%) |
| Construction | 128 (85.3%) | 22 (14.7%) |
| Manufacturing | 133 (84.7%) | 24 (15.3%) |
| Wholesale Trade | 56 (76.7%) | 17 (23.3%) |
| Retail Trade | 160 (60.8%) | 103 (39.2%) |
| Transportation & Warehousing | 33 (100.0%) | 0 (0.0%) |
| Utilities | 51 (61.5%) | 32 (38.6%) |
| Information | 27 (100.0%) | 0 (0.0%) |
| Finance & Insurance | 87 (85.3%) | 15 (14.7%) |
| Real Estate, Rental & Leasing | 42 (73.7%) | 15 (26.3%) |
| Professional & Scientific | 33 (28.9%) | 81 (71.1%) |
| Enterprise Management | 0 (0.0%) | 0 (0.0%) |
| Administrative & Support | 9 (25.0%) | 27 (75.0%) |
| Educational Services | 104 (43.3%) | 136 (56.7%) |
| Health Care & Social Assistance | 74 (15.2%) | 414 (84.8%) |
| Arts, Entertainment & Recreation | 18 (31.6%) | 39 (68.4%) |
| Accommodation & Food Services | 42 (8.8%) | 434 (91.2%) |
| Public Administration | 74 (26.0%) | 211 (74.0%) |
| Total | 1,235 (42.4%) | 1,679 (57.6%) |
Education in Indian River Estates
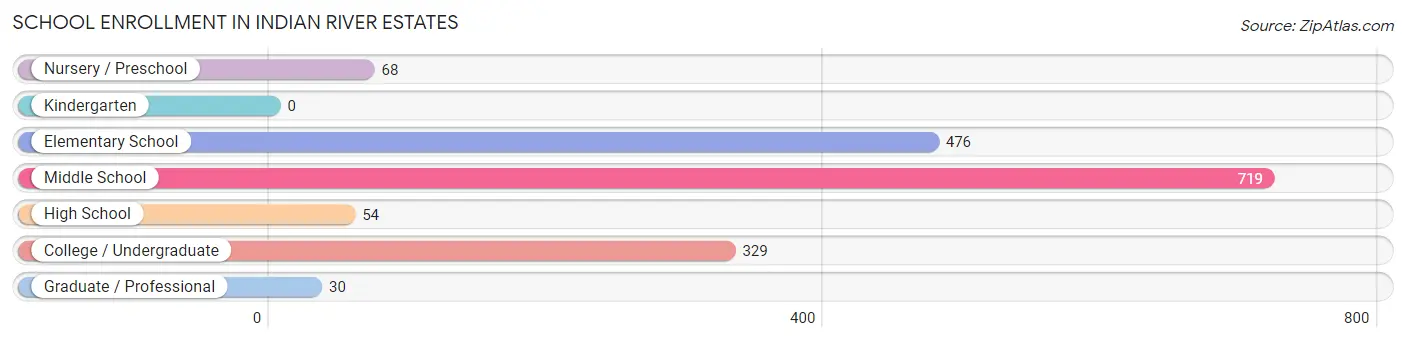
School Enrollment in Indian River Estates
The most common levels of schooling among the 1,676 students in Indian River Estates are middle school (719 | 42.9%), elementary school (476 | 28.4%), and college / undergraduate (329 | 19.6%).
| School Level | # Students | % Students |
| Nursery / Preschool | 68 | 4.1% |
| Kindergarten | 0 | 0.0% |
| Elementary School | 476 | 28.4% |
| Middle School | 719 | 42.9% |
| High School | 54 | 3.2% |
| College / Undergraduate | 329 | 19.6% |
| Graduate / Professional | 30 | 1.8% |
| Total | 1,676 | 100.0% |
School Enrollment by Age by Funding Source in Indian River Estates
Out of a total of 1,676 students who are enrolled in schools in Indian River Estates, 112 (6.7%) attend a private institution, while the remaining 1,564 (93.3%) are enrolled in public schools. The age group of 35 years and over has the highest likelihood of being enrolled in private schools, with 30 (100.0% in the age bracket) enrolled. Conversely, the age group of 10 to 14 year olds has the lowest likelihood of being enrolled in a private school, with 695 (100.0% in the age bracket) attending a public institution.
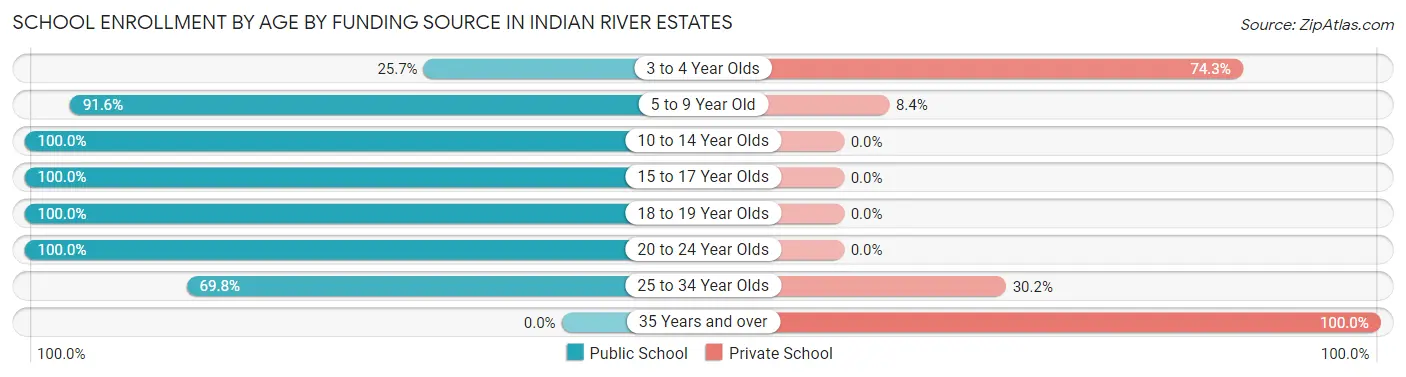
| Age Bracket | Public School | Private School |
| 3 to 4 Year Olds | 9 (25.7%) | 26 (74.3%) |
| 5 to 9 Year Old | 445 (91.6%) | 41 (8.4%) |
| 10 to 14 Year Olds | 695 (100.0%) | 0 (0.0%) |
| 15 to 17 Year Olds | 88 (100.0%) | 0 (0.0%) |
| 18 to 19 Year Olds | 57 (100.0%) | 0 (0.0%) |
| 20 to 24 Year Olds | 232 (100.0%) | 0 (0.0%) |
| 25 to 34 Year Olds | 37 (69.8%) | 16 (30.2%) |
| 35 Years and over | 0 (0.0%) | 30 (100.0%) |
| Total | 1,564 (93.3%) | 112 (6.7%) |
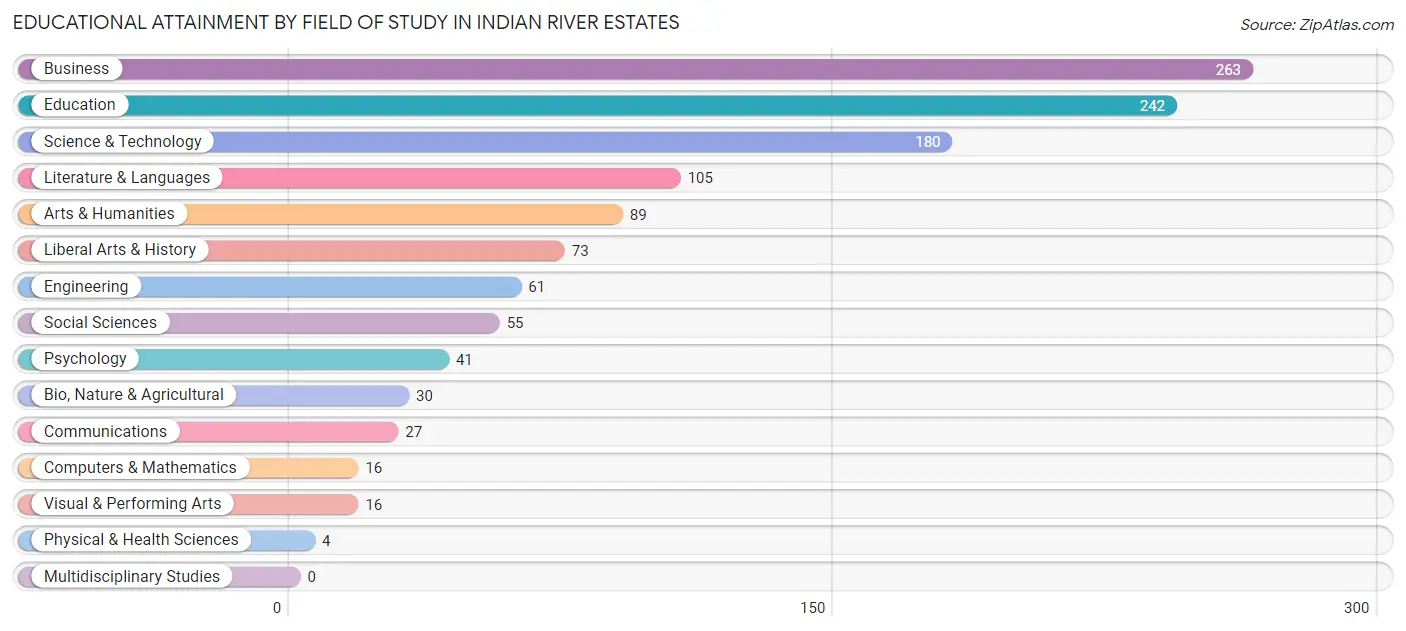
Educational Attainment by Field of Study in Indian River Estates
Business (263 | 21.9%), education (242 | 20.1%), science & technology (180 | 15.0%), literature & languages (105 | 8.7%), and arts & humanities (89 | 7.4%) are the most common fields of study among 1,202 individuals in Indian River Estates who have obtained a bachelor's degree or higher.
| Field of Study | # Graduates | % Graduates |
| Computers & Mathematics | 16 | 1.3% |
| Bio, Nature & Agricultural | 30 | 2.5% |
| Physical & Health Sciences | 4 | 0.3% |
| Psychology | 41 | 3.4% |
| Social Sciences | 55 | 4.6% |
| Engineering | 61 | 5.1% |
| Multidisciplinary Studies | 0 | 0.0% |
| Science & Technology | 180 | 15.0% |
| Business | 263 | 21.9% |
| Education | 242 | 20.1% |
| Literature & Languages | 105 | 8.7% |
| Liberal Arts & History | 73 | 6.1% |
| Visual & Performing Arts | 16 | 1.3% |
| Communications | 27 | 2.2% |
| Arts & Humanities | 89 | 7.4% |
| Total | 1,202 | 100.0% |
Transportation & Commute in Indian River Estates
Vehicle Availability by Sex in Indian River Estates
The most prevalent vehicle ownership categories in Indian River Estates are males with 2 vehicles (452, accounting for 37.8%) and females with 2 vehicles (439, making up 27.4%).
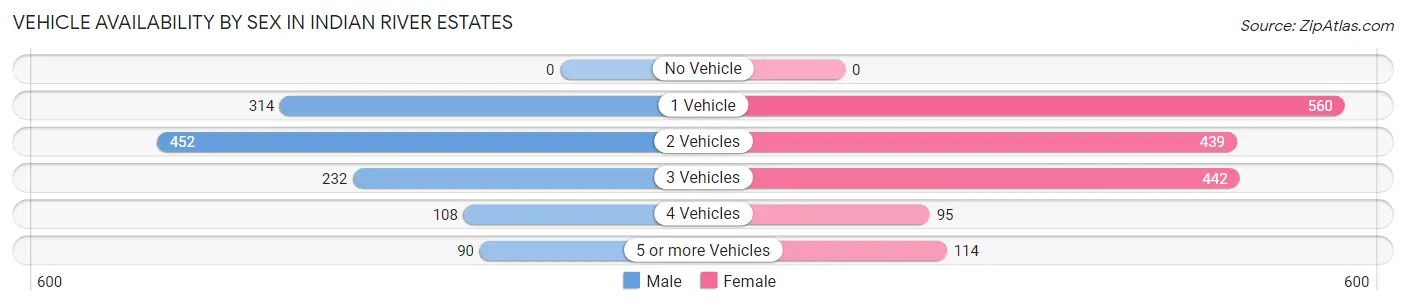
| Vehicles Available | Male | Female |
| No Vehicle | 0 (0.0%) | 0 (0.0%) |
| 1 Vehicle | 314 (26.3%) | 560 (33.9%) |
| 2 Vehicles | 452 (37.8%) | 439 (26.6%) |
| 3 Vehicles | 232 (19.4%) | 442 (26.8%) |
| 4 Vehicles | 108 (9.0%) | 95 (5.8%) |
| 5 or more Vehicles | 90 (7.5%) | 114 (6.9%) |
| Total | 1,196 (100.0%) | 1,650 (100.0%) |
Commute Time in Indian River Estates
The most frequently occuring commute durations in Indian River Estates are 15 to 19 minutes (589 commuters, 22.4%), 10 to 14 minutes (495 commuters, 18.8%), and 30 to 34 minutes (385 commuters, 14.6%).
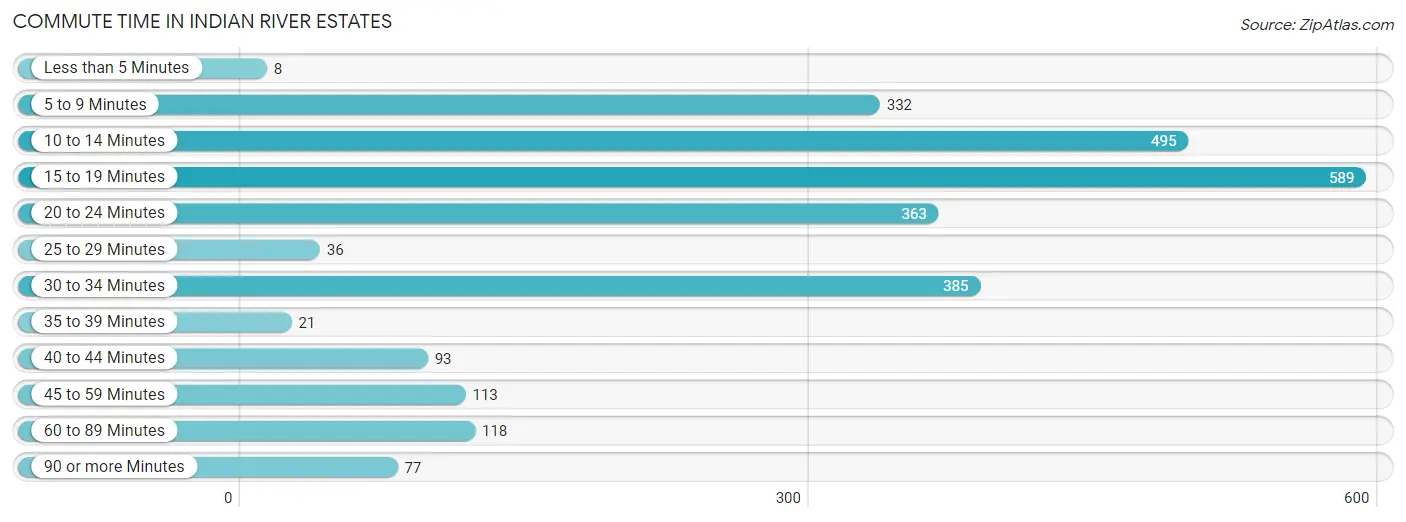
| Commute Time | # Commuters | % Commuters |
| Less than 5 Minutes | 8 | 0.3% |
| 5 to 9 Minutes | 332 | 12.6% |
| 10 to 14 Minutes | 495 | 18.8% |
| 15 to 19 Minutes | 589 | 22.4% |
| 20 to 24 Minutes | 363 | 13.8% |
| 25 to 29 Minutes | 36 | 1.4% |
| 30 to 34 Minutes | 385 | 14.6% |
| 35 to 39 Minutes | 21 | 0.8% |
| 40 to 44 Minutes | 93 | 3.5% |
| 45 to 59 Minutes | 113 | 4.3% |
| 60 to 89 Minutes | 118 | 4.5% |
| 90 or more Minutes | 77 | 2.9% |
Commute Time by Sex in Indian River Estates
The most common commute times in Indian River Estates are 10 to 14 minutes (231 commuters, 20.4%) for males and 15 to 19 minutes (371 commuters, 24.7%) for females.

| Commute Time | Male | Female |
| Less than 5 Minutes | 0 (0.0%) | 8 (0.5%) |
| 5 to 9 Minutes | 122 (10.8%) | 210 (14.0%) |
| 10 to 14 Minutes | 231 (20.4%) | 264 (17.6%) |
| 15 to 19 Minutes | 218 (19.3%) | 371 (24.7%) |
| 20 to 24 Minutes | 113 (10.0%) | 250 (16.7%) |
| 25 to 29 Minutes | 36 (3.2%) | 0 (0.0%) |
| 30 to 34 Minutes | 110 (9.7%) | 275 (18.3%) |
| 35 to 39 Minutes | 17 (1.5%) | 4 (0.3%) |
| 40 to 44 Minutes | 93 (8.2%) | 0 (0.0%) |
| 45 to 59 Minutes | 80 (7.1%) | 33 (2.2%) |
| 60 to 89 Minutes | 49 (4.3%) | 69 (4.6%) |
| 90 or more Minutes | 62 (5.5%) | 15 (1.0%) |
Time of Departure to Work by Sex in Indian River Estates
The most frequent times of departure to work in Indian River Estates are 7:00 AM to 7:29 AM (246, 21.7%) for males and 7:30 AM to 7:59 AM (416, 27.8%) for females.

| Time of Departure | Male | Female |
| 12:00 AM to 4:59 AM | 17 (1.5%) | 9 (0.6%) |
| 5:00 AM to 5:29 AM | 65 (5.8%) | 0 (0.0%) |
| 5:30 AM to 5:59 AM | 58 (5.1%) | 88 (5.9%) |
| 6:00 AM to 6:29 AM | 161 (14.2%) | 0 (0.0%) |
| 6:30 AM to 6:59 AM | 84 (7.4%) | 25 (1.7%) |
| 7:00 AM to 7:29 AM | 246 (21.7%) | 99 (6.6%) |
| 7:30 AM to 7:59 AM | 105 (9.3%) | 416 (27.8%) |
| 8:00 AM to 8:29 AM | 127 (11.2%) | 83 (5.5%) |
| 8:30 AM to 8:59 AM | 69 (6.1%) | 92 (6.1%) |
| 9:00 AM to 9:59 AM | 30 (2.6%) | 222 (14.8%) |
| 10:00 AM to 10:59 AM | 43 (3.8%) | 13 (0.9%) |
| 11:00 AM to 11:59 AM | 0 (0.0%) | 16 (1.1%) |
| 12:00 PM to 3:59 PM | 126 (11.1%) | 389 (26.0%) |
| 4:00 PM to 11:59 PM | 0 (0.0%) | 47 (3.1%) |
| Total | 1,131 (100.0%) | 1,499 (100.0%) |
Housing Occupancy in Indian River Estates
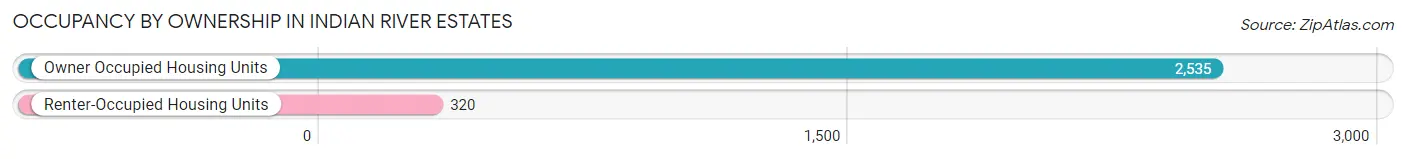
Occupancy by Ownership in Indian River Estates
Of the total 2,855 dwellings in Indian River Estates, owner-occupied units account for 2,535 (88.8%), while renter-occupied units make up 320 (11.2%).
| Occupancy | # Housing Units | % Housing Units |
| Owner Occupied Housing Units | 2,535 | 88.8% |
| Renter-Occupied Housing Units | 320 | 11.2% |
| Total Occupied Housing Units | 2,855 | 100.0% |
Occupancy by Household Size in Indian River Estates

| Household Size | # Housing Units | % Housing Units |
| 1-Person Household | 953 | 33.4% |
| 2-Person Household | 973 | 34.1% |
| 3-Person Household | 408 | 14.3% |
| 4+ Person Household | 521 | 18.2% |
| Total Housing Units | 2,855 | 100.0% |
Occupancy by Ownership by Household Size in Indian River Estates
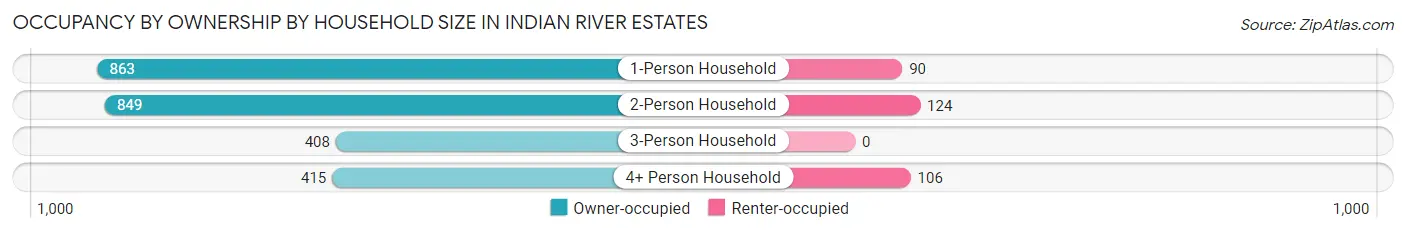
| Household Size | Owner-occupied | Renter-occupied |
| 1-Person Household | 863 (90.6%) | 90 (9.4%) |
| 2-Person Household | 849 (87.3%) | 124 (12.7%) |
| 3-Person Household | 408 (100.0%) | 0 (0.0%) |
| 4+ Person Household | 415 (79.6%) | 106 (20.3%) |
| Total Housing Units | 2,535 (88.8%) | 320 (11.2%) |
Occupancy by Educational Attainment in Indian River Estates
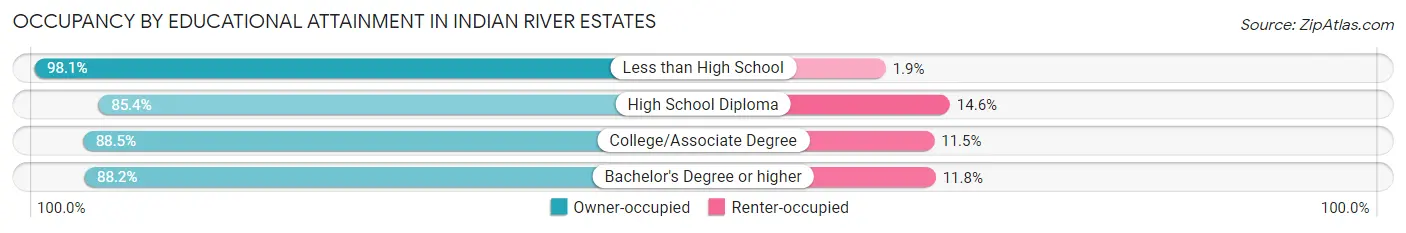
| Household Size | Owner-occupied | Renter-occupied |
| Less than High School | 415 (98.1%) | 8 (1.9%) |
| High School Diploma | 829 (85.4%) | 142 (14.6%) |
| College/Associate Degree | 813 (88.5%) | 106 (11.5%) |
| Bachelor's Degree or higher | 478 (88.2%) | 64 (11.8%) |
Occupancy by Age of Householder in Indian River Estates
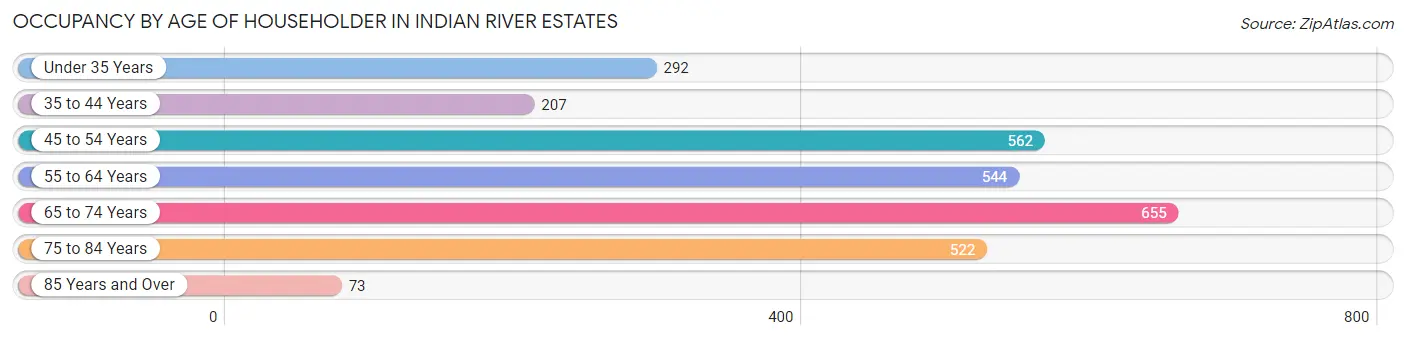
| Age Bracket | # Households | % Households |
| Under 35 Years | 292 | 10.2% |
| 35 to 44 Years | 207 | 7.2% |
| 45 to 54 Years | 562 | 19.7% |
| 55 to 64 Years | 544 | 19.1% |
| 65 to 74 Years | 655 | 22.9% |
| 75 to 84 Years | 522 | 18.3% |
| 85 Years and Over | 73 | 2.6% |
| Total | 2,855 | 100.0% |
Housing Finances in Indian River Estates
Median Income by Occupancy in Indian River Estates
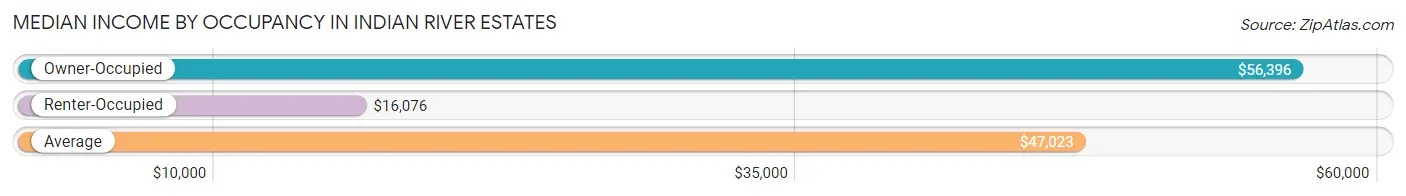
| Occupancy Type | # Households | Median Income |
| Owner-Occupied | 2,535 (88.8%) | $56,396 |
| Renter-Occupied | 320 (11.2%) | $16,076 |
| Average | 2,855 (100.0%) | $47,023 |
Occupancy by Householder Income Bracket in Indian River Estates
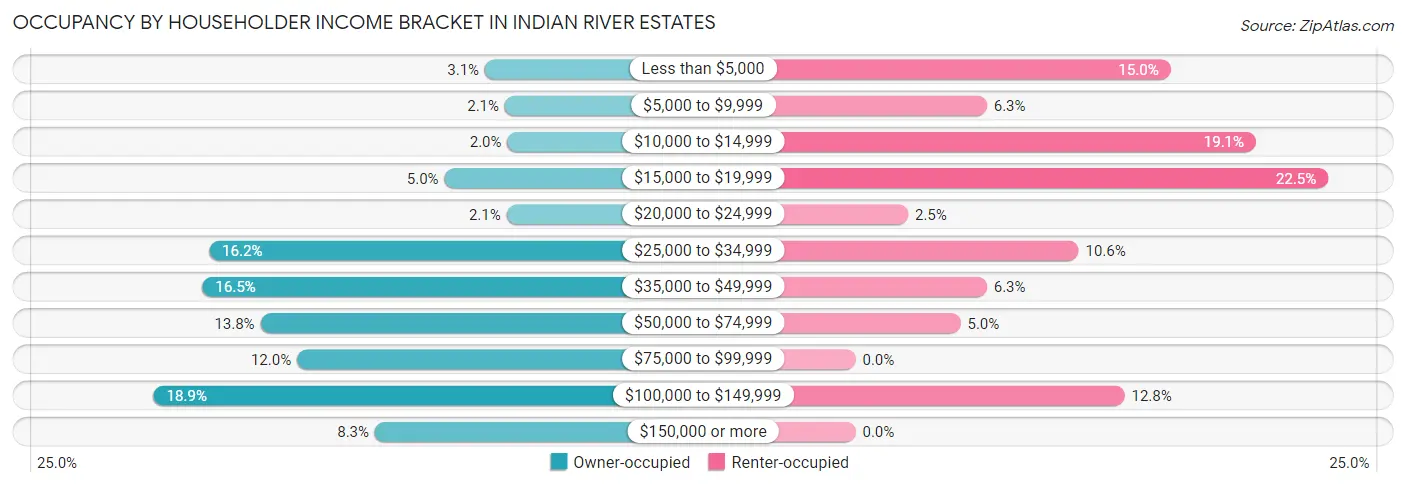
| Income Bracket | Owner-occupied | Renter-occupied |
| Less than $5,000 | 78 (3.1%) | 48 (15.0%) |
| $5,000 to $9,999 | 54 (2.1%) | 20 (6.2%) |
| $10,000 to $14,999 | 51 (2.0%) | 61 (19.1%) |
| $15,000 to $19,999 | 127 (5.0%) | 72 (22.5%) |
| $20,000 to $24,999 | 52 (2.1%) | 8 (2.5%) |
| $25,000 to $34,999 | 411 (16.2%) | 34 (10.6%) |
| $35,000 to $49,999 | 419 (16.5%) | 20 (6.2%) |
| $50,000 to $74,999 | 349 (13.8%) | 16 (5.0%) |
| $75,000 to $99,999 | 305 (12.0%) | 0 (0.0%) |
| $100,000 to $149,999 | 478 (18.9%) | 41 (12.8%) |
| $150,000 or more | 211 (8.3%) | 0 (0.0%) |
| Total | 2,535 (100.0%) | 320 (100.0%) |
Monthly Housing Cost Tiers in Indian River Estates
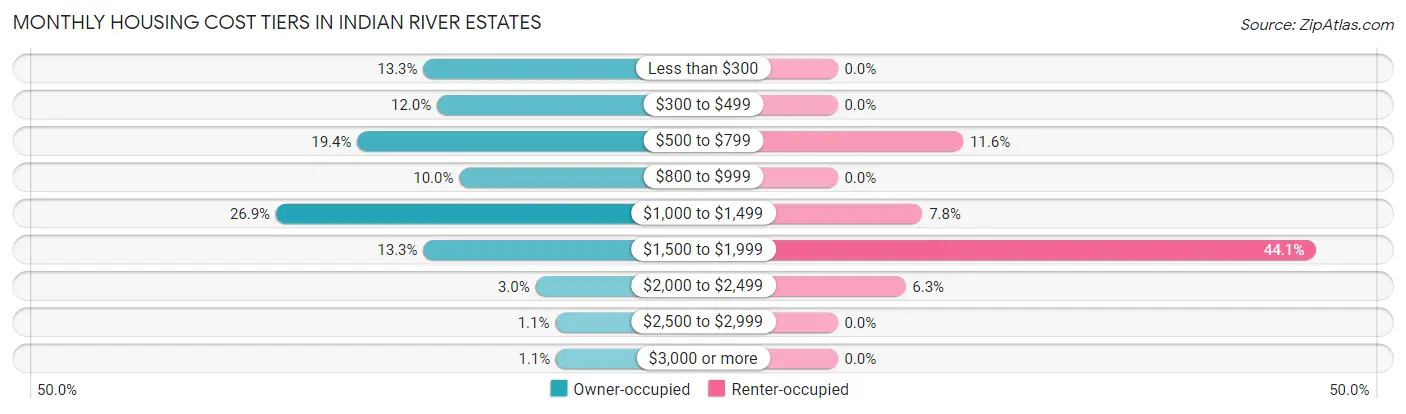
| Monthly Cost | Owner-occupied | Renter-occupied |
| Less than $300 | 337 (13.3%) | 0 (0.0%) |
| $300 to $499 | 305 (12.0%) | 0 (0.0%) |
| $500 to $799 | 491 (19.4%) | 37 (11.6%) |
| $800 to $999 | 253 (10.0%) | 0 (0.0%) |
| $1,000 to $1,499 | 681 (26.9%) | 25 (7.8%) |
| $1,500 to $1,999 | 337 (13.3%) | 141 (44.1%) |
| $2,000 to $2,499 | 75 (3.0%) | 20 (6.2%) |
| $2,500 to $2,999 | 29 (1.1%) | 0 (0.0%) |
| $3,000 or more | 27 (1.1%) | 0 (0.0%) |
| Total | 2,535 (100.0%) | 320 (100.0%) |
Physical Housing Characteristics in Indian River Estates
Housing Structures in Indian River Estates
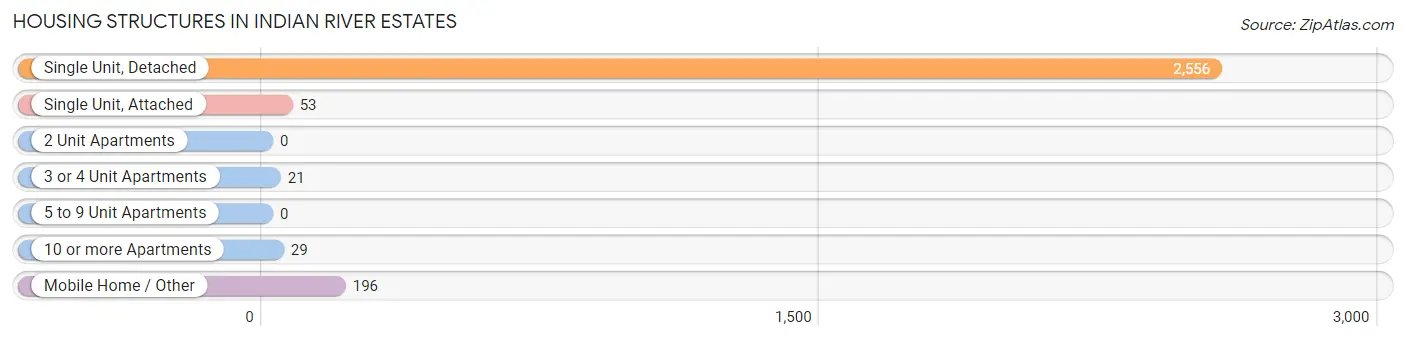
| Structure Type | # Housing Units | % Housing Units |
| Single Unit, Detached | 2,556 | 89.5% |
| Single Unit, Attached | 53 | 1.9% |
| 2 Unit Apartments | 0 | 0.0% |
| 3 or 4 Unit Apartments | 21 | 0.7% |
| 5 to 9 Unit Apartments | 0 | 0.0% |
| 10 or more Apartments | 29 | 1.0% |
| Mobile Home / Other | 196 | 6.9% |
| Total | 2,855 | 100.0% |
Housing Structures by Occupancy in Indian River Estates
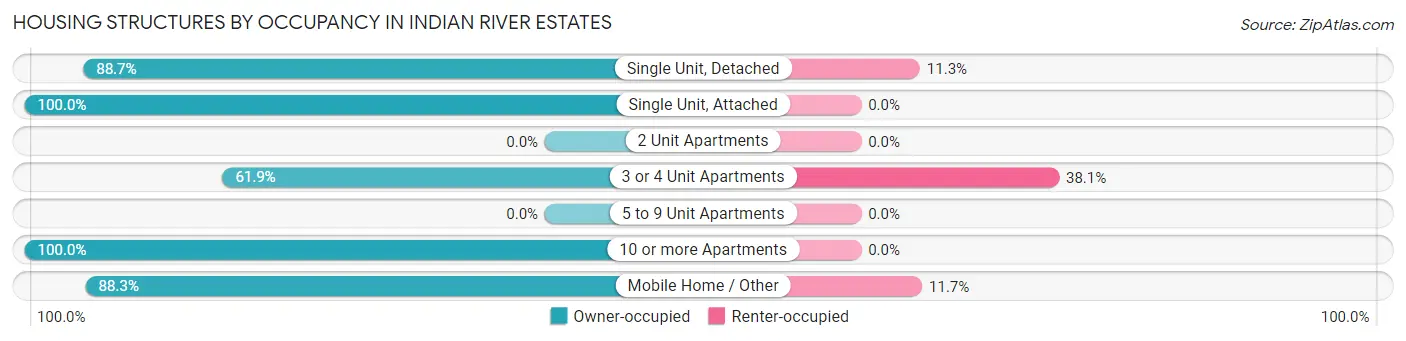
| Structure Type | Owner-occupied | Renter-occupied |
| Single Unit, Detached | 2,267 (88.7%) | 289 (11.3%) |
| Single Unit, Attached | 53 (100.0%) | 0 (0.0%) |
| 2 Unit Apartments | 0 (0.0%) | 0 (0.0%) |
| 3 or 4 Unit Apartments | 13 (61.9%) | 8 (38.1%) |
| 5 to 9 Unit Apartments | 0 (0.0%) | 0 (0.0%) |
| 10 or more Apartments | 29 (100.0%) | 0 (0.0%) |
| Mobile Home / Other | 173 (88.3%) | 23 (11.7%) |
| Total | 2,535 (88.8%) | 320 (11.2%) |
Housing Structures by Number of Rooms in Indian River Estates
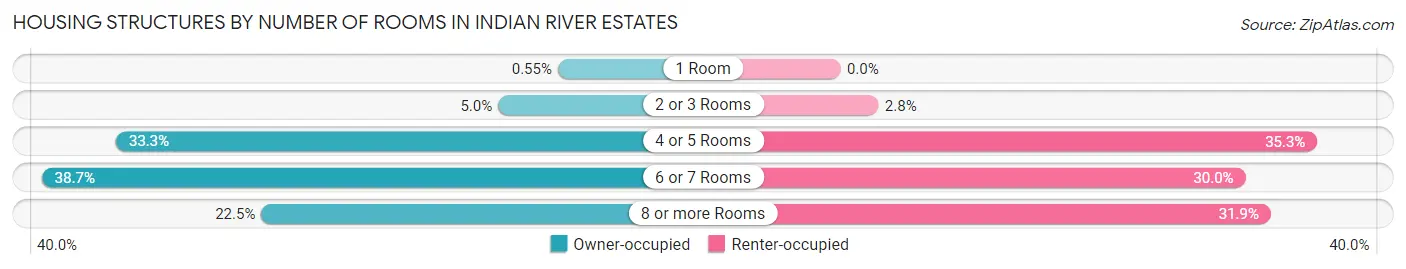
| Number of Rooms | Owner-occupied | Renter-occupied |
| 1 Room | 14 (0.5%) | 0 (0.0%) |
| 2 or 3 Rooms | 126 (5.0%) | 9 (2.8%) |
| 4 or 5 Rooms | 843 (33.3%) | 113 (35.3%) |
| 6 or 7 Rooms | 982 (38.7%) | 96 (30.0%) |
| 8 or more Rooms | 570 (22.5%) | 102 (31.9%) |
| Total | 2,535 (100.0%) | 320 (100.0%) |
Housing Structure by Heating Type in Indian River Estates
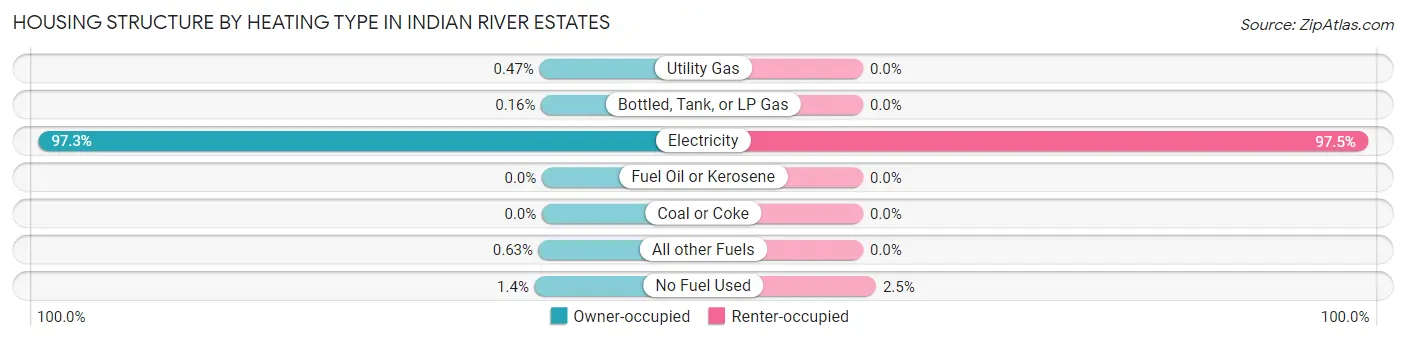
| Heating Type | Owner-occupied | Renter-occupied |
| Utility Gas | 12 (0.5%) | 0 (0.0%) |
| Bottled, Tank, or LP Gas | 4 (0.2%) | 0 (0.0%) |
| Electricity | 2,467 (97.3%) | 312 (97.5%) |
| Fuel Oil or Kerosene | 0 (0.0%) | 0 (0.0%) |
| Coal or Coke | 0 (0.0%) | 0 (0.0%) |
| All other Fuels | 16 (0.6%) | 0 (0.0%) |
| No Fuel Used | 36 (1.4%) | 8 (2.5%) |
| Total | 2,535 (100.0%) | 320 (100.0%) |
Household Vehicle Usage in Indian River Estates
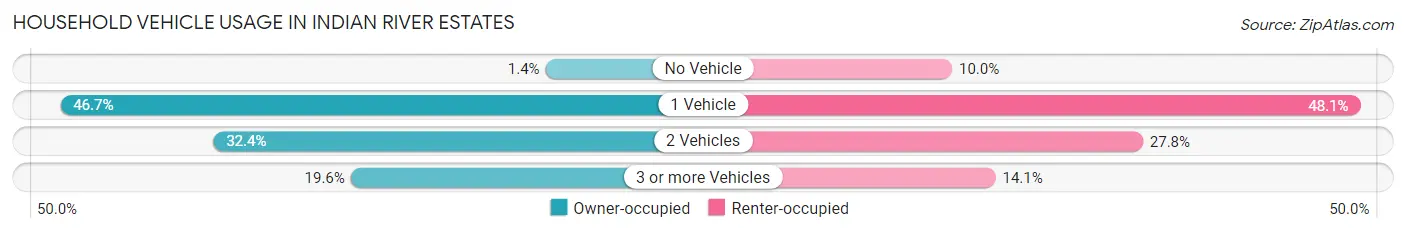
| Vehicles per Household | Owner-occupied | Renter-occupied |
| No Vehicle | 35 (1.4%) | 32 (10.0%) |
| 1 Vehicle | 1,183 (46.7%) | 154 (48.1%) |
| 2 Vehicles | 821 (32.4%) | 89 (27.8%) |
| 3 or more Vehicles | 496 (19.6%) | 45 (14.1%) |
| Total | 2,535 (100.0%) | 320 (100.0%) |
Real Estate & Mortgages in Indian River Estates
Real Estate and Mortgage Overview in Indian River Estates
| Characteristic | Without Mortgage | With Mortgage |
| Housing Units | 1,257 | 1,278 |
| Median Property Value | $191,600 | $230,300 |
| Median Household Income | $36,649 | $135 |
| Monthly Housing Costs | $487 | $27 |
| Real Estate Taxes | $1,303 | $16 |
Property Value by Mortgage Status in Indian River Estates

| Property Value | Without Mortgage | With Mortgage |
| Less than $50,000 | 32 (2.5%) | 23 (1.8%) |
| $50,000 to $99,999 | 181 (14.4%) | 10 (0.8%) |
| $100,000 to $299,999 | 787 (62.6%) | 937 (73.3%) |
| $300,000 to $499,999 | 181 (14.4%) | 244 (19.1%) |
| $500,000 to $749,999 | 76 (6.0%) | 64 (5.0%) |
| $750,000 to $999,999 | 0 (0.0%) | 0 (0.0%) |
| $1,000,000 or more | 0 (0.0%) | 0 (0.0%) |
| Total | 1,257 (100.0%) | 1,278 (100.0%) |
Household Income by Mortgage Status in Indian River Estates
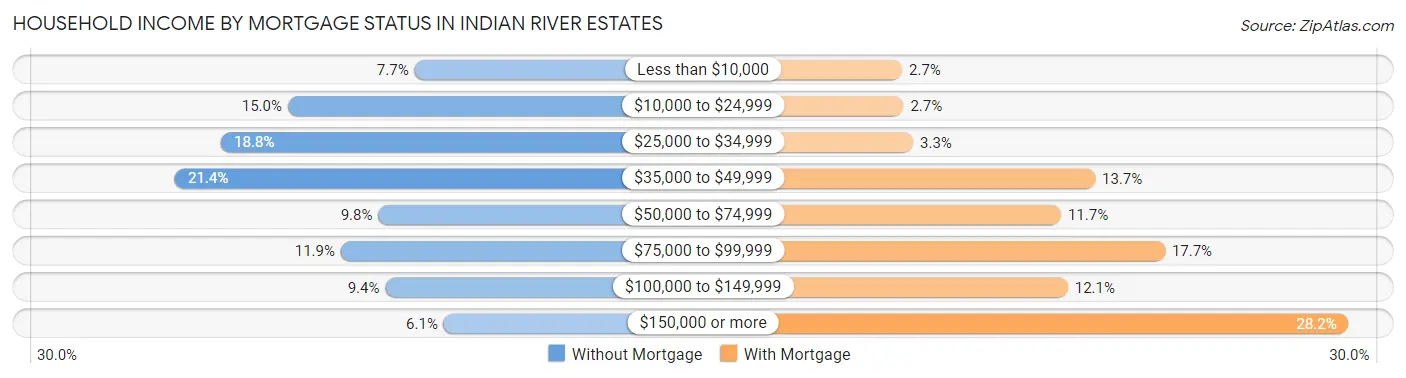
| Household Income | Without Mortgage | With Mortgage |
| Less than $10,000 | 97 (7.7%) | 34 (2.7%) |
| $10,000 to $24,999 | 188 (15.0%) | 35 (2.7%) |
| $25,000 to $34,999 | 236 (18.8%) | 42 (3.3%) |
| $35,000 to $49,999 | 269 (21.4%) | 175 (13.7%) |
| $50,000 to $74,999 | 123 (9.8%) | 150 (11.7%) |
| $75,000 to $99,999 | 150 (11.9%) | 226 (17.7%) |
| $100,000 to $149,999 | 118 (9.4%) | 155 (12.1%) |
| $150,000 or more | 76 (6.0%) | 360 (28.2%) |
| Total | 1,257 (100.0%) | 1,278 (100.0%) |
Property Value to Household Income Ratio in Indian River Estates
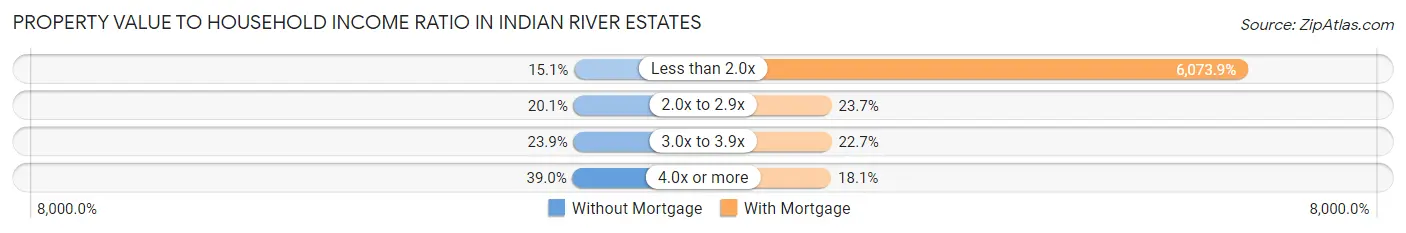
| Value-to-Income Ratio | Without Mortgage | With Mortgage |
| Less than 2.0x | 190 (15.1%) | 77,625 (6,073.9%) |
| 2.0x to 2.9x | 252 (20.1%) | 303 (23.7%) |
| 3.0x to 3.9x | 300 (23.9%) | 290 (22.7%) |
| 4.0x or more | 490 (39.0%) | 231 (18.1%) |
| Total | 1,257 (100.0%) | 1,278 (100.0%) |
Real Estate Taxes by Mortgage Status in Indian River Estates

| Property Taxes | Without Mortgage | With Mortgage |
| Less than $800 | 307 (24.4%) | 0 (0.0%) |
| $800 to $1,499 | 381 (30.3%) | 82 (6.4%) |
| $800 to $1,499 | 514 (40.9%) | 174 (13.6%) |
| Total | 1,257 (100.0%) | 1,278 (100.0%) |
Health & Disability in Indian River Estates
Health Insurance Coverage by Age in Indian River Estates
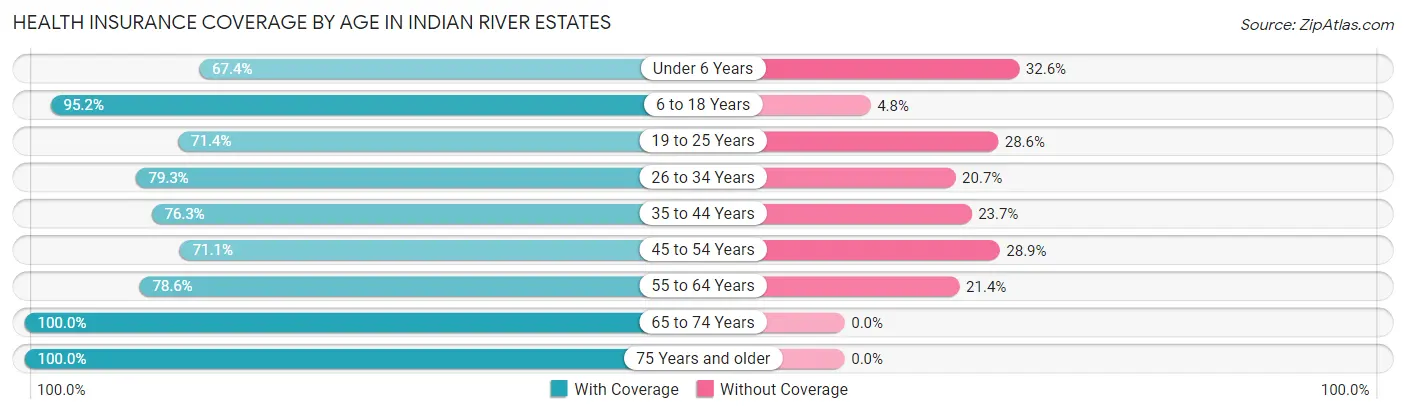
| Age Bracket | With Coverage | Without Coverage |
| Under 6 Years | 58 (67.4%) | 28 (32.6%) |
| 6 to 18 Years | 1,436 (95.2%) | 73 (4.8%) |
| 19 to 25 Years | 379 (71.4%) | 152 (28.6%) |
| 26 to 34 Years | 518 (79.3%) | 135 (20.7%) |
| 35 to 44 Years | 371 (76.3%) | 115 (23.7%) |
| 45 to 54 Years | 693 (71.1%) | 282 (28.9%) |
| 55 to 64 Years | 741 (78.6%) | 202 (21.4%) |
| 65 to 74 Years | 947 (100.0%) | 0 (0.0%) |
| 75 Years and older | 835 (100.0%) | 0 (0.0%) |
| Total | 5,978 (85.8%) | 987 (14.2%) |
Health Insurance Coverage by Citizenship Status in Indian River Estates
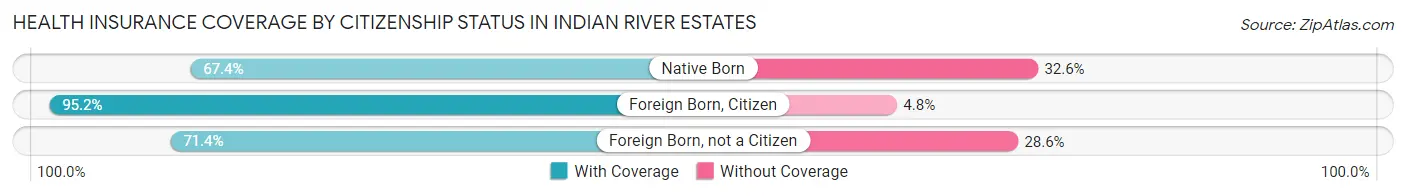
| Citizenship Status | With Coverage | Without Coverage |
| Native Born | 58 (67.4%) | 28 (32.6%) |
| Foreign Born, Citizen | 1,436 (95.2%) | 73 (4.8%) |
| Foreign Born, not a Citizen | 379 (71.4%) | 152 (28.6%) |
Health Insurance Coverage by Household Income in Indian River Estates

| Household Income | With Coverage | Without Coverage |
| Under $25,000 | 900 (89.3%) | 108 (10.7%) |
| $25,000 to $49,999 | 1,988 (86.3%) | 316 (13.7%) |
| $50,000 to $74,999 | 597 (89.4%) | 71 (10.6%) |
| $75,000 to $99,999 | 614 (78.2%) | 171 (21.8%) |
| $100,000 and over | 1,870 (85.5%) | 318 (14.5%) |
Public vs Private Health Insurance Coverage by Age in Indian River Estates
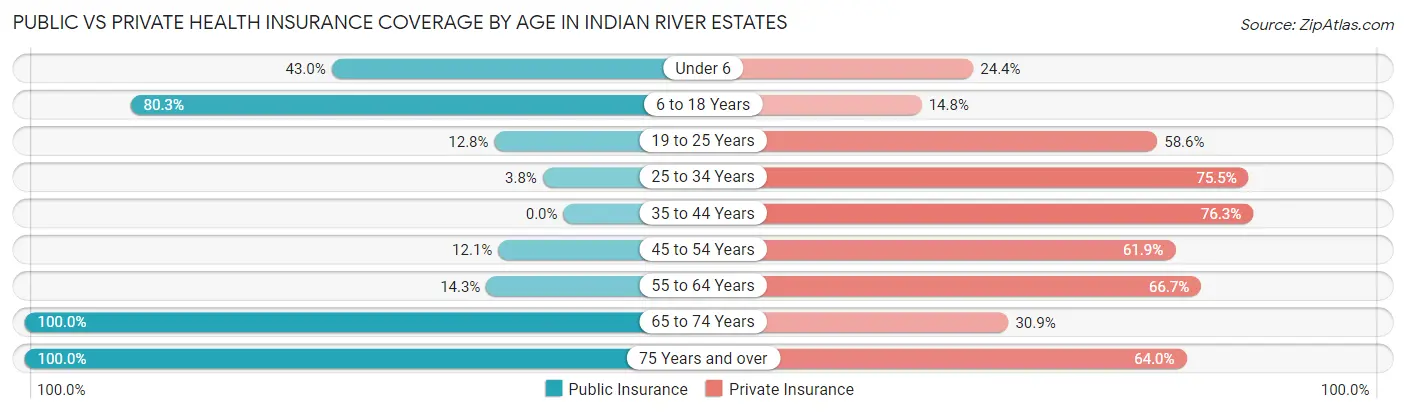
| Age Bracket | Public Insurance | Private Insurance |
| Under 6 | 37 (43.0%) | 21 (24.4%) |
| 6 to 18 Years | 1,212 (80.3%) | 224 (14.8%) |
| 19 to 25 Years | 68 (12.8%) | 311 (58.6%) |
| 25 to 34 Years | 25 (3.8%) | 493 (75.5%) |
| 35 to 44 Years | 0 (0.0%) | 371 (76.3%) |
| 45 to 54 Years | 118 (12.1%) | 603 (61.9%) |
| 55 to 64 Years | 135 (14.3%) | 629 (66.7%) |
| 65 to 74 Years | 947 (100.0%) | 293 (30.9%) |
| 75 Years and over | 835 (100.0%) | 534 (63.9%) |
| Total | 3,377 (48.5%) | 3,479 (49.9%) |
Disability Status by Sex by Age in Indian River Estates
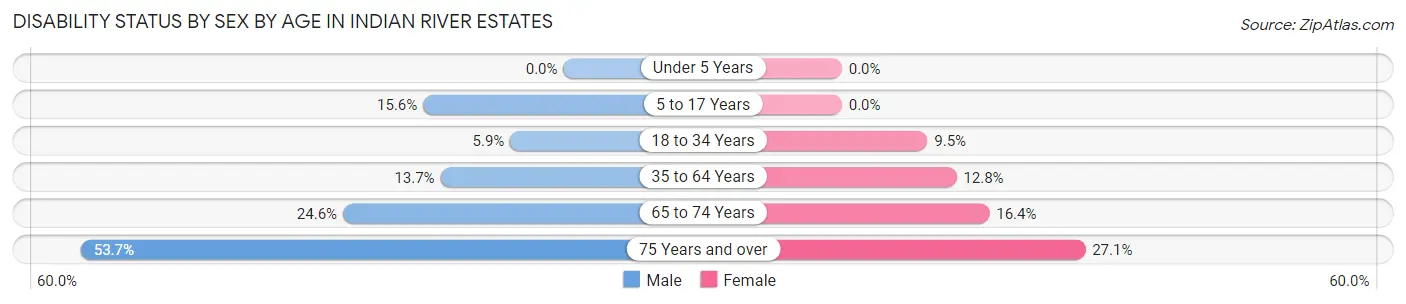
| Age Bracket | Male | Female |
| Under 5 Years | 0 (0.0%) | 0 (0.0%) |
| 5 to 17 Years | 104 (15.6%) | 0 (0.0%) |
| 18 to 34 Years | 38 (5.9%) | 77 (9.5%) |
| 35 to 64 Years | 148 (13.7%) | 169 (12.8%) |
| 65 to 74 Years | 110 (24.5%) | 82 (16.4%) |
| 75 Years and over | 201 (53.7%) | 125 (27.1%) |
Disability Class by Sex by Age in Indian River Estates
Disability Class: Hearing Difficulty
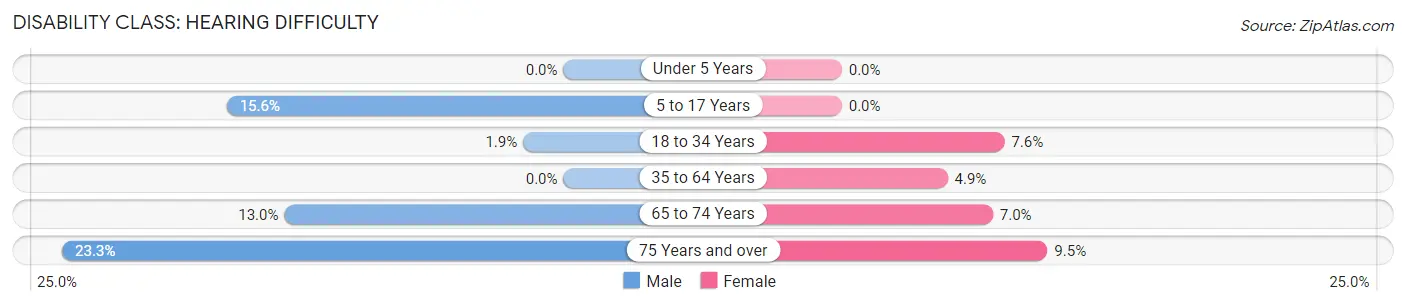
| Age Bracket | Male | Female |
| Under 5 Years | 0 (0.0%) | 0 (0.0%) |
| 5 to 17 Years | 104 (15.6%) | 0 (0.0%) |
| 18 to 34 Years | 12 (1.9%) | 61 (7.5%) |
| 35 to 64 Years | 0 (0.0%) | 65 (4.9%) |
| 65 to 74 Years | 58 (13.0%) | 35 (7.0%) |
| 75 Years and over | 87 (23.3%) | 44 (9.5%) |
Disability Class: Vision Difficulty
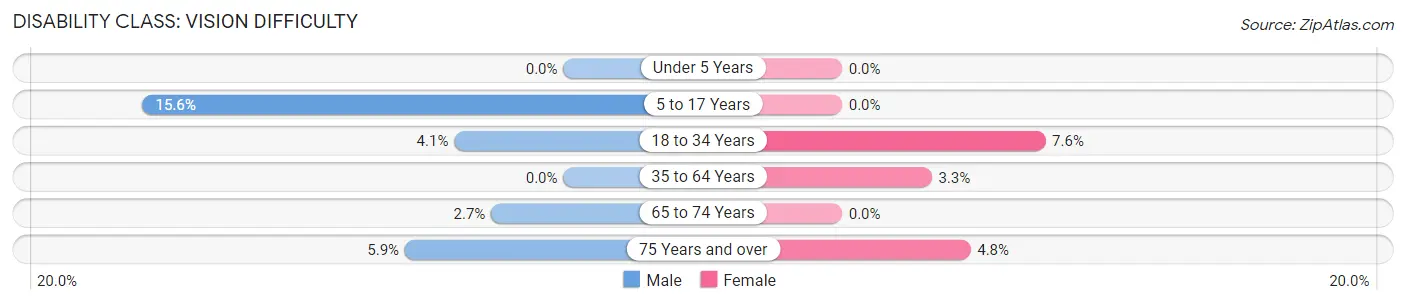
| Age Bracket | Male | Female |
| Under 5 Years | 0 (0.0%) | 0 (0.0%) |
| 5 to 17 Years | 104 (15.6%) | 0 (0.0%) |
| 18 to 34 Years | 26 (4.1%) | 61 (7.5%) |
| 35 to 64 Years | 0 (0.0%) | 44 (3.3%) |
| 65 to 74 Years | 12 (2.7%) | 0 (0.0%) |
| 75 Years and over | 22 (5.9%) | 22 (4.8%) |
Disability Class: Cognitive Difficulty
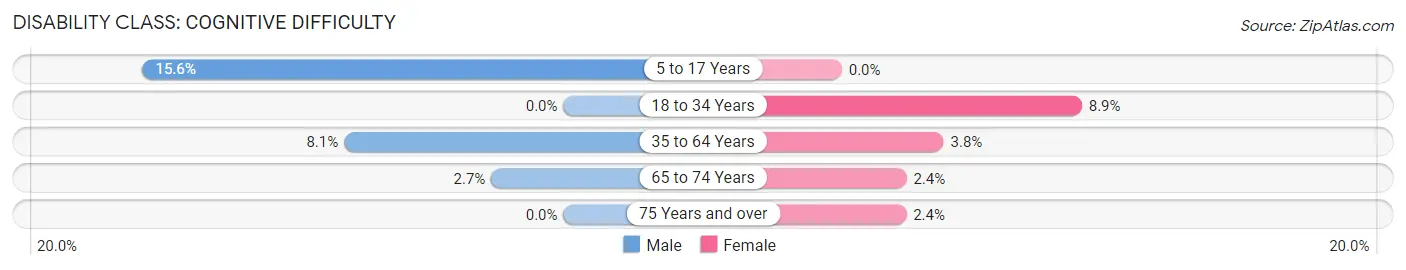
| Age Bracket | Male | Female |
| 5 to 17 Years | 104 (15.6%) | 0 (0.0%) |
| 18 to 34 Years | 0 (0.0%) | 72 (8.9%) |
| 35 to 64 Years | 88 (8.1%) | 50 (3.8%) |
| 65 to 74 Years | 12 (2.7%) | 12 (2.4%) |
| 75 Years and over | 0 (0.0%) | 11 (2.4%) |
Disability Class: Ambulatory Difficulty
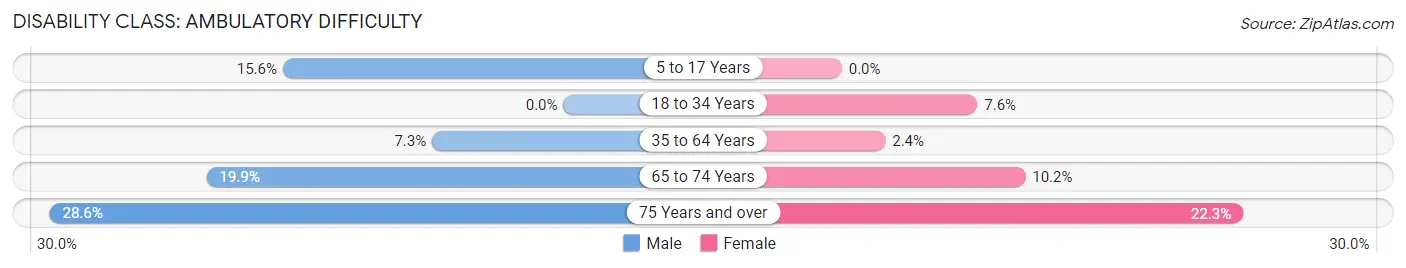
| Age Bracket | Male | Female |
| 5 to 17 Years | 104 (15.6%) | 0 (0.0%) |
| 18 to 34 Years | 0 (0.0%) | 61 (7.5%) |
| 35 to 64 Years | 79 (7.3%) | 32 (2.4%) |
| 65 to 74 Years | 89 (19.9%) | 51 (10.2%) |
| 75 Years and over | 107 (28.6%) | 103 (22.3%) |
Disability Class: Self-Care Difficulty
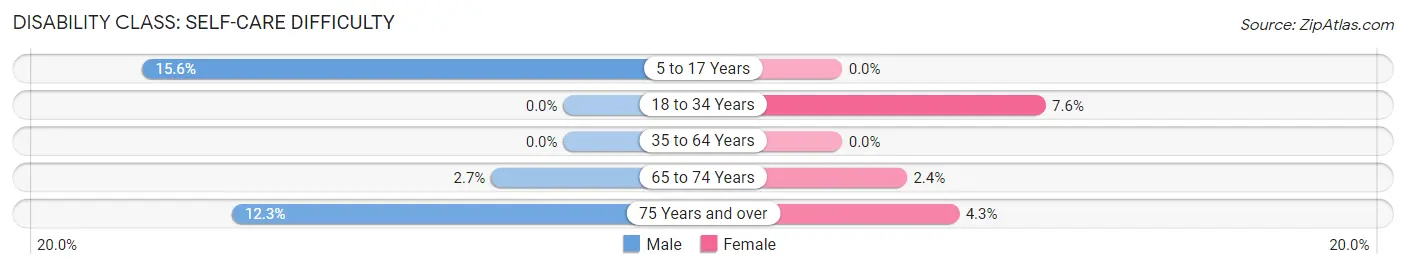
| Age Bracket | Male | Female |
| 5 to 17 Years | 104 (15.6%) | 0 (0.0%) |
| 18 to 34 Years | 0 (0.0%) | 61 (7.5%) |
| 35 to 64 Years | 0 (0.0%) | 0 (0.0%) |
| 65 to 74 Years | 12 (2.7%) | 12 (2.4%) |
| 75 Years and over | 46 (12.3%) | 20 (4.3%) |
Technology Access in Indian River Estates
Computing Device Access in Indian River Estates
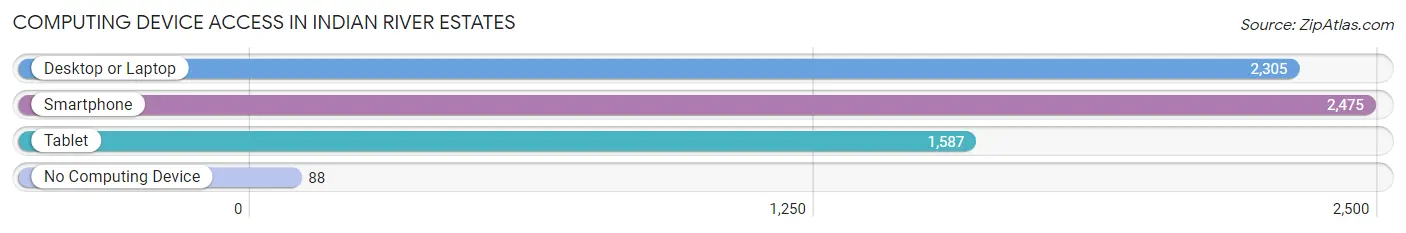
| Device Type | # Households | % Households |
| Desktop or Laptop | 2,305 | 80.7% |
| Smartphone | 2,475 | 86.7% |
| Tablet | 1,587 | 55.6% |
| No Computing Device | 88 | 3.1% |
| Total | 2,855 | 100.0% |
Internet Access in Indian River Estates
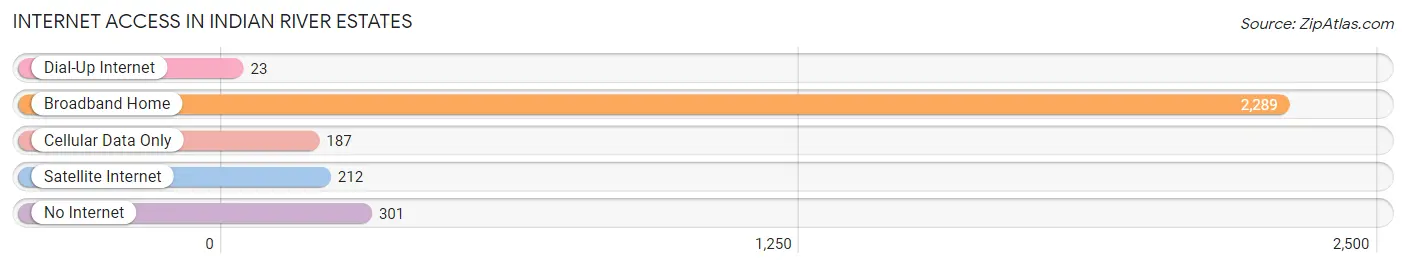
| Internet Type | # Households | % Households |
| Dial-Up Internet | 23 | 0.8% |
| Broadband Home | 2,289 | 80.2% |
| Cellular Data Only | 187 | 6.6% |
| Satellite Internet | 212 | 7.4% |
| No Internet | 301 | 10.5% |
| Total | 2,855 | 100.0% |
Indian River Estates Summary
Introduction
Indian River Estates is a census-designated place (CDP) located in Indian River County, Florida. It is located on the east coast of Florida, just south of the city of Vero Beach. The population of Indian River Estates was 5,845 at the 2010 census. The CDP is part of the Sebastian-Vero Beach Metropolitan Statistical Area.
History
The area that is now Indian River Estates was originally inhabited by the Ais Indians, who were part of the Seminole tribe. The Ais Indians lived in the area for centuries before the arrival of European settlers in the late 1700s. The area was first settled by William and Mary Osceola, who established a homestead in the area in 1820.
The area was originally known as Osceola, but the name was changed to Indian River Estates in the 1950s. The name was chosen to reflect the area’s history and its proximity to the Indian River.
Geography
Indian River Estates is located at 27°41'N 80°25'W (27.6833, -80.4167). It is bordered to the north by Vero Beach, to the east by the Indian River, to the south by the St. Lucie County line, and to the west by the Sebastian River.
The CDP has a total area of 4.2 square miles, of which 4.1 square miles is land and 0.1 square miles is water.
Economy
The economy of Indian River Estates is largely based on tourism and agriculture. The area is home to several tourist attractions, including the Indian River Lagoon, the Sebastian Inlet State Park, and the Pelican Island National Wildlife Refuge.
Agriculture is also an important part of the local economy. The area is home to several citrus groves, as well as vegetable and flower farms.
Demographics
As of the 2010 census, there were 5,845 people, 2,541 households, and 1,717 families residing in the CDP. The population density was 1,417.3 people per square mile. The racial makeup of the CDP was 94.2% White, 2.2% African American, 0.4% Native American, 0.7% Asian, 0.1% Pacific Islander, 1.2% from other races, and 1.2% from two or more races. Hispanic or Latino of any race were 4.3% of the population.
The median income for a household in the CDP was $41,944, and the median income for a family was $50,938. Males had a median income of $35,938 versus $27,917 for females. The per capita income for the CDP was $20,945. About 8.2% of families and 10.2% of the population were below the poverty line, including 14.2% of those under age 18 and 6.2% of those age 65 or over.
Conclusion
Indian River Estates is a census-designated place located in Indian River County, Florida. It is located on the east coast of Florida, just south of the city of Vero Beach. The population of Indian River Estates was 5,845 at the 2010 census. The CDP is part of the Sebastian-Vero Beach Metropolitan Statistical Area. The area was originally inhabited by the Ais Indians, who were part of the Seminole tribe. The economy of Indian River Estates is largely based on tourism and agriculture. The population of the CDP is predominantly white, with a small percentage of African American, Native American, Asian, and Pacific Islander residents. The median income for a household in the CDP was $41,944, and the median income for a family was $50,938.
Common Questions
What is the Total Population of Indian River Estates?
Total Population of Indian River Estates is 6,965.
What is the Total Male Population of Indian River Estates?
Total Male Population of Indian River Estates is 3,220.
What is the Total Female Population of Indian River Estates?
Total Female Population of Indian River Estates is 3,745.
What is the Ratio of Males per 100 Females in Indian River Estates?
There are 85.98 Males per 100 Females in Indian River Estates.
What is the Ratio of Females per 100 Males in Indian River Estates?
There are 116.30 Females per 100 Males in Indian River Estates.
What is the Median Population Age in Indian River Estates?
Median Population Age in Indian River Estates is 49.4 Years.
What is the Average Family Size in Indian River Estates
Average Family Size in Indian River Estates is 3.2 People.
What is the Average Household Size in Indian River Estates
Average Household Size in Indian River Estates is 2.4 People.
What is Per Capita Income in Indian River Estates?
Per Capita income in Indian River Estates is $28,591.
What is the Median Family Income in Indian River Estates?
Median Family Income in Indian River Estates is $72,303.
What is the Median Household income in Indian River Estates?
Median Household Income in Indian River Estates is $47,023.
What is Income or Wage Gap in Indian River Estates?
Income or Wage Gap in Indian River Estates is 29.0%.
Women in Indian River Estates earn 71.0 cents for every dollar earned by a man.
What is Inequality or Gini Index in Indian River Estates?
Inequality or Gini Index in Indian River Estates is 0.43.
How Large is the Labor Force in Indian River Estates?
There are 3,061 People in the Labor Forcein in Indian River Estates.
What is the Percentage of People in the Labor Force in Indian River Estates?
54.2% of People are in the Labor Force in Indian River Estates.
What is the Unemployment Rate in Indian River Estates?
Unemployment Rate in Indian River Estates is 4.7%.