Westgate, FL
Westgate Map
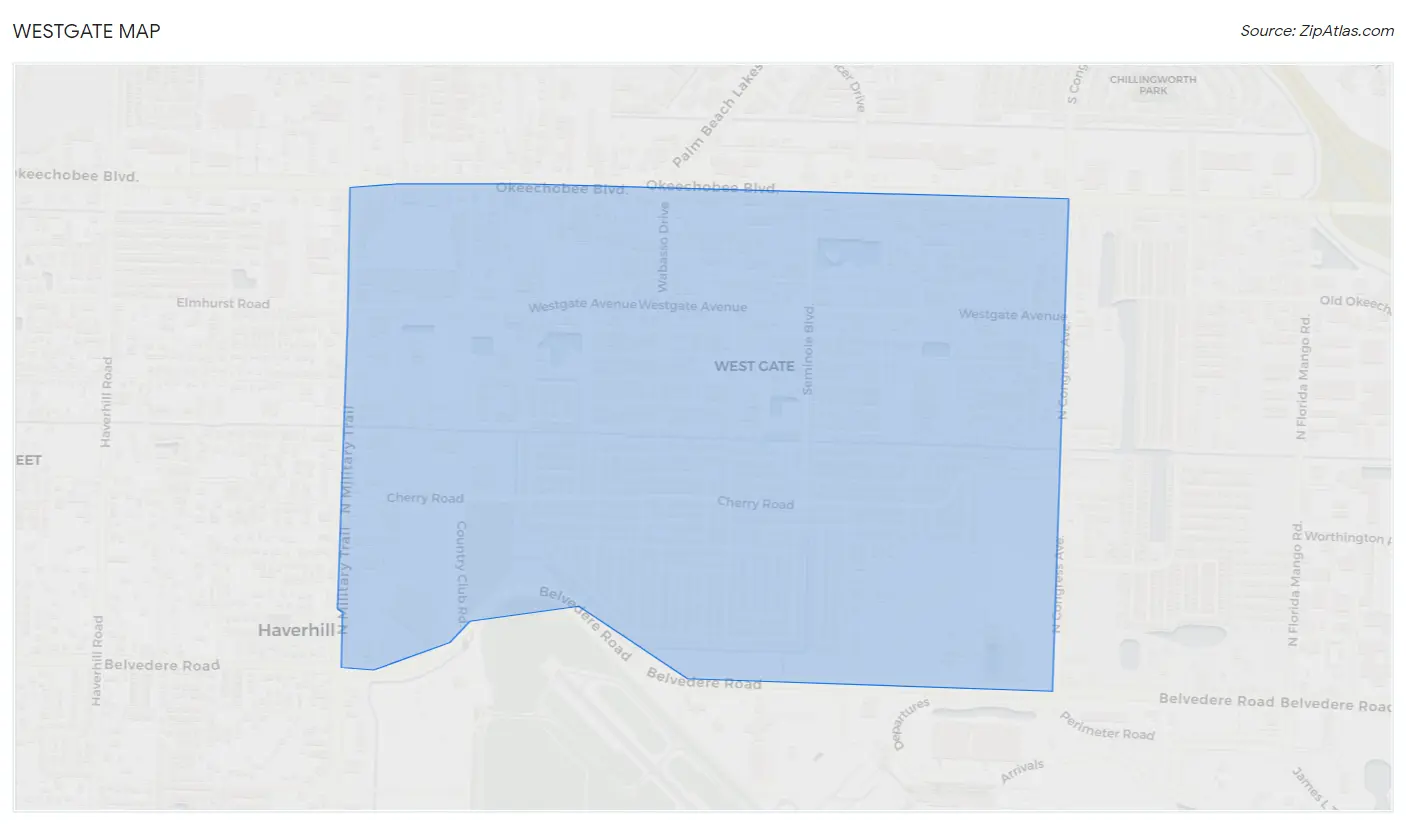
Westgate Overview
8,340
TOTAL POPULATION
4,392
MALE POPULATION
3,948
FEMALE POPULATION
111.25
MALES / 100 FEMALES
89.89
FEMALES / 100 MALES
30.6
MEDIAN AGE
4.0
AVG FAMILY SIZE
3.6
AVG HOUSEHOLD SIZE
$16,354
PER CAPITA INCOME
$44,190
AVG FAMILY INCOME
$42,449
AVG HOUSEHOLD INCOME
8.4%
WAGE / INCOME GAP [ % ]
91.6¢/ $1
WAGE / INCOME GAP [ $ ]
$9,282
FAMILY INCOME DEFICIT
0.38
INEQUALITY / GINI INDEX
4,533
LABOR FORCE [ PEOPLE ]
74.5%
PERCENT IN LABOR FORCE
8.6%
UNEMPLOYMENT RATE
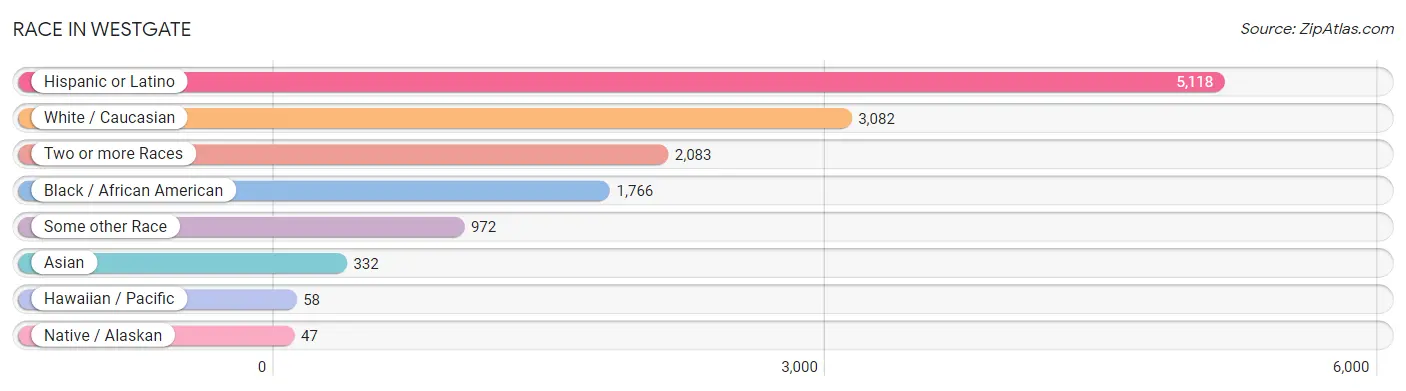
Race in Westgate
The most populous races in Westgate are Hispanic or Latino (5,118 | 61.4%), White / Caucasian (3,082 | 36.9%), and Two or more Races (2,083 | 25.0%).
| Race | # Population | % Population |
| Asian | 332 | 4.0% |
| Black / African American | 1,766 | 21.2% |
| Hawaiian / Pacific | 58 | 0.7% |
| Hispanic or Latino | 5,118 | 61.4% |
| Native / Alaskan | 47 | 0.6% |
| White / Caucasian | 3,082 | 36.9% |
| Two or more Races | 2,083 | 25.0% |
| Some other Race | 972 | 11.7% |
| Total | 8,340 | 100.0% |
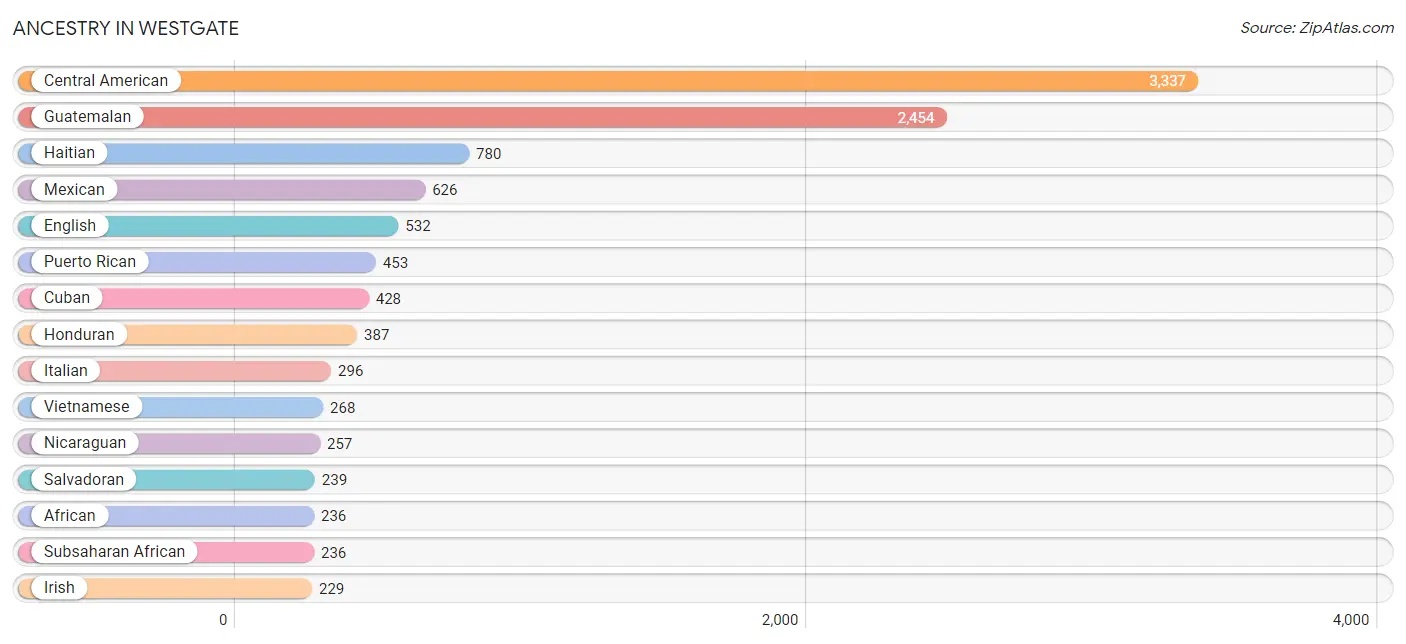
Ancestry in Westgate
The most populous ancestries reported in Westgate are Central American (3,337 | 40.0%), Guatemalan (2,454 | 29.4%), Haitian (780 | 9.3%), Mexican (626 | 7.5%), and English (532 | 6.4%), together accounting for 92.7% of all Westgate residents.
| Ancestry | # Population | % Population |
| African | 236 | 2.8% |
| American | 207 | 2.5% |
| Bahamian | 173 | 2.1% |
| Blackfeet | 44 | 0.5% |
| British | 7 | 0.1% |
| Central American | 3,337 | 40.0% |
| Central American Indian | 47 | 0.6% |
| Colombian | 60 | 0.7% |
| Cuban | 428 | 5.1% |
| Dominican | 128 | 1.5% |
| Dutch | 43 | 0.5% |
| Ecuadorian | 10 | 0.1% |
| English | 532 | 6.4% |
| French | 106 | 1.3% |
| French Canadian | 16 | 0.2% |
| German | 220 | 2.6% |
| Greek | 19 | 0.2% |
| Guamanian / Chamorro | 193 | 2.3% |
| Guatemalan | 2,454 | 29.4% |
| Haitian | 780 | 9.3% |
| Honduran | 387 | 4.6% |
| Indian (Asian) | 9 | 0.1% |
| Irish | 229 | 2.8% |
| Italian | 296 | 3.5% |
| Jamaican | 74 | 0.9% |
| Lithuanian | 11 | 0.1% |
| Mexican | 626 | 7.5% |
| Nicaraguan | 257 | 3.1% |
| Peruvian | 14 | 0.2% |
| Polish | 19 | 0.2% |
| Puerto Rican | 453 | 5.4% |
| Salvadoran | 239 | 2.9% |
| Scandinavian | 8 | 0.1% |
| Scotch-Irish | 40 | 0.5% |
| South American | 84 | 1.0% |
| Sri Lankan | 30 | 0.4% |
| Subsaharan African | 236 | 2.8% |
| Thai | 45 | 0.5% |
| Vietnamese | 268 | 3.2% | View All 39 Rows |
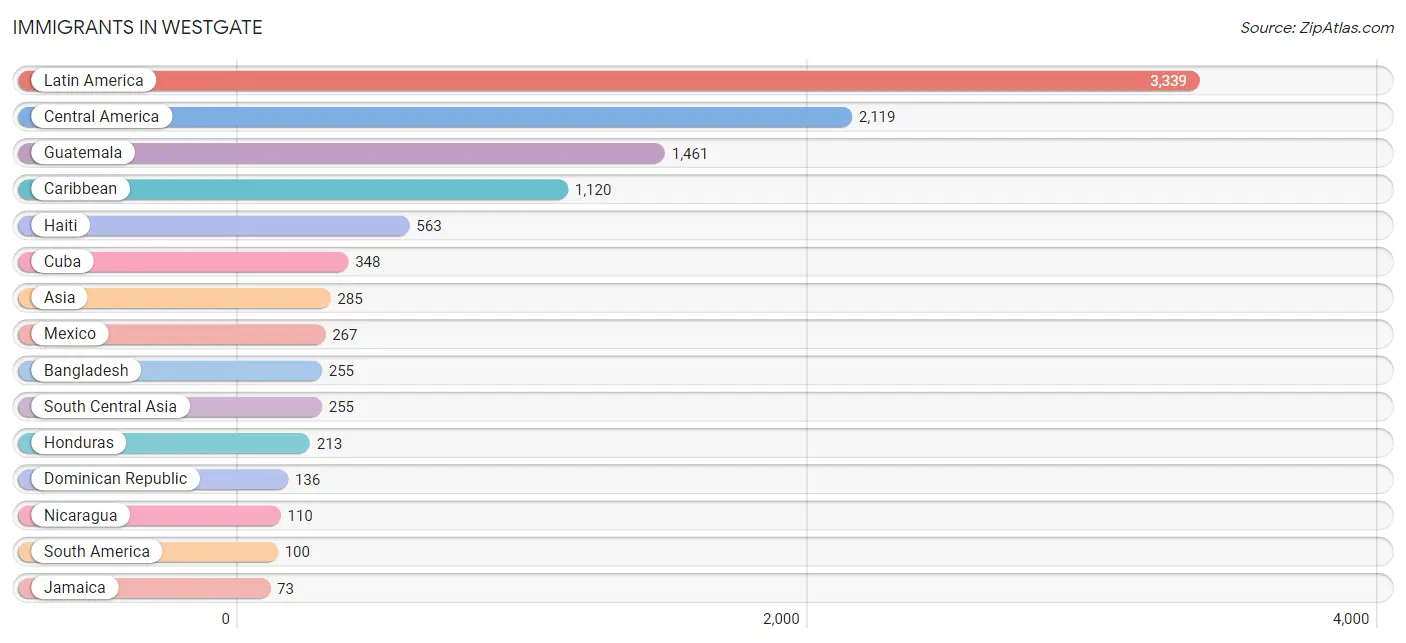
Immigrants in Westgate
The most numerous immigrant groups reported in Westgate came from Latin America (3,339 | 40.0%), Central America (2,119 | 25.4%), Guatemala (1,461 | 17.5%), Caribbean (1,120 | 13.4%), and Haiti (563 | 6.8%), together accounting for 103.1% of all Westgate residents.
| Immigration Origin | # Population | % Population |
| Asia | 285 | 3.4% |
| Bangladesh | 255 | 3.1% |
| Brazil | 31 | 0.4% |
| Canada | 6 | 0.1% |
| Caribbean | 1,120 | 13.4% |
| Central America | 2,119 | 25.4% |
| Colombia | 60 | 0.7% |
| Cuba | 348 | 4.2% |
| Dominican Republic | 136 | 1.6% |
| El Salvador | 68 | 0.8% |
| Guatemala | 1,461 | 17.5% |
| Haiti | 563 | 6.8% |
| Honduras | 213 | 2.5% |
| Jamaica | 73 | 0.9% |
| Latin America | 3,339 | 40.0% |
| Mexico | 267 | 3.2% |
| Nicaragua | 110 | 1.3% |
| Peru | 9 | 0.1% |
| South America | 100 | 1.2% |
| South Central Asia | 255 | 3.1% |
| South Eastern Asia | 30 | 0.4% |
| Vietnam | 30 | 0.4% | View All 22 Rows |
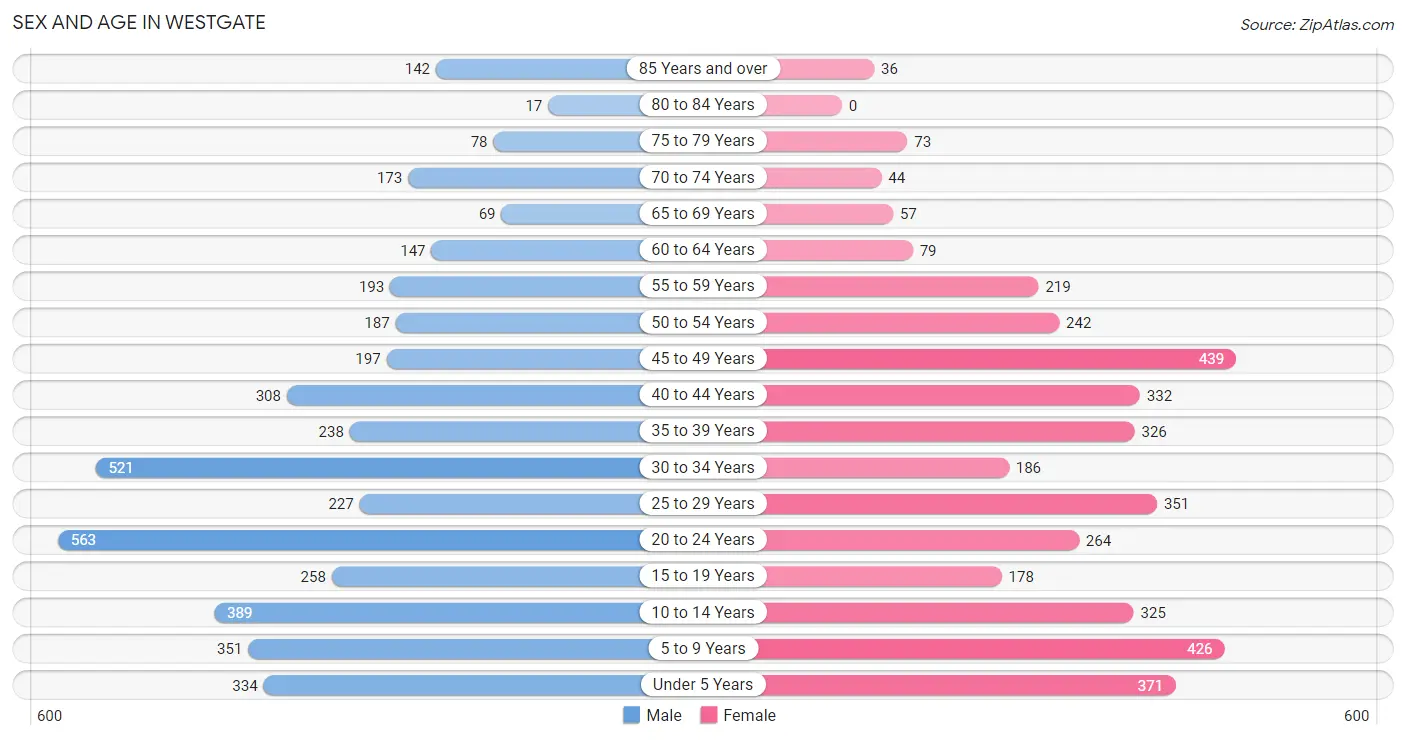
Sex and Age in Westgate
Sex and Age in Westgate
The most populous age groups in Westgate are 20 to 24 Years (563 | 12.8%) for men and 45 to 49 Years (439 | 11.1%) for women.
| Age Bracket | Male | Female |
| Under 5 Years | 334 (7.6%) | 371 (9.4%) |
| 5 to 9 Years | 351 (8.0%) | 426 (10.8%) |
| 10 to 14 Years | 389 (8.9%) | 325 (8.2%) |
| 15 to 19 Years | 258 (5.9%) | 178 (4.5%) |
| 20 to 24 Years | 563 (12.8%) | 264 (6.7%) |
| 25 to 29 Years | 227 (5.2%) | 351 (8.9%) |
| 30 to 34 Years | 521 (11.9%) | 186 (4.7%) |
| 35 to 39 Years | 238 (5.4%) | 326 (8.3%) |
| 40 to 44 Years | 308 (7.0%) | 332 (8.4%) |
| 45 to 49 Years | 197 (4.5%) | 439 (11.1%) |
| 50 to 54 Years | 187 (4.3%) | 242 (6.1%) |
| 55 to 59 Years | 193 (4.4%) | 219 (5.6%) |
| 60 to 64 Years | 147 (3.4%) | 79 (2.0%) |
| 65 to 69 Years | 69 (1.6%) | 57 (1.4%) |
| 70 to 74 Years | 173 (3.9%) | 44 (1.1%) |
| 75 to 79 Years | 78 (1.8%) | 73 (1.8%) |
| 80 to 84 Years | 17 (0.4%) | 0 (0.0%) |
| 85 Years and over | 142 (3.2%) | 36 (0.9%) |
| Total | 4,392 (100.0%) | 3,948 (100.0%) |
Families and Households in Westgate
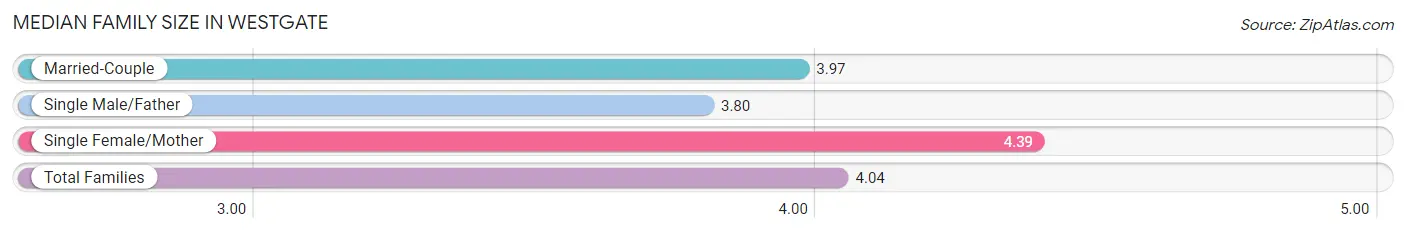
Median Family Size in Westgate
The median family size in Westgate is 4.04 persons per family, with single female/mother families (534 | 30.4%) accounting for the largest median family size of 4.39 persons per family. On the other hand, single male/father families (538 | 30.6%) represent the smallest median family size with 3.80 persons per family.
| Family Type | # Families | Family Size |
| Married-Couple | 685 (39.0%) | 3.97 |
| Single Male/Father | 538 (30.6%) | 3.80 |
| Single Female/Mother | 534 (30.4%) | 4.39 |
| Total Families | 1,757 (100.0%) | 4.04 |
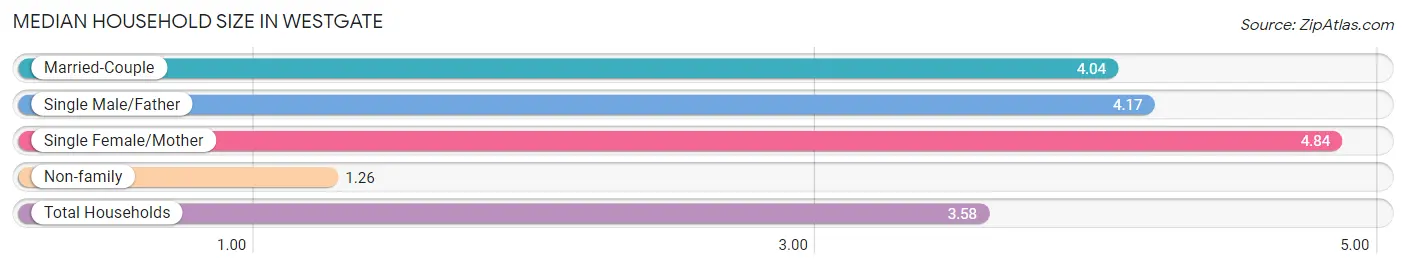
Median Household Size in Westgate
The median household size in Westgate is 3.58 persons per household, with single female/mother households (534 | 23.0%) accounting for the largest median household size of 4.84 persons per household. non-family households (564 | 24.3%) represent the smallest median household size with 1.26 persons per household.
| Household Type | # Households | Household Size |
| Married-Couple | 685 (29.5%) | 4.04 |
| Single Male/Father | 538 (23.2%) | 4.17 |
| Single Female/Mother | 534 (23.0%) | 4.84 |
| Non-family | 564 (24.3%) | 1.26 |
| Total Households | 2,321 (100.0%) | 3.58 |
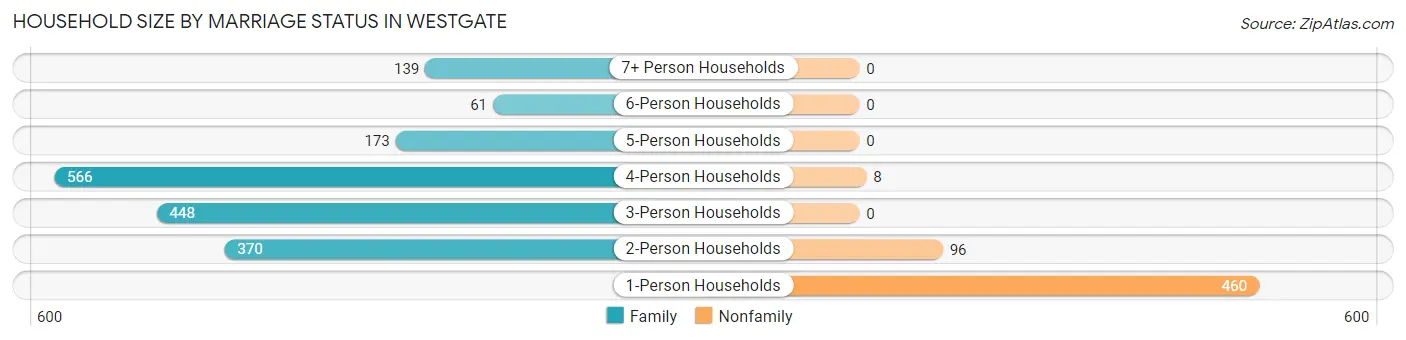
Household Size by Marriage Status in Westgate
Out of a total of 2,321 households in Westgate, 1,757 (75.7%) are family households, while 564 (24.3%) are nonfamily households. The most numerous type of family households are 4-person households, comprising 566, and the most common type of nonfamily households are 1-person households, comprising 460.
| Household Size | Family Households | Nonfamily Households |
| 1-Person Households | - | 460 (19.8%) |
| 2-Person Households | 370 (15.9%) | 96 (4.1%) |
| 3-Person Households | 448 (19.3%) | 0 (0.0%) |
| 4-Person Households | 566 (24.4%) | 8 (0.3%) |
| 5-Person Households | 173 (7.4%) | 0 (0.0%) |
| 6-Person Households | 61 (2.6%) | 0 (0.0%) |
| 7+ Person Households | 139 (6.0%) | 0 (0.0%) |
| Total | 1,757 (75.7%) | 564 (24.3%) |
Female Fertility in Westgate
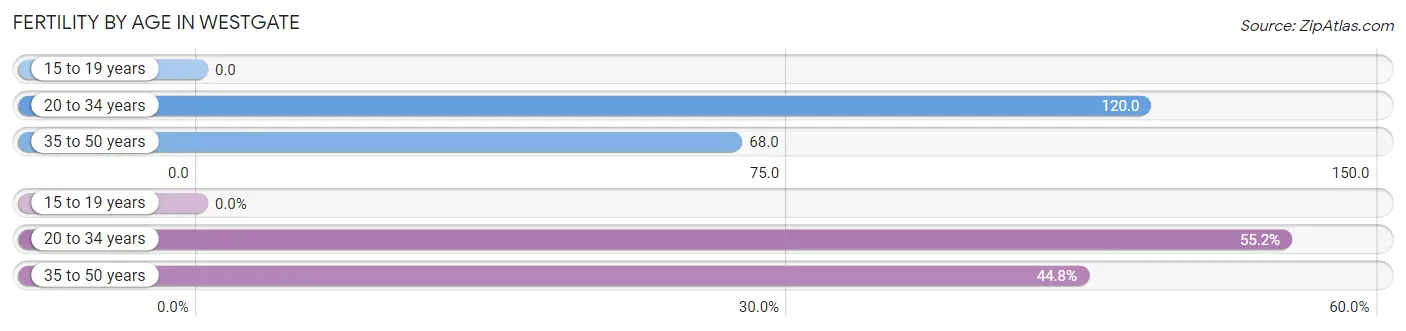
Fertility by Age in Westgate
Average fertility rate in Westgate is 82.0 births per 1,000 women. Women in the age bracket of 20 to 34 years have the highest fertility rate with 120.0 births per 1,000 women. Women in the age bracket of 20 to 34 years acount for 55.2% of all women with births.
| Age Bracket | Women with Births | Births / 1,000 Women |
| 15 to 19 years | 0 (0.0%) | 0.0 |
| 20 to 34 years | 96 (55.2%) | 120.0 |
| 35 to 50 years | 78 (44.8%) | 68.0 |
| Total | 174 (100.0%) | 82.0 |
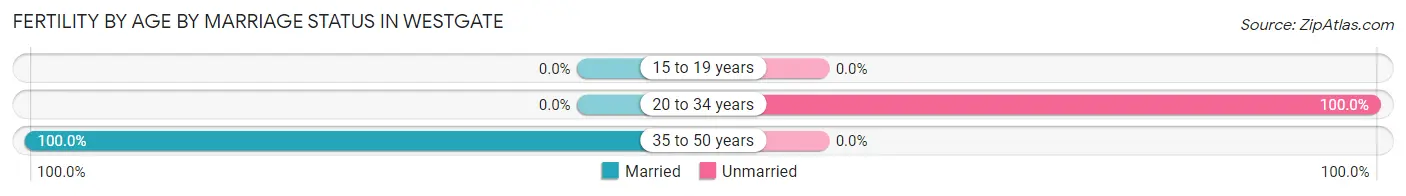
Fertility by Age by Marriage Status in Westgate
44.8% of women with births (174) in Westgate are married. The highest percentage of unmarried women with births falls into 20 to 34 years age bracket with 100.0% of them unmarried at the time of birth, while the lowest percentage of unmarried women with births belong to 35 to 50 years age bracket with 0.0% of them unmarried.
| Age Bracket | Married | Unmarried |
| 15 to 19 years | 0 (0.0%) | 0 (0.0%) |
| 20 to 34 years | 0 (0.0%) | 96 (100.0%) |
| 35 to 50 years | 78 (100.0%) | 0 (0.0%) |
| Total | 78 (44.8%) | 96 (55.2%) |
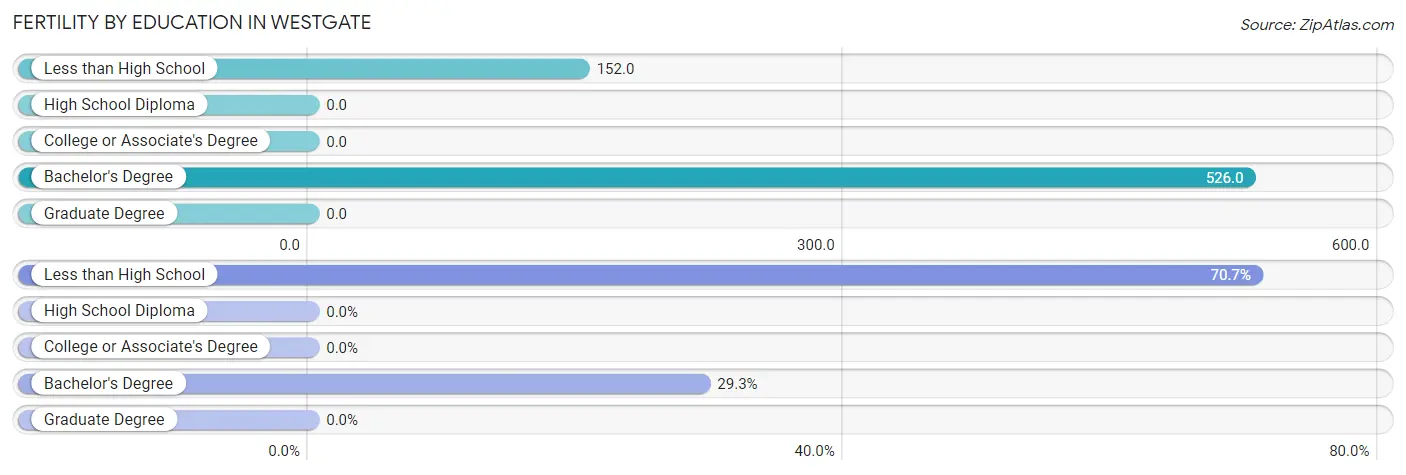
Fertility by Education in Westgate
| Educational Attainment | Women with Births | Births / 1,000 Women |
| Less than High School | 123 (70.7%) | 152.0 |
| High School Diploma | 0 (0.0%) | 0.0 |
| College or Associate's Degree | 0 (0.0%) | 0.0 |
| Bachelor's Degree | 51 (29.3%) | 526.0 |
| Graduate Degree | 0 (0.0%) | 0.0 |
| Total | 174 (100.0%) | 82.0 |
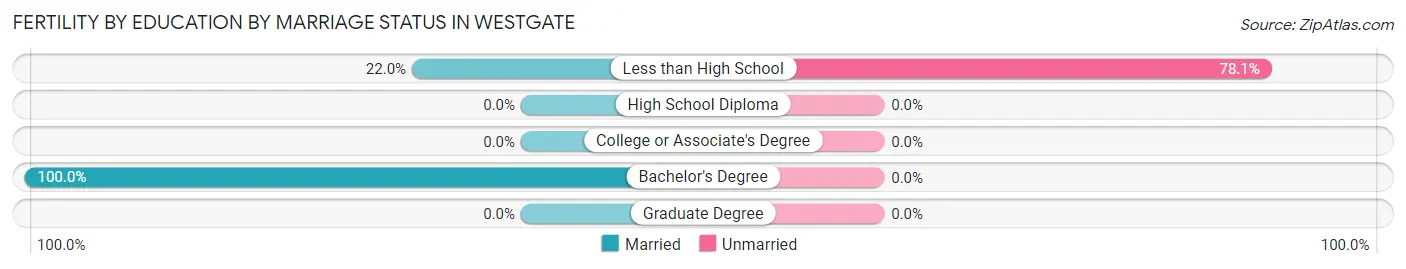
Fertility by Education by Marriage Status in Westgate
55.2% of women with births in Westgate are unmarried. Women with the educational attainment of bachelor's degree are most likely to be married with 100.0% of them married at childbirth, while women with the educational attainment of less than high school are least likely to be married with 78.0% of them unmarried at childbirth.
| Educational Attainment | Married | Unmarried |
| Less than High School | 27 (22.0%) | 96 (78.0%) |
| High School Diploma | 0 (0.0%) | 0 (0.0%) |
| College or Associate's Degree | 0 (0.0%) | 0 (0.0%) |
| Bachelor's Degree | 51 (100.0%) | 0 (0.0%) |
| Graduate Degree | 0 (0.0%) | 0 (0.0%) |
| Total | 78 (44.8%) | 96 (55.2%) |
Income in Westgate
Income Overview in Westgate
Per Capita Income in Westgate is $16,354, while median incomes of families and households are $44,190 and $42,449 respectively.
| Characteristic | Number | Measure |
| Per Capita Income | 8,340 | $16,354 |
| Median Family Income | 1,757 | $44,190 |
| Mean Family Income | 1,757 | $55,665 |
| Median Household Income | 2,321 | $42,449 |
| Mean Household Income | 2,321 | $51,144 |
| Income Deficit | 1,757 | $9,282 |
| Wage / Income Gap (%) | 8,340 | 8.38% |
| Wage / Income Gap ($) | 8,340 | 91.62¢ per $1 |
| Gini / Inequality Index | 8,340 | 0.38 |
Earnings by Sex in Westgate
Average Earnings in Westgate are $24,346, $24,964 for men and $22,871 for women, a difference of 8.4%.
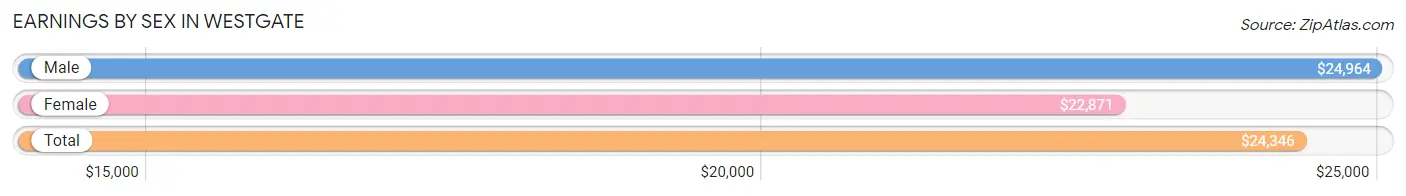
| Sex | Number | Average Earnings |
| Male | 2,569 (58.3%) | $24,964 |
| Female | 1,836 (41.7%) | $22,871 |
| Total | 4,405 (100.0%) | $24,346 |
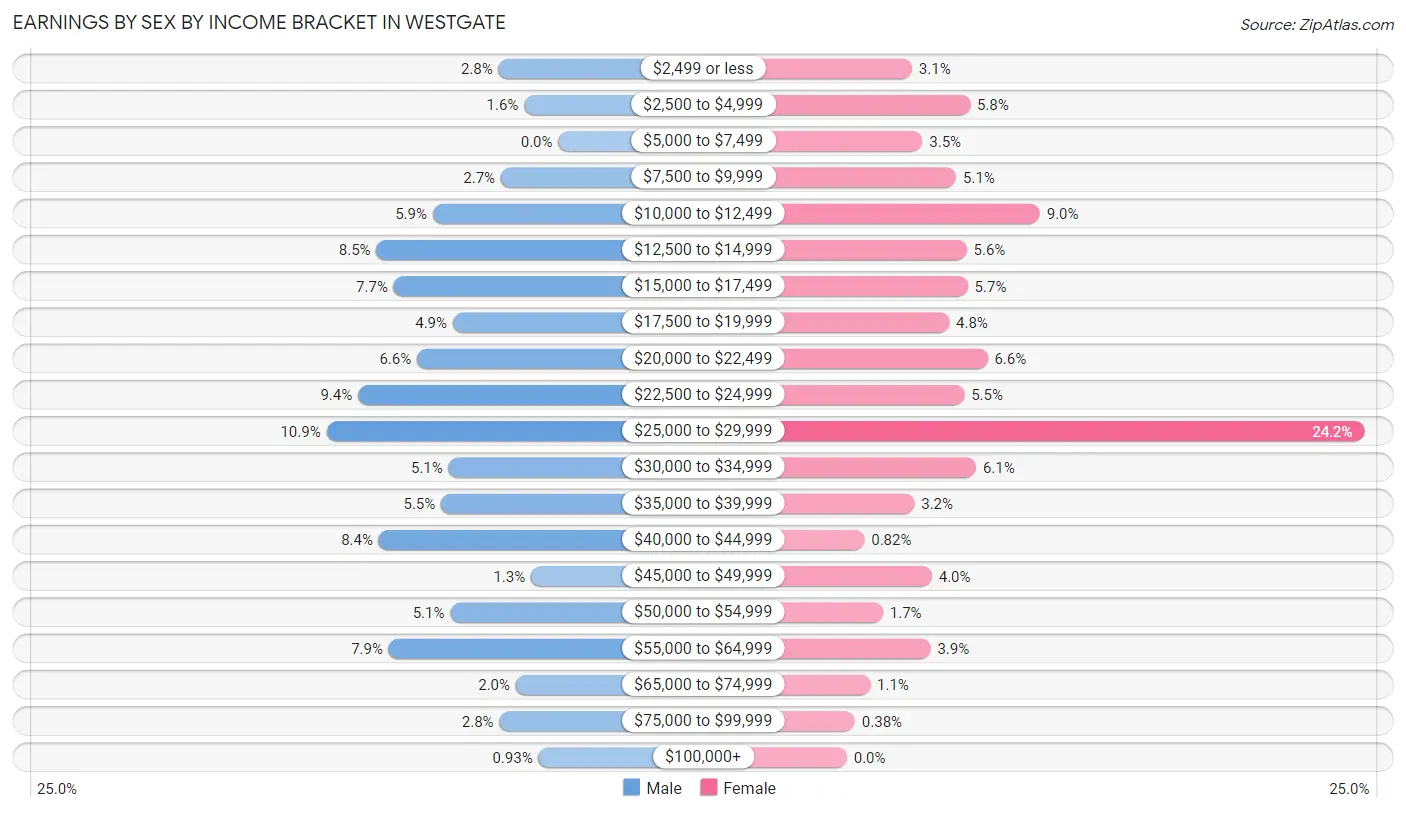
Earnings by Sex by Income Bracket in Westgate
The most common earnings brackets in Westgate are $25,000 to $29,999 for men (279 | 10.9%) and $25,000 to $29,999 for women (445 | 24.2%).
| Income | Male | Female |
| $2,499 or less | 72 (2.8%) | 56 (3.0%) |
| $2,500 to $4,999 | 41 (1.6%) | 106 (5.8%) |
| $5,000 to $7,499 | 0 (0.0%) | 65 (3.5%) |
| $7,500 to $9,999 | 69 (2.7%) | 94 (5.1%) |
| $10,000 to $12,499 | 151 (5.9%) | 166 (9.0%) |
| $12,500 to $14,999 | 219 (8.5%) | 103 (5.6%) |
| $15,000 to $17,499 | 198 (7.7%) | 104 (5.7%) |
| $17,500 to $19,999 | 127 (4.9%) | 88 (4.8%) |
| $20,000 to $22,499 | 170 (6.6%) | 121 (6.6%) |
| $22,500 to $24,999 | 241 (9.4%) | 101 (5.5%) |
| $25,000 to $29,999 | 279 (10.9%) | 445 (24.2%) |
| $30,000 to $34,999 | 132 (5.1%) | 111 (6.0%) |
| $35,000 to $39,999 | 141 (5.5%) | 58 (3.2%) |
| $40,000 to $44,999 | 216 (8.4%) | 15 (0.8%) |
| $45,000 to $49,999 | 33 (1.3%) | 73 (4.0%) |
| $50,000 to $54,999 | 130 (5.1%) | 31 (1.7%) |
| $55,000 to $64,999 | 204 (7.9%) | 72 (3.9%) |
| $65,000 to $74,999 | 51 (2.0%) | 20 (1.1%) |
| $75,000 to $99,999 | 71 (2.8%) | 7 (0.4%) |
| $100,000+ | 24 (0.9%) | 0 (0.0%) |
| Total | 2,569 (100.0%) | 1,836 (100.0%) |
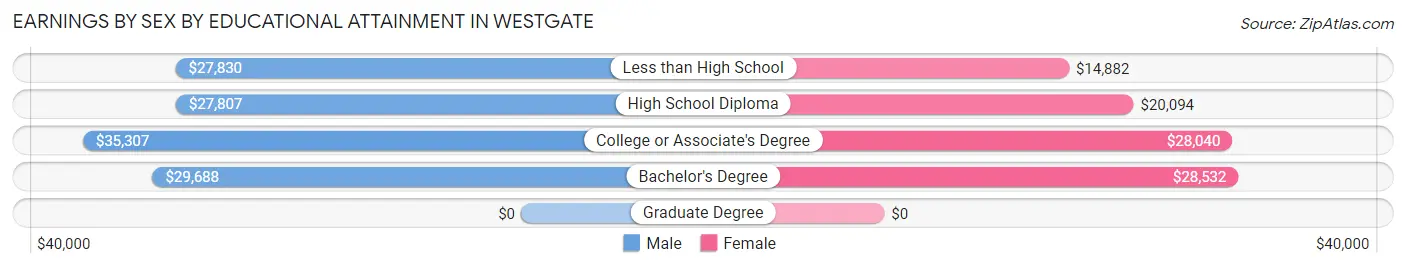
Earnings by Sex by Educational Attainment in Westgate
Average earnings in Westgate are $28,843 for men and $24,022 for women, a difference of 16.7%. Men with an educational attainment of college or associate's degree enjoy the highest average annual earnings of $35,307, while those with high school diploma education earn the least with $27,807. Women with an educational attainment of bachelor's degree earn the most with the average annual earnings of $28,532, while those with less than high school education have the smallest earnings of $14,882.
| Educational Attainment | Male Income | Female Income |
| Less than High School | $27,830 | $14,882 |
| High School Diploma | $27,807 | $20,094 |
| College or Associate's Degree | $35,307 | $28,040 |
| Bachelor's Degree | $29,688 | $28,532 |
| Graduate Degree | - | - |
| Total | $28,843 | $24,022 |
Family Income in Westgate
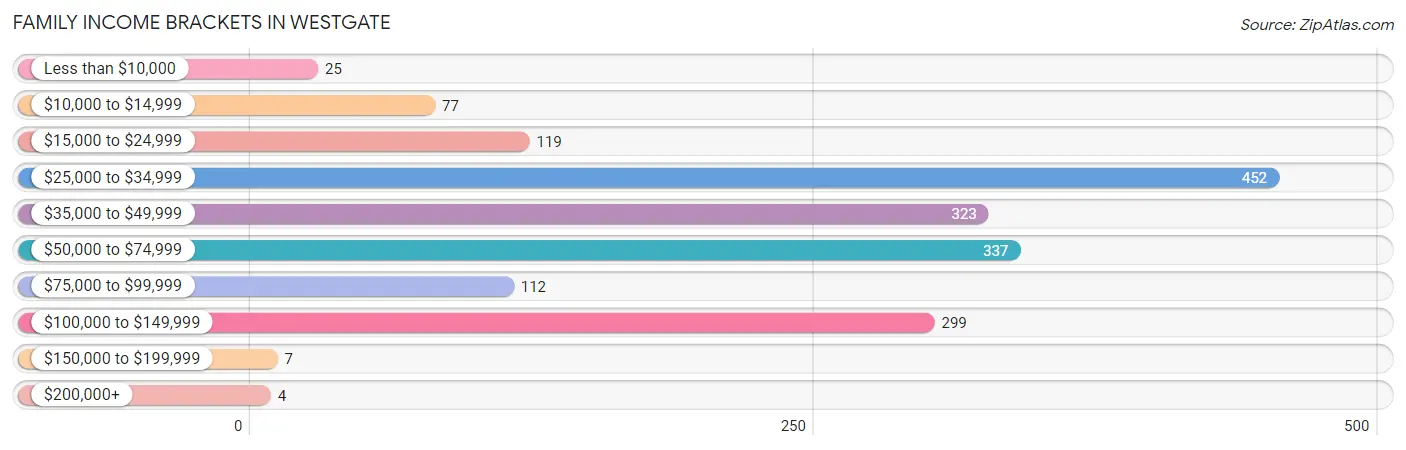
Family Income Brackets in Westgate
According to the Westgate family income data, there are 452 families falling into the $25,000 to $34,999 income range, which is the most common income bracket and makes up 25.7% of all families. Conversely, the $200,000+ income bracket is the least frequent group with only 4 families (0.2%) belonging to this category.
| Income Bracket | # Families | % Families |
| Less than $10,000 | 25 | 1.4% |
| $10,000 to $14,999 | 77 | 4.4% |
| $15,000 to $24,999 | 119 | 6.8% |
| $25,000 to $34,999 | 452 | 25.7% |
| $35,000 to $49,999 | 323 | 18.4% |
| $50,000 to $74,999 | 337 | 19.2% |
| $75,000 to $99,999 | 112 | 6.4% |
| $100,000 to $149,999 | 299 | 17.0% |
| $150,000 to $199,999 | 7 | 0.4% |
| $200,000+ | 4 | 0.2% |
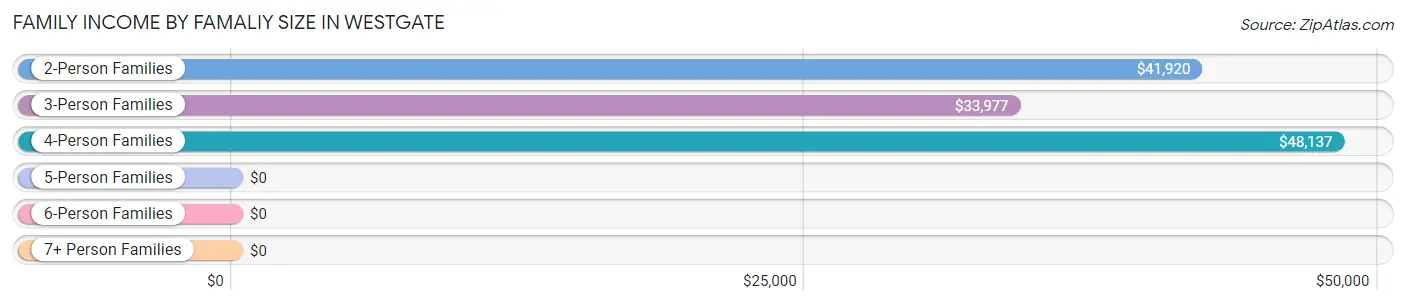
Family Income by Famaliy Size in Westgate
4-person families (364 | 20.7%) account for the highest median family income in Westgate with $48,137 per family, while 2-person families (429 | 24.4%) have the highest median income of $20,960 per family member.
| Income Bracket | # Families | Median Income |
| 2-Person Families | 429 (24.4%) | $41,920 |
| 3-Person Families | 591 (33.6%) | $33,977 |
| 4-Person Families | 364 (20.7%) | $48,137 |
| 5-Person Families | 213 (12.1%) | $0 |
| 6-Person Families | 39 (2.2%) | $0 |
| 7+ Person Families | 121 (6.9%) | $0 |
| Total | 1,757 (100.0%) | $44,190 |
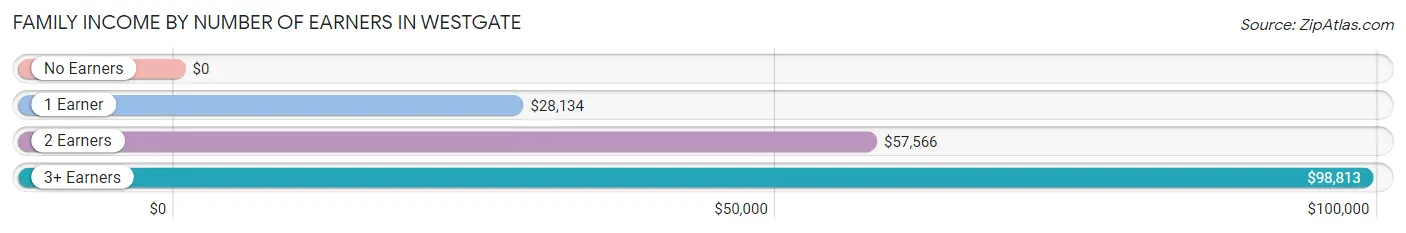
Family Income by Number of Earners in Westgate
| Number of Earners | # Families | Median Income |
| No Earners | 18 (1.0%) | $0 |
| 1 Earner | 687 (39.1%) | $28,134 |
| 2 Earners | 745 (42.4%) | $57,566 |
| 3+ Earners | 307 (17.5%) | $98,813 |
| Total | 1,757 (100.0%) | $44,190 |
Household Income in Westgate
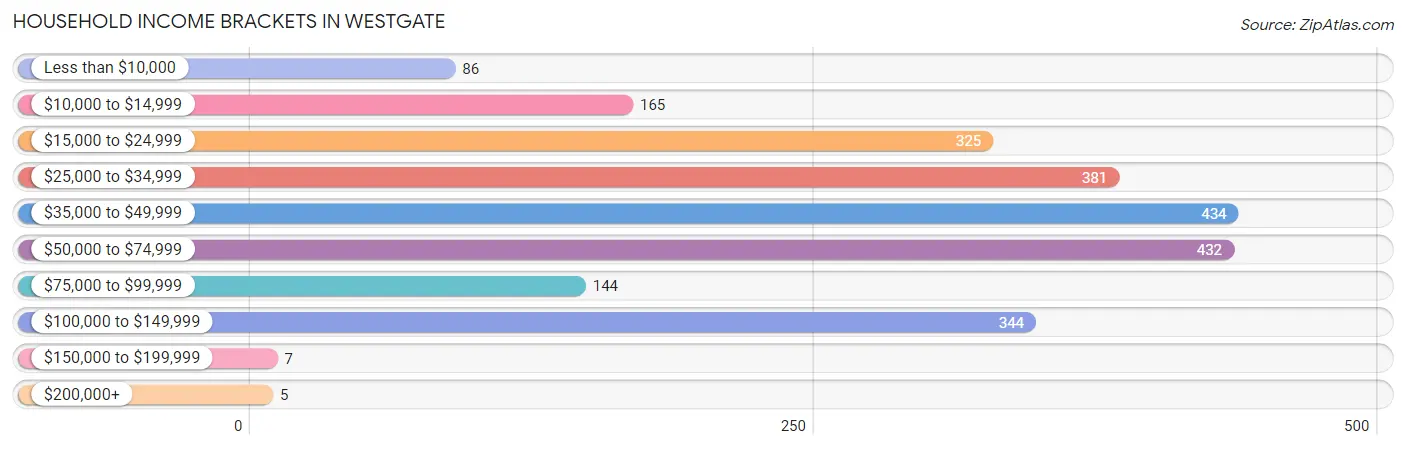
Household Income Brackets in Westgate
With 434 households falling in the category, the $35,000 to $49,999 income range is the most frequent in Westgate, accounting for 18.7% of all households. In contrast, only 5 households (0.2%) fall into the $200,000+ income bracket, making it the least populous group.
| Income Bracket | # Households | % Households |
| Less than $10,000 | 86 | 3.7% |
| $10,000 to $14,999 | 165 | 7.1% |
| $15,000 to $24,999 | 325 | 14.0% |
| $25,000 to $34,999 | 381 | 16.4% |
| $35,000 to $49,999 | 434 | 18.7% |
| $50,000 to $74,999 | 432 | 18.6% |
| $75,000 to $99,999 | 144 | 6.2% |
| $100,000 to $149,999 | 344 | 14.8% |
| $150,000 to $199,999 | 7 | 0.3% |
| $200,000+ | 5 | 0.2% |
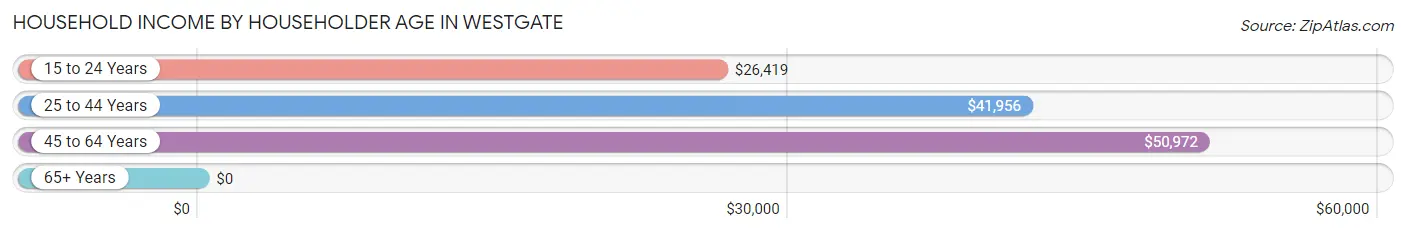
Household Income by Householder Age in Westgate
The median household income in Westgate is $42,449, with the highest median household income of $50,972 found in the 45 to 64 years age bracket for the primary householder. A total of 786 households (33.9%) fall into this category. Meanwhile, the 65+ years age bracket for the primary householder has the lowest median household income of $0, with 409 households (17.6%) in this group.
| Income Bracket | # Households | Median Income |
| 15 to 24 Years | 175 (7.5%) | $26,419 |
| 25 to 44 Years | 951 (41.0%) | $41,956 |
| 45 to 64 Years | 786 (33.9%) | $50,972 |
| 65+ Years | 409 (17.6%) | $0 |
| Total | 2,321 (100.0%) | $42,449 |
Poverty in Westgate
Income Below Poverty by Sex and Age in Westgate
With 20.1% poverty level for males and 33.8% for females among the residents of Westgate, 5 year old males and 75 year old and over females are the most vulnerable to poverty, with 59 males (55.1%) and 71 females (65.1%) in their respective age groups living below the poverty level.
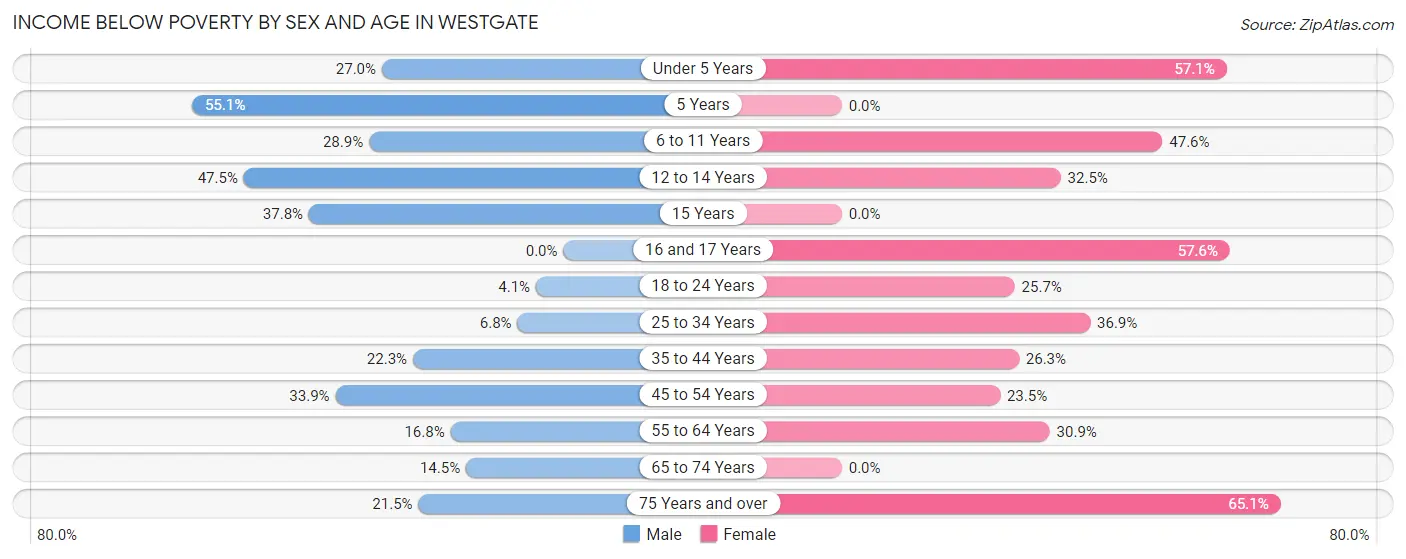
| Age Bracket | Male | Female |
| Under 5 Years | 90 (27.0%) | 212 (57.1%) |
| 5 Years | 59 (55.1%) | 0 (0.0%) |
| 6 to 11 Years | 86 (28.9%) | 238 (47.6%) |
| 12 to 14 Years | 159 (47.5%) | 52 (32.5%) |
| 15 Years | 17 (37.8%) | 0 (0.0%) |
| 16 and 17 Years | 0 (0.0%) | 53 (57.6%) |
| 18 to 24 Years | 27 (4.1%) | 86 (25.7%) |
| 25 to 34 Years | 51 (6.8%) | 198 (36.9%) |
| 35 to 44 Years | 122 (22.3%) | 173 (26.3%) |
| 45 to 54 Years | 130 (33.9%) | 160 (23.5%) |
| 55 to 64 Years | 57 (16.8%) | 92 (30.9%) |
| 65 to 74 Years | 35 (14.5%) | 0 (0.0%) |
| 75 Years and over | 51 (21.5%) | 71 (65.1%) |
| Total | 884 (20.1%) | 1,335 (33.8%) |
Income Above Poverty by Sex and Age in Westgate
According to the poverty statistics in Westgate, males aged 16 and 17 years and females aged 5 years are the age groups that are most secure financially, with 100.0% of males and 100.0% of females in these age groups living above the poverty line.
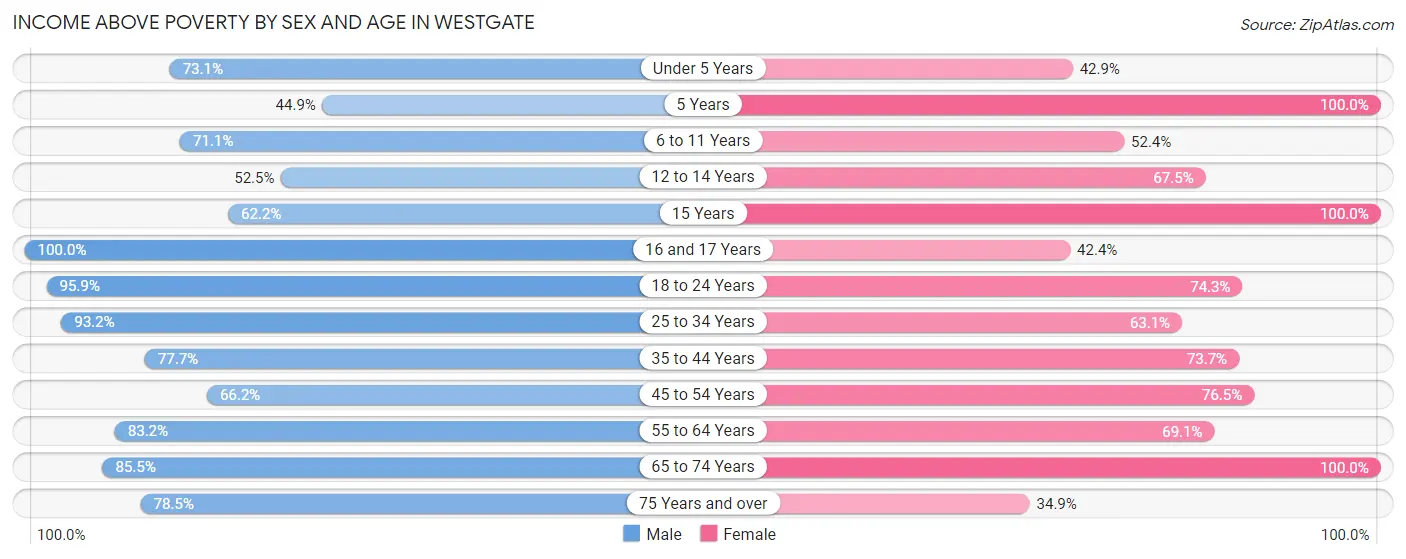
| Age Bracket | Male | Female |
| Under 5 Years | 244 (73.1%) | 159 (42.9%) |
| 5 Years | 48 (44.9%) | 91 (100.0%) |
| 6 to 11 Years | 212 (71.1%) | 262 (52.4%) |
| 12 to 14 Years | 176 (52.5%) | 108 (67.5%) |
| 15 Years | 28 (62.2%) | 15 (100.0%) |
| 16 and 17 Years | 113 (100.0%) | 39 (42.4%) |
| 18 to 24 Years | 636 (95.9%) | 249 (74.3%) |
| 25 to 34 Years | 697 (93.2%) | 339 (63.1%) |
| 35 to 44 Years | 424 (77.7%) | 485 (73.7%) |
| 45 to 54 Years | 254 (66.1%) | 521 (76.5%) |
| 55 to 64 Years | 283 (83.2%) | 206 (69.1%) |
| 65 to 74 Years | 207 (85.5%) | 101 (100.0%) |
| 75 Years and over | 186 (78.5%) | 38 (34.9%) |
| Total | 3,508 (79.9%) | 2,613 (66.2%) |
Income Below Poverty Among Married-Couple Families in Westgate
The poverty statistics for married-couple families in Westgate show that 13.6% or 93 of the total 685 families live below the poverty line. Families with 3 or 4 children have the highest poverty rate of 68.9%, comprising of 42 families. On the other hand, families with no children have the lowest poverty rate of 7.8%, which includes 19 families.
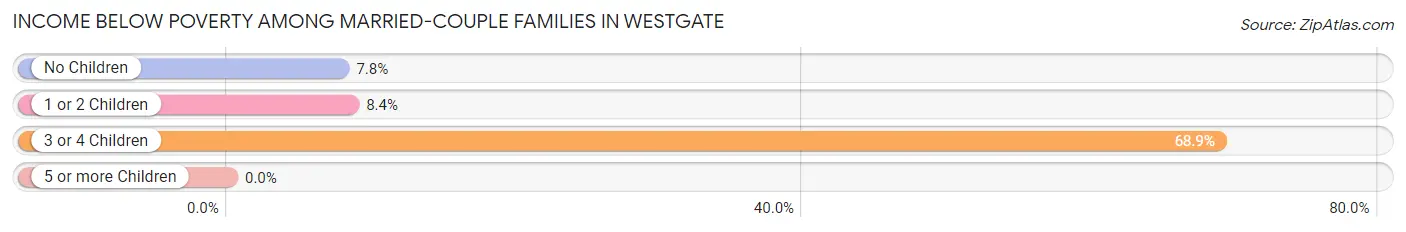
| Children | Above Poverty | Below Poverty |
| No Children | 226 (92.2%) | 19 (7.8%) |
| 1 or 2 Children | 347 (91.6%) | 32 (8.4%) |
| 3 or 4 Children | 19 (31.1%) | 42 (68.9%) |
| 5 or more Children | 0 (0.0%) | 0 (0.0%) |
| Total | 592 (86.4%) | 93 (13.6%) |
Income Below Poverty Among Single-Parent Households in Westgate
According to the poverty data in Westgate, 12.8% or 69 single-father households and 34.5% or 184 single-mother households are living below the poverty line. Among single-father households, those with 5 or more children have the highest poverty rate, with 31 households (100.0%) experiencing poverty. Likewise, among single-mother households, those with 5 or more children have the highest poverty rate, with 59 households (100.0%) falling below the poverty line.
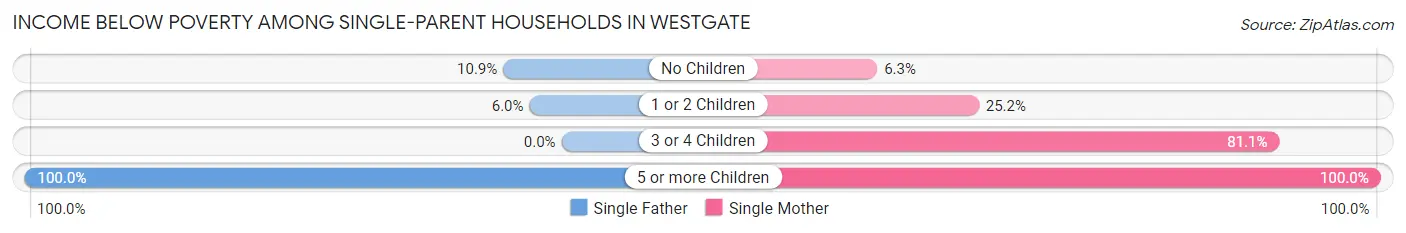
| Children | Single Father | Single Mother |
| No Children | 20 (10.9%) | 8 (6.2%) |
| 1 or 2 Children | 18 (6.0%) | 74 (25.2%) |
| 3 or 4 Children | 0 (0.0%) | 43 (81.1%) |
| 5 or more Children | 31 (100.0%) | 59 (100.0%) |
| Total | 69 (12.8%) | 184 (34.5%) |
Income Below Poverty Among Married-Couple vs Single-Parent Households in Westgate
The poverty data for Westgate shows that 93 of the married-couple family households (13.6%) and 253 of the single-parent households (23.6%) are living below the poverty level. Within the married-couple family households, those with 3 or 4 children have the highest poverty rate, with 42 households (68.9%) falling below the poverty line. Among the single-parent households, those with 5 or more children have the highest poverty rate, with 90 household (100.0%) living below poverty.
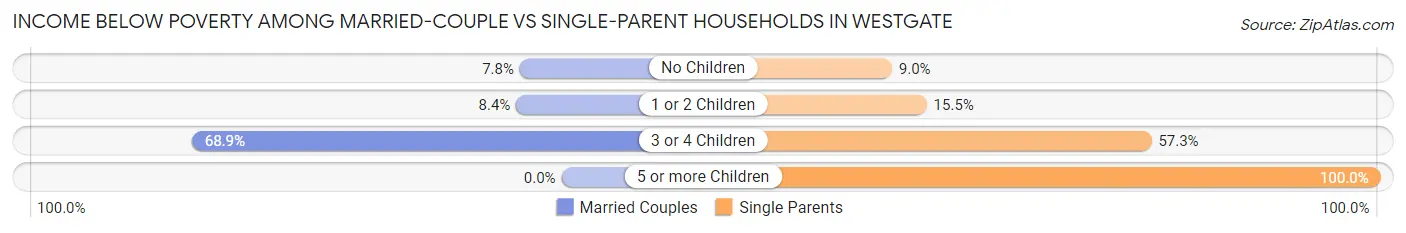
| Children | Married-Couple Families | Single-Parent Households |
| No Children | 19 (7.8%) | 28 (9.0%) |
| 1 or 2 Children | 32 (8.4%) | 92 (15.5%) |
| 3 or 4 Children | 42 (68.9%) | 43 (57.3%) |
| 5 or more Children | 0 (0.0%) | 90 (100.0%) |
| Total | 93 (13.6%) | 253 (23.6%) |
Employment Characteristics in Westgate
Employment by Class of Employer in Westgate
Among the 4,082 employed individuals in Westgate, private company employees (3,603 | 88.3%), self-employed (incorporated) (108 | 2.6%), and state government employees (84 | 2.1%) make up the most common classes of employment.
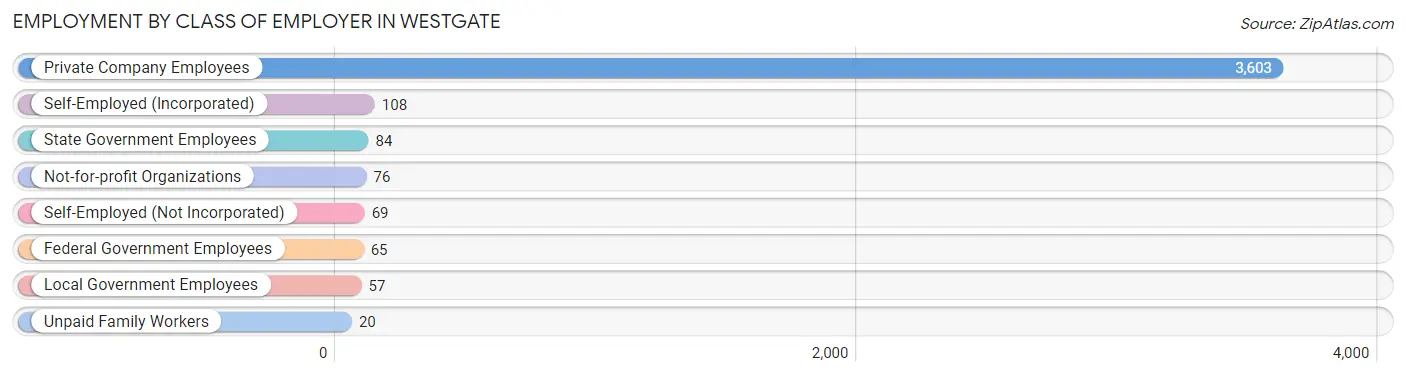
| Employer Class | # Employees | % Employees |
| Private Company Employees | 3,603 | 88.3% |
| Self-Employed (Incorporated) | 108 | 2.6% |
| Self-Employed (Not Incorporated) | 69 | 1.7% |
| Not-for-profit Organizations | 76 | 1.9% |
| Local Government Employees | 57 | 1.4% |
| State Government Employees | 84 | 2.1% |
| Federal Government Employees | 65 | 1.6% |
| Unpaid Family Workers | 20 | 0.5% |
| Total | 4,082 | 100.0% |
Employment Status by Age in Westgate
According to the labor force statistics for Westgate, out of the total population over 16 years of age (6,084), 74.5% or 4,533 individuals are in the labor force, with 8.6% or 390 of them unemployed. The age group with the highest labor force participation rate is 20 to 24 years, with 88.8% or 734 individuals in the labor force. Within the labor force, the 45 to 54 years age range has the highest percentage of unemployed individuals, with 20.4% or 186 of them being unemployed.
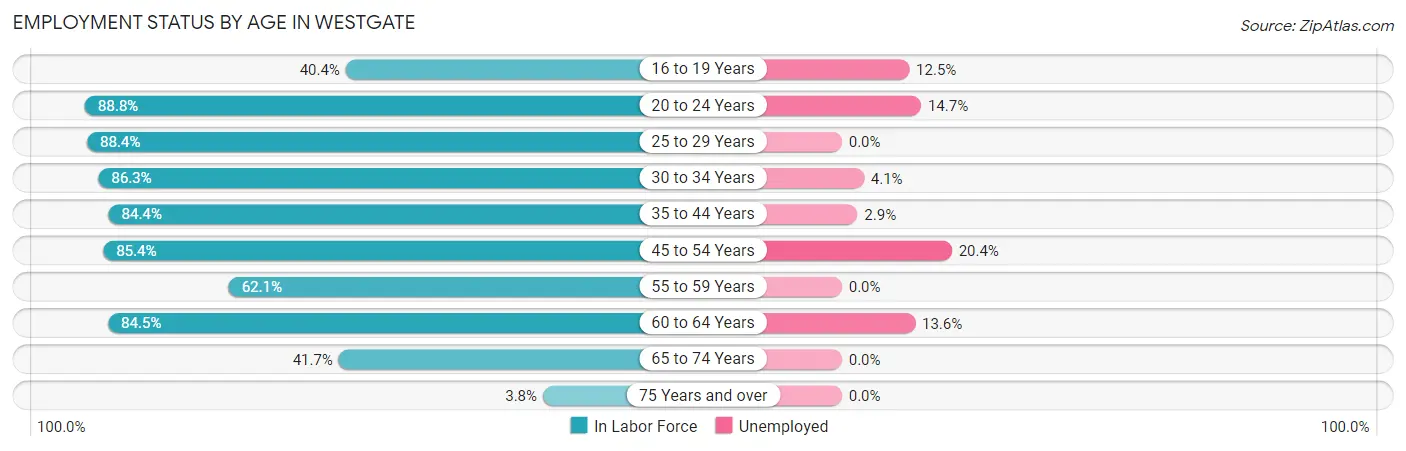
| Age Bracket | In Labor Force | Unemployed |
| 16 to 19 Years | 152 (40.4%) | 19 (12.5%) |
| 20 to 24 Years | 734 (88.8%) | 108 (14.7%) |
| 25 to 29 Years | 511 (88.4%) | 0 (0.0%) |
| 30 to 34 Years | 610 (86.3%) | 25 (4.1%) |
| 35 to 44 Years | 1,016 (84.4%) | 29 (2.9%) |
| 45 to 54 Years | 910 (85.4%) | 186 (20.4%) |
| 55 to 59 Years | 256 (62.1%) | 0 (0.0%) |
| 60 to 64 Years | 191 (84.5%) | 26 (13.6%) |
| 65 to 74 Years | 143 (41.7%) | 0 (0.0%) |
| 75 Years and over | 13 (3.8%) | 0 (0.0%) |
| Total | 4,533 (74.5%) | 390 (8.6%) |
Employment Status by Educational Attainment in Westgate
According to labor force statistics for Westgate, 83.3% of individuals (3,492) out of the total population between 25 and 64 years of age (4,192) are in the labor force, with 7.6% or 265 of them being unemployed. The group with the highest labor force participation rate are those with the educational attainment of bachelor's degree or higher, with 96.0% or 214 individuals in the labor force. Within the labor force, individuals with high school diploma education have the highest percentage of unemployment, with 14.1% or 154 of them being unemployed.
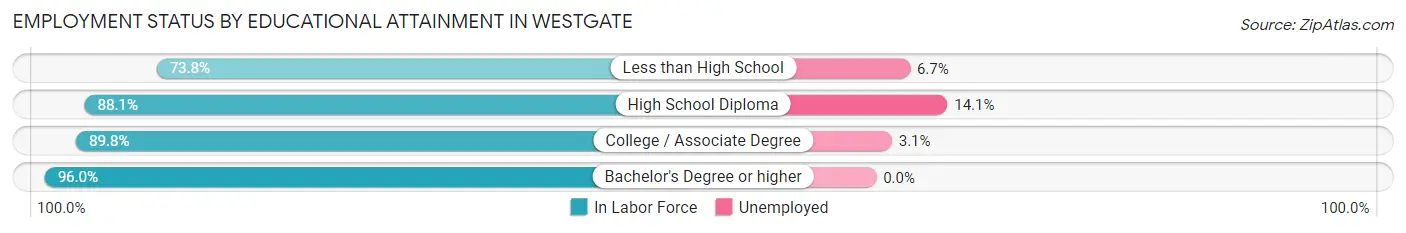
| Educational Attainment | In Labor Force | Unemployed |
| Less than High School | 1,215 (73.8%) | 110 (6.7%) |
| High School Diploma | 1,090 (88.1%) | 174 (14.1%) |
| College / Associate Degree | 975 (89.8%) | 34 (3.1%) |
| Bachelor's Degree or higher | 214 (96.0%) | 0 (0.0%) |
| Total | 3,492 (83.3%) | 319 (7.6%) |
Employment Occupations by Sex in Westgate
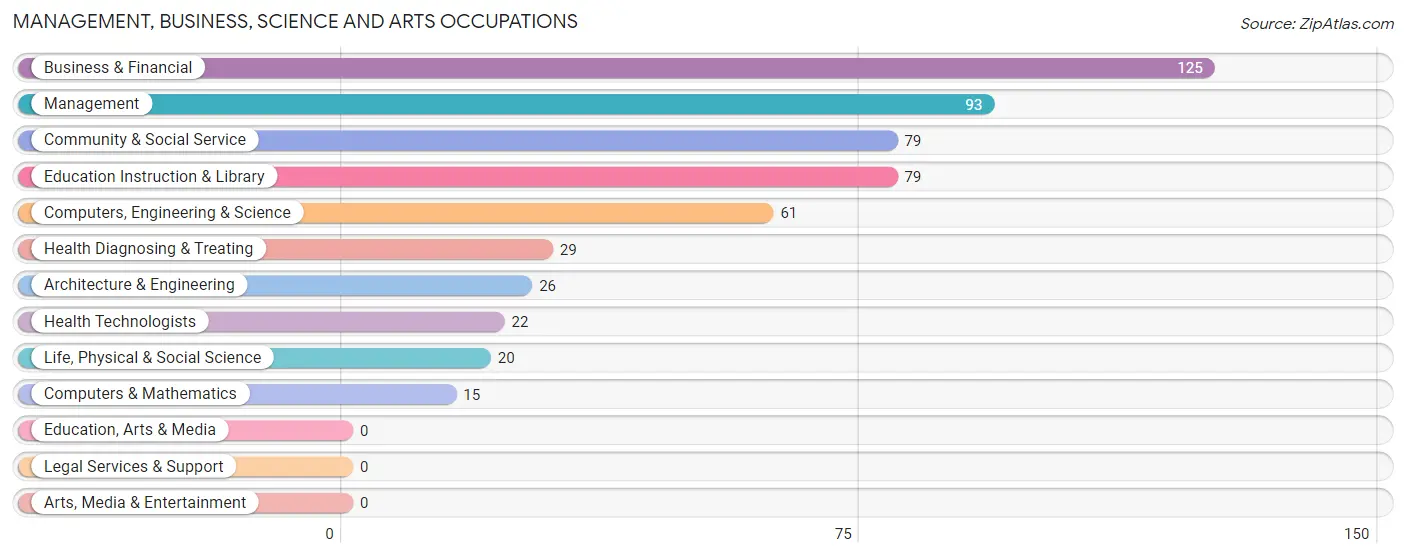
Management, Business, Science and Arts Occupations
The most common Management, Business, Science and Arts occupations in Westgate are Business & Financial (125 | 3.0%), Management (93 | 2.2%), Community & Social Service (79 | 1.9%), Education Instruction & Library (79 | 1.9%), and Computers, Engineering & Science (61 | 1.5%).
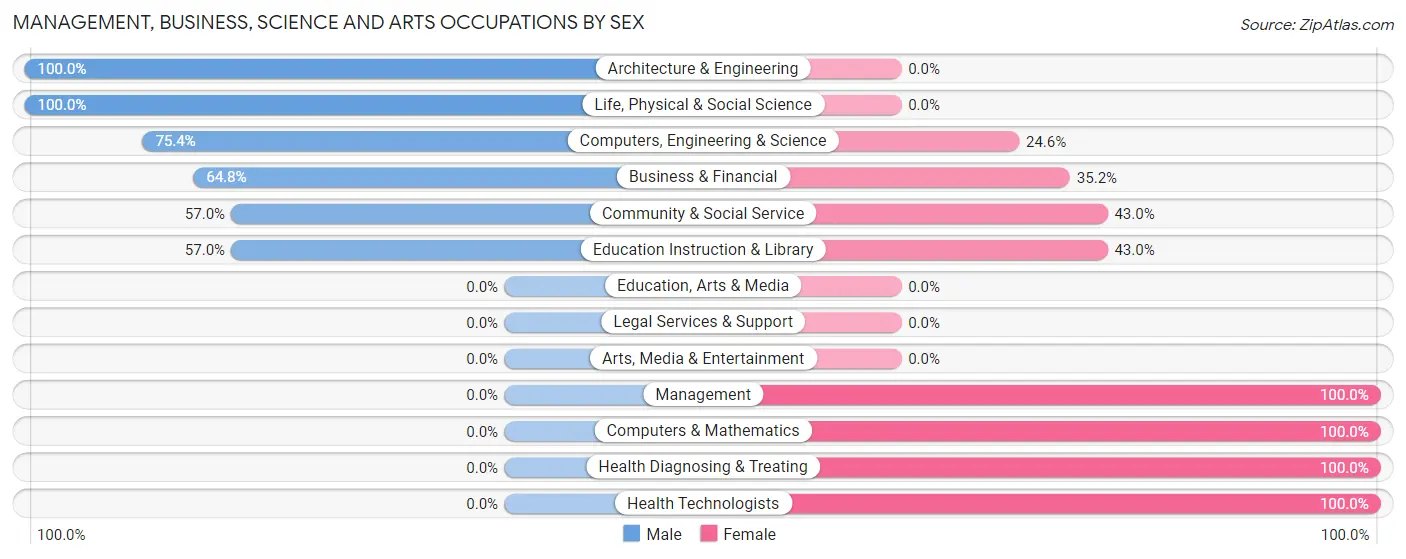
Management, Business, Science and Arts Occupations by Sex
Within the Management, Business, Science and Arts occupations in Westgate, the most male-oriented occupations are Architecture & Engineering (100.0%), Life, Physical & Social Science (100.0%), and Computers, Engineering & Science (75.4%), while the most female-oriented occupations are Management (100.0%), Computers & Mathematics (100.0%), and Health Diagnosing & Treating (100.0%).
| Occupation | Male | Female |
| Management | 0 (0.0%) | 93 (100.0%) |
| Business & Financial | 81 (64.8%) | 44 (35.2%) |
| Computers, Engineering & Science | 46 (75.4%) | 15 (24.6%) |
| Computers & Mathematics | 0 (0.0%) | 15 (100.0%) |
| Architecture & Engineering | 26 (100.0%) | 0 (0.0%) |
| Life, Physical & Social Science | 20 (100.0%) | 0 (0.0%) |
| Community & Social Service | 45 (57.0%) | 34 (43.0%) |
| Education, Arts & Media | 0 (0.0%) | 0 (0.0%) |
| Legal Services & Support | 0 (0.0%) | 0 (0.0%) |
| Education Instruction & Library | 45 (57.0%) | 34 (43.0%) |
| Arts, Media & Entertainment | 0 (0.0%) | 0 (0.0%) |
| Health Diagnosing & Treating | 0 (0.0%) | 29 (100.0%) |
| Health Technologists | 0 (0.0%) | 22 (100.0%) |
| Total (Category) | 172 (44.4%) | 215 (55.6%) |
| Total (Overall) | 2,426 (58.6%) | 1,717 (41.4%) |
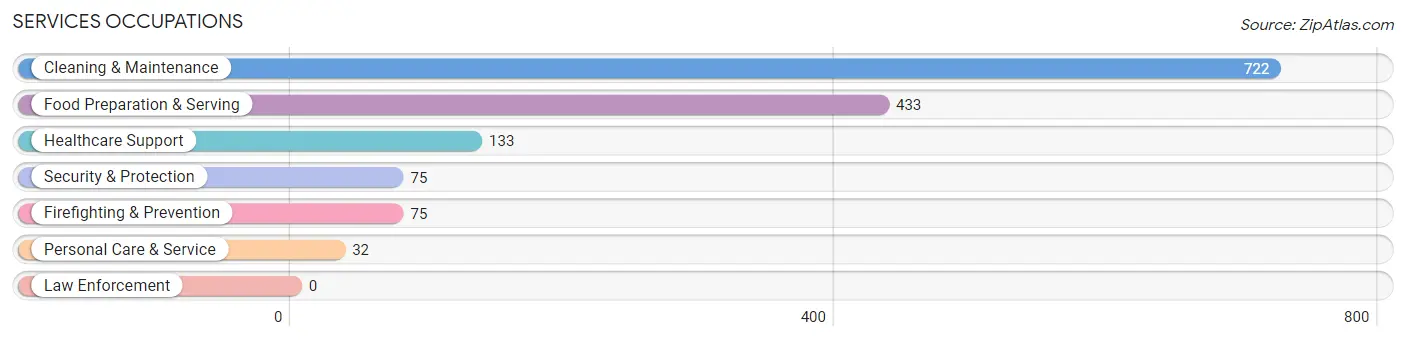
Services Occupations
The most common Services occupations in Westgate are Cleaning & Maintenance (722 | 17.4%), Food Preparation & Serving (433 | 10.4%), Healthcare Support (133 | 3.2%), Security & Protection (75 | 1.8%), and Firefighting & Prevention (75 | 1.8%).
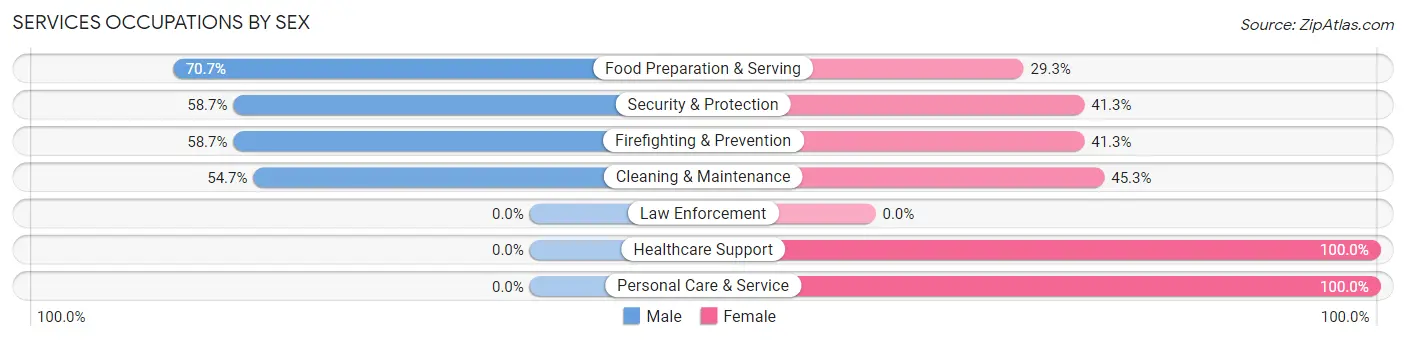
Services Occupations by Sex
Within the Services occupations in Westgate, the most male-oriented occupations are Food Preparation & Serving (70.7%), Security & Protection (58.7%), and Firefighting & Prevention (58.7%), while the most female-oriented occupations are Healthcare Support (100.0%), Personal Care & Service (100.0%), and Cleaning & Maintenance (45.3%).
| Occupation | Male | Female |
| Healthcare Support | 0 (0.0%) | 133 (100.0%) |
| Security & Protection | 44 (58.7%) | 31 (41.3%) |
| Firefighting & Prevention | 44 (58.7%) | 31 (41.3%) |
| Law Enforcement | 0 (0.0%) | 0 (0.0%) |
| Food Preparation & Serving | 306 (70.7%) | 127 (29.3%) |
| Cleaning & Maintenance | 395 (54.7%) | 327 (45.3%) |
| Personal Care & Service | 0 (0.0%) | 32 (100.0%) |
| Total (Category) | 745 (53.4%) | 650 (46.6%) |
| Total (Overall) | 2,426 (58.6%) | 1,717 (41.4%) |
Sales and Office Occupations
The most common Sales and Office occupations in Westgate are Sales & Related (612 | 14.8%), and Office & Administration (444 | 10.7%).
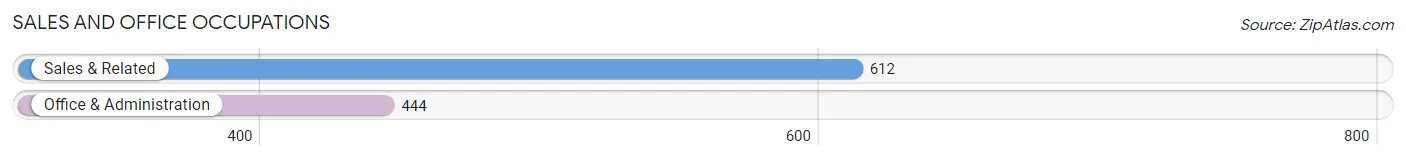
Sales and Office Occupations by Sex
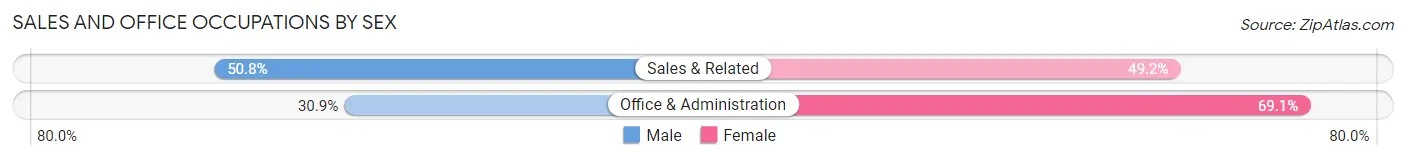
| Occupation | Male | Female |
| Sales & Related | 311 (50.8%) | 301 (49.2%) |
| Office & Administration | 137 (30.9%) | 307 (69.1%) |
| Total (Category) | 448 (42.4%) | 608 (57.6%) |
| Total (Overall) | 2,426 (58.6%) | 1,717 (41.4%) |
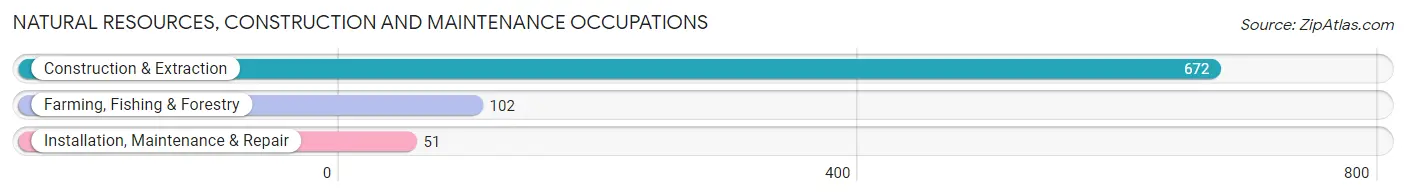
Natural Resources, Construction and Maintenance Occupations
The most common Natural Resources, Construction and Maintenance occupations in Westgate are Construction & Extraction (672 | 16.2%), Farming, Fishing & Forestry (102 | 2.5%), and Installation, Maintenance & Repair (51 | 1.2%).
Natural Resources, Construction and Maintenance Occupations by Sex
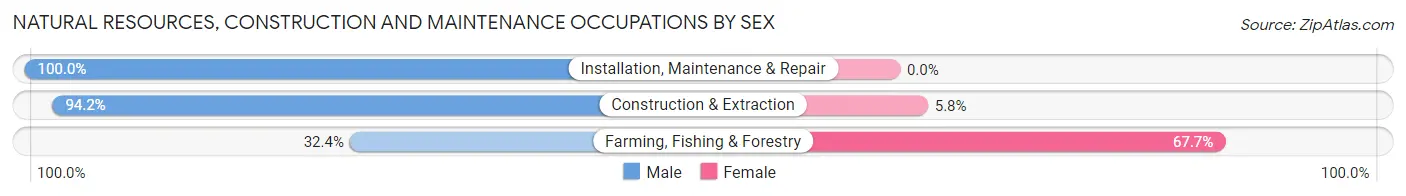
| Occupation | Male | Female |
| Farming, Fishing & Forestry | 33 (32.4%) | 69 (67.6%) |
| Construction & Extraction | 633 (94.2%) | 39 (5.8%) |
| Installation, Maintenance & Repair | 51 (100.0%) | 0 (0.0%) |
| Total (Category) | 717 (86.9%) | 108 (13.1%) |
| Total (Overall) | 2,426 (58.6%) | 1,717 (41.4%) |
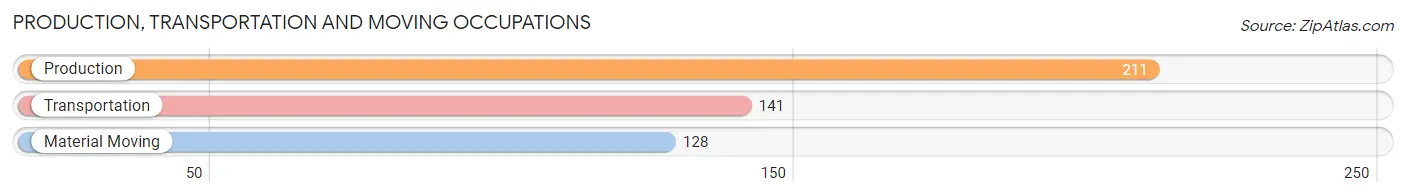
Production, Transportation and Moving Occupations
The most common Production, Transportation and Moving occupations in Westgate are Production (211 | 5.1%), Transportation (141 | 3.4%), and Material Moving (128 | 3.1%).
Production, Transportation and Moving Occupations by Sex
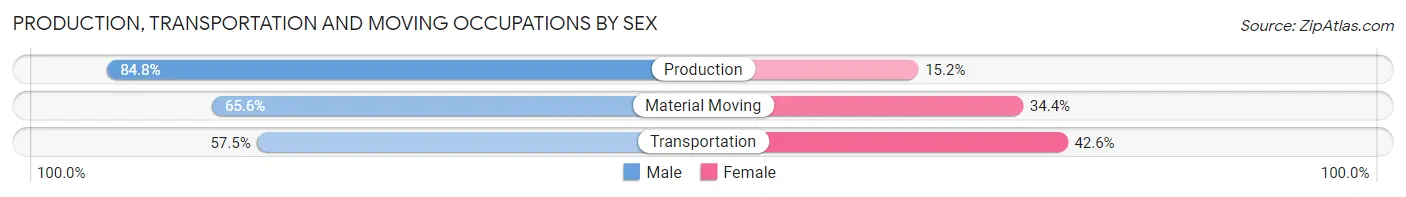
| Occupation | Male | Female |
| Production | 179 (84.8%) | 32 (15.2%) |
| Transportation | 81 (57.5%) | 60 (42.5%) |
| Material Moving | 84 (65.6%) | 44 (34.4%) |
| Total (Category) | 344 (71.7%) | 136 (28.3%) |
| Total (Overall) | 2,426 (58.6%) | 1,717 (41.4%) |
Employment Industries by Sex in Westgate
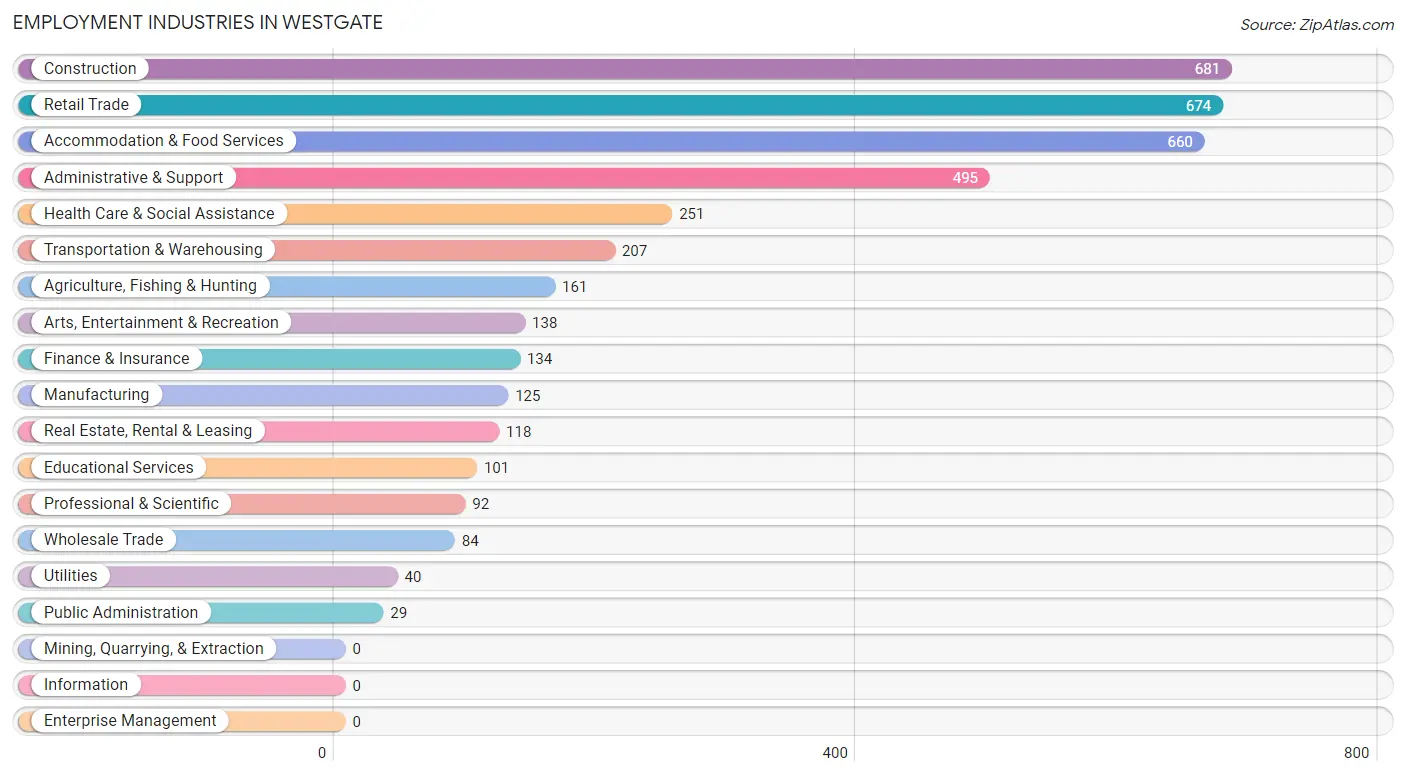
Employment Industries in Westgate
The major employment industries in Westgate include Construction (681 | 16.4%), Retail Trade (674 | 16.3%), Accommodation & Food Services (660 | 15.9%), Administrative & Support (495 | 11.9%), and Health Care & Social Assistance (251 | 6.1%).
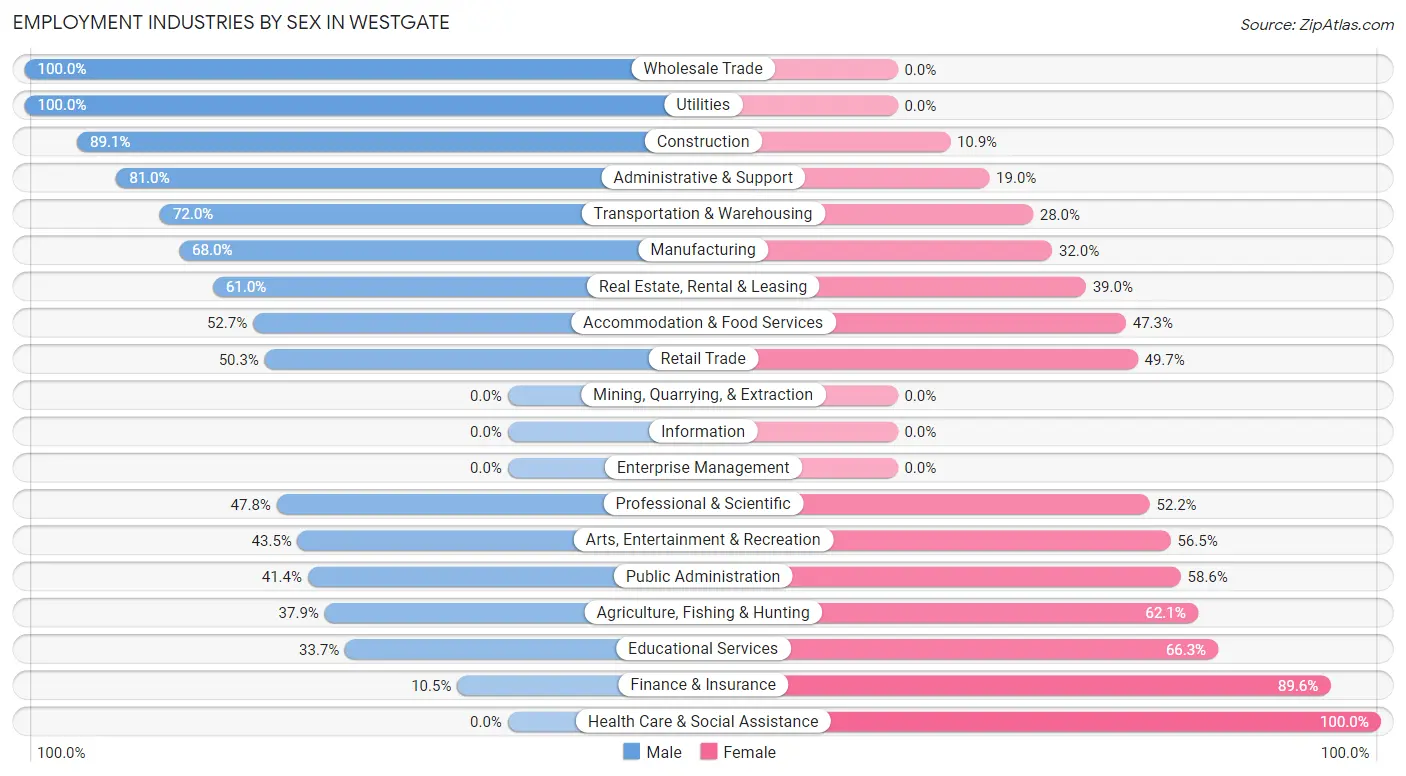
Employment Industries by Sex in Westgate
The Westgate industries that see more men than women are Wholesale Trade (100.0%), Utilities (100.0%), and Construction (89.1%), whereas the industries that tend to have a higher number of women are Health Care & Social Assistance (100.0%), Finance & Insurance (89.5%), and Educational Services (66.3%).
| Industry | Male | Female |
| Agriculture, Fishing & Hunting | 61 (37.9%) | 100 (62.1%) |
| Mining, Quarrying, & Extraction | 0 (0.0%) | 0 (0.0%) |
| Construction | 607 (89.1%) | 74 (10.9%) |
| Manufacturing | 85 (68.0%) | 40 (32.0%) |
| Wholesale Trade | 84 (100.0%) | 0 (0.0%) |
| Retail Trade | 339 (50.3%) | 335 (49.7%) |
| Transportation & Warehousing | 149 (72.0%) | 58 (28.0%) |
| Utilities | 40 (100.0%) | 0 (0.0%) |
| Information | 0 (0.0%) | 0 (0.0%) |
| Finance & Insurance | 14 (10.4%) | 120 (89.5%) |
| Real Estate, Rental & Leasing | 72 (61.0%) | 46 (39.0%) |
| Professional & Scientific | 44 (47.8%) | 48 (52.2%) |
| Enterprise Management | 0 (0.0%) | 0 (0.0%) |
| Administrative & Support | 401 (81.0%) | 94 (19.0%) |
| Educational Services | 34 (33.7%) | 67 (66.3%) |
| Health Care & Social Assistance | 0 (0.0%) | 251 (100.0%) |
| Arts, Entertainment & Recreation | 60 (43.5%) | 78 (56.5%) |
| Accommodation & Food Services | 348 (52.7%) | 312 (47.3%) |
| Public Administration | 12 (41.4%) | 17 (58.6%) |
| Total | 2,426 (58.6%) | 1,717 (41.4%) |
Education in Westgate
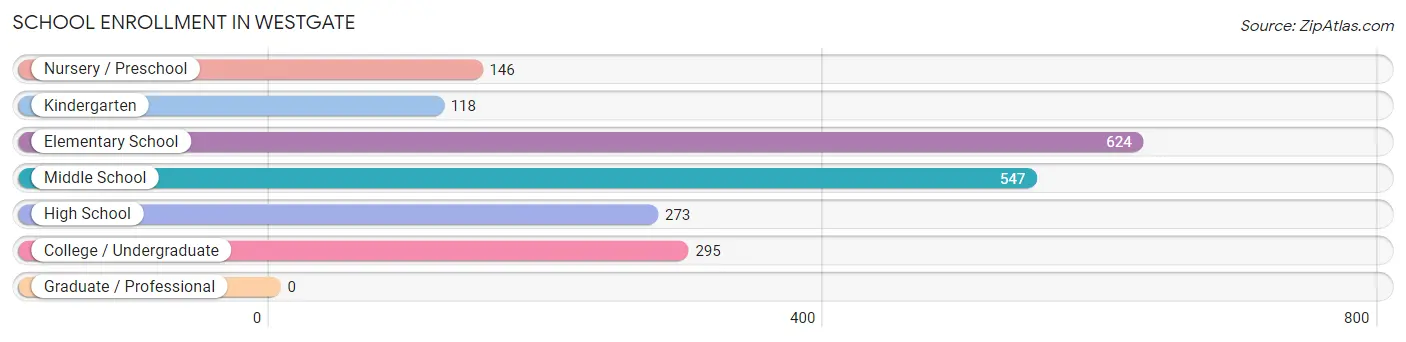
School Enrollment in Westgate
The most common levels of schooling among the 2,003 students in Westgate are elementary school (624 | 31.1%), middle school (547 | 27.3%), and college / undergraduate (295 | 14.7%).
| School Level | # Students | % Students |
| Nursery / Preschool | 146 | 7.3% |
| Kindergarten | 118 | 5.9% |
| Elementary School | 624 | 31.1% |
| Middle School | 547 | 27.3% |
| High School | 273 | 13.6% |
| College / Undergraduate | 295 | 14.7% |
| Graduate / Professional | 0 | 0.0% |
| Total | 2,003 | 100.0% |
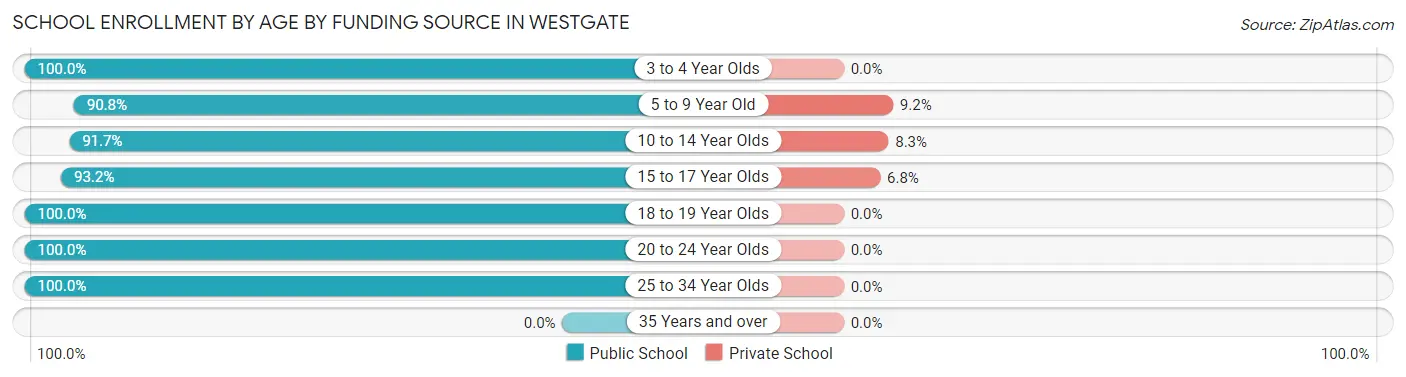
School Enrollment by Age by Funding Source in Westgate
Out of a total of 2,003 students who are enrolled in schools in Westgate, 130 (6.5%) attend a private institution, while the remaining 1,873 (93.5%) are enrolled in public schools. The age group of 5 to 9 year old has the highest likelihood of being enrolled in private schools, with 64 (9.2% in the age bracket) enrolled. Conversely, the age group of 3 to 4 year olds has the lowest likelihood of being enrolled in a private school, with 126 (100.0% in the age bracket) attending a public institution.
| Age Bracket | Public School | Private School |
| 3 to 4 Year Olds | 126 (100.0%) | 0 (0.0%) |
| 5 to 9 Year Old | 634 (90.8%) | 64 (9.2%) |
| 10 to 14 Year Olds | 563 (91.7%) | 51 (8.3%) |
| 15 to 17 Year Olds | 206 (93.2%) | 15 (6.8%) |
| 18 to 19 Year Olds | 118 (100.0%) | 0 (0.0%) |
| 20 to 24 Year Olds | 204 (100.0%) | 0 (0.0%) |
| 25 to 34 Year Olds | 22 (100.0%) | 0 (0.0%) |
| 35 Years and over | 0 (0.0%) | 0 (0.0%) |
| Total | 1,873 (93.5%) | 130 (6.5%) |
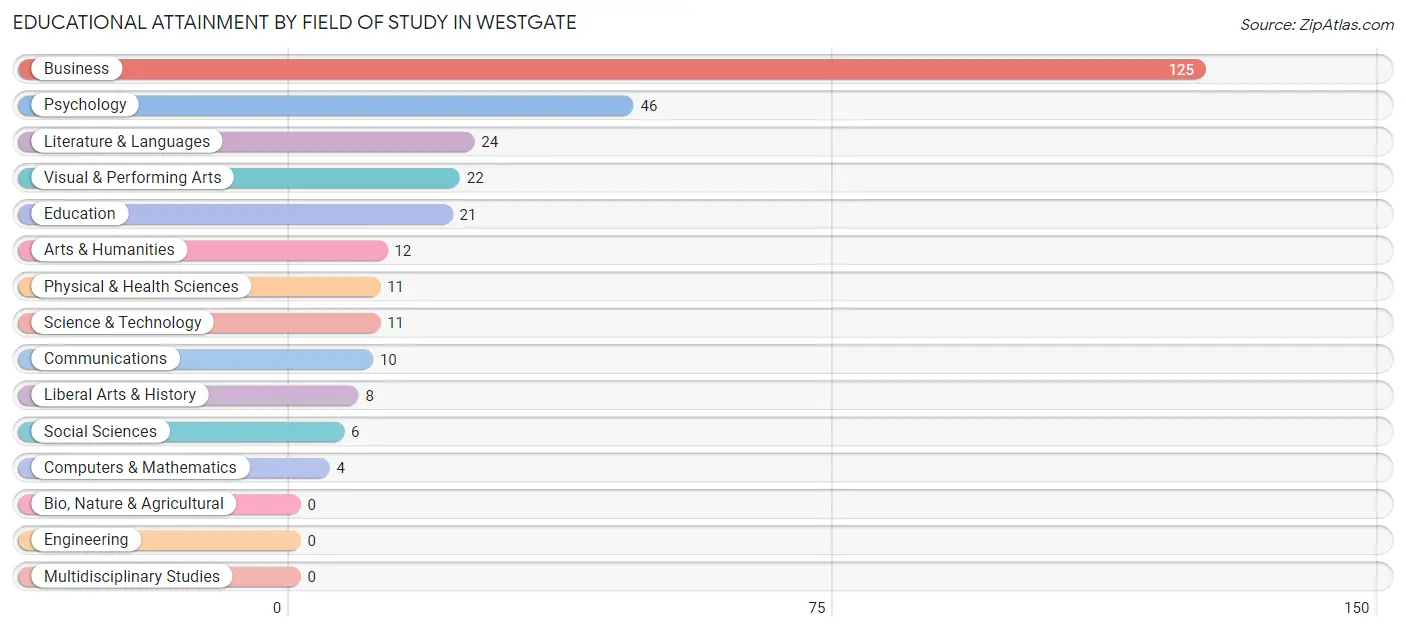
Educational Attainment by Field of Study in Westgate
Business (125 | 41.7%), psychology (46 | 15.3%), literature & languages (24 | 8.0%), visual & performing arts (22 | 7.3%), and education (21 | 7.0%) are the most common fields of study among 300 individuals in Westgate who have obtained a bachelor's degree or higher.
| Field of Study | # Graduates | % Graduates |
| Computers & Mathematics | 4 | 1.3% |
| Bio, Nature & Agricultural | 0 | 0.0% |
| Physical & Health Sciences | 11 | 3.7% |
| Psychology | 46 | 15.3% |
| Social Sciences | 6 | 2.0% |
| Engineering | 0 | 0.0% |
| Multidisciplinary Studies | 0 | 0.0% |
| Science & Technology | 11 | 3.7% |
| Business | 125 | 41.7% |
| Education | 21 | 7.0% |
| Literature & Languages | 24 | 8.0% |
| Liberal Arts & History | 8 | 2.7% |
| Visual & Performing Arts | 22 | 7.3% |
| Communications | 10 | 3.3% |
| Arts & Humanities | 12 | 4.0% |
| Total | 300 | 100.0% |
Transportation & Commute in Westgate
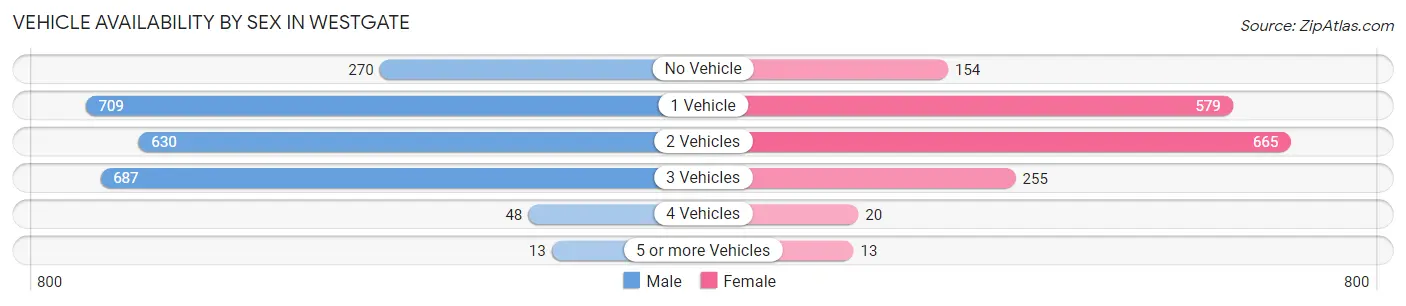
Vehicle Availability by Sex in Westgate
The most prevalent vehicle ownership categories in Westgate are males with 1 vehicle (709, accounting for 30.1%) and females with 1 vehicle (579, making up 42.0%).
| Vehicles Available | Male | Female |
| No Vehicle | 270 (11.5%) | 154 (9.1%) |
| 1 Vehicle | 709 (30.1%) | 579 (34.3%) |
| 2 Vehicles | 630 (26.7%) | 665 (39.4%) |
| 3 Vehicles | 687 (29.1%) | 255 (15.1%) |
| 4 Vehicles | 48 (2.0%) | 20 (1.2%) |
| 5 or more Vehicles | 13 (0.5%) | 13 (0.8%) |
| Total | 2,357 (100.0%) | 1,686 (100.0%) |
Commute Time in Westgate
The most frequently occuring commute durations in Westgate are 20 to 24 minutes (879 commuters, 21.8%), 15 to 19 minutes (757 commuters, 18.8%), and 30 to 34 minutes (719 commuters, 17.9%).
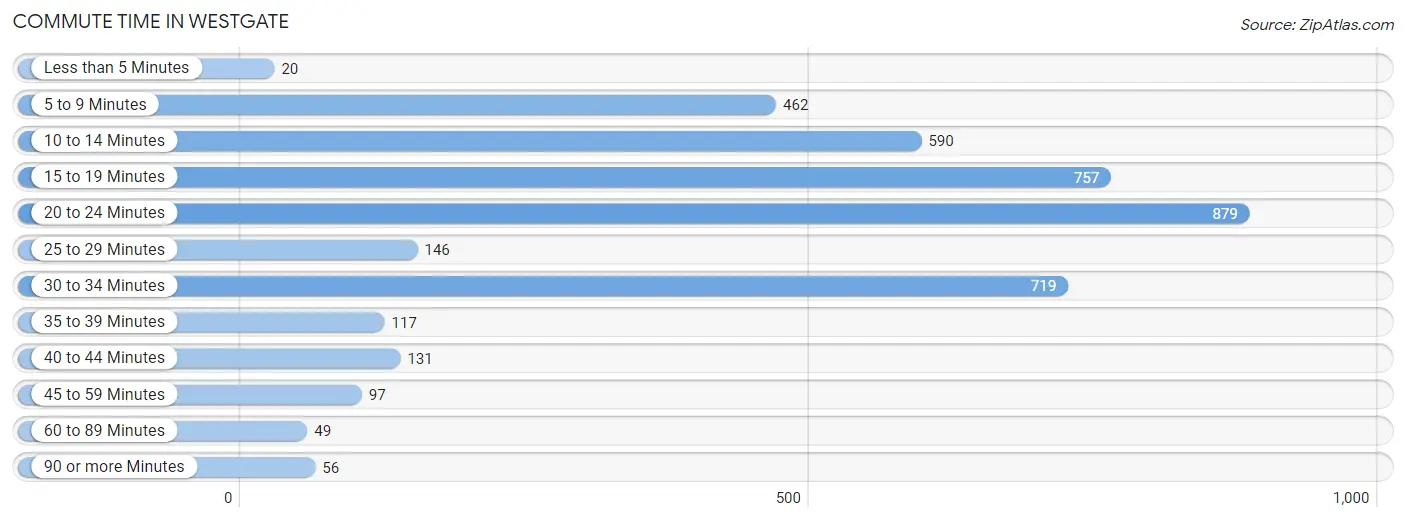
| Commute Time | # Commuters | % Commuters |
| Less than 5 Minutes | 20 | 0.5% |
| 5 to 9 Minutes | 462 | 11.5% |
| 10 to 14 Minutes | 590 | 14.7% |
| 15 to 19 Minutes | 757 | 18.8% |
| 20 to 24 Minutes | 879 | 21.8% |
| 25 to 29 Minutes | 146 | 3.6% |
| 30 to 34 Minutes | 719 | 17.9% |
| 35 to 39 Minutes | 117 | 2.9% |
| 40 to 44 Minutes | 131 | 3.3% |
| 45 to 59 Minutes | 97 | 2.4% |
| 60 to 89 Minutes | 49 | 1.2% |
| 90 or more Minutes | 56 | 1.4% |
Commute Time by Sex in Westgate
The most common commute times in Westgate are 15 to 19 minutes (517 commuters, 21.6%) for males and 20 to 24 minutes (506 commuters, 31.1%) for females.
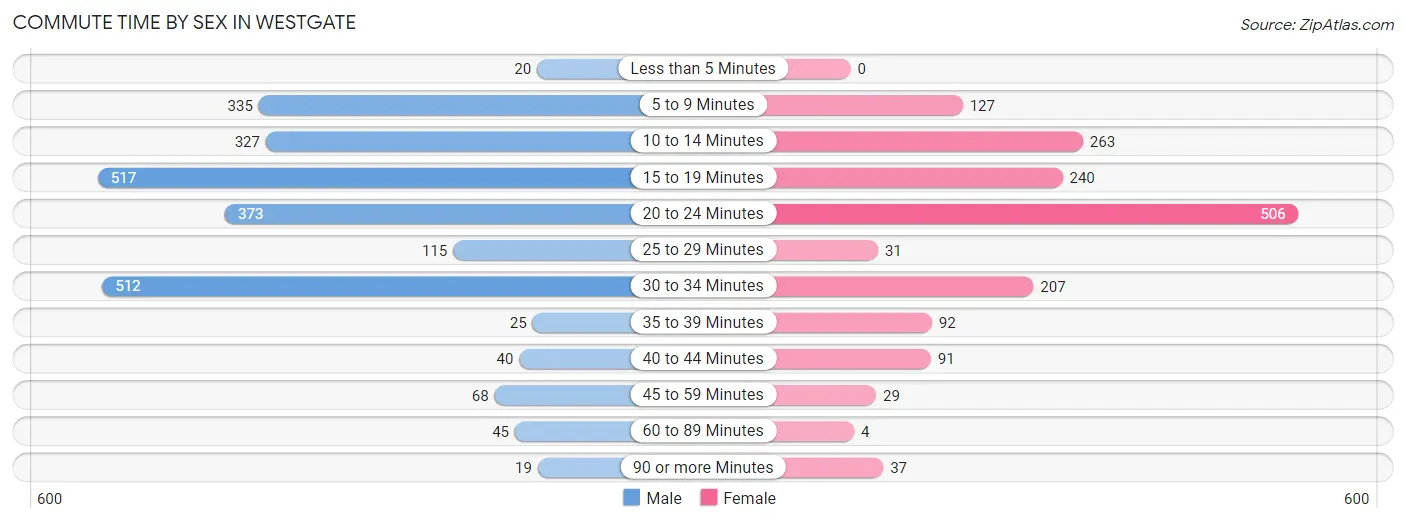
| Commute Time | Male | Female |
| Less than 5 Minutes | 20 (0.8%) | 0 (0.0%) |
| 5 to 9 Minutes | 335 (14.0%) | 127 (7.8%) |
| 10 to 14 Minutes | 327 (13.7%) | 263 (16.2%) |
| 15 to 19 Minutes | 517 (21.6%) | 240 (14.7%) |
| 20 to 24 Minutes | 373 (15.6%) | 506 (31.1%) |
| 25 to 29 Minutes | 115 (4.8%) | 31 (1.9%) |
| 30 to 34 Minutes | 512 (21.4%) | 207 (12.7%) |
| 35 to 39 Minutes | 25 (1.0%) | 92 (5.7%) |
| 40 to 44 Minutes | 40 (1.7%) | 91 (5.6%) |
| 45 to 59 Minutes | 68 (2.8%) | 29 (1.8%) |
| 60 to 89 Minutes | 45 (1.9%) | 4 (0.3%) |
| 90 or more Minutes | 19 (0.8%) | 37 (2.3%) |
Time of Departure to Work by Sex in Westgate
The most frequent times of departure to work in Westgate are 7:30 AM to 7:59 AM (426, 17.8%) for males and 7:00 AM to 7:29 AM (242, 14.9%) for females.
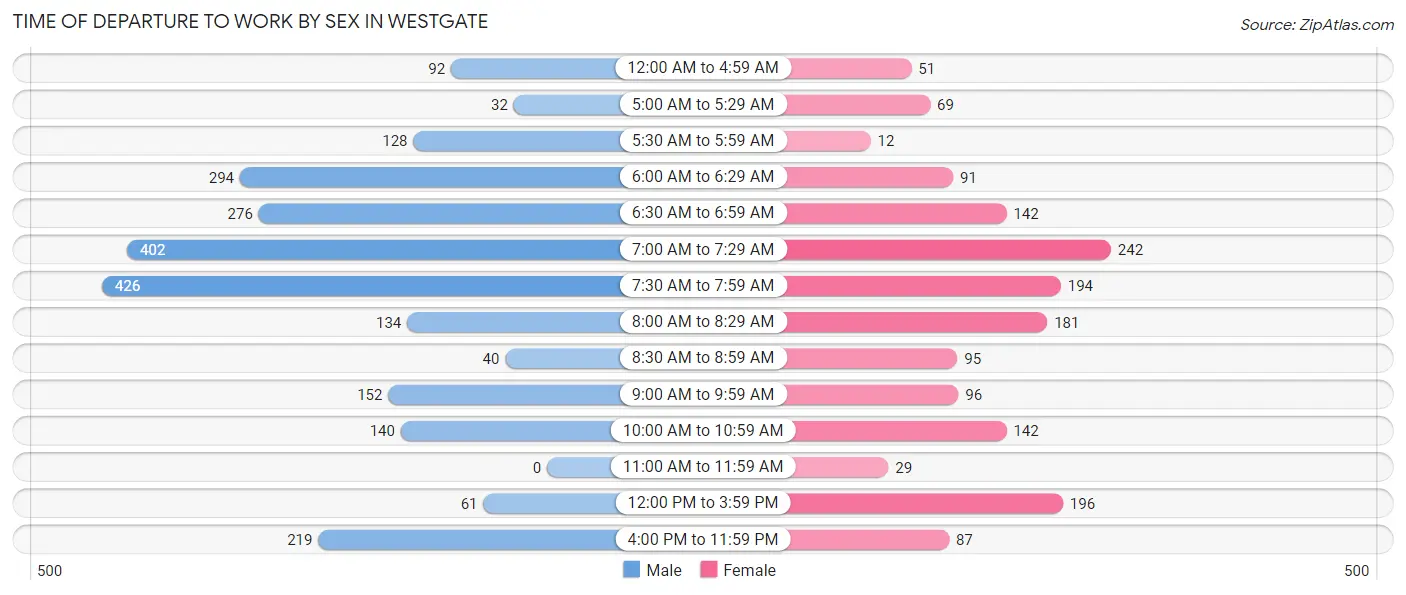
| Time of Departure | Male | Female |
| 12:00 AM to 4:59 AM | 92 (3.8%) | 51 (3.1%) |
| 5:00 AM to 5:29 AM | 32 (1.3%) | 69 (4.2%) |
| 5:30 AM to 5:59 AM | 128 (5.3%) | 12 (0.7%) |
| 6:00 AM to 6:29 AM | 294 (12.3%) | 91 (5.6%) |
| 6:30 AM to 6:59 AM | 276 (11.5%) | 142 (8.7%) |
| 7:00 AM to 7:29 AM | 402 (16.8%) | 242 (14.9%) |
| 7:30 AM to 7:59 AM | 426 (17.8%) | 194 (11.9%) |
| 8:00 AM to 8:29 AM | 134 (5.6%) | 181 (11.1%) |
| 8:30 AM to 8:59 AM | 40 (1.7%) | 95 (5.8%) |
| 9:00 AM to 9:59 AM | 152 (6.3%) | 96 (5.9%) |
| 10:00 AM to 10:59 AM | 140 (5.8%) | 142 (8.7%) |
| 11:00 AM to 11:59 AM | 0 (0.0%) | 29 (1.8%) |
| 12:00 PM to 3:59 PM | 61 (2.5%) | 196 (12.0%) |
| 4:00 PM to 11:59 PM | 219 (9.1%) | 87 (5.3%) |
| Total | 2,396 (100.0%) | 1,627 (100.0%) |
Housing Occupancy in Westgate
Occupancy by Ownership in Westgate
Of the total 2,321 dwellings in Westgate, owner-occupied units account for 904 (39.0%), while renter-occupied units make up 1,417 (61.1%).
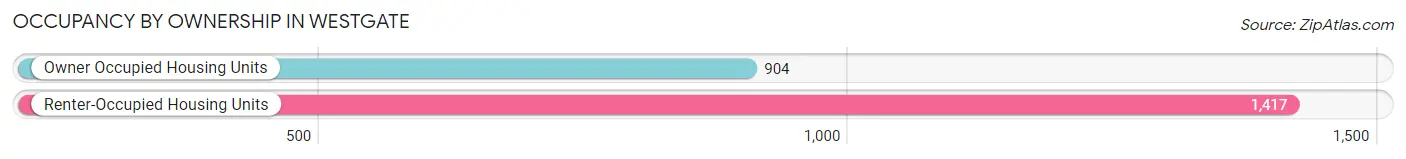
| Occupancy | # Housing Units | % Housing Units |
| Owner Occupied Housing Units | 904 | 39.0% |
| Renter-Occupied Housing Units | 1,417 | 61.1% |
| Total Occupied Housing Units | 2,321 | 100.0% |
Occupancy by Household Size in Westgate
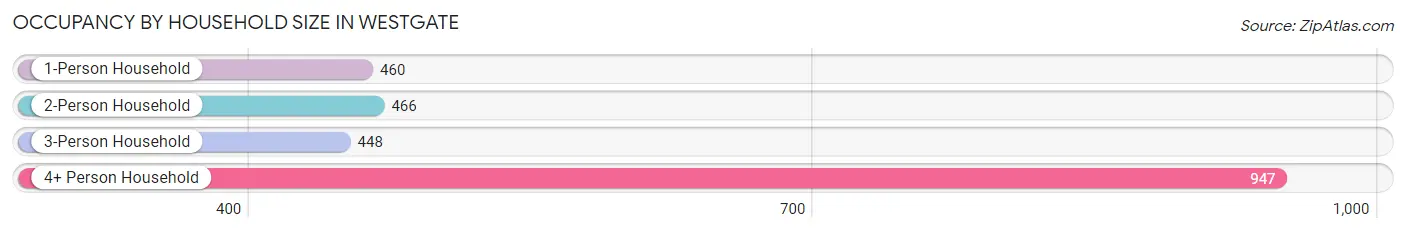
| Household Size | # Housing Units | % Housing Units |
| 1-Person Household | 460 | 19.8% |
| 2-Person Household | 466 | 20.1% |
| 3-Person Household | 448 | 19.3% |
| 4+ Person Household | 947 | 40.8% |
| Total Housing Units | 2,321 | 100.0% |
Occupancy by Ownership by Household Size in Westgate
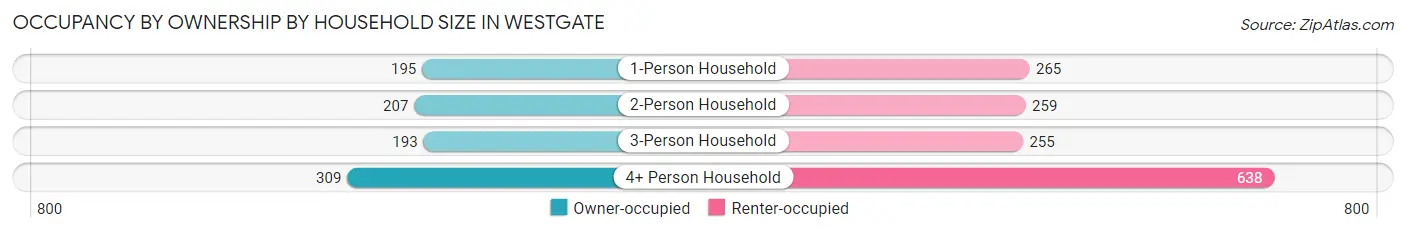
| Household Size | Owner-occupied | Renter-occupied |
| 1-Person Household | 195 (42.4%) | 265 (57.6%) |
| 2-Person Household | 207 (44.4%) | 259 (55.6%) |
| 3-Person Household | 193 (43.1%) | 255 (56.9%) |
| 4+ Person Household | 309 (32.6%) | 638 (67.4%) |
| Total Housing Units | 904 (39.0%) | 1,417 (61.1%) |
Occupancy by Educational Attainment in Westgate
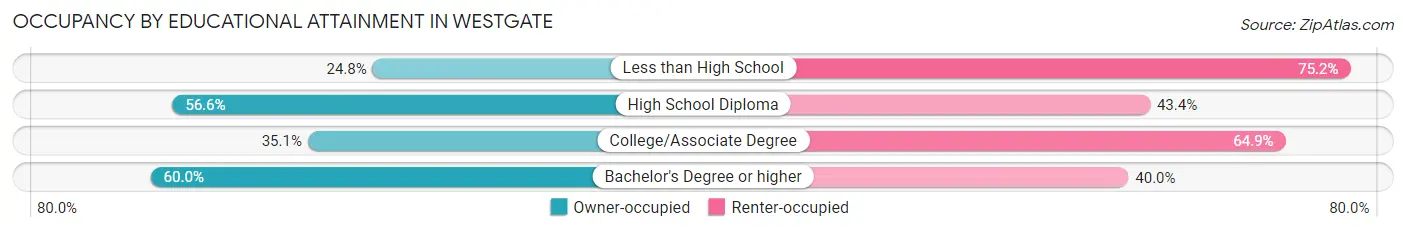
| Household Size | Owner-occupied | Renter-occupied |
| Less than High School | 201 (24.8%) | 609 (75.2%) |
| High School Diploma | 327 (56.6%) | 251 (43.4%) |
| College/Associate Degree | 259 (35.1%) | 479 (64.9%) |
| Bachelor's Degree or higher | 117 (60.0%) | 78 (40.0%) |
Occupancy by Age of Householder in Westgate
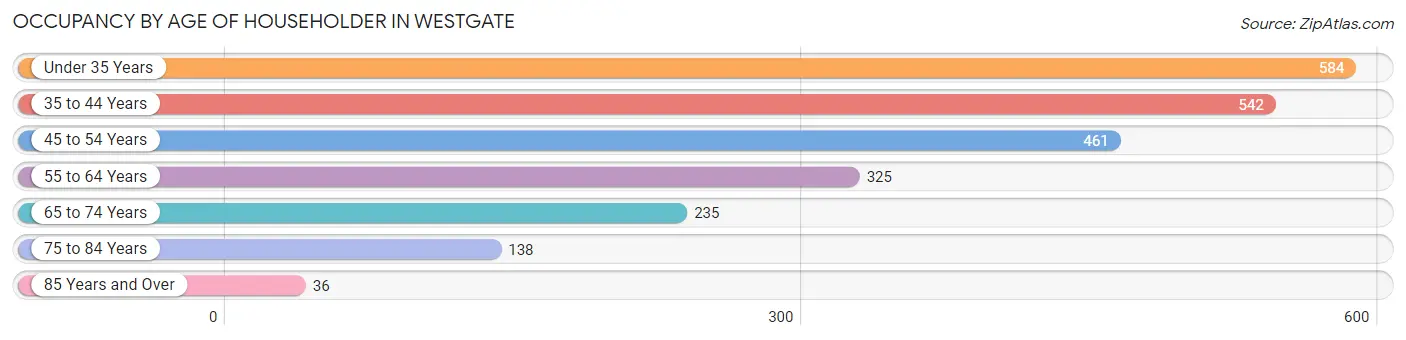
| Age Bracket | # Households | % Households |
| Under 35 Years | 584 | 25.2% |
| 35 to 44 Years | 542 | 23.4% |
| 45 to 54 Years | 461 | 19.9% |
| 55 to 64 Years | 325 | 14.0% |
| 65 to 74 Years | 235 | 10.1% |
| 75 to 84 Years | 138 | 5.9% |
| 85 Years and Over | 36 | 1.5% |
| Total | 2,321 | 100.0% |
Housing Finances in Westgate
Median Income by Occupancy in Westgate
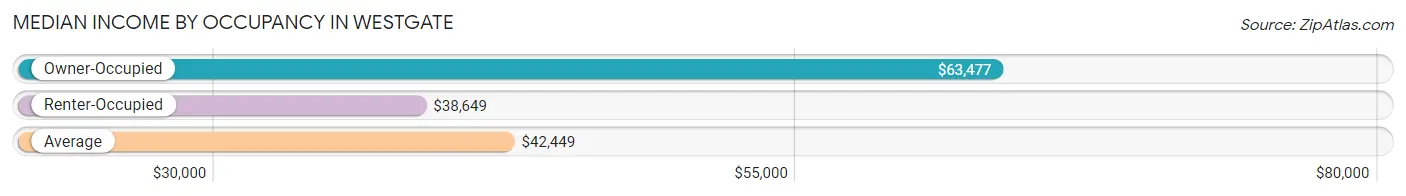
| Occupancy Type | # Households | Median Income |
| Owner-Occupied | 904 (39.0%) | $63,477 |
| Renter-Occupied | 1,417 (61.1%) | $38,649 |
| Average | 2,321 (100.0%) | $42,449 |
Occupancy by Householder Income Bracket in Westgate
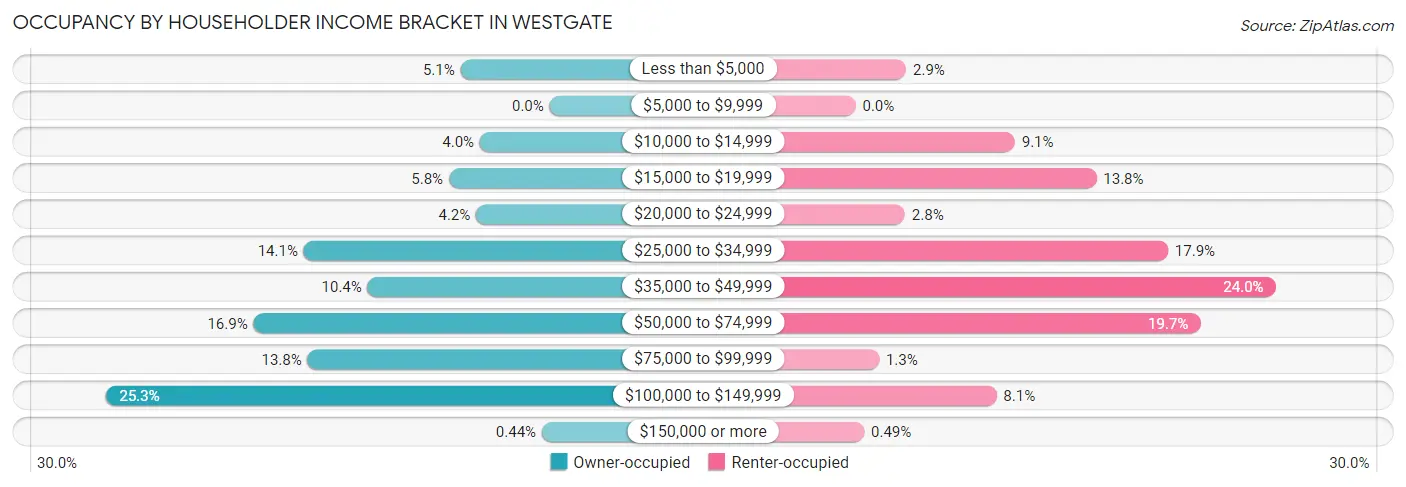
| Income Bracket | Owner-occupied | Renter-occupied |
| Less than $5,000 | 46 (5.1%) | 41 (2.9%) |
| $5,000 to $9,999 | 0 (0.0%) | 0 (0.0%) |
| $10,000 to $14,999 | 36 (4.0%) | 129 (9.1%) |
| $15,000 to $19,999 | 52 (5.8%) | 195 (13.8%) |
| $20,000 to $24,999 | 38 (4.2%) | 40 (2.8%) |
| $25,000 to $34,999 | 127 (14.1%) | 253 (17.8%) |
| $35,000 to $49,999 | 94 (10.4%) | 340 (24.0%) |
| $50,000 to $74,999 | 153 (16.9%) | 279 (19.7%) |
| $75,000 to $99,999 | 125 (13.8%) | 19 (1.3%) |
| $100,000 to $149,999 | 229 (25.3%) | 114 (8.1%) |
| $150,000 or more | 4 (0.4%) | 7 (0.5%) |
| Total | 904 (100.0%) | 1,417 (100.0%) |
Monthly Housing Cost Tiers in Westgate
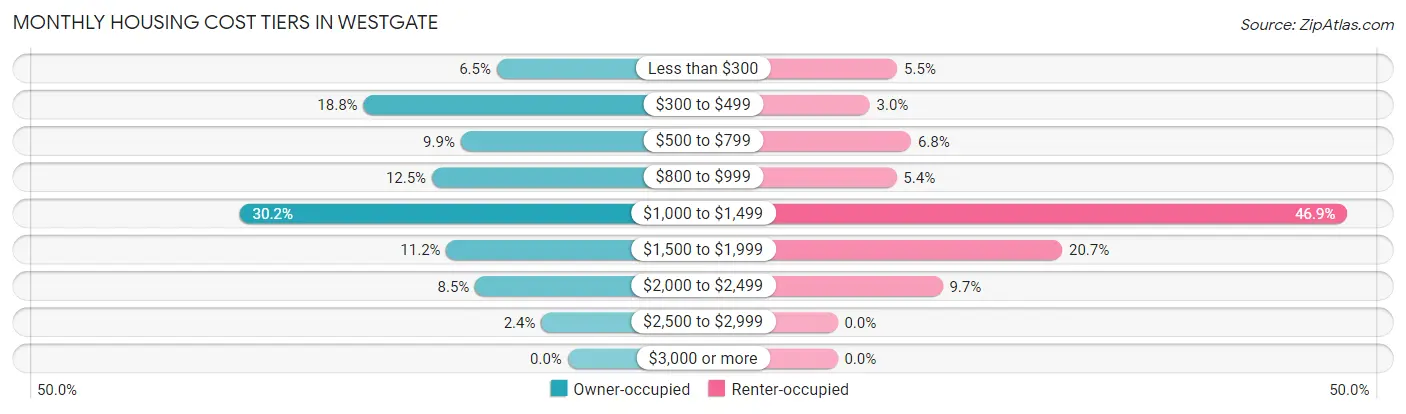
| Monthly Cost | Owner-occupied | Renter-occupied |
| Less than $300 | 59 (6.5%) | 78 (5.5%) |
| $300 to $499 | 170 (18.8%) | 42 (3.0%) |
| $500 to $799 | 89 (9.9%) | 96 (6.8%) |
| $800 to $999 | 113 (12.5%) | 77 (5.4%) |
| $1,000 to $1,499 | 273 (30.2%) | 665 (46.9%) |
| $1,500 to $1,999 | 101 (11.2%) | 293 (20.7%) |
| $2,000 to $2,499 | 77 (8.5%) | 137 (9.7%) |
| $2,500 to $2,999 | 22 (2.4%) | 0 (0.0%) |
| $3,000 or more | 0 (0.0%) | 0 (0.0%) |
| Total | 904 (100.0%) | 1,417 (100.0%) |
Physical Housing Characteristics in Westgate
Housing Structures in Westgate
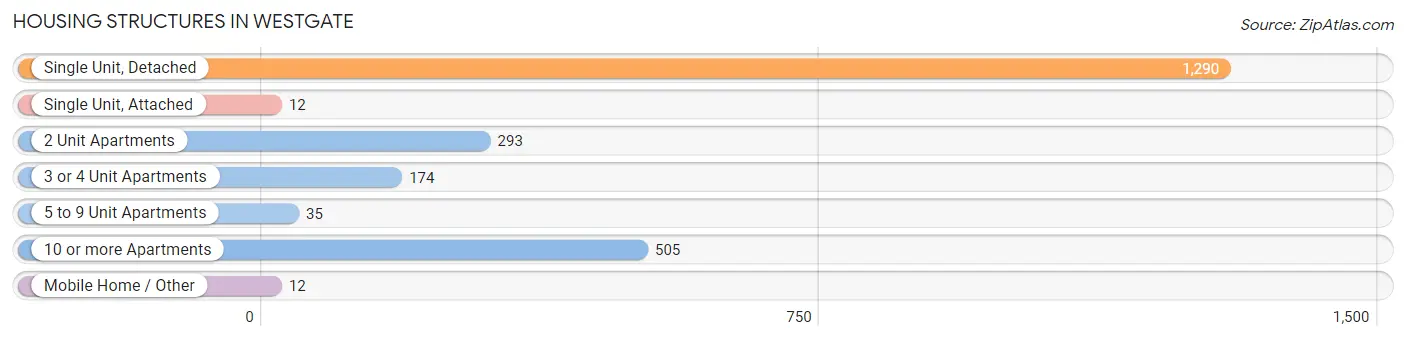
| Structure Type | # Housing Units | % Housing Units |
| Single Unit, Detached | 1,290 | 55.6% |
| Single Unit, Attached | 12 | 0.5% |
| 2 Unit Apartments | 293 | 12.6% |
| 3 or 4 Unit Apartments | 174 | 7.5% |
| 5 to 9 Unit Apartments | 35 | 1.5% |
| 10 or more Apartments | 505 | 21.8% |
| Mobile Home / Other | 12 | 0.5% |
| Total | 2,321 | 100.0% |
Housing Structures by Occupancy in Westgate
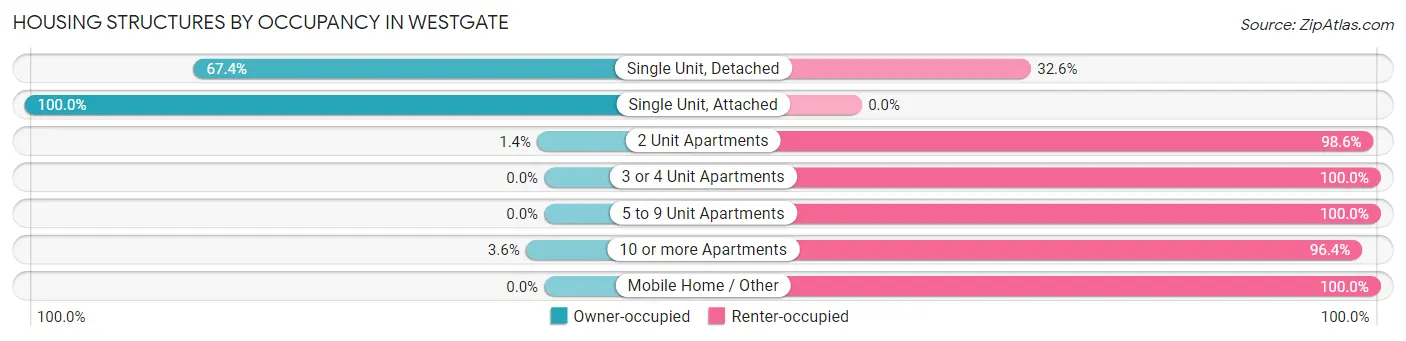
| Structure Type | Owner-occupied | Renter-occupied |
| Single Unit, Detached | 870 (67.4%) | 420 (32.6%) |
| Single Unit, Attached | 12 (100.0%) | 0 (0.0%) |
| 2 Unit Apartments | 4 (1.4%) | 289 (98.6%) |
| 3 or 4 Unit Apartments | 0 (0.0%) | 174 (100.0%) |
| 5 to 9 Unit Apartments | 0 (0.0%) | 35 (100.0%) |
| 10 or more Apartments | 18 (3.6%) | 487 (96.4%) |
| Mobile Home / Other | 0 (0.0%) | 12 (100.0%) |
| Total | 904 (39.0%) | 1,417 (61.1%) |
Housing Structures by Number of Rooms in Westgate
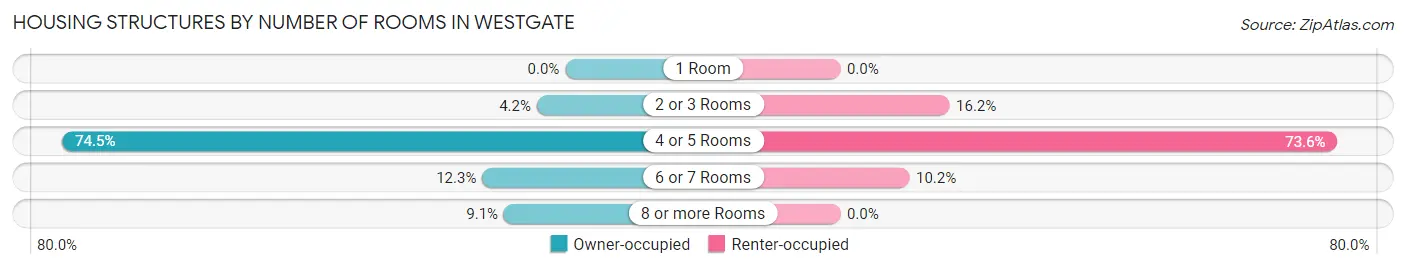
| Number of Rooms | Owner-occupied | Renter-occupied |
| 1 Room | 0 (0.0%) | 0 (0.0%) |
| 2 or 3 Rooms | 38 (4.2%) | 229 (16.2%) |
| 4 or 5 Rooms | 673 (74.5%) | 1,043 (73.6%) |
| 6 or 7 Rooms | 111 (12.3%) | 145 (10.2%) |
| 8 or more Rooms | 82 (9.1%) | 0 (0.0%) |
| Total | 904 (100.0%) | 1,417 (100.0%) |
Housing Structure by Heating Type in Westgate
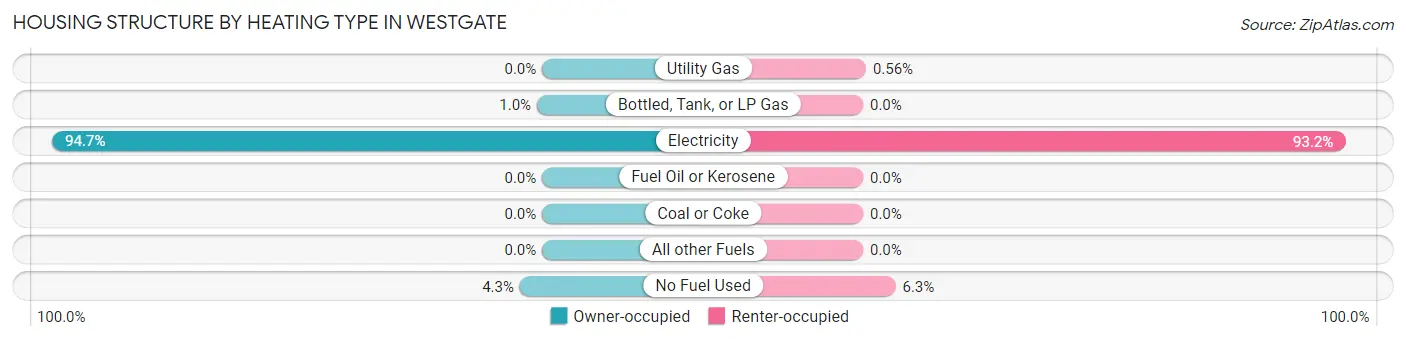
| Heating Type | Owner-occupied | Renter-occupied |
| Utility Gas | 0 (0.0%) | 8 (0.6%) |
| Bottled, Tank, or LP Gas | 9 (1.0%) | 0 (0.0%) |
| Electricity | 856 (94.7%) | 1,320 (93.1%) |
| Fuel Oil or Kerosene | 0 (0.0%) | 0 (0.0%) |
| Coal or Coke | 0 (0.0%) | 0 (0.0%) |
| All other Fuels | 0 (0.0%) | 0 (0.0%) |
| No Fuel Used | 39 (4.3%) | 89 (6.3%) |
| Total | 904 (100.0%) | 1,417 (100.0%) |
Household Vehicle Usage in Westgate
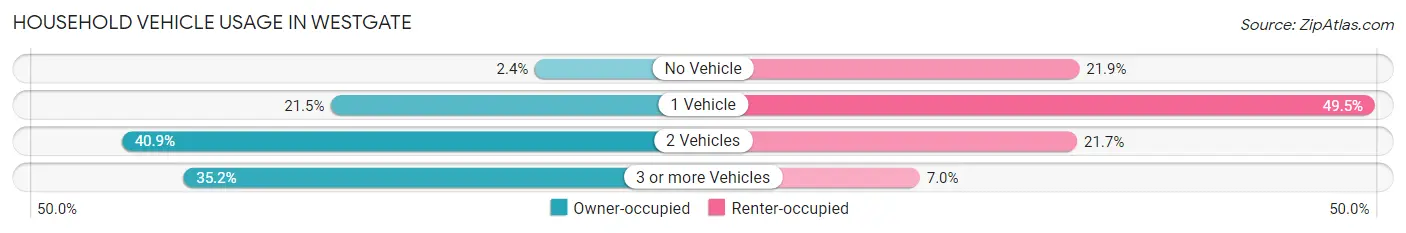
| Vehicles per Household | Owner-occupied | Renter-occupied |
| No Vehicle | 22 (2.4%) | 310 (21.9%) |
| 1 Vehicle | 194 (21.5%) | 701 (49.5%) |
| 2 Vehicles | 370 (40.9%) | 307 (21.7%) |
| 3 or more Vehicles | 318 (35.2%) | 99 (7.0%) |
| Total | 904 (100.0%) | 1,417 (100.0%) |
Real Estate & Mortgages in Westgate
Real Estate and Mortgage Overview in Westgate
| Characteristic | Without Mortgage | With Mortgage |
| Housing Units | 269 | 635 |
| Median Property Value | $169,100 | $225,700 |
| Median Household Income | $28,598 | $4 |
| Monthly Housing Costs | $405 | $0 |
| Real Estate Taxes | $1,337 | $5 |
Property Value by Mortgage Status in Westgate
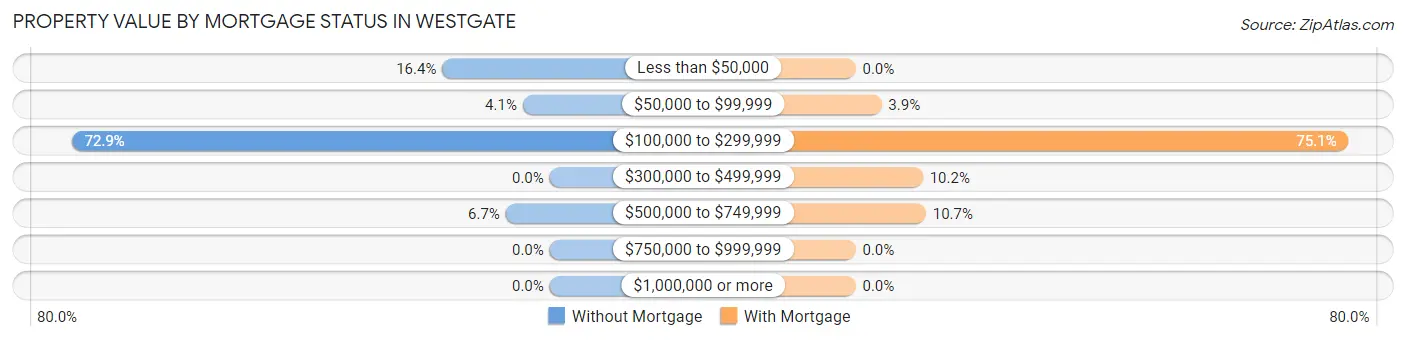
| Property Value | Without Mortgage | With Mortgage |
| Less than $50,000 | 44 (16.4%) | 0 (0.0%) |
| $50,000 to $99,999 | 11 (4.1%) | 25 (3.9%) |
| $100,000 to $299,999 | 196 (72.9%) | 477 (75.1%) |
| $300,000 to $499,999 | 0 (0.0%) | 65 (10.2%) |
| $500,000 to $749,999 | 18 (6.7%) | 68 (10.7%) |
| $750,000 to $999,999 | 0 (0.0%) | 0 (0.0%) |
| $1,000,000 or more | 0 (0.0%) | 0 (0.0%) |
| Total | 269 (100.0%) | 635 (100.0%) |
Household Income by Mortgage Status in Westgate
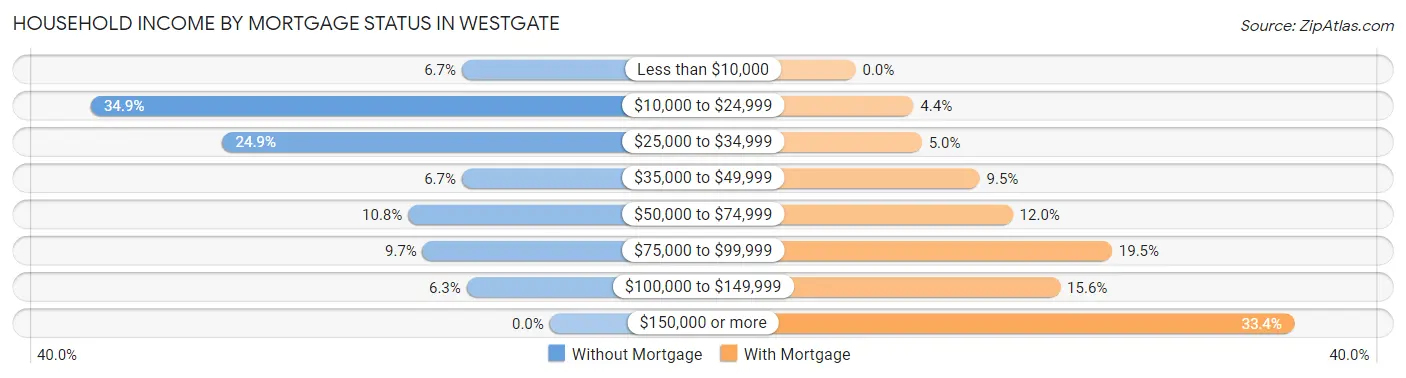
| Household Income | Without Mortgage | With Mortgage |
| Less than $10,000 | 18 (6.7%) | 0 (0.0%) |
| $10,000 to $24,999 | 94 (34.9%) | 28 (4.4%) |
| $25,000 to $34,999 | 67 (24.9%) | 32 (5.0%) |
| $35,000 to $49,999 | 18 (6.7%) | 60 (9.5%) |
| $50,000 to $74,999 | 29 (10.8%) | 76 (12.0%) |
| $75,000 to $99,999 | 26 (9.7%) | 124 (19.5%) |
| $100,000 to $149,999 | 17 (6.3%) | 99 (15.6%) |
| $150,000 or more | 0 (0.0%) | 212 (33.4%) |
| Total | 269 (100.0%) | 635 (100.0%) |
Property Value to Household Income Ratio in Westgate
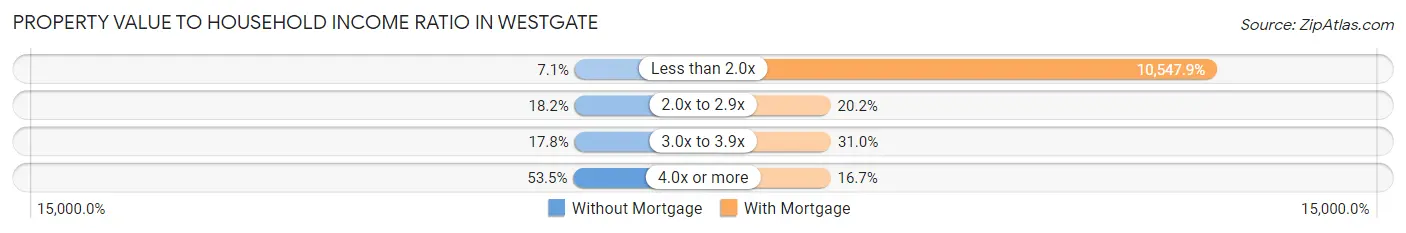
| Value-to-Income Ratio | Without Mortgage | With Mortgage |
| Less than 2.0x | 19 (7.1%) | 66,979 (10,547.9%) |
| 2.0x to 2.9x | 49 (18.2%) | 128 (20.2%) |
| 3.0x to 3.9x | 48 (17.8%) | 197 (31.0%) |
| 4.0x or more | 144 (53.5%) | 106 (16.7%) |
| Total | 269 (100.0%) | 635 (100.0%) |
Real Estate Taxes by Mortgage Status in Westgate
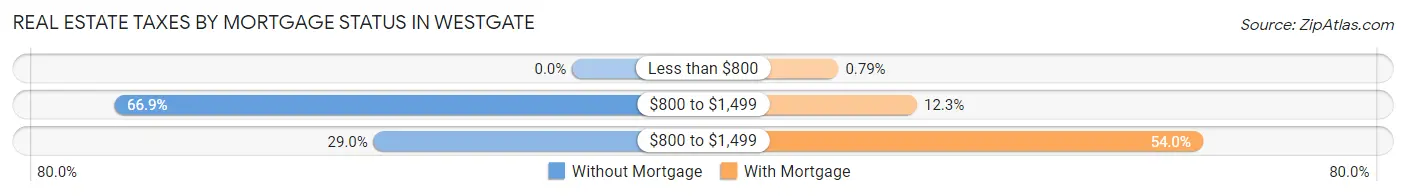
| Property Taxes | Without Mortgage | With Mortgage |
| Less than $800 | 0 (0.0%) | 5 (0.8%) |
| $800 to $1,499 | 180 (66.9%) | 78 (12.3%) |
| $800 to $1,499 | 78 (29.0%) | 343 (54.0%) |
| Total | 269 (100.0%) | 635 (100.0%) |
Health & Disability in Westgate
Health Insurance Coverage by Age in Westgate
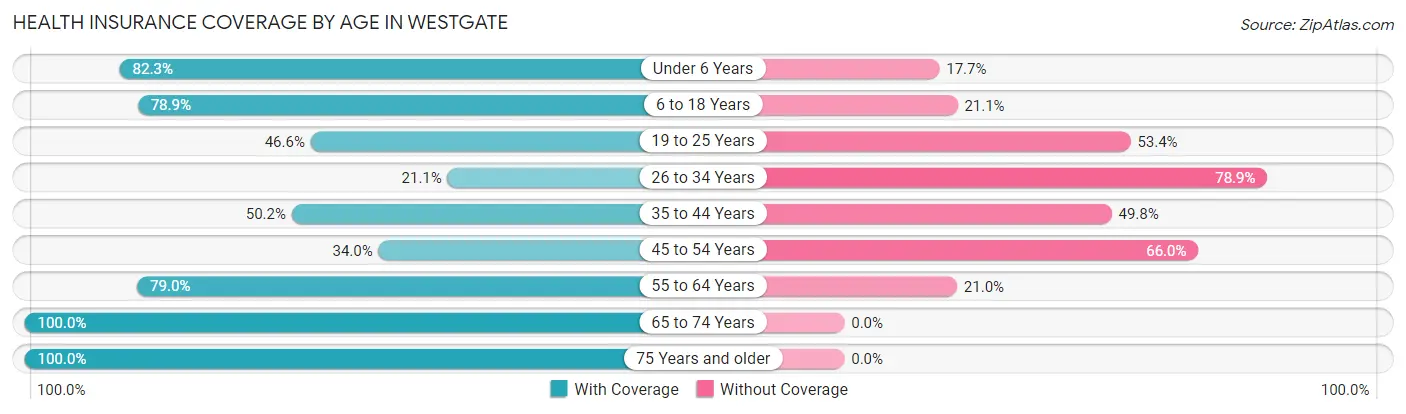
| Age Bracket | With Coverage | Without Coverage |
| Under 6 Years | 743 (82.3%) | 160 (17.7%) |
| 6 to 18 Years | 1,271 (78.9%) | 340 (21.1%) |
| 19 to 25 Years | 499 (46.6%) | 571 (53.4%) |
| 26 to 34 Years | 245 (21.1%) | 915 (78.9%) |
| 35 to 44 Years | 604 (50.2%) | 600 (49.8%) |
| 45 to 54 Years | 362 (34.0%) | 703 (66.0%) |
| 55 to 64 Years | 504 (79.0%) | 134 (21.0%) |
| 65 to 74 Years | 343 (100.0%) | 0 (0.0%) |
| 75 Years and older | 346 (100.0%) | 0 (0.0%) |
| Total | 4,917 (59.0%) | 3,423 (41.0%) |
Health Insurance Coverage by Citizenship Status in Westgate
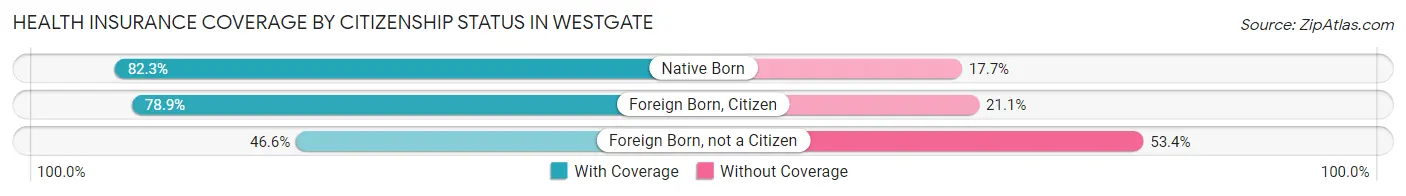
| Citizenship Status | With Coverage | Without Coverage |
| Native Born | 743 (82.3%) | 160 (17.7%) |
| Foreign Born, Citizen | 1,271 (78.9%) | 340 (21.1%) |
| Foreign Born, not a Citizen | 499 (46.6%) | 571 (53.4%) |
Health Insurance Coverage by Household Income in Westgate
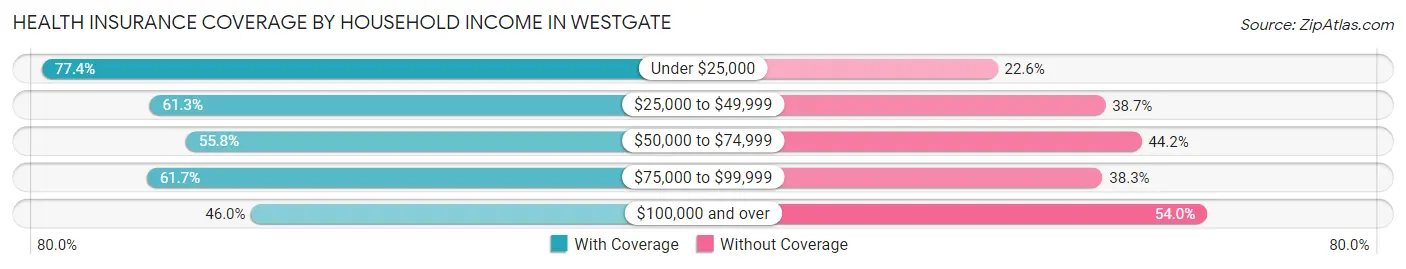
| Household Income | With Coverage | Without Coverage |
| Under $25,000 | 901 (77.4%) | 263 (22.6%) |
| $25,000 to $49,999 | 1,693 (61.3%) | 1,070 (38.7%) |
| $50,000 to $74,999 | 1,049 (55.8%) | 830 (44.2%) |
| $75,000 to $99,999 | 417 (61.7%) | 259 (38.3%) |
| $100,000 and over | 837 (46.0%) | 982 (54.0%) |
Public vs Private Health Insurance Coverage by Age in Westgate
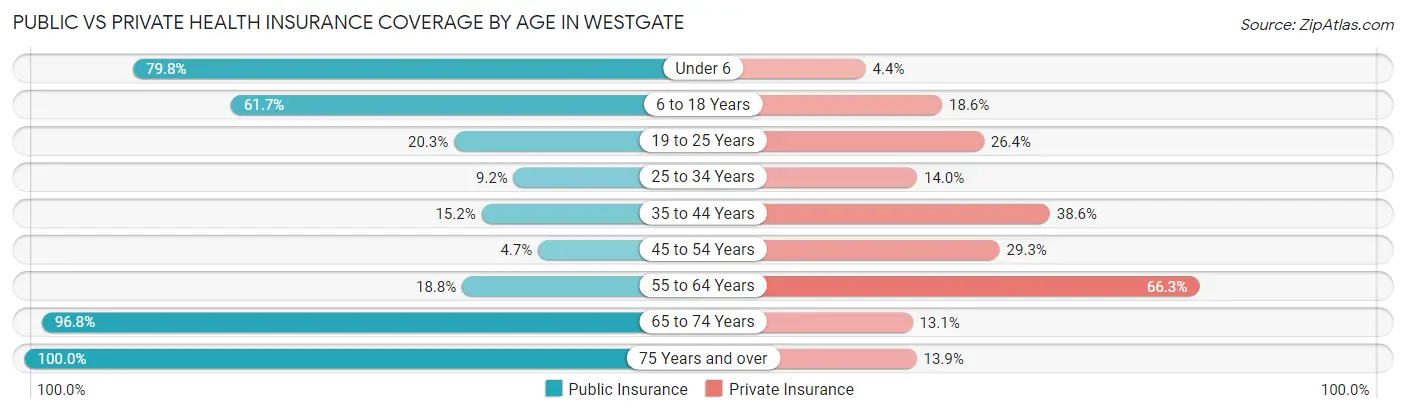
| Age Bracket | Public Insurance | Private Insurance |
| Under 6 | 721 (79.8%) | 40 (4.4%) |
| 6 to 18 Years | 994 (61.7%) | 300 (18.6%) |
| 19 to 25 Years | 217 (20.3%) | 282 (26.4%) |
| 25 to 34 Years | 107 (9.2%) | 162 (14.0%) |
| 35 to 44 Years | 183 (15.2%) | 465 (38.6%) |
| 45 to 54 Years | 50 (4.7%) | 312 (29.3%) |
| 55 to 64 Years | 120 (18.8%) | 423 (66.3%) |
| 65 to 74 Years | 332 (96.8%) | 45 (13.1%) |
| 75 Years and over | 346 (100.0%) | 48 (13.9%) |
| Total | 3,070 (36.8%) | 2,077 (24.9%) |
Disability Status by Sex by Age in Westgate
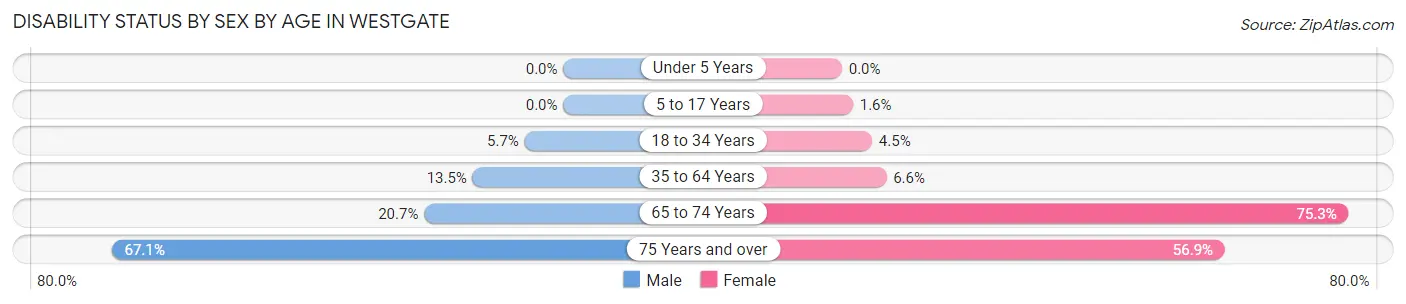
| Age Bracket | Male | Female |
| Under 5 Years | 0 (0.0%) | 0 (0.0%) |
| 5 to 17 Years | 0 (0.0%) | 14 (1.6%) |
| 18 to 34 Years | 81 (5.7%) | 39 (4.5%) |
| 35 to 64 Years | 171 (13.5%) | 108 (6.6%) |
| 65 to 74 Years | 50 (20.7%) | 76 (75.2%) |
| 75 Years and over | 159 (67.1%) | 62 (56.9%) |
Disability Class by Sex by Age in Westgate
Disability Class: Hearing Difficulty
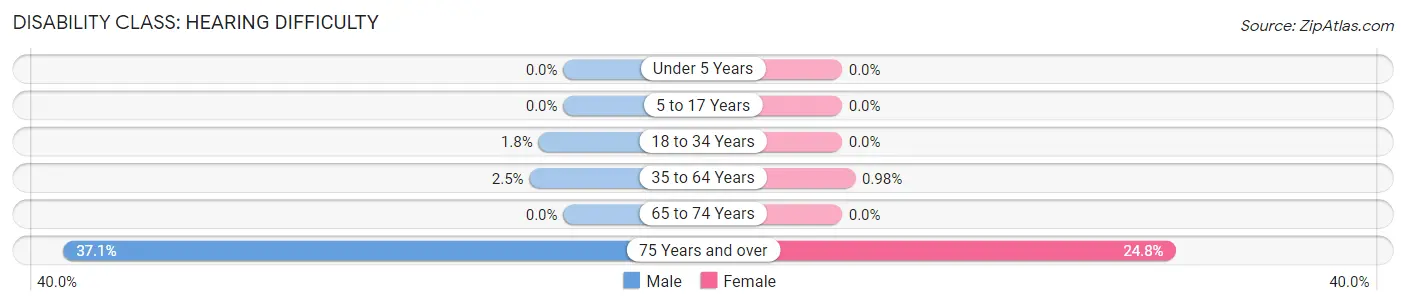
| Age Bracket | Male | Female |
| Under 5 Years | 0 (0.0%) | 0 (0.0%) |
| 5 to 17 Years | 0 (0.0%) | 0 (0.0%) |
| 18 to 34 Years | 26 (1.8%) | 0 (0.0%) |
| 35 to 64 Years | 32 (2.5%) | 16 (1.0%) |
| 65 to 74 Years | 0 (0.0%) | 0 (0.0%) |
| 75 Years and over | 88 (37.1%) | 27 (24.8%) |
Disability Class: Vision Difficulty
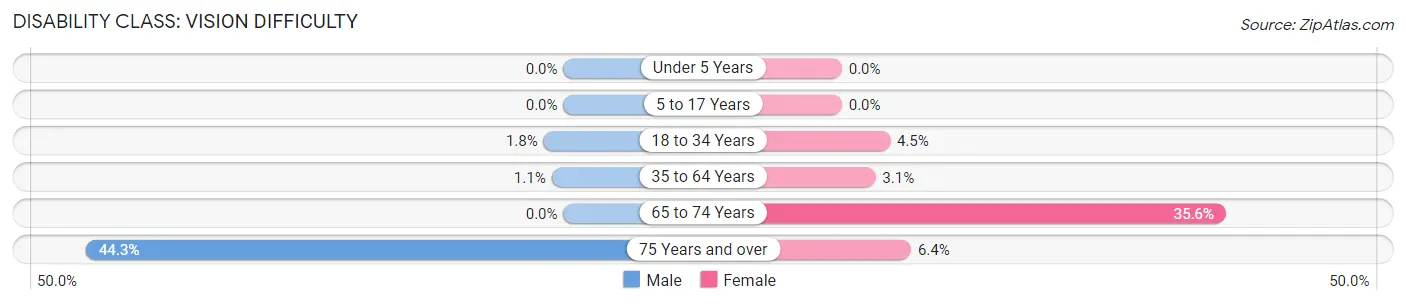
| Age Bracket | Male | Female |
| Under 5 Years | 0 (0.0%) | 0 (0.0%) |
| 5 to 17 Years | 0 (0.0%) | 0 (0.0%) |
| 18 to 34 Years | 26 (1.8%) | 39 (4.5%) |
| 35 to 64 Years | 14 (1.1%) | 51 (3.1%) |
| 65 to 74 Years | 0 (0.0%) | 36 (35.6%) |
| 75 Years and over | 105 (44.3%) | 7 (6.4%) |
Disability Class: Cognitive Difficulty
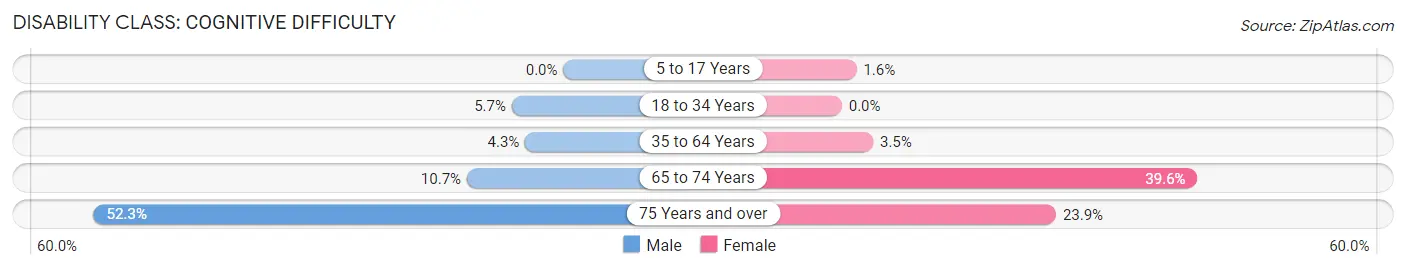
| Age Bracket | Male | Female |
| 5 to 17 Years | 0 (0.0%) | 14 (1.6%) |
| 18 to 34 Years | 81 (5.7%) | 0 (0.0%) |
| 35 to 64 Years | 54 (4.3%) | 57 (3.5%) |
| 65 to 74 Years | 26 (10.7%) | 40 (39.6%) |
| 75 Years and over | 124 (52.3%) | 26 (23.8%) |
Disability Class: Ambulatory Difficulty
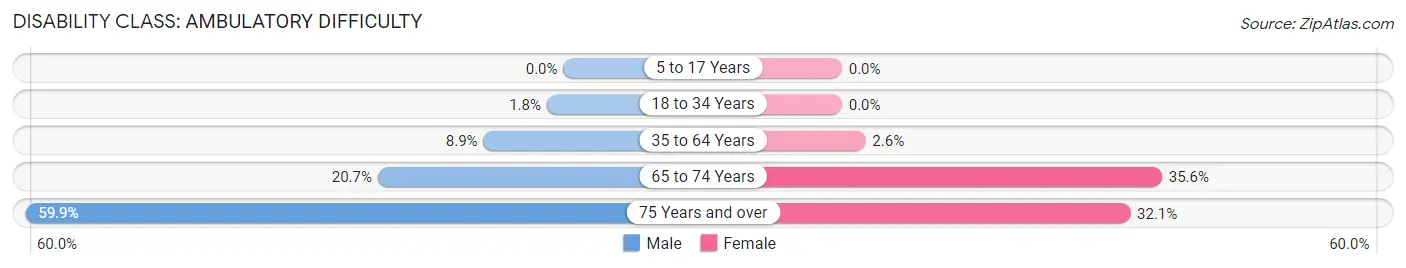
| Age Bracket | Male | Female |
| 5 to 17 Years | 0 (0.0%) | 0 (0.0%) |
| 18 to 34 Years | 26 (1.8%) | 0 (0.0%) |
| 35 to 64 Years | 113 (8.9%) | 43 (2.6%) |
| 65 to 74 Years | 50 (20.7%) | 36 (35.6%) |
| 75 Years and over | 142 (59.9%) | 35 (32.1%) |
Disability Class: Self-Care Difficulty
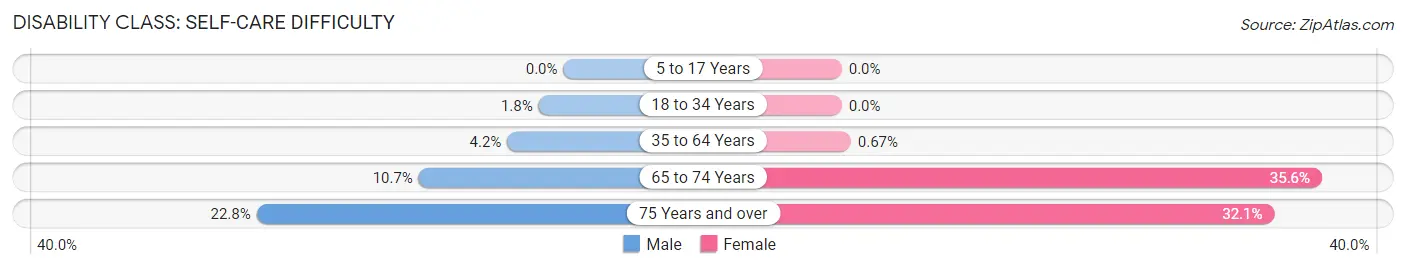
| Age Bracket | Male | Female |
| 5 to 17 Years | 0 (0.0%) | 0 (0.0%) |
| 18 to 34 Years | 26 (1.8%) | 0 (0.0%) |
| 35 to 64 Years | 53 (4.2%) | 11 (0.7%) |
| 65 to 74 Years | 26 (10.7%) | 36 (35.6%) |
| 75 Years and over | 54 (22.8%) | 35 (32.1%) |
Technology Access in Westgate
Computing Device Access in Westgate
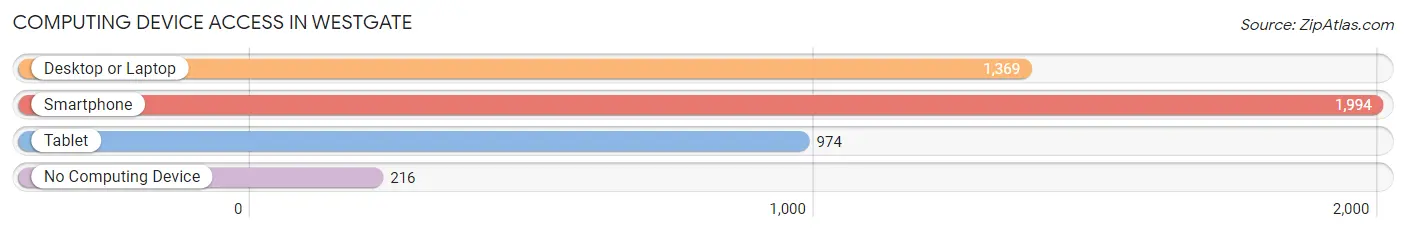
| Device Type | # Households | % Households |
| Desktop or Laptop | 1,369 | 59.0% |
| Smartphone | 1,994 | 85.9% |
| Tablet | 974 | 42.0% |
| No Computing Device | 216 | 9.3% |
| Total | 2,321 | 100.0% |
Internet Access in Westgate
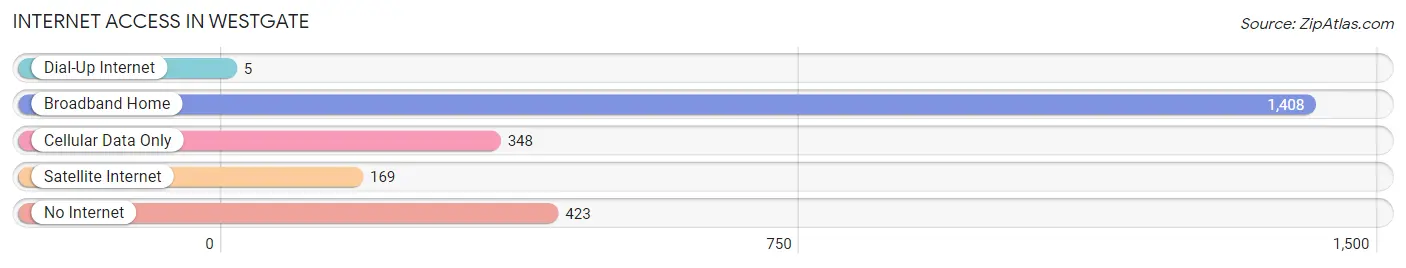
| Internet Type | # Households | % Households |
| Dial-Up Internet | 5 | 0.2% |
| Broadband Home | 1,408 | 60.7% |
| Cellular Data Only | 348 | 15.0% |
| Satellite Internet | 169 | 7.3% |
| No Internet | 423 | 18.2% |
| Total | 2,321 | 100.0% |
Westgate Summary
History
Westgate is a small unincorporated community located in the western part of Hillsborough County, Florida. It is situated on the banks of the Hillsborough River, just south of the city of Tampa. The area was first settled in the late 19th century by settlers from the nearby town of Tampa. The first settlers were mostly farmers and ranchers, who used the fertile land along the river to grow crops and raise livestock.
The area was originally known as Westgate Station, named after the railroad station that was built in the area in the late 1800s. The station was used to transport goods and passengers between Tampa and other nearby towns. The station was eventually abandoned in the early 1900s, but the name Westgate stuck.
In the early 1900s, the area began to develop as a residential community. The first homes were built along the river, and the area quickly grew in popularity. By the mid-1900s, Westgate had become a popular destination for tourists and vacationers. The area was known for its beautiful scenery and its proximity to Tampa.
In the late 1900s, Westgate began to experience rapid growth. The area was annexed by the city of Tampa in the late 1990s, and the population of Westgate has continued to grow ever since. Today, Westgate is a vibrant community with a population of over 10,000 people.
Geography
Westgate is located in the western part of Hillsborough County, Florida. It is situated on the banks of the Hillsborough River, just south of the city of Tampa. The area is mostly flat, with some rolling hills in the northern part of the community. The area is known for its lush vegetation and its abundance of wildlife.
The climate in Westgate is subtropical, with hot and humid summers and mild winters. The average temperature in the summer is around 90 degrees Fahrenheit, and the average temperature in the winter is around 70 degrees Fahrenheit. The area receives an average of 50 inches of rain per year.
Economy
Westgate is primarily a residential community, but it does have a few businesses. The area is home to several restaurants, bars, and retail stores. There is also a small industrial park located in the area.
The economy of Westgate is largely driven by tourism. The area is a popular destination for vacationers and tourists, and it is home to several resorts and hotels. The area is also known for its abundance of outdoor activities, such as fishing, boating, and hiking.
Demographics
As of the 2010 census, the population of Westgate was 10,845. The population is mostly white (77.3%), followed by Hispanic or Latino (14.2%), African American (4.3%), and Asian (2.2%). The median household income in Westgate is $50,945, and the median home value is $179,400. The area is mostly made up of families, with the majority of households (63.3%) having children under the age of 18.
Common Questions
What is the Total Population of Westgate?
Total Population of Westgate is 8,340.
What is the Total Male Population of Westgate?
Total Male Population of Westgate is 4,392.
What is the Total Female Population of Westgate?
Total Female Population of Westgate is 3,948.
What is the Ratio of Males per 100 Females in Westgate?
There are 111.25 Males per 100 Females in Westgate.
What is the Ratio of Females per 100 Males in Westgate?
There are 89.89 Females per 100 Males in Westgate.
What is the Median Population Age in Westgate?
Median Population Age in Westgate is 30.6 Years.
What is the Average Family Size in Westgate
Average Family Size in Westgate is 4.0 People.
What is the Average Household Size in Westgate
Average Household Size in Westgate is 3.6 People.
What is Per Capita Income in Westgate?
Per Capita income in Westgate is $16,354.
What is the Median Family Income in Westgate?
Median Family Income in Westgate is $44,190.
What is the Median Household income in Westgate?
Median Household Income in Westgate is $42,449.
What is Income or Wage Gap in Westgate?
Income or Wage Gap in Westgate is 8.4%.
Women in Westgate earn 91.6 cents for every dollar earned by a man.
What is Family Income Deficit in Westgate?
Family Income Deficit in Westgate is $9,282.
Families that are below poverty line in Westgate earn $9,282 less on average than the poverty threshold level.
What is Inequality or Gini Index in Westgate?
Inequality or Gini Index in Westgate is 0.38.
How Large is the Labor Force in Westgate?
There are 4,533 People in the Labor Forcein in Westgate.
What is the Percentage of People in the Labor Force in Westgate?
74.5% of People are in the Labor Force in Westgate.
What is the Unemployment Rate in Westgate?
Unemployment Rate in Westgate is 8.6%.