Zip Codes with the Most Immigrants from South America in Germantown, TN
RELATED REPORTS & OPTIONS
South America
Germantown
Compare Zip Codes
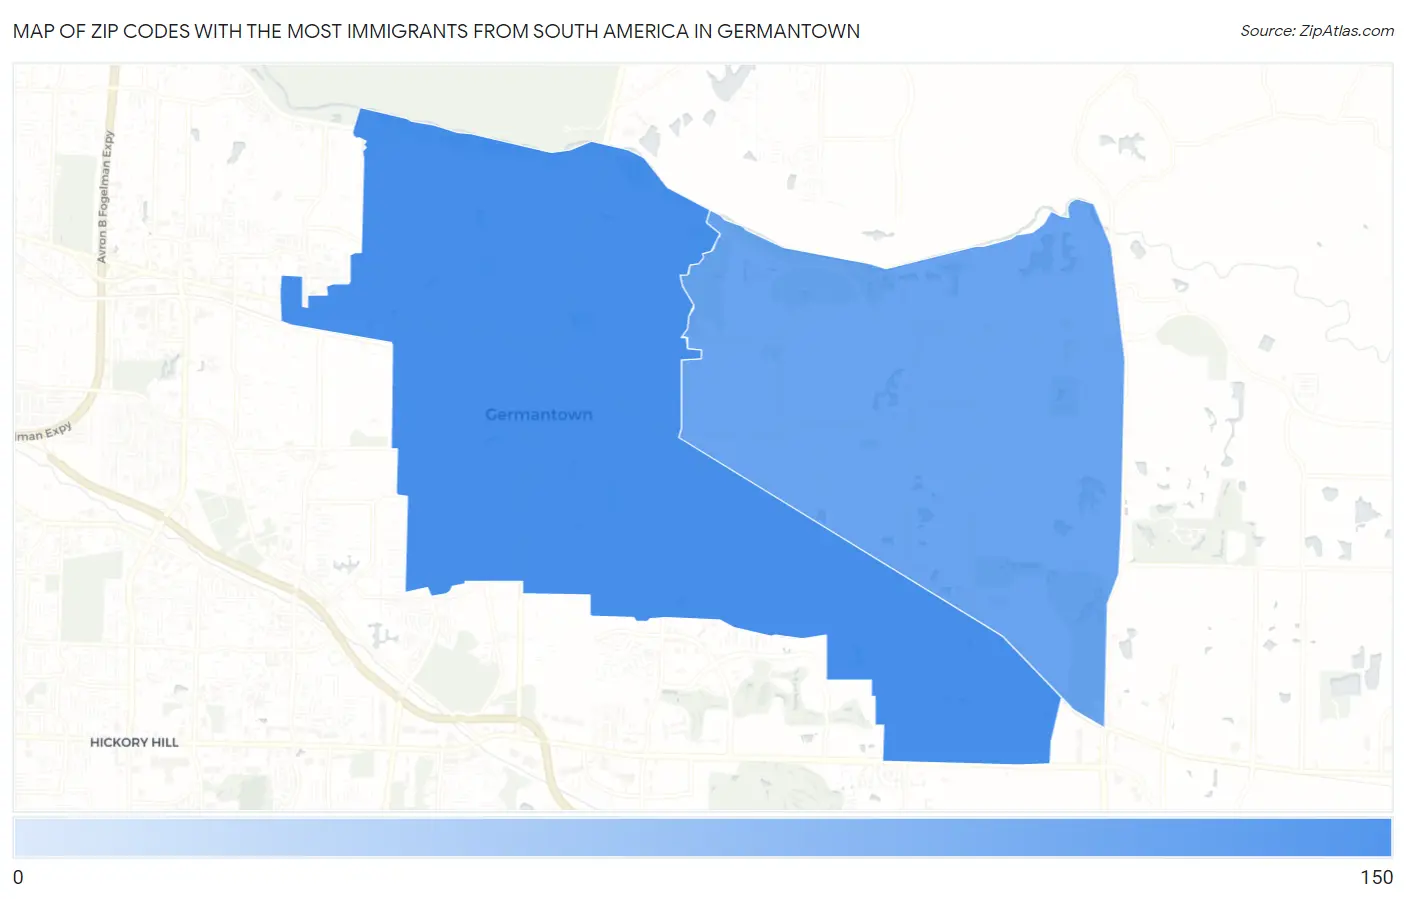
Map of Zip Codes with the Most Immigrants from South America in Germantown
0
150
Zip Codes with the Most Immigrants from South America in Germantown, TN
| Zip Code | South America | vs State | vs National | |
| 1. | 38138 | 125 | 19,271(0.65%)#46 | 3,636,375(0.00%)#4,486 |
| 2. | 38139 | 39 | 19,271(0.20%)#106 | 3,636,375(0.00%)#7,350 |
1
Common Questions
What are the Top Zip Codes with the Most Immigrants from South America in Germantown, TN?
Top Zip Codes with the Most Immigrants from South America in Germantown, TN are:
What zip code has the Most Immigrants from South America in Germantown, TN?
38138 has the Most Immigrants from South America in Germantown, TN with 125.
What is the Total Immigrants from South America in Germantown, TN?
Total Immigrants from South America in Germantown is 164.
What is the Total Immigrants from South America in Tennessee?
Total Immigrants from South America in Tennessee is 19,271.
What is the Total Immigrants from South America in the United States?
Total Immigrants from South America in the United States is 3,636,375.