Central, TN
Central Map
Central Overview
1,942
TOTAL POPULATION
830
MALE POPULATION
1,112
FEMALE POPULATION
74.64
MALES / 100 FEMALES
133.98
FEMALES / 100 MALES
54.7
MEDIAN AGE
2.8
AVG FAMILY SIZE
2.1
AVG HOUSEHOLD SIZE
$24,428
PER CAPITA INCOME
$57,045
AVG FAMILY INCOME
$38,690
AVG HOUSEHOLD INCOME
25.0%
WAGE / INCOME GAP [ % ]
75.0¢/ $1
WAGE / INCOME GAP [ $ ]
0.42
INEQUALITY / GINI INDEX
871
LABOR FORCE [ PEOPLE ]
49.7%
PERCENT IN LABOR FORCE
4.6%
UNEMPLOYMENT RATE
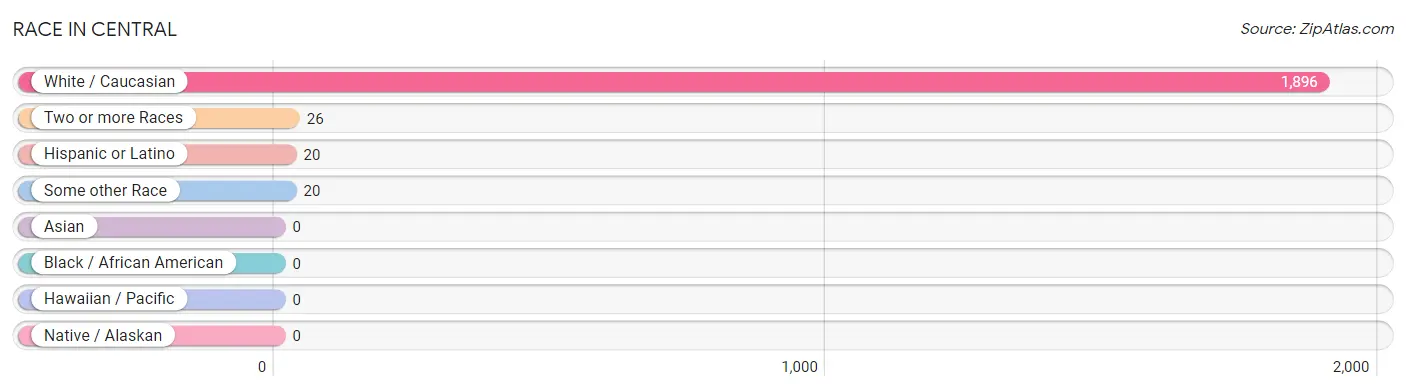
Race in Central
The most populous races in Central are White / Caucasian (1,896 | 97.6%), Two or more Races (26 | 1.3%), and Hispanic or Latino (20 | 1.0%).
| Race | # Population | % Population |
| Asian | 0 | 0.0% |
| Black / African American | 0 | 0.0% |
| Hawaiian / Pacific | 0 | 0.0% |
| Hispanic or Latino | 20 | 1.0% |
| Native / Alaskan | 0 | 0.0% |
| White / Caucasian | 1,896 | 97.6% |
| Two or more Races | 26 | 1.3% |
| Some other Race | 20 | 1.0% |
| Total | 1,942 | 100.0% |
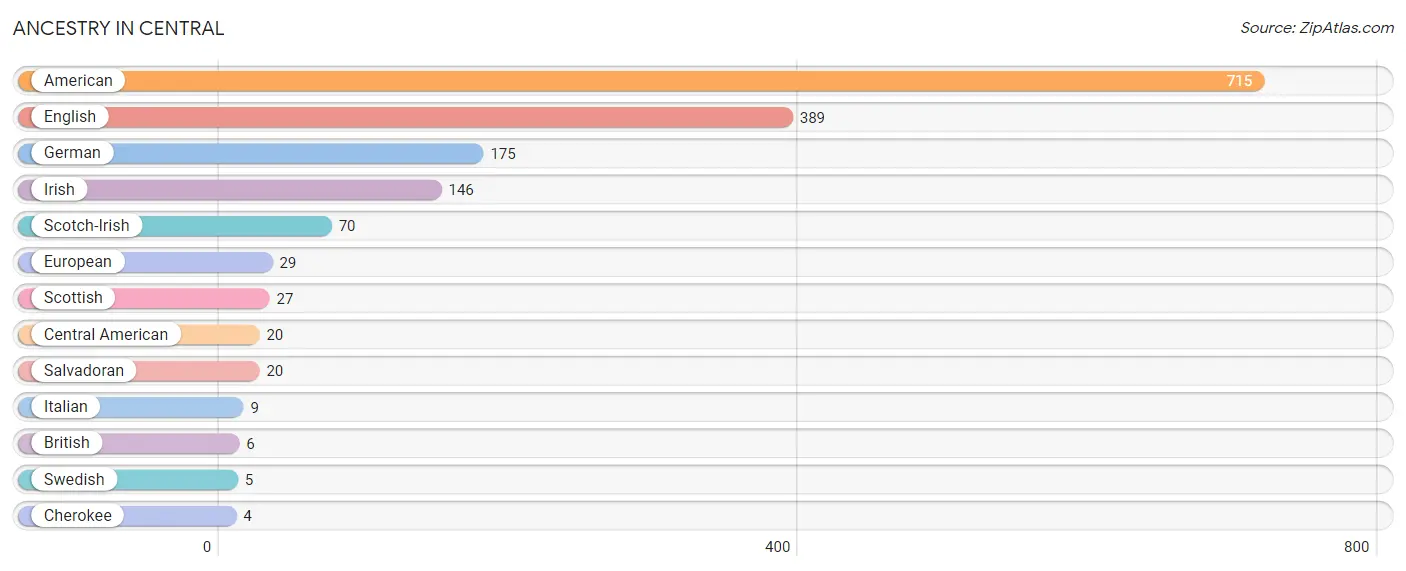
Ancestry in Central
The most populous ancestries reported in Central are American (715 | 36.8%), English (389 | 20.0%), German (175 | 9.0%), Irish (146 | 7.5%), and Scotch-Irish (70 | 3.6%), together accounting for 77.0% of all Central residents.
| Ancestry | # Population | % Population |
| American | 715 | 36.8% |
| British | 6 | 0.3% |
| Central American | 20 | 1.0% |
| Cherokee | 4 | 0.2% |
| English | 389 | 20.0% |
| European | 29 | 1.5% |
| German | 175 | 9.0% |
| Irish | 146 | 7.5% |
| Italian | 9 | 0.5% |
| Salvadoran | 20 | 1.0% |
| Scotch-Irish | 70 | 3.6% |
| Scottish | 27 | 1.4% |
| Swedish | 5 | 0.3% | View All 13 Rows |
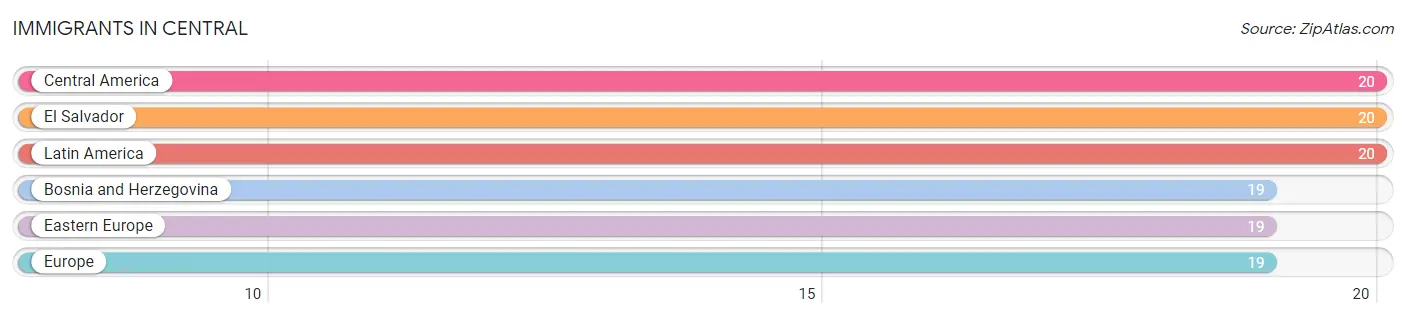
Immigrants in Central
The most numerous immigrant groups reported in Central came from Central America (20 | 1.0%), El Salvador (20 | 1.0%), Latin America (20 | 1.0%), Bosnia and Herzegovina (19 | 1.0%), and Eastern Europe (19 | 1.0%), together accounting for 5.1% of all Central residents.
| Immigration Origin | # Population | % Population |
| Bosnia and Herzegovina | 19 | 1.0% |
| Central America | 20 | 1.0% |
| Eastern Europe | 19 | 1.0% |
| El Salvador | 20 | 1.0% |
| Europe | 19 | 1.0% |
| Latin America | 20 | 1.0% | View All 6 Rows |
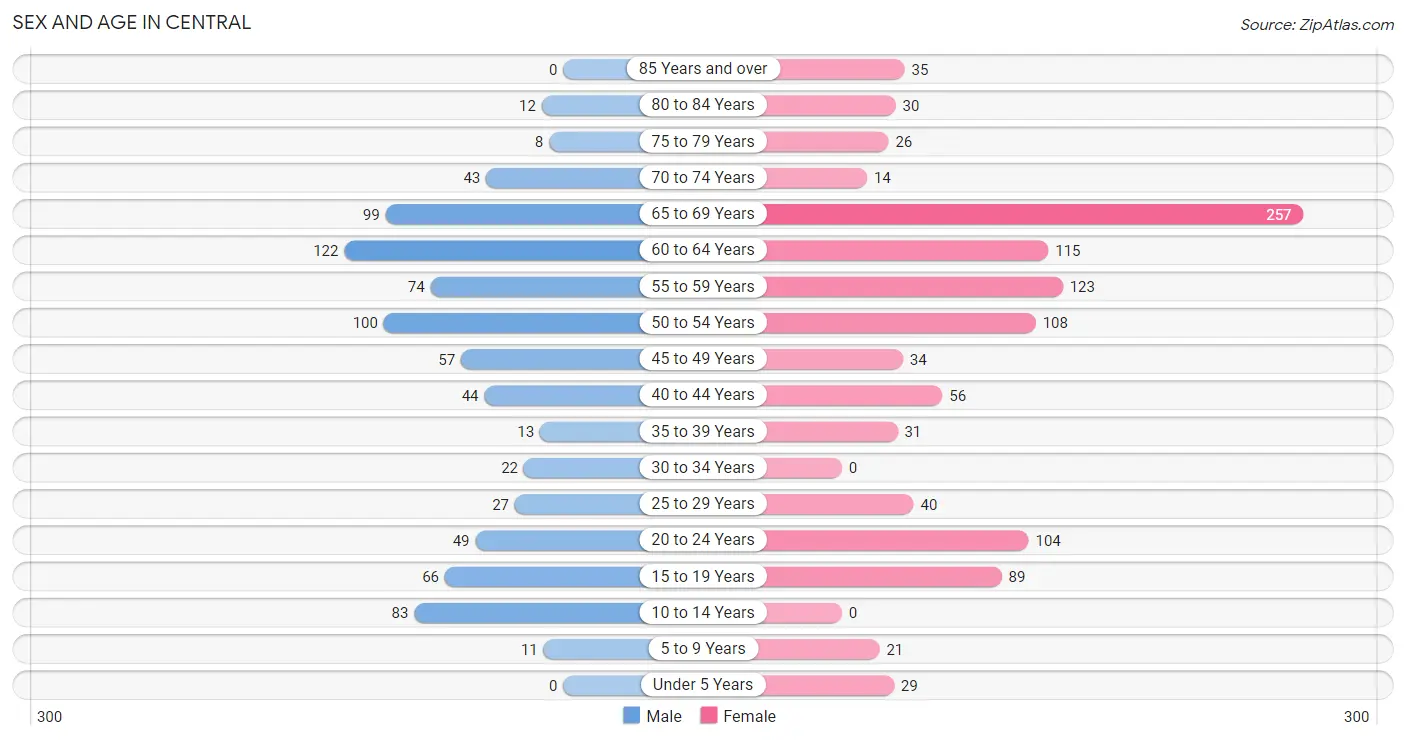
Sex and Age in Central
Sex and Age in Central
The most populous age groups in Central are 60 to 64 Years (122 | 14.7%) for men and 65 to 69 Years (257 | 23.1%) for women.
| Age Bracket | Male | Female |
| Under 5 Years | 0 (0.0%) | 29 (2.6%) |
| 5 to 9 Years | 11 (1.3%) | 21 (1.9%) |
| 10 to 14 Years | 83 (10.0%) | 0 (0.0%) |
| 15 to 19 Years | 66 (8.0%) | 89 (8.0%) |
| 20 to 24 Years | 49 (5.9%) | 104 (9.3%) |
| 25 to 29 Years | 27 (3.3%) | 40 (3.6%) |
| 30 to 34 Years | 22 (2.6%) | 0 (0.0%) |
| 35 to 39 Years | 13 (1.6%) | 31 (2.8%) |
| 40 to 44 Years | 44 (5.3%) | 56 (5.0%) |
| 45 to 49 Years | 57 (6.9%) | 34 (3.1%) |
| 50 to 54 Years | 100 (12.0%) | 108 (9.7%) |
| 55 to 59 Years | 74 (8.9%) | 123 (11.1%) |
| 60 to 64 Years | 122 (14.7%) | 115 (10.3%) |
| 65 to 69 Years | 99 (11.9%) | 257 (23.1%) |
| 70 to 74 Years | 43 (5.2%) | 14 (1.3%) |
| 75 to 79 Years | 8 (1.0%) | 26 (2.3%) |
| 80 to 84 Years | 12 (1.5%) | 30 (2.7%) |
| 85 Years and over | 0 (0.0%) | 35 (3.2%) |
| Total | 830 (100.0%) | 1,112 (100.0%) |
Families and Households in Central
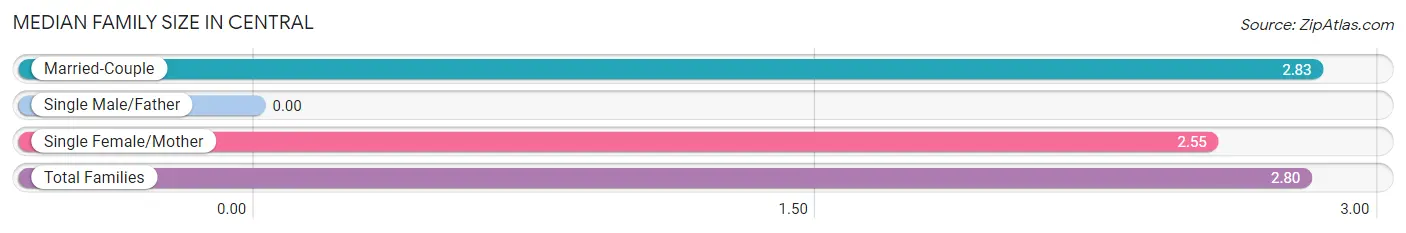
Median Family Size in Central
| Family Type | # Families | Family Size |
| Married-Couple | 434 (88.2%) | 2.83 |
| Single Male/Father | 0 (0.0%) | - |
| Single Female/Mother | 58 (11.8%) | 2.55 |
| Total Families | 492 (100.0%) | 2.80 |
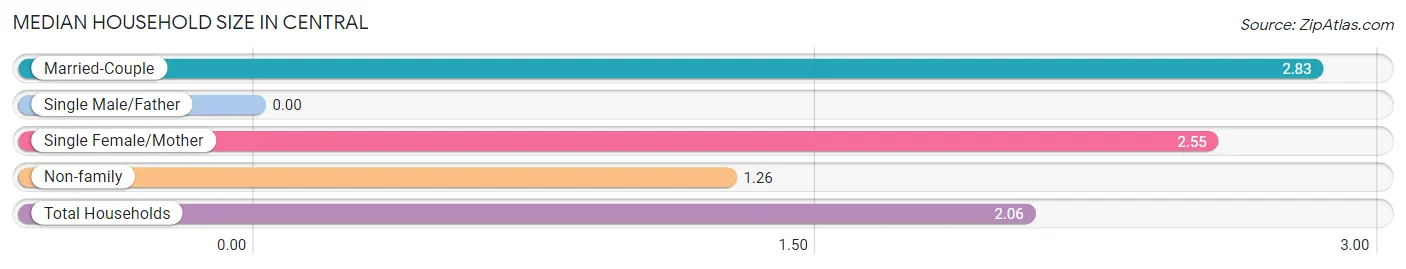
Median Household Size in Central
| Household Type | # Households | Household Size |
| Married-Couple | 434 (46.1%) | 2.83 |
| Single Male/Father | 0 (0.0%) | - |
| Single Female/Mother | 58 (6.2%) | 2.55 |
| Non-family | 450 (47.8%) | 1.26 |
| Total Households | 942 (100.0%) | 2.06 |
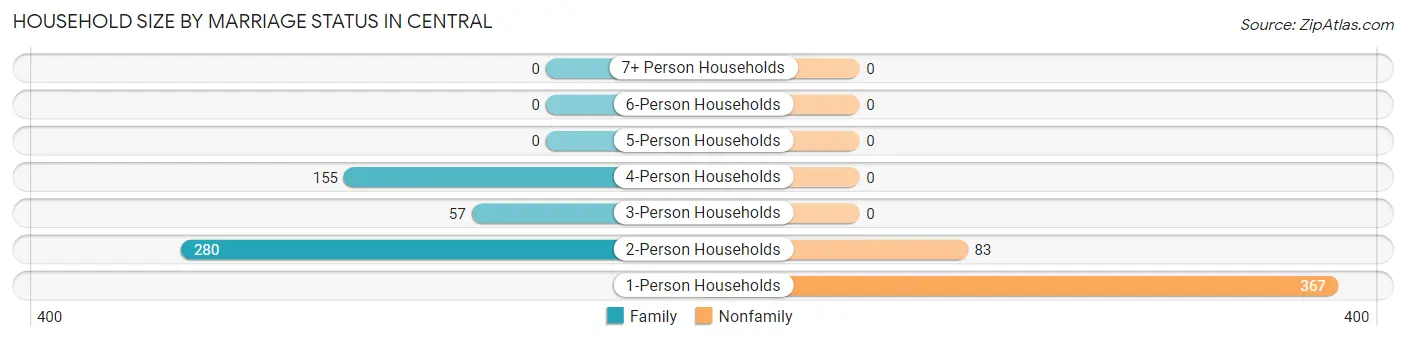
Household Size by Marriage Status in Central
Out of a total of 942 households in Central, 492 (52.2%) are family households, while 450 (47.8%) are nonfamily households. The most numerous type of family households are 2-person households, comprising 280, and the most common type of nonfamily households are 1-person households, comprising 367.
| Household Size | Family Households | Nonfamily Households |
| 1-Person Households | - | 367 (39.0%) |
| 2-Person Households | 280 (29.7%) | 83 (8.8%) |
| 3-Person Households | 57 (6.0%) | 0 (0.0%) |
| 4-Person Households | 155 (16.5%) | 0 (0.0%) |
| 5-Person Households | 0 (0.0%) | 0 (0.0%) |
| 6-Person Households | 0 (0.0%) | 0 (0.0%) |
| 7+ Person Households | 0 (0.0%) | 0 (0.0%) |
| Total | 492 (52.2%) | 450 (47.8%) |
Female Fertility in Central
Fertility by Age in Central
| Age Bracket | Women with Births | Births / 1,000 Women |
| 15 to 19 years | 0 (0.0%) | 0.0 |
| 20 to 34 years | 0 (0.0%) | 0.0 |
| 35 to 50 years | 0 (0.0%) | 0.0 |
| Total | 0 (0.0%) | 0.0 |
Fertility by Age by Marriage Status in Central
| Age Bracket | Married | Unmarried |
| 15 to 19 years | 0 (0.0%) | 0 (0.0%) |
| 20 to 34 years | 0 (0.0%) | 0 (0.0%) |
| 35 to 50 years | 0 (0.0%) | 0 (0.0%) |
| Total | 0 (0.0%) | 0 (0.0%) |
Fertility by Education in Central
| Educational Attainment | Women with Births | Births / 1,000 Women |
| Less than High School | 0 (0.0%) | 0.0 |
| High School Diploma | 0 (0.0%) | 0.0 |
| College or Associate's Degree | 0 (0.0%) | 0.0 |
| Bachelor's Degree | 0 (0.0%) | 0.0 |
| Graduate Degree | 0 (0.0%) | 0.0 |
| Total | 0 (0.0%) | 0.0 |
Fertility by Education by Marriage Status in Central
| Educational Attainment | Married | Unmarried |
| Less than High School | 0 (0.0%) | 0 (0.0%) |
| High School Diploma | 0 (0.0%) | 0 (0.0%) |
| College or Associate's Degree | 0 (0.0%) | 0 (0.0%) |
| Bachelor's Degree | 0 (0.0%) | 0 (0.0%) |
| Graduate Degree | 0 (0.0%) | 0 (0.0%) |
| Total | 0 (0.0%) | 0 (0.0%) |
Income in Central
Income Overview in Central
Per Capita Income in Central is $24,428, while median incomes of families and households are $57,045 and $38,690 respectively.
| Characteristic | Number | Measure |
| Per Capita Income | 1,942 | $24,428 |
| Median Family Income | 492 | $57,045 |
| Mean Family Income | 492 | $64,399 |
| Median Household Income | 942 | $38,690 |
| Mean Household Income | 942 | $49,670 |
| Income Deficit | 492 | $0 |
| Wage / Income Gap (%) | 1,942 | 25.05% |
| Wage / Income Gap ($) | 1,942 | 74.95¢ per $1 |
| Gini / Inequality Index | 1,942 | 0.42 |
Earnings by Sex in Central
Average Earnings in Central are $34,526, $41,477 for men and $31,089 for women, a difference of 25.1%.
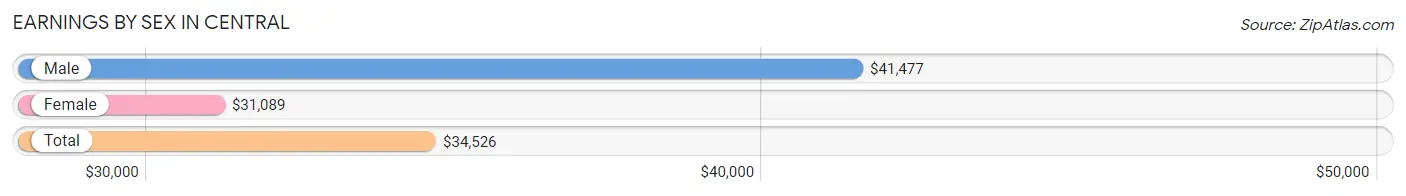
| Sex | Number | Average Earnings |
| Male | 381 (44.8%) | $41,477 |
| Female | 469 (55.2%) | $31,089 |
| Total | 850 (100.0%) | $34,526 |
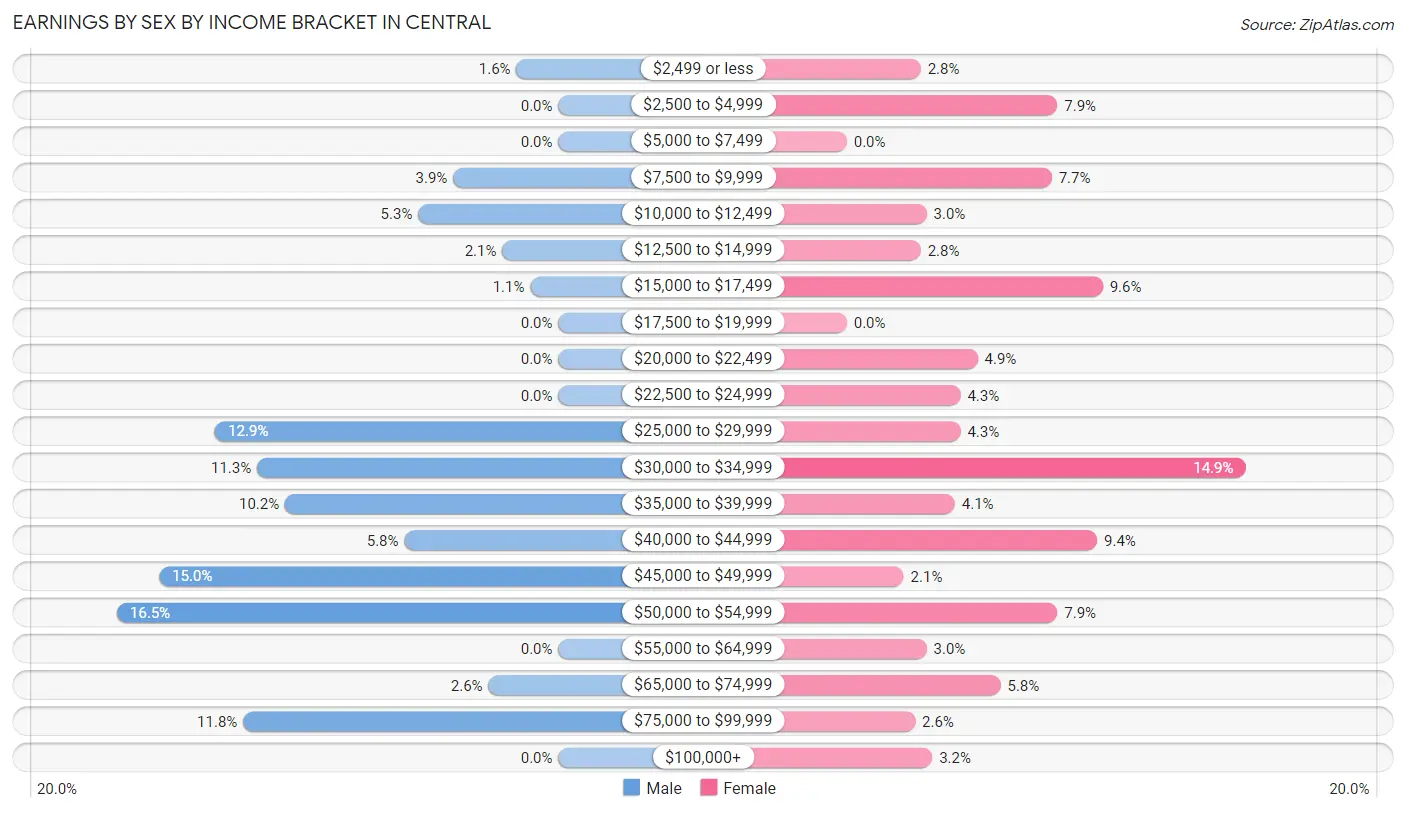
Earnings by Sex by Income Bracket in Central
The most common earnings brackets in Central are $50,000 to $54,999 for men (63 | 16.5%) and $30,000 to $34,999 for women (70 | 14.9%).
| Income | Male | Female |
| $2,499 or less | 6 (1.6%) | 13 (2.8%) |
| $2,500 to $4,999 | 0 (0.0%) | 37 (7.9%) |
| $5,000 to $7,499 | 0 (0.0%) | 0 (0.0%) |
| $7,500 to $9,999 | 15 (3.9%) | 36 (7.7%) |
| $10,000 to $12,499 | 20 (5.2%) | 14 (3.0%) |
| $12,500 to $14,999 | 8 (2.1%) | 13 (2.8%) |
| $15,000 to $17,499 | 4 (1.1%) | 45 (9.6%) |
| $17,500 to $19,999 | 0 (0.0%) | 0 (0.0%) |
| $20,000 to $22,499 | 0 (0.0%) | 23 (4.9%) |
| $22,500 to $24,999 | 0 (0.0%) | 20 (4.3%) |
| $25,000 to $29,999 | 49 (12.9%) | 20 (4.3%) |
| $30,000 to $34,999 | 43 (11.3%) | 70 (14.9%) |
| $35,000 to $39,999 | 39 (10.2%) | 19 (4.1%) |
| $40,000 to $44,999 | 22 (5.8%) | 44 (9.4%) |
| $45,000 to $49,999 | 57 (15.0%) | 10 (2.1%) |
| $50,000 to $54,999 | 63 (16.5%) | 37 (7.9%) |
| $55,000 to $64,999 | 0 (0.0%) | 14 (3.0%) |
| $65,000 to $74,999 | 10 (2.6%) | 27 (5.8%) |
| $75,000 to $99,999 | 45 (11.8%) | 12 (2.6%) |
| $100,000+ | 0 (0.0%) | 15 (3.2%) |
| Total | 381 (100.0%) | 469 (100.0%) |
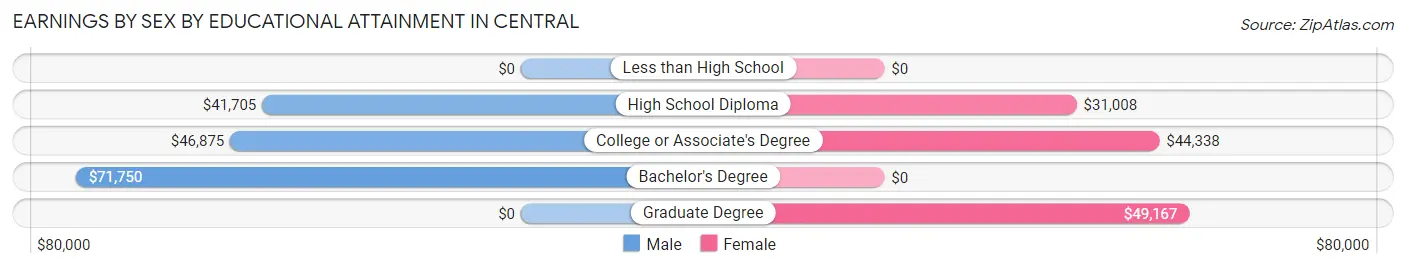
Earnings by Sex by Educational Attainment in Central
Average earnings in Central are $44,205 for men and $34,712 for women, a difference of 21.5%. Men with an educational attainment of bachelor's degree enjoy the highest average annual earnings of $71,750, while those with high school diploma education earn the least with $41,705. Women with an educational attainment of graduate degree earn the most with the average annual earnings of $49,167, while those with high school diploma education have the smallest earnings of $31,008.
| Educational Attainment | Male Income | Female Income |
| Less than High School | - | - |
| High School Diploma | $41,705 | $31,008 |
| College or Associate's Degree | $46,875 | $44,338 |
| Bachelor's Degree | $71,750 | $0 |
| Graduate Degree | - | - |
| Total | $44,205 | $34,712 |
Family Income in Central
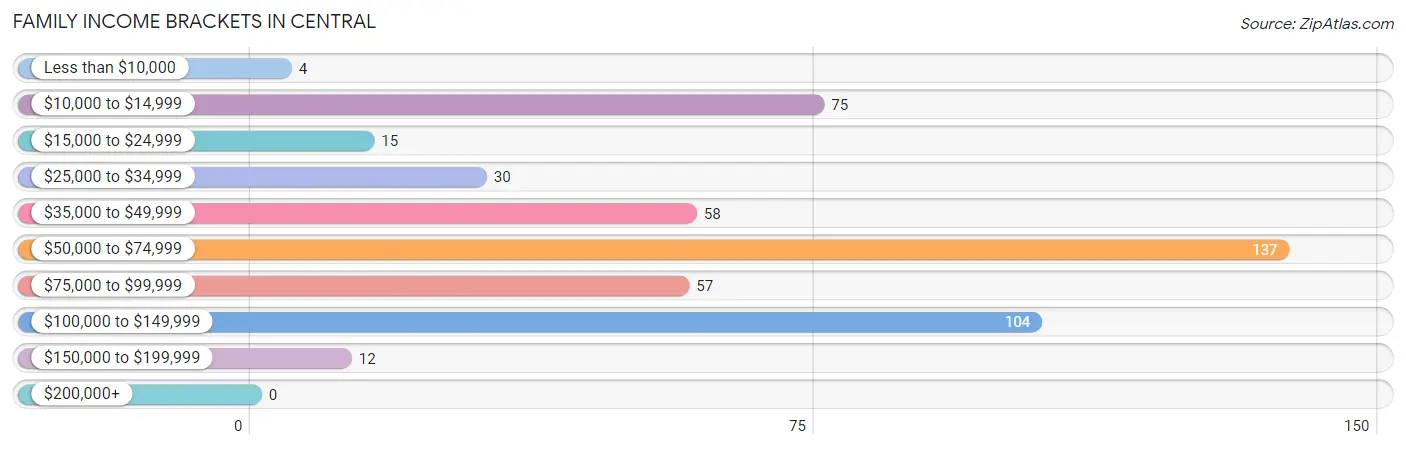
Family Income Brackets in Central
According to the Central family income data, there are 137 families falling into the $50,000 to $74,999 income range, which is the most common income bracket and makes up 27.9% of all families.
| Income Bracket | # Families | % Families |
| Less than $10,000 | 4 | 0.8% |
| $10,000 to $14,999 | 75 | 15.2% |
| $15,000 to $24,999 | 15 | 3.0% |
| $25,000 to $34,999 | 30 | 6.1% |
| $35,000 to $49,999 | 58 | 11.8% |
| $50,000 to $74,999 | 137 | 27.8% |
| $75,000 to $99,999 | 57 | 11.6% |
| $100,000 to $149,999 | 104 | 21.1% |
| $150,000 to $199,999 | 12 | 2.4% |
| $200,000+ | 0 | 0.0% |
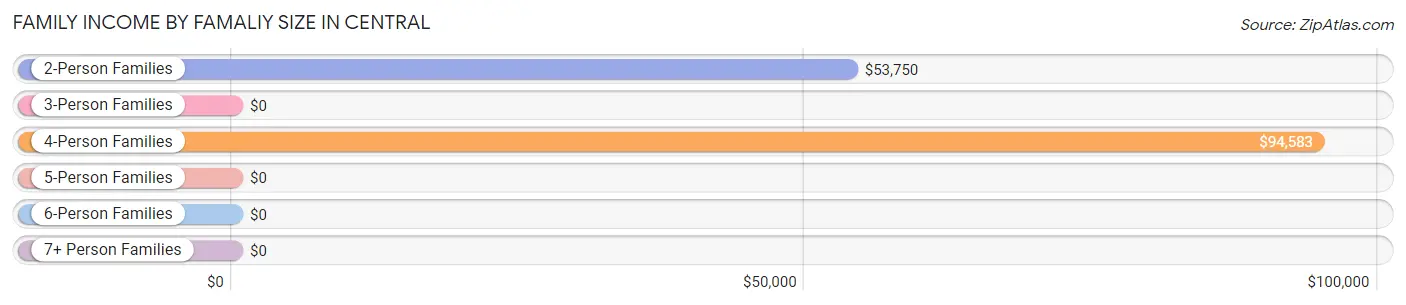
Family Income by Famaliy Size in Central
4-person families (155 | 31.5%) account for the highest median family income in Central with $94,583 per family, while 2-person families (280 | 56.9%) have the highest median income of $26,875 per family member.
| Income Bracket | # Families | Median Income |
| 2-Person Families | 280 (56.9%) | $53,750 |
| 3-Person Families | 57 (11.6%) | $0 |
| 4-Person Families | 155 (31.5%) | $94,583 |
| 5-Person Families | 0 (0.0%) | $0 |
| 6-Person Families | 0 (0.0%) | $0 |
| 7+ Person Families | 0 (0.0%) | $0 |
| Total | 492 (100.0%) | $57,045 |
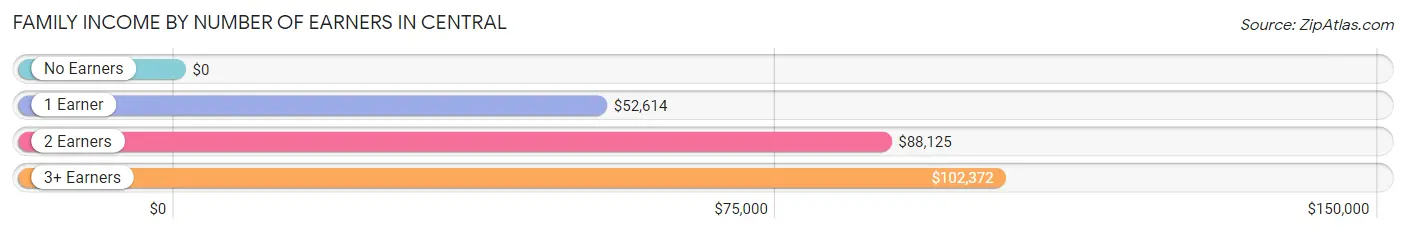
Family Income by Number of Earners in Central
| Number of Earners | # Families | Median Income |
| No Earners | 146 (29.7%) | $0 |
| 1 Earner | 150 (30.5%) | $52,614 |
| 2 Earners | 122 (24.8%) | $88,125 |
| 3+ Earners | 74 (15.0%) | $102,372 |
| Total | 492 (100.0%) | $57,045 |
Household Income in Central
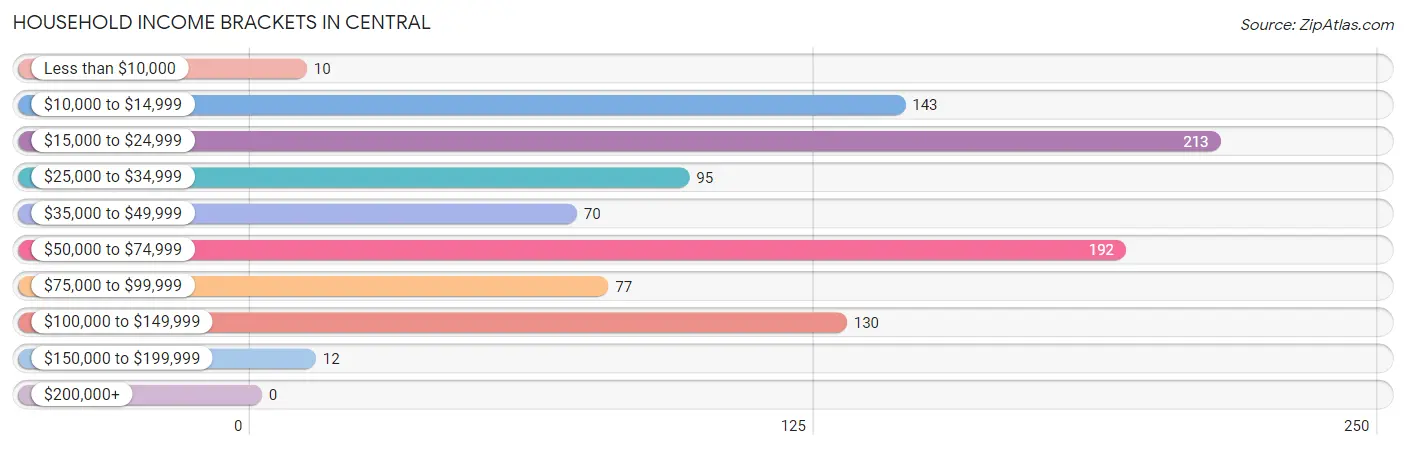
Household Income Brackets in Central
With 213 households falling in the category, the $15,000 to $24,999 income range is the most frequent in Central, accounting for 22.6% of all households.
| Income Bracket | # Households | % Households |
| Less than $10,000 | 10 | 1.1% |
| $10,000 to $14,999 | 143 | 15.2% |
| $15,000 to $24,999 | 213 | 22.6% |
| $25,000 to $34,999 | 95 | 10.1% |
| $35,000 to $49,999 | 70 | 7.4% |
| $50,000 to $74,999 | 192 | 20.4% |
| $75,000 to $99,999 | 77 | 8.2% |
| $100,000 to $149,999 | 130 | 13.8% |
| $150,000 to $199,999 | 12 | 1.3% |
| $200,000+ | 0 | 0.0% |
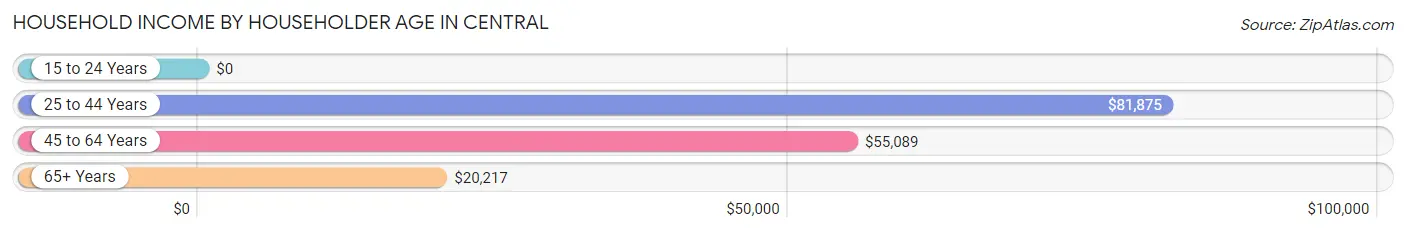
Household Income by Householder Age in Central
The median household income in Central is $38,690, with the highest median household income of $81,875 found in the 25 to 44 years age bracket for the primary householder. A total of 118 households (12.5%) fall into this category. Meanwhile, the 15 to 24 years age bracket for the primary householder has the lowest median household income of $0, with 29 households (3.1%) in this group.
| Income Bracket | # Households | Median Income |
| 15 to 24 Years | 29 (3.1%) | $0 |
| 25 to 44 Years | 118 (12.5%) | $81,875 |
| 45 to 64 Years | 377 (40.0%) | $55,089 |
| 65+ Years | 418 (44.4%) | $20,217 |
| Total | 942 (100.0%) | $38,690 |
Poverty in Central
Income Below Poverty by Sex and Age in Central
With 23.4% poverty level for males and 21.8% for females among the residents of Central, 12 to 14 year old males and 15 year old females are the most vulnerable to poverty, with 39 males (62.9%) and 45 females (100.0%) in their respective age groups living below the poverty level.
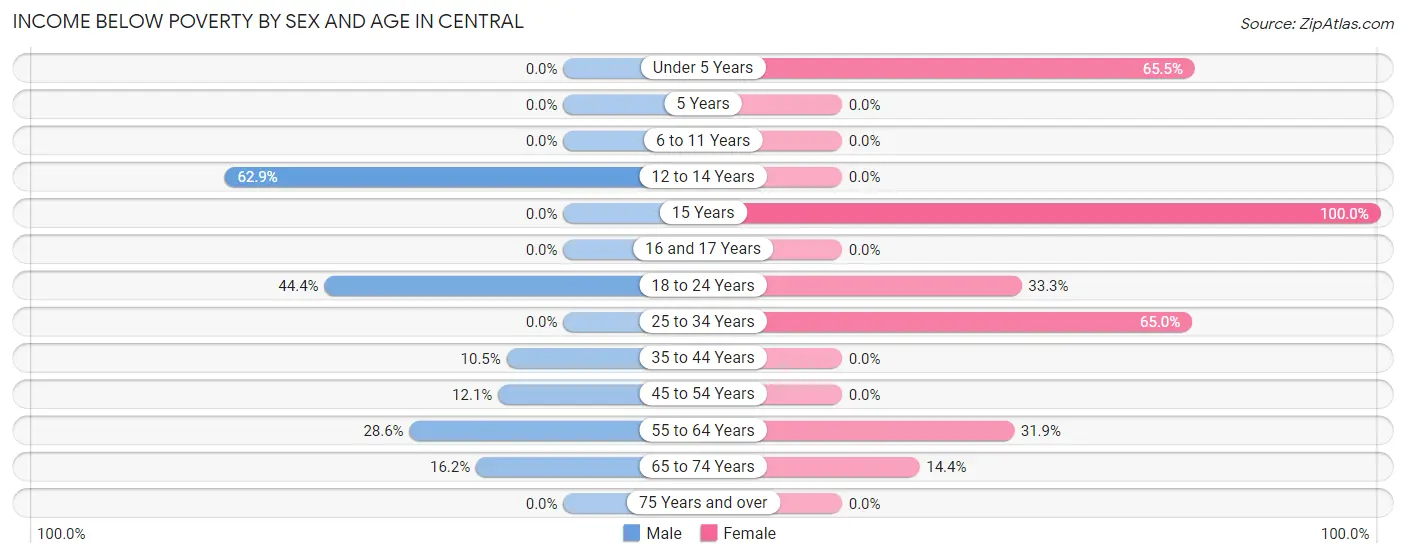
| Age Bracket | Male | Female |
| Under 5 Years | 0 (0.0%) | 19 (65.5%) |
| 5 Years | 0 (0.0%) | 0 (0.0%) |
| 6 to 11 Years | 0 (0.0%) | 0 (0.0%) |
| 12 to 14 Years | 39 (62.9%) | 0 (0.0%) |
| 15 Years | 0 (0.0%) | 45 (100.0%) |
| 16 and 17 Years | 0 (0.0%) | 0 (0.0%) |
| 18 to 24 Years | 51 (44.4%) | 37 (33.3%) |
| 25 to 34 Years | 0 (0.0%) | 26 (65.0%) |
| 35 to 44 Years | 6 (10.5%) | 0 (0.0%) |
| 45 to 54 Years | 19 (12.1%) | 0 (0.0%) |
| 55 to 64 Years | 56 (28.6%) | 76 (31.9%) |
| 65 to 74 Years | 23 (16.2%) | 39 (14.4%) |
| 75 Years and over | 0 (0.0%) | 0 (0.0%) |
| Total | 194 (23.4%) | 242 (21.8%) |
Income Above Poverty by Sex and Age in Central
According to the poverty statistics in Central, males aged 6 to 11 years and females aged 6 to 11 years are the age groups that are most secure financially, with 100.0% of males and 100.0% of females in these age groups living above the poverty line.
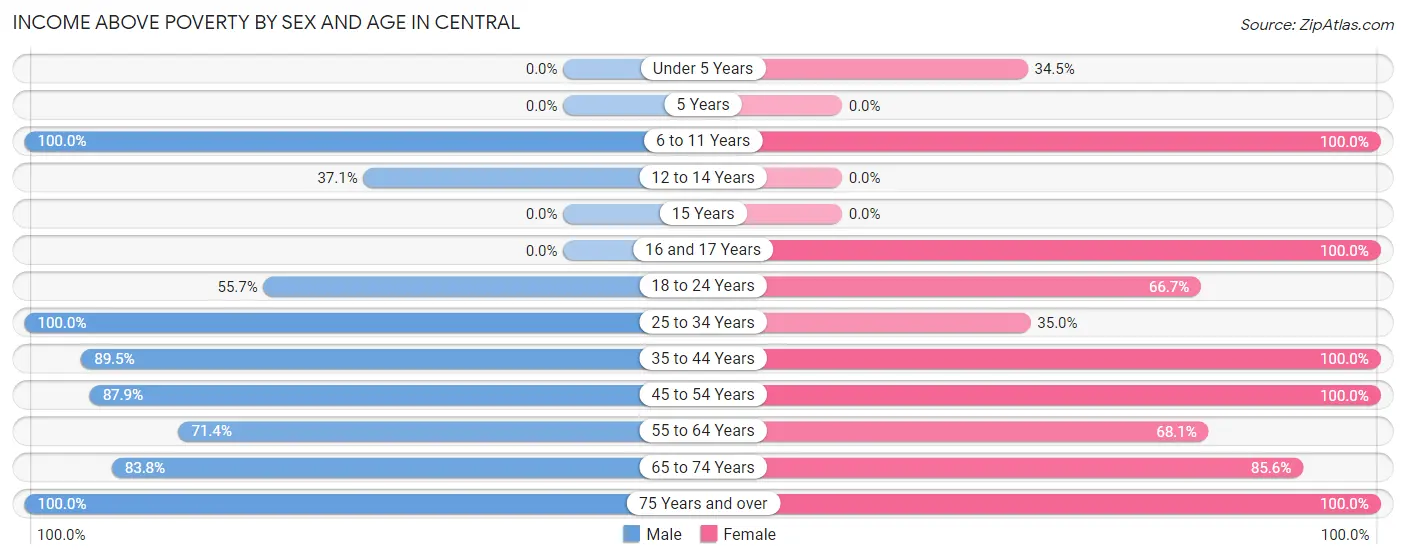
| Age Bracket | Male | Female |
| Under 5 Years | 0 (0.0%) | 10 (34.5%) |
| 5 Years | 0 (0.0%) | 0 (0.0%) |
| 6 to 11 Years | 32 (100.0%) | 21 (100.0%) |
| 12 to 14 Years | 23 (37.1%) | 0 (0.0%) |
| 15 Years | 0 (0.0%) | 0 (0.0%) |
| 16 and 17 Years | 0 (0.0%) | 37 (100.0%) |
| 18 to 24 Years | 64 (55.6%) | 74 (66.7%) |
| 25 to 34 Years | 49 (100.0%) | 14 (35.0%) |
| 35 to 44 Years | 51 (89.5%) | 87 (100.0%) |
| 45 to 54 Years | 138 (87.9%) | 142 (100.0%) |
| 55 to 64 Years | 140 (71.4%) | 162 (68.1%) |
| 65 to 74 Years | 119 (83.8%) | 232 (85.6%) |
| 75 Years and over | 20 (100.0%) | 91 (100.0%) |
| Total | 636 (76.6%) | 870 (78.2%) |
Income Below Poverty Among Married-Couple Families in Central
The poverty statistics for married-couple families in Central show that 8.3% or 36 of the total 434 families live below the poverty line. Families with 1 or 2 children have the highest poverty rate of 34.6%, comprising of 36 families. On the other hand, families with no children have the lowest poverty rate of 0.0%, which includes 0 families.
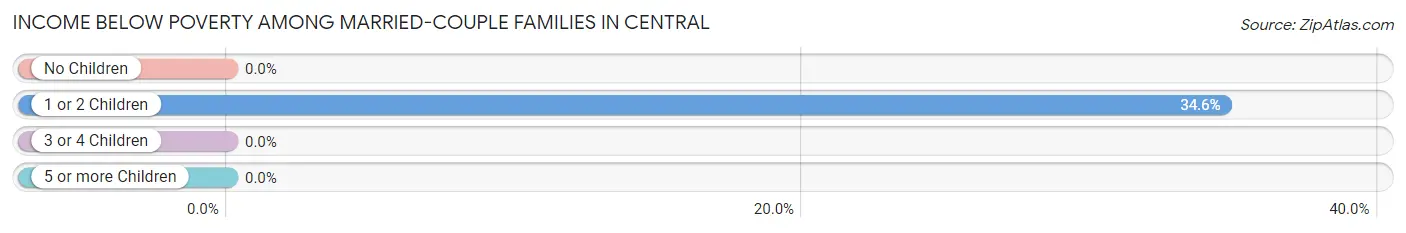
| Children | Above Poverty | Below Poverty |
| No Children | 330 (100.0%) | 0 (0.0%) |
| 1 or 2 Children | 68 (65.4%) | 36 (34.6%) |
| 3 or 4 Children | 0 (0.0%) | 0 (0.0%) |
| 5 or more Children | 0 (0.0%) | 0 (0.0%) |
| Total | 398 (91.7%) | 36 (8.3%) |
Income Below Poverty Among Single-Parent Households in Central
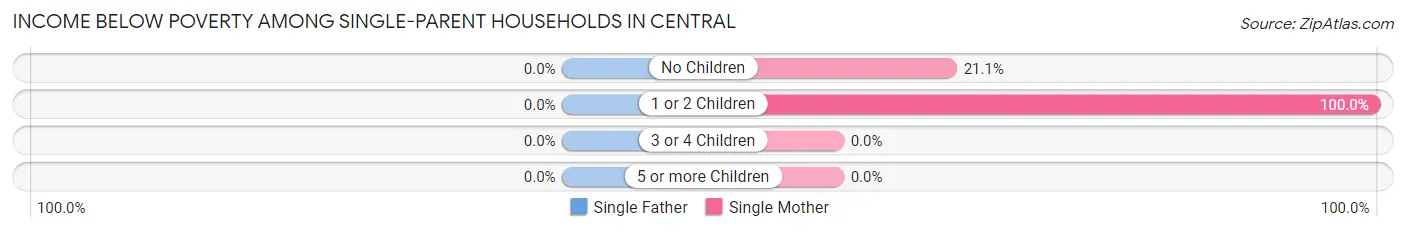
| Children | Single Father | Single Mother |
| No Children | 0 (0.0%) | 4 (21.0%) |
| 1 or 2 Children | 0 (0.0%) | 39 (100.0%) |
| 3 or 4 Children | 0 (0.0%) | 0 (0.0%) |
| 5 or more Children | 0 (0.0%) | 0 (0.0%) |
| Total | 0 (0.0%) | 43 (74.1%) |
Income Below Poverty Among Married-Couple vs Single-Parent Households in Central
The poverty data for Central shows that 36 of the married-couple family households (8.3%) and 43 of the single-parent households (74.1%) are living below the poverty level. Within the married-couple family households, those with 1 or 2 children have the highest poverty rate, with 36 households (34.6%) falling below the poverty line. Among the single-parent households, those with 1 or 2 children have the highest poverty rate, with 39 household (100.0%) living below poverty.
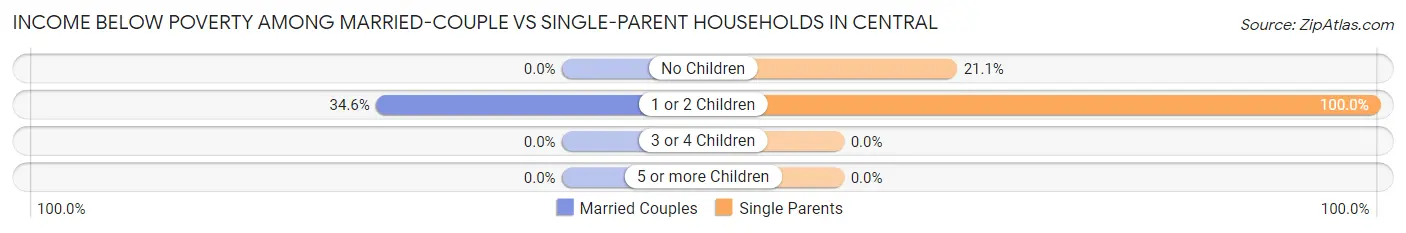
| Children | Married-Couple Families | Single-Parent Households |
| No Children | 0 (0.0%) | 4 (21.0%) |
| 1 or 2 Children | 36 (34.6%) | 39 (100.0%) |
| 3 or 4 Children | 0 (0.0%) | 0 (0.0%) |
| 5 or more Children | 0 (0.0%) | 0 (0.0%) |
| Total | 36 (8.3%) | 43 (74.1%) |
Employment Characteristics in Central
Employment by Class of Employer in Central
Among the 801 employed individuals in Central, private company employees (521 | 65.0%), not-for-profit organizations (107 | 13.4%), and self-employed (not incorporated) (47 | 5.9%) make up the most common classes of employment.
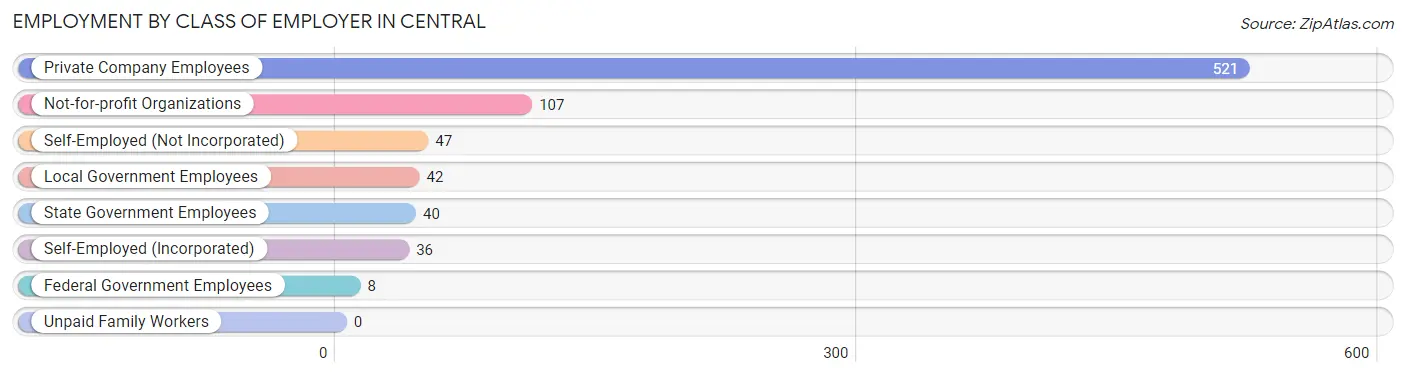
| Employer Class | # Employees | % Employees |
| Private Company Employees | 521 | 65.0% |
| Self-Employed (Incorporated) | 36 | 4.5% |
| Self-Employed (Not Incorporated) | 47 | 5.9% |
| Not-for-profit Organizations | 107 | 13.4% |
| Local Government Employees | 42 | 5.2% |
| State Government Employees | 40 | 5.0% |
| Federal Government Employees | 8 | 1.0% |
| Unpaid Family Workers | 0 | 0.0% |
| Total | 801 | 100.0% |
Employment Status by Age in Central
According to the labor force statistics for Central, out of the total population over 16 years of age (1,753), 49.7% or 871 individuals are in the labor force, with 4.6% or 40 of them unemployed. The age group with the highest labor force participation rate is 25 to 29 years, with 100.0% or 67 individuals in the labor force. Within the labor force, the 20 to 24 years age range has the highest percentage of unemployed individuals, with 34.5% or 40 of them being unemployed.
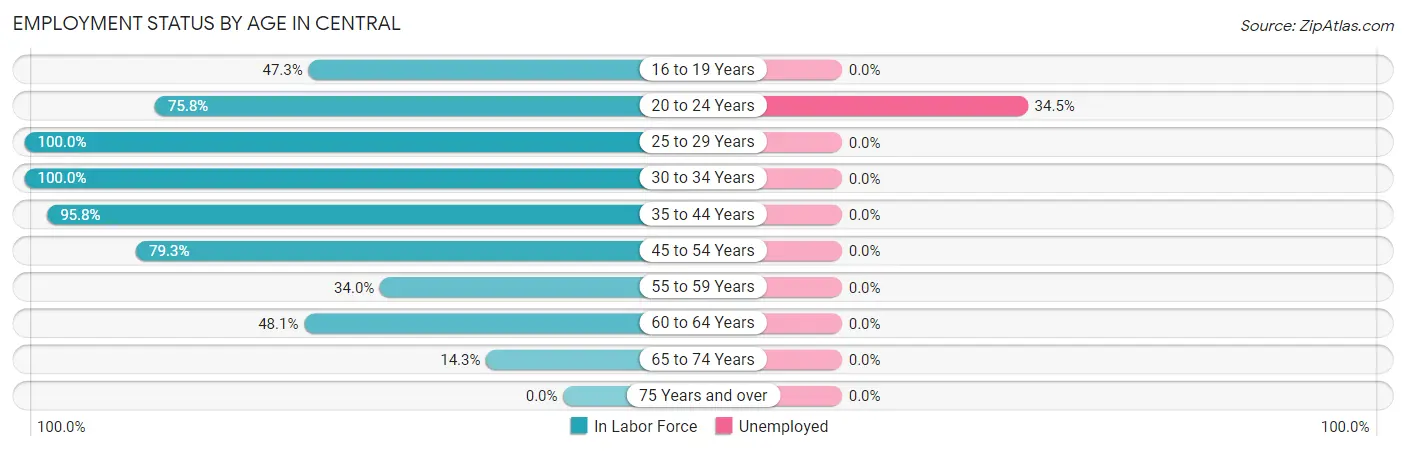
| Age Bracket | In Labor Force | Unemployed |
| 16 to 19 Years | 52 (47.3%) | 0 (0.0%) |
| 20 to 24 Years | 116 (75.8%) | 40 (34.5%) |
| 25 to 29 Years | 67 (100.0%) | 0 (0.0%) |
| 30 to 34 Years | 22 (100.0%) | 0 (0.0%) |
| 35 to 44 Years | 138 (95.8%) | 0 (0.0%) |
| 45 to 54 Years | 237 (79.3%) | 0 (0.0%) |
| 55 to 59 Years | 67 (34.0%) | 0 (0.0%) |
| 60 to 64 Years | 114 (48.1%) | 0 (0.0%) |
| 65 to 74 Years | 59 (14.3%) | 0 (0.0%) |
| 75 Years and over | 0 (0.0%) | 0 (0.0%) |
| Total | 871 (49.7%) | 40 (4.6%) |
Employment Status by Educational Attainment in Central
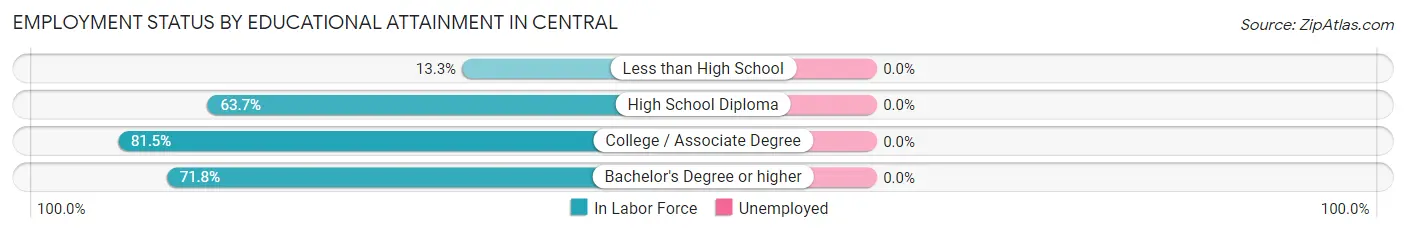
| Educational Attainment | In Labor Force | Unemployed |
| Less than High School | 14 (13.3%) | 0 (0.0%) |
| High School Diploma | 207 (63.7%) | 0 (0.0%) |
| College / Associate Degree | 330 (81.5%) | 0 (0.0%) |
| Bachelor's Degree or higher | 94 (71.8%) | 0 (0.0%) |
| Total | 645 (66.8%) | 0 (0.0%) |
Employment Occupations by Sex in Central
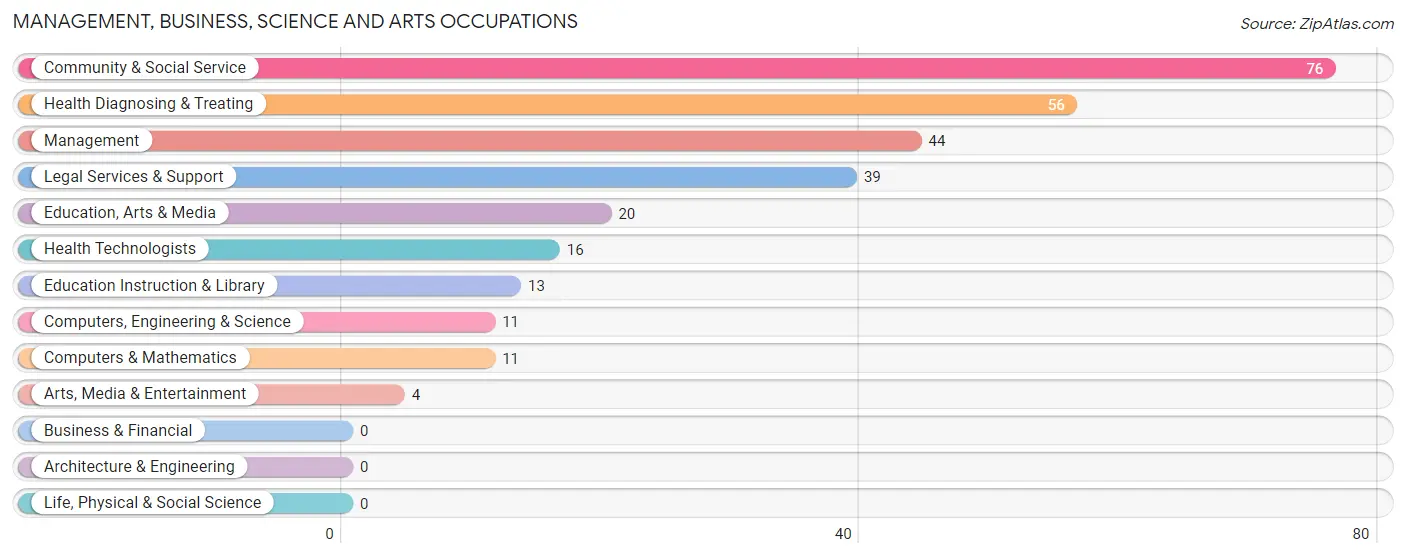
Management, Business, Science and Arts Occupations
The most common Management, Business, Science and Arts occupations in Central are Community & Social Service (76 | 9.1%), Health Diagnosing & Treating (56 | 6.7%), Management (44 | 5.3%), Legal Services & Support (39 | 4.7%), and Education, Arts & Media (20 | 2.4%).
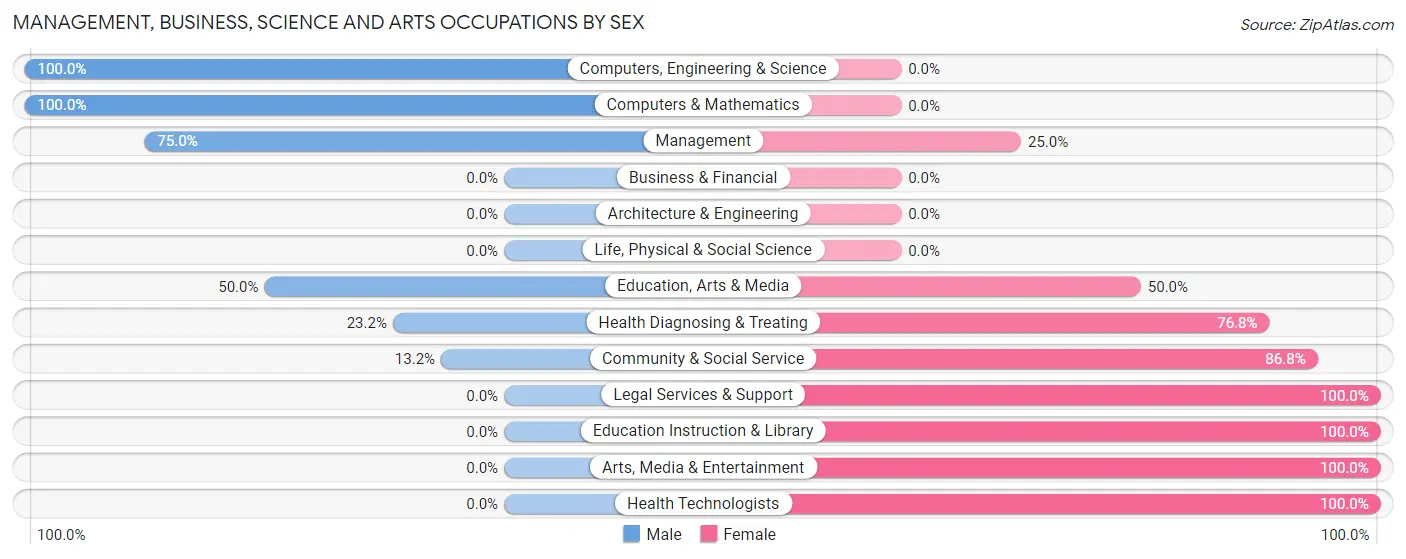
Management, Business, Science and Arts Occupations by Sex
Within the Management, Business, Science and Arts occupations in Central, the most male-oriented occupations are Computers, Engineering & Science (100.0%), Computers & Mathematics (100.0%), and Management (75.0%), while the most female-oriented occupations are Legal Services & Support (100.0%), Education Instruction & Library (100.0%), and Arts, Media & Entertainment (100.0%).
| Occupation | Male | Female |
| Management | 33 (75.0%) | 11 (25.0%) |
| Business & Financial | 0 (0.0%) | 0 (0.0%) |
| Computers, Engineering & Science | 11 (100.0%) | 0 (0.0%) |
| Computers & Mathematics | 11 (100.0%) | 0 (0.0%) |
| Architecture & Engineering | 0 (0.0%) | 0 (0.0%) |
| Life, Physical & Social Science | 0 (0.0%) | 0 (0.0%) |
| Community & Social Service | 10 (13.2%) | 66 (86.8%) |
| Education, Arts & Media | 10 (50.0%) | 10 (50.0%) |
| Legal Services & Support | 0 (0.0%) | 39 (100.0%) |
| Education Instruction & Library | 0 (0.0%) | 13 (100.0%) |
| Arts, Media & Entertainment | 0 (0.0%) | 4 (100.0%) |
| Health Diagnosing & Treating | 13 (23.2%) | 43 (76.8%) |
| Health Technologists | 0 (0.0%) | 16 (100.0%) |
| Total (Category) | 67 (35.8%) | 120 (64.2%) |
| Total (Overall) | 381 (45.8%) | 451 (54.2%) |
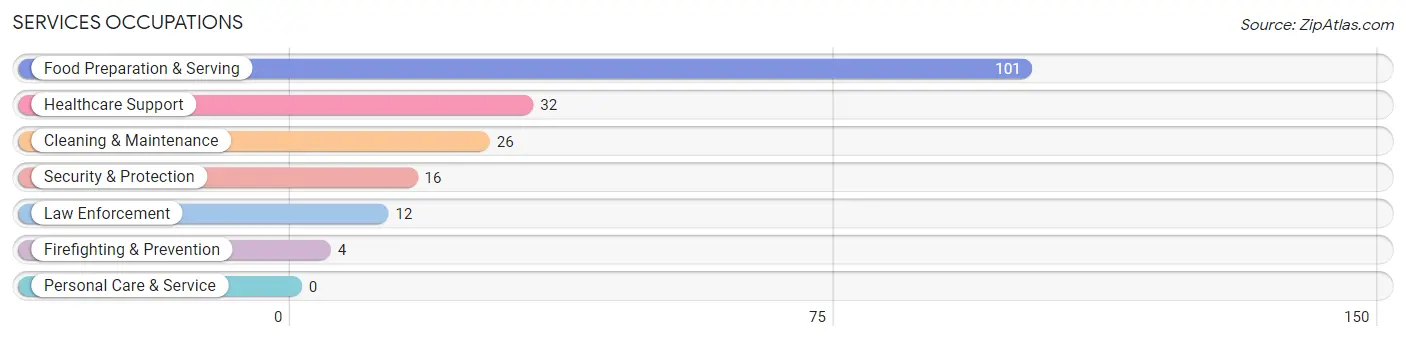
Services Occupations
The most common Services occupations in Central are Food Preparation & Serving (101 | 12.1%), Healthcare Support (32 | 3.8%), Cleaning & Maintenance (26 | 3.1%), Security & Protection (16 | 1.9%), and Law Enforcement (12 | 1.4%).
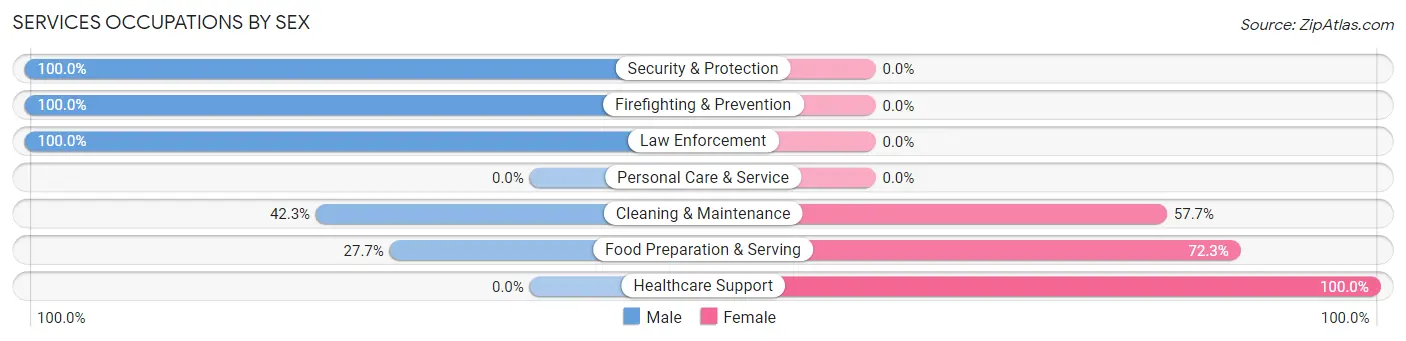
Services Occupations by Sex
Within the Services occupations in Central, the most male-oriented occupations are Security & Protection (100.0%), Firefighting & Prevention (100.0%), and Law Enforcement (100.0%), while the most female-oriented occupations are Healthcare Support (100.0%), Food Preparation & Serving (72.3%), and Cleaning & Maintenance (57.7%).
| Occupation | Male | Female |
| Healthcare Support | 0 (0.0%) | 32 (100.0%) |
| Security & Protection | 16 (100.0%) | 0 (0.0%) |
| Firefighting & Prevention | 4 (100.0%) | 0 (0.0%) |
| Law Enforcement | 12 (100.0%) | 0 (0.0%) |
| Food Preparation & Serving | 28 (27.7%) | 73 (72.3%) |
| Cleaning & Maintenance | 11 (42.3%) | 15 (57.7%) |
| Personal Care & Service | 0 (0.0%) | 0 (0.0%) |
| Total (Category) | 55 (31.4%) | 120 (68.6%) |
| Total (Overall) | 381 (45.8%) | 451 (54.2%) |
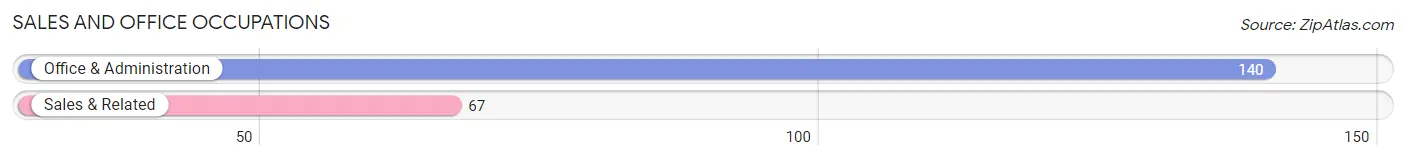
Sales and Office Occupations
The most common Sales and Office occupations in Central are Office & Administration (140 | 16.8%), and Sales & Related (67 | 8.1%).
Sales and Office Occupations by Sex
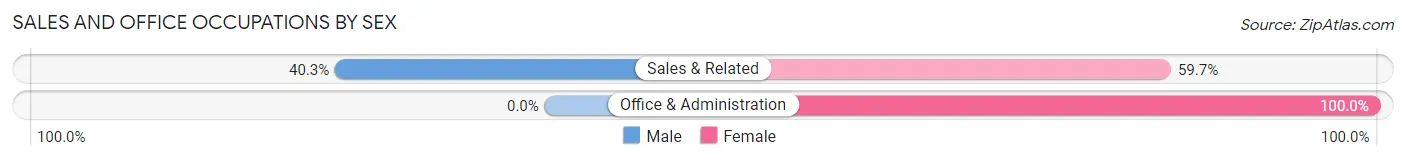
| Occupation | Male | Female |
| Sales & Related | 27 (40.3%) | 40 (59.7%) |
| Office & Administration | 0 (0.0%) | 140 (100.0%) |
| Total (Category) | 27 (13.0%) | 180 (87.0%) |
| Total (Overall) | 381 (45.8%) | 451 (54.2%) |
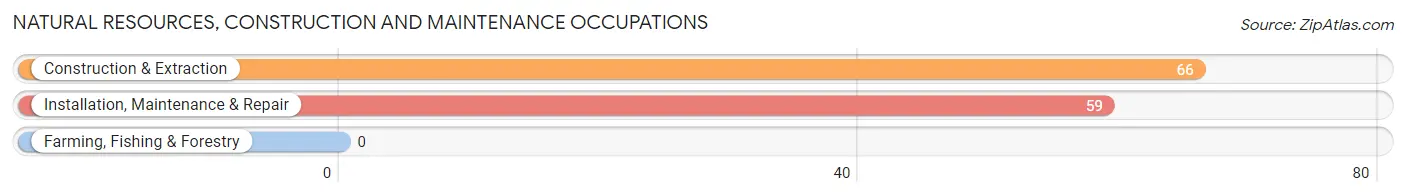
Natural Resources, Construction and Maintenance Occupations
The most common Natural Resources, Construction and Maintenance occupations in Central are Construction & Extraction (66 | 7.9%), and Installation, Maintenance & Repair (59 | 7.1%).
Natural Resources, Construction and Maintenance Occupations by Sex
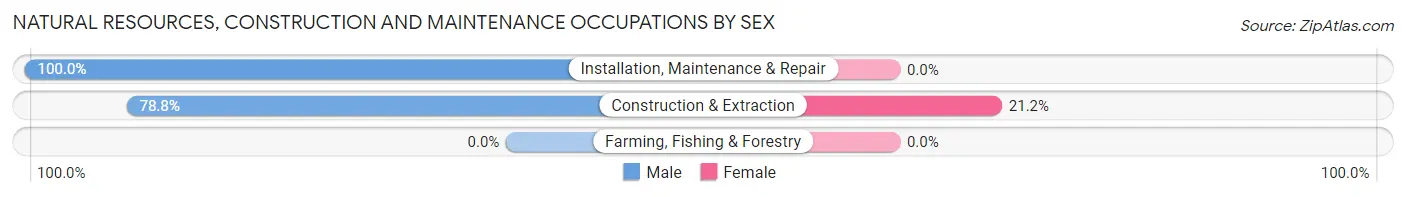
| Occupation | Male | Female |
| Farming, Fishing & Forestry | 0 (0.0%) | 0 (0.0%) |
| Construction & Extraction | 52 (78.8%) | 14 (21.2%) |
| Installation, Maintenance & Repair | 59 (100.0%) | 0 (0.0%) |
| Total (Category) | 111 (88.8%) | 14 (11.2%) |
| Total (Overall) | 381 (45.8%) | 451 (54.2%) |
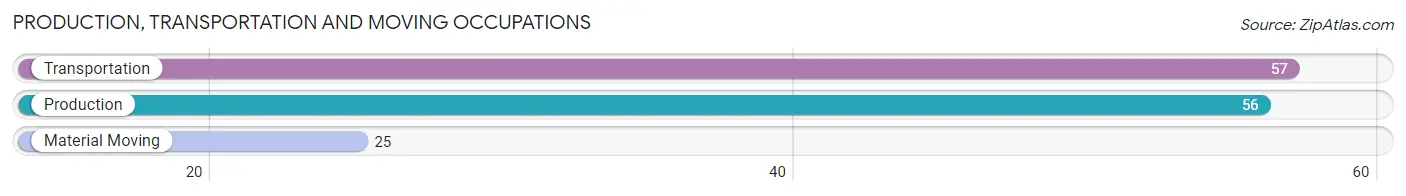
Production, Transportation and Moving Occupations
The most common Production, Transportation and Moving occupations in Central are Transportation (57 | 6.9%), Production (56 | 6.7%), and Material Moving (25 | 3.0%).
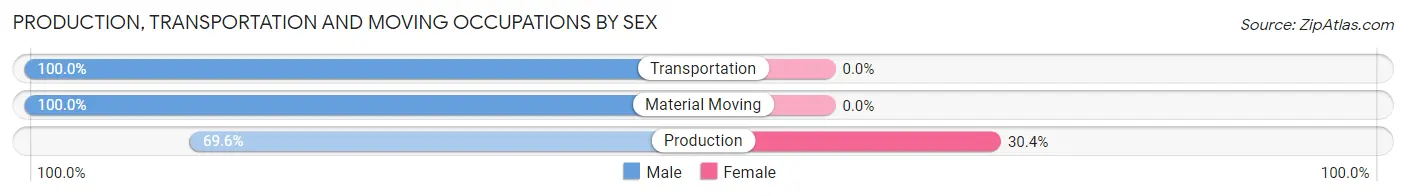
Production, Transportation and Moving Occupations by Sex
| Occupation | Male | Female |
| Production | 39 (69.6%) | 17 (30.4%) |
| Transportation | 57 (100.0%) | 0 (0.0%) |
| Material Moving | 25 (100.0%) | 0 (0.0%) |
| Total (Category) | 121 (87.7%) | 17 (12.3%) |
| Total (Overall) | 381 (45.8%) | 451 (54.2%) |
Employment Industries by Sex in Central
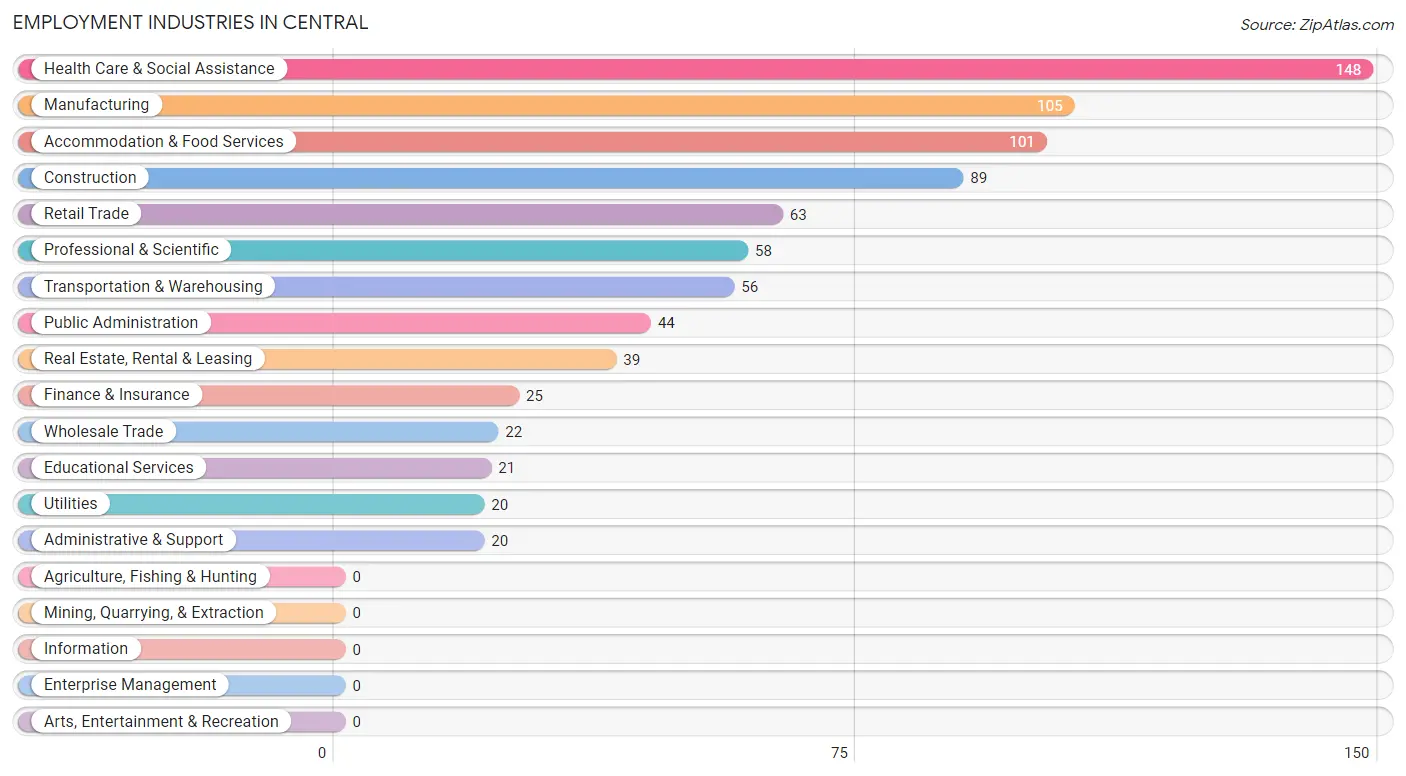
Employment Industries in Central
The major employment industries in Central include Health Care & Social Assistance (148 | 17.8%), Manufacturing (105 | 12.6%), Accommodation & Food Services (101 | 12.1%), Construction (89 | 10.7%), and Retail Trade (63 | 7.6%).
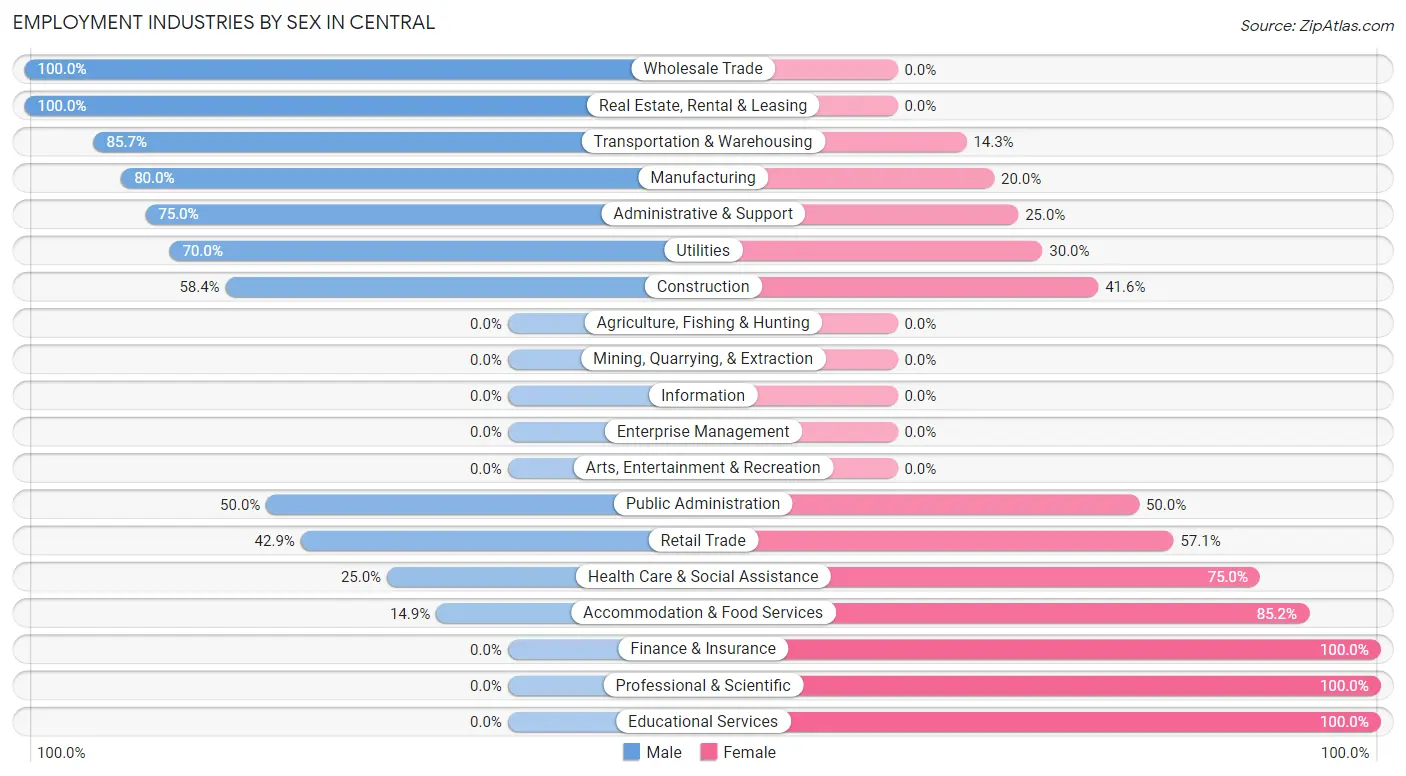
Employment Industries by Sex in Central
The Central industries that see more men than women are Wholesale Trade (100.0%), Real Estate, Rental & Leasing (100.0%), and Transportation & Warehousing (85.7%), whereas the industries that tend to have a higher number of women are Finance & Insurance (100.0%), Professional & Scientific (100.0%), and Educational Services (100.0%).
| Industry | Male | Female |
| Agriculture, Fishing & Hunting | 0 (0.0%) | 0 (0.0%) |
| Mining, Quarrying, & Extraction | 0 (0.0%) | 0 (0.0%) |
| Construction | 52 (58.4%) | 37 (41.6%) |
| Manufacturing | 84 (80.0%) | 21 (20.0%) |
| Wholesale Trade | 22 (100.0%) | 0 (0.0%) |
| Retail Trade | 27 (42.9%) | 36 (57.1%) |
| Transportation & Warehousing | 48 (85.7%) | 8 (14.3%) |
| Utilities | 14 (70.0%) | 6 (30.0%) |
| Information | 0 (0.0%) | 0 (0.0%) |
| Finance & Insurance | 0 (0.0%) | 25 (100.0%) |
| Real Estate, Rental & Leasing | 39 (100.0%) | 0 (0.0%) |
| Professional & Scientific | 0 (0.0%) | 58 (100.0%) |
| Enterprise Management | 0 (0.0%) | 0 (0.0%) |
| Administrative & Support | 15 (75.0%) | 5 (25.0%) |
| Educational Services | 0 (0.0%) | 21 (100.0%) |
| Health Care & Social Assistance | 37 (25.0%) | 111 (75.0%) |
| Arts, Entertainment & Recreation | 0 (0.0%) | 0 (0.0%) |
| Accommodation & Food Services | 15 (14.8%) | 86 (85.2%) |
| Public Administration | 22 (50.0%) | 22 (50.0%) |
| Total | 381 (45.8%) | 451 (54.2%) |
Education in Central
School Enrollment in Central
The most common levels of schooling among the 293 students in Central are high school (127 | 43.3%), middle school (60 | 20.5%), and graduate / professional (50 | 17.1%).
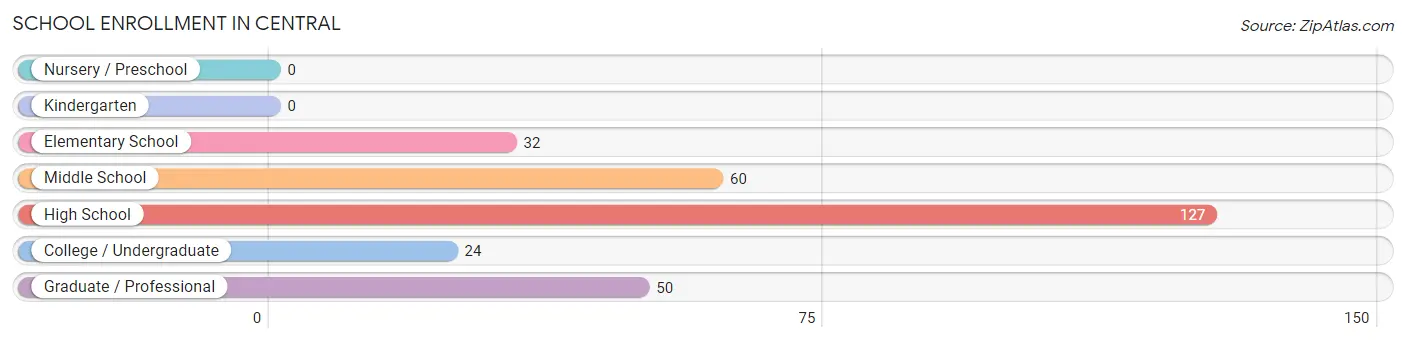
| School Level | # Students | % Students |
| Nursery / Preschool | 0 | 0.0% |
| Kindergarten | 0 | 0.0% |
| Elementary School | 32 | 10.9% |
| Middle School | 60 | 20.5% |
| High School | 127 | 43.3% |
| College / Undergraduate | 24 | 8.2% |
| Graduate / Professional | 50 | 17.1% |
| Total | 293 | 100.0% |
School Enrollment by Age by Funding Source in Central
Out of a total of 293 students who are enrolled in schools in Central, 5 (1.7%) attend a private institution, while the remaining 288 (98.3%) are enrolled in public schools. The age group of 35 years and over has the highest likelihood of being enrolled in private schools, with 5 (20.8% in the age bracket) enrolled. Conversely, the age group of 5 to 9 year old has the lowest likelihood of being enrolled in a private school, with 32 (100.0% in the age bracket) attending a public institution.
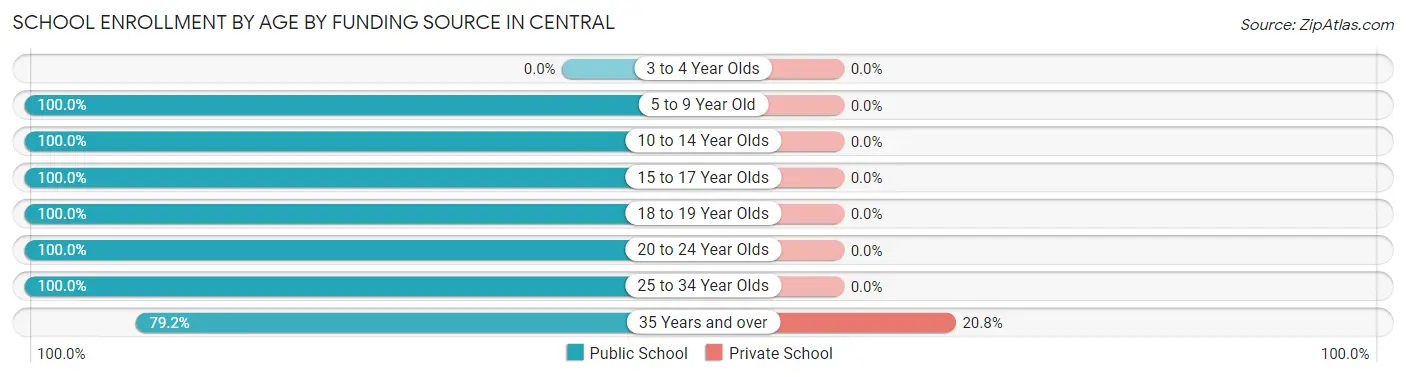
| Age Bracket | Public School | Private School |
| 3 to 4 Year Olds | 0 (0.0%) | 0 (0.0%) |
| 5 to 9 Year Old | 32 (100.0%) | 0 (0.0%) |
| 10 to 14 Year Olds | 83 (100.0%) | 0 (0.0%) |
| 15 to 17 Year Olds | 82 (100.0%) | 0 (0.0%) |
| 18 to 19 Year Olds | 22 (100.0%) | 0 (0.0%) |
| 20 to 24 Year Olds | 37 (100.0%) | 0 (0.0%) |
| 25 to 34 Year Olds | 13 (100.0%) | 0 (0.0%) |
| 35 Years and over | 19 (79.2%) | 5 (20.8%) |
| Total | 288 (98.3%) | 5 (1.7%) |
Educational Attainment by Field of Study in Central
Business (65 | 26.5%), communications (40 | 16.3%), education (35 | 14.3%), liberal arts & history (25 | 10.2%), and literature & languages (21 | 8.6%) are the most common fields of study among 245 individuals in Central who have obtained a bachelor's degree or higher.
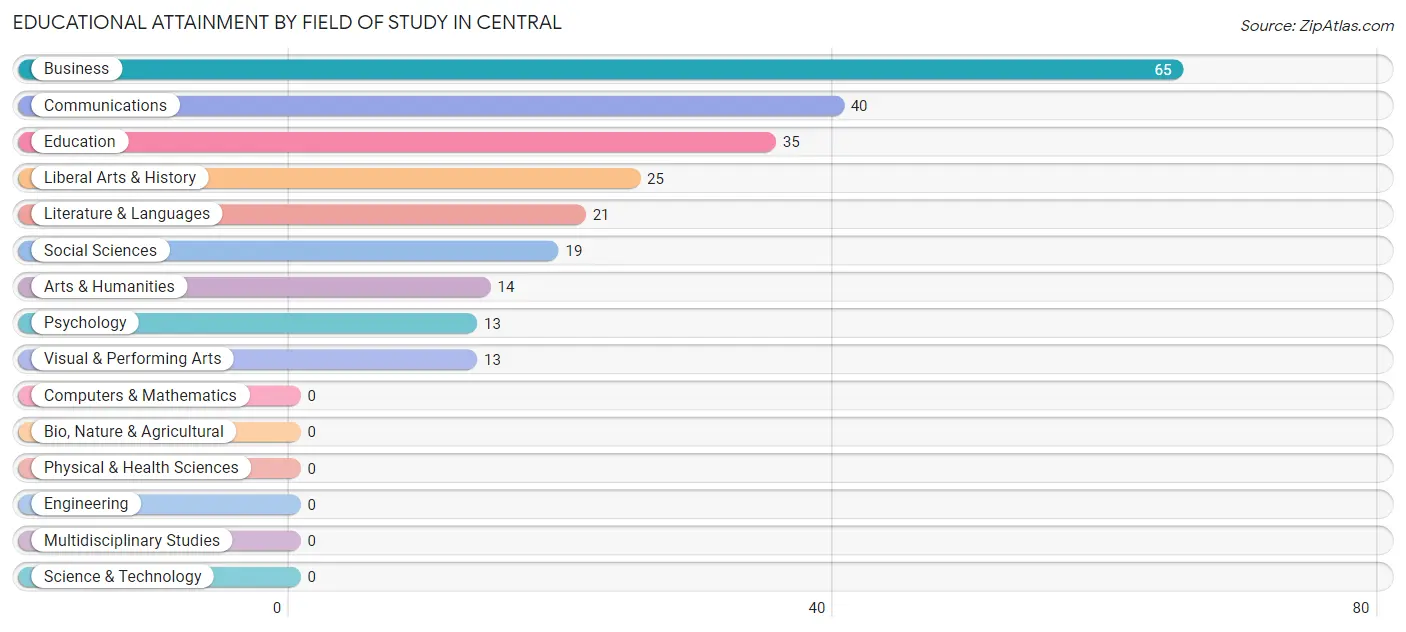
| Field of Study | # Graduates | % Graduates |
| Computers & Mathematics | 0 | 0.0% |
| Bio, Nature & Agricultural | 0 | 0.0% |
| Physical & Health Sciences | 0 | 0.0% |
| Psychology | 13 | 5.3% |
| Social Sciences | 19 | 7.8% |
| Engineering | 0 | 0.0% |
| Multidisciplinary Studies | 0 | 0.0% |
| Science & Technology | 0 | 0.0% |
| Business | 65 | 26.5% |
| Education | 35 | 14.3% |
| Literature & Languages | 21 | 8.6% |
| Liberal Arts & History | 25 | 10.2% |
| Visual & Performing Arts | 13 | 5.3% |
| Communications | 40 | 16.3% |
| Arts & Humanities | 14 | 5.7% |
| Total | 245 | 100.0% |
Transportation & Commute in Central
Vehicle Availability by Sex in Central
The most prevalent vehicle ownership categories in Central are males with 2 vehicles (155, accounting for 41.3%) and females with 2 vehicles (180, making up 36.4%).
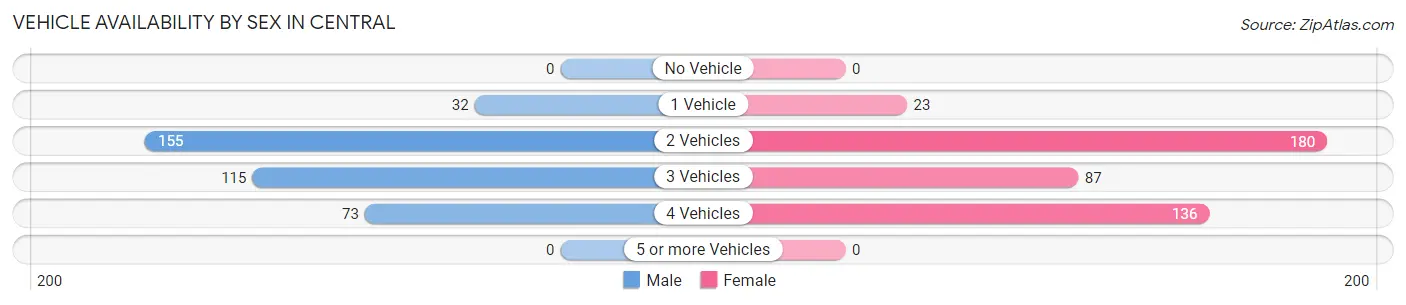
| Vehicles Available | Male | Female |
| No Vehicle | 0 (0.0%) | 0 (0.0%) |
| 1 Vehicle | 32 (8.5%) | 23 (5.4%) |
| 2 Vehicles | 155 (41.3%) | 180 (42.2%) |
| 3 Vehicles | 115 (30.7%) | 87 (20.4%) |
| 4 Vehicles | 73 (19.5%) | 136 (31.9%) |
| 5 or more Vehicles | 0 (0.0%) | 0 (0.0%) |
| Total | 375 (100.0%) | 426 (100.0%) |
Commute Time in Central
The most frequently occuring commute durations in Central are 15 to 19 minutes (252 commuters, 32.7%), 10 to 14 minutes (211 commuters, 27.4%), and 20 to 24 minutes (166 commuters, 21.6%).
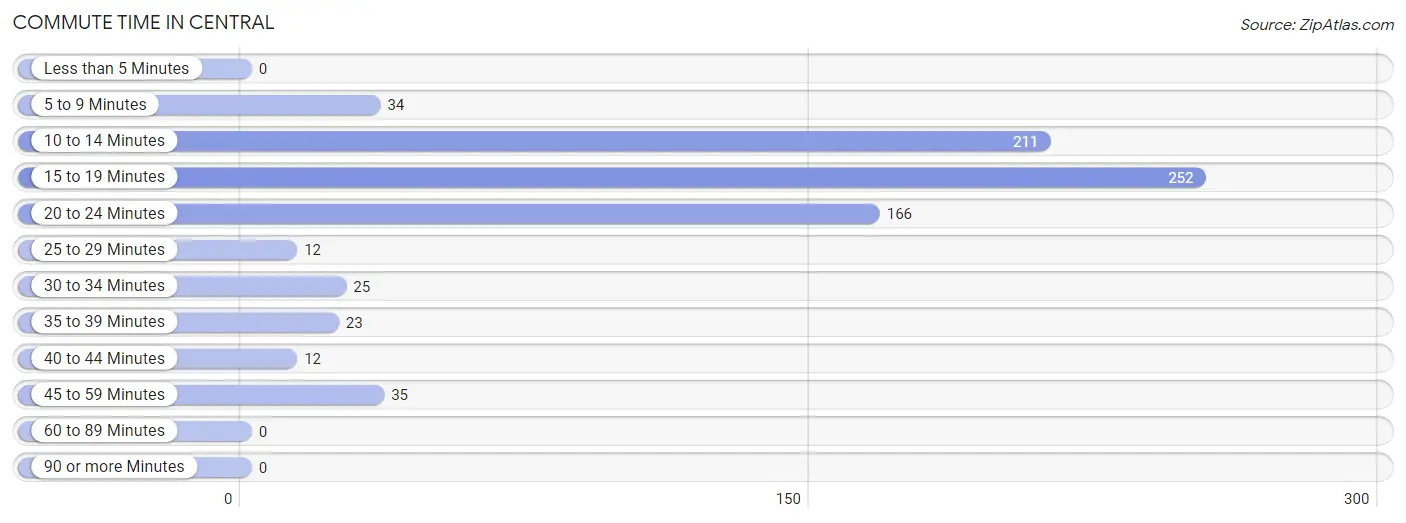
| Commute Time | # Commuters | % Commuters |
| Less than 5 Minutes | 0 | 0.0% |
| 5 to 9 Minutes | 34 | 4.4% |
| 10 to 14 Minutes | 211 | 27.4% |
| 15 to 19 Minutes | 252 | 32.7% |
| 20 to 24 Minutes | 166 | 21.6% |
| 25 to 29 Minutes | 12 | 1.6% |
| 30 to 34 Minutes | 25 | 3.3% |
| 35 to 39 Minutes | 23 | 3.0% |
| 40 to 44 Minutes | 12 | 1.6% |
| 45 to 59 Minutes | 35 | 4.5% |
| 60 to 89 Minutes | 0 | 0.0% |
| 90 or more Minutes | 0 | 0.0% |
Commute Time by Sex in Central
The most common commute times in Central are 15 to 19 minutes (115 commuters, 33.4%) for males and 15 to 19 minutes (137 commuters, 32.2%) for females.
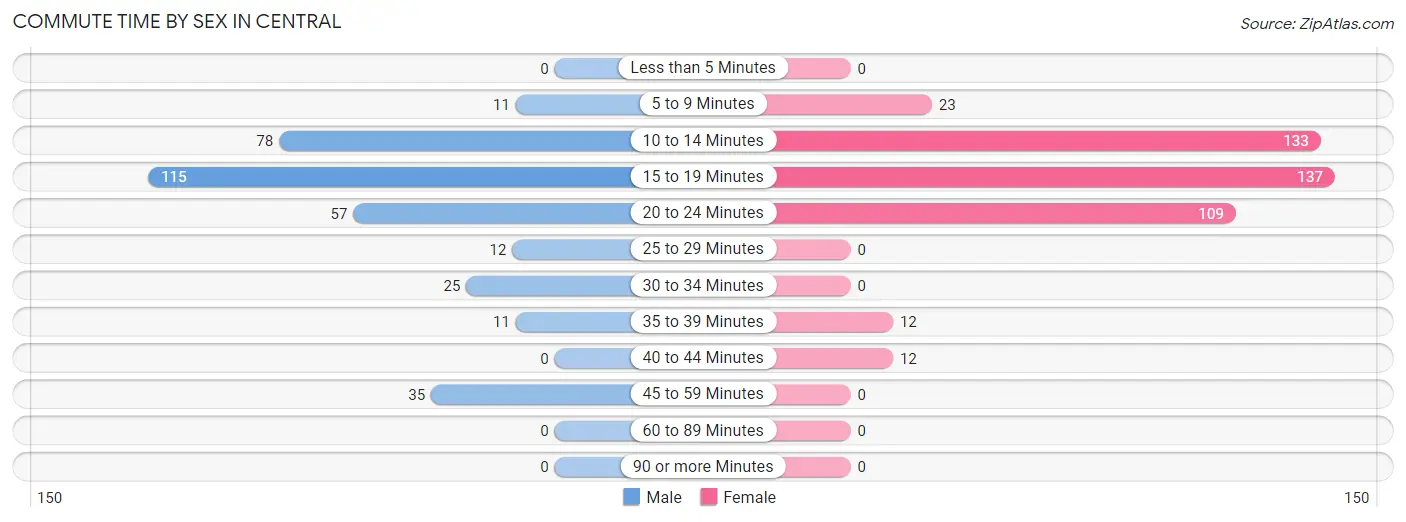
| Commute Time | Male | Female |
| Less than 5 Minutes | 0 (0.0%) | 0 (0.0%) |
| 5 to 9 Minutes | 11 (3.2%) | 23 (5.4%) |
| 10 to 14 Minutes | 78 (22.7%) | 133 (31.2%) |
| 15 to 19 Minutes | 115 (33.4%) | 137 (32.2%) |
| 20 to 24 Minutes | 57 (16.6%) | 109 (25.6%) |
| 25 to 29 Minutes | 12 (3.5%) | 0 (0.0%) |
| 30 to 34 Minutes | 25 (7.3%) | 0 (0.0%) |
| 35 to 39 Minutes | 11 (3.2%) | 12 (2.8%) |
| 40 to 44 Minutes | 0 (0.0%) | 12 (2.8%) |
| 45 to 59 Minutes | 35 (10.2%) | 0 (0.0%) |
| 60 to 89 Minutes | 0 (0.0%) | 0 (0.0%) |
| 90 or more Minutes | 0 (0.0%) | 0 (0.0%) |
Time of Departure to Work by Sex in Central
The most frequent times of departure to work in Central are 7:30 AM to 7:59 AM (73, 21.2%) for males and 12:00 AM to 4:59 AM (105, 24.6%) for females.
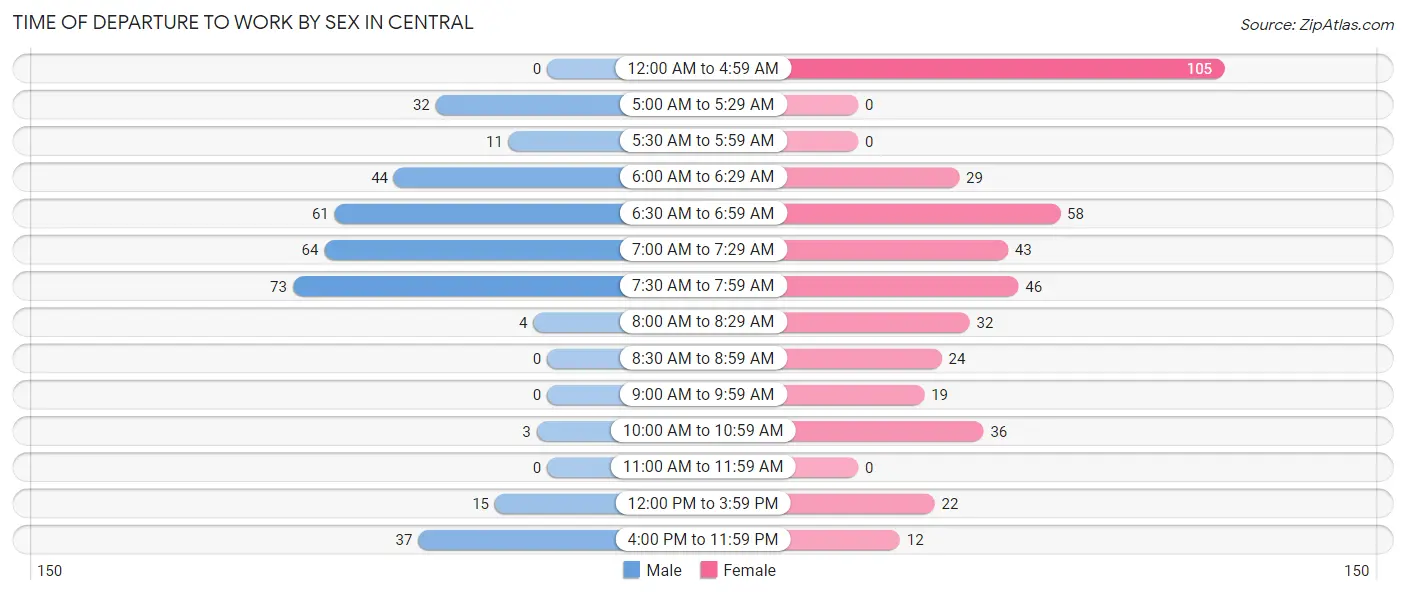
| Time of Departure | Male | Female |
| 12:00 AM to 4:59 AM | 0 (0.0%) | 105 (24.6%) |
| 5:00 AM to 5:29 AM | 32 (9.3%) | 0 (0.0%) |
| 5:30 AM to 5:59 AM | 11 (3.2%) | 0 (0.0%) |
| 6:00 AM to 6:29 AM | 44 (12.8%) | 29 (6.8%) |
| 6:30 AM to 6:59 AM | 61 (17.7%) | 58 (13.6%) |
| 7:00 AM to 7:29 AM | 64 (18.6%) | 43 (10.1%) |
| 7:30 AM to 7:59 AM | 73 (21.2%) | 46 (10.8%) |
| 8:00 AM to 8:29 AM | 4 (1.2%) | 32 (7.5%) |
| 8:30 AM to 8:59 AM | 0 (0.0%) | 24 (5.6%) |
| 9:00 AM to 9:59 AM | 0 (0.0%) | 19 (4.5%) |
| 10:00 AM to 10:59 AM | 3 (0.9%) | 36 (8.5%) |
| 11:00 AM to 11:59 AM | 0 (0.0%) | 0 (0.0%) |
| 12:00 PM to 3:59 PM | 15 (4.4%) | 22 (5.2%) |
| 4:00 PM to 11:59 PM | 37 (10.8%) | 12 (2.8%) |
| Total | 344 (100.0%) | 426 (100.0%) |
Housing Occupancy in Central
Occupancy by Ownership in Central
Of the total 942 dwellings in Central, owner-occupied units account for 732 (77.7%), while renter-occupied units make up 210 (22.3%).
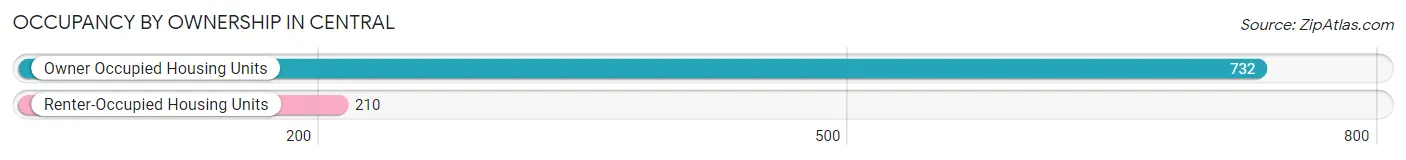
| Occupancy | # Housing Units | % Housing Units |
| Owner Occupied Housing Units | 732 | 77.7% |
| Renter-Occupied Housing Units | 210 | 22.3% |
| Total Occupied Housing Units | 942 | 100.0% |
Occupancy by Household Size in Central
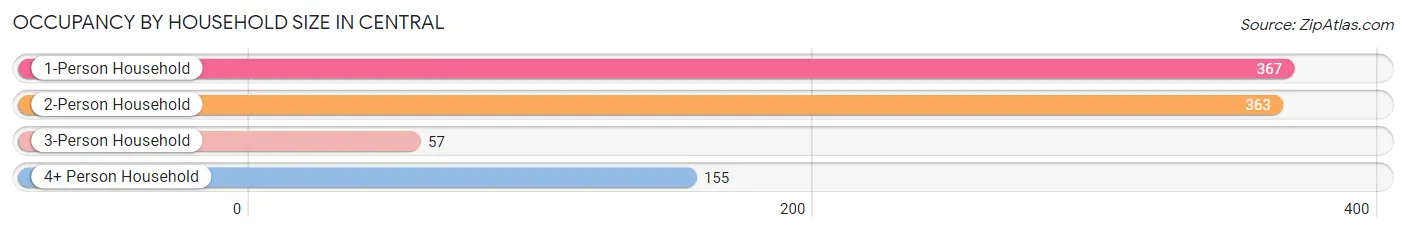
| Household Size | # Housing Units | % Housing Units |
| 1-Person Household | 367 | 39.0% |
| 2-Person Household | 363 | 38.5% |
| 3-Person Household | 57 | 6.0% |
| 4+ Person Household | 155 | 16.5% |
| Total Housing Units | 942 | 100.0% |
Occupancy by Ownership by Household Size in Central
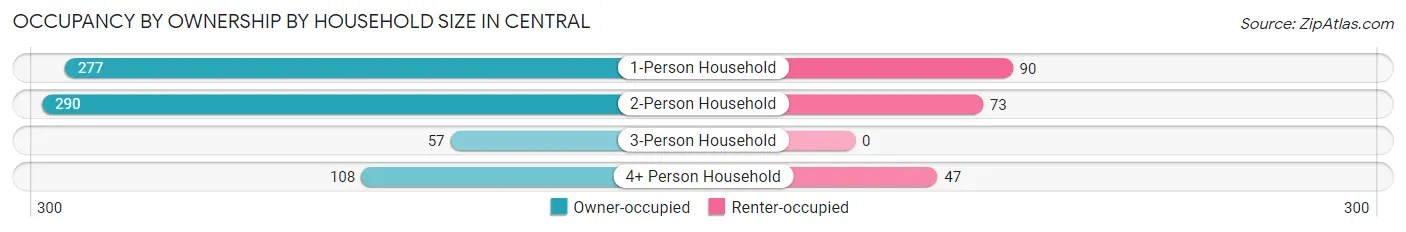
| Household Size | Owner-occupied | Renter-occupied |
| 1-Person Household | 277 (75.5%) | 90 (24.5%) |
| 2-Person Household | 290 (79.9%) | 73 (20.1%) |
| 3-Person Household | 57 (100.0%) | 0 (0.0%) |
| 4+ Person Household | 108 (69.7%) | 47 (30.3%) |
| Total Housing Units | 732 (77.7%) | 210 (22.3%) |
Occupancy by Educational Attainment in Central
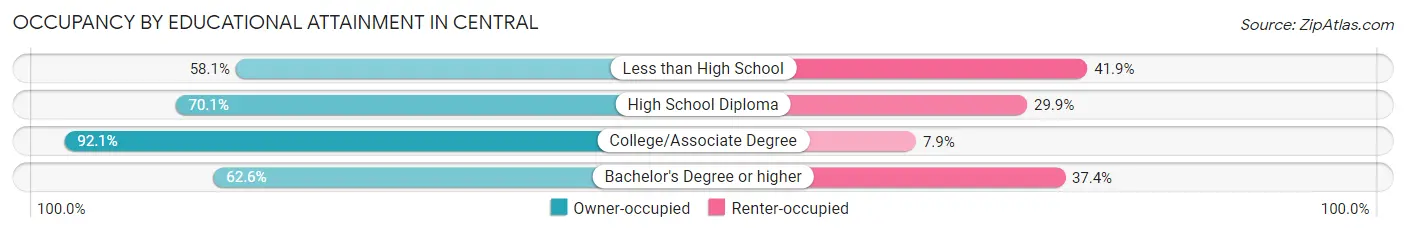
| Household Size | Owner-occupied | Renter-occupied |
| Less than High School | 50 (58.1%) | 36 (41.9%) |
| High School Diploma | 178 (70.1%) | 76 (29.9%) |
| College/Associate Degree | 397 (92.1%) | 34 (7.9%) |
| Bachelor's Degree or higher | 107 (62.6%) | 64 (37.4%) |
Occupancy by Age of Householder in Central
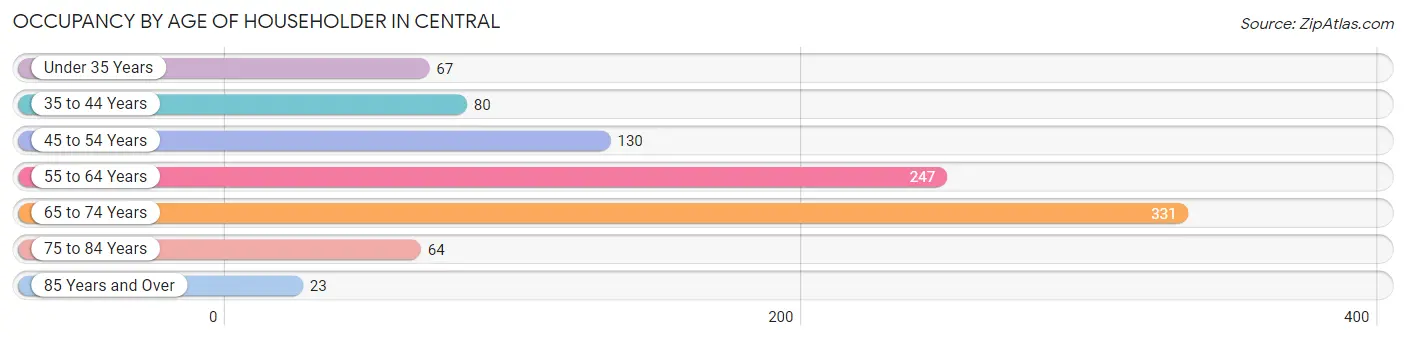
| Age Bracket | # Households | % Households |
| Under 35 Years | 67 | 7.1% |
| 35 to 44 Years | 80 | 8.5% |
| 45 to 54 Years | 130 | 13.8% |
| 55 to 64 Years | 247 | 26.2% |
| 65 to 74 Years | 331 | 35.1% |
| 75 to 84 Years | 64 | 6.8% |
| 85 Years and Over | 23 | 2.4% |
| Total | 942 | 100.0% |
Housing Finances in Central
Median Income by Occupancy in Central
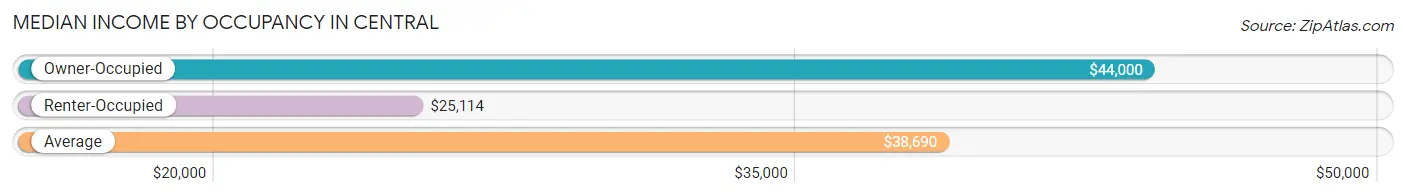
| Occupancy Type | # Households | Median Income |
| Owner-Occupied | 732 (77.7%) | $44,000 |
| Renter-Occupied | 210 (22.3%) | $25,114 |
| Average | 942 (100.0%) | $38,690 |
Occupancy by Householder Income Bracket in Central
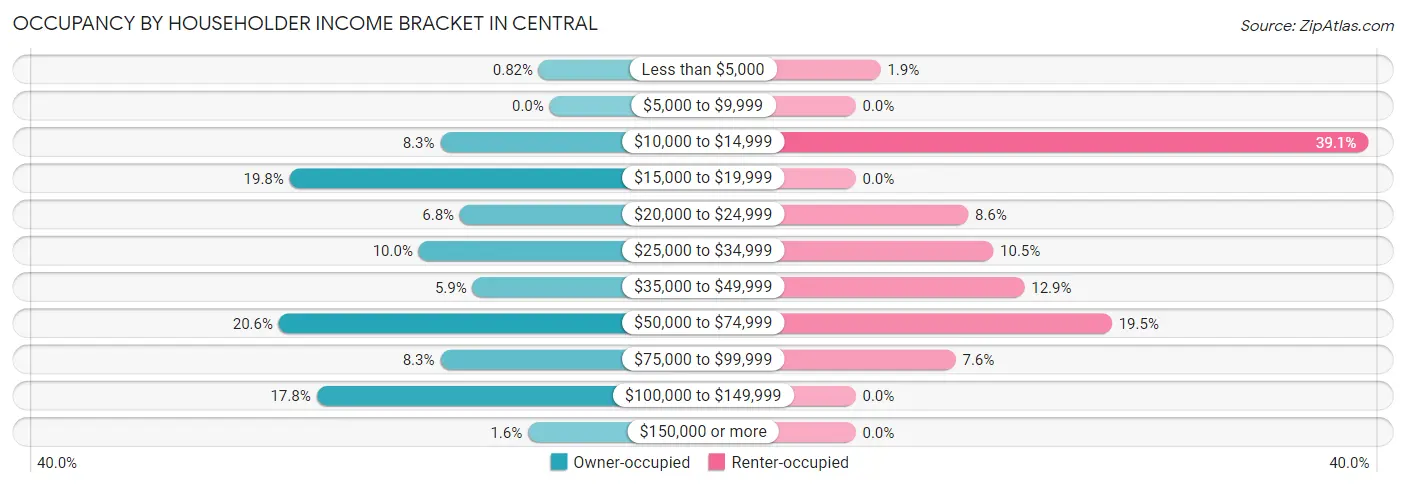
| Income Bracket | Owner-occupied | Renter-occupied |
| Less than $5,000 | 6 (0.8%) | 4 (1.9%) |
| $5,000 to $9,999 | 0 (0.0%) | 0 (0.0%) |
| $10,000 to $14,999 | 61 (8.3%) | 82 (39.1%) |
| $15,000 to $19,999 | 145 (19.8%) | 0 (0.0%) |
| $20,000 to $24,999 | 50 (6.8%) | 18 (8.6%) |
| $25,000 to $34,999 | 73 (10.0%) | 22 (10.5%) |
| $35,000 to $49,999 | 43 (5.9%) | 27 (12.9%) |
| $50,000 to $74,999 | 151 (20.6%) | 41 (19.5%) |
| $75,000 to $99,999 | 61 (8.3%) | 16 (7.6%) |
| $100,000 to $149,999 | 130 (17.8%) | 0 (0.0%) |
| $150,000 or more | 12 (1.6%) | 0 (0.0%) |
| Total | 732 (100.0%) | 210 (100.0%) |
Monthly Housing Cost Tiers in Central
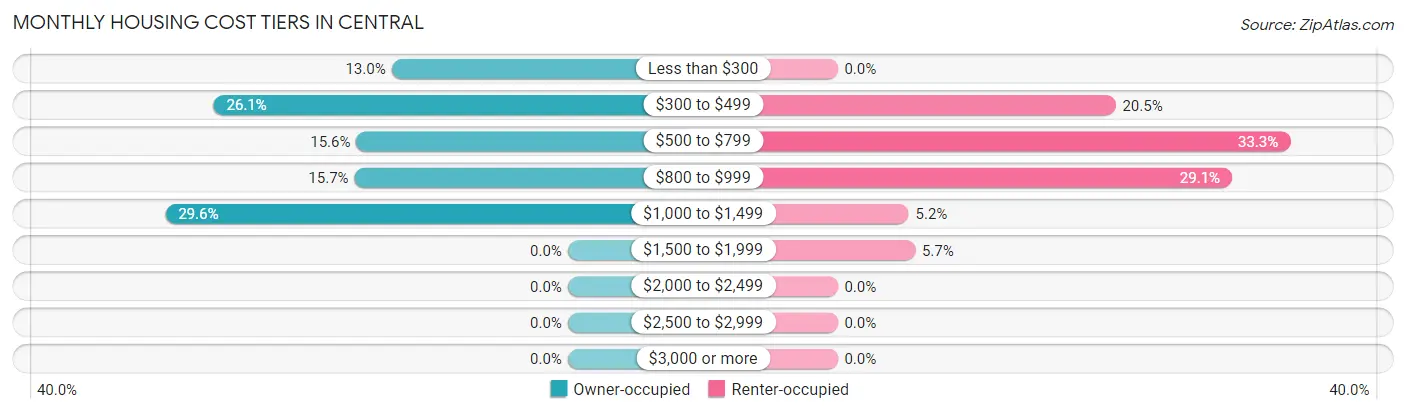
| Monthly Cost | Owner-occupied | Renter-occupied |
| Less than $300 | 95 (13.0%) | 0 (0.0%) |
| $300 to $499 | 191 (26.1%) | 43 (20.5%) |
| $500 to $799 | 114 (15.6%) | 70 (33.3%) |
| $800 to $999 | 115 (15.7%) | 61 (29.0%) |
| $1,000 to $1,499 | 217 (29.6%) | 11 (5.2%) |
| $1,500 to $1,999 | 0 (0.0%) | 12 (5.7%) |
| $2,000 to $2,499 | 0 (0.0%) | 0 (0.0%) |
| $2,500 to $2,999 | 0 (0.0%) | 0 (0.0%) |
| $3,000 or more | 0 (0.0%) | 0 (0.0%) |
| Total | 732 (100.0%) | 210 (100.0%) |
Physical Housing Characteristics in Central
Housing Structures in Central
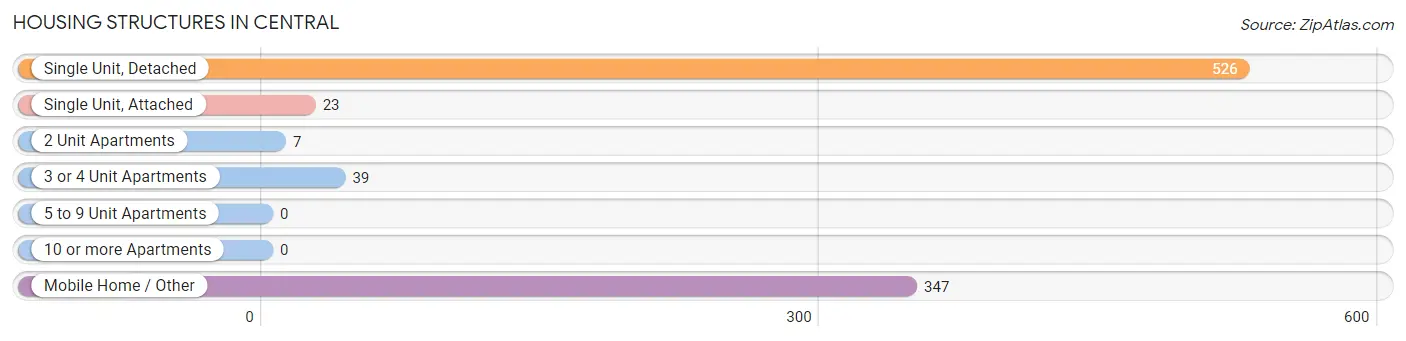
| Structure Type | # Housing Units | % Housing Units |
| Single Unit, Detached | 526 | 55.8% |
| Single Unit, Attached | 23 | 2.4% |
| 2 Unit Apartments | 7 | 0.7% |
| 3 or 4 Unit Apartments | 39 | 4.1% |
| 5 to 9 Unit Apartments | 0 | 0.0% |
| 10 or more Apartments | 0 | 0.0% |
| Mobile Home / Other | 347 | 36.8% |
| Total | 942 | 100.0% |
Housing Structures by Occupancy in Central
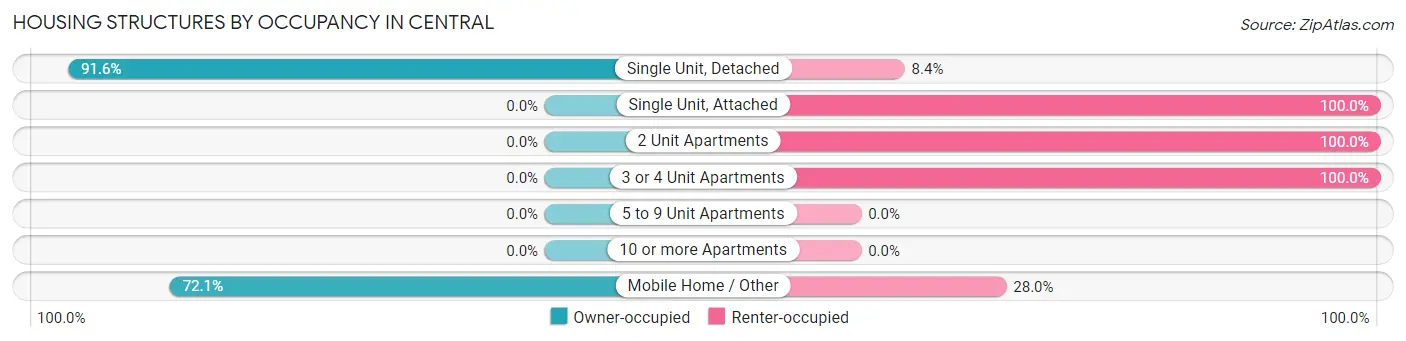
| Structure Type | Owner-occupied | Renter-occupied |
| Single Unit, Detached | 482 (91.6%) | 44 (8.4%) |
| Single Unit, Attached | 0 (0.0%) | 23 (100.0%) |
| 2 Unit Apartments | 0 (0.0%) | 7 (100.0%) |
| 3 or 4 Unit Apartments | 0 (0.0%) | 39 (100.0%) |
| 5 to 9 Unit Apartments | 0 (0.0%) | 0 (0.0%) |
| 10 or more Apartments | 0 (0.0%) | 0 (0.0%) |
| Mobile Home / Other | 250 (72.1%) | 97 (28.0%) |
| Total | 732 (77.7%) | 210 (22.3%) |
Housing Structures by Number of Rooms in Central
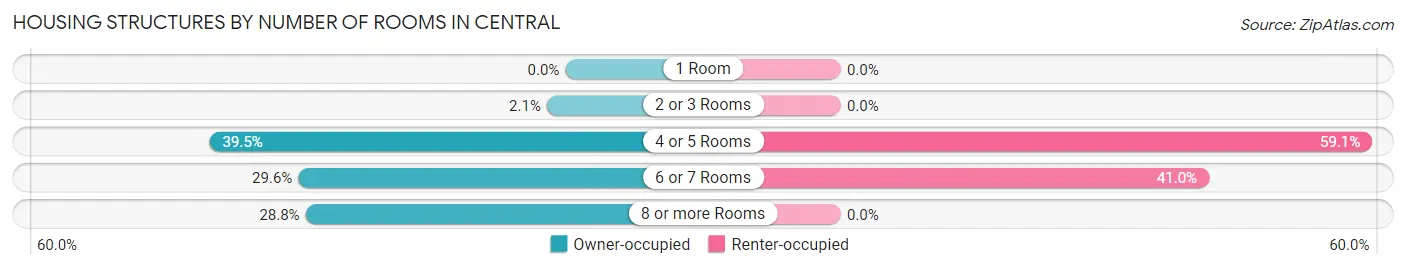
| Number of Rooms | Owner-occupied | Renter-occupied |
| 1 Room | 0 (0.0%) | 0 (0.0%) |
| 2 or 3 Rooms | 15 (2.1%) | 0 (0.0%) |
| 4 or 5 Rooms | 289 (39.5%) | 124 (59.1%) |
| 6 or 7 Rooms | 217 (29.6%) | 86 (40.9%) |
| 8 or more Rooms | 211 (28.8%) | 0 (0.0%) |
| Total | 732 (100.0%) | 210 (100.0%) |
Housing Structure by Heating Type in Central
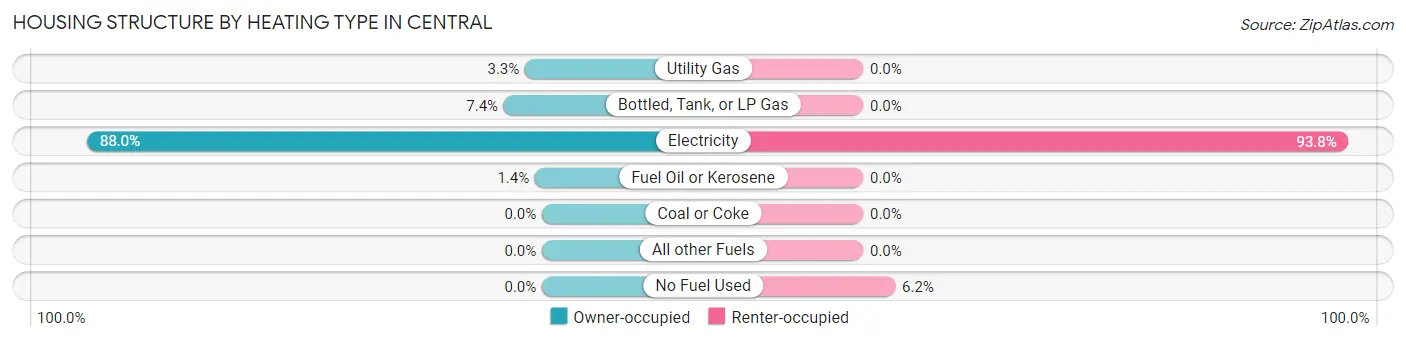
| Heating Type | Owner-occupied | Renter-occupied |
| Utility Gas | 24 (3.3%) | 0 (0.0%) |
| Bottled, Tank, or LP Gas | 54 (7.4%) | 0 (0.0%) |
| Electricity | 644 (88.0%) | 197 (93.8%) |
| Fuel Oil or Kerosene | 10 (1.4%) | 0 (0.0%) |
| Coal or Coke | 0 (0.0%) | 0 (0.0%) |
| All other Fuels | 0 (0.0%) | 0 (0.0%) |
| No Fuel Used | 0 (0.0%) | 13 (6.2%) |
| Total | 732 (100.0%) | 210 (100.0%) |
Household Vehicle Usage in Central
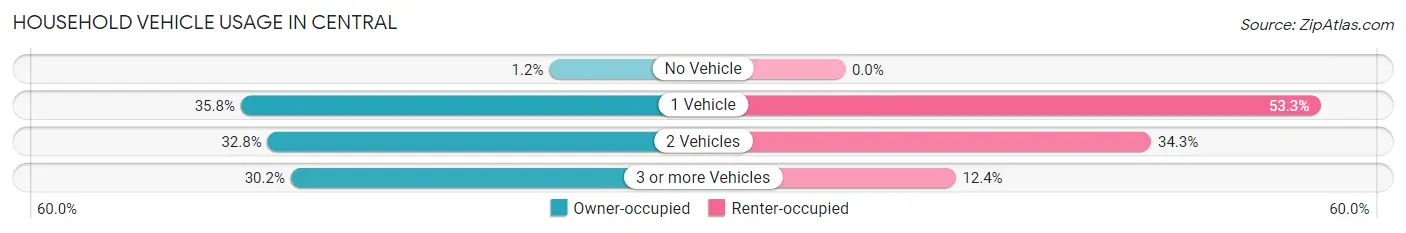
| Vehicles per Household | Owner-occupied | Renter-occupied |
| No Vehicle | 9 (1.2%) | 0 (0.0%) |
| 1 Vehicle | 262 (35.8%) | 112 (53.3%) |
| 2 Vehicles | 240 (32.8%) | 72 (34.3%) |
| 3 or more Vehicles | 221 (30.2%) | 26 (12.4%) |
| Total | 732 (100.0%) | 210 (100.0%) |
Real Estate & Mortgages in Central
Real Estate and Mortgage Overview in Central
| Characteristic | Without Mortgage | With Mortgage |
| Housing Units | 341 | 391 |
| Median Property Value | $108,100 | $137,800 |
| Median Household Income | $53,862 | $12 |
| Monthly Housing Costs | $383 | $0 |
| Real Estate Taxes | $554 | $0 |
Property Value by Mortgage Status in Central
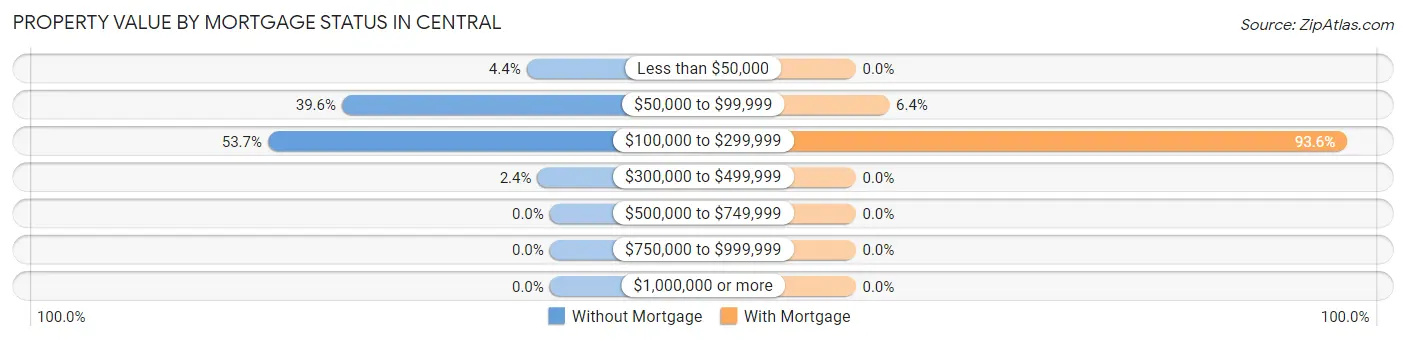
| Property Value | Without Mortgage | With Mortgage |
| Less than $50,000 | 15 (4.4%) | 0 (0.0%) |
| $50,000 to $99,999 | 135 (39.6%) | 25 (6.4%) |
| $100,000 to $299,999 | 183 (53.7%) | 366 (93.6%) |
| $300,000 to $499,999 | 8 (2.4%) | 0 (0.0%) |
| $500,000 to $749,999 | 0 (0.0%) | 0 (0.0%) |
| $750,000 to $999,999 | 0 (0.0%) | 0 (0.0%) |
| $1,000,000 or more | 0 (0.0%) | 0 (0.0%) |
| Total | 341 (100.0%) | 391 (100.0%) |
Household Income by Mortgage Status in Central
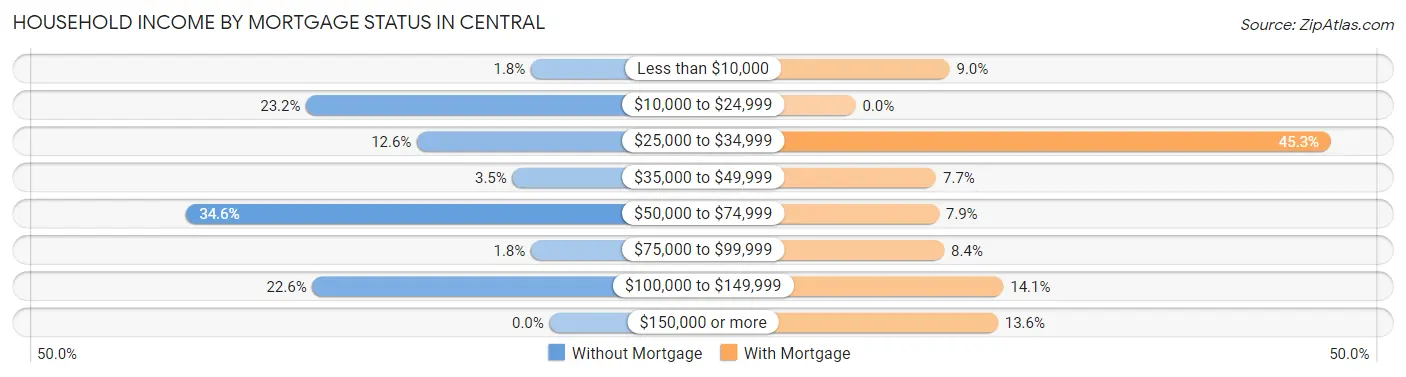
| Household Income | Without Mortgage | With Mortgage |
| Less than $10,000 | 6 (1.8%) | 35 (8.9%) |
| $10,000 to $24,999 | 79 (23.2%) | 0 (0.0%) |
| $25,000 to $34,999 | 43 (12.6%) | 177 (45.3%) |
| $35,000 to $49,999 | 12 (3.5%) | 30 (7.7%) |
| $50,000 to $74,999 | 118 (34.6%) | 31 (7.9%) |
| $75,000 to $99,999 | 6 (1.8%) | 33 (8.4%) |
| $100,000 to $149,999 | 77 (22.6%) | 55 (14.1%) |
| $150,000 or more | 0 (0.0%) | 53 (13.6%) |
| Total | 341 (100.0%) | 391 (100.0%) |
Property Value to Household Income Ratio in Central
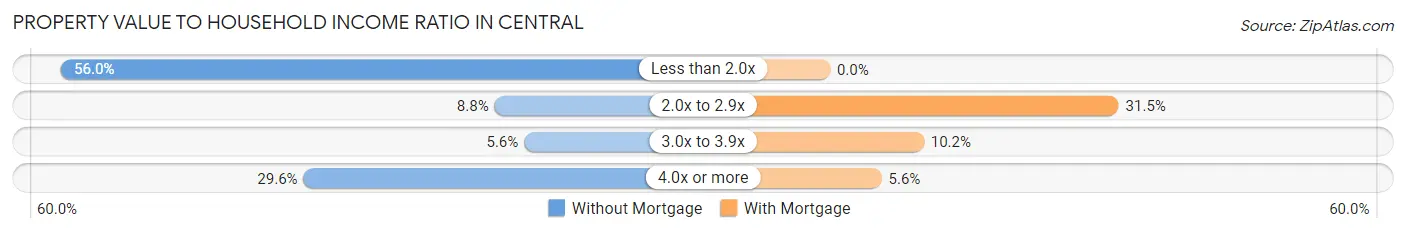
| Value-to-Income Ratio | Without Mortgage | With Mortgage |
| Less than 2.0x | 191 (56.0%) | 0 (0.0%) |
| 2.0x to 2.9x | 30 (8.8%) | 123 (31.5%) |
| 3.0x to 3.9x | 19 (5.6%) | 40 (10.2%) |
| 4.0x or more | 101 (29.6%) | 22 (5.6%) |
| Total | 341 (100.0%) | 391 (100.0%) |
Real Estate Taxes by Mortgage Status in Central
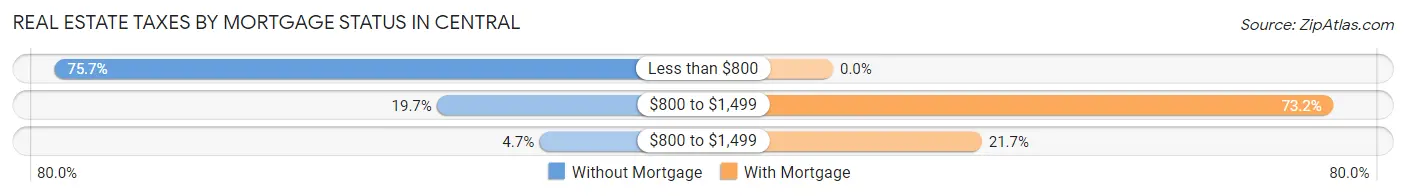
| Property Taxes | Without Mortgage | With Mortgage |
| Less than $800 | 258 (75.7%) | 0 (0.0%) |
| $800 to $1,499 | 67 (19.7%) | 286 (73.2%) |
| $800 to $1,499 | 16 (4.7%) | 85 (21.7%) |
| Total | 341 (100.0%) | 391 (100.0%) |
Health & Disability in Central
Health Insurance Coverage by Age in Central
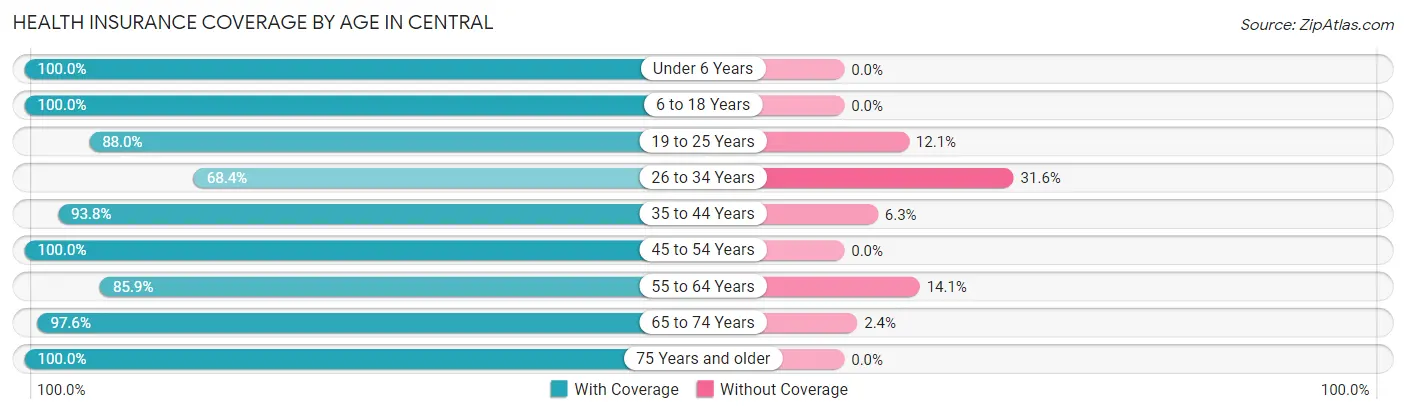
| Age Bracket | With Coverage | Without Coverage |
| Under 6 Years | 29 (100.0%) | 0 (0.0%) |
| 6 to 18 Years | 270 (100.0%) | 0 (0.0%) |
| 19 to 25 Years | 146 (87.9%) | 20 (12.0%) |
| 26 to 34 Years | 52 (68.4%) | 24 (31.6%) |
| 35 to 44 Years | 135 (93.8%) | 9 (6.2%) |
| 45 to 54 Years | 299 (100.0%) | 0 (0.0%) |
| 55 to 64 Years | 373 (85.9%) | 61 (14.1%) |
| 65 to 74 Years | 403 (97.6%) | 10 (2.4%) |
| 75 Years and older | 111 (100.0%) | 0 (0.0%) |
| Total | 1,818 (93.6%) | 124 (6.4%) |
Health Insurance Coverage by Citizenship Status in Central
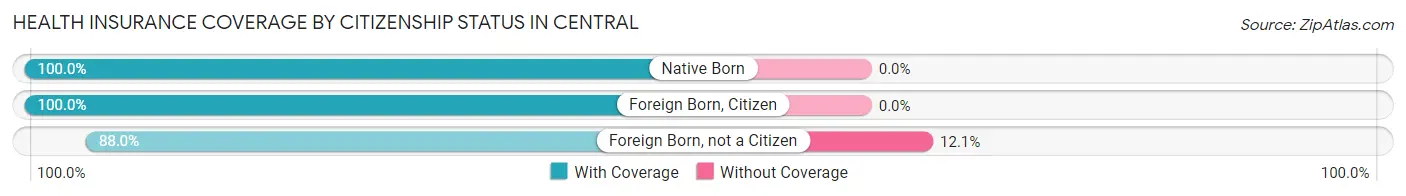
| Citizenship Status | With Coverage | Without Coverage |
| Native Born | 29 (100.0%) | 0 (0.0%) |
| Foreign Born, Citizen | 270 (100.0%) | 0 (0.0%) |
| Foreign Born, not a Citizen | 146 (87.9%) | 20 (12.0%) |
Health Insurance Coverage by Household Income in Central
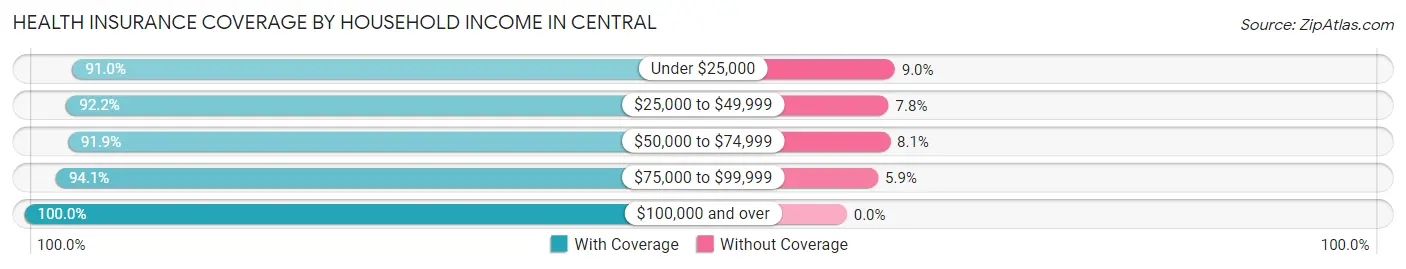
| Household Income | With Coverage | Without Coverage |
| Under $25,000 | 577 (91.0%) | 57 (9.0%) |
| $25,000 to $49,999 | 235 (92.2%) | 20 (7.8%) |
| $50,000 to $74,999 | 374 (91.9%) | 33 (8.1%) |
| $75,000 to $99,999 | 224 (94.1%) | 14 (5.9%) |
| $100,000 and over | 408 (100.0%) | 0 (0.0%) |
Public vs Private Health Insurance Coverage by Age in Central
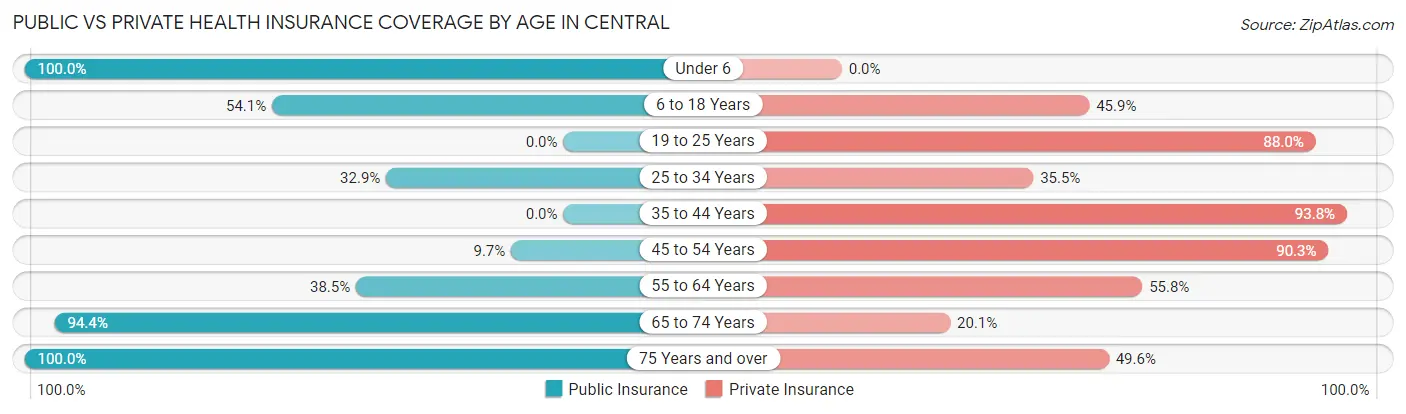
| Age Bracket | Public Insurance | Private Insurance |
| Under 6 | 29 (100.0%) | 0 (0.0%) |
| 6 to 18 Years | 146 (54.1%) | 124 (45.9%) |
| 19 to 25 Years | 0 (0.0%) | 146 (87.9%) |
| 25 to 34 Years | 25 (32.9%) | 27 (35.5%) |
| 35 to 44 Years | 0 (0.0%) | 135 (93.8%) |
| 45 to 54 Years | 29 (9.7%) | 270 (90.3%) |
| 55 to 64 Years | 167 (38.5%) | 242 (55.8%) |
| 65 to 74 Years | 390 (94.4%) | 83 (20.1%) |
| 75 Years and over | 111 (100.0%) | 55 (49.5%) |
| Total | 897 (46.2%) | 1,082 (55.7%) |
Disability Status by Sex by Age in Central
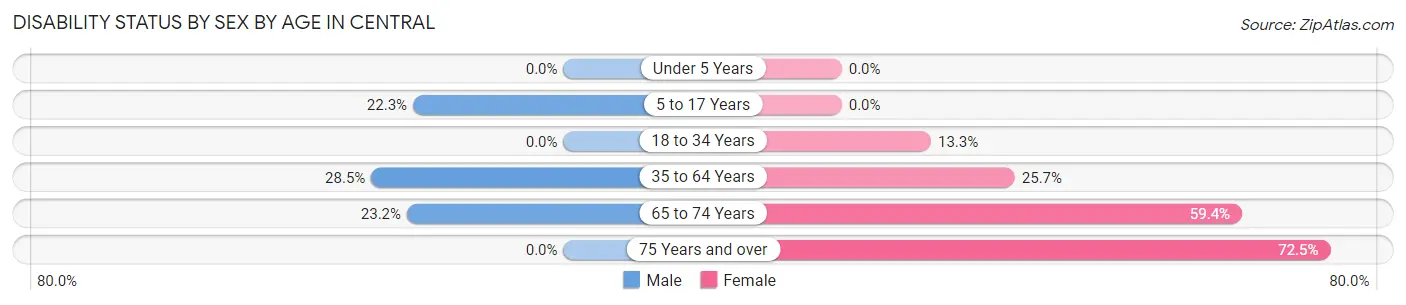
| Age Bracket | Male | Female |
| Under 5 Years | 0 (0.0%) | 0 (0.0%) |
| 5 to 17 Years | 21 (22.3%) | 0 (0.0%) |
| 18 to 34 Years | 0 (0.0%) | 20 (13.3%) |
| 35 to 64 Years | 117 (28.5%) | 120 (25.7%) |
| 65 to 74 Years | 33 (23.2%) | 161 (59.4%) |
| 75 Years and over | 0 (0.0%) | 66 (72.5%) |
Disability Class by Sex by Age in Central
Disability Class: Hearing Difficulty
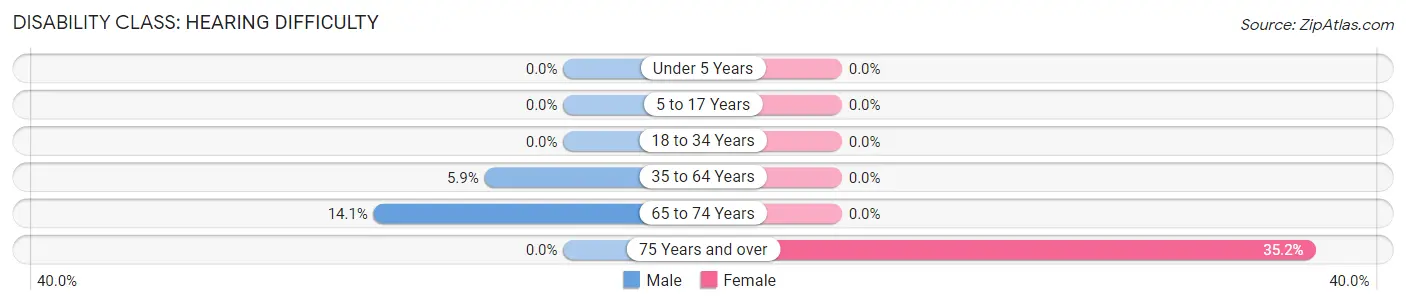
| Age Bracket | Male | Female |
| Under 5 Years | 0 (0.0%) | 0 (0.0%) |
| 5 to 17 Years | 0 (0.0%) | 0 (0.0%) |
| 18 to 34 Years | 0 (0.0%) | 0 (0.0%) |
| 35 to 64 Years | 24 (5.9%) | 0 (0.0%) |
| 65 to 74 Years | 20 (14.1%) | 0 (0.0%) |
| 75 Years and over | 0 (0.0%) | 32 (35.2%) |
Disability Class: Vision Difficulty
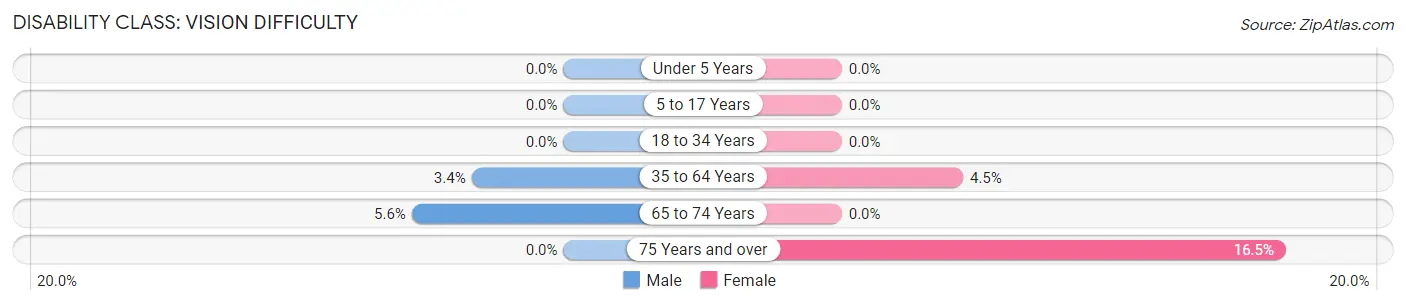
| Age Bracket | Male | Female |
| Under 5 Years | 0 (0.0%) | 0 (0.0%) |
| 5 to 17 Years | 0 (0.0%) | 0 (0.0%) |
| 18 to 34 Years | 0 (0.0%) | 0 (0.0%) |
| 35 to 64 Years | 14 (3.4%) | 21 (4.5%) |
| 65 to 74 Years | 8 (5.6%) | 0 (0.0%) |
| 75 Years and over | 0 (0.0%) | 15 (16.5%) |
Disability Class: Cognitive Difficulty
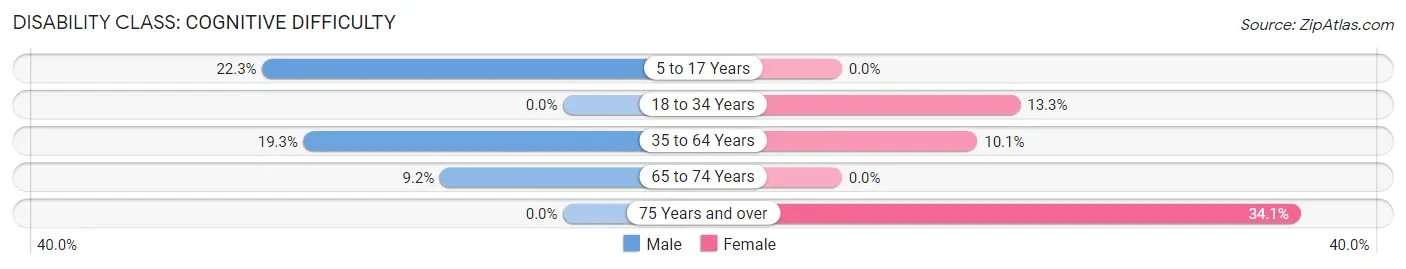
| Age Bracket | Male | Female |
| 5 to 17 Years | 21 (22.3%) | 0 (0.0%) |
| 18 to 34 Years | 0 (0.0%) | 20 (13.3%) |
| 35 to 64 Years | 79 (19.3%) | 47 (10.1%) |
| 65 to 74 Years | 13 (9.1%) | 0 (0.0%) |
| 75 Years and over | 0 (0.0%) | 31 (34.1%) |
Disability Class: Ambulatory Difficulty
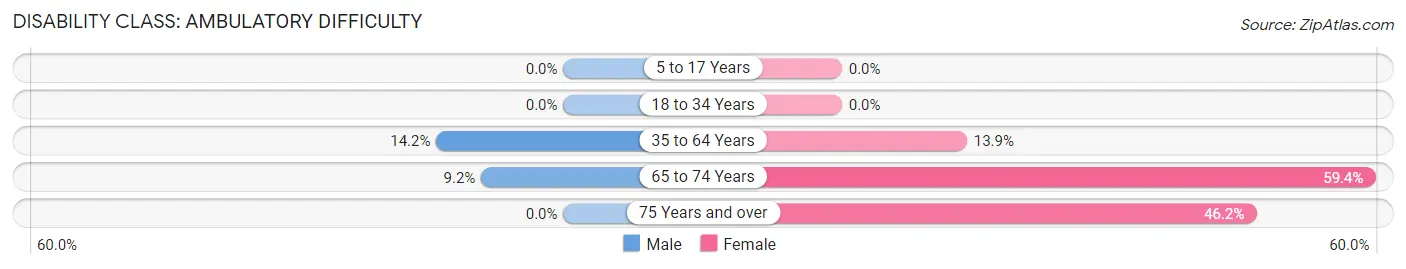
| Age Bracket | Male | Female |
| 5 to 17 Years | 0 (0.0%) | 0 (0.0%) |
| 18 to 34 Years | 0 (0.0%) | 0 (0.0%) |
| 35 to 64 Years | 58 (14.1%) | 65 (13.9%) |
| 65 to 74 Years | 13 (9.1%) | 161 (59.4%) |
| 75 Years and over | 0 (0.0%) | 42 (46.2%) |
Disability Class: Self-Care Difficulty
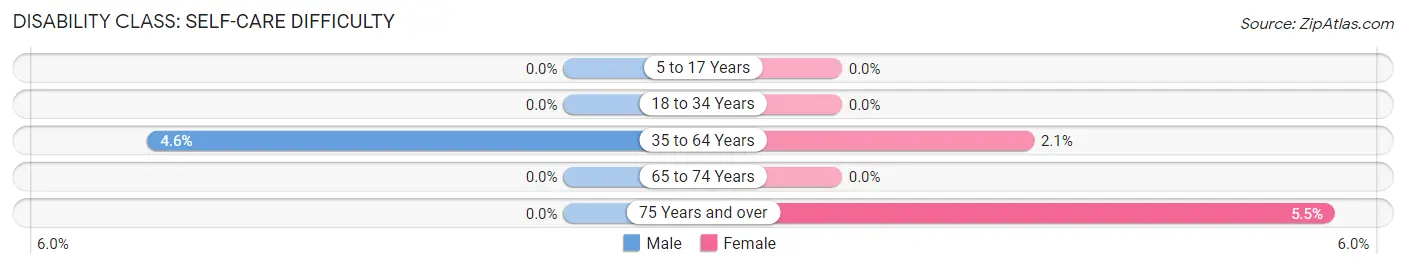
| Age Bracket | Male | Female |
| 5 to 17 Years | 0 (0.0%) | 0 (0.0%) |
| 18 to 34 Years | 0 (0.0%) | 0 (0.0%) |
| 35 to 64 Years | 19 (4.6%) | 10 (2.1%) |
| 65 to 74 Years | 0 (0.0%) | 0 (0.0%) |
| 75 Years and over | 0 (0.0%) | 5 (5.5%) |
Technology Access in Central
Computing Device Access in Central
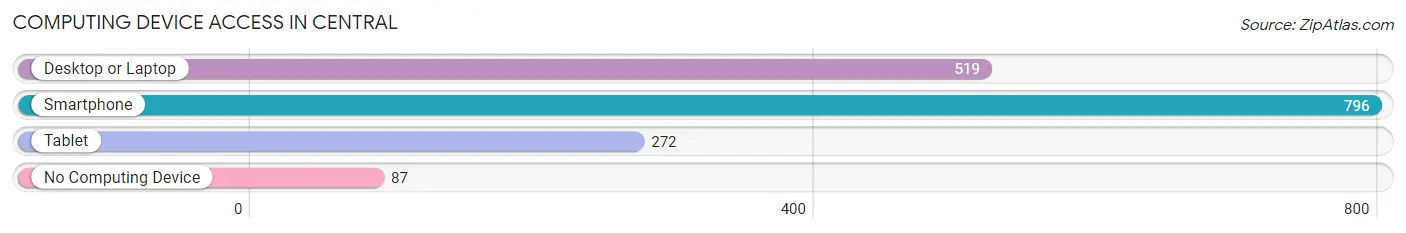
| Device Type | # Households | % Households |
| Desktop or Laptop | 519 | 55.1% |
| Smartphone | 796 | 84.5% |
| Tablet | 272 | 28.9% |
| No Computing Device | 87 | 9.2% |
| Total | 942 | 100.0% |
Internet Access in Central
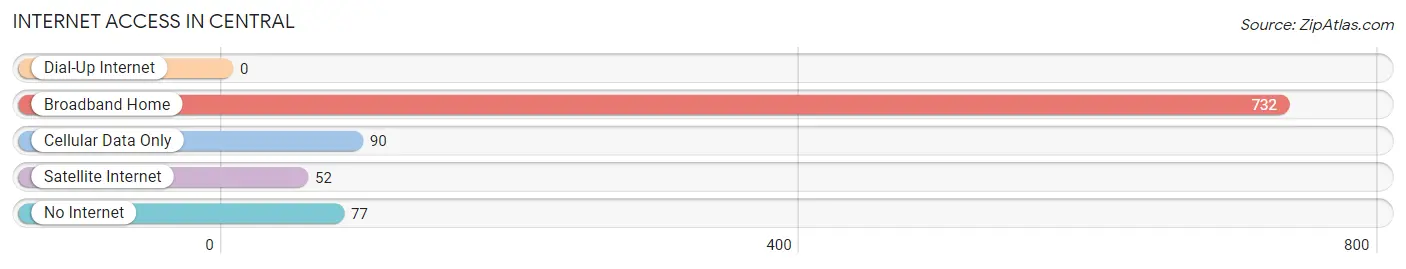
| Internet Type | # Households | % Households |
| Dial-Up Internet | 0 | 0.0% |
| Broadband Home | 732 | 77.7% |
| Cellular Data Only | 90 | 9.6% |
| Satellite Internet | 52 | 5.5% |
| No Internet | 77 | 8.2% |
| Total | 942 | 100.0% |
Central Summary
Central, Tennessee is a city located in the heart of the state, just south of Nashville. It is the county seat of Maury County and is home to a population of approximately 34,000 people. The city is known for its rich history, beautiful geography, and vibrant economy.
History
Central, Tennessee was founded in 1817 and was originally known as Mount Pleasant. The city was named after the nearby Central College, which was established in 1819. The college was the first college in the state and was the first to offer a degree in the sciences. The city was officially incorporated in 1823 and was renamed Central in 1826.
The city was an important center of commerce and industry during the 19th century. It was home to several factories, including a cotton mill, a paper mill, and a tannery. The city was also home to several educational institutions, including Central College, which was the first college in the state to offer a degree in the sciences.
The city was also an important center of the Civil War. It was the site of the Battle of Franklin in 1864, which was one of the bloodiest battles of the war. The city was also the site of the Battle of Nashville in 1864, which was the last major battle of the war.
Geography
Central, Tennessee is located in the heart of the state, just south of Nashville. It is situated in the rolling hills of the Nashville Basin, which is part of the Central Basin of Tennessee. The city is located on the banks of the Duck River, which is a major tributary of the Cumberland River.
The city is surrounded by several small towns and villages, including Spring Hill, Columbia, and Mount Pleasant. The city is also home to several parks and recreational areas, including the Maury County Park, which is a popular destination for outdoor activities.
Economy
Central, Tennessee has a vibrant economy that is driven by a variety of industries. The city is home to several manufacturing companies, including a paper mill, a cotton mill, and a tannery. The city is also home to several educational institutions, including Central College, which is the first college in the state to offer a degree in the sciences.
The city is also home to several retail stores, restaurants, and other businesses. The city is also home to several medical facilities, including Maury Regional Medical Center, which is the largest hospital in the region.
Demographics
As of the 2010 census, the population of Central, Tennessee was 34,000. The city is predominantly white, with a population that is approximately 85% white. The city is also home to a large African American population, which makes up approximately 10% of the population. The city is also home to a small Hispanic population, which makes up approximately 3% of the population. The median household income in the city is approximately $45,000, which is slightly lower than the state average.
Common Questions
What is the Total Population of Central?
Total Population of Central is 1,942.
What is the Total Male Population of Central?
Total Male Population of Central is 830.
What is the Total Female Population of Central?
Total Female Population of Central is 1,112.
What is the Ratio of Males per 100 Females in Central?
There are 74.64 Males per 100 Females in Central.
What is the Ratio of Females per 100 Males in Central?
There are 133.98 Females per 100 Males in Central.
What is the Median Population Age in Central?
Median Population Age in Central is 54.7 Years.
What is the Average Family Size in Central
Average Family Size in Central is 2.8 People.
What is the Average Household Size in Central
Average Household Size in Central is 2.1 People.
What is Per Capita Income in Central?
Per Capita income in Central is $24,428.
What is the Median Family Income in Central?
Median Family Income in Central is $57,045.
What is the Median Household income in Central?
Median Household Income in Central is $38,690.
What is Income or Wage Gap in Central?
Income or Wage Gap in Central is 25.0%.
Women in Central earn 75.0 cents for every dollar earned by a man.
What is Inequality or Gini Index in Central?
Inequality or Gini Index in Central is 0.42.
How Large is the Labor Force in Central?
There are 871 People in the Labor Forcein in Central.
What is the Percentage of People in the Labor Force in Central?
49.7% of People are in the Labor Force in Central.
What is the Unemployment Rate in Central?
Unemployment Rate in Central is 4.6%.