Madisonville, TN
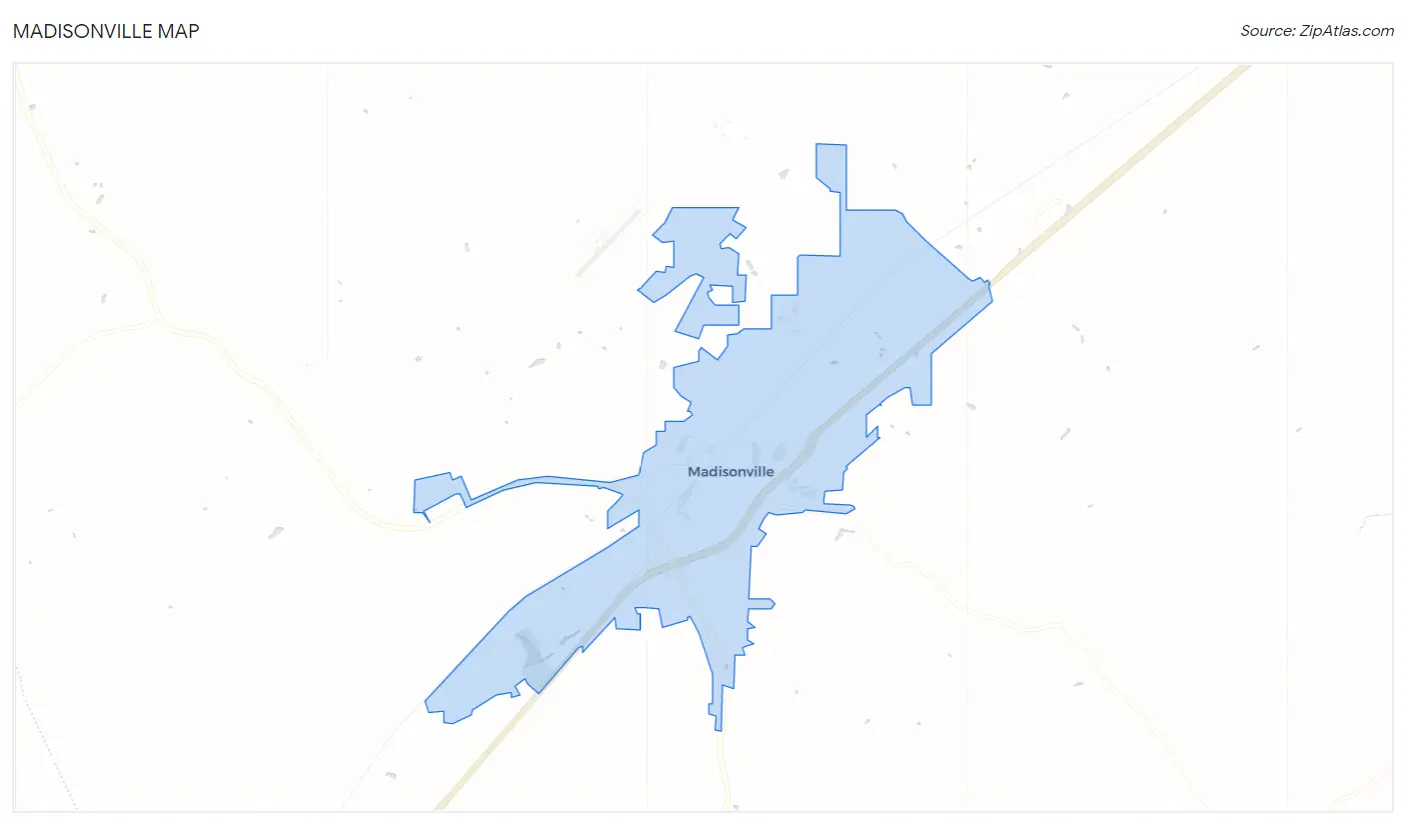
Madisonville Map
Madisonville Overview
5,120
TOTAL POPULATION
2,379
MALE POPULATION
2,741
FEMALE POPULATION
86.79
MALES / 100 FEMALES
115.22
FEMALES / 100 MALES
41.7
MEDIAN AGE
2.9
AVG FAMILY SIZE
2.3
AVG HOUSEHOLD SIZE
$21,652
PER CAPITA INCOME
$58,026
AVG FAMILY INCOME
$40,769
AVG HOUSEHOLD INCOME
42.4%
WAGE / INCOME GAP [ % ]
57.6¢/ $1
WAGE / INCOME GAP [ $ ]
0.40
INEQUALITY / GINI INDEX
2,241
LABOR FORCE [ PEOPLE ]
53.5%
PERCENT IN LABOR FORCE
7.4%
UNEMPLOYMENT RATE
Madisonville Zip Codes
Madisonville Area Codes
Race in Madisonville
The most populous races in Madisonville are White / Caucasian (4,571 | 89.3%), Two or more Races (306 | 6.0%), and Hispanic or Latino (212 | 4.1%).
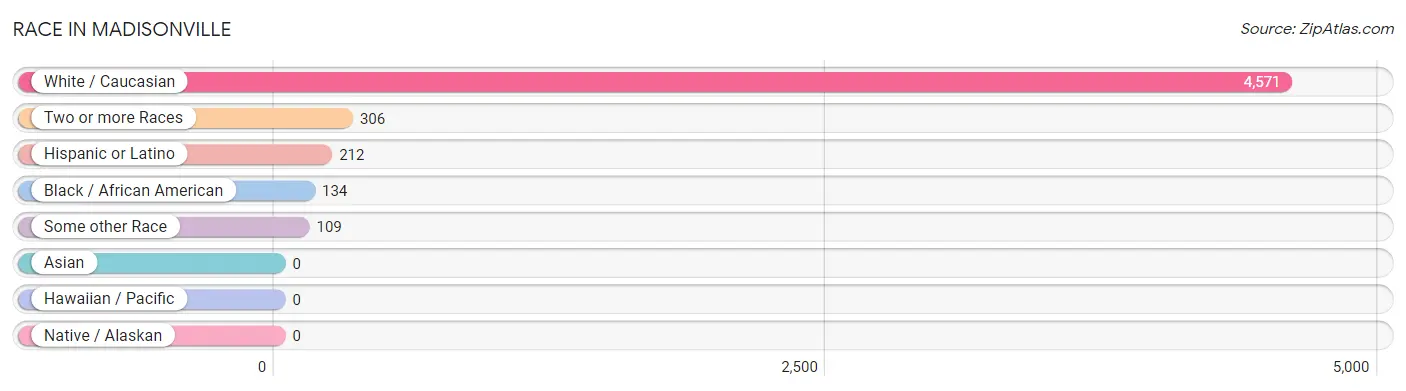
| Race | # Population | % Population |
| Asian | 0 | 0.0% |
| Black / African American | 134 | 2.6% |
| Hawaiian / Pacific | 0 | 0.0% |
| Hispanic or Latino | 212 | 4.1% |
| Native / Alaskan | 0 | 0.0% |
| White / Caucasian | 4,571 | 89.3% |
| Two or more Races | 306 | 6.0% |
| Some other Race | 109 | 2.1% |
| Total | 5,120 | 100.0% |
Ancestry in Madisonville
The most populous ancestries reported in Madisonville are American (628 | 12.3%), German (510 | 10.0%), French (289 | 5.6%), Irish (274 | 5.3%), and English (219 | 4.3%), together accounting for 37.5% of all Madisonville residents.
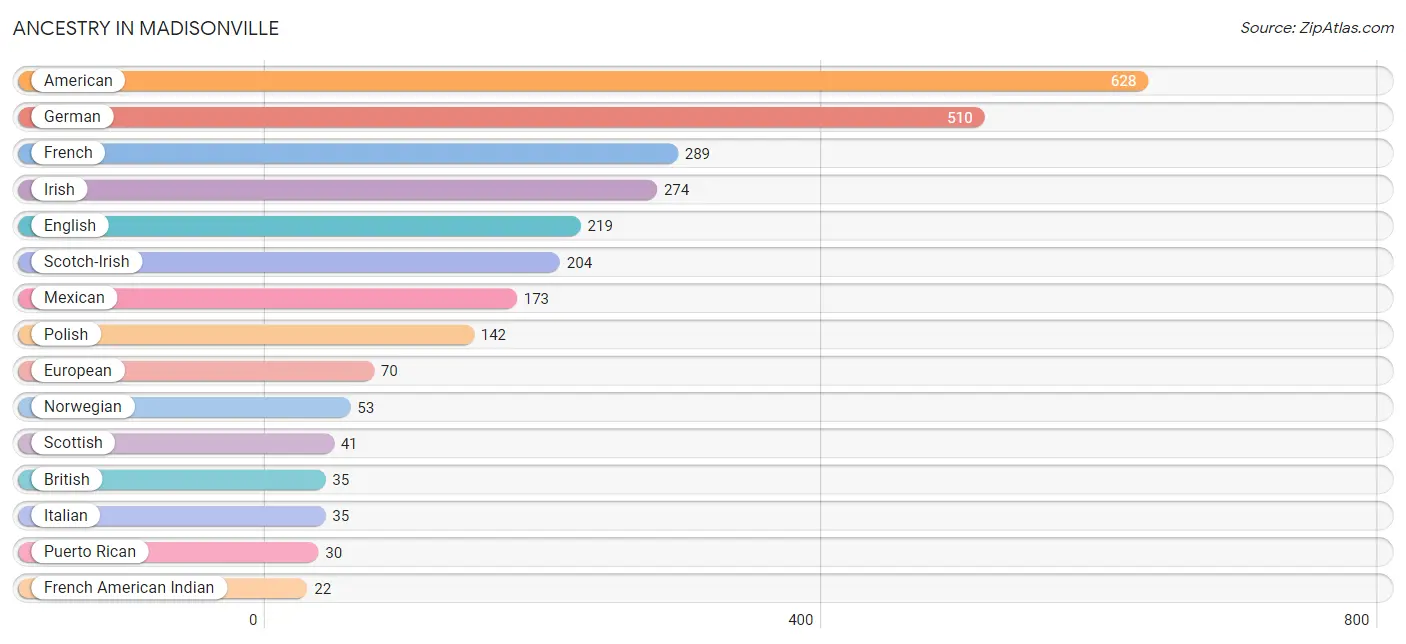
| Ancestry | # Population | % Population |
| African | 10 | 0.2% |
| American | 628 | 12.3% |
| Arab | 12 | 0.2% |
| Bhutanese | 13 | 0.3% |
| British | 35 | 0.7% |
| Cherokee | 5 | 0.1% |
| Danish | 14 | 0.3% |
| Dutch | 17 | 0.3% |
| English | 219 | 4.3% |
| European | 70 | 1.4% |
| French | 289 | 5.6% |
| French American Indian | 22 | 0.4% |
| French Canadian | 17 | 0.3% |
| German | 510 | 10.0% |
| Irish | 274 | 5.3% |
| Italian | 35 | 0.7% |
| Jordanian | 2 | 0.0% |
| Mexican | 173 | 3.4% |
| Norwegian | 53 | 1.0% |
| Polish | 142 | 2.8% |
| Puerto Rican | 30 | 0.6% |
| Scotch-Irish | 204 | 4.0% |
| Scottish | 41 | 0.8% |
| Subsaharan African | 10 | 0.2% |
| Syrian | 10 | 0.2% |
| Turkish | 13 | 0.3% |
| Welsh | 15 | 0.3% | View All 27 Rows |
Immigrants in Madisonville
The most numerous immigrant groups reported in Madisonville came from Europe (37 | 0.7%), Northern Europe (37 | 0.7%), Central America (20 | 0.4%), England (20 | 0.4%), and Latin America (20 | 0.4%), together accounting for 2.6% of all Madisonville residents.
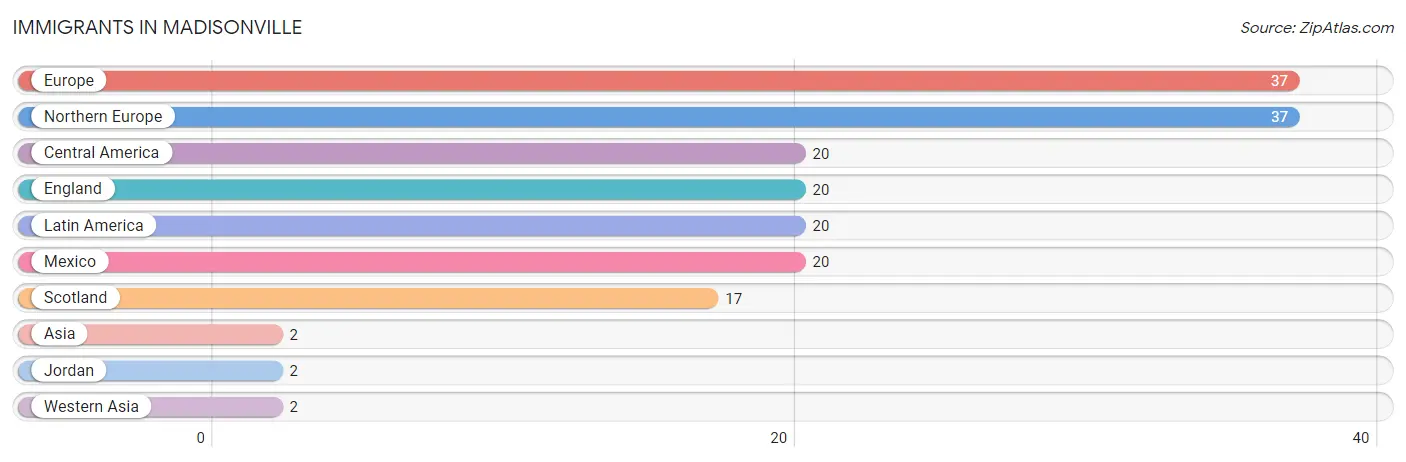
| Immigration Origin | # Population | % Population |
| Asia | 2 | 0.0% |
| Central America | 20 | 0.4% |
| England | 20 | 0.4% |
| Europe | 37 | 0.7% |
| Jordan | 2 | 0.0% |
| Latin America | 20 | 0.4% |
| Mexico | 20 | 0.4% |
| Northern Europe | 37 | 0.7% |
| Scotland | 17 | 0.3% |
| Western Asia | 2 | 0.0% | View All 10 Rows |
Sex and Age in Madisonville
Sex and Age in Madisonville
The most populous age groups in Madisonville are 45 to 49 Years (261 | 11.0%) for men and 15 to 19 Years (288 | 10.5%) for women.
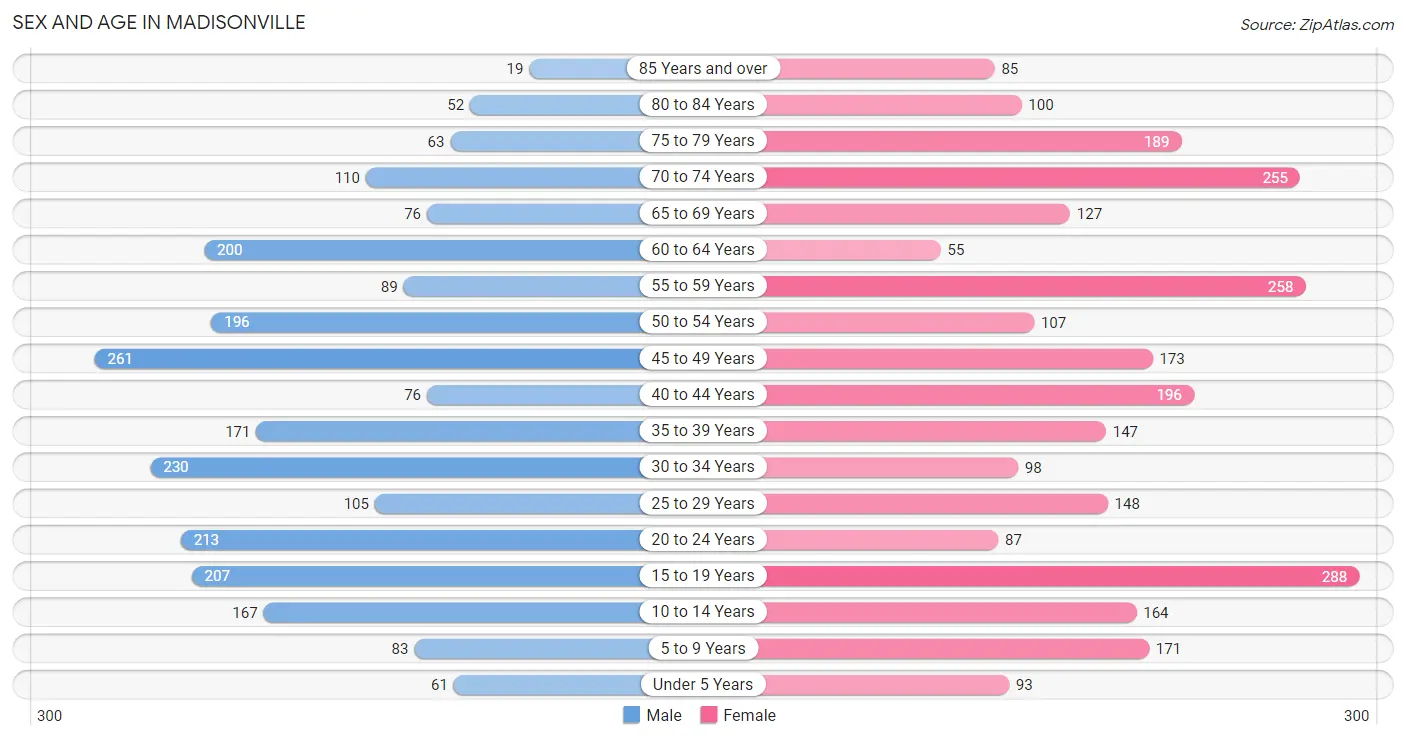
| Age Bracket | Male | Female |
| Under 5 Years | 61 (2.6%) | 93 (3.4%) |
| 5 to 9 Years | 83 (3.5%) | 171 (6.2%) |
| 10 to 14 Years | 167 (7.0%) | 164 (6.0%) |
| 15 to 19 Years | 207 (8.7%) | 288 (10.5%) |
| 20 to 24 Years | 213 (8.9%) | 87 (3.2%) |
| 25 to 29 Years | 105 (4.4%) | 148 (5.4%) |
| 30 to 34 Years | 230 (9.7%) | 98 (3.6%) |
| 35 to 39 Years | 171 (7.2%) | 147 (5.4%) |
| 40 to 44 Years | 76 (3.2%) | 196 (7.1%) |
| 45 to 49 Years | 261 (11.0%) | 173 (6.3%) |
| 50 to 54 Years | 196 (8.2%) | 107 (3.9%) |
| 55 to 59 Years | 89 (3.7%) | 258 (9.4%) |
| 60 to 64 Years | 200 (8.4%) | 55 (2.0%) |
| 65 to 69 Years | 76 (3.2%) | 127 (4.6%) |
| 70 to 74 Years | 110 (4.6%) | 255 (9.3%) |
| 75 to 79 Years | 63 (2.6%) | 189 (6.9%) |
| 80 to 84 Years | 52 (2.2%) | 100 (3.6%) |
| 85 Years and over | 19 (0.8%) | 85 (3.1%) |
| Total | 2,379 (100.0%) | 2,741 (100.0%) |
Families and Households in Madisonville
Median Family Size in Madisonville
The median family size in Madisonville is 2.91 persons per family, with married-couple families (770 | 59.1%) accounting for the largest median family size of 3.28 persons per family. On the other hand, single male/father families (98 | 7.5%) represent the smallest median family size with 1.96 persons per family.
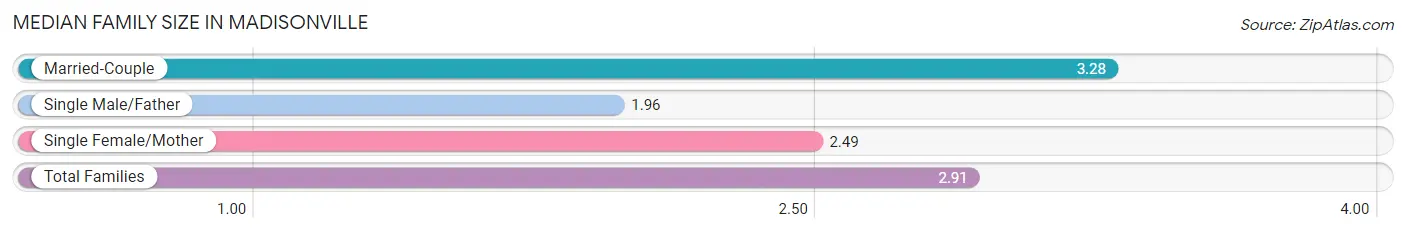
| Family Type | # Families | Family Size |
| Married-Couple | 770 (59.1%) | 3.28 |
| Single Male/Father | 98 (7.5%) | 1.96 |
| Single Female/Mother | 434 (33.3%) | 2.49 |
| Total Families | 1,302 (100.0%) | 2.91 |
Median Household Size in Madisonville
The median household size in Madisonville is 2.30 persons per household, with married-couple households (770 | 36.8%) accounting for the largest median household size of 3.28 persons per household. non-family households (788 | 37.7%) represent the smallest median household size with 1.17 persons per household.
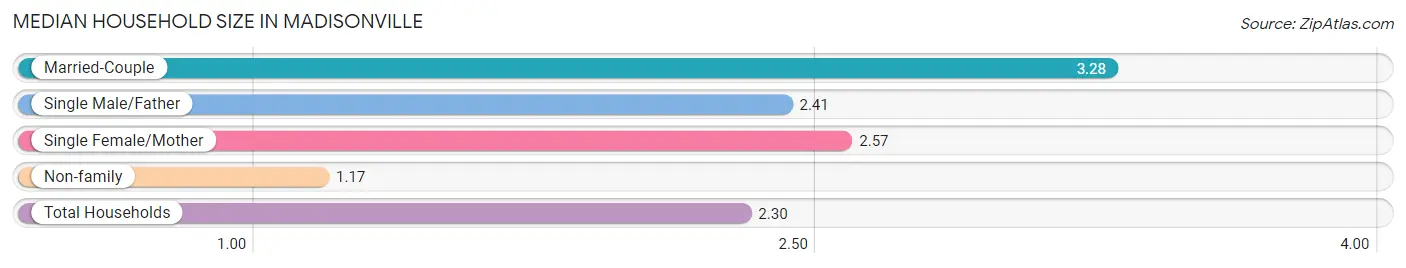
| Household Type | # Households | Household Size |
| Married-Couple | 770 (36.8%) | 3.28 |
| Single Male/Father | 98 (4.7%) | 2.41 |
| Single Female/Mother | 434 (20.8%) | 2.57 |
| Non-family | 788 (37.7%) | 1.17 |
| Total Households | 2,090 (100.0%) | 2.30 |
Household Size by Marriage Status in Madisonville
Out of a total of 2,090 households in Madisonville, 1,302 (62.3%) are family households, while 788 (37.7%) are nonfamily households. The most numerous type of family households are 2-person households, comprising 624, and the most common type of nonfamily households are 1-person households, comprising 696.
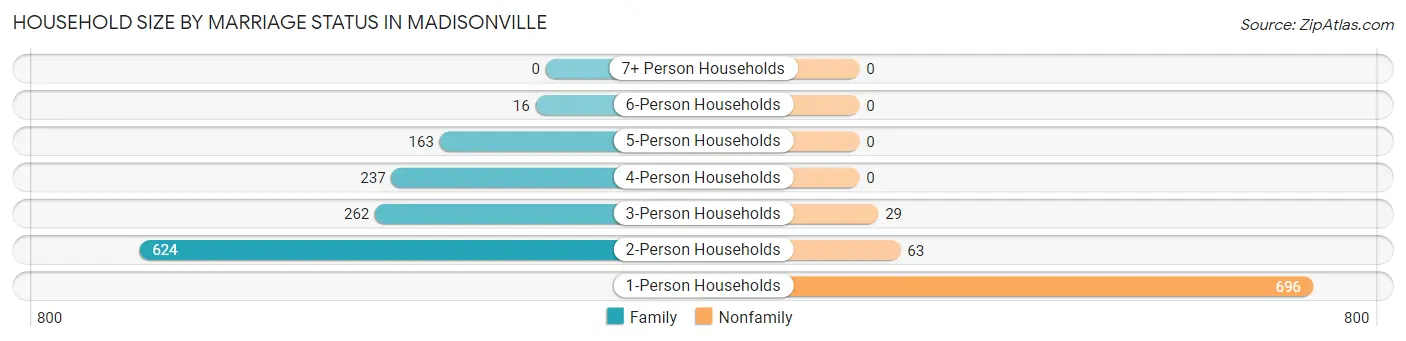
| Household Size | Family Households | Nonfamily Households |
| 1-Person Households | - | 696 (33.3%) |
| 2-Person Households | 624 (29.9%) | 63 (3.0%) |
| 3-Person Households | 262 (12.5%) | 29 (1.4%) |
| 4-Person Households | 237 (11.3%) | 0 (0.0%) |
| 5-Person Households | 163 (7.8%) | 0 (0.0%) |
| 6-Person Households | 16 (0.8%) | 0 (0.0%) |
| 7+ Person Households | 0 (0.0%) | 0 (0.0%) |
| Total | 1,302 (62.3%) | 788 (37.7%) |
Female Fertility in Madisonville
Fertility by Age in Madisonville
Average fertility rate in Madisonville is 76.0 births per 1,000 women. Women in the age bracket of 20 to 34 years have the highest fertility rate with 222.0 births per 1,000 women. Women in the age bracket of 20 to 34 years acount for 83.2% of all women with births.
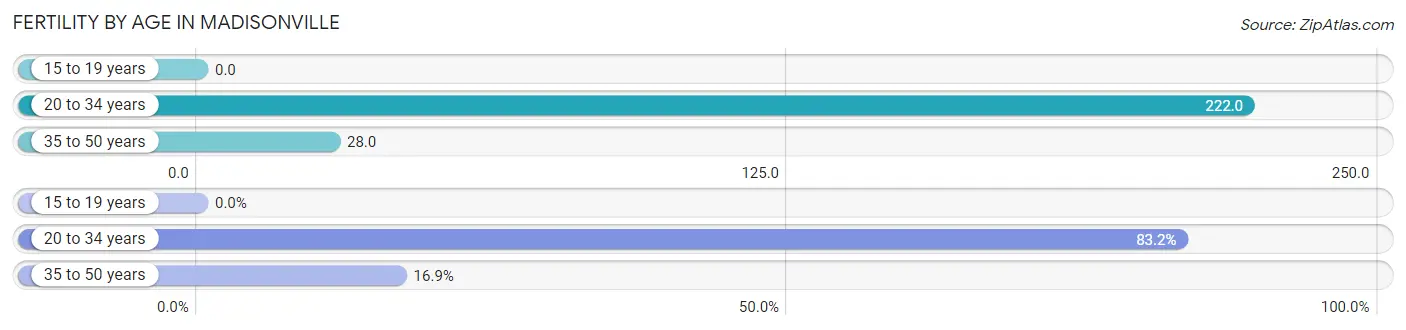
| Age Bracket | Women with Births | Births / 1,000 Women |
| 15 to 19 years | 0 (0.0%) | 0.0 |
| 20 to 34 years | 74 (83.2%) | 222.0 |
| 35 to 50 years | 15 (16.9%) | 28.0 |
| Total | 89 (100.0%) | 76.0 |
Fertility by Age by Marriage Status in Madisonville
16.9% of women with births (89) in Madisonville are married. The highest percentage of unmarried women with births falls into 20 to 34 years age bracket with 100.0% of them unmarried at the time of birth, while the lowest percentage of unmarried women with births belong to 35 to 50 years age bracket with 0.0% of them unmarried.
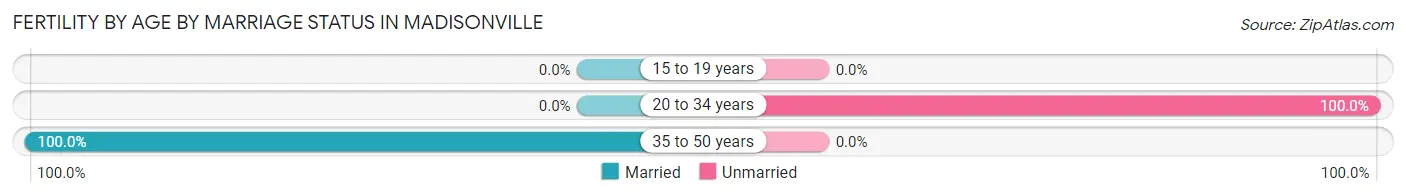
| Age Bracket | Married | Unmarried |
| 15 to 19 years | 0 (0.0%) | 0 (0.0%) |
| 20 to 34 years | 0 (0.0%) | 74 (100.0%) |
| 35 to 50 years | 15 (100.0%) | 0 (0.0%) |
| Total | 15 (16.9%) | 74 (83.2%) |
Fertility by Education in Madisonville
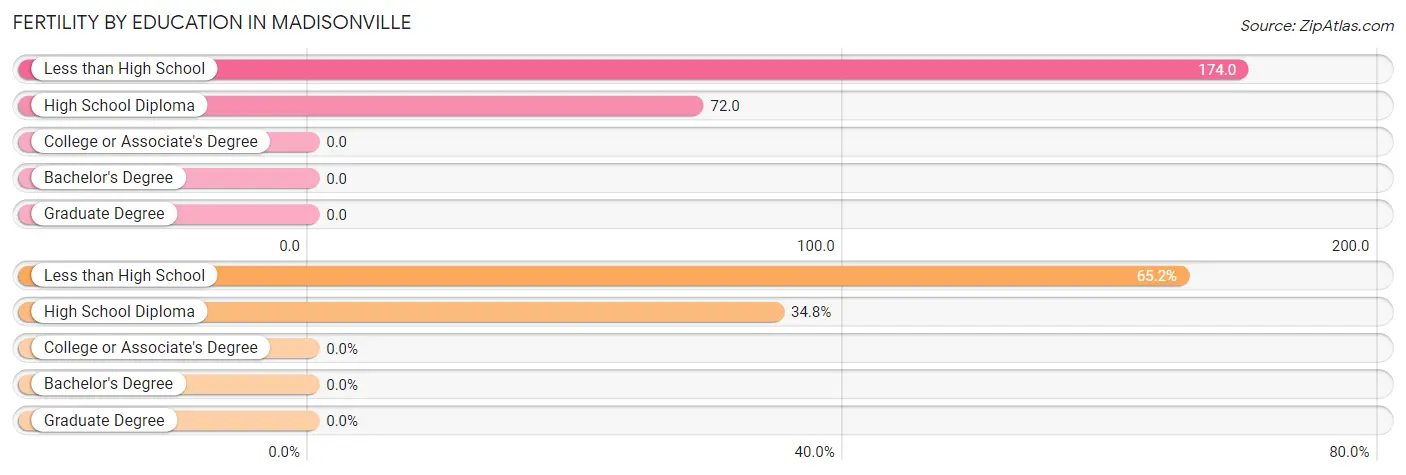
| Educational Attainment | Women with Births | Births / 1,000 Women |
| Less than High School | 58 (65.2%) | 174.0 |
| High School Diploma | 31 (34.8%) | 72.0 |
| College or Associate's Degree | 0 (0.0%) | 0.0 |
| Bachelor's Degree | 0 (0.0%) | 0.0 |
| Graduate Degree | 0 (0.0%) | 0.0 |
| Total | 89 (100.0%) | 76.0 |
Fertility by Education by Marriage Status in Madisonville
83.2% of women with births in Madisonville are unmarried. Women with the educational attainment of high school diploma are most likely to be married with 48.4% of them married at childbirth, while women with the educational attainment of less than high school are least likely to be married with 100.0% of them unmarried at childbirth.
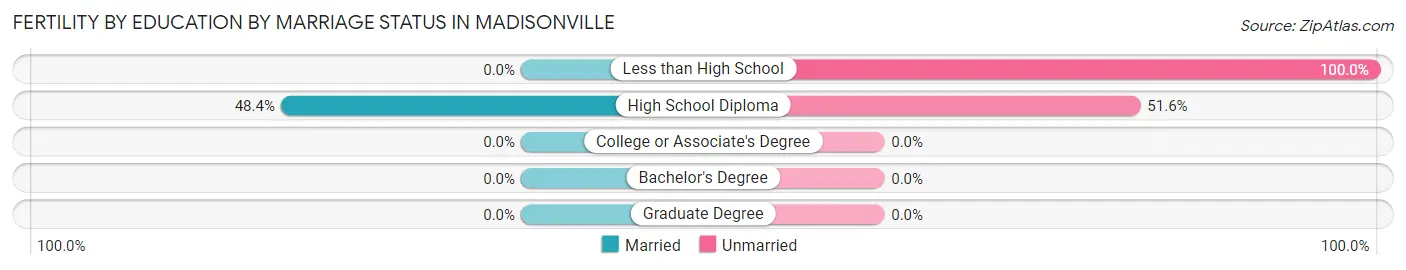
| Educational Attainment | Married | Unmarried |
| Less than High School | 0 (0.0%) | 58 (100.0%) |
| High School Diploma | 15 (48.4%) | 16 (51.6%) |
| College or Associate's Degree | 0 (0.0%) | 0 (0.0%) |
| Bachelor's Degree | 0 (0.0%) | 0 (0.0%) |
| Graduate Degree | 0 (0.0%) | 0 (0.0%) |
| Total | 15 (16.9%) | 74 (83.2%) |
Income in Madisonville
Income Overview in Madisonville
Per Capita Income in Madisonville is $21,652, while median incomes of families and households are $58,026 and $40,769 respectively.
| Characteristic | Number | Measure |
| Per Capita Income | 5,120 | $21,652 |
| Median Family Income | 1,302 | $58,026 |
| Mean Family Income | 1,302 | $65,084 |
| Median Household Income | 2,090 | $40,769 |
| Mean Household Income | 2,090 | $51,817 |
| Income Deficit | 1,302 | $0 |
| Wage / Income Gap (%) | 5,120 | 42.40% |
| Wage / Income Gap ($) | 5,120 | 57.60¢ per $1 |
| Gini / Inequality Index | 5,120 | 0.40 |
Earnings by Sex in Madisonville
Average Earnings in Madisonville are $32,133, $40,807 for men and $23,506 for women, a difference of 42.4%.
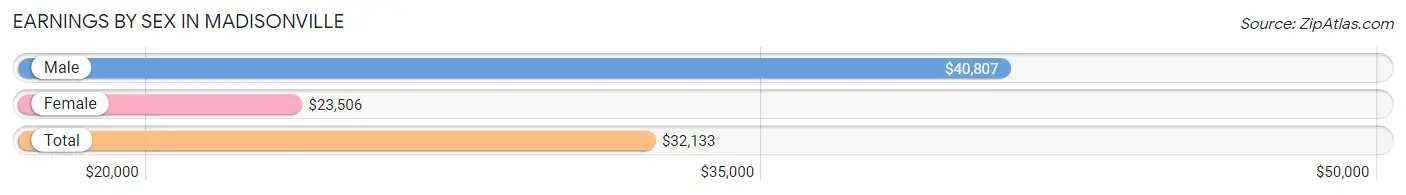
| Sex | Number | Average Earnings |
| Male | 1,286 (54.4%) | $40,807 |
| Female | 1,077 (45.6%) | $23,506 |
| Total | 2,363 (100.0%) | $32,133 |
Earnings by Sex by Income Bracket in Madisonville
The most common earnings brackets in Madisonville are $40,000 to $44,999 for men (242 | 18.8%) and $17,500 to $19,999 for women (153 | 14.2%).
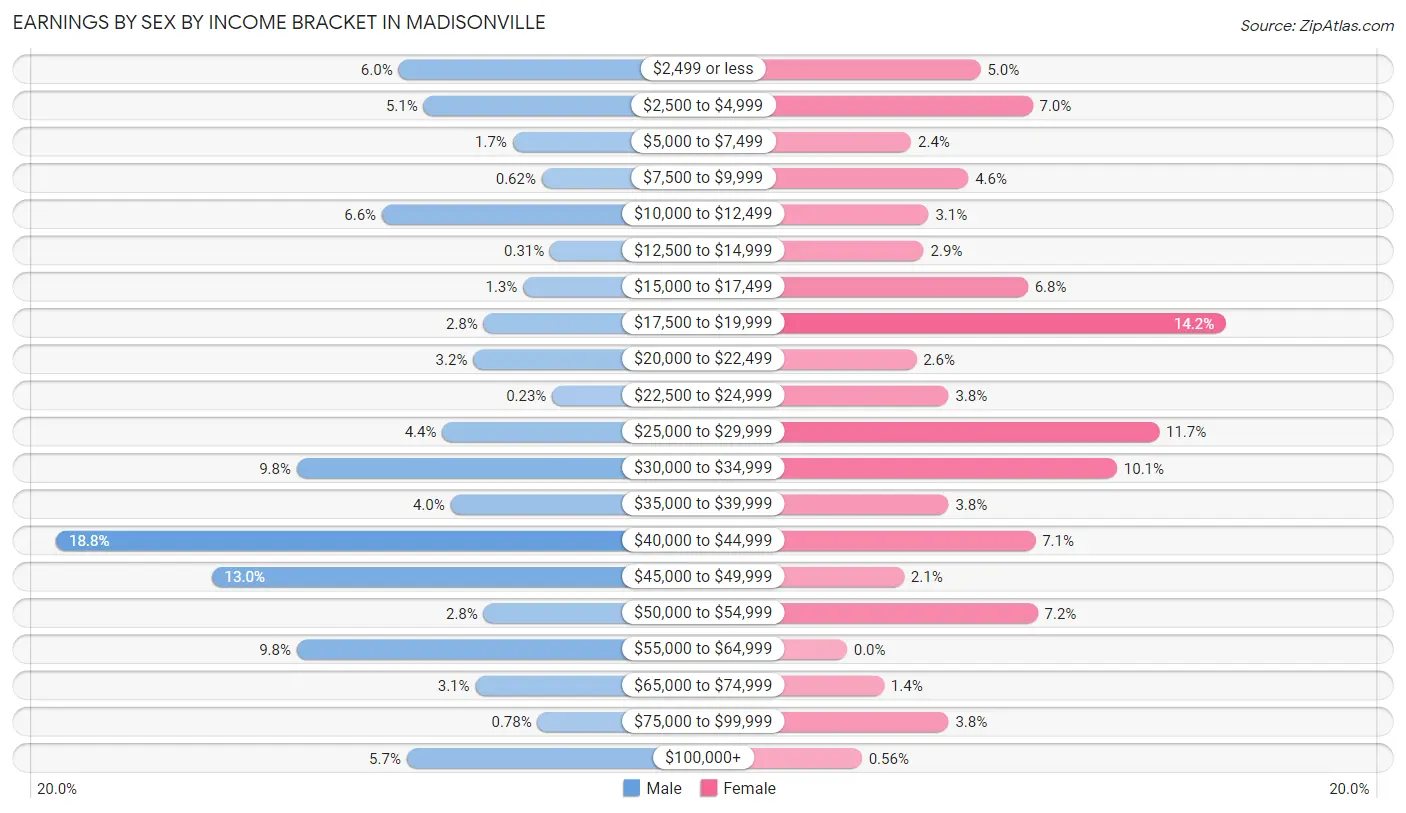
| Income | Male | Female |
| $2,499 or less | 77 (6.0%) | 54 (5.0%) |
| $2,500 to $4,999 | 65 (5.1%) | 75 (7.0%) |
| $5,000 to $7,499 | 22 (1.7%) | 26 (2.4%) |
| $7,500 to $9,999 | 8 (0.6%) | 49 (4.5%) |
| $10,000 to $12,499 | 85 (6.6%) | 33 (3.1%) |
| $12,500 to $14,999 | 4 (0.3%) | 31 (2.9%) |
| $15,000 to $17,499 | 17 (1.3%) | 73 (6.8%) |
| $17,500 to $19,999 | 36 (2.8%) | 153 (14.2%) |
| $20,000 to $22,499 | 41 (3.2%) | 28 (2.6%) |
| $22,500 to $24,999 | 3 (0.2%) | 41 (3.8%) |
| $25,000 to $29,999 | 56 (4.3%) | 126 (11.7%) |
| $30,000 to $34,999 | 126 (9.8%) | 109 (10.1%) |
| $35,000 to $39,999 | 52 (4.0%) | 41 (3.8%) |
| $40,000 to $44,999 | 242 (18.8%) | 76 (7.1%) |
| $45,000 to $49,999 | 167 (13.0%) | 23 (2.1%) |
| $50,000 to $54,999 | 36 (2.8%) | 77 (7.1%) |
| $55,000 to $64,999 | 126 (9.8%) | 0 (0.0%) |
| $65,000 to $74,999 | 40 (3.1%) | 15 (1.4%) |
| $75,000 to $99,999 | 10 (0.8%) | 41 (3.8%) |
| $100,000+ | 73 (5.7%) | 6 (0.6%) |
| Total | 1,286 (100.0%) | 1,077 (100.0%) |
Earnings by Sex by Educational Attainment in Madisonville
Average earnings in Madisonville are $41,843 for men and $25,841 for women, a difference of 38.2%. Men with an educational attainment of bachelor's degree enjoy the highest average annual earnings of $57,683, while those with high school diploma education earn the least with $37,688. Women with an educational attainment of graduate degree earn the most with the average annual earnings of $51,116, while those with less than high school education have the smallest earnings of $14,315.
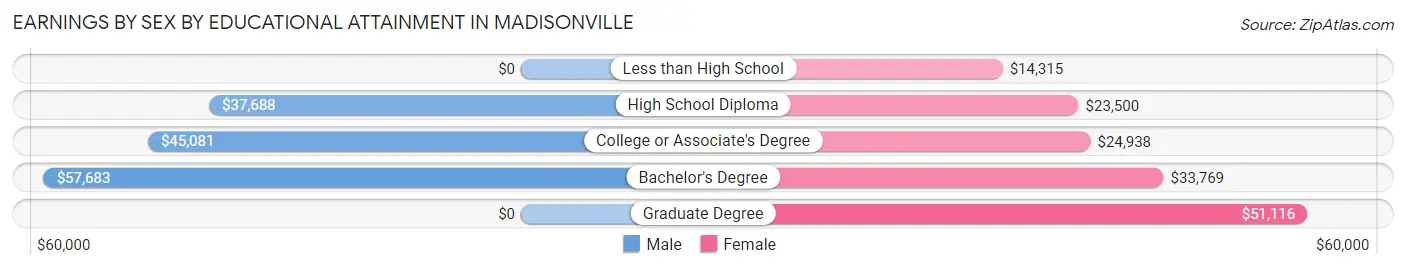
| Educational Attainment | Male Income | Female Income |
| Less than High School | - | - |
| High School Diploma | $37,688 | $23,500 |
| College or Associate's Degree | $45,081 | $24,938 |
| Bachelor's Degree | $57,683 | $33,769 |
| Graduate Degree | - | - |
| Total | $41,843 | $25,841 |
Family Income in Madisonville
Family Income Brackets in Madisonville
According to the Madisonville family income data, there are 289 families falling into the $50,000 to $74,999 income range, which is the most common income bracket and makes up 22.2% of all families.
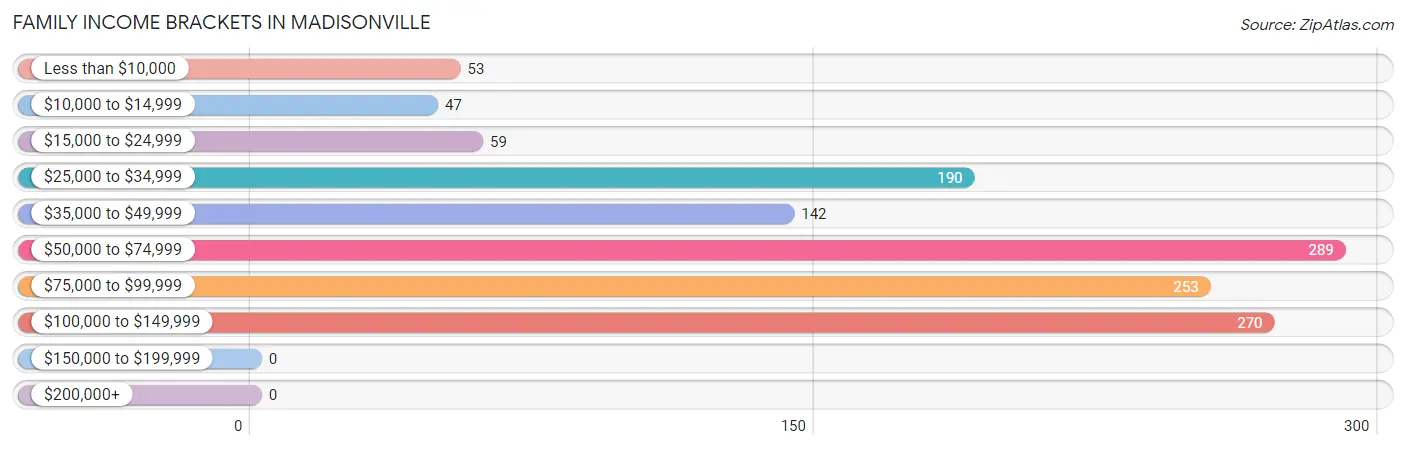
| Income Bracket | # Families | % Families |
| Less than $10,000 | 53 | 4.1% |
| $10,000 to $14,999 | 47 | 3.6% |
| $15,000 to $24,999 | 59 | 4.5% |
| $25,000 to $34,999 | 190 | 14.6% |
| $35,000 to $49,999 | 142 | 10.9% |
| $50,000 to $74,999 | 289 | 22.2% |
| $75,000 to $99,999 | 253 | 19.4% |
| $100,000 to $149,999 | 270 | 20.7% |
| $150,000 to $199,999 | 0 | 0.0% |
| $200,000+ | 0 | 0.0% |
Family Income by Famaliy Size in Madisonville
5-person families (163 | 12.5%) account for the highest median family income in Madisonville with $102,417 per family, while 4-person families (237 | 18.2%) have the highest median income of $22,538 per family member.
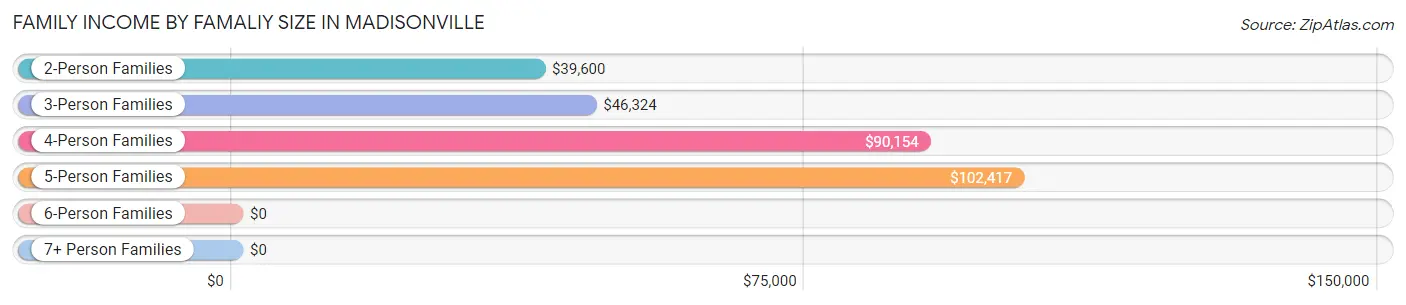
| Income Bracket | # Families | Median Income |
| 2-Person Families | 718 (55.1%) | $39,600 |
| 3-Person Families | 168 (12.9%) | $46,324 |
| 4-Person Families | 237 (18.2%) | $90,154 |
| 5-Person Families | 163 (12.5%) | $102,417 |
| 6-Person Families | 16 (1.2%) | $0 |
| 7+ Person Families | 0 (0.0%) | $0 |
| Total | 1,302 (100.0%) | $58,026 |
Family Income by Number of Earners in Madisonville
The median family income in Madisonville is $58,026, with families comprising 3+ earners (119) having the highest median family income of $101,417, while families with no earners (245) have the lowest median family income of $34,254, accounting for 9.1% and 18.8% of families, respectively.
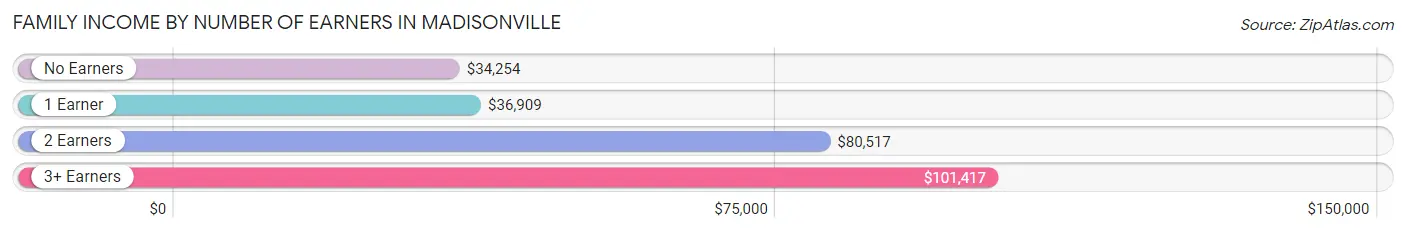
| Number of Earners | # Families | Median Income |
| No Earners | 245 (18.8%) | $34,254 |
| 1 Earner | 318 (24.4%) | $36,909 |
| 2 Earners | 620 (47.6%) | $80,517 |
| 3+ Earners | 119 (9.1%) | $101,417 |
| Total | 1,302 (100.0%) | $58,026 |
Household Income in Madisonville
Household Income Brackets in Madisonville
With 326 households falling in the category, the $75,000 to $99,999 income range is the most frequent in Madisonville, accounting for 15.6% of all households.
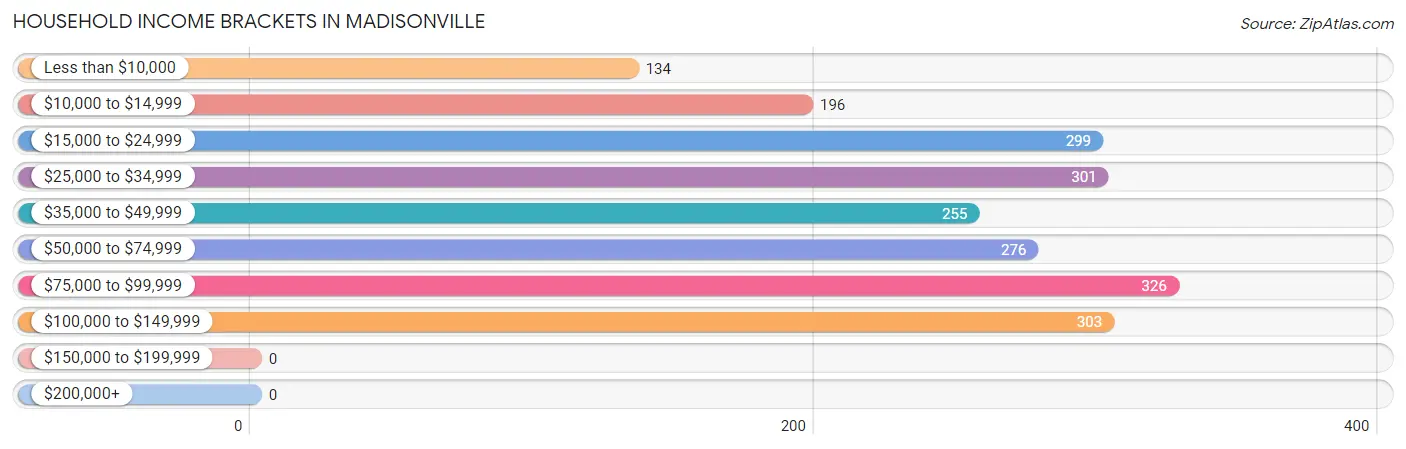
| Income Bracket | # Households | % Households |
| Less than $10,000 | 134 | 6.4% |
| $10,000 to $14,999 | 196 | 9.4% |
| $15,000 to $24,999 | 299 | 14.3% |
| $25,000 to $34,999 | 301 | 14.4% |
| $35,000 to $49,999 | 255 | 12.2% |
| $50,000 to $74,999 | 276 | 13.2% |
| $75,000 to $99,999 | 326 | 15.6% |
| $100,000 to $149,999 | 303 | 14.5% |
| $150,000 to $199,999 | 0 | 0.0% |
| $200,000+ | 0 | 0.0% |
Household Income by Householder Age in Madisonville
The median household income in Madisonville is $40,769, with the highest median household income of $79,406 found in the 25 to 44 years age bracket for the primary householder. A total of 649 households (31.0%) fall into this category. Meanwhile, the 15 to 24 years age bracket for the primary householder has the lowest median household income of $0, with 65 households (3.1%) in this group.
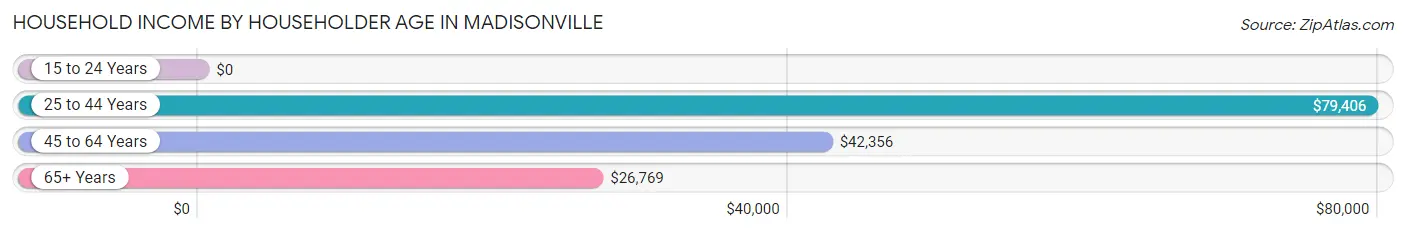
| Income Bracket | # Households | Median Income |
| 15 to 24 Years | 65 (3.1%) | $0 |
| 25 to 44 Years | 649 (31.0%) | $79,406 |
| 45 to 64 Years | 631 (30.2%) | $42,356 |
| 65+ Years | 745 (35.6%) | $26,769 |
| Total | 2,090 (100.0%) | $40,769 |
Poverty in Madisonville
Income Below Poverty by Sex and Age in Madisonville
With 8.5% poverty level for males and 14.7% for females among the residents of Madisonville, 75 year old and over males and 75 year old and over females are the most vulnerable to poverty, with 35 males (28.7%) and 153 females (44.5%) in their respective age groups living below the poverty level.
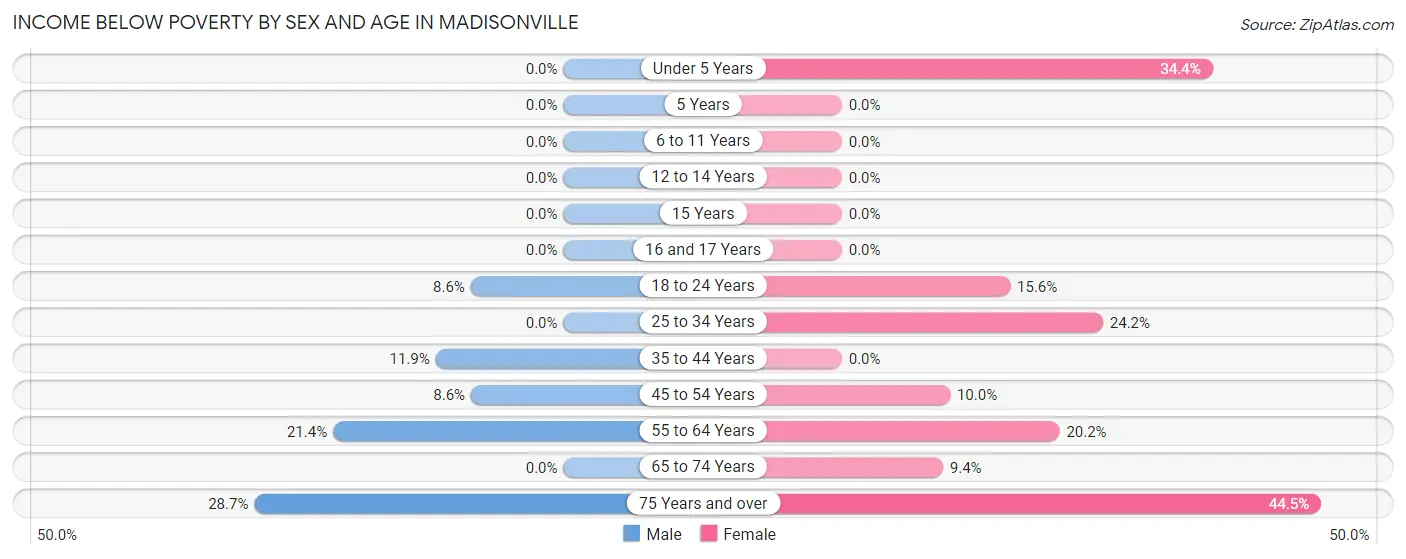
| Age Bracket | Male | Female |
| Under 5 Years | 0 (0.0%) | 32 (34.4%) |
| 5 Years | 0 (0.0%) | 0 (0.0%) |
| 6 to 11 Years | 0 (0.0%) | 0 (0.0%) |
| 12 to 14 Years | 0 (0.0%) | 0 (0.0%) |
| 15 Years | 0 (0.0%) | 0 (0.0%) |
| 16 and 17 Years | 0 (0.0%) | 0 (0.0%) |
| 18 to 24 Years | 30 (8.6%) | 25 (15.6%) |
| 25 to 34 Years | 0 (0.0%) | 55 (24.2%) |
| 35 to 44 Years | 21 (11.9%) | 0 (0.0%) |
| 45 to 54 Years | 37 (8.6%) | 26 (10.0%) |
| 55 to 64 Years | 59 (21.4%) | 61 (20.2%) |
| 65 to 74 Years | 0 (0.0%) | 35 (9.4%) |
| 75 Years and over | 35 (28.7%) | 153 (44.5%) |
| Total | 182 (8.5%) | 387 (14.7%) |
Income Above Poverty by Sex and Age in Madisonville
According to the poverty statistics in Madisonville, males aged under 5 years and females aged 5 years are the age groups that are most secure financially, with 100.0% of males and 100.0% of females in these age groups living above the poverty line.
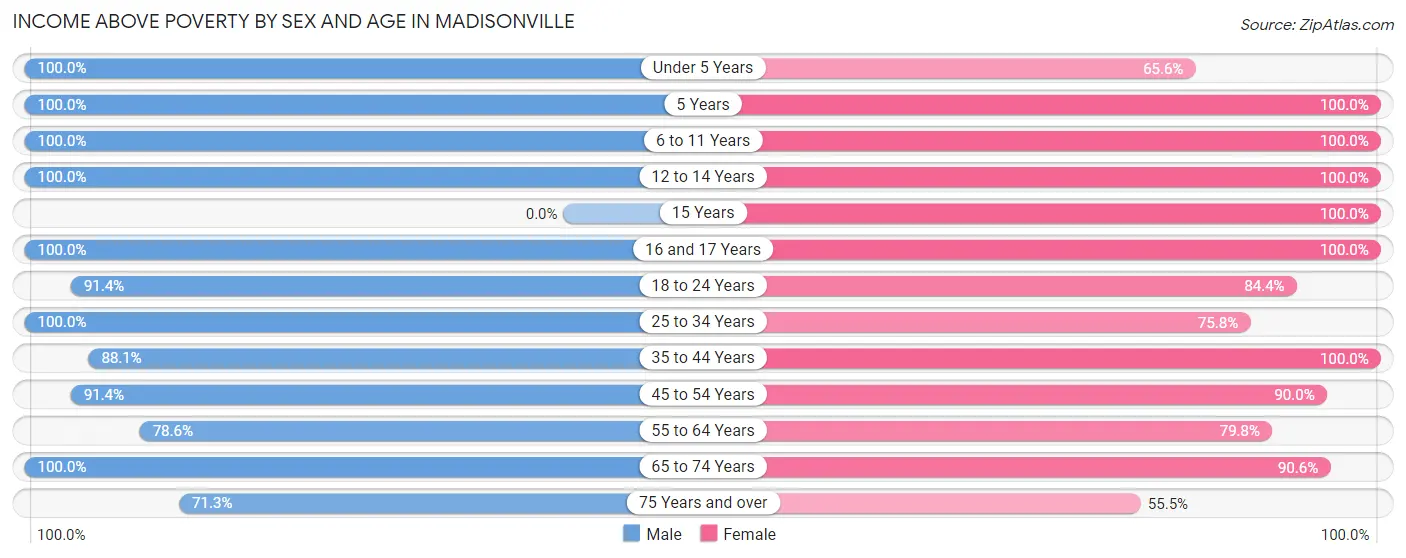
| Age Bracket | Male | Female |
| Under 5 Years | 15 (100.0%) | 61 (65.6%) |
| 5 Years | 22 (100.0%) | 14 (100.0%) |
| 6 to 11 Years | 132 (100.0%) | 203 (100.0%) |
| 12 to 14 Years | 96 (100.0%) | 113 (100.0%) |
| 15 Years | 0 (0.0%) | 191 (100.0%) |
| 16 and 17 Years | 53 (100.0%) | 21 (100.0%) |
| 18 to 24 Years | 319 (91.4%) | 135 (84.4%) |
| 25 to 34 Years | 288 (100.0%) | 172 (75.8%) |
| 35 to 44 Years | 156 (88.1%) | 324 (100.0%) |
| 45 to 54 Years | 394 (91.4%) | 233 (90.0%) |
| 55 to 64 Years | 217 (78.6%) | 241 (79.8%) |
| 65 to 74 Years | 178 (100.0%) | 338 (90.6%) |
| 75 Years and over | 87 (71.3%) | 191 (55.5%) |
| Total | 1,957 (91.5%) | 2,237 (85.3%) |
Income Below Poverty Among Married-Couple Families in Madisonville
The poverty statistics for married-couple families in Madisonville show that 3.5% or 27 of the total 770 families live below the poverty line. Families with no children have the highest poverty rate of 7.2%, comprising of 27 families. On the other hand, families with 1 or 2 children have the lowest poverty rate of 0.0%, which includes 0 families.
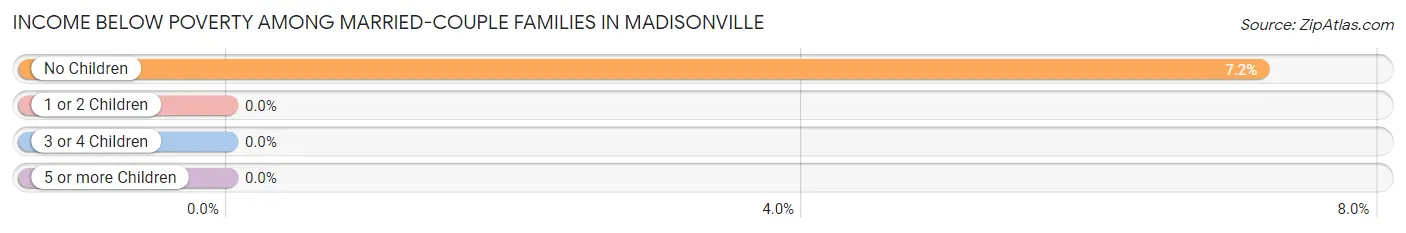
| Children | Above Poverty | Below Poverty |
| No Children | 349 (92.8%) | 27 (7.2%) |
| 1 or 2 Children | 297 (100.0%) | 0 (0.0%) |
| 3 or 4 Children | 97 (100.0%) | 0 (0.0%) |
| 5 or more Children | 0 (0.0%) | 0 (0.0%) |
| Total | 743 (96.5%) | 27 (3.5%) |
Income Below Poverty Among Single-Parent Households in Madisonville
According to the poverty data in Madisonville, 29.6% or 29 single-father households and 17.7% or 77 single-mother households are living below the poverty line. Among single-father households, those with 1 or 2 children have the highest poverty rate, with 29 households (74.4%) experiencing poverty. Likewise, among single-mother households, those with no children have the highest poverty rate, with 77 households (26.1%) falling below the poverty line.
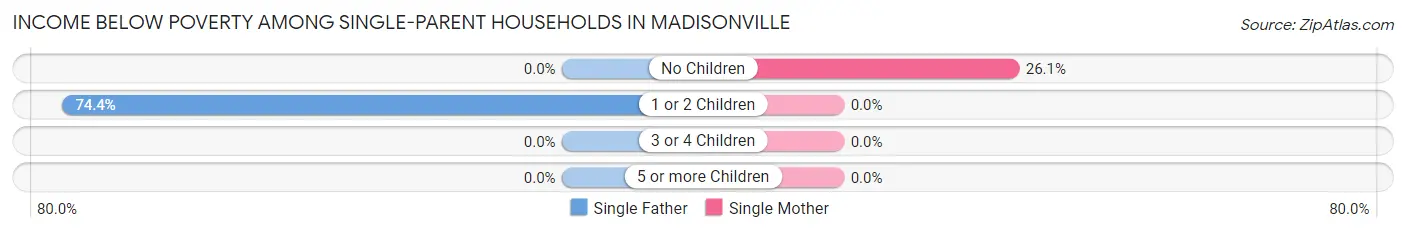
| Children | Single Father | Single Mother |
| No Children | 0 (0.0%) | 77 (26.1%) |
| 1 or 2 Children | 29 (74.4%) | 0 (0.0%) |
| 3 or 4 Children | 0 (0.0%) | 0 (0.0%) |
| 5 or more Children | 0 (0.0%) | 0 (0.0%) |
| Total | 29 (29.6%) | 77 (17.7%) |
Income Below Poverty Among Married-Couple vs Single-Parent Households in Madisonville
The poverty data for Madisonville shows that 27 of the married-couple family households (3.5%) and 106 of the single-parent households (19.9%) are living below the poverty level. Within the married-couple family households, those with no children have the highest poverty rate, with 27 households (7.2%) falling below the poverty line. Among the single-parent households, those with no children have the highest poverty rate, with 77 household (21.7%) living below poverty.
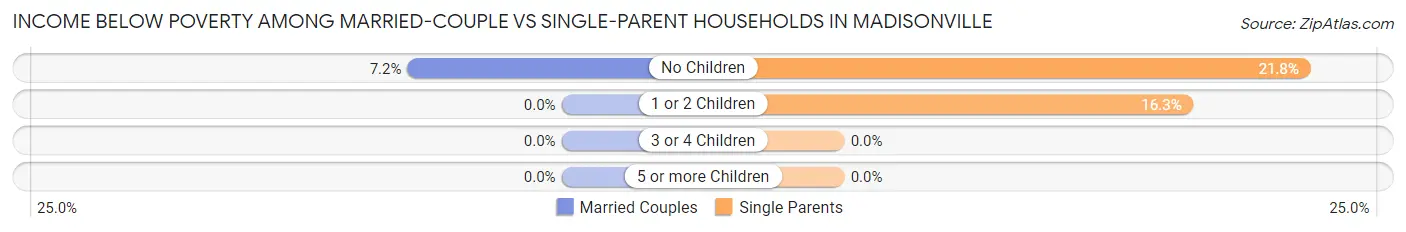
| Children | Married-Couple Families | Single-Parent Households |
| No Children | 27 (7.2%) | 77 (21.7%) |
| 1 or 2 Children | 0 (0.0%) | 29 (16.3%) |
| 3 or 4 Children | 0 (0.0%) | 0 (0.0%) |
| 5 or more Children | 0 (0.0%) | 0 (0.0%) |
| Total | 27 (3.5%) | 106 (19.9%) |
Employment Characteristics in Madisonville
Employment by Class of Employer in Madisonville
Among the 2,055 employed individuals in Madisonville, private company employees (1,401 | 68.2%), self-employed (incorporated) (185 | 9.0%), and not-for-profit organizations (174 | 8.5%) make up the most common classes of employment.
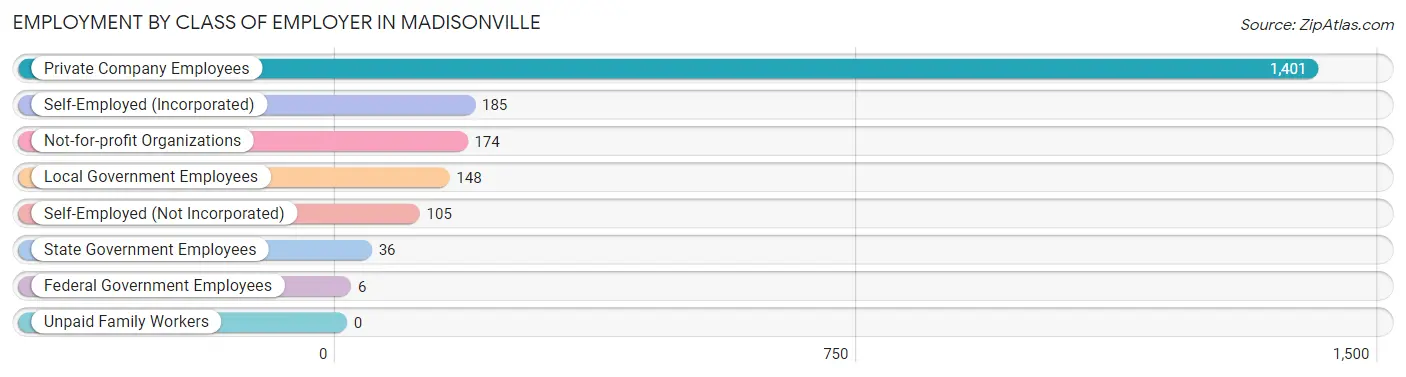
| Employer Class | # Employees | % Employees |
| Private Company Employees | 1,401 | 68.2% |
| Self-Employed (Incorporated) | 185 | 9.0% |
| Self-Employed (Not Incorporated) | 105 | 5.1% |
| Not-for-profit Organizations | 174 | 8.5% |
| Local Government Employees | 148 | 7.2% |
| State Government Employees | 36 | 1.8% |
| Federal Government Employees | 6 | 0.3% |
| Unpaid Family Workers | 0 | 0.0% |
| Total | 2,055 | 100.0% |
Employment Status by Age in Madisonville
According to the labor force statistics for Madisonville, out of the total population over 16 years of age (4,188), 53.5% or 2,241 individuals are in the labor force, with 7.4% or 166 of them unemployed. The age group with the highest labor force participation rate is 30 to 34 years, with 86.9% or 285 individuals in the labor force. Within the labor force, the 16 to 19 years age range has the highest percentage of unemployed individuals, with 28.0% or 47 of them being unemployed.
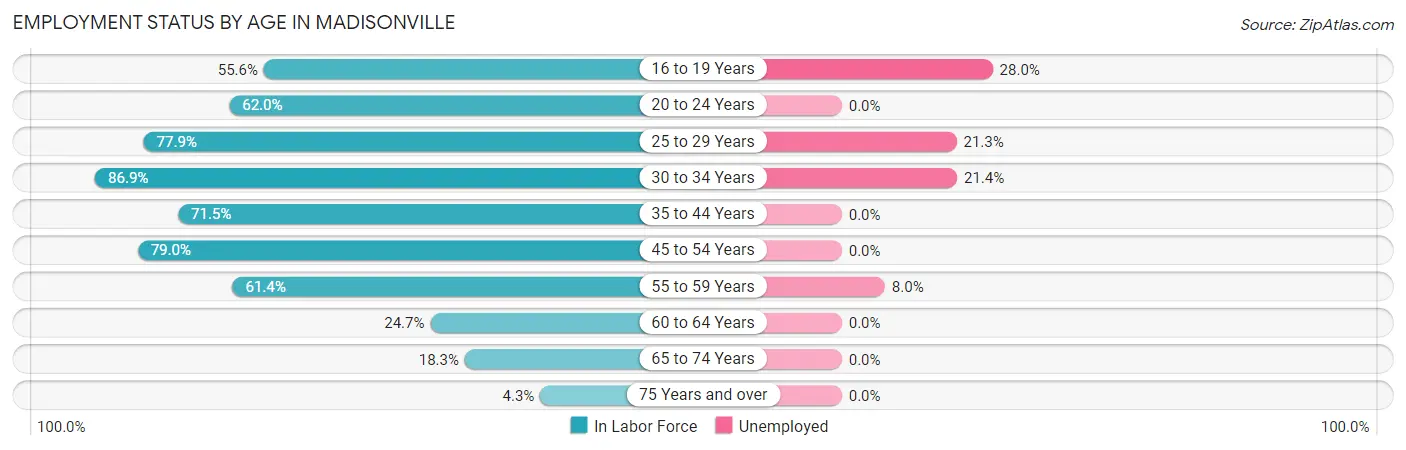
| Age Bracket | In Labor Force | Unemployed |
| 16 to 19 Years | 168 (55.6%) | 47 (28.0%) |
| 20 to 24 Years | 186 (62.0%) | 0 (0.0%) |
| 25 to 29 Years | 197 (77.9%) | 42 (21.3%) |
| 30 to 34 Years | 285 (86.9%) | 61 (21.4%) |
| 35 to 44 Years | 422 (71.5%) | 0 (0.0%) |
| 45 to 54 Years | 582 (79.0%) | 0 (0.0%) |
| 55 to 59 Years | 213 (61.4%) | 17 (8.0%) |
| 60 to 64 Years | 63 (24.7%) | 0 (0.0%) |
| 65 to 74 Years | 104 (18.3%) | 0 (0.0%) |
| 75 Years and over | 22 (4.3%) | 0 (0.0%) |
| Total | 2,241 (53.5%) | 166 (7.4%) |
Employment Status by Educational Attainment in Madisonville
According to labor force statistics for Madisonville, 70.2% of individuals (1,762) out of the total population between 25 and 64 years of age (2,510) are in the labor force, with 6.8% or 120 of them being unemployed. The group with the highest labor force participation rate are those with the educational attainment of bachelor's degree or higher, with 86.7% or 340 individuals in the labor force. Within the labor force, individuals with high school diploma education have the highest percentage of unemployment, with 11.9% or 90 of them being unemployed.
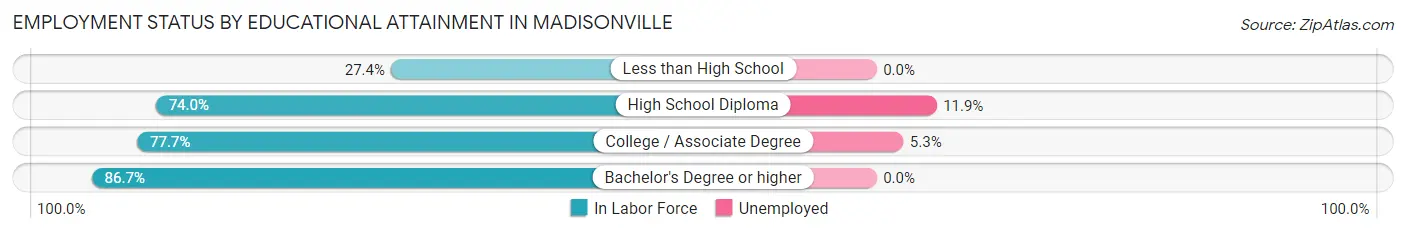
| Educational Attainment | In Labor Force | Unemployed |
| Less than High School | 101 (27.4%) | 0 (0.0%) |
| High School Diploma | 757 (74.0%) | 122 (11.9%) |
| College / Associate Degree | 564 (77.7%) | 38 (5.3%) |
| Bachelor's Degree or higher | 340 (86.7%) | 0 (0.0%) |
| Total | 1,762 (70.2%) | 171 (6.8%) |
Employment Occupations by Sex in Madisonville
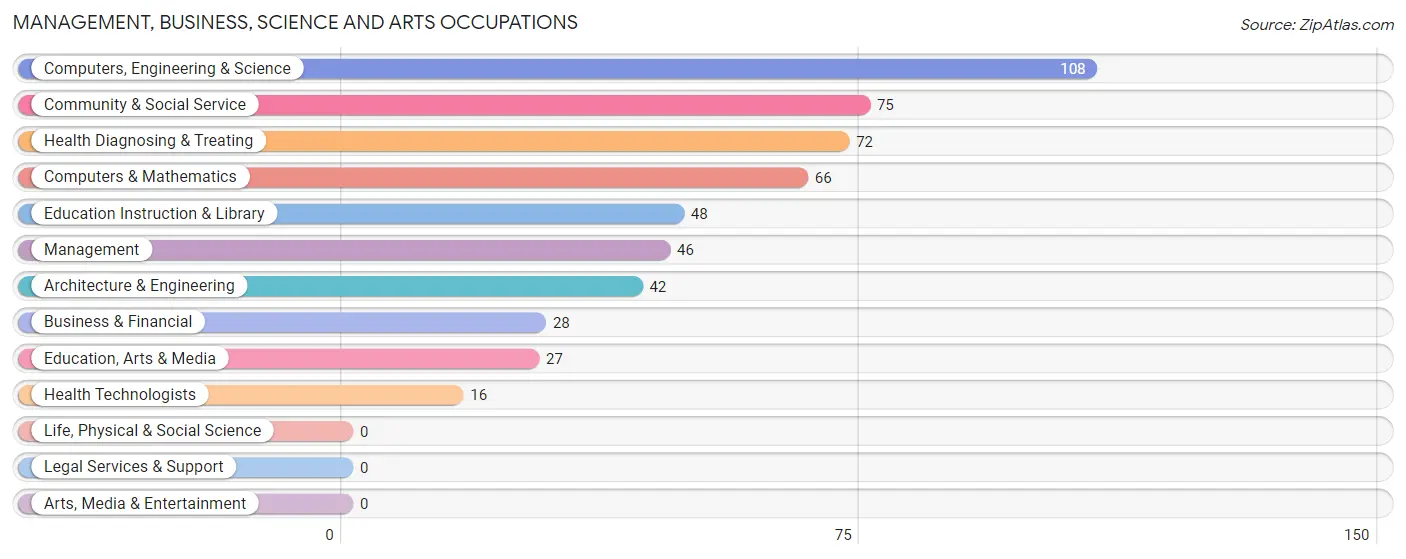
Management, Business, Science and Arts Occupations
The most common Management, Business, Science and Arts occupations in Madisonville are Computers, Engineering & Science (108 | 5.2%), Community & Social Service (75 | 3.6%), Health Diagnosing & Treating (72 | 3.5%), Computers & Mathematics (66 | 3.2%), and Education Instruction & Library (48 | 2.3%).
Management, Business, Science and Arts Occupations by Sex
Within the Management, Business, Science and Arts occupations in Madisonville, the most male-oriented occupations are Management (100.0%), Architecture & Engineering (100.0%), and Computers, Engineering & Science (67.6%), while the most female-oriented occupations are Business & Financial (100.0%), Education Instruction & Library (100.0%), and Health Diagnosing & Treating (100.0%).
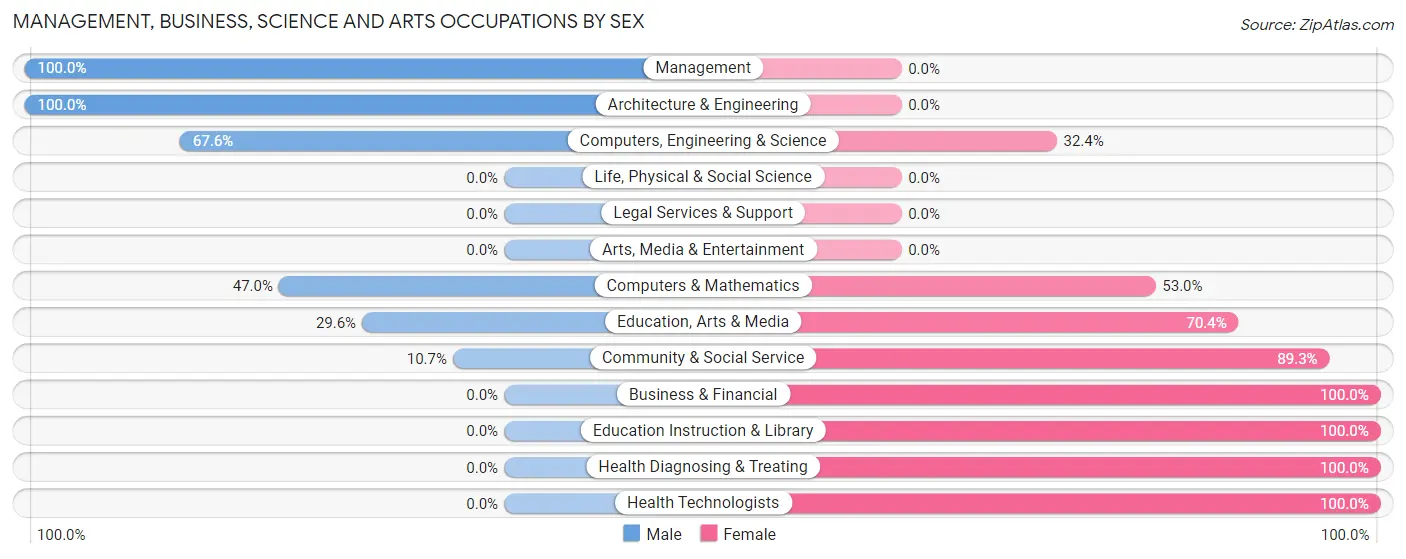
| Occupation | Male | Female |
| Management | 46 (100.0%) | 0 (0.0%) |
| Business & Financial | 0 (0.0%) | 28 (100.0%) |
| Computers, Engineering & Science | 73 (67.6%) | 35 (32.4%) |
| Computers & Mathematics | 31 (47.0%) | 35 (53.0%) |
| Architecture & Engineering | 42 (100.0%) | 0 (0.0%) |
| Life, Physical & Social Science | 0 (0.0%) | 0 (0.0%) |
| Community & Social Service | 8 (10.7%) | 67 (89.3%) |
| Education, Arts & Media | 8 (29.6%) | 19 (70.4%) |
| Legal Services & Support | 0 (0.0%) | 0 (0.0%) |
| Education Instruction & Library | 0 (0.0%) | 48 (100.0%) |
| Arts, Media & Entertainment | 0 (0.0%) | 0 (0.0%) |
| Health Diagnosing & Treating | 0 (0.0%) | 72 (100.0%) |
| Health Technologists | 0 (0.0%) | 16 (100.0%) |
| Total (Category) | 127 (38.6%) | 202 (61.4%) |
| Total (Overall) | 1,163 (56.0%) | 912 (44.0%) |
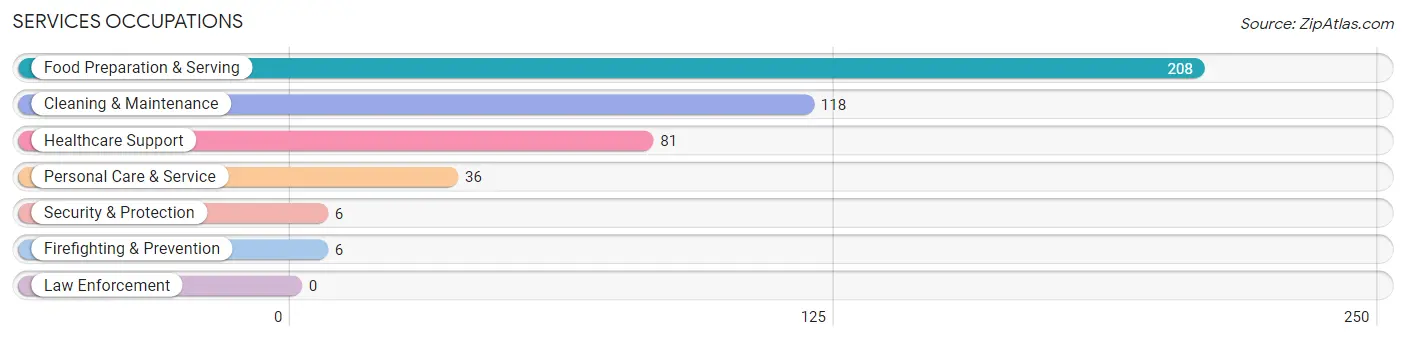
Services Occupations
The most common Services occupations in Madisonville are Food Preparation & Serving (208 | 10.0%), Cleaning & Maintenance (118 | 5.7%), Healthcare Support (81 | 3.9%), Personal Care & Service (36 | 1.7%), and Security & Protection (6 | 0.3%).
Services Occupations by Sex
Within the Services occupations in Madisonville, the most male-oriented occupations are Personal Care & Service (100.0%), Cleaning & Maintenance (50.8%), and Food Preparation & Serving (50.5%), while the most female-oriented occupations are Security & Protection (100.0%), Firefighting & Prevention (100.0%), and Healthcare Support (76.5%).
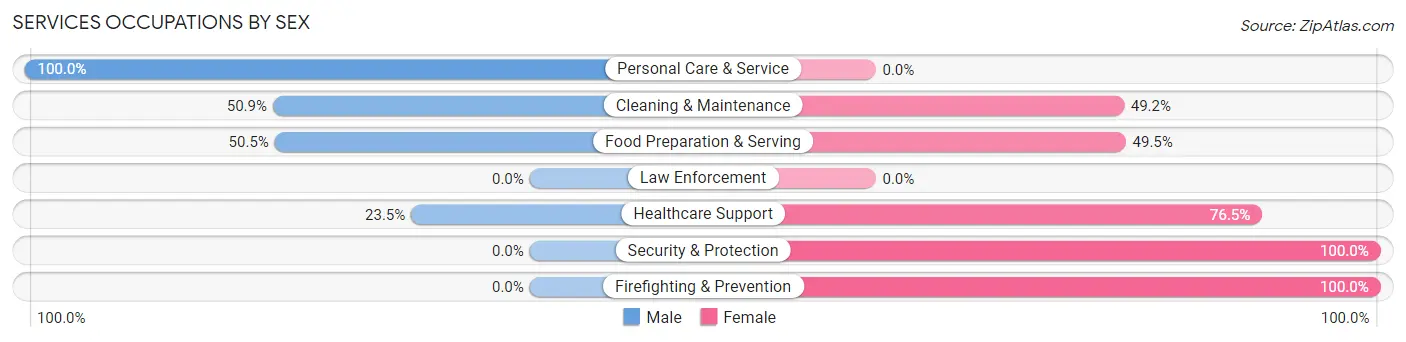
| Occupation | Male | Female |
| Healthcare Support | 19 (23.5%) | 62 (76.5%) |
| Security & Protection | 0 (0.0%) | 6 (100.0%) |
| Firefighting & Prevention | 0 (0.0%) | 6 (100.0%) |
| Law Enforcement | 0 (0.0%) | 0 (0.0%) |
| Food Preparation & Serving | 105 (50.5%) | 103 (49.5%) |
| Cleaning & Maintenance | 60 (50.8%) | 58 (49.1%) |
| Personal Care & Service | 36 (100.0%) | 0 (0.0%) |
| Total (Category) | 220 (49.0%) | 229 (51.0%) |
| Total (Overall) | 1,163 (56.0%) | 912 (44.0%) |
Sales and Office Occupations
The most common Sales and Office occupations in Madisonville are Office & Administration (276 | 13.3%), and Sales & Related (230 | 11.1%).

Sales and Office Occupations by Sex

| Occupation | Male | Female |
| Sales & Related | 131 (57.0%) | 99 (43.0%) |
| Office & Administration | 52 (18.8%) | 224 (81.2%) |
| Total (Category) | 183 (36.2%) | 323 (63.8%) |
| Total (Overall) | 1,163 (56.0%) | 912 (44.0%) |
Natural Resources, Construction and Maintenance Occupations
The most common Natural Resources, Construction and Maintenance occupations in Madisonville are Construction & Extraction (72 | 3.5%), and Installation, Maintenance & Repair (64 | 3.1%).
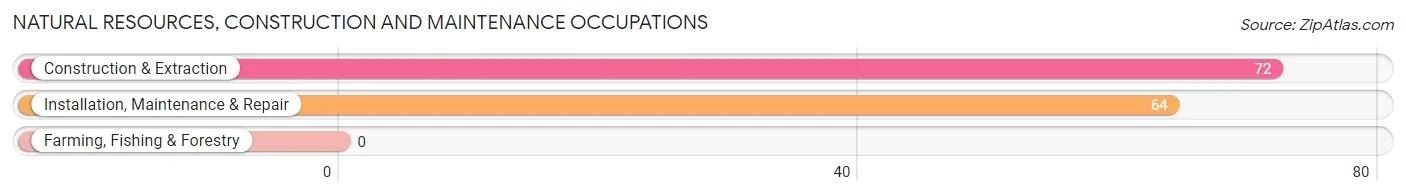
Natural Resources, Construction and Maintenance Occupations by Sex

| Occupation | Male | Female |
| Farming, Fishing & Forestry | 0 (0.0%) | 0 (0.0%) |
| Construction & Extraction | 65 (90.3%) | 7 (9.7%) |
| Installation, Maintenance & Repair | 64 (100.0%) | 0 (0.0%) |
| Total (Category) | 129 (94.9%) | 7 (5.1%) |
| Total (Overall) | 1,163 (56.0%) | 912 (44.0%) |
Production, Transportation and Moving Occupations
The most common Production, Transportation and Moving occupations in Madisonville are Production (472 | 22.8%), Transportation (101 | 4.9%), and Material Moving (82 | 4.0%).
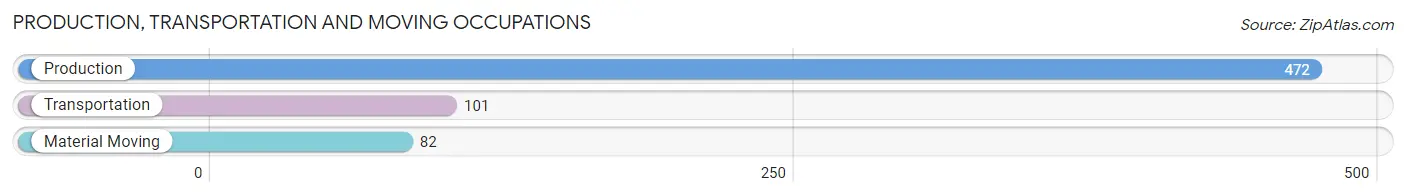
Production, Transportation and Moving Occupations by Sex
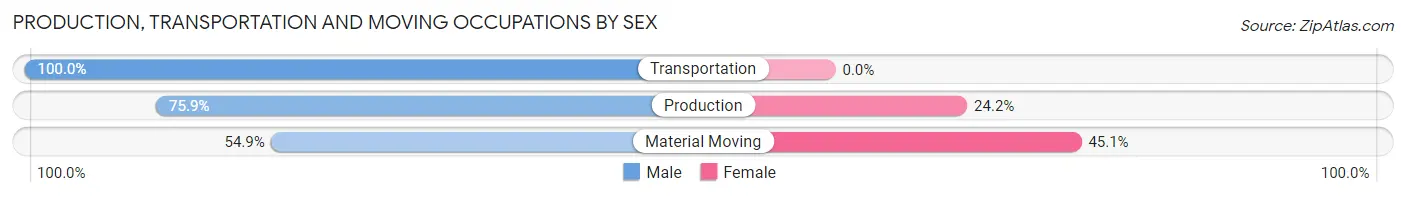
| Occupation | Male | Female |
| Production | 358 (75.8%) | 114 (24.1%) |
| Transportation | 101 (100.0%) | 0 (0.0%) |
| Material Moving | 45 (54.9%) | 37 (45.1%) |
| Total (Category) | 504 (76.9%) | 151 (23.1%) |
| Total (Overall) | 1,163 (56.0%) | 912 (44.0%) |
Employment Industries by Sex in Madisonville
Employment Industries in Madisonville
The major employment industries in Madisonville include Manufacturing (482 | 23.2%), Retail Trade (427 | 20.6%), Health Care & Social Assistance (211 | 10.2%), Accommodation & Food Services (182 | 8.8%), and Educational Services (159 | 7.7%).
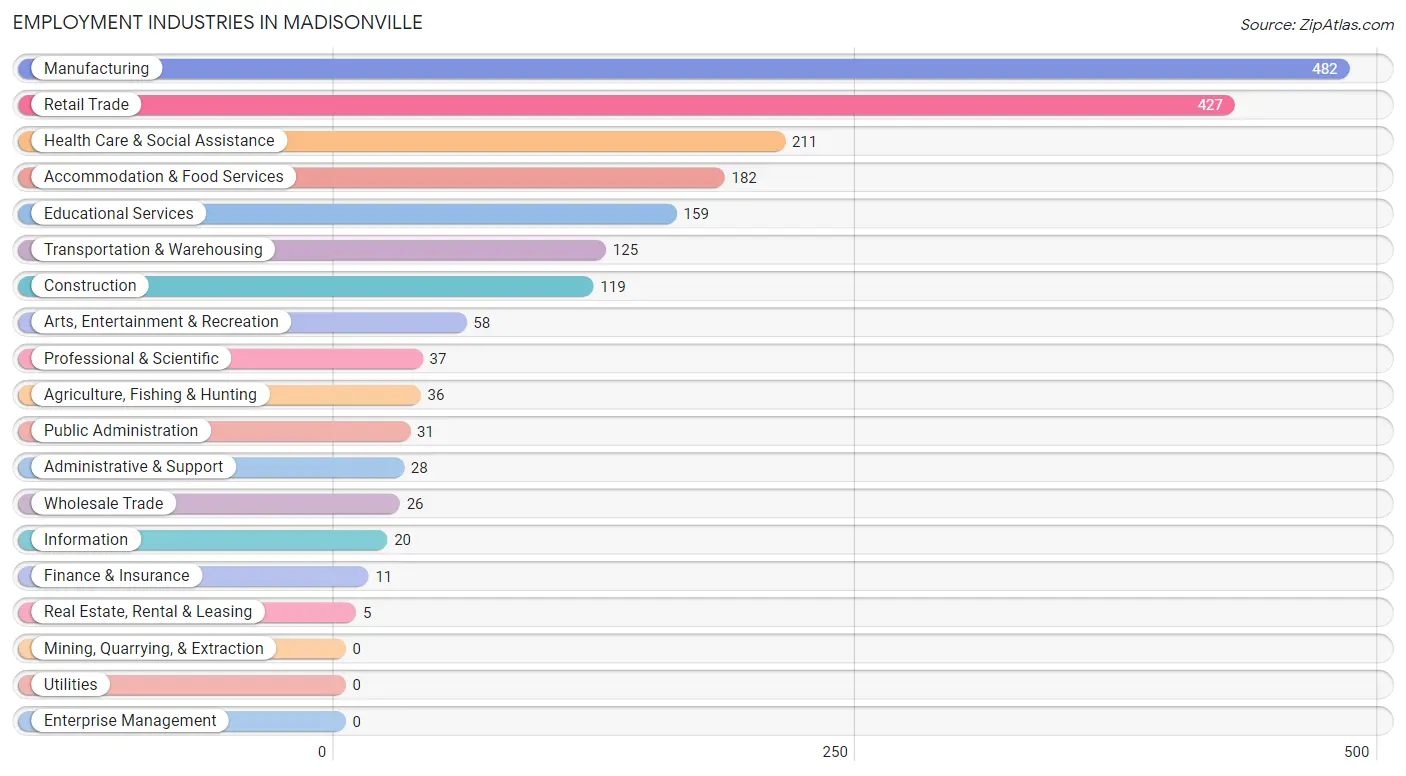
Employment Industries by Sex in Madisonville
The Madisonville industries that see more men than women are Agriculture, Fishing & Hunting (100.0%), Transportation & Warehousing (100.0%), and Information (100.0%), whereas the industries that tend to have a higher number of women are Wholesale Trade (100.0%), Real Estate, Rental & Leasing (100.0%), and Educational Services (100.0%).
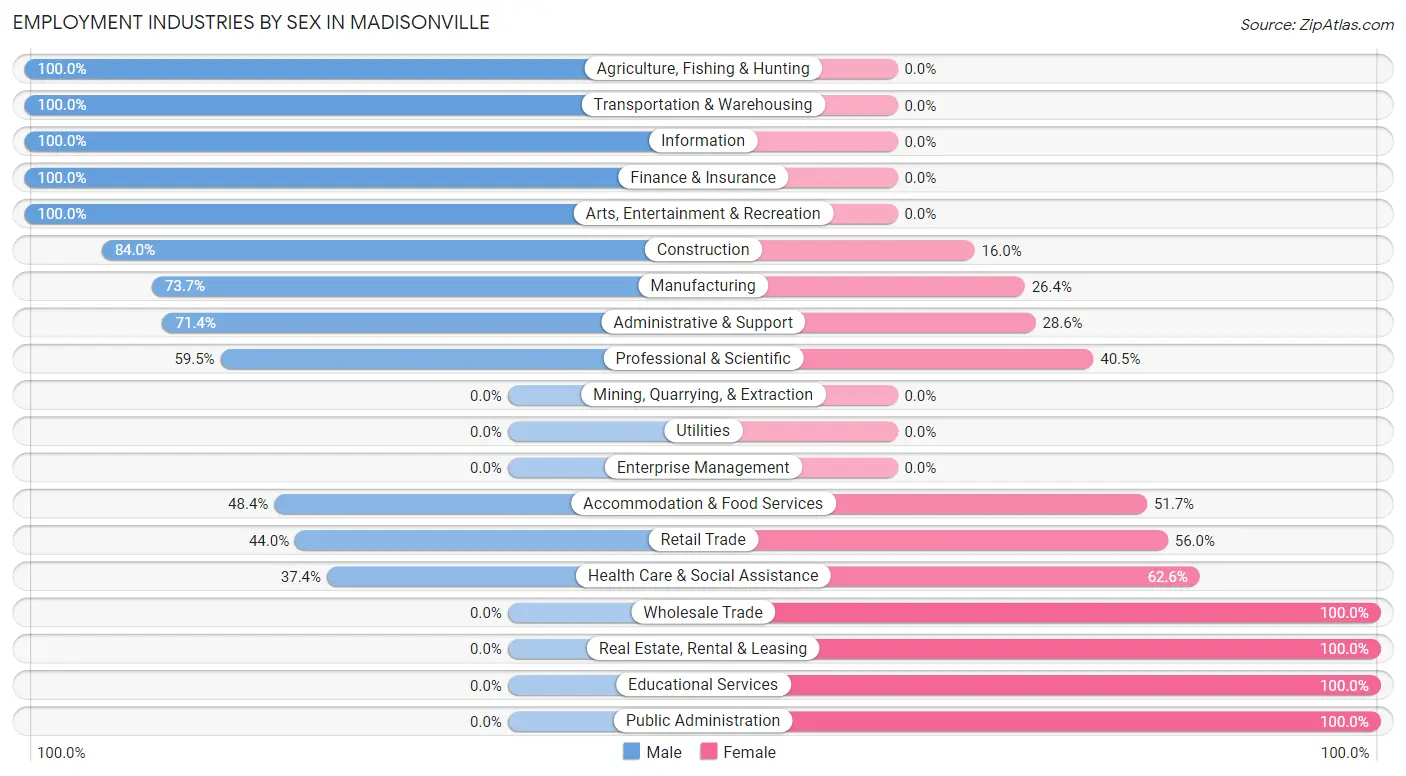
| Industry | Male | Female |
| Agriculture, Fishing & Hunting | 36 (100.0%) | 0 (0.0%) |
| Mining, Quarrying, & Extraction | 0 (0.0%) | 0 (0.0%) |
| Construction | 100 (84.0%) | 19 (16.0%) |
| Manufacturing | 355 (73.7%) | 127 (26.4%) |
| Wholesale Trade | 0 (0.0%) | 26 (100.0%) |
| Retail Trade | 188 (44.0%) | 239 (56.0%) |
| Transportation & Warehousing | 125 (100.0%) | 0 (0.0%) |
| Utilities | 0 (0.0%) | 0 (0.0%) |
| Information | 20 (100.0%) | 0 (0.0%) |
| Finance & Insurance | 11 (100.0%) | 0 (0.0%) |
| Real Estate, Rental & Leasing | 0 (0.0%) | 5 (100.0%) |
| Professional & Scientific | 22 (59.5%) | 15 (40.5%) |
| Enterprise Management | 0 (0.0%) | 0 (0.0%) |
| Administrative & Support | 20 (71.4%) | 8 (28.6%) |
| Educational Services | 0 (0.0%) | 159 (100.0%) |
| Health Care & Social Assistance | 79 (37.4%) | 132 (62.6%) |
| Arts, Entertainment & Recreation | 58 (100.0%) | 0 (0.0%) |
| Accommodation & Food Services | 88 (48.3%) | 94 (51.6%) |
| Public Administration | 0 (0.0%) | 31 (100.0%) |
| Total | 1,163 (56.0%) | 912 (44.0%) |
Education in Madisonville
School Enrollment in Madisonville
The most common levels of schooling among the 920 students in Madisonville are middle school (295 | 32.1%), high school (286 | 31.1%), and elementary school (232 | 25.2%).
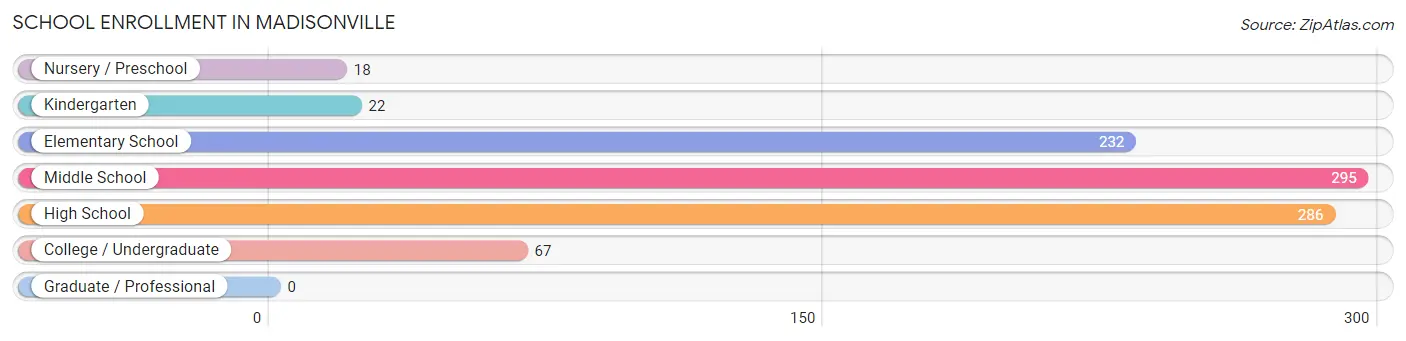
| School Level | # Students | % Students |
| Nursery / Preschool | 18 | 2.0% |
| Kindergarten | 22 | 2.4% |
| Elementary School | 232 | 25.2% |
| Middle School | 295 | 32.1% |
| High School | 286 | 31.1% |
| College / Undergraduate | 67 | 7.3% |
| Graduate / Professional | 0 | 0.0% |
| Total | 920 | 100.0% |
School Enrollment by Age by Funding Source in Madisonville
Out of a total of 920 students who are enrolled in schools in Madisonville, 7 (0.8%) attend a private institution, while the remaining 913 (99.2%) are enrolled in public schools. The age group of 10 to 14 year olds has the highest likelihood of being enrolled in private schools, with 7 (2.3% in the age bracket) enrolled. Conversely, the age group of 3 to 4 year olds has the lowest likelihood of being enrolled in a private school, with 4 (100.0% in the age bracket) attending a public institution.
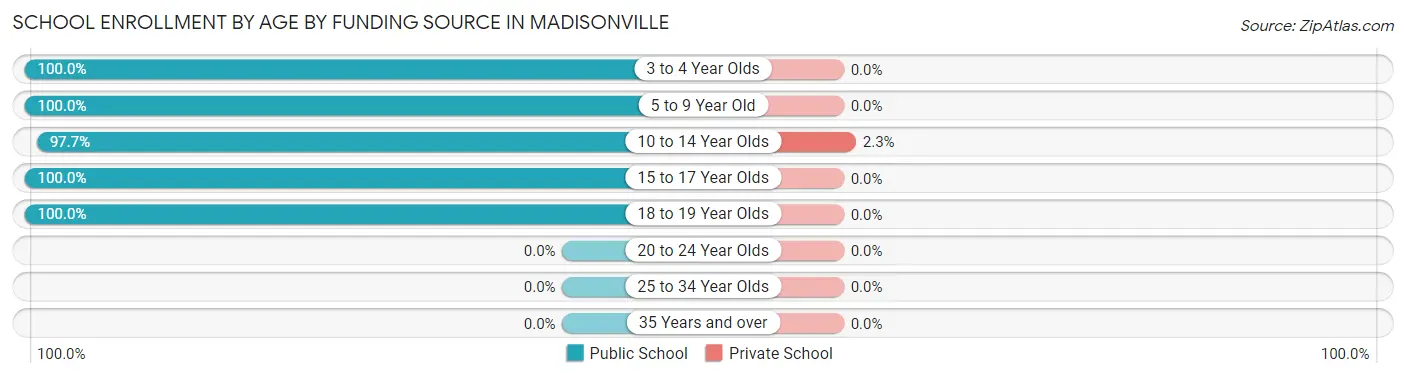
| Age Bracket | Public School | Private School |
| 3 to 4 Year Olds | 4 (100.0%) | 0 (0.0%) |
| 5 to 9 Year Old | 254 (100.0%) | 0 (0.0%) |
| 10 to 14 Year Olds | 302 (97.7%) | 7 (2.3%) |
| 15 to 17 Year Olds | 267 (100.0%) | 0 (0.0%) |
| 18 to 19 Year Olds | 86 (100.0%) | 0 (0.0%) |
| 20 to 24 Year Olds | 0 (0.0%) | 0 (0.0%) |
| 25 to 34 Year Olds | 0 (0.0%) | 0 (0.0%) |
| 35 Years and over | 0 (0.0%) | 0 (0.0%) |
| Total | 913 (99.2%) | 7 (0.8%) |
Educational Attainment by Field of Study in Madisonville
Business (181 | 31.7%), arts & humanities (127 | 22.2%), education (88 | 15.4%), liberal arts & history (46 | 8.1%), and bio, nature & agricultural (40 | 7.0%) are the most common fields of study among 571 individuals in Madisonville who have obtained a bachelor's degree or higher.
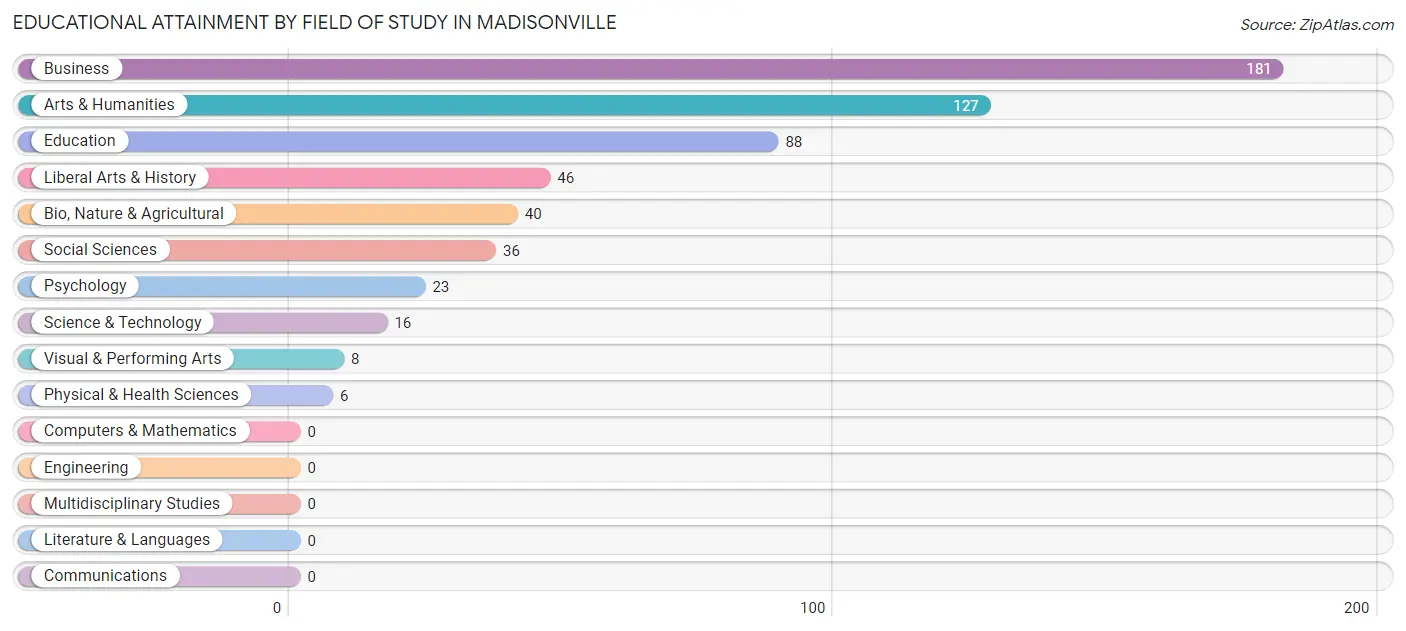
| Field of Study | # Graduates | % Graduates |
| Computers & Mathematics | 0 | 0.0% |
| Bio, Nature & Agricultural | 40 | 7.0% |
| Physical & Health Sciences | 6 | 1.1% |
| Psychology | 23 | 4.0% |
| Social Sciences | 36 | 6.3% |
| Engineering | 0 | 0.0% |
| Multidisciplinary Studies | 0 | 0.0% |
| Science & Technology | 16 | 2.8% |
| Business | 181 | 31.7% |
| Education | 88 | 15.4% |
| Literature & Languages | 0 | 0.0% |
| Liberal Arts & History | 46 | 8.1% |
| Visual & Performing Arts | 8 | 1.4% |
| Communications | 0 | 0.0% |
| Arts & Humanities | 127 | 22.2% |
| Total | 571 | 100.0% |
Transportation & Commute in Madisonville
Vehicle Availability by Sex in Madisonville
The most prevalent vehicle ownership categories in Madisonville are males with 2 vehicles (522, accounting for 45.7%) and females with 2 vehicles (419, making up 57.2%).
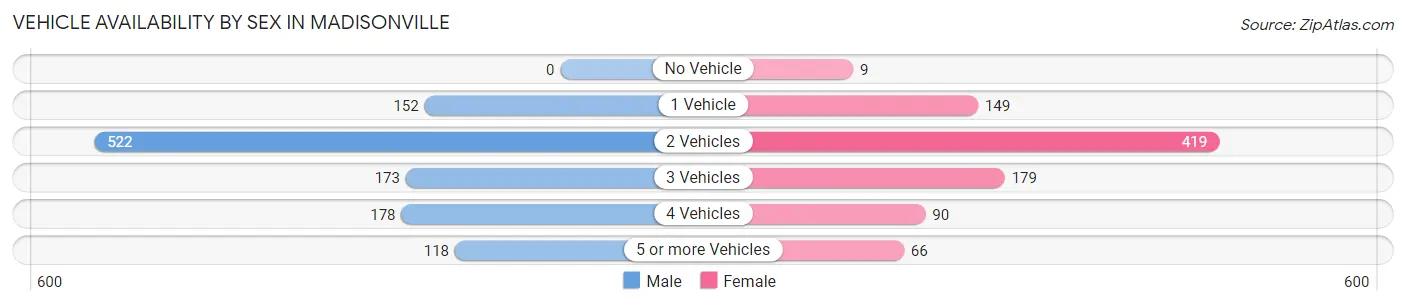
| Vehicles Available | Male | Female |
| No Vehicle | 0 (0.0%) | 9 (1.0%) |
| 1 Vehicle | 152 (13.3%) | 149 (16.3%) |
| 2 Vehicles | 522 (45.7%) | 419 (45.9%) |
| 3 Vehicles | 173 (15.1%) | 179 (19.6%) |
| 4 Vehicles | 178 (15.6%) | 90 (9.9%) |
| 5 or more Vehicles | 118 (10.3%) | 66 (7.2%) |
| Total | 1,143 (100.0%) | 912 (100.0%) |
Commute Time in Madisonville
The most frequently occuring commute durations in Madisonville are 20 to 24 minutes (506 commuters, 24.8%), 5 to 9 minutes (459 commuters, 22.5%), and 30 to 34 minutes (249 commuters, 12.2%).
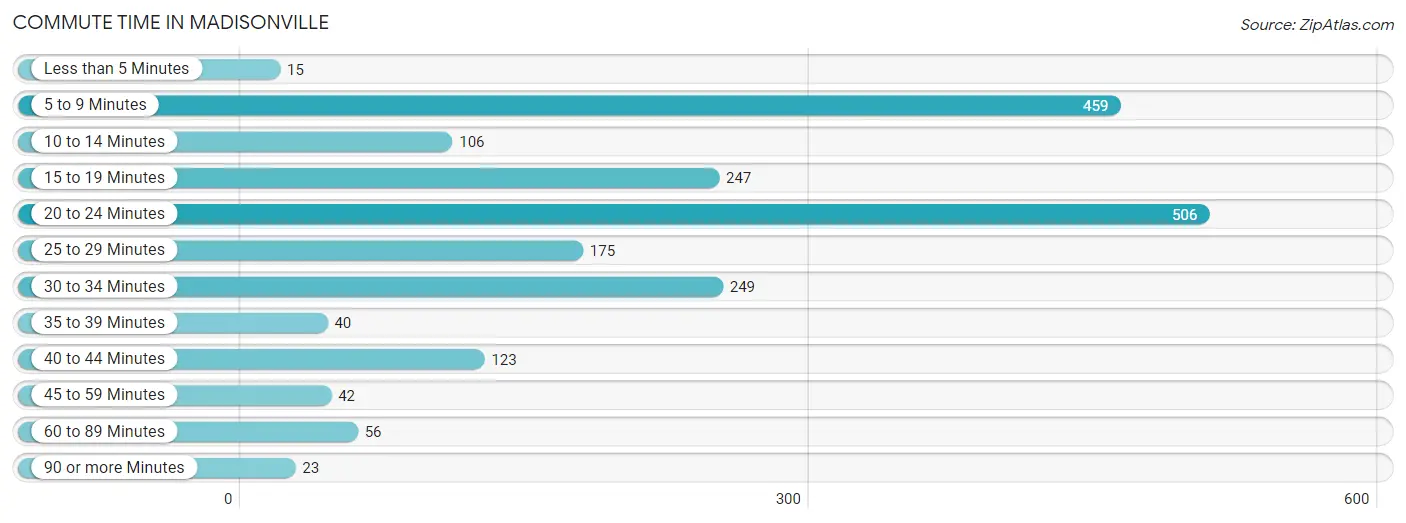
| Commute Time | # Commuters | % Commuters |
| Less than 5 Minutes | 15 | 0.7% |
| 5 to 9 Minutes | 459 | 22.5% |
| 10 to 14 Minutes | 106 | 5.2% |
| 15 to 19 Minutes | 247 | 12.1% |
| 20 to 24 Minutes | 506 | 24.8% |
| 25 to 29 Minutes | 175 | 8.6% |
| 30 to 34 Minutes | 249 | 12.2% |
| 35 to 39 Minutes | 40 | 2.0% |
| 40 to 44 Minutes | 123 | 6.0% |
| 45 to 59 Minutes | 42 | 2.1% |
| 60 to 89 Minutes | 56 | 2.7% |
| 90 or more Minutes | 23 | 1.1% |
Commute Time by Sex in Madisonville
The most common commute times in Madisonville are 20 to 24 minutes (292 commuters, 25.9%) for males and 5 to 9 minutes (235 commuters, 25.8%) for females.
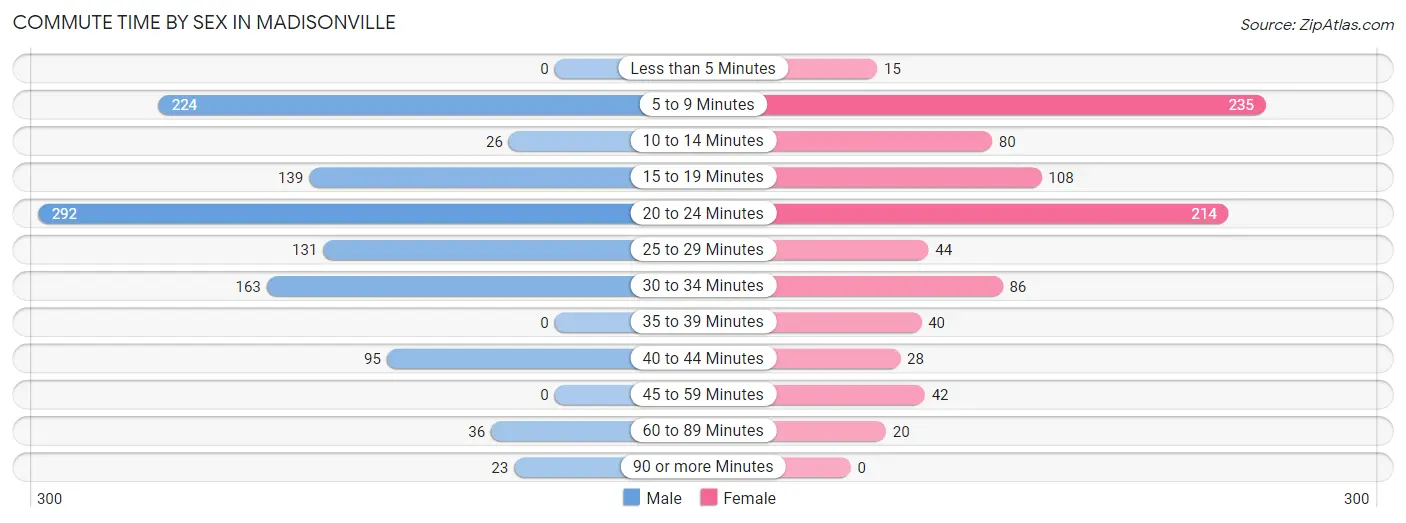
| Commute Time | Male | Female |
| Less than 5 Minutes | 0 (0.0%) | 15 (1.6%) |
| 5 to 9 Minutes | 224 (19.8%) | 235 (25.8%) |
| 10 to 14 Minutes | 26 (2.3%) | 80 (8.8%) |
| 15 to 19 Minutes | 139 (12.3%) | 108 (11.8%) |
| 20 to 24 Minutes | 292 (25.9%) | 214 (23.5%) |
| 25 to 29 Minutes | 131 (11.6%) | 44 (4.8%) |
| 30 to 34 Minutes | 163 (14.4%) | 86 (9.4%) |
| 35 to 39 Minutes | 0 (0.0%) | 40 (4.4%) |
| 40 to 44 Minutes | 95 (8.4%) | 28 (3.1%) |
| 45 to 59 Minutes | 0 (0.0%) | 42 (4.6%) |
| 60 to 89 Minutes | 36 (3.2%) | 20 (2.2%) |
| 90 or more Minutes | 23 (2.0%) | 0 (0.0%) |
Time of Departure to Work by Sex in Madisonville
The most frequent times of departure to work in Madisonville are 7:00 AM to 7:29 AM (215, 19.0%) for males and 7:30 AM to 7:59 AM (170, 18.6%) for females.
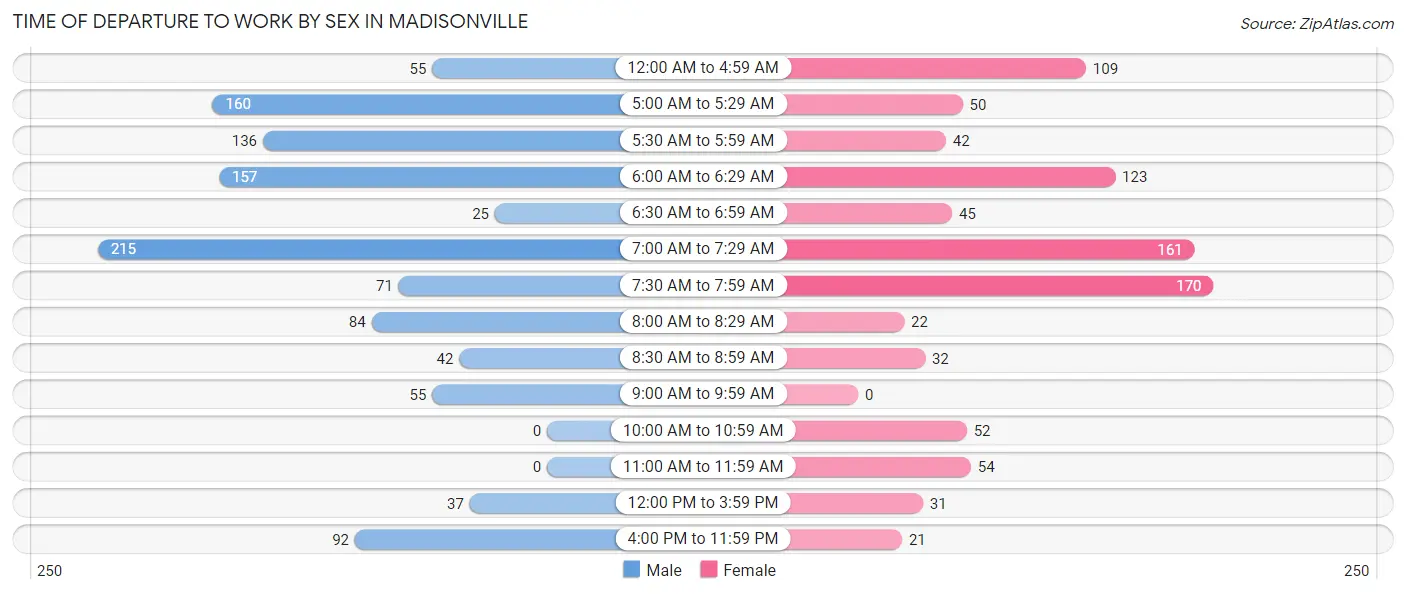
| Time of Departure | Male | Female |
| 12:00 AM to 4:59 AM | 55 (4.9%) | 109 (11.9%) |
| 5:00 AM to 5:29 AM | 160 (14.2%) | 50 (5.5%) |
| 5:30 AM to 5:59 AM | 136 (12.0%) | 42 (4.6%) |
| 6:00 AM to 6:29 AM | 157 (13.9%) | 123 (13.5%) |
| 6:30 AM to 6:59 AM | 25 (2.2%) | 45 (4.9%) |
| 7:00 AM to 7:29 AM | 215 (19.0%) | 161 (17.6%) |
| 7:30 AM to 7:59 AM | 71 (6.3%) | 170 (18.6%) |
| 8:00 AM to 8:29 AM | 84 (7.4%) | 22 (2.4%) |
| 8:30 AM to 8:59 AM | 42 (3.7%) | 32 (3.5%) |
| 9:00 AM to 9:59 AM | 55 (4.9%) | 0 (0.0%) |
| 10:00 AM to 10:59 AM | 0 (0.0%) | 52 (5.7%) |
| 11:00 AM to 11:59 AM | 0 (0.0%) | 54 (5.9%) |
| 12:00 PM to 3:59 PM | 37 (3.3%) | 31 (3.4%) |
| 4:00 PM to 11:59 PM | 92 (8.2%) | 21 (2.3%) |
| Total | 1,129 (100.0%) | 912 (100.0%) |
Housing Occupancy in Madisonville
Occupancy by Ownership in Madisonville
Of the total 2,090 dwellings in Madisonville, owner-occupied units account for 1,270 (60.8%), while renter-occupied units make up 820 (39.2%).
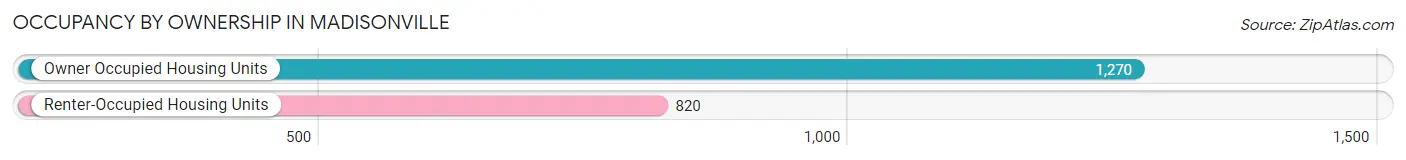
| Occupancy | # Housing Units | % Housing Units |
| Owner Occupied Housing Units | 1,270 | 60.8% |
| Renter-Occupied Housing Units | 820 | 39.2% |
| Total Occupied Housing Units | 2,090 | 100.0% |
Occupancy by Household Size in Madisonville
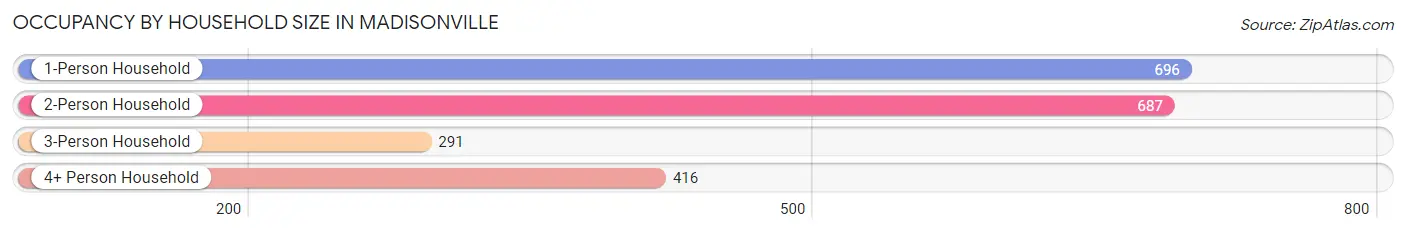
| Household Size | # Housing Units | % Housing Units |
| 1-Person Household | 696 | 33.3% |
| 2-Person Household | 687 | 32.9% |
| 3-Person Household | 291 | 13.9% |
| 4+ Person Household | 416 | 19.9% |
| Total Housing Units | 2,090 | 100.0% |
Occupancy by Ownership by Household Size in Madisonville
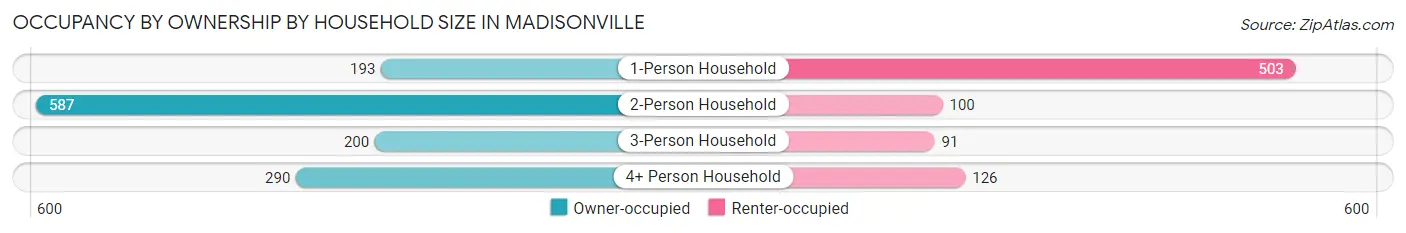
| Household Size | Owner-occupied | Renter-occupied |
| 1-Person Household | 193 (27.7%) | 503 (72.3%) |
| 2-Person Household | 587 (85.4%) | 100 (14.6%) |
| 3-Person Household | 200 (68.7%) | 91 (31.3%) |
| 4+ Person Household | 290 (69.7%) | 126 (30.3%) |
| Total Housing Units | 1,270 (60.8%) | 820 (39.2%) |
Occupancy by Educational Attainment in Madisonville
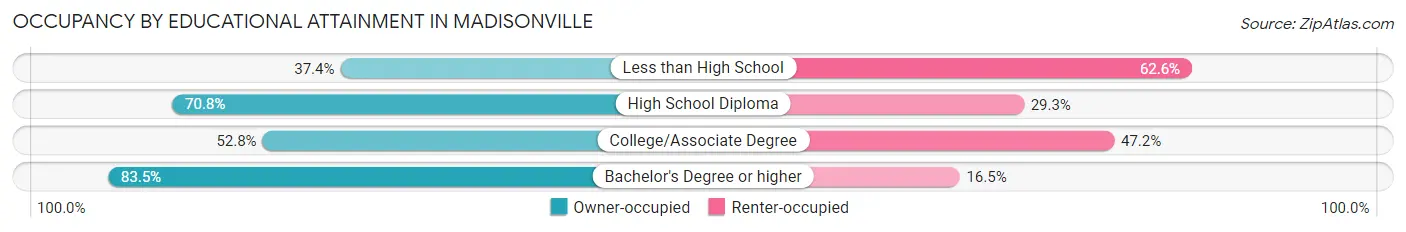
| Household Size | Owner-occupied | Renter-occupied |
| Less than High School | 147 (37.4%) | 246 (62.6%) |
| High School Diploma | 491 (70.8%) | 203 (29.2%) |
| College/Associate Degree | 354 (52.8%) | 316 (47.2%) |
| Bachelor's Degree or higher | 278 (83.5%) | 55 (16.5%) |
Occupancy by Age of Householder in Madisonville
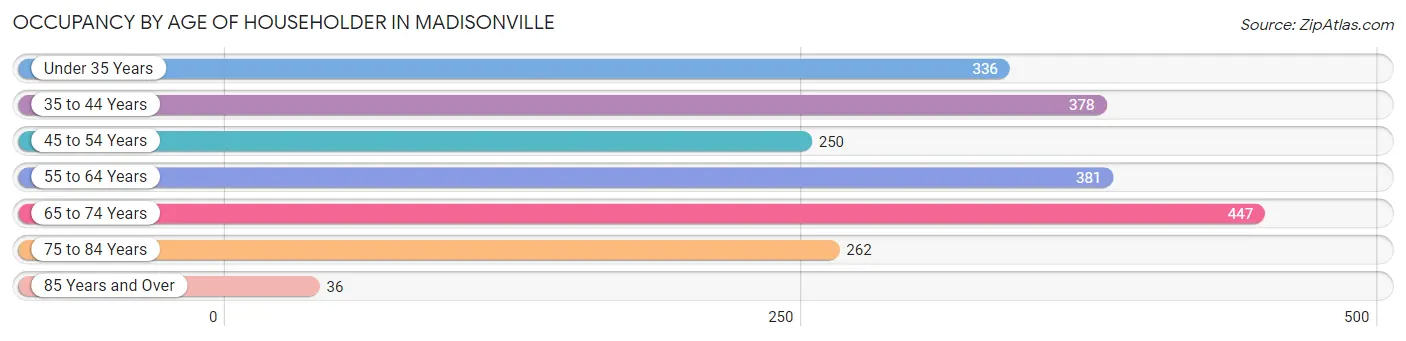
| Age Bracket | # Households | % Households |
| Under 35 Years | 336 | 16.1% |
| 35 to 44 Years | 378 | 18.1% |
| 45 to 54 Years | 250 | 12.0% |
| 55 to 64 Years | 381 | 18.2% |
| 65 to 74 Years | 447 | 21.4% |
| 75 to 84 Years | 262 | 12.5% |
| 85 Years and Over | 36 | 1.7% |
| Total | 2,090 | 100.0% |
Housing Finances in Madisonville
Median Income by Occupancy in Madisonville
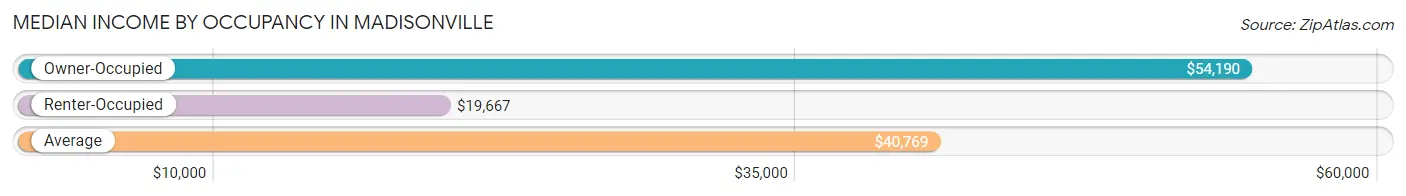
| Occupancy Type | # Households | Median Income |
| Owner-Occupied | 1,270 (60.8%) | $54,190 |
| Renter-Occupied | 820 (39.2%) | $19,667 |
| Average | 2,090 (100.0%) | $40,769 |
Occupancy by Householder Income Bracket in Madisonville
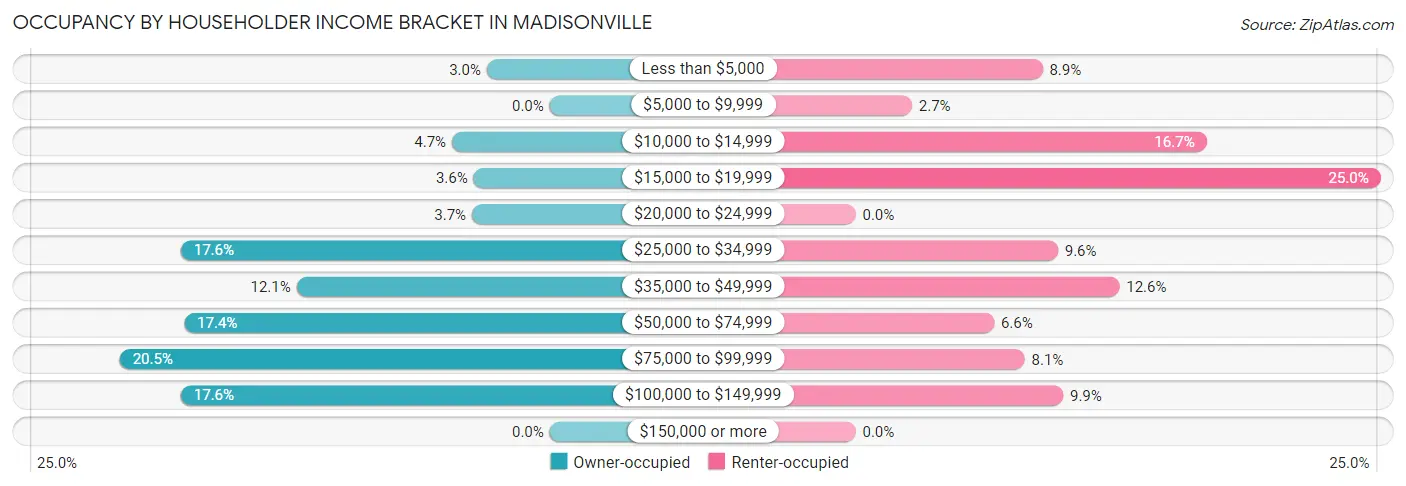
| Income Bracket | Owner-occupied | Renter-occupied |
| Less than $5,000 | 38 (3.0%) | 73 (8.9%) |
| $5,000 to $9,999 | 0 (0.0%) | 22 (2.7%) |
| $10,000 to $14,999 | 59 (4.6%) | 137 (16.7%) |
| $15,000 to $19,999 | 46 (3.6%) | 205 (25.0%) |
| $20,000 to $24,999 | 47 (3.7%) | 0 (0.0%) |
| $25,000 to $34,999 | 223 (17.6%) | 79 (9.6%) |
| $35,000 to $49,999 | 153 (12.0%) | 103 (12.6%) |
| $50,000 to $74,999 | 221 (17.4%) | 54 (6.6%) |
| $75,000 to $99,999 | 260 (20.5%) | 66 (8.1%) |
| $100,000 to $149,999 | 223 (17.6%) | 81 (9.9%) |
| $150,000 or more | 0 (0.0%) | 0 (0.0%) |
| Total | 1,270 (100.0%) | 820 (100.0%) |
Monthly Housing Cost Tiers in Madisonville
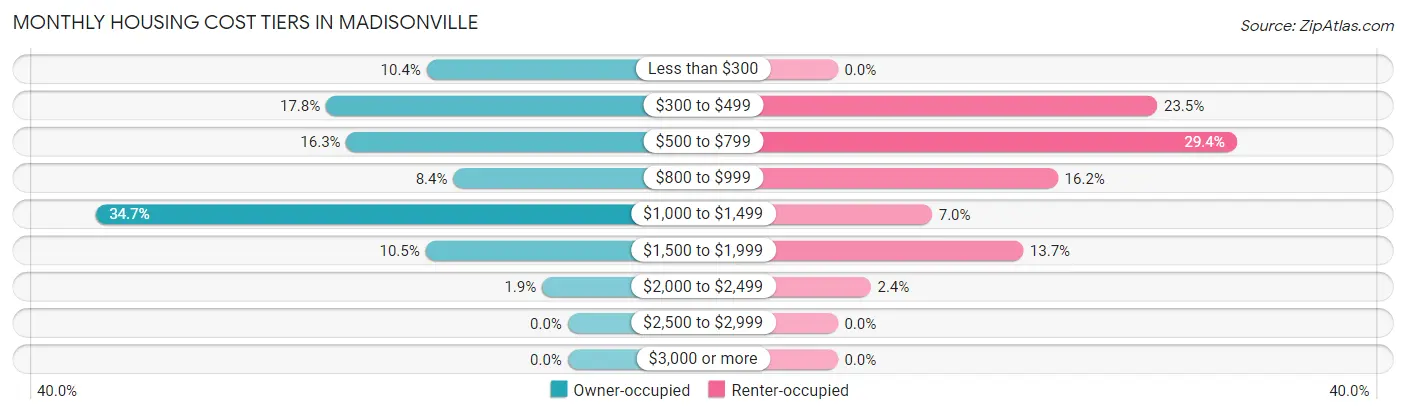
| Monthly Cost | Owner-occupied | Renter-occupied |
| Less than $300 | 132 (10.4%) | 0 (0.0%) |
| $300 to $499 | 226 (17.8%) | 193 (23.5%) |
| $500 to $799 | 207 (16.3%) | 241 (29.4%) |
| $800 to $999 | 107 (8.4%) | 133 (16.2%) |
| $1,000 to $1,499 | 441 (34.7%) | 57 (7.0%) |
| $1,500 to $1,999 | 133 (10.5%) | 112 (13.7%) |
| $2,000 to $2,499 | 24 (1.9%) | 20 (2.4%) |
| $2,500 to $2,999 | 0 (0.0%) | 0 (0.0%) |
| $3,000 or more | 0 (0.0%) | 0 (0.0%) |
| Total | 1,270 (100.0%) | 820 (100.0%) |
Physical Housing Characteristics in Madisonville
Housing Structures in Madisonville
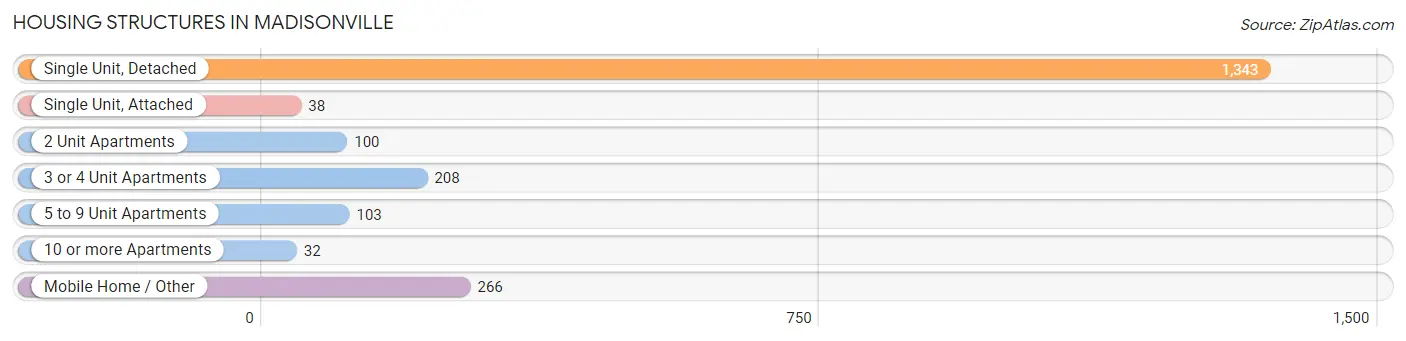
| Structure Type | # Housing Units | % Housing Units |
| Single Unit, Detached | 1,343 | 64.3% |
| Single Unit, Attached | 38 | 1.8% |
| 2 Unit Apartments | 100 | 4.8% |
| 3 or 4 Unit Apartments | 208 | 10.0% |
| 5 to 9 Unit Apartments | 103 | 4.9% |
| 10 or more Apartments | 32 | 1.5% |
| Mobile Home / Other | 266 | 12.7% |
| Total | 2,090 | 100.0% |
Housing Structures by Occupancy in Madisonville
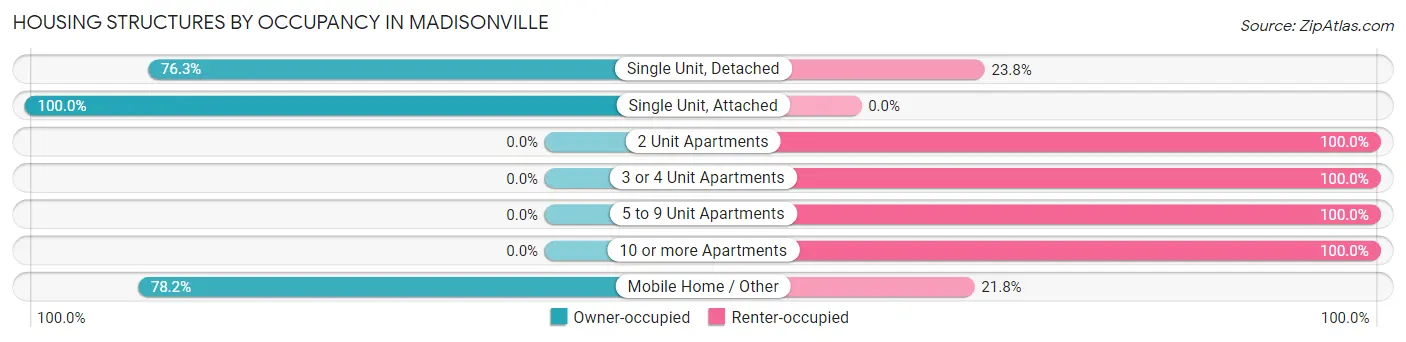
| Structure Type | Owner-occupied | Renter-occupied |
| Single Unit, Detached | 1,024 (76.2%) | 319 (23.7%) |
| Single Unit, Attached | 38 (100.0%) | 0 (0.0%) |
| 2 Unit Apartments | 0 (0.0%) | 100 (100.0%) |
| 3 or 4 Unit Apartments | 0 (0.0%) | 208 (100.0%) |
| 5 to 9 Unit Apartments | 0 (0.0%) | 103 (100.0%) |
| 10 or more Apartments | 0 (0.0%) | 32 (100.0%) |
| Mobile Home / Other | 208 (78.2%) | 58 (21.8%) |
| Total | 1,270 (60.8%) | 820 (39.2%) |
Housing Structures by Number of Rooms in Madisonville
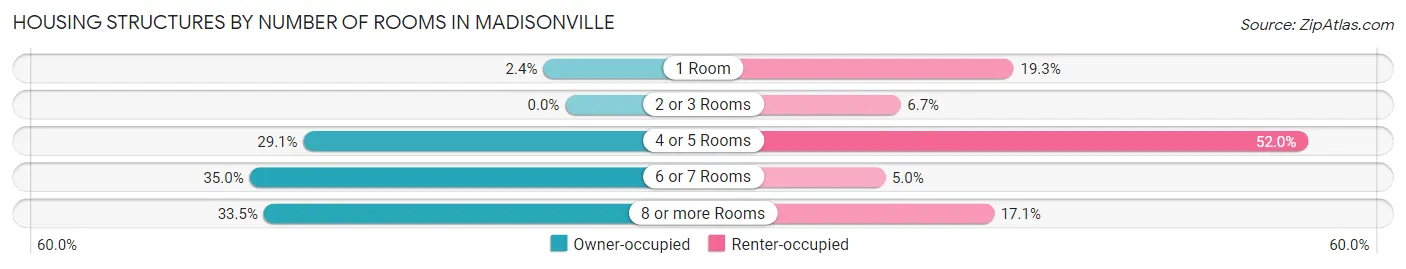
| Number of Rooms | Owner-occupied | Renter-occupied |
| 1 Room | 31 (2.4%) | 158 (19.3%) |
| 2 or 3 Rooms | 0 (0.0%) | 55 (6.7%) |
| 4 or 5 Rooms | 369 (29.1%) | 426 (51.9%) |
| 6 or 7 Rooms | 445 (35.0%) | 41 (5.0%) |
| 8 or more Rooms | 425 (33.5%) | 140 (17.1%) |
| Total | 1,270 (100.0%) | 820 (100.0%) |
Housing Structure by Heating Type in Madisonville
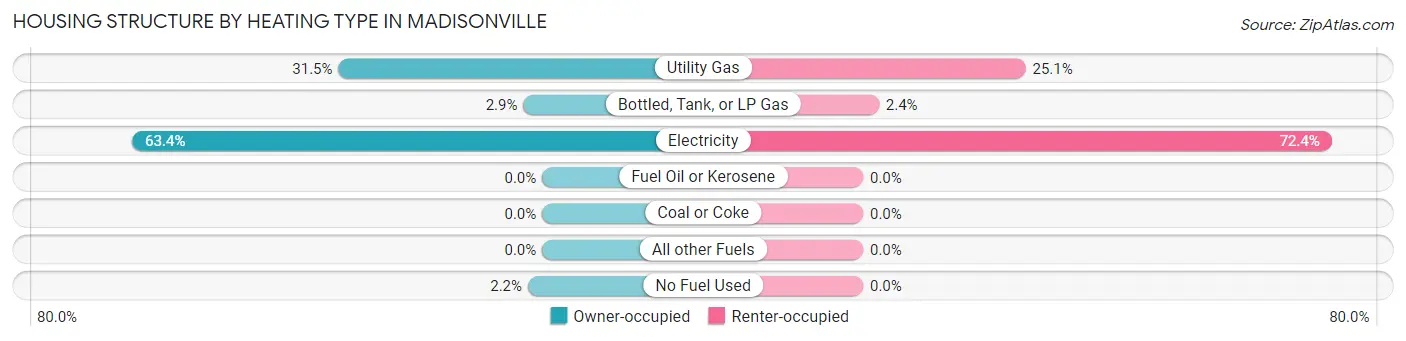
| Heating Type | Owner-occupied | Renter-occupied |
| Utility Gas | 400 (31.5%) | 206 (25.1%) |
| Bottled, Tank, or LP Gas | 37 (2.9%) | 20 (2.4%) |
| Electricity | 805 (63.4%) | 594 (72.4%) |
| Fuel Oil or Kerosene | 0 (0.0%) | 0 (0.0%) |
| Coal or Coke | 0 (0.0%) | 0 (0.0%) |
| All other Fuels | 0 (0.0%) | 0 (0.0%) |
| No Fuel Used | 28 (2.2%) | 0 (0.0%) |
| Total | 1,270 (100.0%) | 820 (100.0%) |
Household Vehicle Usage in Madisonville
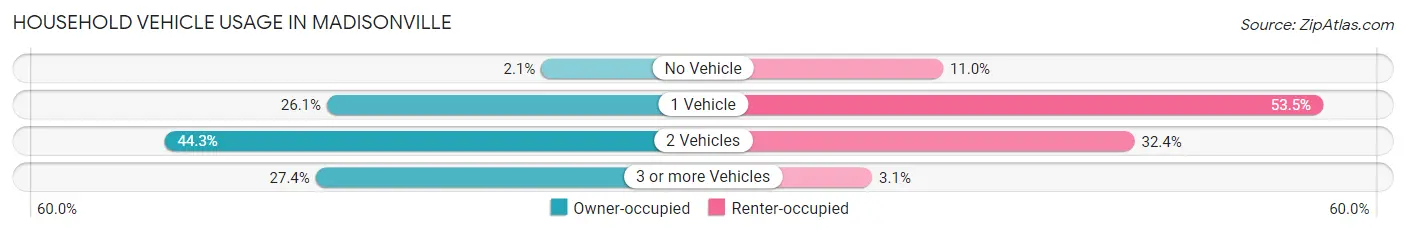
| Vehicles per Household | Owner-occupied | Renter-occupied |
| No Vehicle | 27 (2.1%) | 90 (11.0%) |
| 1 Vehicle | 332 (26.1%) | 439 (53.5%) |
| 2 Vehicles | 563 (44.3%) | 266 (32.4%) |
| 3 or more Vehicles | 348 (27.4%) | 25 (3.0%) |
| Total | 1,270 (100.0%) | 820 (100.0%) |
Real Estate & Mortgages in Madisonville
Real Estate and Mortgage Overview in Madisonville
| Characteristic | Without Mortgage | With Mortgage |
| Housing Units | 525 | 745 |
| Median Property Value | $155,800 | $178,000 |
| Median Household Income | $33,965 | $0 |
| Monthly Housing Costs | $346 | $0 |
| Real Estate Taxes | $980 | $0 |
Property Value by Mortgage Status in Madisonville
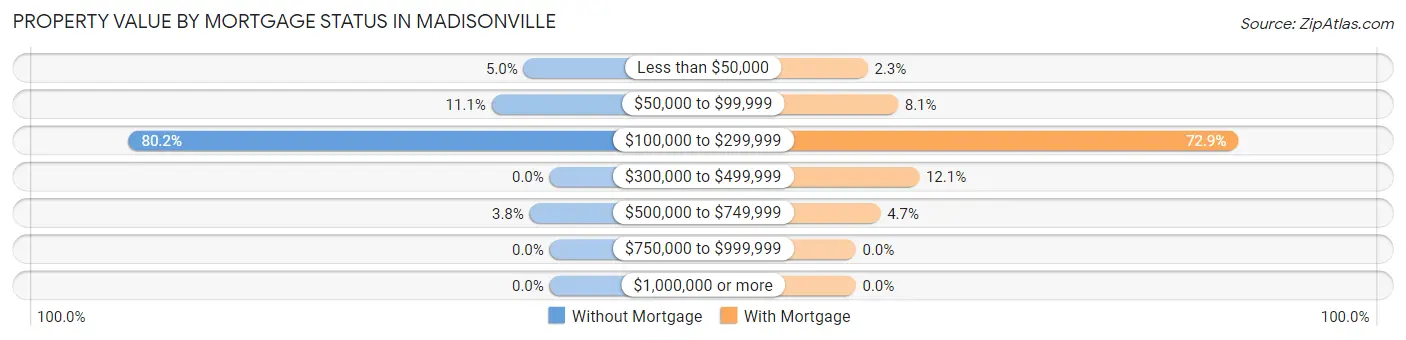
| Property Value | Without Mortgage | With Mortgage |
| Less than $50,000 | 26 (5.0%) | 17 (2.3%) |
| $50,000 to $99,999 | 58 (11.1%) | 60 (8.1%) |
| $100,000 to $299,999 | 421 (80.2%) | 543 (72.9%) |
| $300,000 to $499,999 | 0 (0.0%) | 90 (12.1%) |
| $500,000 to $749,999 | 20 (3.8%) | 35 (4.7%) |
| $750,000 to $999,999 | 0 (0.0%) | 0 (0.0%) |
| $1,000,000 or more | 0 (0.0%) | 0 (0.0%) |
| Total | 525 (100.0%) | 745 (100.0%) |
Household Income by Mortgage Status in Madisonville
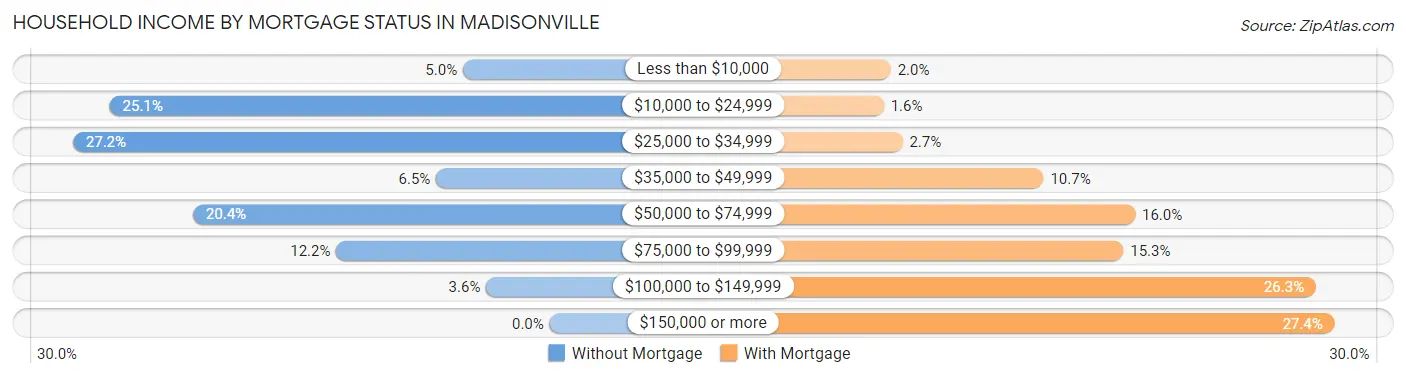
| Household Income | Without Mortgage | With Mortgage |
| Less than $10,000 | 26 (5.0%) | 15 (2.0%) |
| $10,000 to $24,999 | 132 (25.1%) | 12 (1.6%) |
| $25,000 to $34,999 | 143 (27.2%) | 20 (2.7%) |
| $35,000 to $49,999 | 34 (6.5%) | 80 (10.7%) |
| $50,000 to $74,999 | 107 (20.4%) | 119 (16.0%) |
| $75,000 to $99,999 | 64 (12.2%) | 114 (15.3%) |
| $100,000 to $149,999 | 19 (3.6%) | 196 (26.3%) |
| $150,000 or more | 0 (0.0%) | 204 (27.4%) |
| Total | 525 (100.0%) | 745 (100.0%) |
Property Value to Household Income Ratio in Madisonville
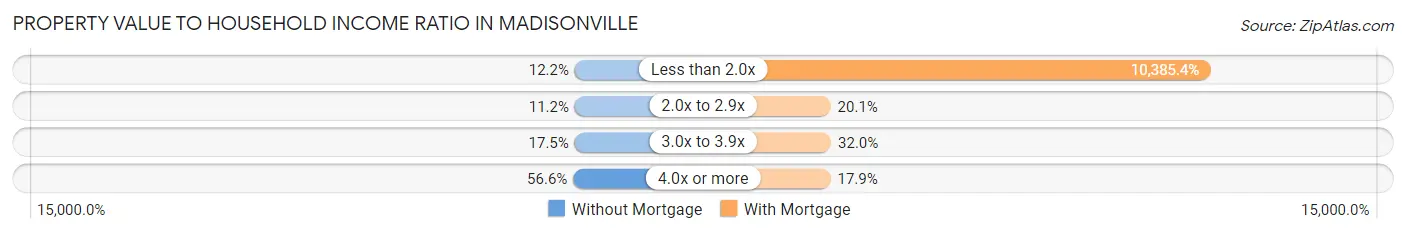
| Value-to-Income Ratio | Without Mortgage | With Mortgage |
| Less than 2.0x | 64 (12.2%) | 77,371 (10,385.4%) |
| 2.0x to 2.9x | 59 (11.2%) | 150 (20.1%) |
| 3.0x to 3.9x | 92 (17.5%) | 238 (32.0%) |
| 4.0x or more | 297 (56.6%) | 133 (17.8%) |
| Total | 525 (100.0%) | 745 (100.0%) |
Real Estate Taxes by Mortgage Status in Madisonville
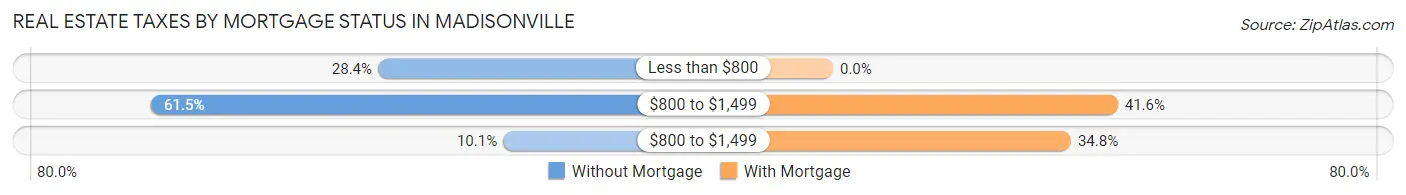
| Property Taxes | Without Mortgage | With Mortgage |
| Less than $800 | 149 (28.4%) | 0 (0.0%) |
| $800 to $1,499 | 323 (61.5%) | 310 (41.6%) |
| $800 to $1,499 | 53 (10.1%) | 259 (34.8%) |
| Total | 525 (100.0%) | 745 (100.0%) |
Health & Disability in Madisonville
Health Insurance Coverage by Age in Madisonville
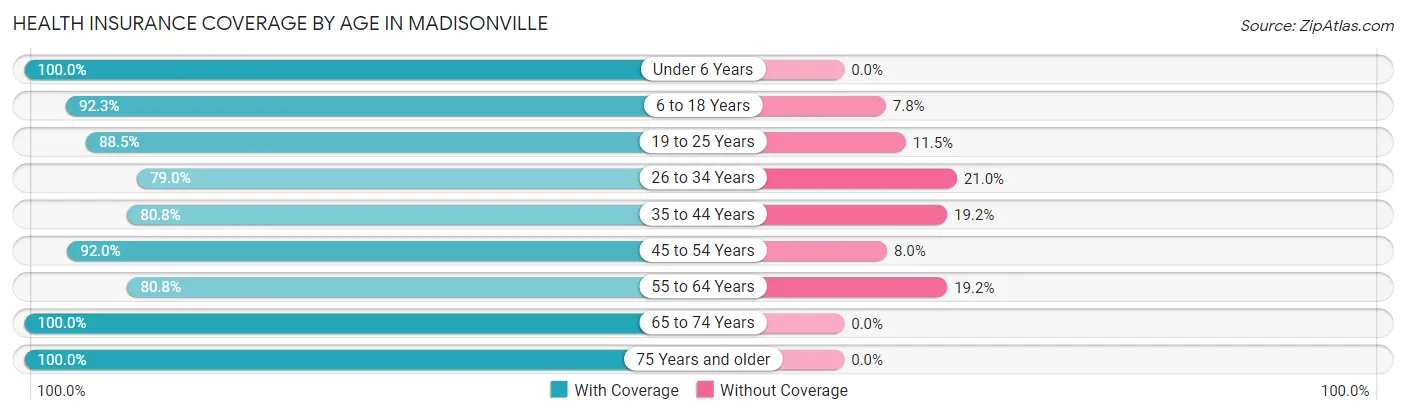
| Age Bracket | With Coverage | Without Coverage |
| Under 6 Years | 190 (100.0%) | 0 (0.0%) |
| 6 to 18 Years | 881 (92.2%) | 74 (7.7%) |
| 19 to 25 Years | 339 (88.5%) | 44 (11.5%) |
| 26 to 34 Years | 391 (79.0%) | 104 (21.0%) |
| 35 to 44 Years | 405 (80.8%) | 96 (19.2%) |
| 45 to 54 Years | 635 (92.0%) | 55 (8.0%) |
| 55 to 64 Years | 467 (80.8%) | 111 (19.2%) |
| 65 to 74 Years | 551 (100.0%) | 0 (0.0%) |
| 75 Years and older | 466 (100.0%) | 0 (0.0%) |
| Total | 4,325 (89.9%) | 484 (10.1%) |
Health Insurance Coverage by Citizenship Status in Madisonville

| Citizenship Status | With Coverage | Without Coverage |
| Native Born | 190 (100.0%) | 0 (0.0%) |
| Foreign Born, Citizen | 881 (92.2%) | 74 (7.7%) |
| Foreign Born, not a Citizen | 339 (88.5%) | 44 (11.5%) |
Health Insurance Coverage by Household Income in Madisonville
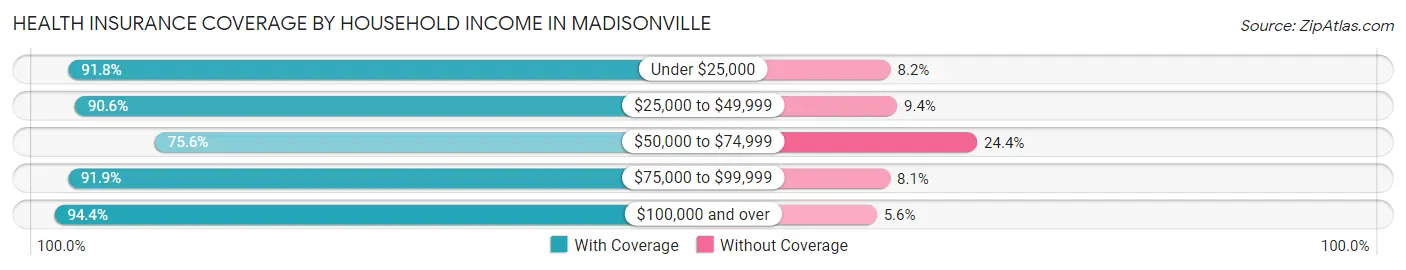
| Household Income | With Coverage | Without Coverage |
| Under $25,000 | 727 (91.8%) | 65 (8.2%) |
| $25,000 to $49,999 | 1,029 (90.6%) | 107 (9.4%) |
| $50,000 to $74,999 | 492 (75.6%) | 159 (24.4%) |
| $75,000 to $99,999 | 1,042 (91.9%) | 92 (8.1%) |
| $100,000 and over | 1,026 (94.4%) | 61 (5.6%) |
Public vs Private Health Insurance Coverage by Age in Madisonville
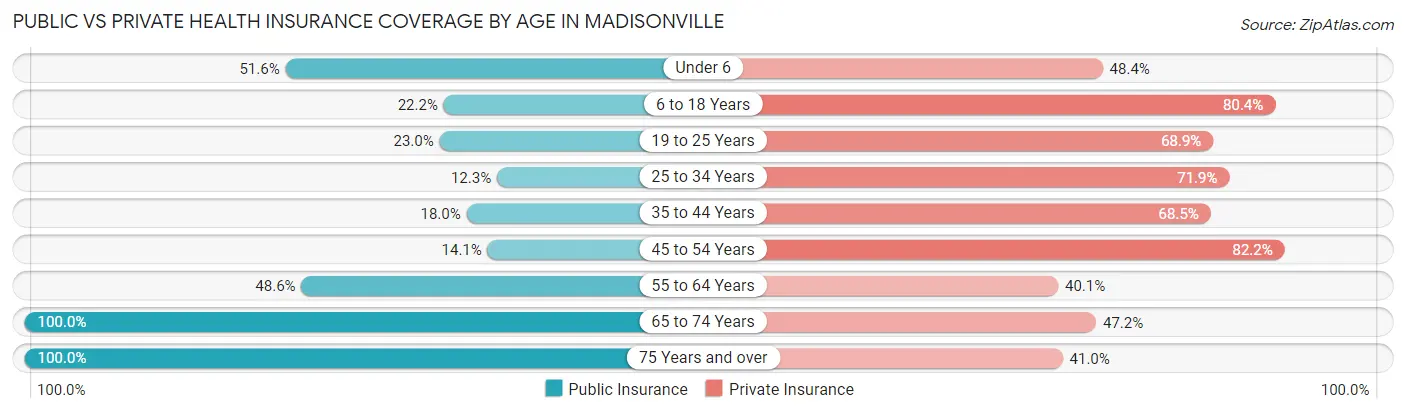
| Age Bracket | Public Insurance | Private Insurance |
| Under 6 | 98 (51.6%) | 92 (48.4%) |
| 6 to 18 Years | 212 (22.2%) | 768 (80.4%) |
| 19 to 25 Years | 88 (23.0%) | 264 (68.9%) |
| 25 to 34 Years | 61 (12.3%) | 356 (71.9%) |
| 35 to 44 Years | 90 (18.0%) | 343 (68.5%) |
| 45 to 54 Years | 97 (14.1%) | 567 (82.2%) |
| 55 to 64 Years | 281 (48.6%) | 232 (40.1%) |
| 65 to 74 Years | 551 (100.0%) | 260 (47.2%) |
| 75 Years and over | 466 (100.0%) | 191 (41.0%) |
| Total | 1,944 (40.4%) | 3,073 (63.9%) |
Disability Status by Sex by Age in Madisonville
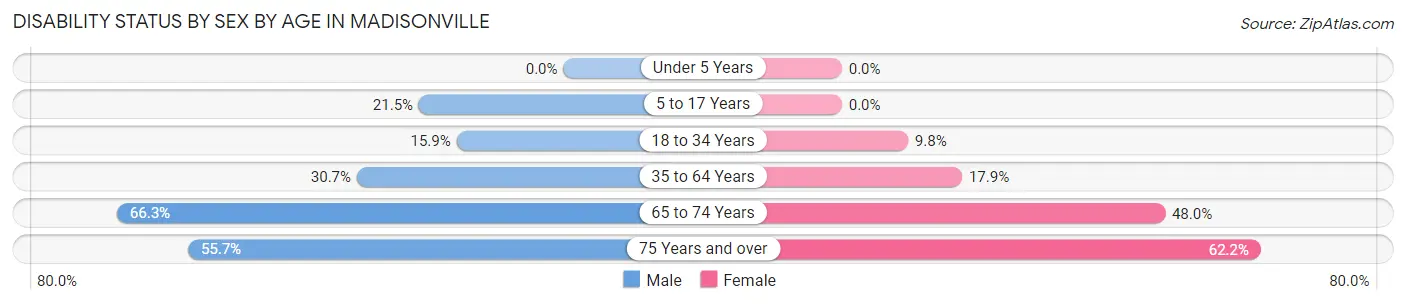
| Age Bracket | Male | Female |
| Under 5 Years | 0 (0.0%) | 0 (0.0%) |
| 5 to 17 Years | 65 (21.4%) | 0 (0.0%) |
| 18 to 34 Years | 101 (15.9%) | 38 (9.8%) |
| 35 to 64 Years | 271 (30.7%) | 158 (17.8%) |
| 65 to 74 Years | 118 (66.3%) | 179 (48.0%) |
| 75 Years and over | 68 (55.7%) | 214 (62.2%) |
Disability Class by Sex by Age in Madisonville
Disability Class: Hearing Difficulty
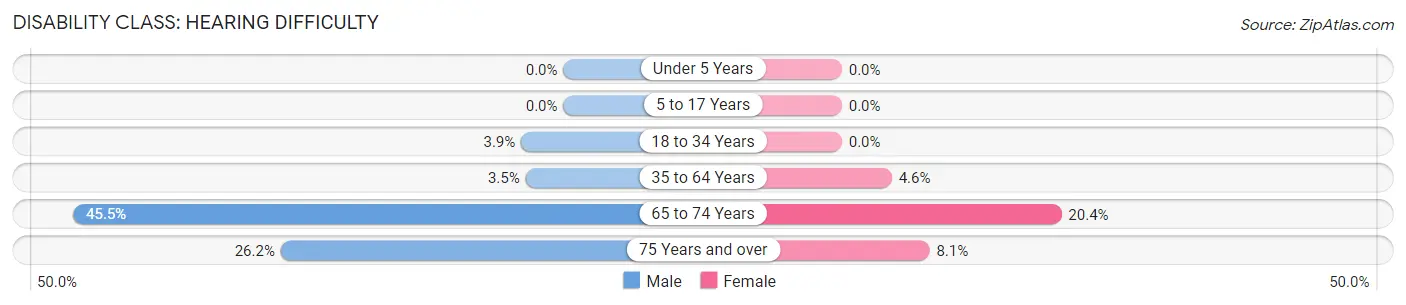
| Age Bracket | Male | Female |
| Under 5 Years | 0 (0.0%) | 0 (0.0%) |
| 5 to 17 Years | 0 (0.0%) | 0 (0.0%) |
| 18 to 34 Years | 25 (3.9%) | 0 (0.0%) |
| 35 to 64 Years | 31 (3.5%) | 41 (4.6%) |
| 65 to 74 Years | 81 (45.5%) | 76 (20.4%) |
| 75 Years and over | 32 (26.2%) | 28 (8.1%) |
Disability Class: Vision Difficulty
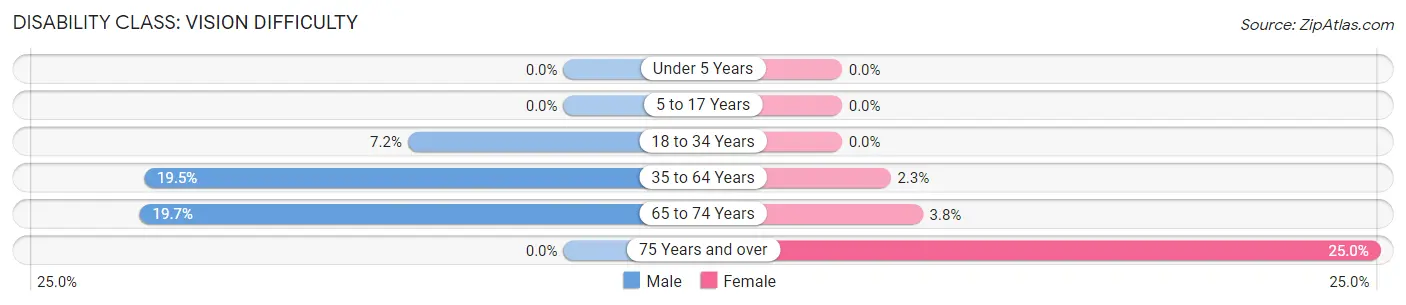
| Age Bracket | Male | Female |
| Under 5 Years | 0 (0.0%) | 0 (0.0%) |
| 5 to 17 Years | 0 (0.0%) | 0 (0.0%) |
| 18 to 34 Years | 46 (7.2%) | 0 (0.0%) |
| 35 to 64 Years | 172 (19.5%) | 20 (2.3%) |
| 65 to 74 Years | 35 (19.7%) | 14 (3.7%) |
| 75 Years and over | 0 (0.0%) | 86 (25.0%) |
Disability Class: Cognitive Difficulty
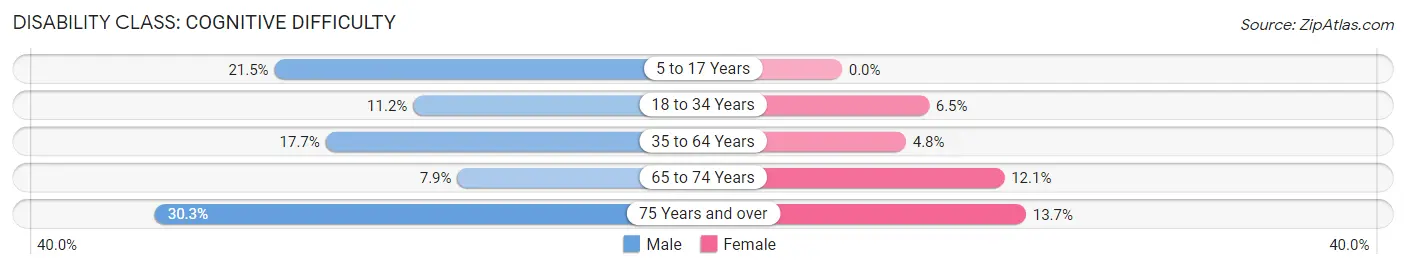
| Age Bracket | Male | Female |
| 5 to 17 Years | 65 (21.4%) | 0 (0.0%) |
| 18 to 34 Years | 71 (11.2%) | 25 (6.5%) |
| 35 to 64 Years | 156 (17.6%) | 42 (4.8%) |
| 65 to 74 Years | 14 (7.9%) | 45 (12.1%) |
| 75 Years and over | 37 (30.3%) | 47 (13.7%) |
Disability Class: Ambulatory Difficulty
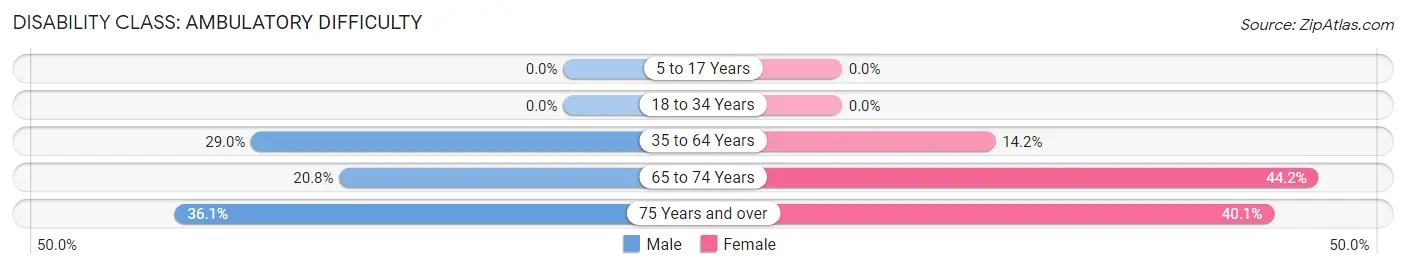
| Age Bracket | Male | Female |
| 5 to 17 Years | 0 (0.0%) | 0 (0.0%) |
| 18 to 34 Years | 0 (0.0%) | 0 (0.0%) |
| 35 to 64 Years | 256 (29.0%) | 126 (14.2%) |
| 65 to 74 Years | 37 (20.8%) | 165 (44.2%) |
| 75 Years and over | 44 (36.1%) | 138 (40.1%) |
Disability Class: Self-Care Difficulty
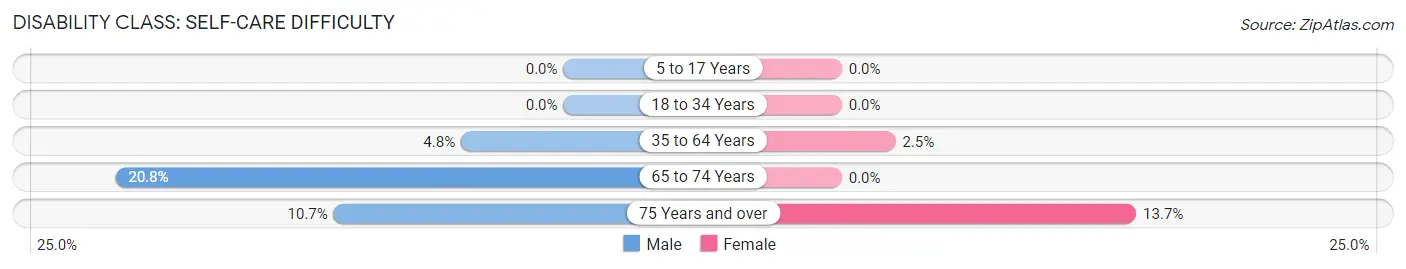
| Age Bracket | Male | Female |
| 5 to 17 Years | 0 (0.0%) | 0 (0.0%) |
| 18 to 34 Years | 0 (0.0%) | 0 (0.0%) |
| 35 to 64 Years | 42 (4.8%) | 22 (2.5%) |
| 65 to 74 Years | 37 (20.8%) | 0 (0.0%) |
| 75 Years and over | 13 (10.7%) | 47 (13.7%) |
Technology Access in Madisonville
Computing Device Access in Madisonville
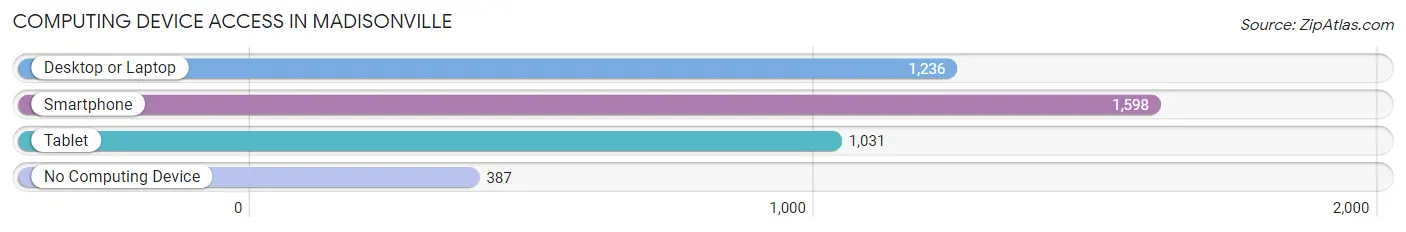
| Device Type | # Households | % Households |
| Desktop or Laptop | 1,236 | 59.1% |
| Smartphone | 1,598 | 76.5% |
| Tablet | 1,031 | 49.3% |
| No Computing Device | 387 | 18.5% |
| Total | 2,090 | 100.0% |
Internet Access in Madisonville
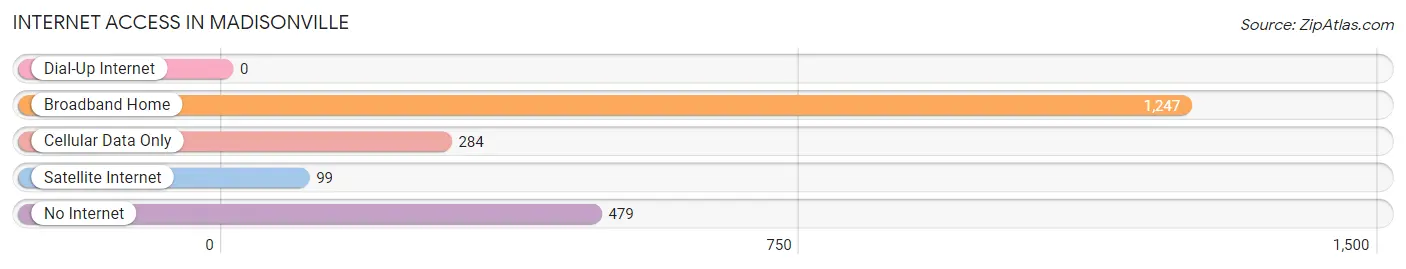
| Internet Type | # Households | % Households |
| Dial-Up Internet | 0 | 0.0% |
| Broadband Home | 1,247 | 59.7% |
| Cellular Data Only | 284 | 13.6% |
| Satellite Internet | 99 | 4.7% |
| No Internet | 479 | 22.9% |
| Total | 2,090 | 100.0% |
Madisonville Summary
History
The city of Madisonville, Tennessee is located in Monroe County, Tennessee, and is the county seat. The city was founded in 1819 and was named after President James Madison. The city was originally known as Tellico, but the name was changed to Madisonville in 1821.
The city of Madisonville was an important stop on the stagecoach route between Knoxville and Chattanooga. The city was also an important stop on the railroad line between Knoxville and Chattanooga. The railroad line was completed in 1854 and was a major factor in the growth of the city.
The city of Madisonville was an important center for the Confederate Army during the Civil War. The city was the site of several battles, including the Battle of Madisonville in 1863. The city was also the site of a major Confederate victory in the Battle of Tellico Plains in 1864.
Geography
Madisonville is located in the foothills of the Great Smoky Mountains in eastern Tennessee. The city is situated at the confluence of the Tellico and Little Tennessee Rivers. The city is located about 25 miles south of Knoxville and about 50 miles north of Chattanooga.
The city has a total area of 4.2 square miles, all of which is land. The city is located at an elevation of 890 feet above sea level. The climate in Madisonville is humid subtropical, with hot summers and mild winters.
Economy
The economy of Madisonville is largely based on agriculture and manufacturing. The city is home to several large manufacturing companies, including a paper mill, a furniture factory, and a plastics plant. The city is also home to several small businesses, including restaurants, retail stores, and service providers.
The city is also home to several educational institutions, including the University of Tennessee at Chattanooga, Tennessee Technological University, and the University of Tennessee at Knoxville.
Demographics
As of the 2010 census, the city of Madisonville had a population of 4,619. The racial makeup of the city was 87.3% White, 8.2% African American, 0.3% Native American, 0.7% Asian, 0.1% Pacific Islander, 1.2% from other races, and 2.4% from two or more races. Hispanic or Latino of any race were 3.2% of the population.
The median income for a household in the city was $30,938, and the median income for a family was $37,917. The per capita income for the city was $17,845. About 17.2% of families and 20.3% of the population were below the poverty line, including 28.2% of those under age 18 and 14.2% of those age 65 or over.
Common Questions
What is the Total Population of Madisonville?
Total Population of Madisonville is 5,120.
What is the Total Male Population of Madisonville?
Total Male Population of Madisonville is 2,379.
What is the Total Female Population of Madisonville?
Total Female Population of Madisonville is 2,741.
What is the Ratio of Males per 100 Females in Madisonville?
There are 86.79 Males per 100 Females in Madisonville.
What is the Ratio of Females per 100 Males in Madisonville?
There are 115.22 Females per 100 Males in Madisonville.
What is the Median Population Age in Madisonville?
Median Population Age in Madisonville is 41.7 Years.
What is the Average Family Size in Madisonville
Average Family Size in Madisonville is 2.9 People.
What is the Average Household Size in Madisonville
Average Household Size in Madisonville is 2.3 People.
What is Per Capita Income in Madisonville?
Per Capita income in Madisonville is $21,652.
What is the Median Family Income in Madisonville?
Median Family Income in Madisonville is $58,026.
What is the Median Household income in Madisonville?
Median Household Income in Madisonville is $40,769.
What is Income or Wage Gap in Madisonville?
Income or Wage Gap in Madisonville is 42.4%.
Women in Madisonville earn 57.6 cents for every dollar earned by a man.
What is Inequality or Gini Index in Madisonville?
Inequality or Gini Index in Madisonville is 0.40.
How Large is the Labor Force in Madisonville?
There are 2,241 People in the Labor Forcein in Madisonville.
What is the Percentage of People in the Labor Force in Madisonville?
53.5% of People are in the Labor Force in Madisonville.
What is the Unemployment Rate in Madisonville?
Unemployment Rate in Madisonville is 7.4%.