Cities with the Highest Unemployment Rate Amomg Youth Under the Age of 25 in Colorado
RELATED REPORTS & OPTIONS
Highest Unemployment | Youth < 25
Colorado
Compare Cities
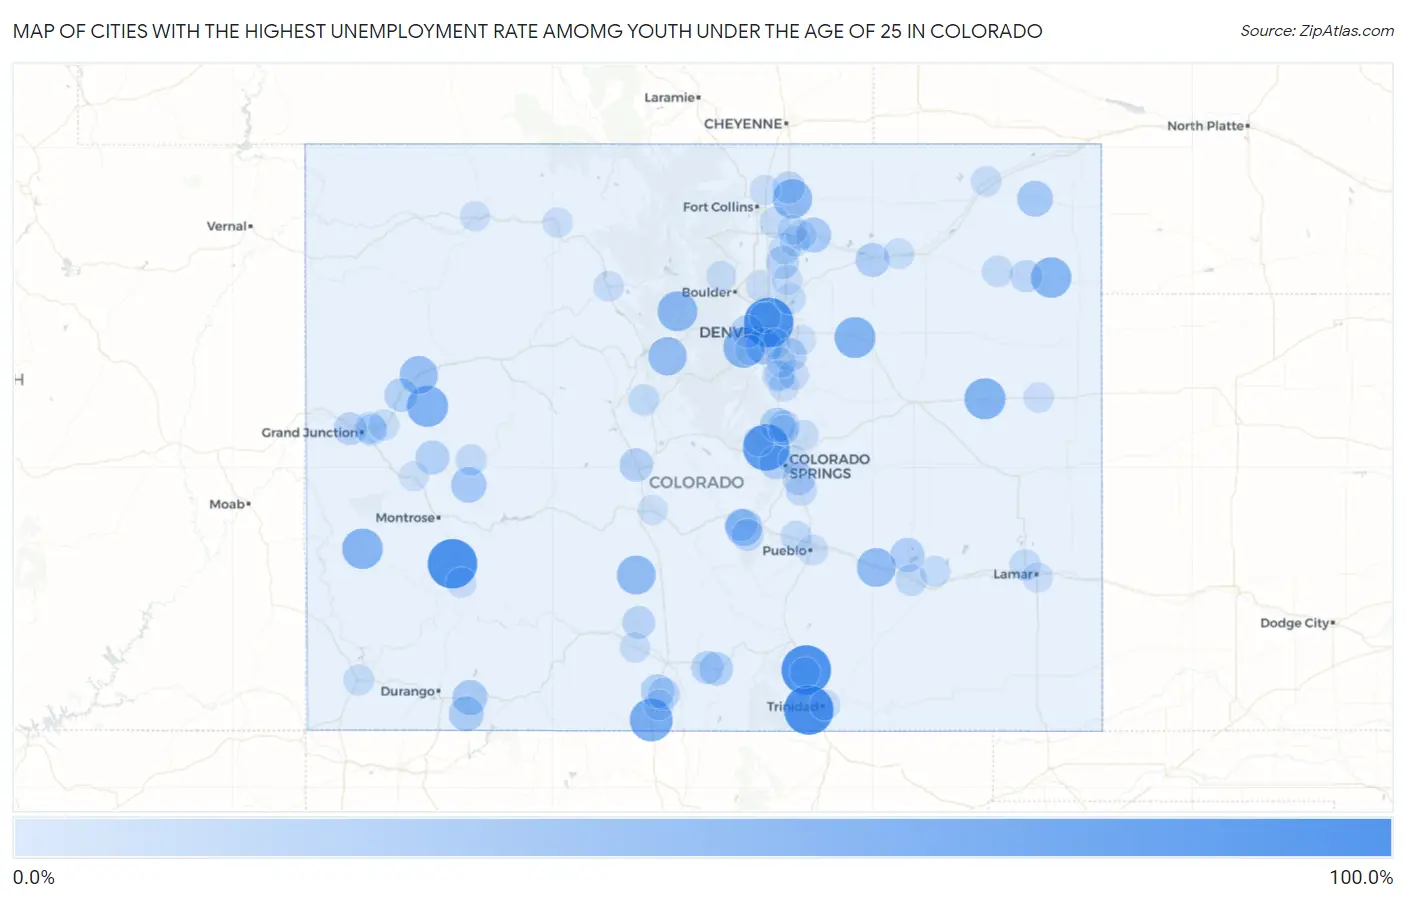
Map of Cities with the Highest Unemployment Rate Amomg Youth Under the Age of 25 in Colorado
0.0%
100.0%
Cities with the Highest Unemployment Rate Amomg Youth Under the Age of 25 in Colorado
| City | Youth Unemployment | vs State | vs National | |
| 1. | Ridgway | 100.0% | 9.1%(+90.9)#1 | 10.9%(+89.1)#57 |
| 2. | North Washington | 100.0% | 9.1%(+90.9)#2 | 10.9%(+89.1)#177 |
| 3. | Cope | 100.0% | 9.1%(+90.9)#3 | 10.9%(+89.1)#307 |
| 4. | Lynn | 100.0% | 9.1%(+90.9)#4 | 10.9%(+89.1)#320 |
| 5. | Cokedale | 99.8% | 9.1%(+90.7)#5 | 10.9%(+88.9)#375 |
| 6. | Cascade Chipita Park | 85.9% | 9.1%(+76.8)#6 | 10.9%(+75.0)#424 |
| 7. | Antonito | 68.7% | 9.1%(+59.6)#7 | 10.9%(+57.8)#606 |
| 8. | Collbran | 61.0% | 9.1%(+51.9)#8 | 10.9%(+50.1)#746 |
| 9. | Flagler | 60.0% | 9.1%(+50.9)#9 | 10.9%(+49.1)#769 |
| 10. | Byers | 59.1% | 9.1%(+50.0)#10 | 10.9%(+48.2)#799 |
| 11. | Morrison | 57.9% | 9.1%(+48.8)#11 | 10.9%(+47.0)#825 |
| 12. | Nucla | 57.6% | 9.1%(+48.5)#12 | 10.9%(+46.7)#833 |
| 13. | Eckley | 57.1% | 9.1%(+48.0)#13 | 10.9%(+46.2)#853 |
| 14. | Winter Park | 54.0% | 9.1%(+44.9)#14 | 10.9%(+43.1)#953 |
| 15. | Pierce | 51.9% | 9.1%(+42.8)#15 | 10.9%(+41.0)#1,028 |
| 16. | Saguache | 50.0% | 9.1%(+40.9)#16 | 10.9%(+39.1)#1,096 |
| 17. | Fowler | 48.6% | 9.1%(+39.5)#17 | 10.9%(+37.7)#1,221 |
| 18. | Montezuma | 47.6% | 9.1%(+38.5)#18 | 10.9%(+36.7)#1,253 |
| 19. | Parachute | 45.6% | 9.1%(+36.5)#19 | 10.9%(+34.7)#1,331 |
| 20. | Brookside | 40.0% | 9.1%(+30.9)#20 | 10.9%(+29.1)#1,695 |
| 21. | Sheridan | 38.6% | 9.1%(+29.5)#21 | 10.9%(+27.7)#1,801 |
| 22. | Haxtun | 35.2% | 9.1%(+26.1)#22 | 10.9%(+24.3)#2,091 |
| 23. | Crawford | 34.2% | 9.1%(+25.1)#23 | 10.9%(+23.3)#2,186 |
| 24. | Bayfield | 32.3% | 9.1%(+23.2)#24 | 10.9%(+21.4)#2,415 |
| 25. | Kersey | 32.1% | 9.1%(+23.0)#25 | 10.9%(+21.2)#2,436 |
| 26. | Ignacio | 31.6% | 9.1%(+22.5)#26 | 10.9%(+20.7)#2,494 |
| 27. | Palmer Lake | 29.7% | 9.1%(+20.6)#27 | 10.9%(+18.8)#2,727 |
| 28. | Pine Valley | 28.5% | 9.1%(+19.4)#28 | 10.9%(+17.6)#2,878 |
| 29. | Ordway | 27.9% | 9.1%(+18.8)#29 | 10.9%(+17.0)#2,974 |
| 30. | Wiggins | 27.6% | 9.1%(+18.5)#30 | 10.9%(+16.7)#3,026 |
| 31. | Cedaredge | 27.2% | 9.1%(+18.1)#31 | 10.9%(+16.3)#3,070 |
| 32. | La Jara | 27.2% | 9.1%(+18.1)#32 | 10.9%(+16.3)#3,077 |
| 33. | Manitou Springs | 26.7% | 9.1%(+17.6)#33 | 10.9%(+15.8)#3,156 |
| 34. | Fort Garland | 26.2% | 9.1%(+17.1)#34 | 10.9%(+15.3)#3,278 |
| 35. | De Beque | 25.9% | 9.1%(+16.8)#35 | 10.9%(+15.0)#3,328 |
| 36. | Foxfield | 25.0% | 9.1%(+15.9)#36 | 10.9%(+14.1)#3,475 |
| 37. | Buena Vista | 24.6% | 9.1%(+15.5)#37 | 10.9%(+13.7)#3,583 |
| 38. | Platteville | 23.5% | 9.1%(+14.4)#38 | 10.9%(+12.6)#3,812 |
| 39. | Blanca | 22.5% | 9.1%(+13.4)#39 | 10.9%(+11.6)#4,057 |
| 40. | Center | 22.2% | 9.1%(+13.1)#40 | 10.9%(+11.3)#4,119 |
| 41. | Redlands | 22.1% | 9.1%(+13.0)#41 | 10.9%(+11.2)#4,179 |
| 42. | Security Widefield | 21.6% | 9.1%(+12.5)#42 | 10.9%(+10.7)#4,269 |
| 43. | Applewood | 21.5% | 9.1%(+12.4)#43 | 10.9%(+10.6)#4,300 |
| 44. | Lincoln Park | 20.6% | 9.1%(+11.5)#44 | 10.9%(+9.70)#4,544 |
| 45. | Rockvale | 20.0% | 9.1%(+10.9)#45 | 10.9%(+9.10)#4,702 |
| 46. | Nunn | 20.0% | 9.1%(+10.9)#46 | 10.9%(+9.10)#4,710 |
| 47. | Woodmoor | 19.8% | 9.1%(+10.7)#47 | 10.9%(+8.90)#4,806 |
| 48. | Yuma | 19.4% | 9.1%(+10.3)#48 | 10.9%(+8.50)#4,904 |
| 49. | Sanford | 19.4% | 9.1%(+10.3)#49 | 10.9%(+8.50)#4,913 |
| 50. | Stepping Stone | 18.3% | 9.1%(+9.20)#50 | 10.9%(+7.40)#5,262 |
| 51. | Rocky Ford | 17.2% | 9.1%(+8.10)#51 | 10.9%(+6.30)#5,727 |
| 52. | Fruitvale | 16.7% | 9.1%(+7.60)#52 | 10.9%(+5.80)#5,901 |
| 53. | Alma | 16.6% | 9.1%(+7.50)#53 | 10.9%(+5.70)#5,975 |
| 54. | Milliken | 16.5% | 9.1%(+7.40)#54 | 10.9%(+5.60)#6,039 |
| 55. | Fountain | 16.2% | 9.1%(+7.10)#55 | 10.9%(+5.30)#6,113 |
| 56. | Clifton | 15.8% | 9.1%(+6.70)#56 | 10.9%(+4.90)#6,296 |
| 57. | Otis | 15.7% | 9.1%(+6.60)#57 | 10.9%(+4.80)#6,365 |
| 58. | Wiley | 15.7% | 9.1%(+6.60)#58 | 10.9%(+4.80)#6,372 |
| 59. | Pueblo West | 15.5% | 9.1%(+6.40)#59 | 10.9%(+4.60)#6,425 |
| 60. | Paonia | 15.3% | 9.1%(+6.20)#60 | 10.9%(+4.40)#6,541 |
| 61. | Brighton | 14.8% | 9.1%(+5.70)#61 | 10.9%(+3.90)#6,756 |
| 62. | Cortez | 14.8% | 9.1%(+5.70)#62 | 10.9%(+3.90)#6,779 |
| 63. | Sherrelwood | 14.7% | 9.1%(+5.60)#63 | 10.9%(+3.80)#6,826 |
| 64. | Castle Pines Village | 14.6% | 9.1%(+5.50)#64 | 10.9%(+3.70)#6,883 |
| 65. | Holly Hills | 14.3% | 9.1%(+5.20)#65 | 10.9%(+3.40)#7,018 |
| 66. | Cheraw | 14.2% | 9.1%(+5.10)#66 | 10.9%(+3.30)#7,137 |
| 67. | Windsor | 13.9% | 9.1%(+4.80)#67 | 10.9%(+3.00)#7,241 |
| 68. | Pueblo | 13.6% | 9.1%(+4.50)#68 | 10.9%(+2.70)#7,433 |
| 69. | Log Lane Village | 13.6% | 9.1%(+4.50)#69 | 10.9%(+2.70)#7,492 |
| 70. | Erie | 13.5% | 9.1%(+4.40)#70 | 10.9%(+2.60)#7,516 |
| 71. | Palisade | 13.4% | 9.1%(+4.30)#71 | 10.9%(+2.50)#7,588 |
| 72. | Castle Pines | 13.2% | 9.1%(+4.10)#72 | 10.9%(+2.30)#7,699 |
| 73. | Evans | 13.1% | 9.1%(+4.00)#73 | 10.9%(+2.20)#7,735 |
| 74. | Iliff | 13.1% | 9.1%(+4.00)#74 | 10.9%(+2.20)#7,780 |
| 75. | Trinidad | 12.8% | 9.1%(+3.70)#75 | 10.9%(+1.90)#7,925 |
| 76. | Kremmling | 12.5% | 9.1%(+3.40)#76 | 10.9%(+1.60)#8,112 |
| 77. | Garden City | 12.5% | 9.1%(+3.40)#77 | 10.9%(+1.60)#8,149 |
| 78. | Monte Vista | 12.3% | 9.1%(+3.20)#78 | 10.9%(+1.40)#8,252 |
| 79. | Manassa | 12.2% | 9.1%(+3.10)#79 | 10.9%(+1.30)#8,324 |
| 80. | Ouray | 12.1% | 9.1%(+3.00)#80 | 10.9%(+1.20)#8,365 |
| 81. | Fort Lupton | 11.9% | 9.1%(+2.80)#81 | 10.9%(+1.00)#8,470 |
| 82. | Castle Rock | 11.8% | 9.1%(+2.70)#82 | 10.9%(+0.900)#8,511 |
| 83. | Stratton | 11.7% | 9.1%(+2.60)#83 | 10.9%(+0.800)#8,611 |
| 84. | Aguilar | 11.7% | 9.1%(+2.60)#84 | 10.9%(+0.800)#8,622 |
| 85. | Jamestown | 11.6% | 9.1%(+2.50)#85 | 10.9%(+0.700)#8,689 |
| 86. | Black Forest | 11.5% | 9.1%(+2.40)#86 | 10.9%(+0.600)#8,719 |
| 87. | Lamar | 11.5% | 9.1%(+2.40)#87 | 10.9%(+0.600)#8,722 |
| 88. | The Pinery | 11.3% | 9.1%(+2.20)#88 | 10.9%(+0.400)#8,846 |
| 89. | Steamboat Springs | 11.2% | 9.1%(+2.10)#89 | 10.9%(+0.300)#8,900 |
| 90. | Craig | 11.2% | 9.1%(+2.10)#90 | 10.9%(+0.300)#8,908 |
| 91. | Woodland Park | 11.2% | 9.1%(+2.10)#91 | 10.9%(+0.300)#8,910 |
| 92. | Wellington | 10.8% | 9.1%(+1.70)#92 | 10.9%(-0.100)#9,188 |
| 93. | Colorado Springs | 10.7% | 9.1%(+1.60)#93 | 10.9%(-0.200)#9,229 |
| 94. | Salida | 10.6% | 9.1%(+1.50)#94 | 10.9%(-0.300)#9,343 |
| 95. | Lone Tree | 10.5% | 9.1%(+1.40)#95 | 10.9%(-0.400)#9,398 |
| 96. | Monument | 10.4% | 9.1%(+1.30)#96 | 10.9%(-0.500)#9,497 |
| 97. | Aurora | 10.3% | 9.1%(+1.20)#97 | 10.9%(-0.600)#9,539 |
| 98. | Dakota Ridge | 10.2% | 9.1%(+1.10)#98 | 10.9%(-0.700)#9,636 |
| 99. | Greeley | 10.0% | 9.1%(+0.900)#99 | 10.9%(-0.900)#9,767 |
| 100. | Delta | 10.0% | 9.1%(+0.900)#100 | 10.9%(-0.900)#9,796 |
Common Questions
What are the Top 10 Cities with the Highest Unemployment Rate Amomg Youth Under the Age of 25 in Colorado?
Top 10 Cities with the Highest Unemployment Rate Amomg Youth Under the Age of 25 in Colorado are:
#1
100.0%
#2
100.0%
#3
100.0%
#4
99.8%
#5
85.9%
#6
68.7%
#7
61.0%
#8
60.0%
#9
59.1%
#10
57.9%
What city has the Highest Unemployment Rate Amomg Youth Under the Age of 25 in Colorado?
Ridgway has the Highest Unemployment Rate Amomg Youth Under the Age of 25 in Colorado with 100.0%.
What is the Unemployment Rate Amomg Youth Under the Age of 25 in the State of Colorado?
Unemployment Rate Amomg Youth Under the Age of 25 in Colorado is 9.1%.
What is the Unemployment Rate Amomg Youth Under the Age of 25 in the United States?
Unemployment Rate Amomg Youth Under the Age of 25 in the United States is 10.9%.