Penn Estates, PA
Penn Estates Map
Penn Estates Overview
4,108
TOTAL POPULATION
2,111
MALE POPULATION
1,997
FEMALE POPULATION
105.71
MALES / 100 FEMALES
94.60
FEMALES / 100 MALES
45.9
MEDIAN AGE
3.2
AVG FAMILY SIZE
2.9
AVG HOUSEHOLD SIZE
$36,248
PER CAPITA INCOME
$90,120
AVG FAMILY INCOME
$88,957
AVG HOUSEHOLD INCOME
39.4%
WAGE / INCOME GAP [ % ]
60.6¢/ $1
WAGE / INCOME GAP [ $ ]
0.34
INEQUALITY / GINI INDEX
2,490
LABOR FORCE [ PEOPLE ]
70.8%
PERCENT IN LABOR FORCE
6.4%
UNEMPLOYMENT RATE
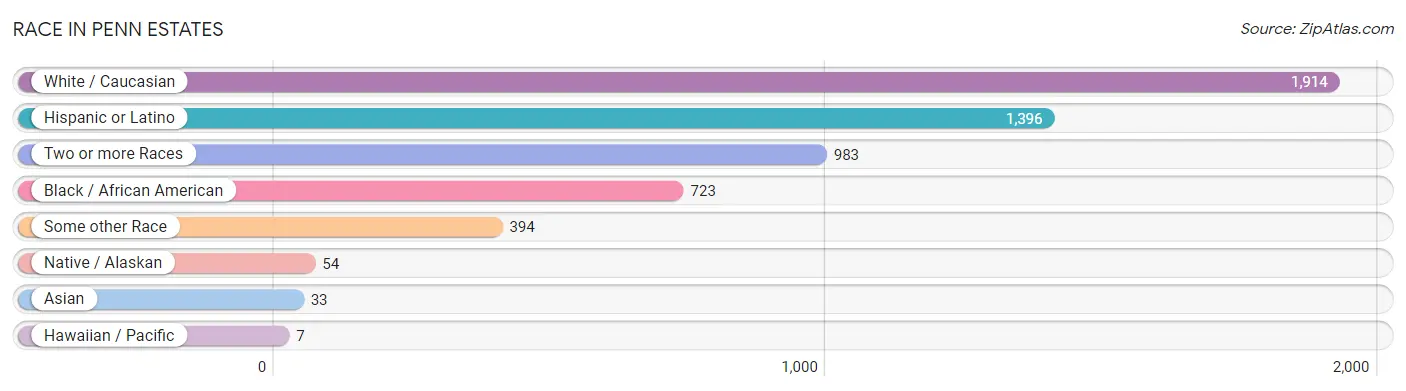
Race in Penn Estates
The most populous races in Penn Estates are White / Caucasian (1,914 | 46.6%), Hispanic or Latino (1,396 | 34.0%), and Two or more Races (983 | 23.9%).
| Race | # Population | % Population |
| Asian | 33 | 0.8% |
| Black / African American | 723 | 17.6% |
| Hawaiian / Pacific | 7 | 0.2% |
| Hispanic or Latino | 1,396 | 34.0% |
| Native / Alaskan | 54 | 1.3% |
| White / Caucasian | 1,914 | 46.6% |
| Two or more Races | 983 | 23.9% |
| Some other Race | 394 | 9.6% |
| Total | 4,108 | 100.0% |
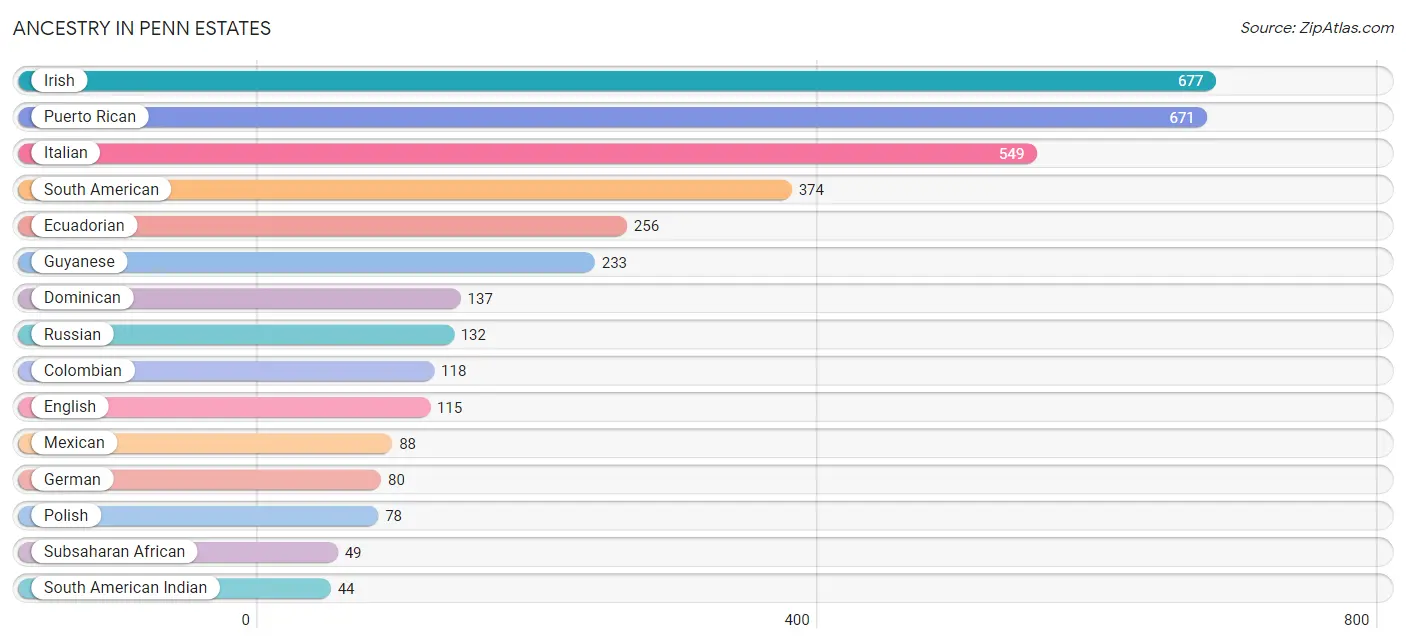
Ancestry in Penn Estates
The most populous ancestries reported in Penn Estates are Irish (677 | 16.5%), Puerto Rican (671 | 16.3%), Italian (549 | 13.4%), South American (374 | 9.1%), and Ecuadorian (256 | 6.2%), together accounting for 61.5% of all Penn Estates residents.
| Ancestry | # Population | % Population |
| British | 30 | 0.7% |
| Burmese | 14 | 0.3% |
| Central American | 34 | 0.8% |
| Choctaw | 10 | 0.2% |
| Colombian | 118 | 2.9% |
| Dominican | 137 | 3.3% |
| Eastern European | 7 | 0.2% |
| Ecuadorian | 256 | 6.2% |
| English | 115 | 2.8% |
| European | 17 | 0.4% |
| French | 39 | 0.9% |
| French Canadian | 33 | 0.8% |
| German | 80 | 1.9% |
| Greek | 39 | 0.9% |
| Guyanese | 233 | 5.7% |
| Honduran | 34 | 0.8% |
| Hungarian | 24 | 0.6% |
| Indian (Asian) | 19 | 0.5% |
| Irish | 677 | 16.5% |
| Italian | 549 | 13.4% |
| Jamaican | 8 | 0.2% |
| Korean | 16 | 0.4% |
| Mexican | 88 | 2.1% |
| Pennsylvania German | 33 | 0.8% |
| Polish | 78 | 1.9% |
| Puerto Rican | 671 | 16.3% |
| Russian | 132 | 3.2% |
| Scotch-Irish | 34 | 0.8% |
| South American | 374 | 9.1% |
| South American Indian | 44 | 1.1% |
| Sri Lankan | 14 | 0.3% |
| Subsaharan African | 49 | 1.2% |
| West Indian | 15 | 0.4% | View All 33 Rows |
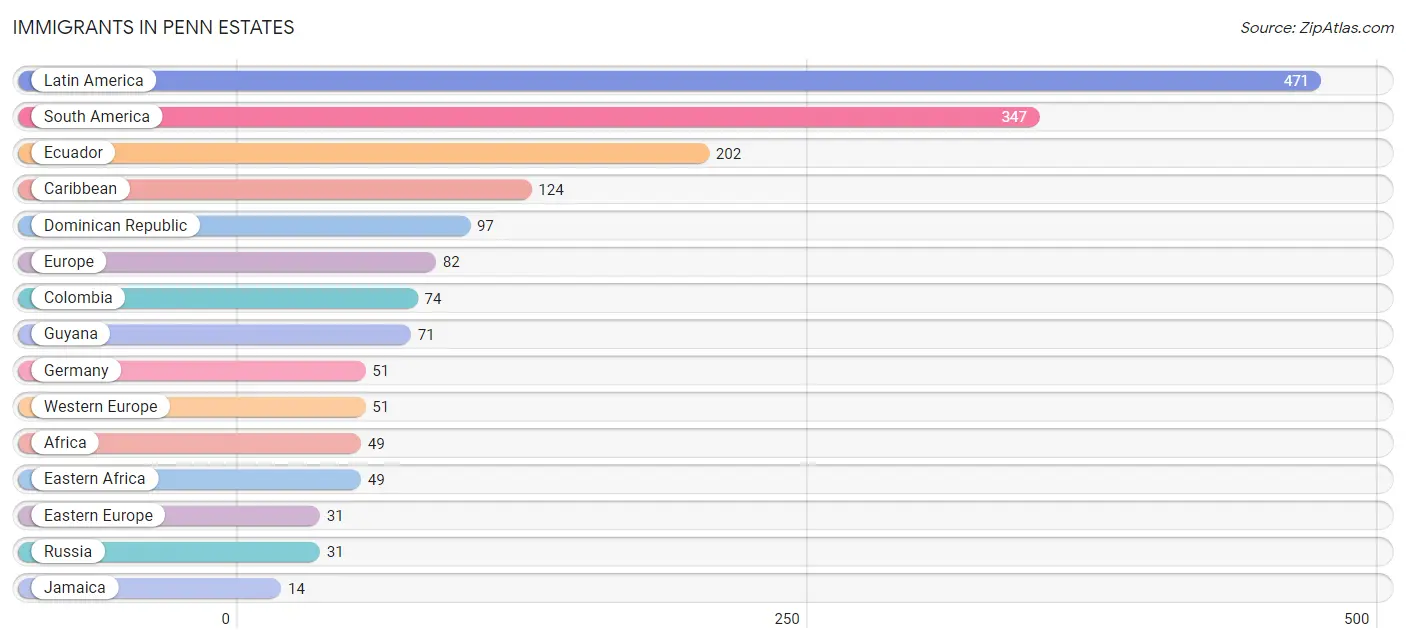
Immigrants in Penn Estates
The most numerous immigrant groups reported in Penn Estates came from Latin America (471 | 11.5%), South America (347 | 8.5%), Ecuador (202 | 4.9%), Caribbean (124 | 3.0%), and Dominican Republic (97 | 2.4%), together accounting for 30.2% of all Penn Estates residents.
| Immigration Origin | # Population | % Population |
| Africa | 49 | 1.2% |
| Asia | 3 | 0.1% |
| Australia | 10 | 0.2% |
| Canada | 7 | 0.2% |
| Caribbean | 124 | 3.0% |
| China | 3 | 0.1% |
| Colombia | 74 | 1.8% |
| Dominican Republic | 97 | 2.4% |
| Eastern Africa | 49 | 1.2% |
| Eastern Asia | 3 | 0.1% |
| Eastern Europe | 31 | 0.7% |
| Ecuador | 202 | 4.9% |
| Europe | 82 | 2.0% |
| Germany | 51 | 1.2% |
| Guyana | 71 | 1.7% |
| Jamaica | 14 | 0.3% |
| Latin America | 471 | 11.5% |
| Oceania | 10 | 0.2% |
| Russia | 31 | 0.7% |
| South America | 347 | 8.5% |
| West Indies | 13 | 0.3% |
| Western Europe | 51 | 1.2% | View All 22 Rows |
Sex and Age in Penn Estates
Sex and Age in Penn Estates
The most populous age groups in Penn Estates are 45 to 49 Years (251 | 11.9%) for men and 60 to 64 Years (303 | 15.2%) for women.
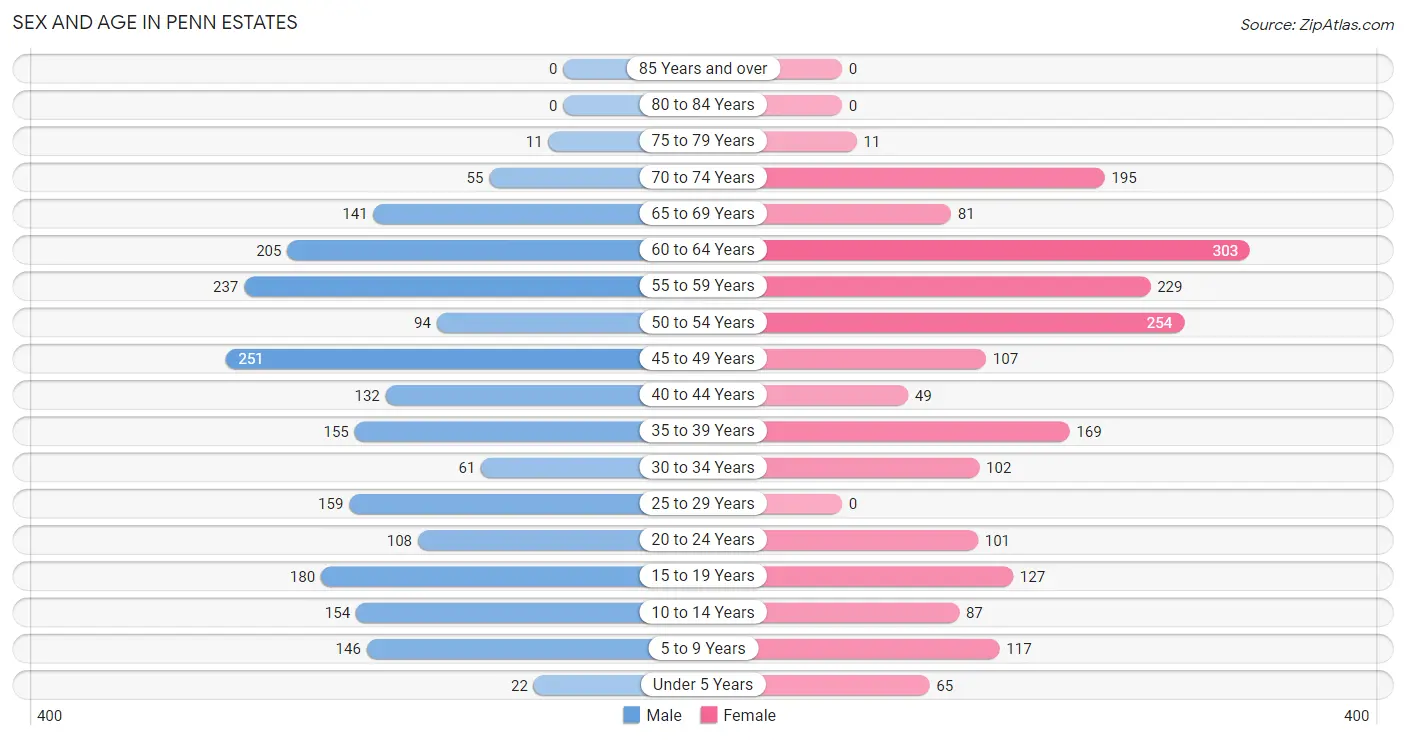
| Age Bracket | Male | Female |
| Under 5 Years | 22 (1.0%) | 65 (3.3%) |
| 5 to 9 Years | 146 (6.9%) | 117 (5.9%) |
| 10 to 14 Years | 154 (7.3%) | 87 (4.4%) |
| 15 to 19 Years | 180 (8.5%) | 127 (6.4%) |
| 20 to 24 Years | 108 (5.1%) | 101 (5.1%) |
| 25 to 29 Years | 159 (7.5%) | 0 (0.0%) |
| 30 to 34 Years | 61 (2.9%) | 102 (5.1%) |
| 35 to 39 Years | 155 (7.3%) | 169 (8.5%) |
| 40 to 44 Years | 132 (6.2%) | 49 (2.5%) |
| 45 to 49 Years | 251 (11.9%) | 107 (5.4%) |
| 50 to 54 Years | 94 (4.4%) | 254 (12.7%) |
| 55 to 59 Years | 237 (11.2%) | 229 (11.5%) |
| 60 to 64 Years | 205 (9.7%) | 303 (15.2%) |
| 65 to 69 Years | 141 (6.7%) | 81 (4.1%) |
| 70 to 74 Years | 55 (2.6%) | 195 (9.8%) |
| 75 to 79 Years | 11 (0.5%) | 11 (0.5%) |
| 80 to 84 Years | 0 (0.0%) | 0 (0.0%) |
| 85 Years and over | 0 (0.0%) | 0 (0.0%) |
| Total | 2,111 (100.0%) | 1,997 (100.0%) |
Families and Households in Penn Estates
Median Family Size in Penn Estates
The median family size in Penn Estates is 3.19 persons per family, with single male/father families (9 | 0.7%) accounting for the largest median family size of 3.44 persons per family. On the other hand, single female/mother families (255 | 20.8%) represent the smallest median family size with 2.60 persons per family.
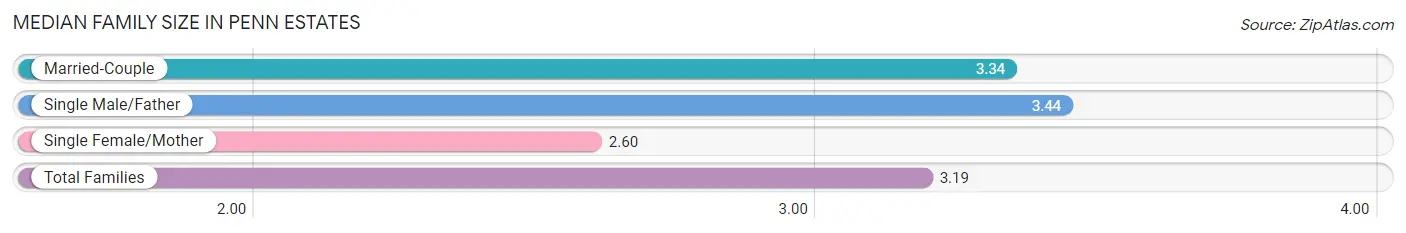
| Family Type | # Families | Family Size |
| Married-Couple | 959 (78.4%) | 3.34 |
| Single Male/Father | 9 (0.7%) | 3.44 |
| Single Female/Mother | 255 (20.8%) | 2.60 |
| Total Families | 1,223 (100.0%) | 3.19 |
Median Household Size in Penn Estates
The median household size in Penn Estates is 2.89 persons per household, with single male/father households (9 | 0.6%) accounting for the largest median household size of 3.44 persons per household. non-family households (200 | 14.1%) represent the smallest median household size with 1.05 persons per household.
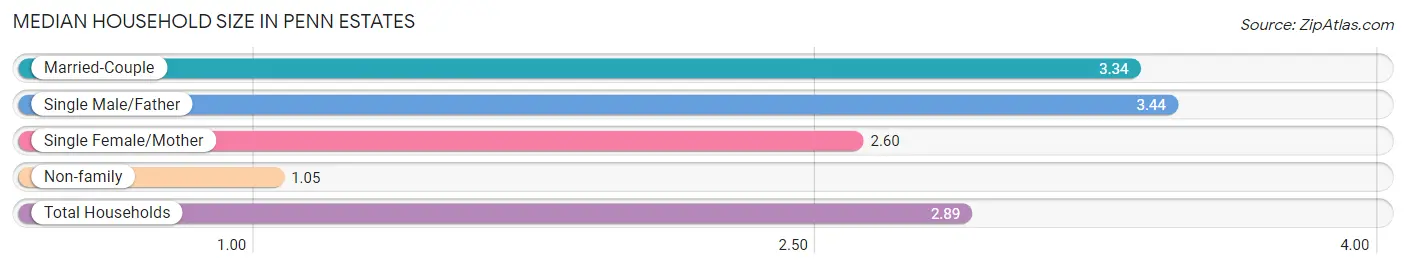
| Household Type | # Households | Household Size |
| Married-Couple | 959 (67.4%) | 3.34 |
| Single Male/Father | 9 (0.6%) | 3.44 |
| Single Female/Mother | 255 (17.9%) | 2.60 |
| Non-family | 200 (14.1%) | 1.05 |
| Total Households | 1,423 (100.0%) | 2.89 |
Household Size by Marriage Status in Penn Estates
Out of a total of 1,423 households in Penn Estates, 1,223 (86.0%) are family households, while 200 (14.1%) are nonfamily households. The most numerous type of family households are 2-person households, comprising 580, and the most common type of nonfamily households are 1-person households, comprising 190.
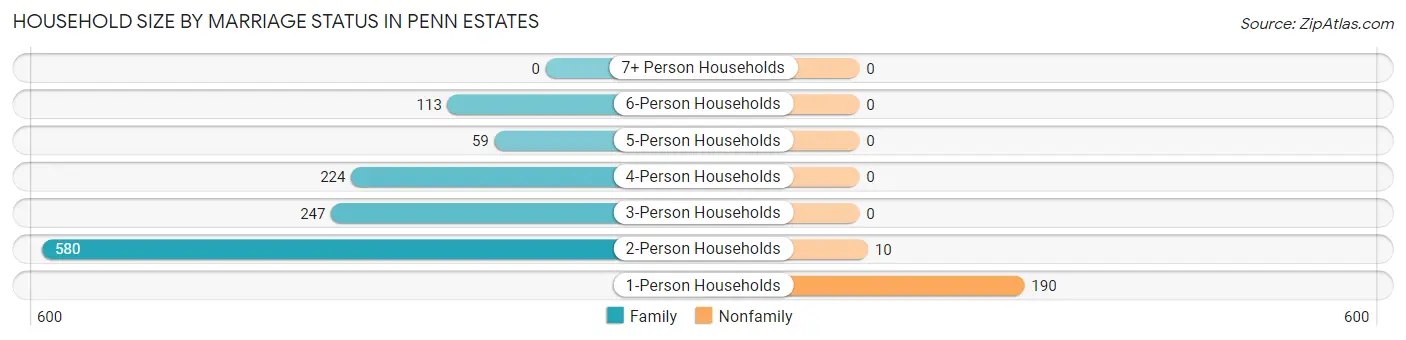
| Household Size | Family Households | Nonfamily Households |
| 1-Person Households | - | 190 (13.4%) |
| 2-Person Households | 580 (40.8%) | 10 (0.7%) |
| 3-Person Households | 247 (17.4%) | 0 (0.0%) |
| 4-Person Households | 224 (15.7%) | 0 (0.0%) |
| 5-Person Households | 59 (4.2%) | 0 (0.0%) |
| 6-Person Households | 113 (7.9%) | 0 (0.0%) |
| 7+ Person Households | 0 (0.0%) | 0 (0.0%) |
| Total | 1,223 (86.0%) | 200 (14.1%) |
Female Fertility in Penn Estates
Fertility by Age in Penn Estates
| Age Bracket | Women with Births | Births / 1,000 Women |
| 15 to 19 years | 0 (0.0%) | 0.0 |
| 20 to 34 years | 0 (0.0%) | 0.0 |
| 35 to 50 years | 0 (0.0%) | 0.0 |
| Total | 0 (0.0%) | 0.0 |
Fertility by Age by Marriage Status in Penn Estates
| Age Bracket | Married | Unmarried |
| 15 to 19 years | 0 (0.0%) | 0 (0.0%) |
| 20 to 34 years | 0 (0.0%) | 0 (0.0%) |
| 35 to 50 years | 0 (0.0%) | 0 (0.0%) |
| Total | 0 (0.0%) | 0 (0.0%) |
Fertility by Education in Penn Estates
| Educational Attainment | Women with Births | Births / 1,000 Women |
| Less than High School | 0 (0.0%) | 0.0 |
| High School Diploma | 0 (0.0%) | 0.0 |
| College or Associate's Degree | 0 (0.0%) | 0.0 |
| Bachelor's Degree | 0 (0.0%) | 0.0 |
| Graduate Degree | 0 (0.0%) | 0.0 |
| Total | 0 (0.0%) | 0.0 |
Fertility by Education by Marriage Status in Penn Estates
| Educational Attainment | Married | Unmarried |
| Less than High School | 0 (0.0%) | 0 (0.0%) |
| High School Diploma | 0 (0.0%) | 0 (0.0%) |
| College or Associate's Degree | 0 (0.0%) | 0 (0.0%) |
| Bachelor's Degree | 0 (0.0%) | 0 (0.0%) |
| Graduate Degree | 0 (0.0%) | 0 (0.0%) |
| Total | 0 (0.0%) | 0 (0.0%) |
Income in Penn Estates
Income Overview in Penn Estates
Per Capita Income in Penn Estates is $36,248, while median incomes of families and households are $90,120 and $88,957 respectively.
| Characteristic | Number | Measure |
| Per Capita Income | 4,108 | $36,248 |
| Median Family Income | 1,223 | $90,120 |
| Mean Family Income | 1,223 | $105,995 |
| Median Household Income | 1,423 | $88,957 |
| Mean Household Income | 1,423 | $100,358 |
| Income Deficit | 1,223 | $0 |
| Wage / Income Gap (%) | 4,108 | 39.35% |
| Wage / Income Gap ($) | 4,108 | 60.65¢ per $1 |
| Gini / Inequality Index | 4,108 | 0.34 |
Earnings by Sex in Penn Estates
Average Earnings in Penn Estates are $39,834, $47,202 for men and $28,627 for women, a difference of 39.4%.
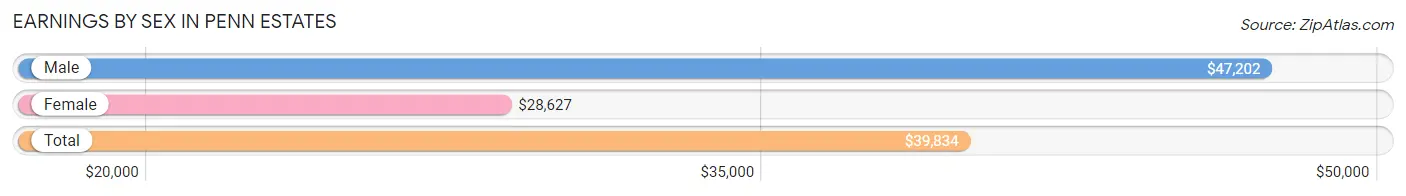
| Sex | Number | Average Earnings |
| Male | 1,449 (56.5%) | $47,202 |
| Female | 1,114 (43.5%) | $28,627 |
| Total | 2,563 (100.0%) | $39,834 |
Earnings by Sex by Income Bracket in Penn Estates
The most common earnings brackets in Penn Estates are $75,000 to $99,999 for men (202 | 13.9%) and $25,000 to $29,999 for women (142 | 12.8%).
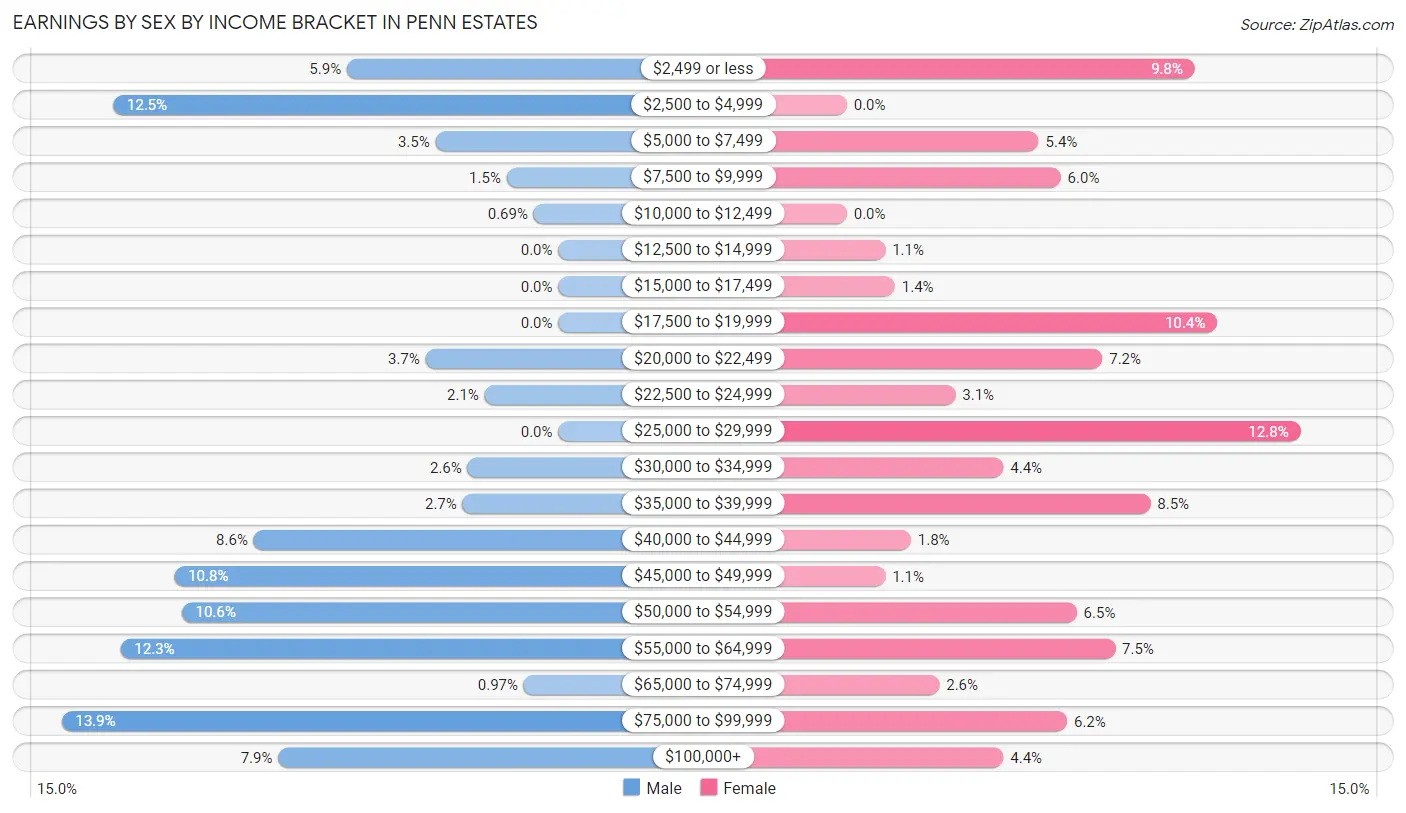
| Income | Male | Female |
| $2,499 or less | 86 (5.9%) | 109 (9.8%) |
| $2,500 to $4,999 | 181 (12.5%) | 0 (0.0%) |
| $5,000 to $7,499 | 50 (3.5%) | 60 (5.4%) |
| $7,500 to $9,999 | 21 (1.5%) | 67 (6.0%) |
| $10,000 to $12,499 | 10 (0.7%) | 0 (0.0%) |
| $12,500 to $14,999 | 0 (0.0%) | 12 (1.1%) |
| $15,000 to $17,499 | 0 (0.0%) | 15 (1.3%) |
| $17,500 to $19,999 | 0 (0.0%) | 116 (10.4%) |
| $20,000 to $22,499 | 54 (3.7%) | 80 (7.2%) |
| $22,500 to $24,999 | 30 (2.1%) | 34 (3.0%) |
| $25,000 to $29,999 | 0 (0.0%) | 142 (12.8%) |
| $30,000 to $34,999 | 37 (2.5%) | 49 (4.4%) |
| $35,000 to $39,999 | 39 (2.7%) | 95 (8.5%) |
| $40,000 to $44,999 | 124 (8.6%) | 20 (1.8%) |
| $45,000 to $49,999 | 156 (10.8%) | 12 (1.1%) |
| $50,000 to $54,999 | 153 (10.6%) | 72 (6.5%) |
| $55,000 to $64,999 | 178 (12.3%) | 84 (7.5%) |
| $65,000 to $74,999 | 14 (1.0%) | 29 (2.6%) |
| $75,000 to $99,999 | 202 (13.9%) | 69 (6.2%) |
| $100,000+ | 114 (7.9%) | 49 (4.4%) |
| Total | 1,449 (100.0%) | 1,114 (100.0%) |
Earnings by Sex by Educational Attainment in Penn Estates
Average earnings in Penn Estates are $53,154 for men and $29,613 for women, a difference of 44.3%. Men with an educational attainment of high school diploma enjoy the highest average annual earnings of $54,898, while those with college or associate's degree education earn the least with $45,702. Women with an educational attainment of bachelor's degree earn the most with the average annual earnings of $61,284, while those with high school diploma education have the smallest earnings of $21,641.
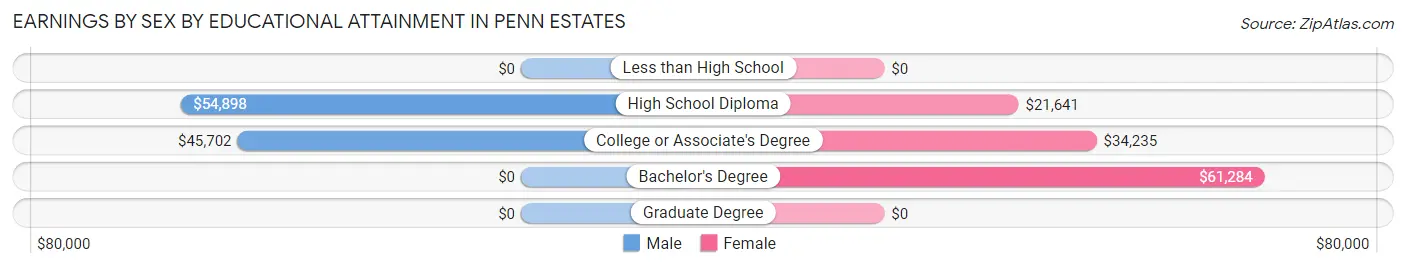
| Educational Attainment | Male Income | Female Income |
| Less than High School | - | - |
| High School Diploma | $54,898 | $21,641 |
| College or Associate's Degree | $45,702 | $34,235 |
| Bachelor's Degree | - | - |
| Graduate Degree | - | - |
| Total | $53,154 | $29,613 |
Family Income in Penn Estates
Family Income Brackets in Penn Estates
According to the Penn Estates family income data, there are 268 families falling into the $100,000 to $149,999 income range, which is the most common income bracket and makes up 21.9% of all families.
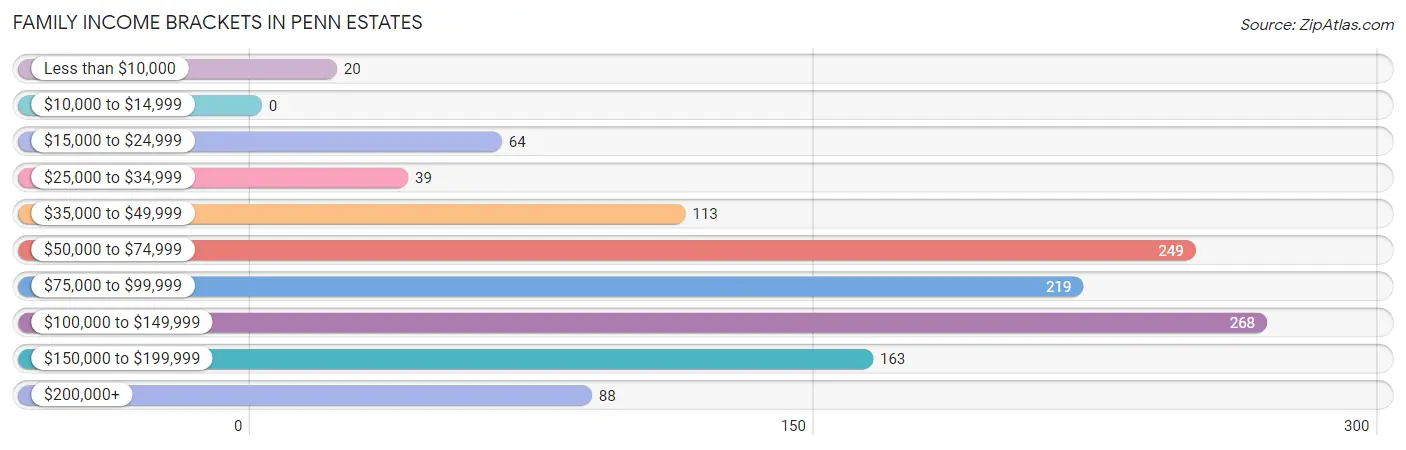
| Income Bracket | # Families | % Families |
| Less than $10,000 | 20 | 1.6% |
| $10,000 to $14,999 | 0 | 0.0% |
| $15,000 to $24,999 | 64 | 5.2% |
| $25,000 to $34,999 | 39 | 3.2% |
| $35,000 to $49,999 | 113 | 9.2% |
| $50,000 to $74,999 | 249 | 20.4% |
| $75,000 to $99,999 | 219 | 17.9% |
| $100,000 to $149,999 | 268 | 21.9% |
| $150,000 to $199,999 | 163 | 13.3% |
| $200,000+ | 88 | 7.2% |
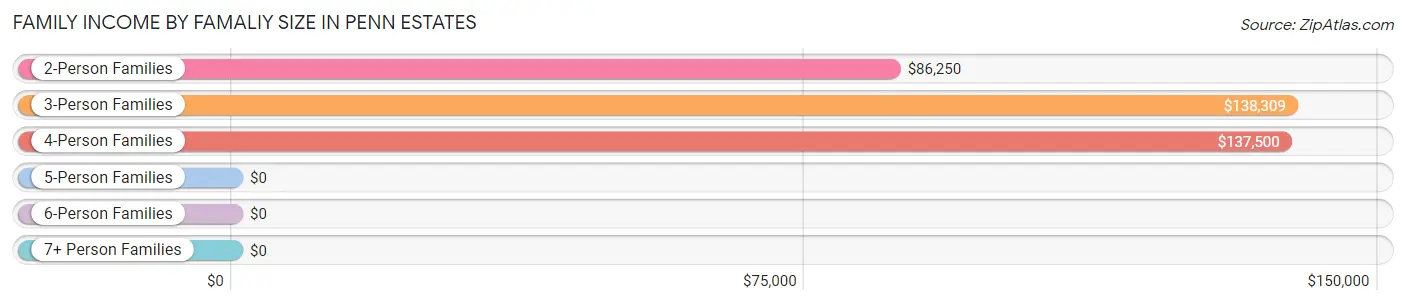
Family Income by Famaliy Size in Penn Estates
3-person families (247 | 20.2%) account for the highest median family income in Penn Estates with $138,309 per family, while 3-person families (247 | 20.2%) have the highest median income of $46,103 per family member.
| Income Bracket | # Families | Median Income |
| 2-Person Families | 580 (47.4%) | $86,250 |
| 3-Person Families | 247 (20.2%) | $138,309 |
| 4-Person Families | 224 (18.3%) | $137,500 |
| 5-Person Families | 59 (4.8%) | $0 |
| 6-Person Families | 113 (9.2%) | $0 |
| 7+ Person Families | 0 (0.0%) | $0 |
| Total | 1,223 (100.0%) | $90,120 |
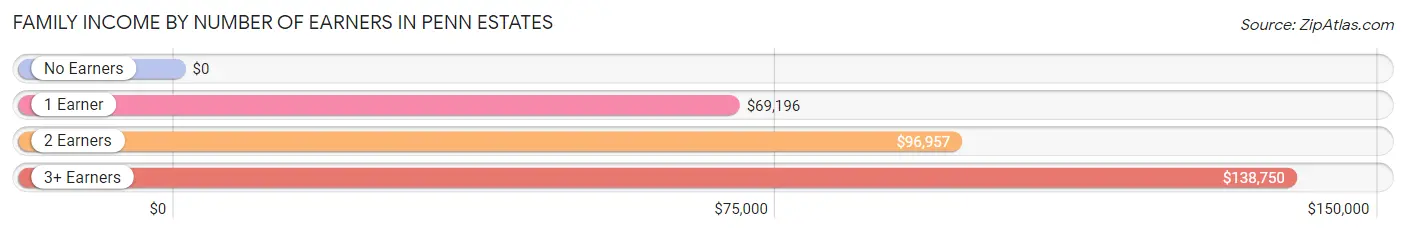
Family Income by Number of Earners in Penn Estates
| Number of Earners | # Families | Median Income |
| No Earners | 120 (9.8%) | $0 |
| 1 Earner | 365 (29.8%) | $69,196 |
| 2 Earners | 410 (33.5%) | $96,957 |
| 3+ Earners | 328 (26.8%) | $138,750 |
| Total | 1,223 (100.0%) | $90,120 |
Household Income in Penn Estates
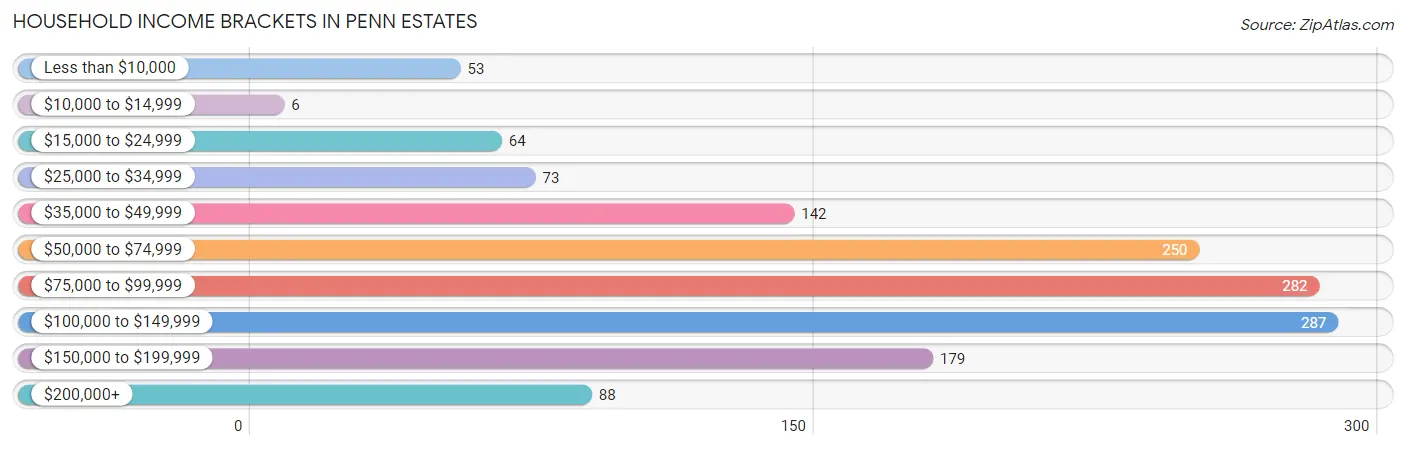
Household Income Brackets in Penn Estates
With 287 households falling in the category, the $100,000 to $149,999 income range is the most frequent in Penn Estates, accounting for 20.2% of all households. In contrast, only 6 households (0.4%) fall into the $10,000 to $14,999 income bracket, making it the least populous group.
| Income Bracket | # Households | % Households |
| Less than $10,000 | 53 | 3.7% |
| $10,000 to $14,999 | 6 | 0.4% |
| $15,000 to $24,999 | 64 | 4.5% |
| $25,000 to $34,999 | 73 | 5.1% |
| $35,000 to $49,999 | 142 | 10.0% |
| $50,000 to $74,999 | 250 | 17.6% |
| $75,000 to $99,999 | 282 | 19.8% |
| $100,000 to $149,999 | 287 | 20.2% |
| $150,000 to $199,999 | 179 | 12.6% |
| $200,000+ | 88 | 6.2% |
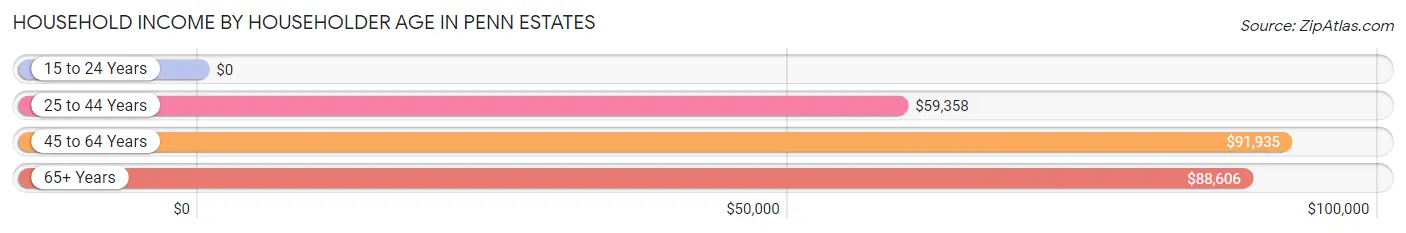
Household Income by Householder Age in Penn Estates
The median household income in Penn Estates is $88,957, with the highest median household income of $91,935 found in the 45 to 64 years age bracket for the primary householder. A total of 945 households (66.4%) fall into this category.
| Income Bracket | # Households | Median Income |
| 15 to 24 Years | 0 (0.0%) | $0 |
| 25 to 44 Years | 239 (16.8%) | $59,358 |
| 45 to 64 Years | 945 (66.4%) | $91,935 |
| 65+ Years | 239 (16.8%) | $88,606 |
| Total | 1,423 (100.0%) | $88,957 |
Poverty in Penn Estates
Income Below Poverty by Sex and Age in Penn Estates
With 12.2% poverty level for males and 17.6% for females among the residents of Penn Estates, 5 year old males and 75 year old and over females are the most vulnerable to poverty, with 41 males (100.0%) and 11 females (100.0%) in their respective age groups living below the poverty level.
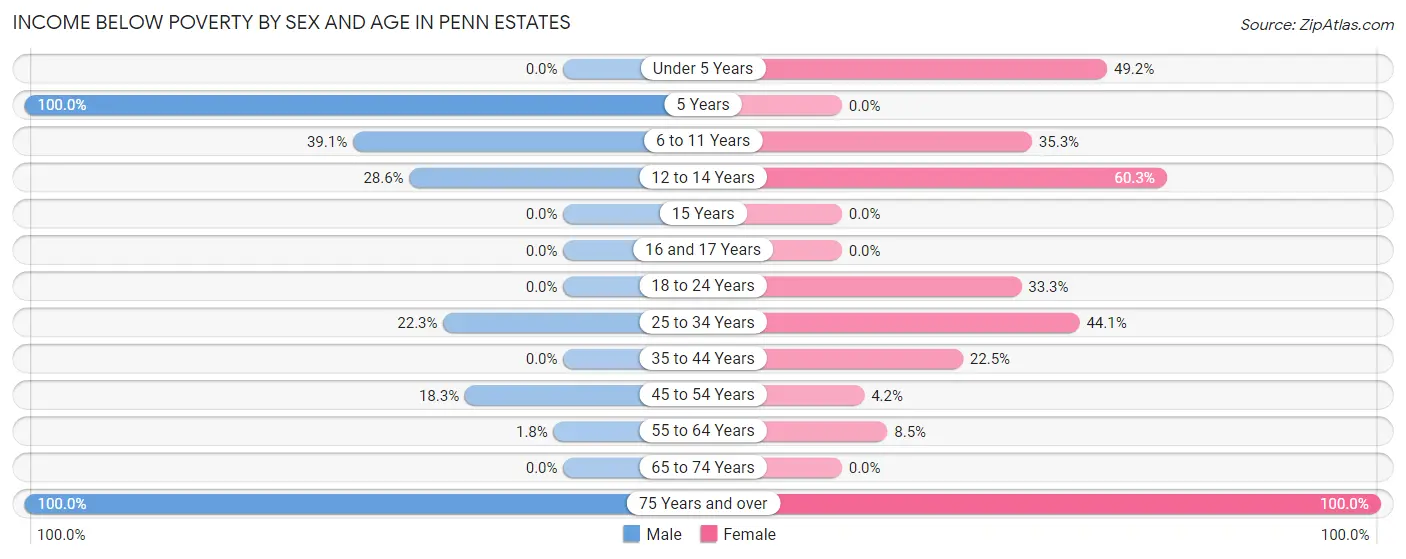
| Age Bracket | Male | Female |
| Under 5 Years | 0 (0.0%) | 32 (49.2%) |
| 5 Years | 41 (100.0%) | 0 (0.0%) |
| 6 to 11 Years | 41 (39.1%) | 48 (35.3%) |
| 12 to 14 Years | 44 (28.6%) | 41 (60.3%) |
| 15 Years | 0 (0.0%) | 0 (0.0%) |
| 16 and 17 Years | 0 (0.0%) | 0 (0.0%) |
| 18 to 24 Years | 0 (0.0%) | 66 (33.3%) |
| 25 to 34 Years | 49 (22.3%) | 45 (44.1%) |
| 35 to 44 Years | 0 (0.0%) | 49 (22.5%) |
| 45 to 54 Years | 63 (18.3%) | 15 (4.2%) |
| 55 to 64 Years | 8 (1.8%) | 45 (8.5%) |
| 65 to 74 Years | 0 (0.0%) | 0 (0.0%) |
| 75 Years and over | 11 (100.0%) | 11 (100.0%) |
| Total | 257 (12.2%) | 352 (17.6%) |
Income Above Poverty by Sex and Age in Penn Estates
According to the poverty statistics in Penn Estates, males aged under 5 years and females aged 16 and 17 years are the age groups that are most secure financially, with 100.0% of males and 100.0% of females in these age groups living above the poverty line.
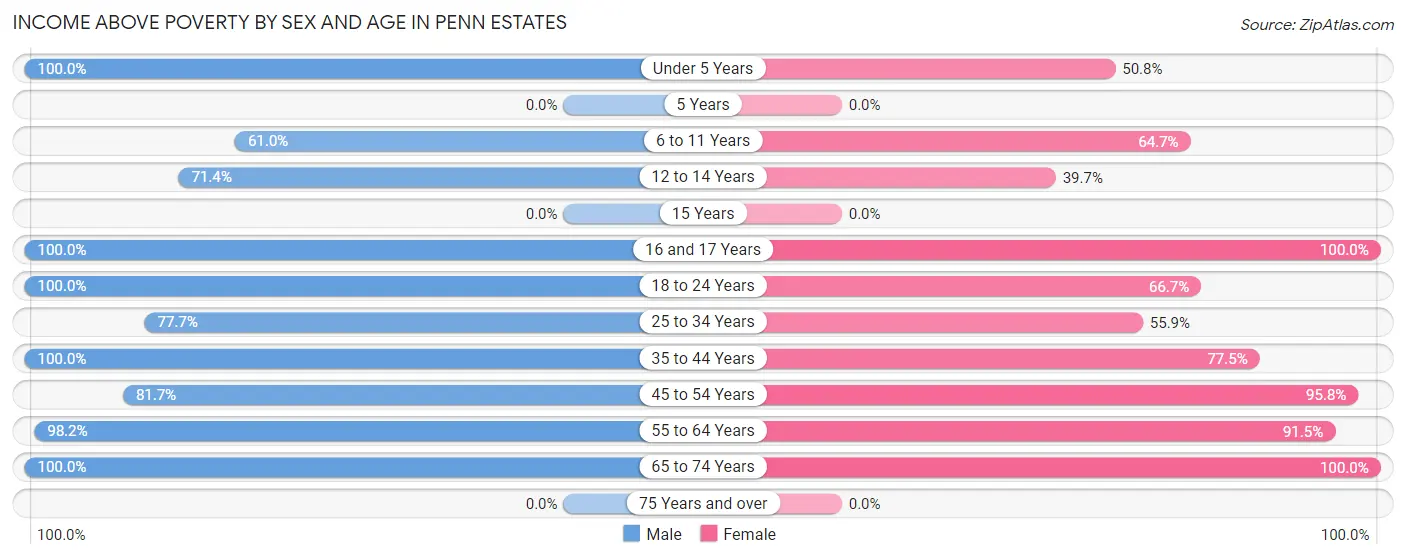
| Age Bracket | Male | Female |
| Under 5 Years | 22 (100.0%) | 33 (50.8%) |
| 5 Years | 0 (0.0%) | 0 (0.0%) |
| 6 to 11 Years | 64 (61.0%) | 88 (64.7%) |
| 12 to 14 Years | 110 (71.4%) | 27 (39.7%) |
| 15 Years | 0 (0.0%) | 0 (0.0%) |
| 16 and 17 Years | 168 (100.0%) | 30 (100.0%) |
| 18 to 24 Years | 120 (100.0%) | 132 (66.7%) |
| 25 to 34 Years | 171 (77.7%) | 57 (55.9%) |
| 35 to 44 Years | 287 (100.0%) | 169 (77.5%) |
| 45 to 54 Years | 282 (81.7%) | 346 (95.8%) |
| 55 to 64 Years | 434 (98.2%) | 487 (91.5%) |
| 65 to 74 Years | 196 (100.0%) | 276 (100.0%) |
| 75 Years and over | 0 (0.0%) | 0 (0.0%) |
| Total | 1,854 (87.8%) | 1,645 (82.4%) |
Income Below Poverty Among Married-Couple Families in Penn Estates
The poverty statistics for married-couple families in Penn Estates show that 9.9% or 95 of the total 959 families live below the poverty line. Families with 3 or 4 children have the highest poverty rate of 44.3%, comprising of 39 families. On the other hand, families with no children have the lowest poverty rate of 1.2%, which includes 7 families.
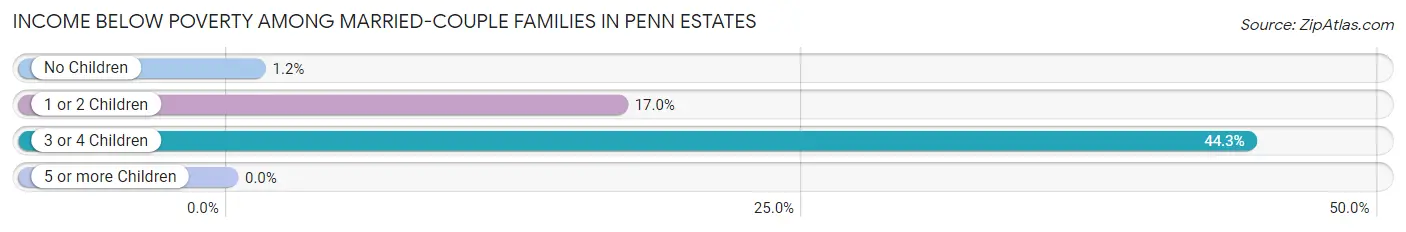
| Children | Above Poverty | Below Poverty |
| No Children | 575 (98.8%) | 7 (1.2%) |
| 1 or 2 Children | 240 (83.0%) | 49 (17.0%) |
| 3 or 4 Children | 49 (55.7%) | 39 (44.3%) |
| 5 or more Children | 0 (0.0%) | 0 (0.0%) |
| Total | 864 (90.1%) | 95 (9.9%) |
Income Below Poverty Among Single-Parent Households in Penn Estates
According to the poverty data in Penn Estates, 100.0% or 9 single-father households and 7.4% or 19 single-mother households are living below the poverty line. Among single-father households, those with no children have the highest poverty rate, with 9 households (100.0%) experiencing poverty. Likewise, among single-mother households, those with 1 or 2 children have the highest poverty rate, with 19 households (12.7%) falling below the poverty line.
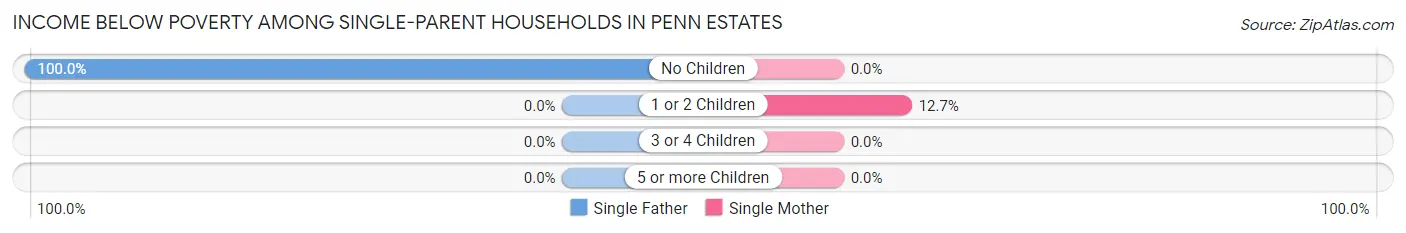
| Children | Single Father | Single Mother |
| No Children | 9 (100.0%) | 0 (0.0%) |
| 1 or 2 Children | 0 (0.0%) | 19 (12.7%) |
| 3 or 4 Children | 0 (0.0%) | 0 (0.0%) |
| 5 or more Children | 0 (0.0%) | 0 (0.0%) |
| Total | 9 (100.0%) | 19 (7.4%) |
Income Below Poverty Among Married-Couple vs Single-Parent Households in Penn Estates
The poverty data for Penn Estates shows that 95 of the married-couple family households (9.9%) and 28 of the single-parent households (10.6%) are living below the poverty level. Within the married-couple family households, those with 3 or 4 children have the highest poverty rate, with 39 households (44.3%) falling below the poverty line. Among the single-parent households, those with 1 or 2 children have the highest poverty rate, with 19 household (12.7%) living below poverty.
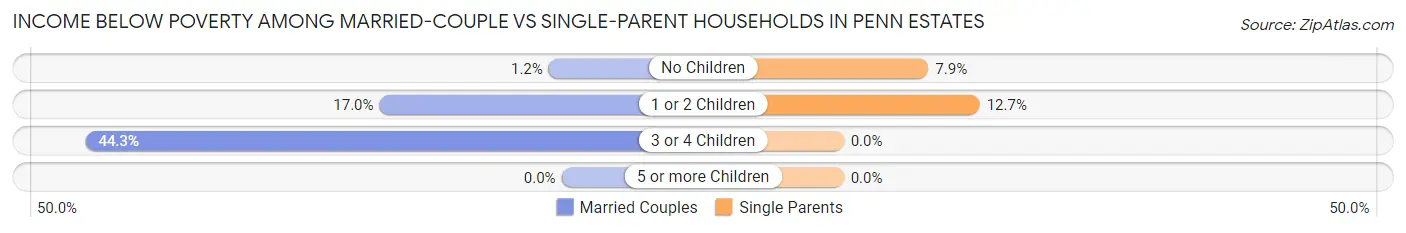
| Children | Married-Couple Families | Single-Parent Households |
| No Children | 7 (1.2%) | 9 (7.9%) |
| 1 or 2 Children | 49 (17.0%) | 19 (12.7%) |
| 3 or 4 Children | 39 (44.3%) | 0 (0.0%) |
| 5 or more Children | 0 (0.0%) | 0 (0.0%) |
| Total | 95 (9.9%) | 28 (10.6%) |
Employment Characteristics in Penn Estates
Employment by Class of Employer in Penn Estates
Among the 2,267 employed individuals in Penn Estates, private company employees (1,779 | 78.5%), local government employees (184 | 8.1%), and self-employed (not incorporated) (105 | 4.6%) make up the most common classes of employment.
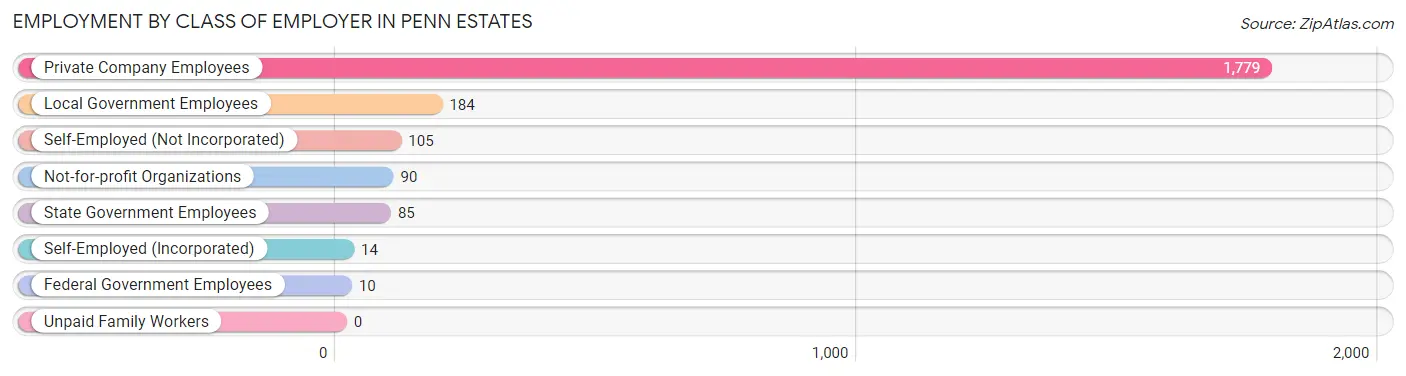
| Employer Class | # Employees | % Employees |
| Private Company Employees | 1,779 | 78.5% |
| Self-Employed (Incorporated) | 14 | 0.6% |
| Self-Employed (Not Incorporated) | 105 | 4.6% |
| Not-for-profit Organizations | 90 | 4.0% |
| Local Government Employees | 184 | 8.1% |
| State Government Employees | 85 | 3.7% |
| Federal Government Employees | 10 | 0.4% |
| Unpaid Family Workers | 0 | 0.0% |
| Total | 2,267 | 100.0% |
Employment Status by Age in Penn Estates
According to the labor force statistics for Penn Estates, out of the total population over 16 years of age (3,517), 70.8% or 2,490 individuals are in the labor force, with 6.4% or 159 of them unemployed. The age group with the highest labor force participation rate is 25 to 29 years, with 100.0% or 159 individuals in the labor force. Within the labor force, the 25 to 29 years age range has the highest percentage of unemployed individuals, with 30.8% or 49 of them being unemployed.
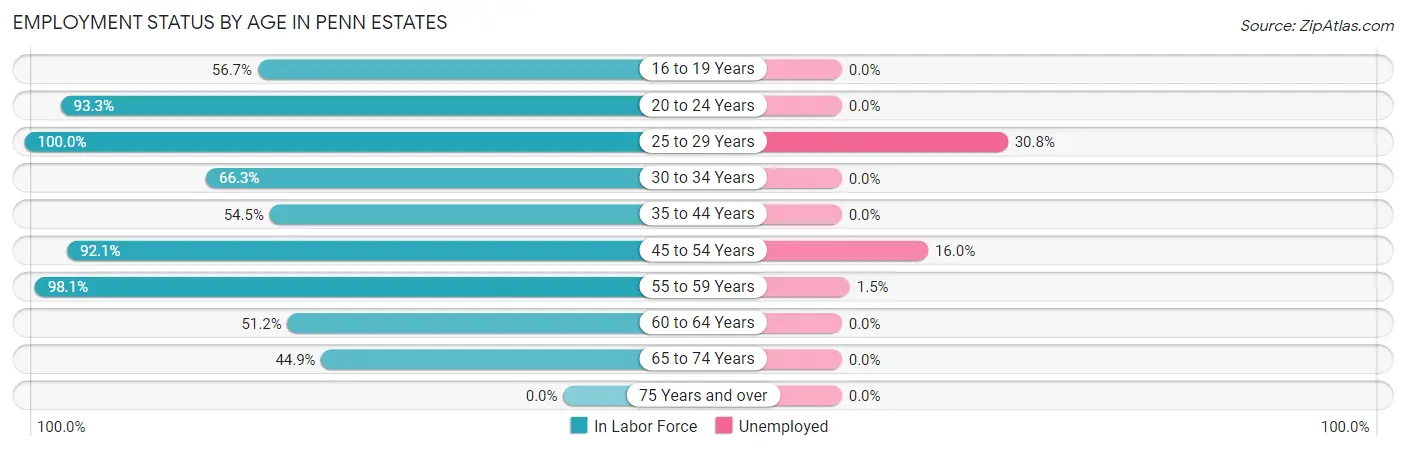
| Age Bracket | In Labor Force | Unemployed |
| 16 to 19 Years | 174 (56.7%) | 0 (0.0%) |
| 20 to 24 Years | 195 (93.3%) | 0 (0.0%) |
| 25 to 29 Years | 159 (100.0%) | 49 (30.8%) |
| 30 to 34 Years | 108 (66.3%) | 0 (0.0%) |
| 35 to 44 Years | 275 (54.5%) | 0 (0.0%) |
| 45 to 54 Years | 650 (92.1%) | 104 (16.0%) |
| 55 to 59 Years | 457 (98.1%) | 7 (1.5%) |
| 60 to 64 Years | 260 (51.2%) | 0 (0.0%) |
| 65 to 74 Years | 212 (44.9%) | 0 (0.0%) |
| 75 Years and over | 0 (0.0%) | 0 (0.0%) |
| Total | 2,490 (70.8%) | 159 (6.4%) |
Employment Status by Educational Attainment in Penn Estates
According to labor force statistics for Penn Estates, 76.1% of individuals (1,908) out of the total population between 25 and 64 years of age (2,507) are in the labor force, with 8.4% or 160 of them being unemployed. The group with the highest labor force participation rate are those with the educational attainment of bachelor's degree or higher, with 100.0% or 597 individuals in the labor force. Within the labor force, individuals with high school diploma education have the highest percentage of unemployment, with 17.0% or 104 of them being unemployed.
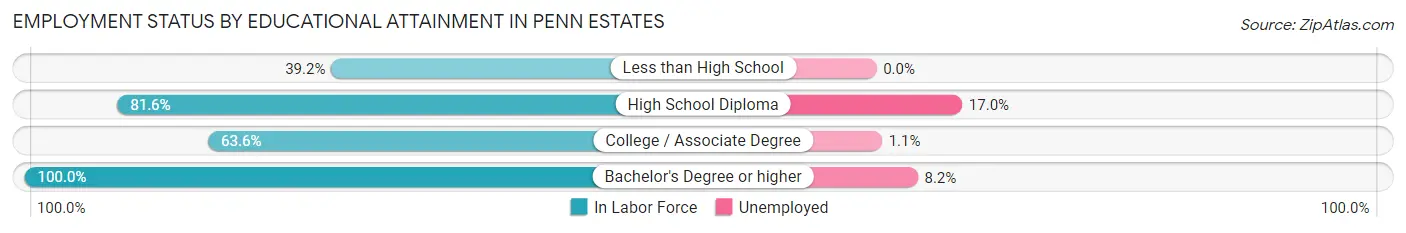
| Educational Attainment | In Labor Force | Unemployed |
| Less than High School | 60 (39.2%) | 0 (0.0%) |
| High School Diploma | 611 (81.6%) | 127 (17.0%) |
| College / Associate Degree | 641 (63.6%) | 11 (1.1%) |
| Bachelor's Degree or higher | 597 (100.0%) | 49 (8.2%) |
| Total | 1,908 (76.1%) | 211 (8.4%) |
Employment Occupations by Sex in Penn Estates
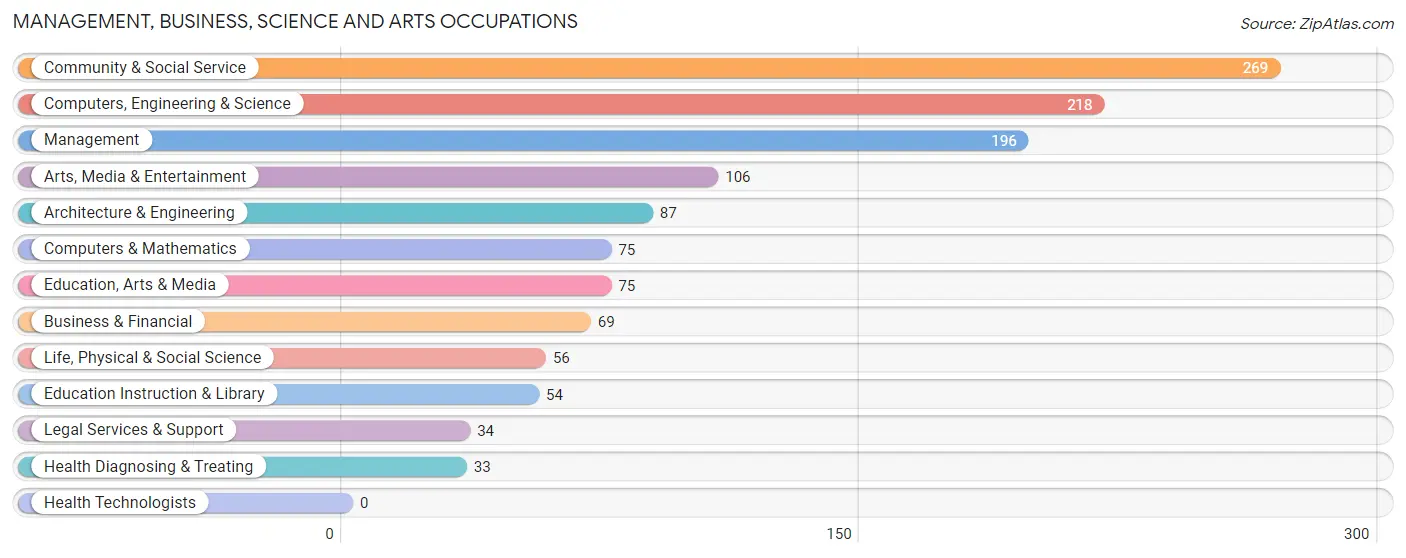
Management, Business, Science and Arts Occupations
The most common Management, Business, Science and Arts occupations in Penn Estates are Community & Social Service (269 | 11.6%), Computers, Engineering & Science (218 | 9.4%), Management (196 | 8.4%), Arts, Media & Entertainment (106 | 4.5%), and Architecture & Engineering (87 | 3.7%).
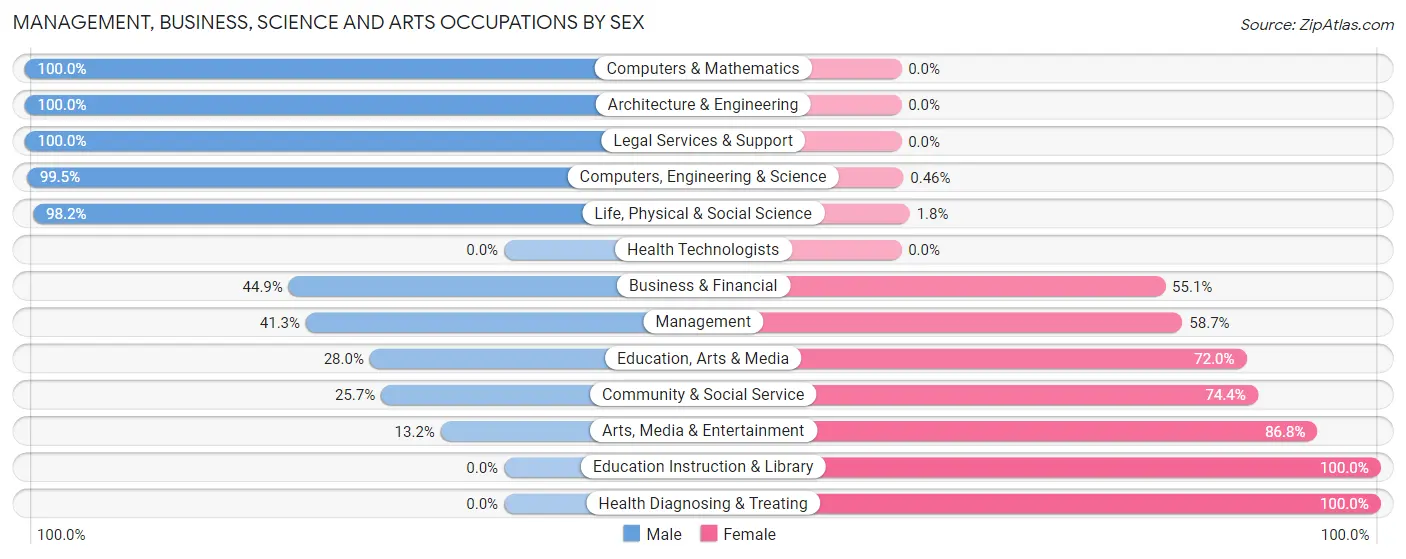
Management, Business, Science and Arts Occupations by Sex
Within the Management, Business, Science and Arts occupations in Penn Estates, the most male-oriented occupations are Computers & Mathematics (100.0%), Architecture & Engineering (100.0%), and Legal Services & Support (100.0%), while the most female-oriented occupations are Education Instruction & Library (100.0%), Health Diagnosing & Treating (100.0%), and Arts, Media & Entertainment (86.8%).
| Occupation | Male | Female |
| Management | 81 (41.3%) | 115 (58.7%) |
| Business & Financial | 31 (44.9%) | 38 (55.1%) |
| Computers, Engineering & Science | 217 (99.5%) | 1 (0.5%) |
| Computers & Mathematics | 75 (100.0%) | 0 (0.0%) |
| Architecture & Engineering | 87 (100.0%) | 0 (0.0%) |
| Life, Physical & Social Science | 55 (98.2%) | 1 (1.8%) |
| Community & Social Service | 69 (25.7%) | 200 (74.4%) |
| Education, Arts & Media | 21 (28.0%) | 54 (72.0%) |
| Legal Services & Support | 34 (100.0%) | 0 (0.0%) |
| Education Instruction & Library | 0 (0.0%) | 54 (100.0%) |
| Arts, Media & Entertainment | 14 (13.2%) | 92 (86.8%) |
| Health Diagnosing & Treating | 0 (0.0%) | 33 (100.0%) |
| Health Technologists | 0 (0.0%) | 0 (0.0%) |
| Total (Category) | 398 (50.7%) | 387 (49.3%) |
| Total (Overall) | 1,305 (56.0%) | 1,025 (44.0%) |
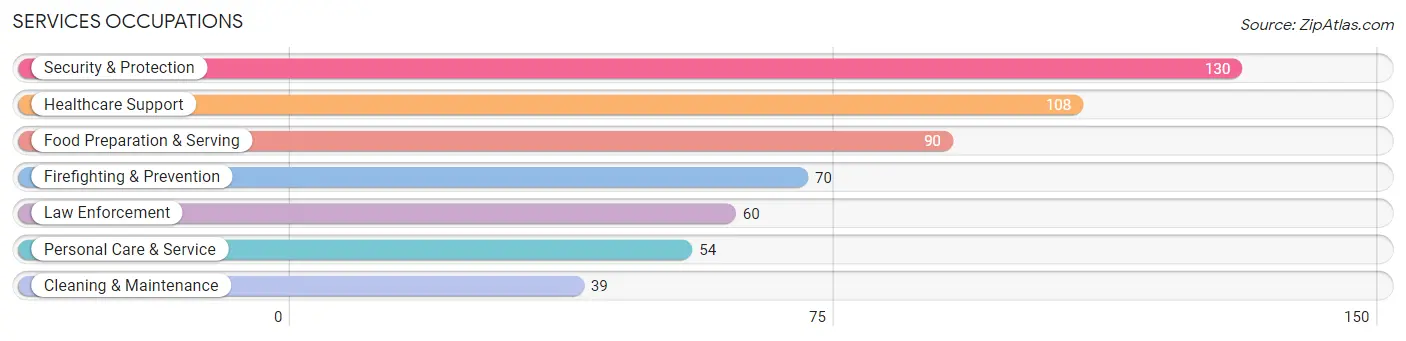
Services Occupations
The most common Services occupations in Penn Estates are Security & Protection (130 | 5.6%), Healthcare Support (108 | 4.6%), Food Preparation & Serving (90 | 3.9%), Firefighting & Prevention (70 | 3.0%), and Law Enforcement (60 | 2.6%).
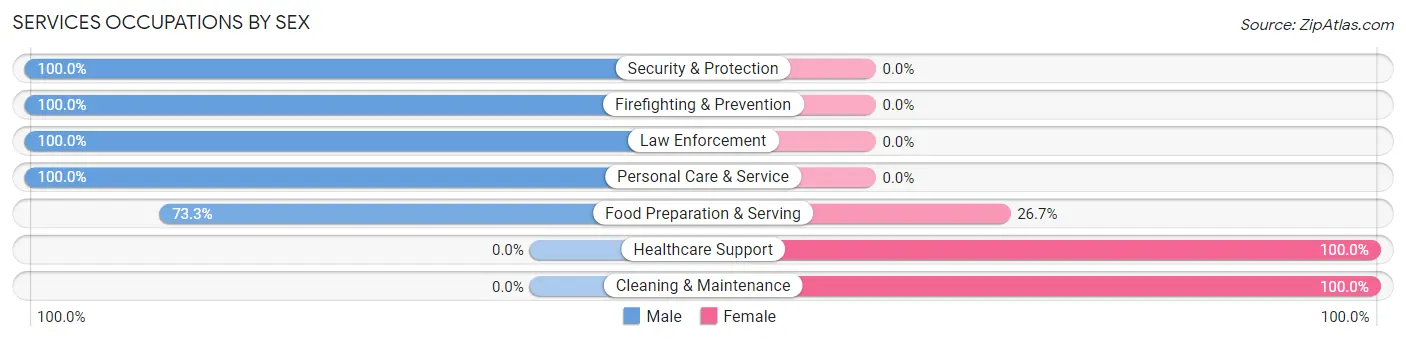
Services Occupations by Sex
Within the Services occupations in Penn Estates, the most male-oriented occupations are Security & Protection (100.0%), Firefighting & Prevention (100.0%), and Law Enforcement (100.0%), while the most female-oriented occupations are Healthcare Support (100.0%), Cleaning & Maintenance (100.0%), and Food Preparation & Serving (26.7%).
| Occupation | Male | Female |
| Healthcare Support | 0 (0.0%) | 108 (100.0%) |
| Security & Protection | 130 (100.0%) | 0 (0.0%) |
| Firefighting & Prevention | 70 (100.0%) | 0 (0.0%) |
| Law Enforcement | 60 (100.0%) | 0 (0.0%) |
| Food Preparation & Serving | 66 (73.3%) | 24 (26.7%) |
| Cleaning & Maintenance | 0 (0.0%) | 39 (100.0%) |
| Personal Care & Service | 54 (100.0%) | 0 (0.0%) |
| Total (Category) | 250 (59.4%) | 171 (40.6%) |
| Total (Overall) | 1,305 (56.0%) | 1,025 (44.0%) |
Sales and Office Occupations
The most common Sales and Office occupations in Penn Estates are Office & Administration (433 | 18.6%), and Sales & Related (216 | 9.3%).

Sales and Office Occupations by Sex
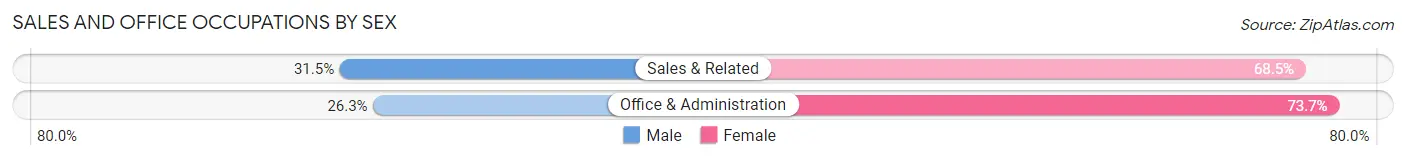
| Occupation | Male | Female |
| Sales & Related | 68 (31.5%) | 148 (68.5%) |
| Office & Administration | 114 (26.3%) | 319 (73.7%) |
| Total (Category) | 182 (28.0%) | 467 (72.0%) |
| Total (Overall) | 1,305 (56.0%) | 1,025 (44.0%) |
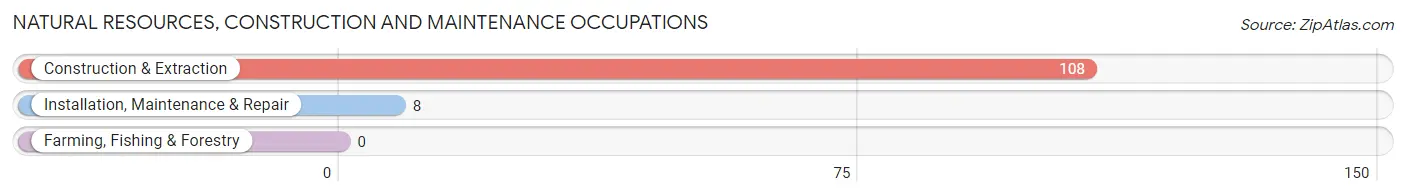
Natural Resources, Construction and Maintenance Occupations
The most common Natural Resources, Construction and Maintenance occupations in Penn Estates are Construction & Extraction (108 | 4.6%), and Installation, Maintenance & Repair (8 | 0.3%).
Natural Resources, Construction and Maintenance Occupations by Sex
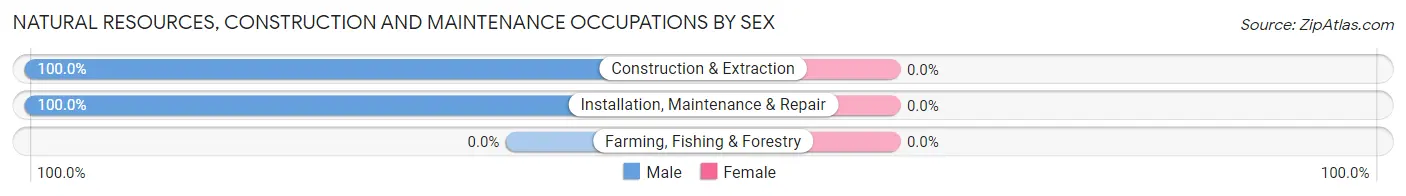
| Occupation | Male | Female |
| Farming, Fishing & Forestry | 0 (0.0%) | 0 (0.0%) |
| Construction & Extraction | 108 (100.0%) | 0 (0.0%) |
| Installation, Maintenance & Repair | 8 (100.0%) | 0 (0.0%) |
| Total (Category) | 116 (100.0%) | 0 (0.0%) |
| Total (Overall) | 1,305 (56.0%) | 1,025 (44.0%) |
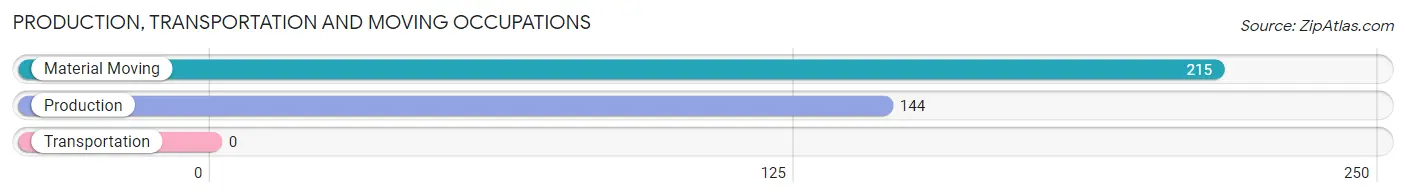
Production, Transportation and Moving Occupations
The most common Production, Transportation and Moving occupations in Penn Estates are Material Moving (215 | 9.2%), and Production (144 | 6.2%).
Production, Transportation and Moving Occupations by Sex
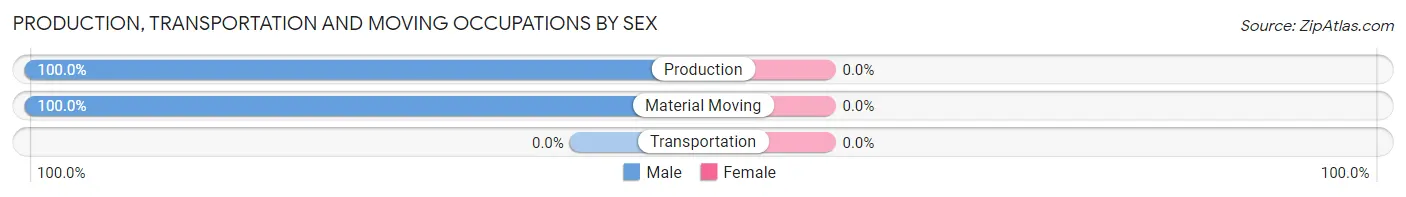
| Occupation | Male | Female |
| Production | 144 (100.0%) | 0 (0.0%) |
| Transportation | 0 (0.0%) | 0 (0.0%) |
| Material Moving | 215 (100.0%) | 0 (0.0%) |
| Total (Category) | 359 (100.0%) | 0 (0.0%) |
| Total (Overall) | 1,305 (56.0%) | 1,025 (44.0%) |
Employment Industries by Sex in Penn Estates
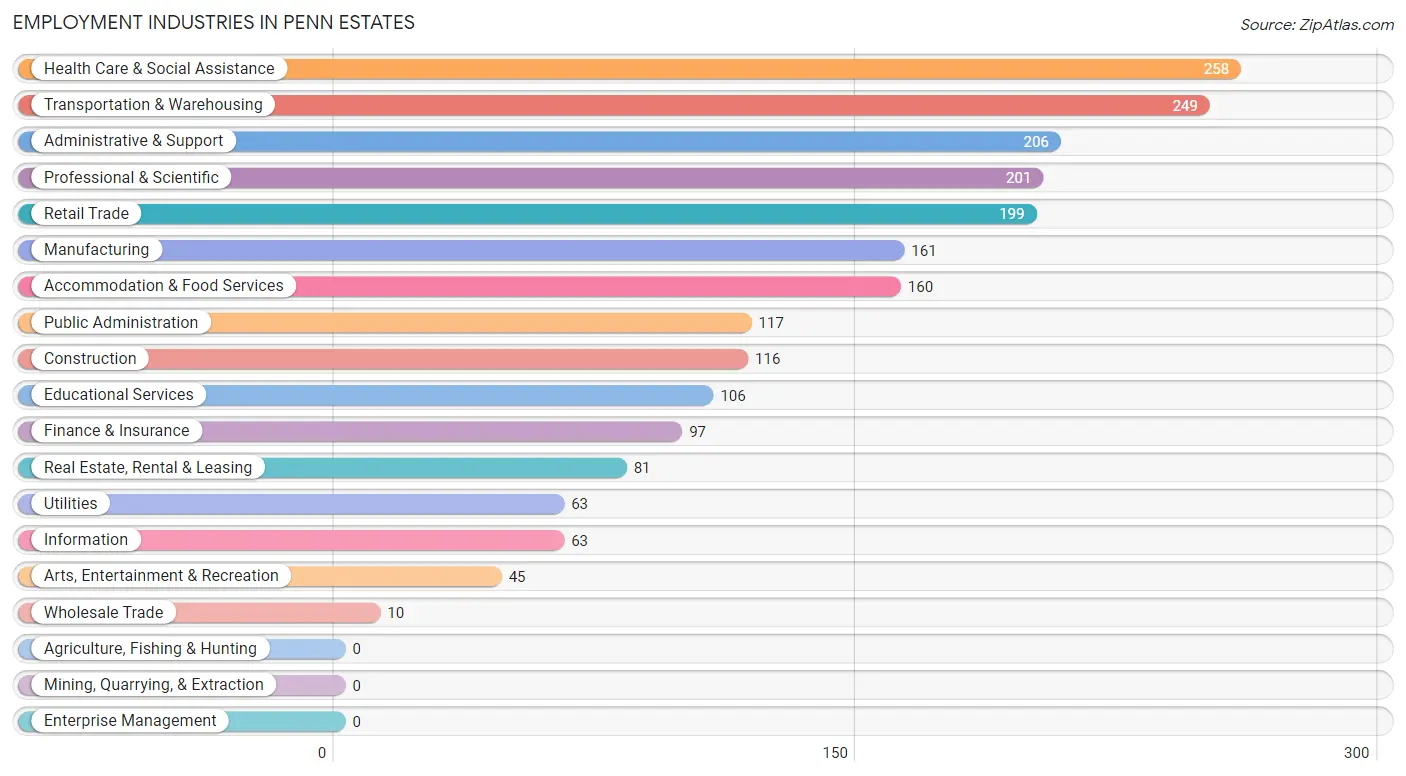
Employment Industries in Penn Estates
The major employment industries in Penn Estates include Health Care & Social Assistance (258 | 11.1%), Transportation & Warehousing (249 | 10.7%), Administrative & Support (206 | 8.8%), Professional & Scientific (201 | 8.6%), and Retail Trade (199 | 8.5%).
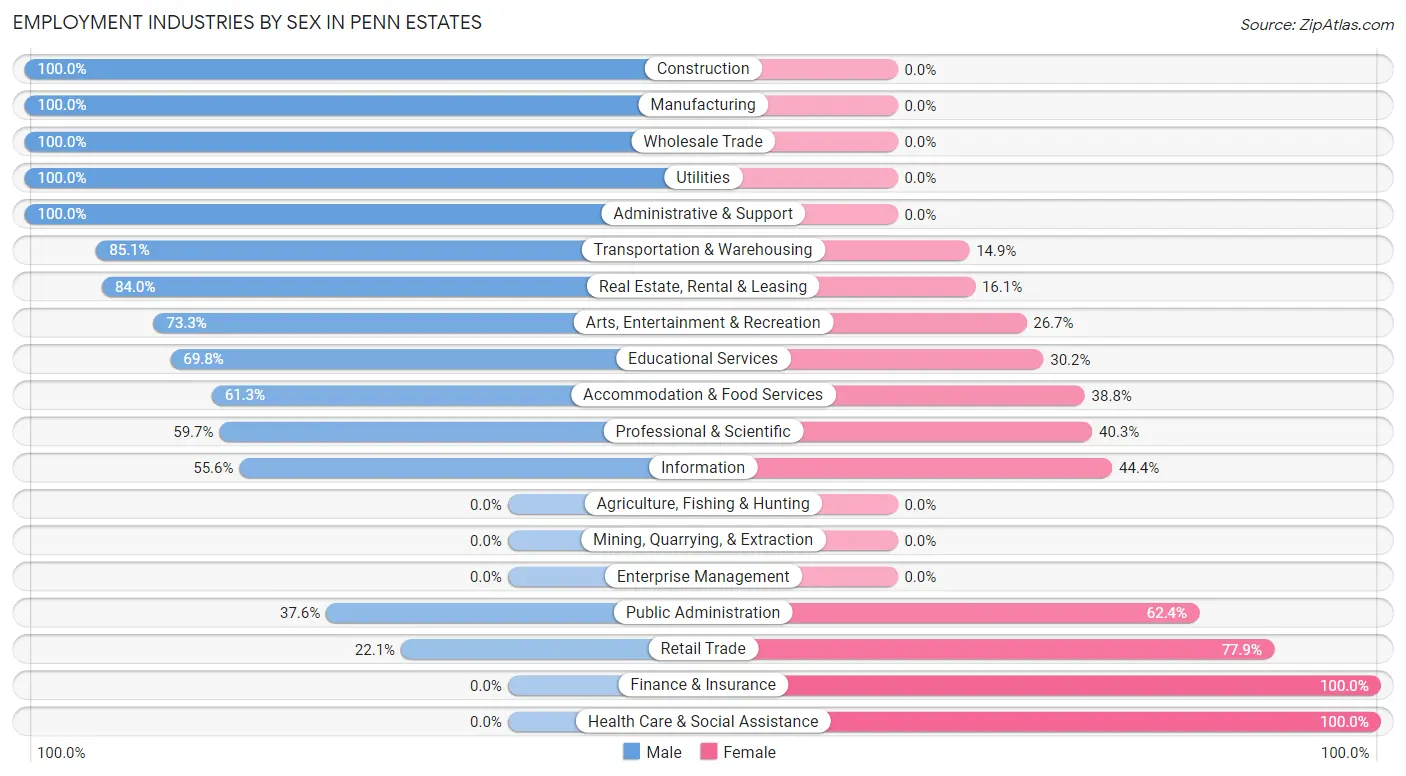
Employment Industries by Sex in Penn Estates
The Penn Estates industries that see more men than women are Construction (100.0%), Manufacturing (100.0%), and Wholesale Trade (100.0%), whereas the industries that tend to have a higher number of women are Finance & Insurance (100.0%), Health Care & Social Assistance (100.0%), and Retail Trade (77.9%).
| Industry | Male | Female |
| Agriculture, Fishing & Hunting | 0 (0.0%) | 0 (0.0%) |
| Mining, Quarrying, & Extraction | 0 (0.0%) | 0 (0.0%) |
| Construction | 116 (100.0%) | 0 (0.0%) |
| Manufacturing | 161 (100.0%) | 0 (0.0%) |
| Wholesale Trade | 10 (100.0%) | 0 (0.0%) |
| Retail Trade | 44 (22.1%) | 155 (77.9%) |
| Transportation & Warehousing | 212 (85.1%) | 37 (14.9%) |
| Utilities | 63 (100.0%) | 0 (0.0%) |
| Information | 35 (55.6%) | 28 (44.4%) |
| Finance & Insurance | 0 (0.0%) | 97 (100.0%) |
| Real Estate, Rental & Leasing | 68 (84.0%) | 13 (16.1%) |
| Professional & Scientific | 120 (59.7%) | 81 (40.3%) |
| Enterprise Management | 0 (0.0%) | 0 (0.0%) |
| Administrative & Support | 206 (100.0%) | 0 (0.0%) |
| Educational Services | 74 (69.8%) | 32 (30.2%) |
| Health Care & Social Assistance | 0 (0.0%) | 258 (100.0%) |
| Arts, Entertainment & Recreation | 33 (73.3%) | 12 (26.7%) |
| Accommodation & Food Services | 98 (61.3%) | 62 (38.8%) |
| Public Administration | 44 (37.6%) | 73 (62.4%) |
| Total | 1,305 (56.0%) | 1,025 (44.0%) |
Education in Penn Estates
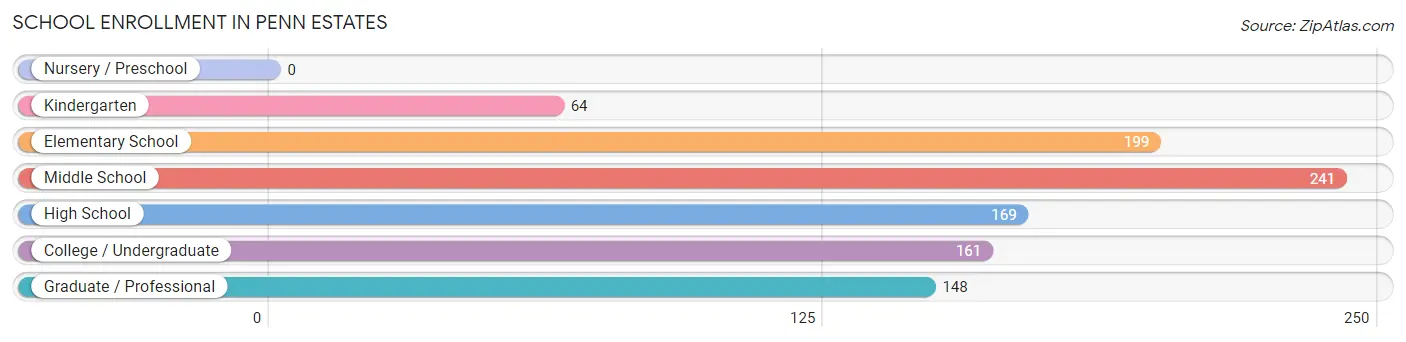
School Enrollment in Penn Estates
The most common levels of schooling among the 982 students in Penn Estates are middle school (241 | 24.5%), elementary school (199 | 20.3%), and high school (169 | 17.2%).
| School Level | # Students | % Students |
| Nursery / Preschool | 0 | 0.0% |
| Kindergarten | 64 | 6.5% |
| Elementary School | 199 | 20.3% |
| Middle School | 241 | 24.5% |
| High School | 169 | 17.2% |
| College / Undergraduate | 161 | 16.4% |
| Graduate / Professional | 148 | 15.1% |
| Total | 982 | 100.0% |
School Enrollment by Age by Funding Source in Penn Estates
Out of a total of 982 students who are enrolled in schools in Penn Estates, 56 (5.7%) attend a private institution, while the remaining 926 (94.3%) are enrolled in public schools. The age group of 20 to 24 year olds has the highest likelihood of being enrolled in private schools, with 44 (25.3% in the age bracket) enrolled. Conversely, the age group of 5 to 9 year old has the lowest likelihood of being enrolled in a private school, with 263 (100.0% in the age bracket) attending a public institution.
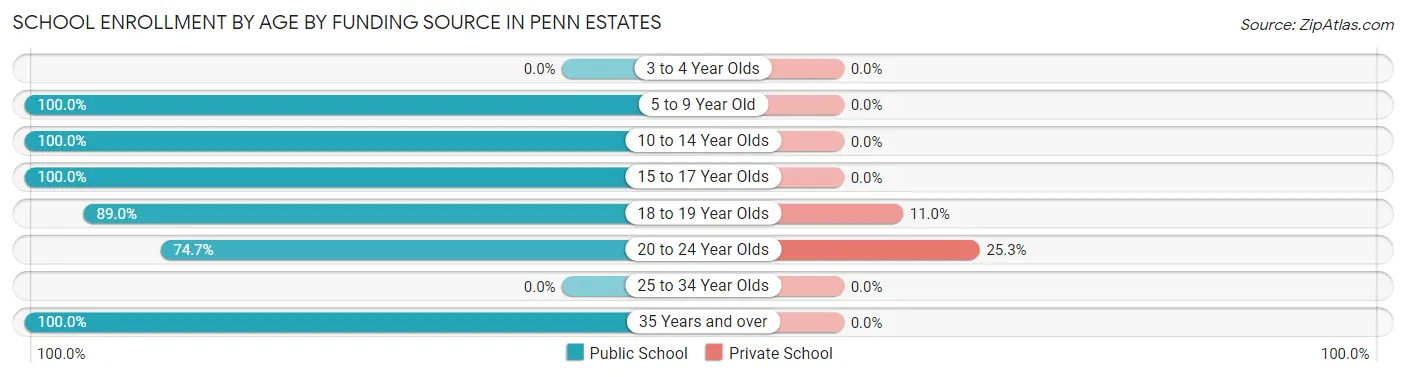
| Age Bracket | Public School | Private School |
| 3 to 4 Year Olds | 0 (0.0%) | 0 (0.0%) |
| 5 to 9 Year Old | 263 (100.0%) | 0 (0.0%) |
| 10 to 14 Year Olds | 241 (100.0%) | 0 (0.0%) |
| 15 to 17 Year Olds | 169 (100.0%) | 0 (0.0%) |
| 18 to 19 Year Olds | 97 (89.0%) | 12 (11.0%) |
| 20 to 24 Year Olds | 130 (74.7%) | 44 (25.3%) |
| 25 to 34 Year Olds | 0 (0.0%) | 0 (0.0%) |
| 35 Years and over | 26 (100.0%) | 0 (0.0%) |
| Total | 926 (94.3%) | 56 (5.7%) |
Educational Attainment by Field of Study in Penn Estates
Business (306 | 41.4%), psychology (96 | 13.0%), education (96 | 13.0%), social sciences (69 | 9.3%), and engineering (63 | 8.5%) are the most common fields of study among 739 individuals in Penn Estates who have obtained a bachelor's degree or higher.
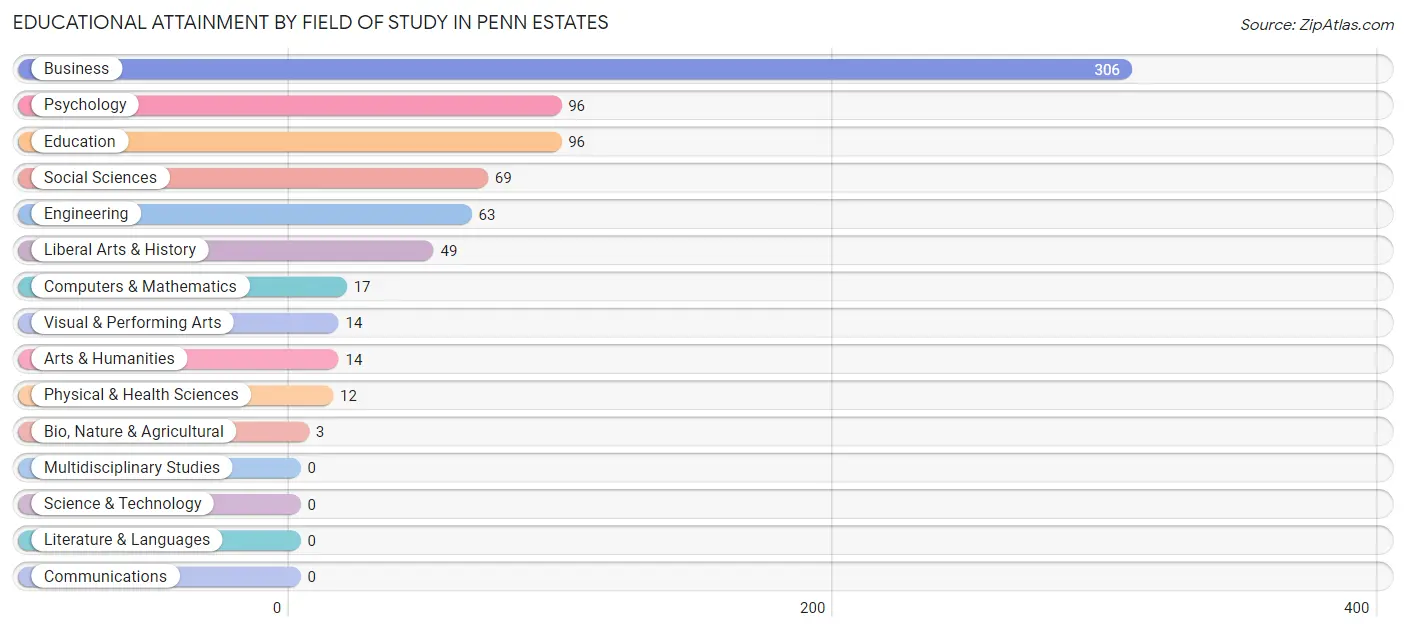
| Field of Study | # Graduates | % Graduates |
| Computers & Mathematics | 17 | 2.3% |
| Bio, Nature & Agricultural | 3 | 0.4% |
| Physical & Health Sciences | 12 | 1.6% |
| Psychology | 96 | 13.0% |
| Social Sciences | 69 | 9.3% |
| Engineering | 63 | 8.5% |
| Multidisciplinary Studies | 0 | 0.0% |
| Science & Technology | 0 | 0.0% |
| Business | 306 | 41.4% |
| Education | 96 | 13.0% |
| Literature & Languages | 0 | 0.0% |
| Liberal Arts & History | 49 | 6.6% |
| Visual & Performing Arts | 14 | 1.9% |
| Communications | 0 | 0.0% |
| Arts & Humanities | 14 | 1.9% |
| Total | 739 | 100.0% |
Transportation & Commute in Penn Estates
Vehicle Availability by Sex in Penn Estates
The most prevalent vehicle ownership categories in Penn Estates are males with 2 vehicles (451, accounting for 35.9%) and females with 2 vehicles (366, making up 44.6%).
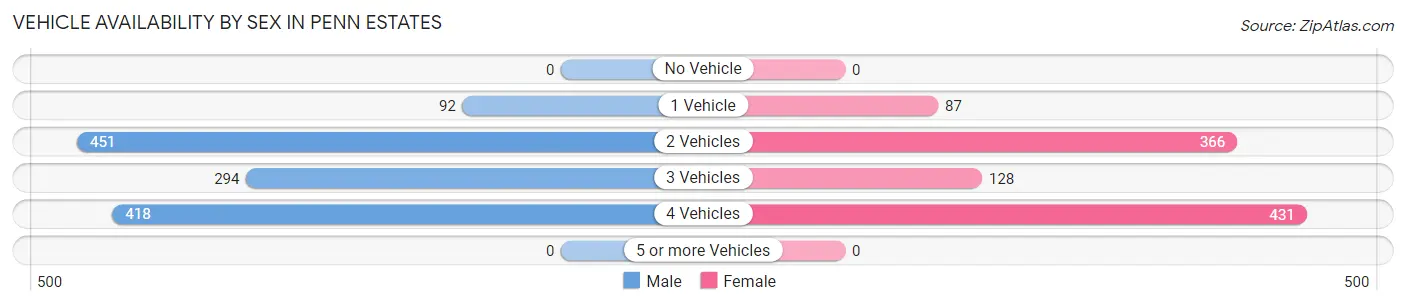
| Vehicles Available | Male | Female |
| No Vehicle | 0 (0.0%) | 0 (0.0%) |
| 1 Vehicle | 92 (7.3%) | 87 (8.6%) |
| 2 Vehicles | 451 (35.9%) | 366 (36.2%) |
| 3 Vehicles | 294 (23.4%) | 128 (12.7%) |
| 4 Vehicles | 418 (33.3%) | 431 (42.6%) |
| 5 or more Vehicles | 0 (0.0%) | 0 (0.0%) |
| Total | 1,255 (100.0%) | 1,012 (100.0%) |
Commute Time in Penn Estates
The most frequently occuring commute durations in Penn Estates are 15 to 19 minutes (475 commuters, 24.5%), 90 or more minutes (417 commuters, 21.5%), and 20 to 24 minutes (324 commuters, 16.7%).
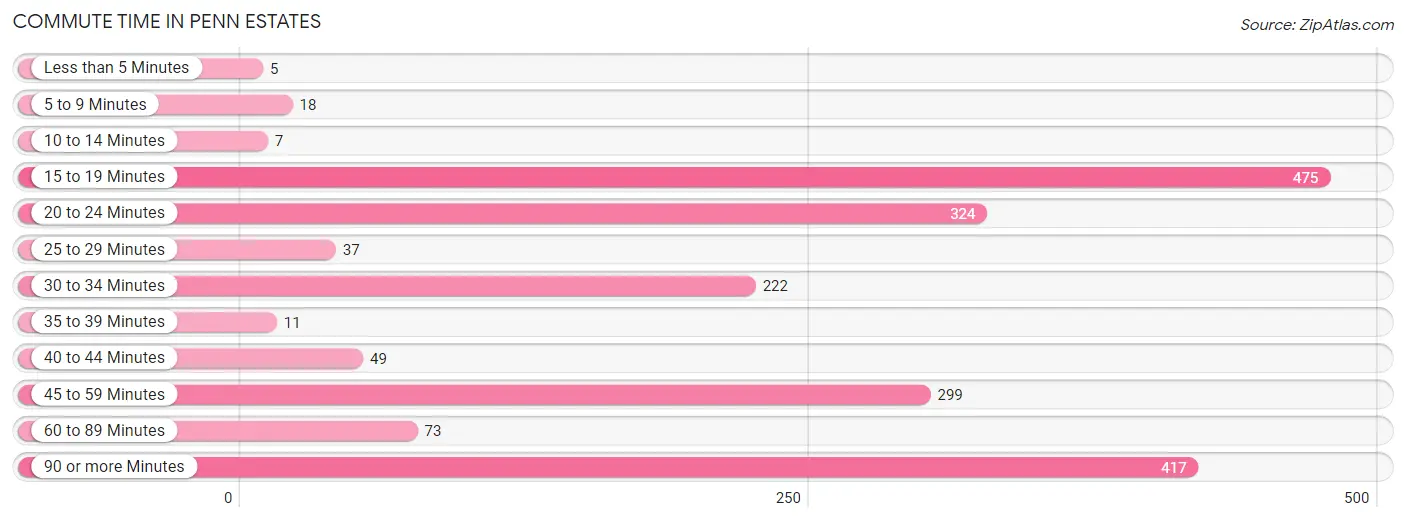
| Commute Time | # Commuters | % Commuters |
| Less than 5 Minutes | 5 | 0.3% |
| 5 to 9 Minutes | 18 | 0.9% |
| 10 to 14 Minutes | 7 | 0.4% |
| 15 to 19 Minutes | 475 | 24.5% |
| 20 to 24 Minutes | 324 | 16.7% |
| 25 to 29 Minutes | 37 | 1.9% |
| 30 to 34 Minutes | 222 | 11.5% |
| 35 to 39 Minutes | 11 | 0.6% |
| 40 to 44 Minutes | 49 | 2.5% |
| 45 to 59 Minutes | 299 | 15.4% |
| 60 to 89 Minutes | 73 | 3.8% |
| 90 or more Minutes | 417 | 21.5% |
Commute Time by Sex in Penn Estates
The most common commute times in Penn Estates are 90 or more minutes (291 commuters, 27.3%) for males and 15 to 19 minutes (377 commuters, 43.3%) for females.
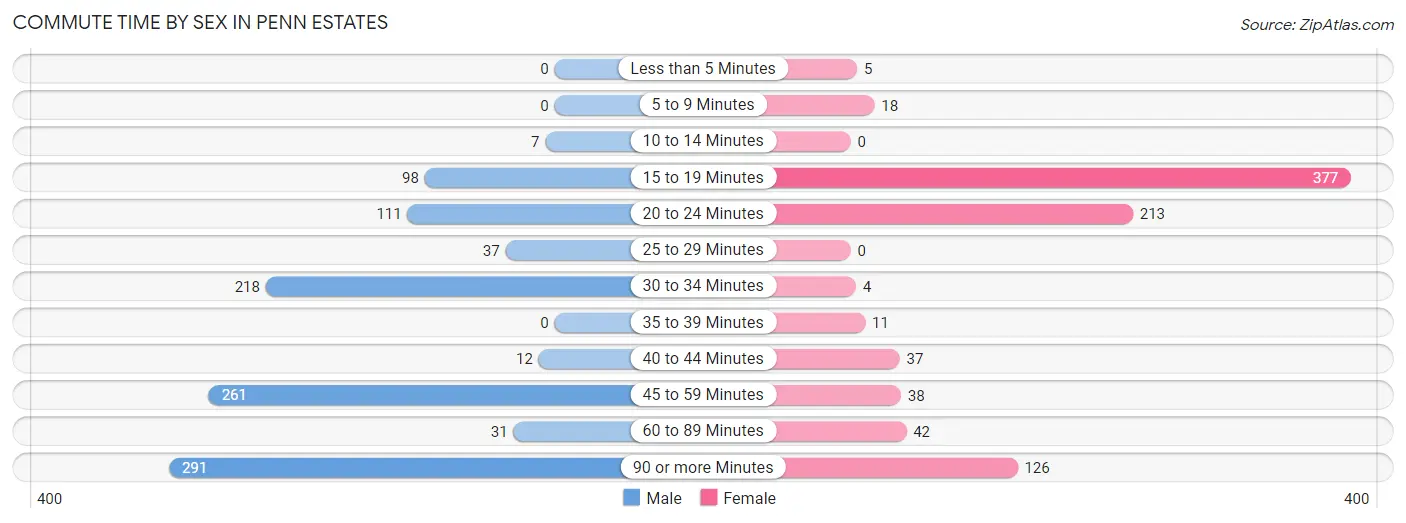
| Commute Time | Male | Female |
| Less than 5 Minutes | 0 (0.0%) | 5 (0.6%) |
| 5 to 9 Minutes | 0 (0.0%) | 18 (2.1%) |
| 10 to 14 Minutes | 7 (0.7%) | 0 (0.0%) |
| 15 to 19 Minutes | 98 (9.2%) | 377 (43.3%) |
| 20 to 24 Minutes | 111 (10.4%) | 213 (24.4%) |
| 25 to 29 Minutes | 37 (3.5%) | 0 (0.0%) |
| 30 to 34 Minutes | 218 (20.4%) | 4 (0.5%) |
| 35 to 39 Minutes | 0 (0.0%) | 11 (1.3%) |
| 40 to 44 Minutes | 12 (1.1%) | 37 (4.3%) |
| 45 to 59 Minutes | 261 (24.5%) | 38 (4.4%) |
| 60 to 89 Minutes | 31 (2.9%) | 42 (4.8%) |
| 90 or more Minutes | 291 (27.3%) | 126 (14.5%) |
Time of Departure to Work by Sex in Penn Estates
The most frequent times of departure to work in Penn Estates are 12:00 PM to 3:59 PM (278, 26.1%) for males and 12:00 PM to 3:59 PM (297, 34.1%) for females.
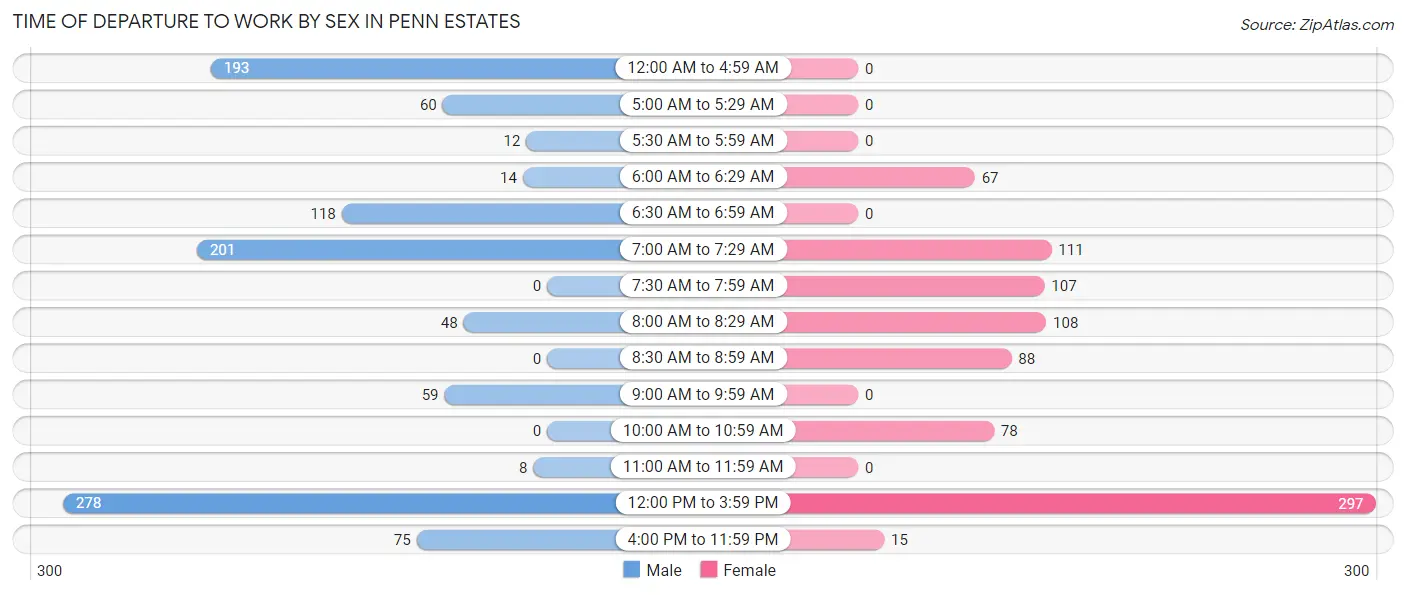
| Time of Departure | Male | Female |
| 12:00 AM to 4:59 AM | 193 (18.1%) | 0 (0.0%) |
| 5:00 AM to 5:29 AM | 60 (5.6%) | 0 (0.0%) |
| 5:30 AM to 5:59 AM | 12 (1.1%) | 0 (0.0%) |
| 6:00 AM to 6:29 AM | 14 (1.3%) | 67 (7.7%) |
| 6:30 AM to 6:59 AM | 118 (11.1%) | 0 (0.0%) |
| 7:00 AM to 7:29 AM | 201 (18.9%) | 111 (12.7%) |
| 7:30 AM to 7:59 AM | 0 (0.0%) | 107 (12.3%) |
| 8:00 AM to 8:29 AM | 48 (4.5%) | 108 (12.4%) |
| 8:30 AM to 8:59 AM | 0 (0.0%) | 88 (10.1%) |
| 9:00 AM to 9:59 AM | 59 (5.5%) | 0 (0.0%) |
| 10:00 AM to 10:59 AM | 0 (0.0%) | 78 (9.0%) |
| 11:00 AM to 11:59 AM | 8 (0.7%) | 0 (0.0%) |
| 12:00 PM to 3:59 PM | 278 (26.1%) | 297 (34.1%) |
| 4:00 PM to 11:59 PM | 75 (7.0%) | 15 (1.7%) |
| Total | 1,066 (100.0%) | 871 (100.0%) |
Housing Occupancy in Penn Estates
Occupancy by Ownership in Penn Estates
Of the total 1,423 dwellings in Penn Estates, owner-occupied units account for 1,349 (94.8%), while renter-occupied units make up 74 (5.2%).
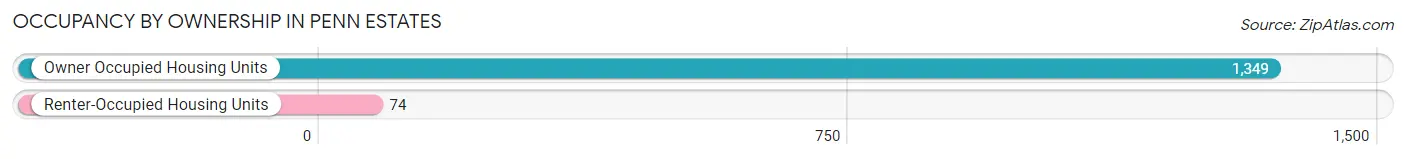
| Occupancy | # Housing Units | % Housing Units |
| Owner Occupied Housing Units | 1,349 | 94.8% |
| Renter-Occupied Housing Units | 74 | 5.2% |
| Total Occupied Housing Units | 1,423 | 100.0% |
Occupancy by Household Size in Penn Estates
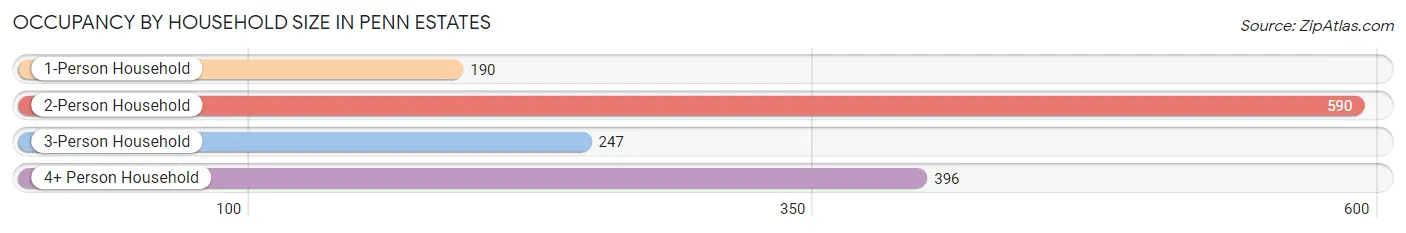
| Household Size | # Housing Units | % Housing Units |
| 1-Person Household | 190 | 13.4% |
| 2-Person Household | 590 | 41.5% |
| 3-Person Household | 247 | 17.4% |
| 4+ Person Household | 396 | 27.8% |
| Total Housing Units | 1,423 | 100.0% |
Occupancy by Ownership by Household Size in Penn Estates
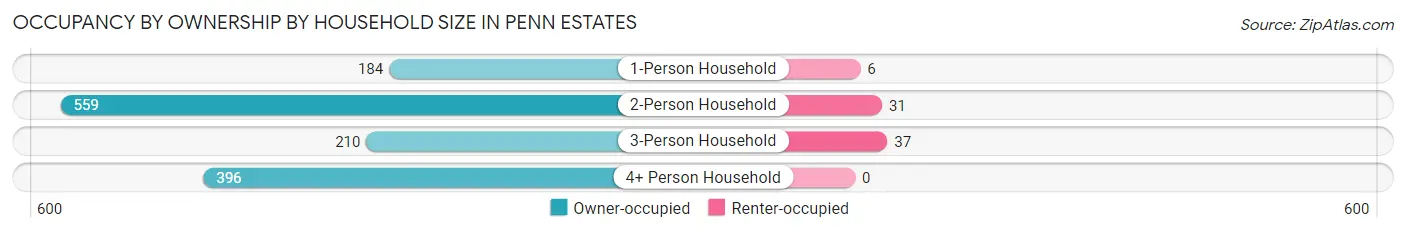
| Household Size | Owner-occupied | Renter-occupied |
| 1-Person Household | 184 (96.8%) | 6 (3.2%) |
| 2-Person Household | 559 (94.8%) | 31 (5.2%) |
| 3-Person Household | 210 (85.0%) | 37 (15.0%) |
| 4+ Person Household | 396 (100.0%) | 0 (0.0%) |
| Total Housing Units | 1,349 (94.8%) | 74 (5.2%) |
Occupancy by Educational Attainment in Penn Estates
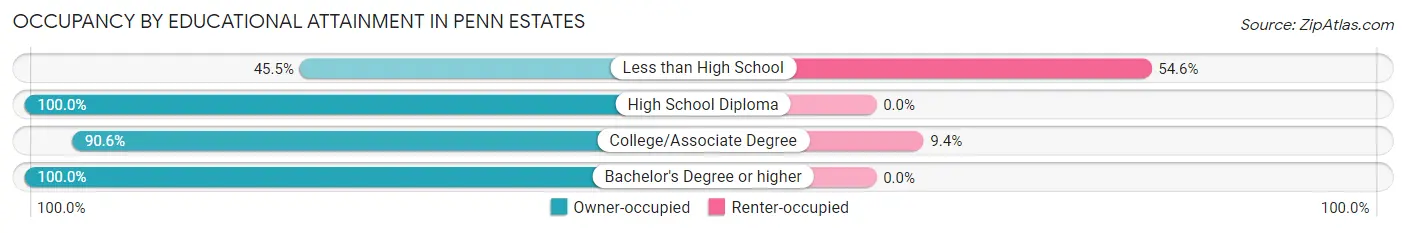
| Household Size | Owner-occupied | Renter-occupied |
| Less than High School | 5 (45.5%) | 6 (54.5%) |
| High School Diploma | 258 (100.0%) | 0 (0.0%) |
| College/Associate Degree | 658 (90.6%) | 68 (9.4%) |
| Bachelor's Degree or higher | 428 (100.0%) | 0 (0.0%) |
Occupancy by Age of Householder in Penn Estates
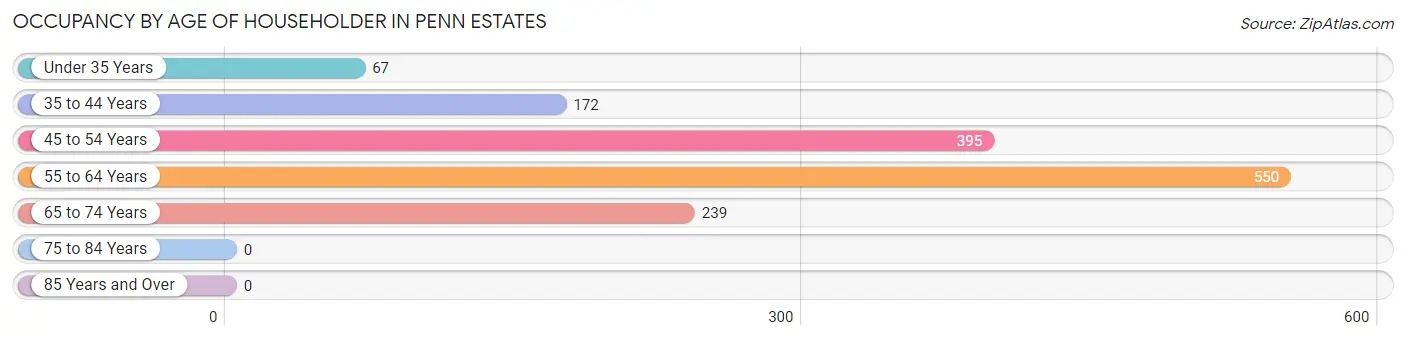
| Age Bracket | # Households | % Households |
| Under 35 Years | 67 | 4.7% |
| 35 to 44 Years | 172 | 12.1% |
| 45 to 54 Years | 395 | 27.8% |
| 55 to 64 Years | 550 | 38.7% |
| 65 to 74 Years | 239 | 16.8% |
| 75 to 84 Years | 0 | 0.0% |
| 85 Years and Over | 0 | 0.0% |
| Total | 1,423 | 100.0% |
Housing Finances in Penn Estates
Median Income by Occupancy in Penn Estates
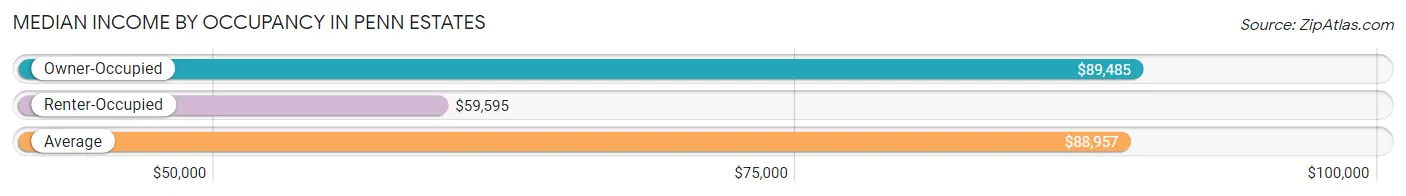
| Occupancy Type | # Households | Median Income |
| Owner-Occupied | 1,349 (94.8%) | $89,485 |
| Renter-Occupied | 74 (5.2%) | $59,595 |
| Average | 1,423 (100.0%) | $88,957 |
Occupancy by Householder Income Bracket in Penn Estates
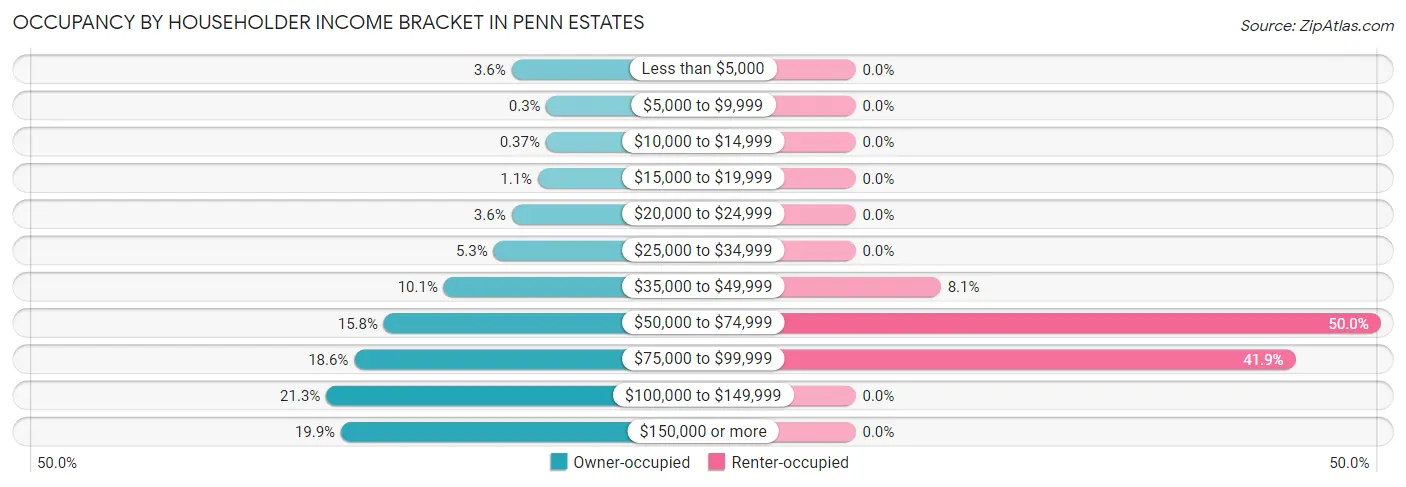
| Income Bracket | Owner-occupied | Renter-occupied |
| Less than $5,000 | 49 (3.6%) | 0 (0.0%) |
| $5,000 to $9,999 | 4 (0.3%) | 0 (0.0%) |
| $10,000 to $14,999 | 5 (0.4%) | 0 (0.0%) |
| $15,000 to $19,999 | 15 (1.1%) | 0 (0.0%) |
| $20,000 to $24,999 | 49 (3.6%) | 0 (0.0%) |
| $25,000 to $34,999 | 72 (5.3%) | 0 (0.0%) |
| $35,000 to $49,999 | 136 (10.1%) | 6 (8.1%) |
| $50,000 to $74,999 | 213 (15.8%) | 37 (50.0%) |
| $75,000 to $99,999 | 251 (18.6%) | 31 (41.9%) |
| $100,000 to $149,999 | 287 (21.3%) | 0 (0.0%) |
| $150,000 or more | 268 (19.9%) | 0 (0.0%) |
| Total | 1,349 (100.0%) | 74 (100.0%) |
Monthly Housing Cost Tiers in Penn Estates
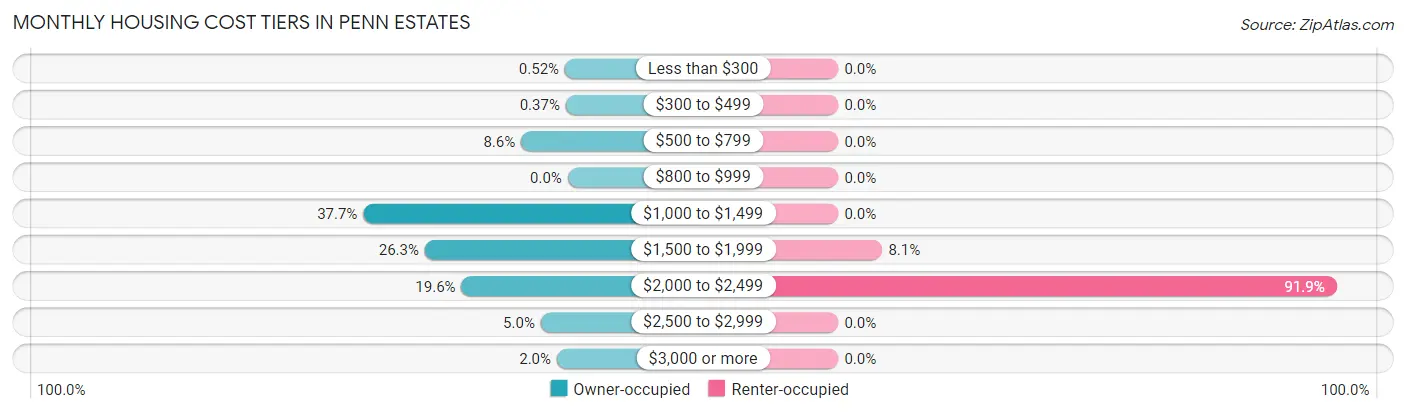
| Monthly Cost | Owner-occupied | Renter-occupied |
| Less than $300 | 7 (0.5%) | 0 (0.0%) |
| $300 to $499 | 5 (0.4%) | 0 (0.0%) |
| $500 to $799 | 116 (8.6%) | 0 (0.0%) |
| $800 to $999 | 0 (0.0%) | 0 (0.0%) |
| $1,000 to $1,499 | 508 (37.7%) | 0 (0.0%) |
| $1,500 to $1,999 | 355 (26.3%) | 6 (8.1%) |
| $2,000 to $2,499 | 264 (19.6%) | 68 (91.9%) |
| $2,500 to $2,999 | 67 (5.0%) | 0 (0.0%) |
| $3,000 or more | 27 (2.0%) | 0 (0.0%) |
| Total | 1,349 (100.0%) | 74 (100.0%) |
Physical Housing Characteristics in Penn Estates
Housing Structures in Penn Estates
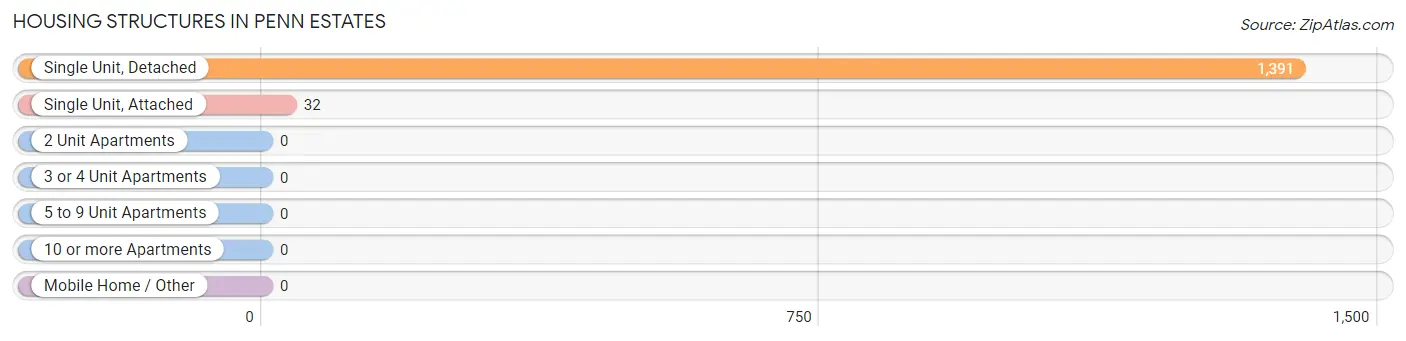
| Structure Type | # Housing Units | % Housing Units |
| Single Unit, Detached | 1,391 | 97.8% |
| Single Unit, Attached | 32 | 2.2% |
| 2 Unit Apartments | 0 | 0.0% |
| 3 or 4 Unit Apartments | 0 | 0.0% |
| 5 to 9 Unit Apartments | 0 | 0.0% |
| 10 or more Apartments | 0 | 0.0% |
| Mobile Home / Other | 0 | 0.0% |
| Total | 1,423 | 100.0% |
Housing Structures by Occupancy in Penn Estates
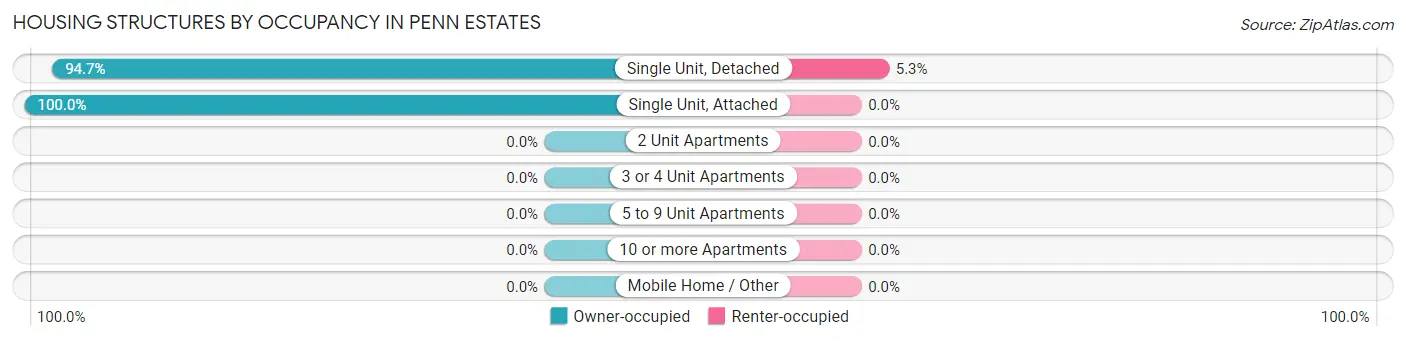
| Structure Type | Owner-occupied | Renter-occupied |
| Single Unit, Detached | 1,317 (94.7%) | 74 (5.3%) |
| Single Unit, Attached | 32 (100.0%) | 0 (0.0%) |
| 2 Unit Apartments | 0 (0.0%) | 0 (0.0%) |
| 3 or 4 Unit Apartments | 0 (0.0%) | 0 (0.0%) |
| 5 to 9 Unit Apartments | 0 (0.0%) | 0 (0.0%) |
| 10 or more Apartments | 0 (0.0%) | 0 (0.0%) |
| Mobile Home / Other | 0 (0.0%) | 0 (0.0%) |
| Total | 1,349 (94.8%) | 74 (5.2%) |
Housing Structures by Number of Rooms in Penn Estates
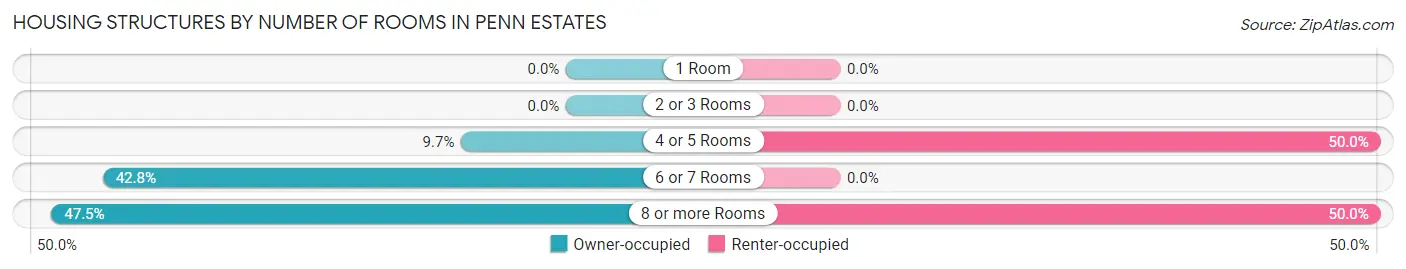
| Number of Rooms | Owner-occupied | Renter-occupied |
| 1 Room | 0 (0.0%) | 0 (0.0%) |
| 2 or 3 Rooms | 0 (0.0%) | 0 (0.0%) |
| 4 or 5 Rooms | 131 (9.7%) | 37 (50.0%) |
| 6 or 7 Rooms | 577 (42.8%) | 0 (0.0%) |
| 8 or more Rooms | 641 (47.5%) | 37 (50.0%) |
| Total | 1,349 (100.0%) | 74 (100.0%) |
Housing Structure by Heating Type in Penn Estates
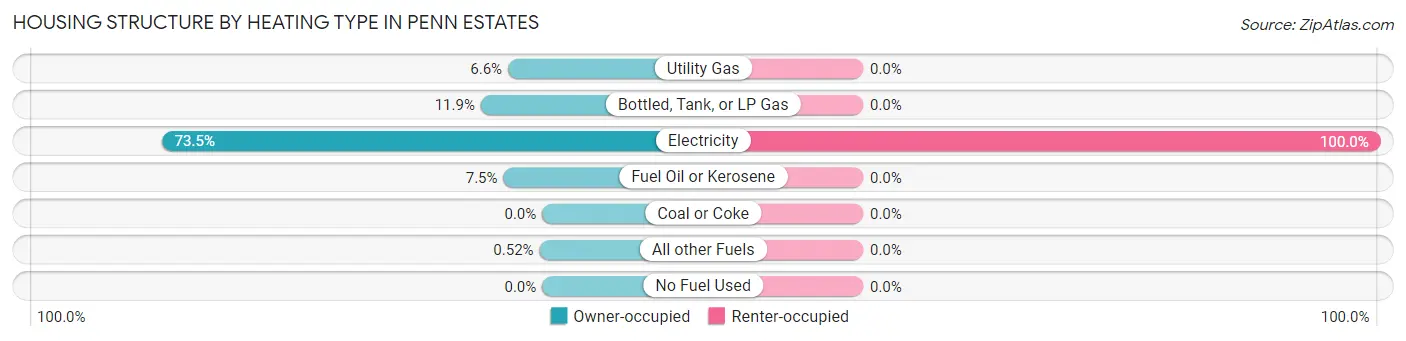
| Heating Type | Owner-occupied | Renter-occupied |
| Utility Gas | 89 (6.6%) | 0 (0.0%) |
| Bottled, Tank, or LP Gas | 160 (11.9%) | 0 (0.0%) |
| Electricity | 992 (73.5%) | 74 (100.0%) |
| Fuel Oil or Kerosene | 101 (7.5%) | 0 (0.0%) |
| Coal or Coke | 0 (0.0%) | 0 (0.0%) |
| All other Fuels | 7 (0.5%) | 0 (0.0%) |
| No Fuel Used | 0 (0.0%) | 0 (0.0%) |
| Total | 1,349 (100.0%) | 74 (100.0%) |
Household Vehicle Usage in Penn Estates
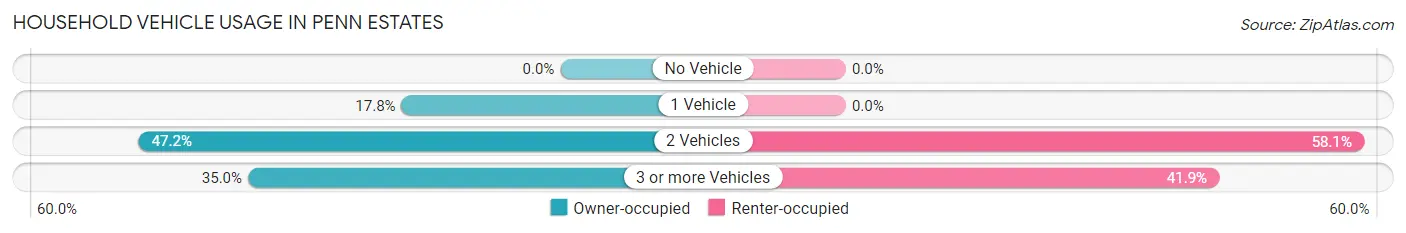
| Vehicles per Household | Owner-occupied | Renter-occupied |
| No Vehicle | 0 (0.0%) | 0 (0.0%) |
| 1 Vehicle | 240 (17.8%) | 0 (0.0%) |
| 2 Vehicles | 637 (47.2%) | 43 (58.1%) |
| 3 or more Vehicles | 472 (35.0%) | 31 (41.9%) |
| Total | 1,349 (100.0%) | 74 (100.0%) |
Real Estate & Mortgages in Penn Estates
Real Estate and Mortgage Overview in Penn Estates
| Characteristic | Without Mortgage | With Mortgage |
| Housing Units | 335 | 1,014 |
| Median Property Value | $193,100 | $199,500 |
| Median Household Income | - | - |
| Monthly Housing Costs | $1,048 | $27 |
| Real Estate Taxes | $6,489 | $59 |
Property Value by Mortgage Status in Penn Estates
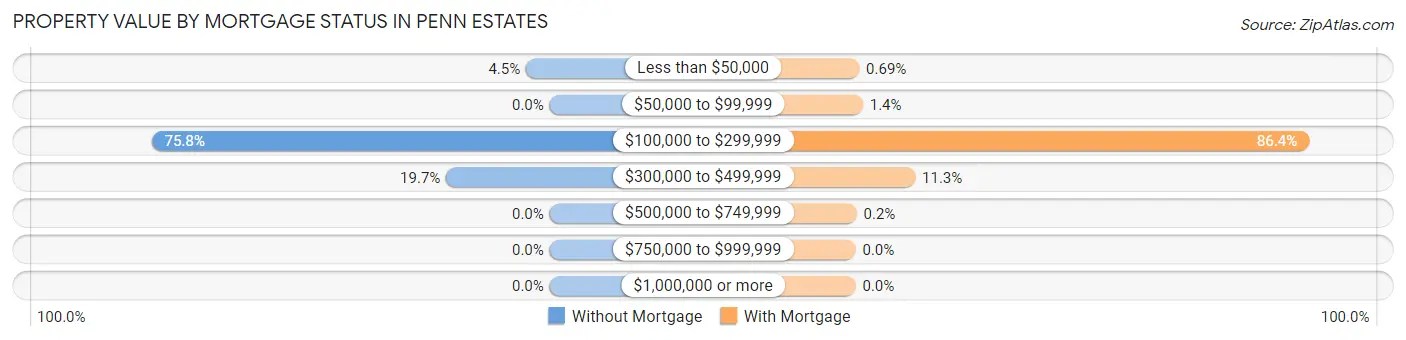
| Property Value | Without Mortgage | With Mortgage |
| Less than $50,000 | 15 (4.5%) | 7 (0.7%) |
| $50,000 to $99,999 | 0 (0.0%) | 14 (1.4%) |
| $100,000 to $299,999 | 254 (75.8%) | 876 (86.4%) |
| $300,000 to $499,999 | 66 (19.7%) | 115 (11.3%) |
| $500,000 to $749,999 | 0 (0.0%) | 2 (0.2%) |
| $750,000 to $999,999 | 0 (0.0%) | 0 (0.0%) |
| $1,000,000 or more | 0 (0.0%) | 0 (0.0%) |
| Total | 335 (100.0%) | 1,014 (100.0%) |
Household Income by Mortgage Status in Penn Estates
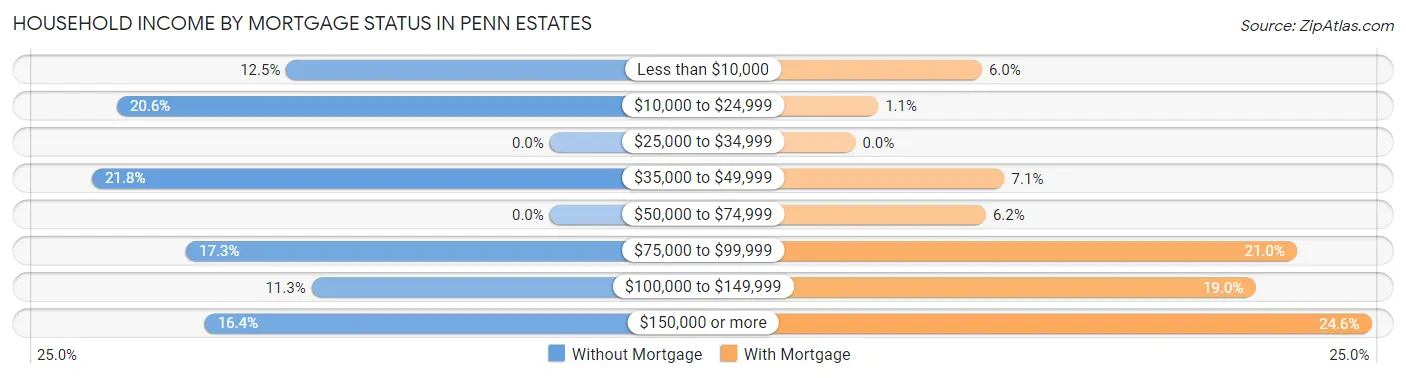
| Household Income | Without Mortgage | With Mortgage |
| Less than $10,000 | 42 (12.5%) | 61 (6.0%) |
| $10,000 to $24,999 | 69 (20.6%) | 11 (1.1%) |
| $25,000 to $34,999 | 0 (0.0%) | 0 (0.0%) |
| $35,000 to $49,999 | 73 (21.8%) | 72 (7.1%) |
| $50,000 to $74,999 | 0 (0.0%) | 63 (6.2%) |
| $75,000 to $99,999 | 58 (17.3%) | 213 (21.0%) |
| $100,000 to $149,999 | 38 (11.3%) | 193 (19.0%) |
| $150,000 or more | 55 (16.4%) | 249 (24.6%) |
| Total | 335 (100.0%) | 1,014 (100.0%) |
Property Value to Household Income Ratio in Penn Estates
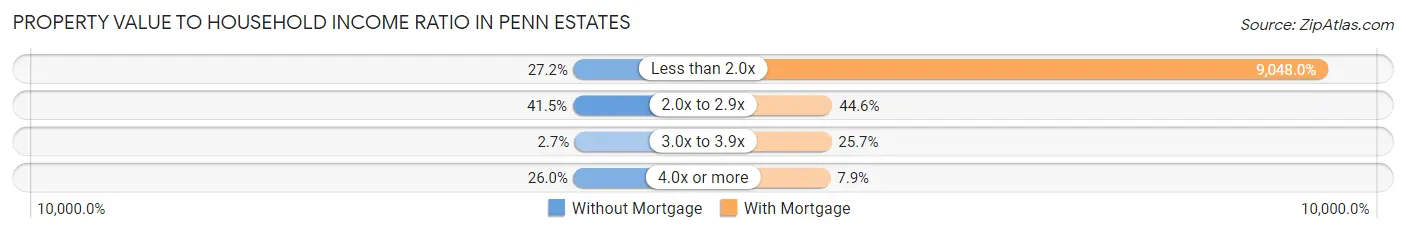
| Value-to-Income Ratio | Without Mortgage | With Mortgage |
| Less than 2.0x | 91 (27.2%) | 91,747 (9,048.0%) |
| 2.0x to 2.9x | 139 (41.5%) | 452 (44.6%) |
| 3.0x to 3.9x | 9 (2.7%) | 261 (25.7%) |
| 4.0x or more | 87 (26.0%) | 80 (7.9%) |
| Total | 335 (100.0%) | 1,014 (100.0%) |
Real Estate Taxes by Mortgage Status in Penn Estates
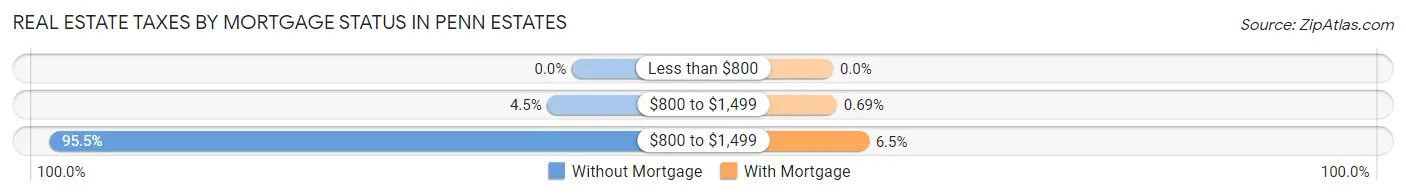
| Property Taxes | Without Mortgage | With Mortgage |
| Less than $800 | 0 (0.0%) | 0 (0.0%) |
| $800 to $1,499 | 15 (4.5%) | 7 (0.7%) |
| $800 to $1,499 | 320 (95.5%) | 66 (6.5%) |
| Total | 335 (100.0%) | 1,014 (100.0%) |
Health & Disability in Penn Estates
Health Insurance Coverage by Age in Penn Estates
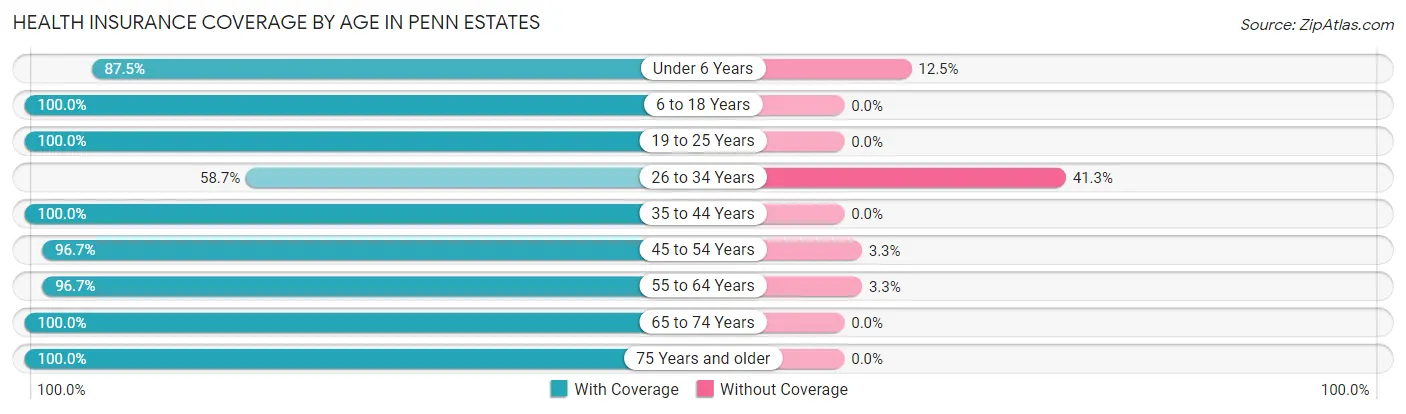
| Age Bracket | With Coverage | Without Coverage |
| Under 6 Years | 112 (87.5%) | 16 (12.5%) |
| 6 to 18 Years | 661 (100.0%) | 0 (0.0%) |
| 19 to 25 Years | 318 (100.0%) | 0 (0.0%) |
| 26 to 34 Years | 189 (58.7%) | 133 (41.3%) |
| 35 to 44 Years | 505 (100.0%) | 0 (0.0%) |
| 45 to 54 Years | 683 (96.7%) | 23 (3.3%) |
| 55 to 64 Years | 942 (96.7%) | 32 (3.3%) |
| 65 to 74 Years | 472 (100.0%) | 0 (0.0%) |
| 75 Years and older | 22 (100.0%) | 0 (0.0%) |
| Total | 3,904 (95.0%) | 204 (5.0%) |
Health Insurance Coverage by Citizenship Status in Penn Estates
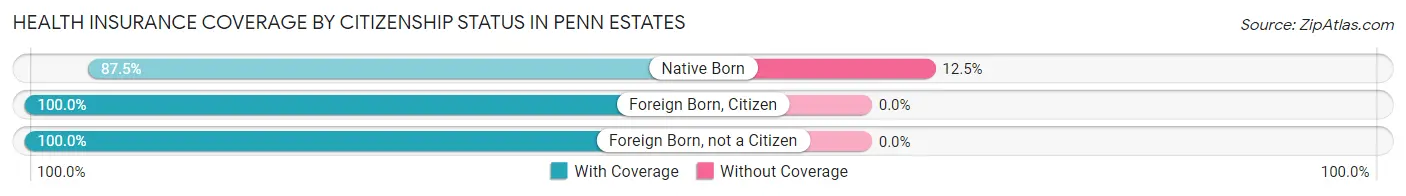
| Citizenship Status | With Coverage | Without Coverage |
| Native Born | 112 (87.5%) | 16 (12.5%) |
| Foreign Born, Citizen | 661 (100.0%) | 0 (0.0%) |
| Foreign Born, not a Citizen | 318 (100.0%) | 0 (0.0%) |
Health Insurance Coverage by Household Income in Penn Estates
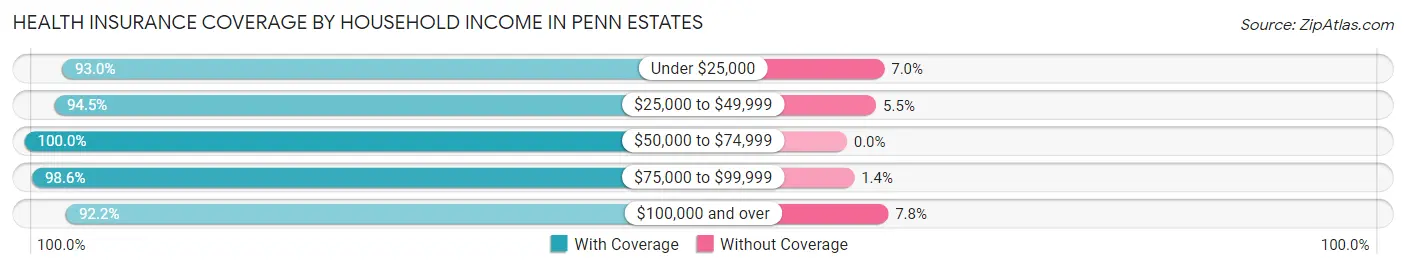
| Household Income | With Coverage | Without Coverage |
| Under $25,000 | 331 (93.0%) | 25 (7.0%) |
| $25,000 to $49,999 | 550 (94.5%) | 32 (5.5%) |
| $50,000 to $74,999 | 688 (100.0%) | 0 (0.0%) |
| $75,000 to $99,999 | 707 (98.6%) | 10 (1.4%) |
| $100,000 and over | 1,628 (92.2%) | 137 (7.8%) |
Public vs Private Health Insurance Coverage by Age in Penn Estates
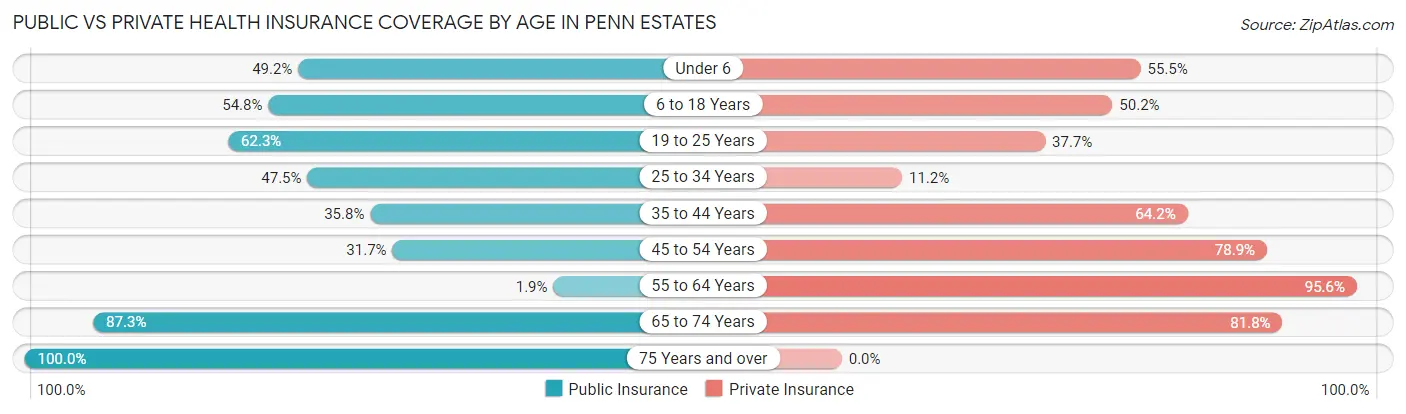
| Age Bracket | Public Insurance | Private Insurance |
| Under 6 | 63 (49.2%) | 71 (55.5%) |
| 6 to 18 Years | 362 (54.8%) | 332 (50.2%) |
| 19 to 25 Years | 198 (62.3%) | 120 (37.7%) |
| 25 to 34 Years | 153 (47.5%) | 36 (11.2%) |
| 35 to 44 Years | 181 (35.8%) | 324 (64.2%) |
| 45 to 54 Years | 224 (31.7%) | 557 (78.9%) |
| 55 to 64 Years | 18 (1.8%) | 931 (95.6%) |
| 65 to 74 Years | 412 (87.3%) | 386 (81.8%) |
| 75 Years and over | 22 (100.0%) | 0 (0.0%) |
| Total | 1,633 (39.8%) | 2,757 (67.1%) |
Disability Status by Sex by Age in Penn Estates
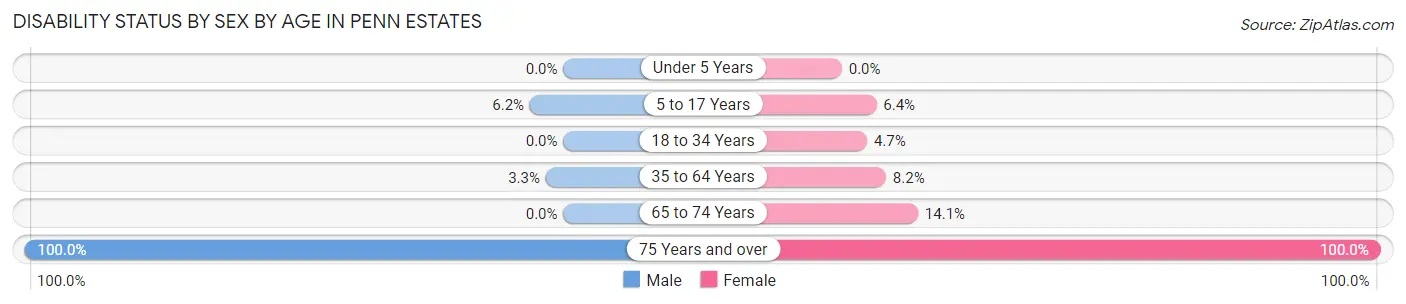
| Age Bracket | Male | Female |
| Under 5 Years | 0 (0.0%) | 0 (0.0%) |
| 5 to 17 Years | 29 (6.2%) | 15 (6.4%) |
| 18 to 34 Years | 0 (0.0%) | 14 (4.7%) |
| 35 to 64 Years | 35 (3.3%) | 91 (8.2%) |
| 65 to 74 Years | 0 (0.0%) | 39 (14.1%) |
| 75 Years and over | 11 (100.0%) | 11 (100.0%) |
Disability Class by Sex by Age in Penn Estates
Disability Class: Hearing Difficulty
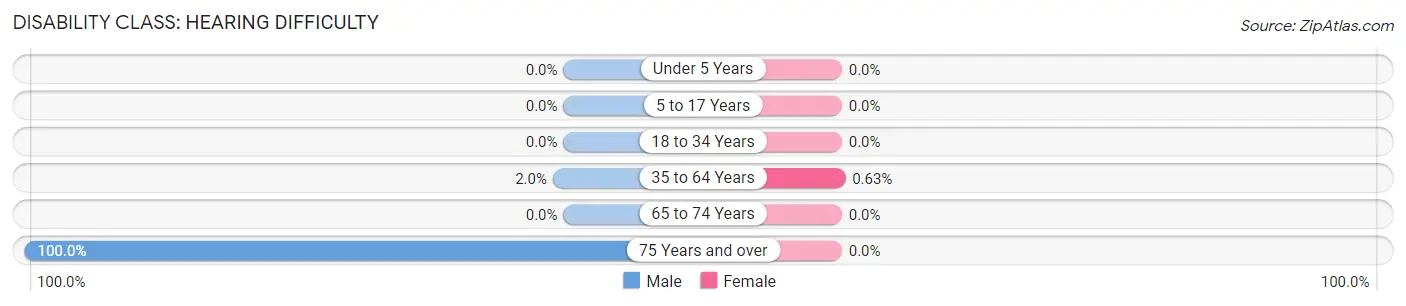
| Age Bracket | Male | Female |
| Under 5 Years | 0 (0.0%) | 0 (0.0%) |
| 5 to 17 Years | 0 (0.0%) | 0 (0.0%) |
| 18 to 34 Years | 0 (0.0%) | 0 (0.0%) |
| 35 to 64 Years | 21 (2.0%) | 7 (0.6%) |
| 65 to 74 Years | 0 (0.0%) | 0 (0.0%) |
| 75 Years and over | 11 (100.0%) | 0 (0.0%) |
Disability Class: Vision Difficulty
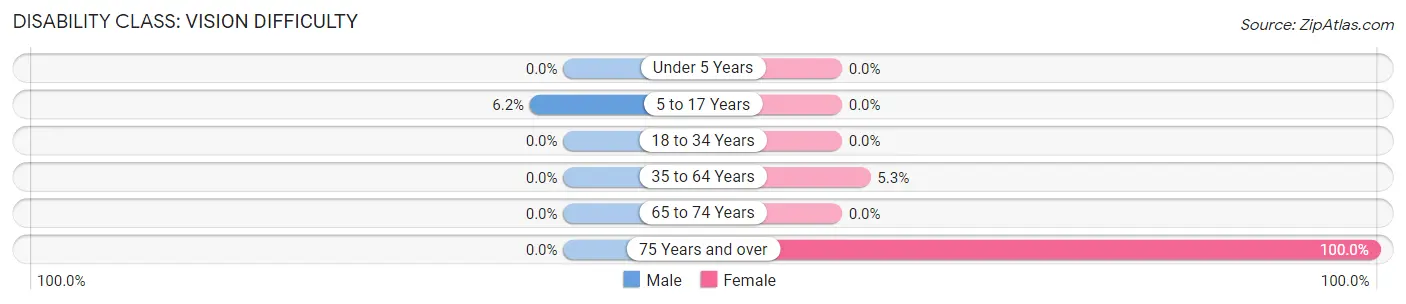
| Age Bracket | Male | Female |
| Under 5 Years | 0 (0.0%) | 0 (0.0%) |
| 5 to 17 Years | 29 (6.2%) | 0 (0.0%) |
| 18 to 34 Years | 0 (0.0%) | 0 (0.0%) |
| 35 to 64 Years | 0 (0.0%) | 59 (5.3%) |
| 65 to 74 Years | 0 (0.0%) | 0 (0.0%) |
| 75 Years and over | 0 (0.0%) | 11 (100.0%) |
Disability Class: Cognitive Difficulty
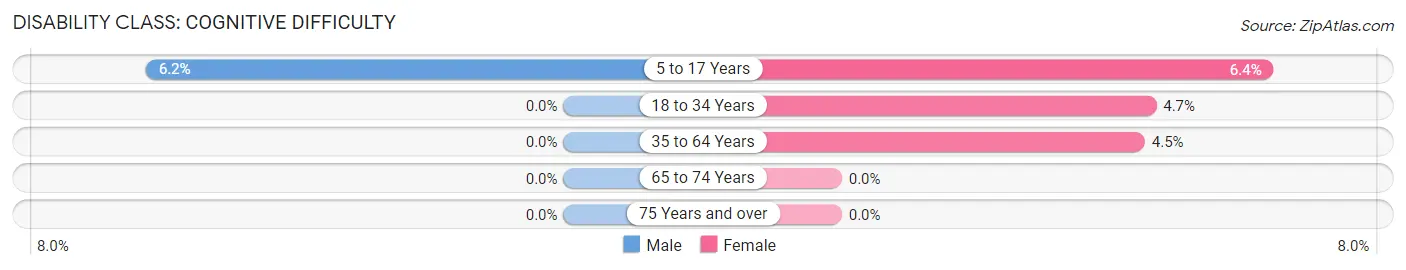
| Age Bracket | Male | Female |
| 5 to 17 Years | 29 (6.2%) | 15 (6.4%) |
| 18 to 34 Years | 0 (0.0%) | 14 (4.7%) |
| 35 to 64 Years | 0 (0.0%) | 50 (4.5%) |
| 65 to 74 Years | 0 (0.0%) | 0 (0.0%) |
| 75 Years and over | 0 (0.0%) | 0 (0.0%) |
Disability Class: Ambulatory Difficulty
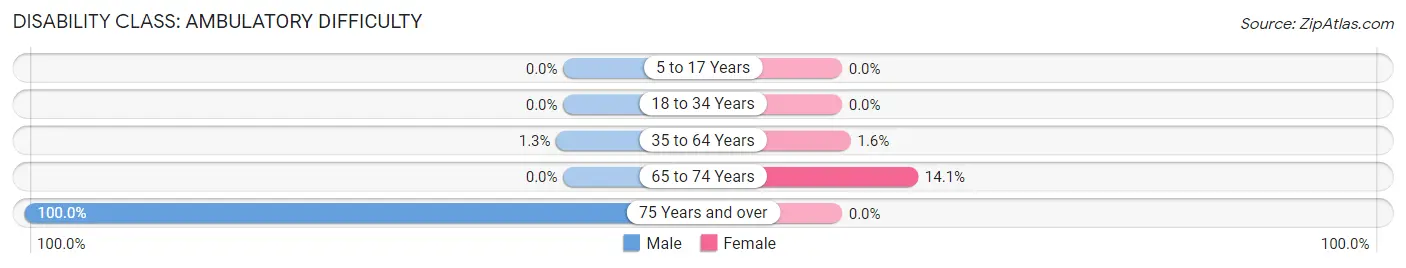
| Age Bracket | Male | Female |
| 5 to 17 Years | 0 (0.0%) | 0 (0.0%) |
| 18 to 34 Years | 0 (0.0%) | 0 (0.0%) |
| 35 to 64 Years | 14 (1.3%) | 18 (1.6%) |
| 65 to 74 Years | 0 (0.0%) | 39 (14.1%) |
| 75 Years and over | 11 (100.0%) | 0 (0.0%) |
Disability Class: Self-Care Difficulty
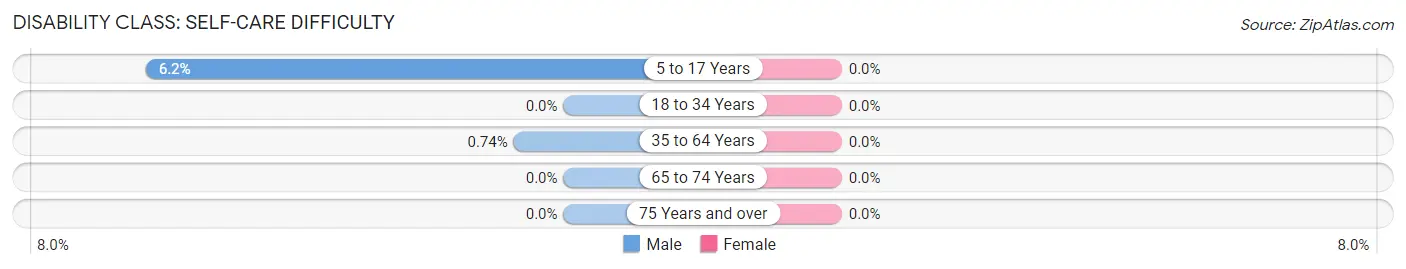
| Age Bracket | Male | Female |
| 5 to 17 Years | 29 (6.2%) | 0 (0.0%) |
| 18 to 34 Years | 0 (0.0%) | 0 (0.0%) |
| 35 to 64 Years | 8 (0.7%) | 0 (0.0%) |
| 65 to 74 Years | 0 (0.0%) | 0 (0.0%) |
| 75 Years and over | 0 (0.0%) | 0 (0.0%) |
Technology Access in Penn Estates
Computing Device Access in Penn Estates
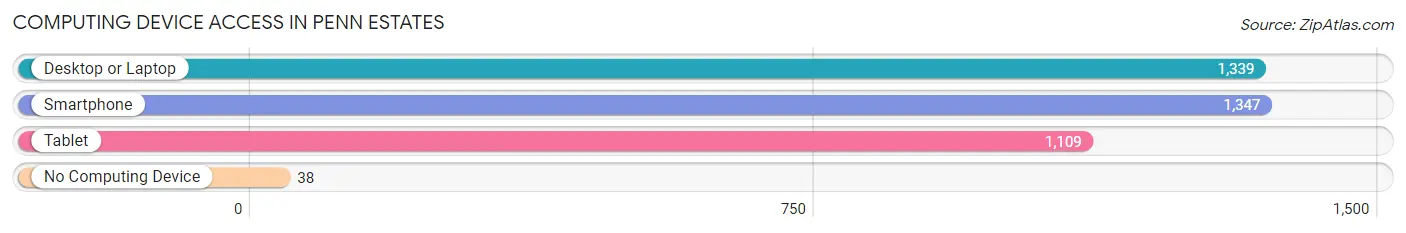
| Device Type | # Households | % Households |
| Desktop or Laptop | 1,339 | 94.1% |
| Smartphone | 1,347 | 94.7% |
| Tablet | 1,109 | 77.9% |
| No Computing Device | 38 | 2.7% |
| Total | 1,423 | 100.0% |
Internet Access in Penn Estates
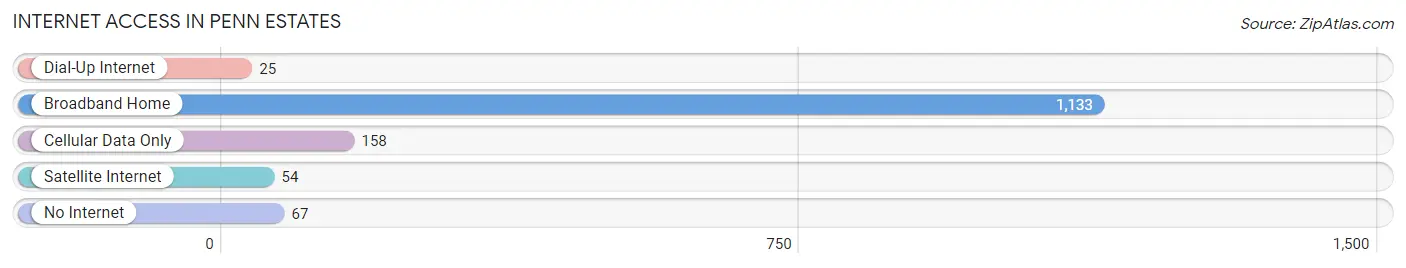
| Internet Type | # Households | % Households |
| Dial-Up Internet | 25 | 1.8% |
| Broadband Home | 1,133 | 79.6% |
| Cellular Data Only | 158 | 11.1% |
| Satellite Internet | 54 | 3.8% |
| No Internet | 67 | 4.7% |
| Total | 1,423 | 100.0% |
Penn Estates Summary
Penn Estates is a census-designated place (CDP) located in Monroe County, Pennsylvania. It is situated in the Pocono Mountains region of the state, and is part of the East Stroudsburg Metropolitan Statistical Area. The population of Penn Estates was 4,845 at the 2010 census.
History
Penn Estates was founded in the late 1960s as a planned community. It was developed by the Penn Estates Corporation, which was founded by local businessman and philanthropist, John J. O’Neill. The community was designed to provide affordable housing for families in the area. The development was planned to include a variety of housing types, including single-family homes, townhouses, and condominiums.
The community was named after the Penn family, who were prominent landowners in the area. The Penn family owned a large tract of land in the area, which was eventually sold to the Penn Estates Corporation.
Geography
Penn Estates is located in the Pocono Mountains region of Pennsylvania. It is situated in the northern part of Monroe County, and is bordered by the townships of Stroud, Smithfield, and Coolbaugh. The community is located approximately 10 miles east of Stroudsburg, and is accessible via Interstate 80 and Route 611.
The terrain of Penn Estates is mostly hilly, with some flat areas. The community is located in the Pocono Mountains, and is surrounded by forests and wooded areas. The highest point in the community is located at the intersection of Route 611 and Penn Estates Road, which is 1,890 feet above sea level.
Economy
The economy of Penn Estates is largely based on tourism and retail. The community is home to several retail stores, restaurants, and other businesses. The community is also home to a number of resorts and hotels, which attract visitors from all over the region.
The community is also home to a number of manufacturing and industrial businesses. These businesses include a plastics factory, a printing company, and a metal fabrication plant.
Demographics
As of the 2010 census, the population of Penn Estates was 4,845. The racial makeup of the community was 94.3% White, 2.2% African American, 0.3% Native American, 0.7% Asian, 0.1% Pacific Islander, and 2.4% from other races. Hispanic or Latino of any race were 4.2% of the population.
The median household income in Penn Estates was $50,945, and the median family income was $60,945. The per capita income for the community was $25,945. About 8.3% of families and 10.2% of the population were below the poverty line, including 14.2% of those under age 18 and 5.2% of those age 65 or over.
Common Questions
What is the Total Population of Penn Estates?
Total Population of Penn Estates is 4,108.
What is the Total Male Population of Penn Estates?
Total Male Population of Penn Estates is 2,111.
What is the Total Female Population of Penn Estates?
Total Female Population of Penn Estates is 1,997.
What is the Ratio of Males per 100 Females in Penn Estates?
There are 105.71 Males per 100 Females in Penn Estates.
What is the Ratio of Females per 100 Males in Penn Estates?
There are 94.60 Females per 100 Males in Penn Estates.
What is the Median Population Age in Penn Estates?
Median Population Age in Penn Estates is 45.9 Years.
What is the Average Family Size in Penn Estates
Average Family Size in Penn Estates is 3.2 People.
What is the Average Household Size in Penn Estates
Average Household Size in Penn Estates is 2.9 People.
What is Per Capita Income in Penn Estates?
Per Capita income in Penn Estates is $36,248.
What is the Median Family Income in Penn Estates?
Median Family Income in Penn Estates is $90,120.
What is the Median Household income in Penn Estates?
Median Household Income in Penn Estates is $88,957.
What is Income or Wage Gap in Penn Estates?
Income or Wage Gap in Penn Estates is 39.4%.
Women in Penn Estates earn 60.6 cents for every dollar earned by a man.
What is Inequality or Gini Index in Penn Estates?
Inequality or Gini Index in Penn Estates is 0.34.
How Large is the Labor Force in Penn Estates?
There are 2,490 People in the Labor Forcein in Penn Estates.
What is the Percentage of People in the Labor Force in Penn Estates?
70.8% of People are in the Labor Force in Penn Estates.
What is the Unemployment Rate in Penn Estates?
Unemployment Rate in Penn Estates is 6.4%.