Sheatown, PA
Sheatown Map
Sheatown Overview
684
TOTAL POPULATION
433
MALE POPULATION
251
FEMALE POPULATION
172.51
MALES / 100 FEMALES
57.97
FEMALES / 100 MALES
42.7
MEDIAN AGE
4.0
AVG FAMILY SIZE
2.2
AVG HOUSEHOLD SIZE
$29,621
PER CAPITA INCOME
$94,276
AVG FAMILY INCOME
$34,352
AVG HOUSEHOLD INCOME
46.8%
WAGE / INCOME GAP [ % ]
53.2¢/ $1
WAGE / INCOME GAP [ $ ]
0.57
INEQUALITY / GINI INDEX
253
LABOR FORCE [ PEOPLE ]
49.3%
PERCENT IN LABOR FORCE
14.2%
UNEMPLOYMENT RATE
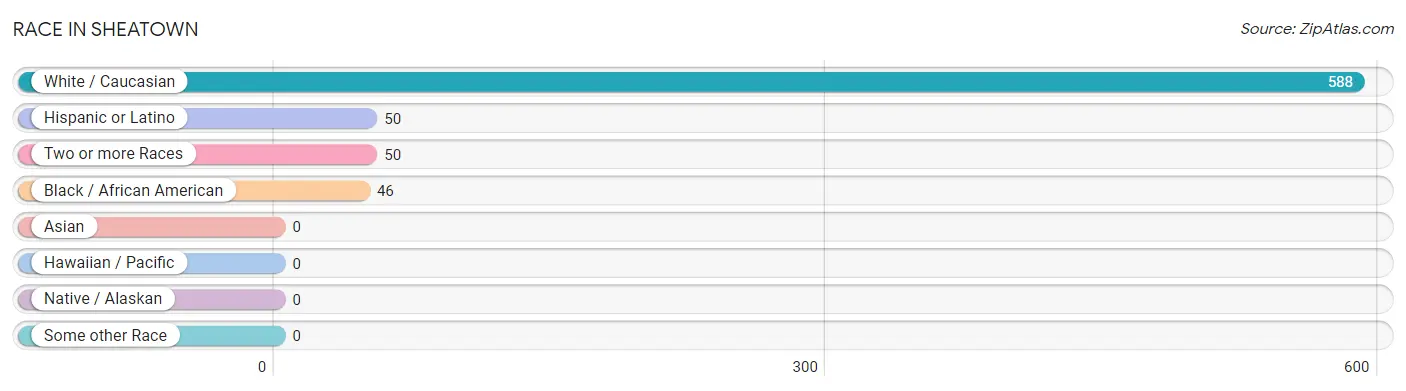
Race in Sheatown
The most populous races in Sheatown are White / Caucasian (588 | 86.0%), Hispanic or Latino (50 | 7.3%), and Two or more Races (50 | 7.3%).
| Race | # Population | % Population |
| Asian | 0 | 0.0% |
| Black / African American | 46 | 6.7% |
| Hawaiian / Pacific | 0 | 0.0% |
| Hispanic or Latino | 50 | 7.3% |
| Native / Alaskan | 0 | 0.0% |
| White / Caucasian | 588 | 86.0% |
| Two or more Races | 50 | 7.3% |
| Some other Race | 0 | 0.0% |
| Total | 684 | 100.0% |
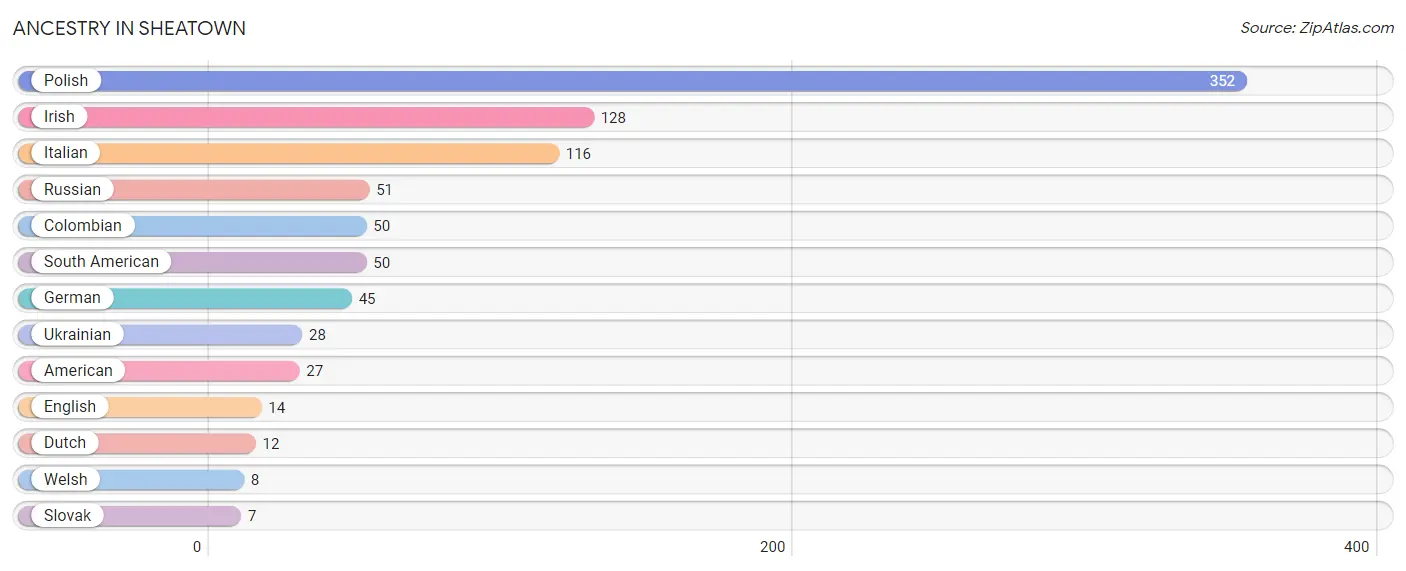
Ancestry in Sheatown
The most populous ancestries reported in Sheatown are Polish (352 | 51.5%), Irish (128 | 18.7%), Italian (116 | 17.0%), Russian (51 | 7.5%), and Colombian (50 | 7.3%), together accounting for 101.9% of all Sheatown residents.
| Ancestry | # Population | % Population |
| American | 27 | 4.0% |
| Colombian | 50 | 7.3% |
| Dutch | 12 | 1.8% |
| English | 14 | 2.1% |
| German | 45 | 6.6% |
| Irish | 128 | 18.7% |
| Italian | 116 | 17.0% |
| Polish | 352 | 51.5% |
| Russian | 51 | 7.5% |
| Slovak | 7 | 1.0% |
| South American | 50 | 7.3% |
| Ukrainian | 28 | 4.1% |
| Welsh | 8 | 1.2% | View All 13 Rows |
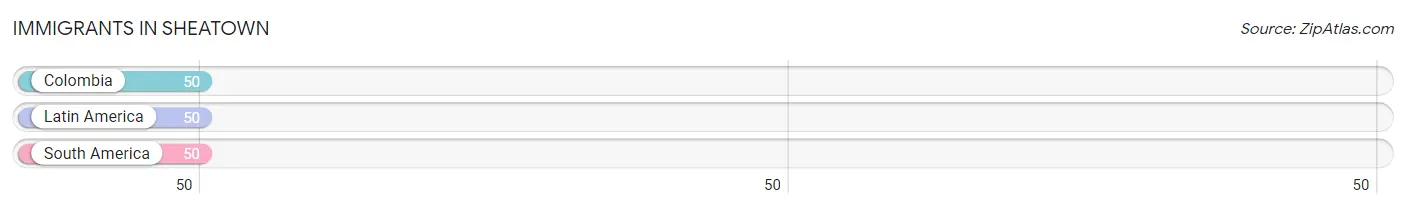
Immigrants in Sheatown
The most numerous immigrant groups reported in Sheatown came from Colombia (50 | 7.3%), Latin America (50 | 7.3%), and South America (50 | 7.3%), together accounting for 21.9% of all Sheatown residents.
| Immigration Origin | # Population | % Population |
| Colombia | 50 | 7.3% |
| Latin America | 50 | 7.3% |
| South America | 50 | 7.3% | View All 3 Rows |
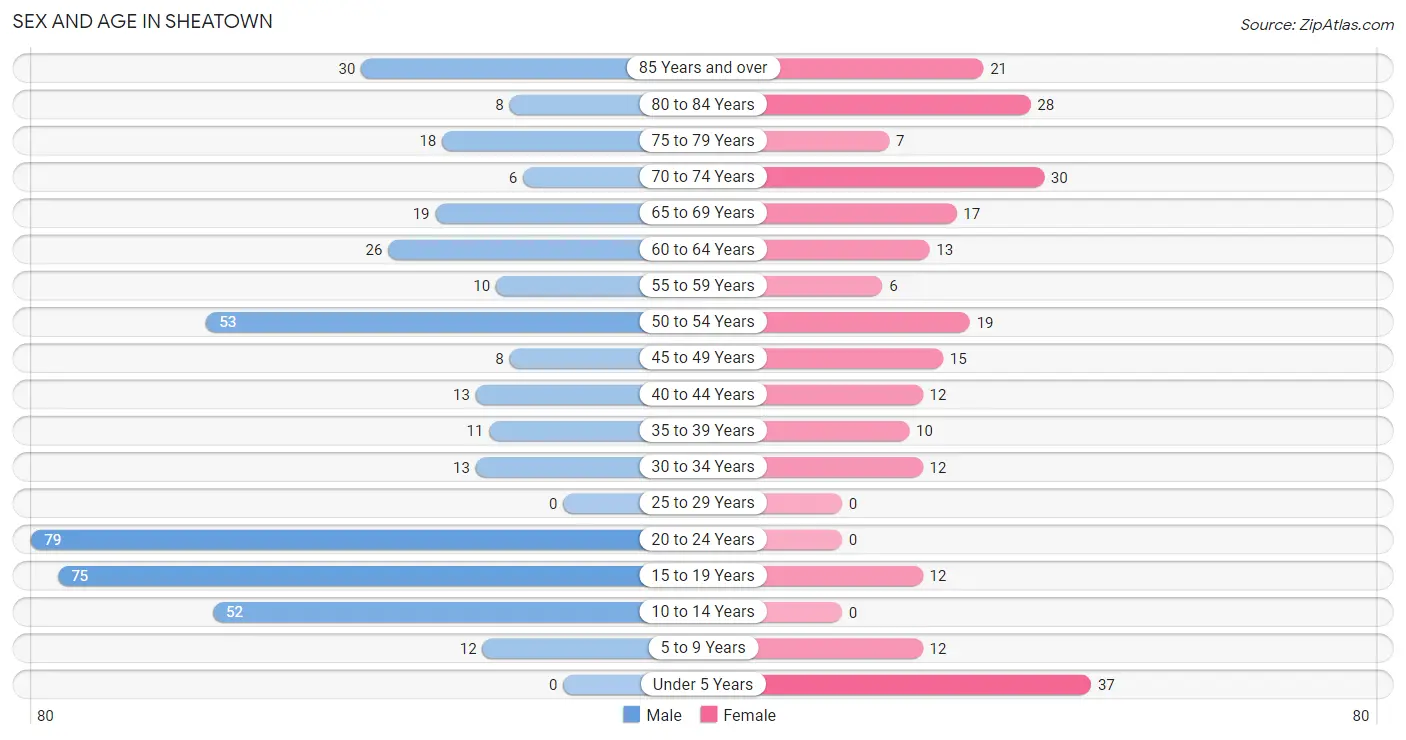
Sex and Age in Sheatown
Sex and Age in Sheatown
The most populous age groups in Sheatown are 20 to 24 Years (79 | 18.2%) for men and Under 5 Years (37 | 14.7%) for women.
| Age Bracket | Male | Female |
| Under 5 Years | 0 (0.0%) | 37 (14.7%) |
| 5 to 9 Years | 12 (2.8%) | 12 (4.8%) |
| 10 to 14 Years | 52 (12.0%) | 0 (0.0%) |
| 15 to 19 Years | 75 (17.3%) | 12 (4.8%) |
| 20 to 24 Years | 79 (18.2%) | 0 (0.0%) |
| 25 to 29 Years | 0 (0.0%) | 0 (0.0%) |
| 30 to 34 Years | 13 (3.0%) | 12 (4.8%) |
| 35 to 39 Years | 11 (2.5%) | 10 (4.0%) |
| 40 to 44 Years | 13 (3.0%) | 12 (4.8%) |
| 45 to 49 Years | 8 (1.8%) | 15 (6.0%) |
| 50 to 54 Years | 53 (12.2%) | 19 (7.6%) |
| 55 to 59 Years | 10 (2.3%) | 6 (2.4%) |
| 60 to 64 Years | 26 (6.0%) | 13 (5.2%) |
| 65 to 69 Years | 19 (4.4%) | 17 (6.8%) |
| 70 to 74 Years | 6 (1.4%) | 30 (11.9%) |
| 75 to 79 Years | 18 (4.2%) | 7 (2.8%) |
| 80 to 84 Years | 8 (1.8%) | 28 (11.2%) |
| 85 Years and over | 30 (6.9%) | 21 (8.4%) |
| Total | 433 (100.0%) | 251 (100.0%) |
Families and Households in Sheatown
Median Family Size in Sheatown
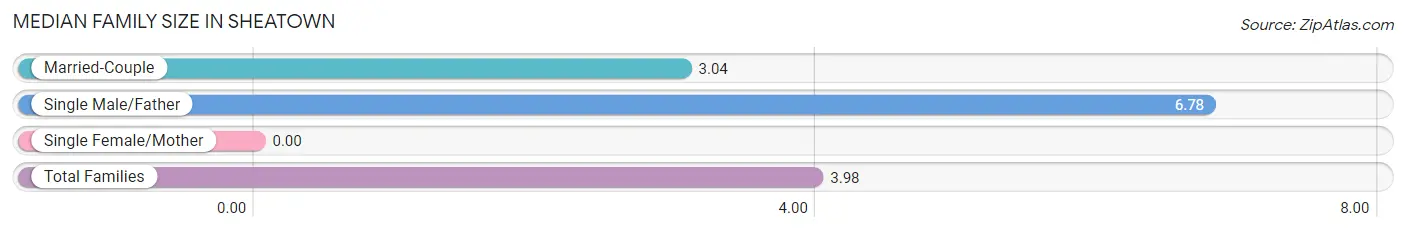
| Family Type | # Families | Family Size |
| Married-Couple | 80 (74.8%) | 3.04 |
| Single Male/Father | 27 (25.2%) | 6.78 |
| Single Female/Mother | 0 (0.0%) | - |
| Total Families | 107 (100.0%) | 3.98 |
Median Household Size in Sheatown
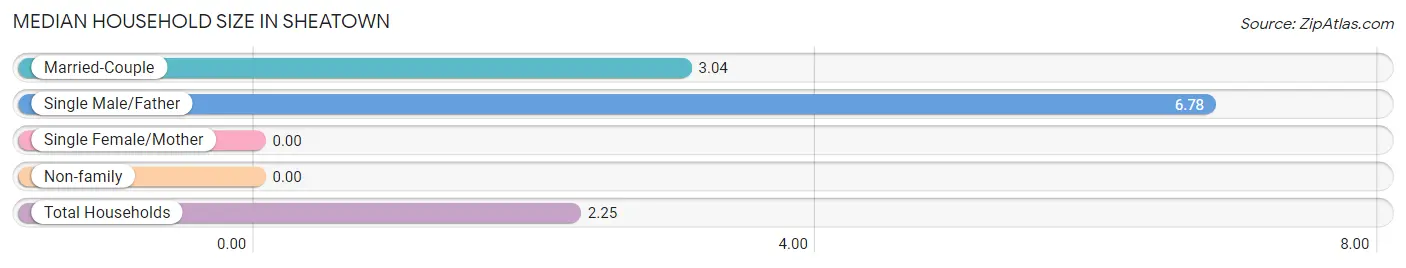
| Household Type | # Households | Household Size |
| Married-Couple | 80 (31.2%) | 3.04 |
| Single Male/Father | 27 (10.5%) | 6.78 |
| Single Female/Mother | 0 (0.0%) | - |
| Non-family | 149 (58.2%) | - |
| Total Households | 256 (100.0%) | 2.25 |
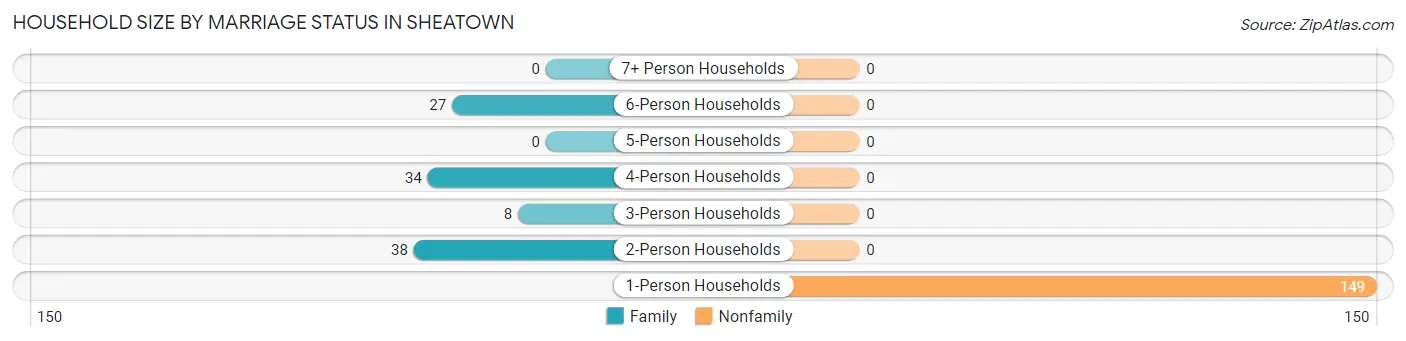
Household Size by Marriage Status in Sheatown
Out of a total of 256 households in Sheatown, 107 (41.8%) are family households, while 149 (58.2%) are nonfamily households. The most numerous type of family households are 2-person households, comprising 38, and the most common type of nonfamily households are 1-person households, comprising 149.
| Household Size | Family Households | Nonfamily Households |
| 1-Person Households | - | 149 (58.2%) |
| 2-Person Households | 38 (14.8%) | 0 (0.0%) |
| 3-Person Households | 8 (3.1%) | 0 (0.0%) |
| 4-Person Households | 34 (13.3%) | 0 (0.0%) |
| 5-Person Households | 0 (0.0%) | 0 (0.0%) |
| 6-Person Households | 27 (10.5%) | 0 (0.0%) |
| 7+ Person Households | 0 (0.0%) | 0 (0.0%) |
| Total | 107 (41.8%) | 149 (58.2%) |
Female Fertility in Sheatown
Fertility by Age in Sheatown
| Age Bracket | Women with Births | Births / 1,000 Women |
| 15 to 19 years | 0 (0.0%) | 0.0 |
| 20 to 34 years | 0 (0.0%) | 0.0 |
| 35 to 50 years | 0 (0.0%) | 0.0 |
| Total | 0 (0.0%) | 0.0 |
Fertility by Age by Marriage Status in Sheatown
| Age Bracket | Married | Unmarried |
| 15 to 19 years | 0 (0.0%) | 0 (0.0%) |
| 20 to 34 years | 0 (0.0%) | 0 (0.0%) |
| 35 to 50 years | 0 (0.0%) | 0 (0.0%) |
| Total | 0 (0.0%) | 0 (0.0%) |
Fertility by Education in Sheatown
| Educational Attainment | Women with Births | Births / 1,000 Women |
| Less than High School | 0 (0.0%) | 0.0 |
| High School Diploma | 0 (0.0%) | 0.0 |
| College or Associate's Degree | 0 (0.0%) | 0.0 |
| Bachelor's Degree | 0 (0.0%) | 0.0 |
| Graduate Degree | 0 (0.0%) | 0.0 |
| Total | 0 (0.0%) | 0.0 |
Fertility by Education by Marriage Status in Sheatown
| Educational Attainment | Married | Unmarried |
| Less than High School | 0 (0.0%) | 0 (0.0%) |
| High School Diploma | 0 (0.0%) | 0 (0.0%) |
| College or Associate's Degree | 0 (0.0%) | 0 (0.0%) |
| Bachelor's Degree | 0 (0.0%) | 0 (0.0%) |
| Graduate Degree | 0 (0.0%) | 0 (0.0%) |
| Total | 0 (0.0%) | 0 (0.0%) |
Income in Sheatown
Income Overview in Sheatown
Per Capita Income in Sheatown is $29,621, while median incomes of families and households are $94,276 and $34,352 respectively.
| Characteristic | Number | Measure |
| Per Capita Income | 684 | $29,621 |
| Median Family Income | 107 | $94,276 |
| Mean Family Income | 107 | $85,796 |
| Median Household Income | 256 | $34,352 |
| Mean Household Income | 256 | $71,067 |
| Income Deficit | 107 | $0 |
| Wage / Income Gap (%) | 684 | 46.79% |
| Wage / Income Gap ($) | 684 | 53.21¢ per $1 |
| Gini / Inequality Index | 684 | 0.57 |
Earnings by Sex in Sheatown
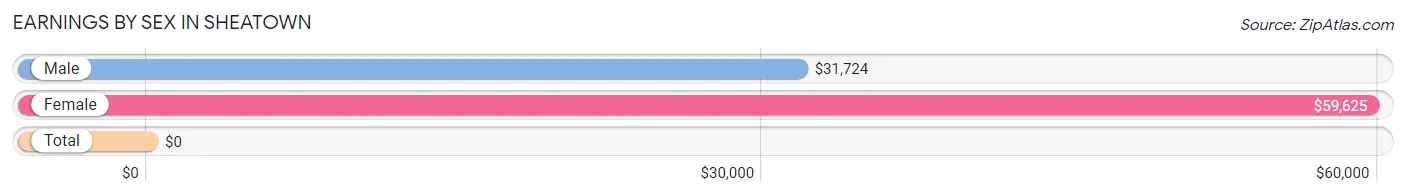
| Sex | Number | Average Earnings |
| Male | 160 (73.7%) | $31,724 |
| Female | 57 (26.3%) | $59,625 |
| Total | 217 (100.0%) | $0 |
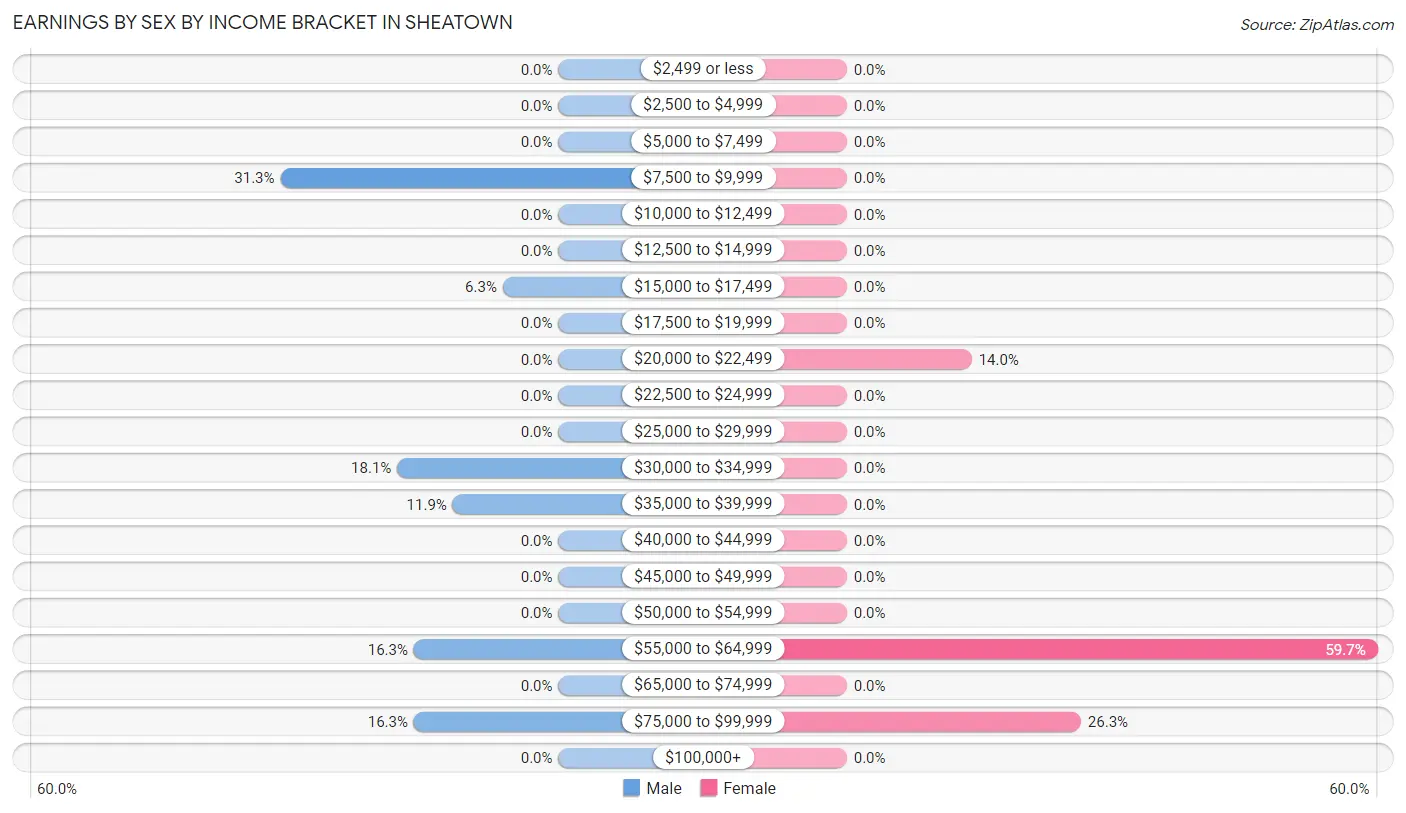
Earnings by Sex by Income Bracket in Sheatown
The most common earnings brackets in Sheatown are $7,500 to $9,999 for men (50 | 31.2%) and $55,000 to $64,999 for women (34 | 59.7%).
| Income | Male | Female |
| $2,499 or less | 0 (0.0%) | 0 (0.0%) |
| $2,500 to $4,999 | 0 (0.0%) | 0 (0.0%) |
| $5,000 to $7,499 | 0 (0.0%) | 0 (0.0%) |
| $7,500 to $9,999 | 50 (31.2%) | 0 (0.0%) |
| $10,000 to $12,499 | 0 (0.0%) | 0 (0.0%) |
| $12,500 to $14,999 | 0 (0.0%) | 0 (0.0%) |
| $15,000 to $17,499 | 10 (6.2%) | 0 (0.0%) |
| $17,500 to $19,999 | 0 (0.0%) | 0 (0.0%) |
| $20,000 to $22,499 | 0 (0.0%) | 8 (14.0%) |
| $22,500 to $24,999 | 0 (0.0%) | 0 (0.0%) |
| $25,000 to $29,999 | 0 (0.0%) | 0 (0.0%) |
| $30,000 to $34,999 | 29 (18.1%) | 0 (0.0%) |
| $35,000 to $39,999 | 19 (11.9%) | 0 (0.0%) |
| $40,000 to $44,999 | 0 (0.0%) | 0 (0.0%) |
| $45,000 to $49,999 | 0 (0.0%) | 0 (0.0%) |
| $50,000 to $54,999 | 0 (0.0%) | 0 (0.0%) |
| $55,000 to $64,999 | 26 (16.3%) | 34 (59.7%) |
| $65,000 to $74,999 | 0 (0.0%) | 0 (0.0%) |
| $75,000 to $99,999 | 26 (16.3%) | 15 (26.3%) |
| $100,000+ | 0 (0.0%) | 0 (0.0%) |
| Total | 160 (100.0%) | 57 (100.0%) |
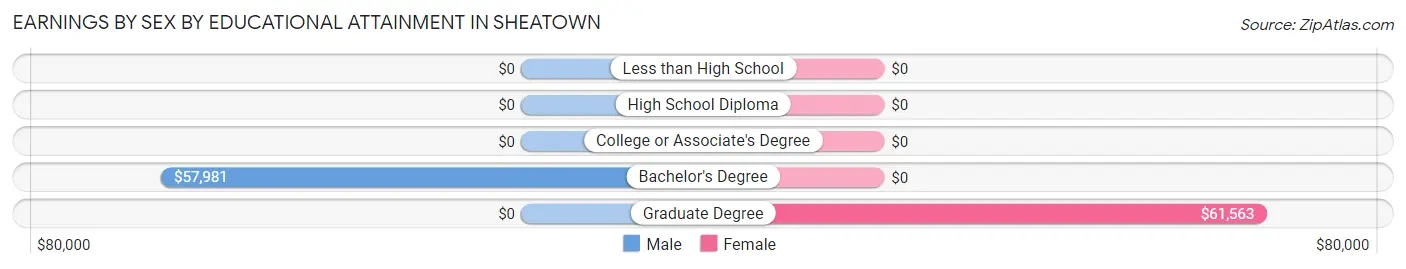
Earnings by Sex by Educational Attainment in Sheatown
Average earnings in Sheatown are $59,712 for men and $59,625 for women, a difference of 0.2%. Men with an educational attainment of bachelor's degree enjoy the highest average annual earnings of $57,981, while those with bachelor's degree education earn the least with $57,981. Women with an educational attainment of graduate degree earn the most with the average annual earnings of $61,563, while those with graduate degree education have the smallest earnings of $61,563.
| Educational Attainment | Male Income | Female Income |
| Less than High School | - | - |
| High School Diploma | - | - |
| College or Associate's Degree | - | - |
| Bachelor's Degree | $57,981 | $0 |
| Graduate Degree | - | - |
| Total | $59,712 | $59,625 |
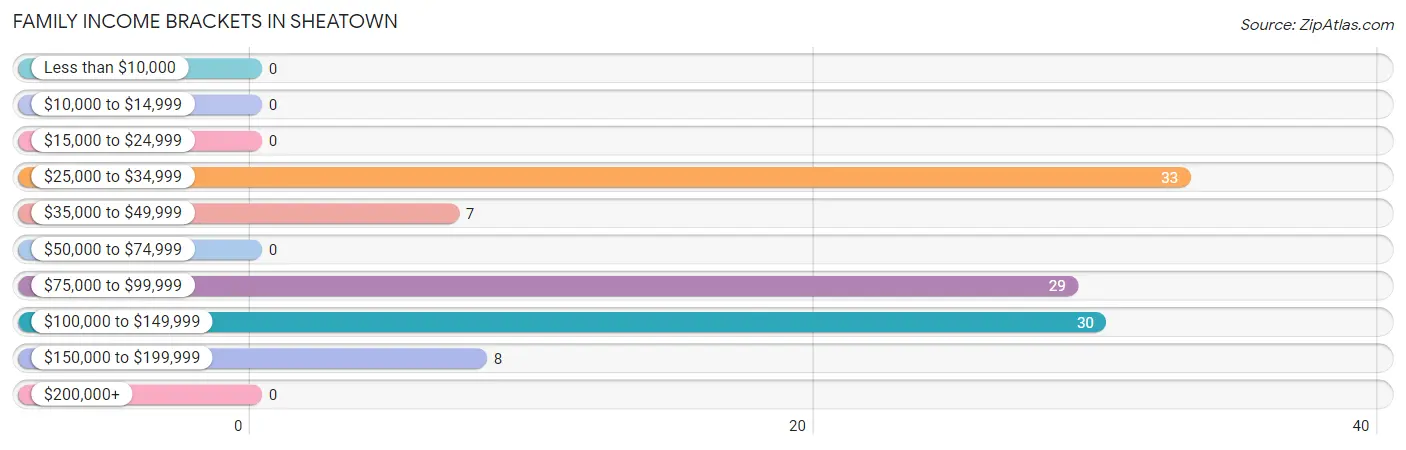
Family Income in Sheatown
Family Income Brackets in Sheatown
According to the Sheatown family income data, there are 33 families falling into the $25,000 to $34,999 income range, which is the most common income bracket and makes up 30.8% of all families.
| Income Bracket | # Families | % Families |
| Less than $10,000 | 0 | 0.0% |
| $10,000 to $14,999 | 0 | 0.0% |
| $15,000 to $24,999 | 0 | 0.0% |
| $25,000 to $34,999 | 33 | 30.8% |
| $35,000 to $49,999 | 7 | 6.5% |
| $50,000 to $74,999 | 0 | 0.0% |
| $75,000 to $99,999 | 29 | 27.1% |
| $100,000 to $149,999 | 30 | 28.0% |
| $150,000 to $199,999 | 8 | 7.5% |
| $200,000+ | 0 | 0.0% |
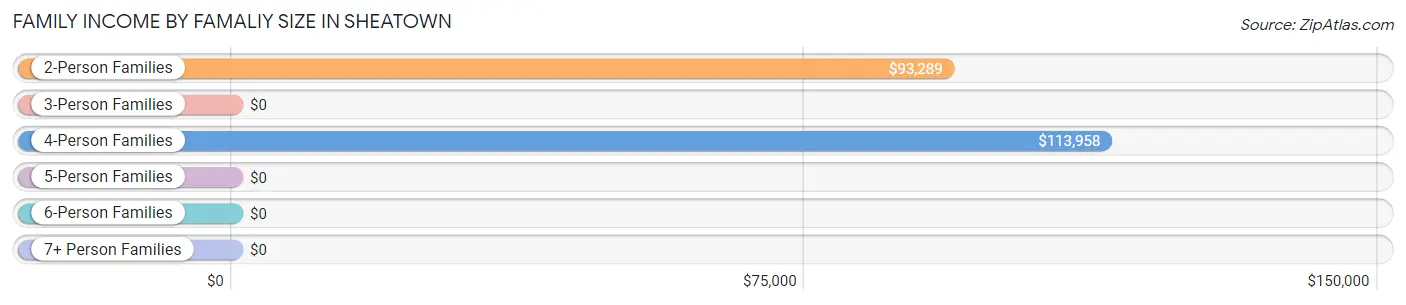
Family Income by Famaliy Size in Sheatown
4-person families (34 | 31.8%) account for the highest median family income in Sheatown with $113,958 per family, while 2-person families (38 | 35.5%) have the highest median income of $46,644 per family member.
| Income Bracket | # Families | Median Income |
| 2-Person Families | 38 (35.5%) | $93,289 |
| 3-Person Families | 8 (7.5%) | $0 |
| 4-Person Families | 34 (31.8%) | $113,958 |
| 5-Person Families | 0 (0.0%) | $0 |
| 6-Person Families | 27 (25.2%) | $0 |
| 7+ Person Families | 0 (0.0%) | $0 |
| Total | 107 (100.0%) | $94,276 |
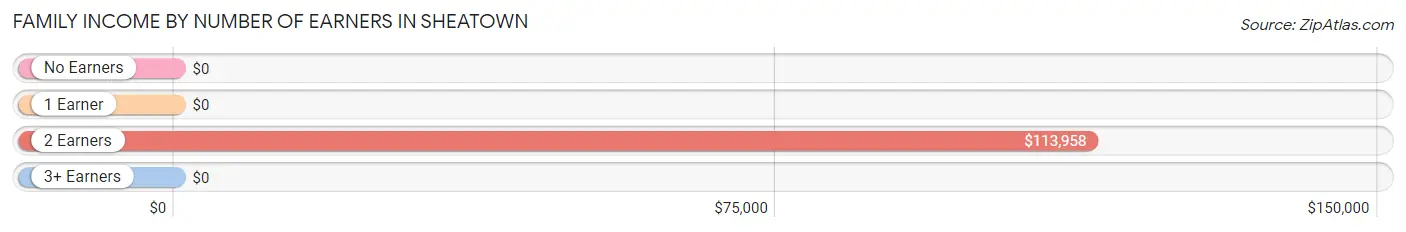
Family Income by Number of Earners in Sheatown
| Number of Earners | # Families | Median Income |
| No Earners | 13 (12.1%) | $0 |
| 1 Earner | 60 (56.1%) | $0 |
| 2 Earners | 34 (31.8%) | $113,958 |
| 3+ Earners | 0 (0.0%) | $0 |
| Total | 107 (100.0%) | $94,276 |
Household Income in Sheatown
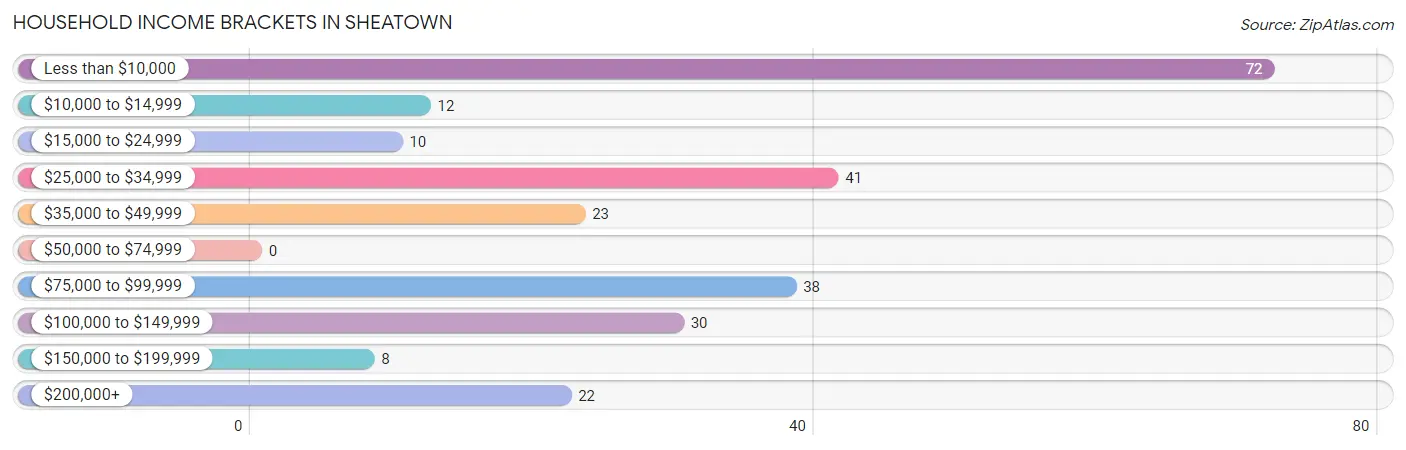
Household Income Brackets in Sheatown
With 72 households falling in the category, the less than $10,000 income range is the most frequent in Sheatown, accounting for 28.1% of all households.
| Income Bracket | # Households | % Households |
| Less than $10,000 | 72 | 28.1% |
| $10,000 to $14,999 | 12 | 4.7% |
| $15,000 to $24,999 | 10 | 3.9% |
| $25,000 to $34,999 | 41 | 16.0% |
| $35,000 to $49,999 | 23 | 9.0% |
| $50,000 to $74,999 | 0 | 0.0% |
| $75,000 to $99,999 | 38 | 14.8% |
| $100,000 to $149,999 | 30 | 11.7% |
| $150,000 to $199,999 | 8 | 3.1% |
| $200,000+ | 22 | 8.6% |
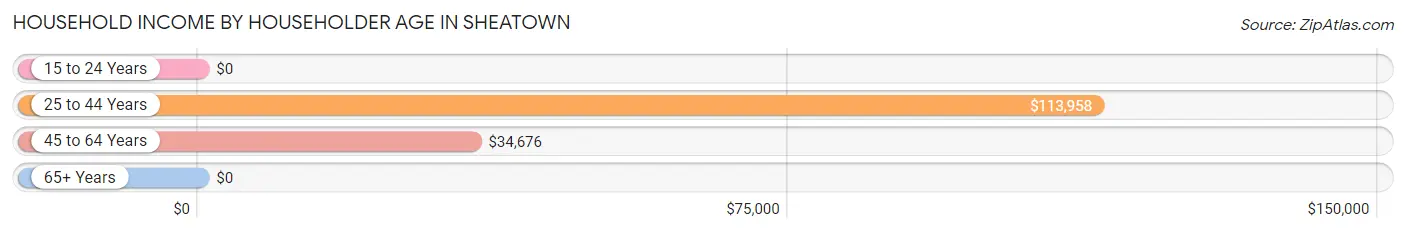
Household Income by Householder Age in Sheatown
The median household income in Sheatown is $34,352, with the highest median household income of $113,958 found in the 25 to 44 years age bracket for the primary householder. A total of 34 households (13.3%) fall into this category. Meanwhile, the 15 to 24 years age bracket for the primary householder has the lowest median household income of $0, with 50 households (19.5%) in this group.
| Income Bracket | # Households | Median Income |
| 15 to 24 Years | 50 (19.5%) | $0 |
| 25 to 44 Years | 34 (13.3%) | $113,958 |
| 45 to 64 Years | 105 (41.0%) | $34,676 |
| 65+ Years | 67 (26.2%) | $0 |
| Total | 256 (100.0%) | $34,352 |
Poverty in Sheatown
Income Below Poverty by Sex and Age in Sheatown
With 65.2% poverty level for males and 13.0% for females among the residents of Sheatown, 12 to 14 year old males and 75 year old and over females are the most vulnerable to poverty, with 26 males (100.0%) and 5 females (41.7%) in their respective age groups living below the poverty level.
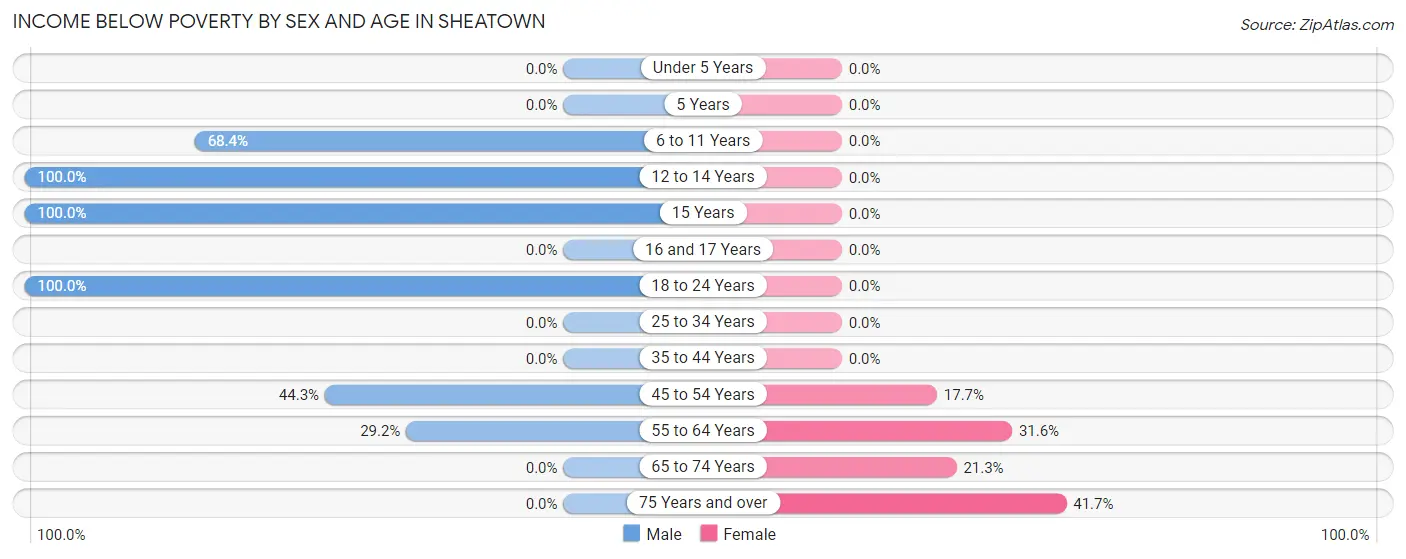
| Age Bracket | Male | Female |
| Under 5 Years | 0 (0.0%) | 0 (0.0%) |
| 5 Years | 0 (0.0%) | 0 (0.0%) |
| 6 to 11 Years | 26 (68.4%) | 0 (0.0%) |
| 12 to 14 Years | 26 (100.0%) | 0 (0.0%) |
| 15 Years | 46 (100.0%) | 0 (0.0%) |
| 16 and 17 Years | 0 (0.0%) | 0 (0.0%) |
| 18 to 24 Years | 108 (100.0%) | 0 (0.0%) |
| 25 to 34 Years | 0 (0.0%) | 0 (0.0%) |
| 35 to 44 Years | 0 (0.0%) | 0 (0.0%) |
| 45 to 54 Years | 27 (44.3%) | 6 (17.6%) |
| 55 to 64 Years | 7 (29.2%) | 6 (31.6%) |
| 65 to 74 Years | 0 (0.0%) | 10 (21.3%) |
| 75 Years and over | 0 (0.0%) | 5 (41.7%) |
| Total | 240 (65.2%) | 27 (13.0%) |
Income Above Poverty by Sex and Age in Sheatown
According to the poverty statistics in Sheatown, males aged 25 to 34 years and females aged under 5 years are the age groups that are most secure financially, with 100.0% of males and 100.0% of females in these age groups living above the poverty line.
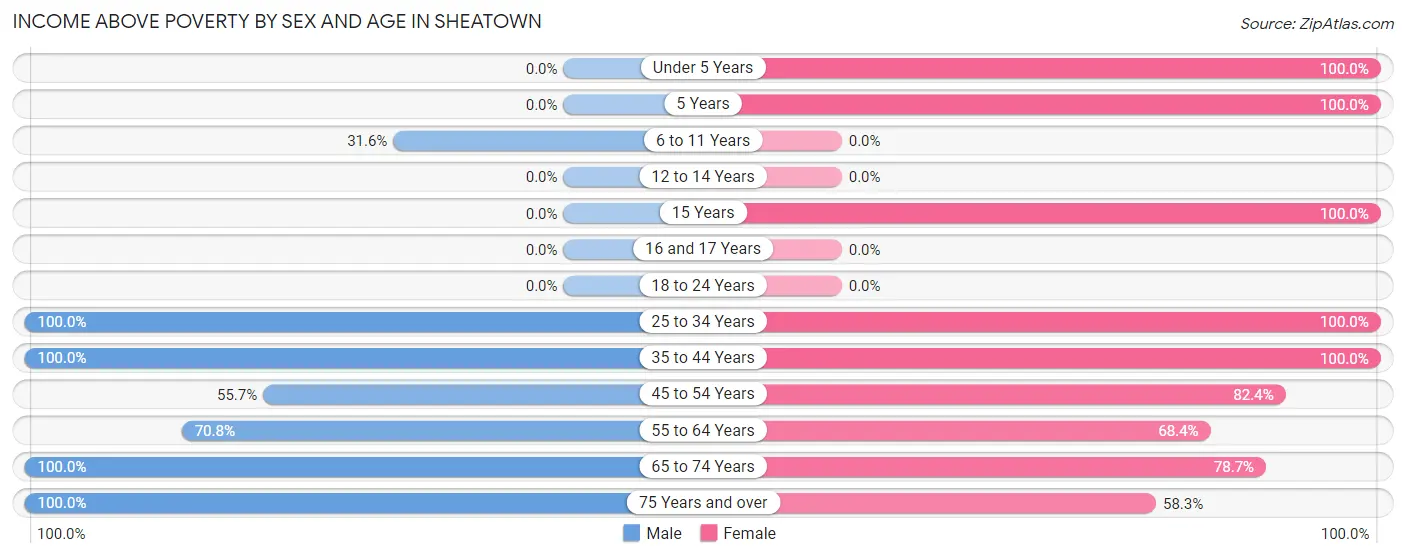
| Age Bracket | Male | Female |
| Under 5 Years | 0 (0.0%) | 37 (100.0%) |
| 5 Years | 0 (0.0%) | 12 (100.0%) |
| 6 to 11 Years | 12 (31.6%) | 0 (0.0%) |
| 12 to 14 Years | 0 (0.0%) | 0 (0.0%) |
| 15 Years | 0 (0.0%) | 12 (100.0%) |
| 16 and 17 Years | 0 (0.0%) | 0 (0.0%) |
| 18 to 24 Years | 0 (0.0%) | 0 (0.0%) |
| 25 to 34 Years | 13 (100.0%) | 12 (100.0%) |
| 35 to 44 Years | 24 (100.0%) | 22 (100.0%) |
| 45 to 54 Years | 34 (55.7%) | 28 (82.4%) |
| 55 to 64 Years | 17 (70.8%) | 13 (68.4%) |
| 65 to 74 Years | 12 (100.0%) | 37 (78.7%) |
| 75 Years and over | 16 (100.0%) | 7 (58.3%) |
| Total | 128 (34.8%) | 180 (87.0%) |
Income Below Poverty Among Married-Couple Families in Sheatown
| Children | Above Poverty | Below Poverty |
| No Children | 46 (100.0%) | 0 (0.0%) |
| 1 or 2 Children | 34 (100.0%) | 0 (0.0%) |
| 3 or 4 Children | 0 (0.0%) | 0 (0.0%) |
| 5 or more Children | 0 (0.0%) | 0 (0.0%) |
| Total | 80 (100.0%) | 0 (0.0%) |
Income Below Poverty Among Single-Parent Households in Sheatown
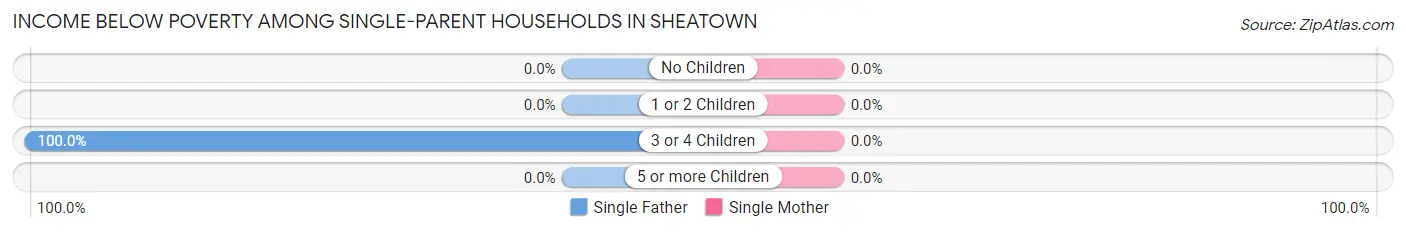
| Children | Single Father | Single Mother |
| No Children | 0 (0.0%) | 0 (0.0%) |
| 1 or 2 Children | 0 (0.0%) | 0 (0.0%) |
| 3 or 4 Children | 27 (100.0%) | 0 (0.0%) |
| 5 or more Children | 0 (0.0%) | 0 (0.0%) |
| Total | 27 (100.0%) | 0 (0.0%) |
Income Below Poverty Among Married-Couple vs Single-Parent Households in Sheatown
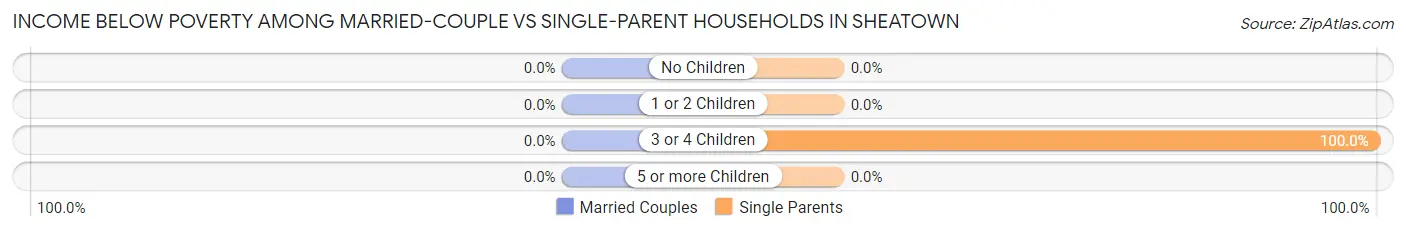
| Children | Married-Couple Families | Single-Parent Households |
| No Children | 0 (0.0%) | 0 (0.0%) |
| 1 or 2 Children | 0 (0.0%) | 0 (0.0%) |
| 3 or 4 Children | 0 (0.0%) | 27 (100.0%) |
| 5 or more Children | 0 (0.0%) | 0 (0.0%) |
| Total | 0 (0.0%) | 27 (100.0%) |
Employment Characteristics in Sheatown
Employment by Class of Employer in Sheatown
Among the 217 employed individuals in Sheatown, private company employees (182 | 83.9%), not-for-profit organizations (19 | 8.8%), and local government employees (16 | 7.4%) make up the most common classes of employment.
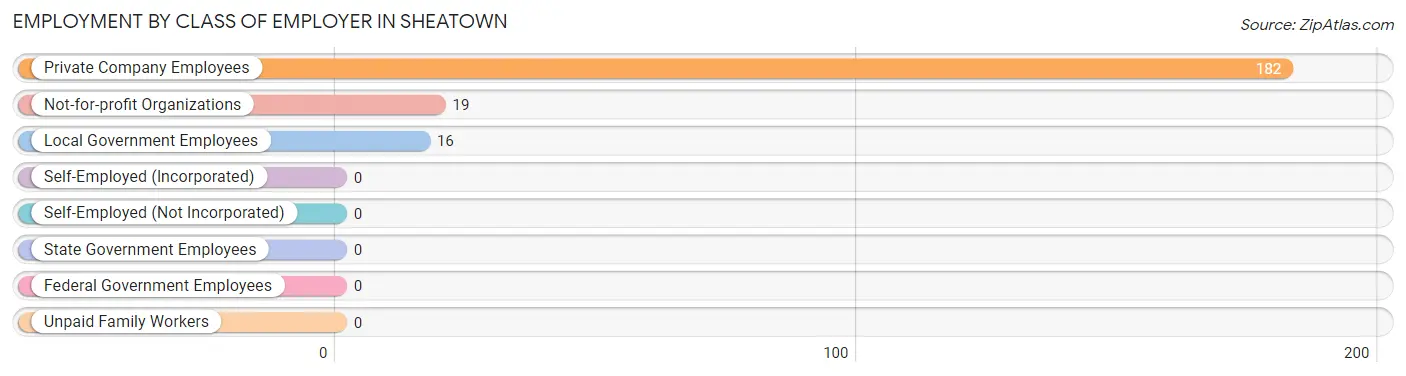
| Employer Class | # Employees | % Employees |
| Private Company Employees | 182 | 83.9% |
| Self-Employed (Incorporated) | 0 | 0.0% |
| Self-Employed (Not Incorporated) | 0 | 0.0% |
| Not-for-profit Organizations | 19 | 8.8% |
| Local Government Employees | 16 | 7.4% |
| State Government Employees | 0 | 0.0% |
| Federal Government Employees | 0 | 0.0% |
| Unpaid Family Workers | 0 | 0.0% |
| Total | 217 | 100.0% |
Employment Status by Age in Sheatown
According to the labor force statistics for Sheatown, out of the total population over 16 years of age (513), 49.3% or 253 individuals are in the labor force, with 14.2% or 36 of them unemployed. The age group with the highest labor force participation rate is 16 to 19 years, with 100.0% or 29 individuals in the labor force. Within the labor force, the 16 to 19 years age range has the highest percentage of unemployed individuals, with 100.0% or 29 of them being unemployed.
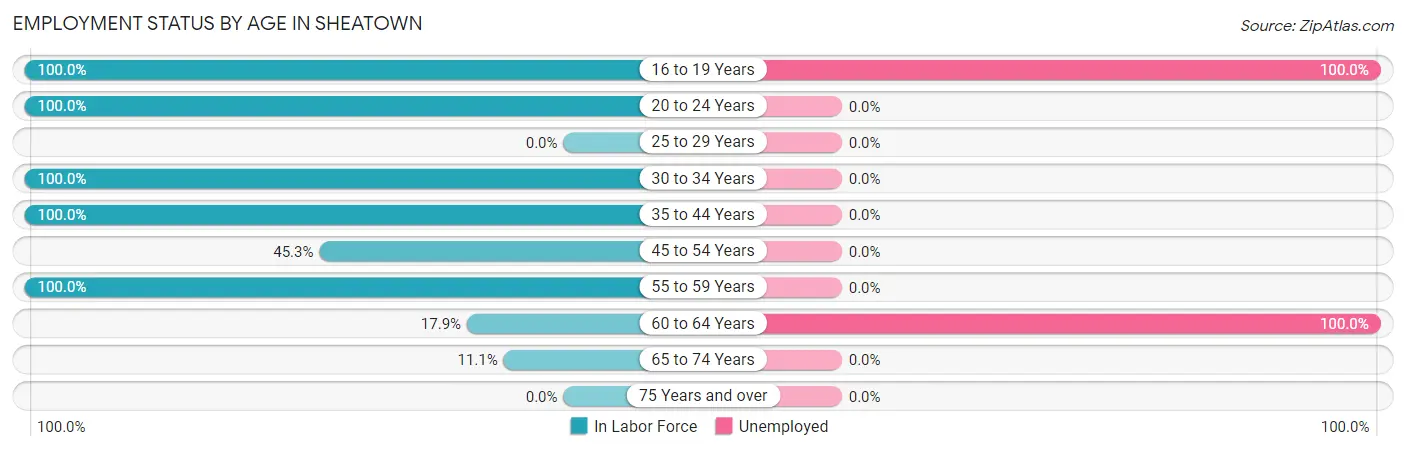
| Age Bracket | In Labor Force | Unemployed |
| 16 to 19 Years | 29 (100.0%) | 29 (100.0%) |
| 20 to 24 Years | 79 (100.0%) | 0 (0.0%) |
| 25 to 29 Years | 0 (0.0%) | 0 (0.0%) |
| 30 to 34 Years | 25 (100.0%) | 0 (0.0%) |
| 35 to 44 Years | 46 (100.0%) | 0 (0.0%) |
| 45 to 54 Years | 43 (45.3%) | 0 (0.0%) |
| 55 to 59 Years | 16 (100.0%) | 0 (0.0%) |
| 60 to 64 Years | 7 (17.9%) | 7 (100.0%) |
| 65 to 74 Years | 8 (11.1%) | 0 (0.0%) |
| 75 Years and over | 0 (0.0%) | 0 (0.0%) |
| Total | 253 (49.3%) | 36 (14.2%) |
Employment Status by Educational Attainment in Sheatown
According to labor force statistics for Sheatown, 62.0% of individuals (137) out of the total population between 25 and 64 years of age (221) are in the labor force, with 5.1% or 7 of them being unemployed. The group with the highest labor force participation rate are those with the educational attainment of bachelor's degree or higher, with 88.8% or 103 individuals in the labor force. Within the labor force, individuals with bachelor's degree or higher education have the highest percentage of unemployment, with 6.8% or 7 of them being unemployed.
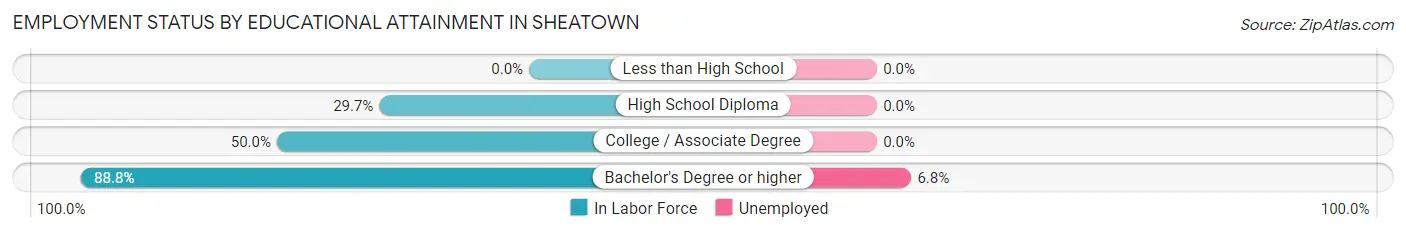
| Educational Attainment | In Labor Force | Unemployed |
| Less than High School | 0 (0.0%) | 0 (0.0%) |
| High School Diploma | 27 (29.7%) | 0 (0.0%) |
| College / Associate Degree | 7 (50.0%) | 0 (0.0%) |
| Bachelor's Degree or higher | 103 (88.8%) | 8 (6.8%) |
| Total | 137 (62.0%) | 11 (5.1%) |
Employment Occupations by Sex in Sheatown
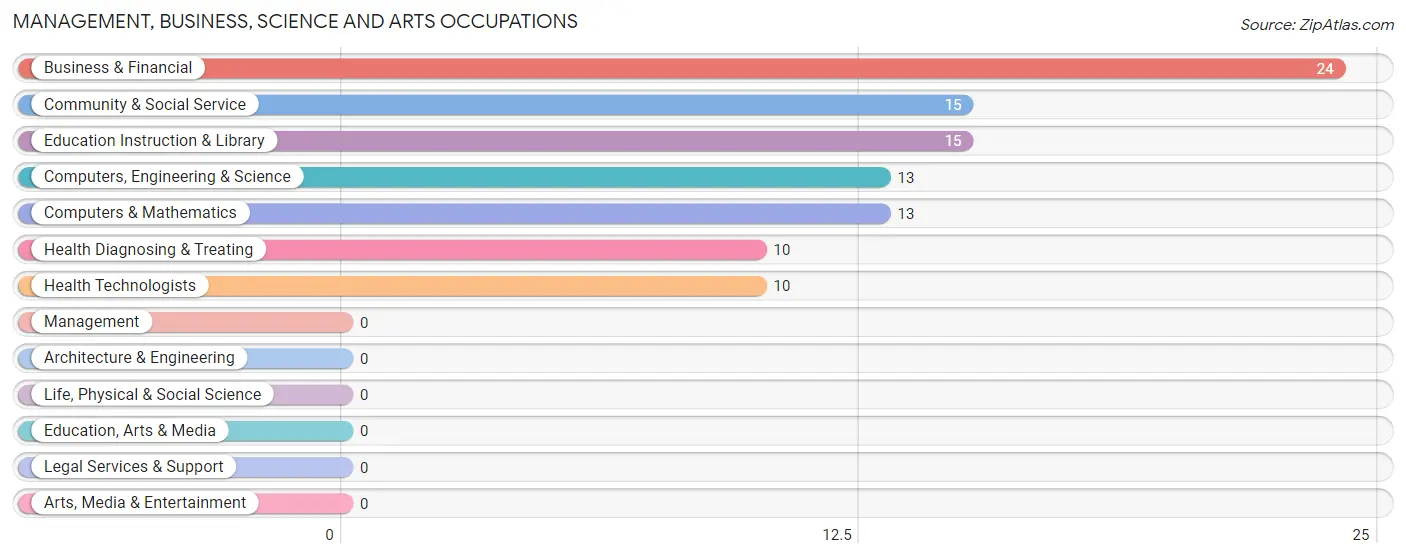
Management, Business, Science and Arts Occupations
The most common Management, Business, Science and Arts occupations in Sheatown are Business & Financial (24 | 11.1%), Community & Social Service (15 | 6.9%), Education Instruction & Library (15 | 6.9%), Computers, Engineering & Science (13 | 6.0%), and Computers & Mathematics (13 | 6.0%).
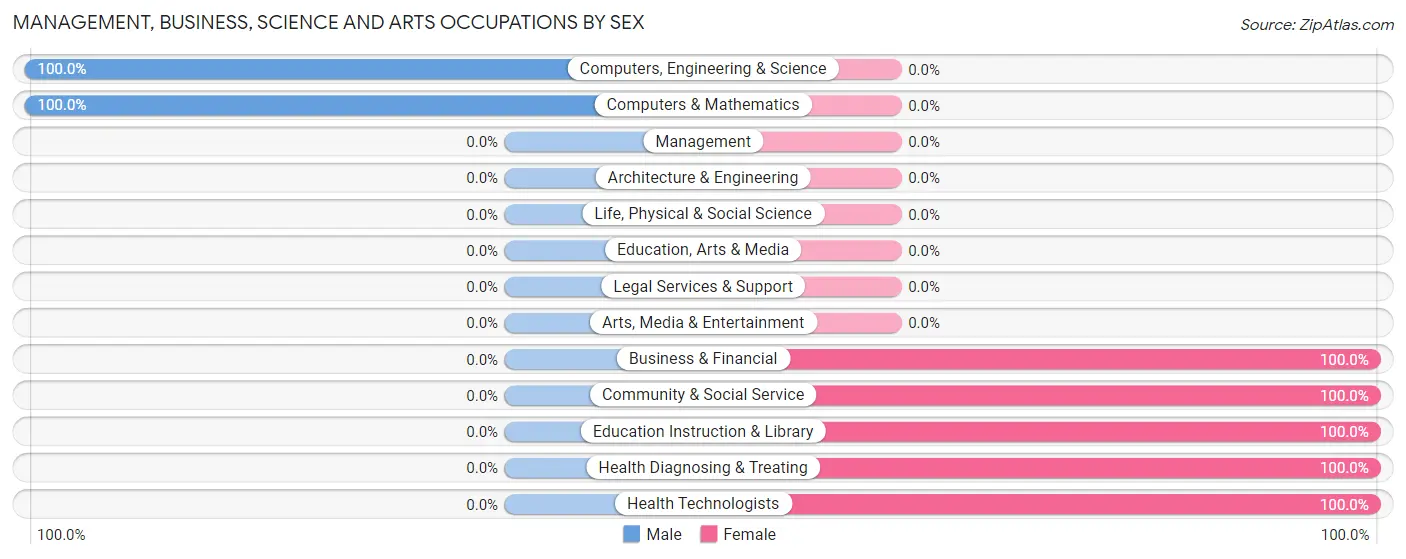
Management, Business, Science and Arts Occupations by Sex
Within the Management, Business, Science and Arts occupations in Sheatown, the most male-oriented occupations are Computers, Engineering & Science (100.0%), and Computers & Mathematics (100.0%), while the most female-oriented occupations are Business & Financial (100.0%), Community & Social Service (100.0%), and Education Instruction & Library (100.0%).
| Occupation | Male | Female |
| Management | 0 (0.0%) | 0 (0.0%) |
| Business & Financial | 0 (0.0%) | 24 (100.0%) |
| Computers, Engineering & Science | 13 (100.0%) | 0 (0.0%) |
| Computers & Mathematics | 13 (100.0%) | 0 (0.0%) |
| Architecture & Engineering | 0 (0.0%) | 0 (0.0%) |
| Life, Physical & Social Science | 0 (0.0%) | 0 (0.0%) |
| Community & Social Service | 0 (0.0%) | 15 (100.0%) |
| Education, Arts & Media | 0 (0.0%) | 0 (0.0%) |
| Legal Services & Support | 0 (0.0%) | 0 (0.0%) |
| Education Instruction & Library | 0 (0.0%) | 15 (100.0%) |
| Arts, Media & Entertainment | 0 (0.0%) | 0 (0.0%) |
| Health Diagnosing & Treating | 0 (0.0%) | 10 (100.0%) |
| Health Technologists | 0 (0.0%) | 10 (100.0%) |
| Total (Category) | 13 (21.0%) | 49 (79.0%) |
| Total (Overall) | 160 (73.7%) | 57 (26.3%) |
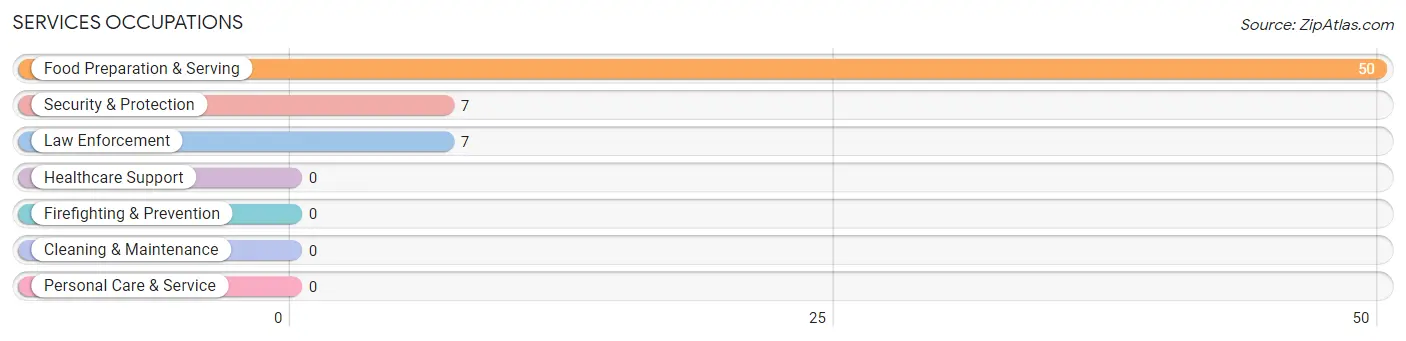
Services Occupations
The most common Services occupations in Sheatown are Food Preparation & Serving (50 | 23.0%), Security & Protection (7 | 3.2%), and Law Enforcement (7 | 3.2%).
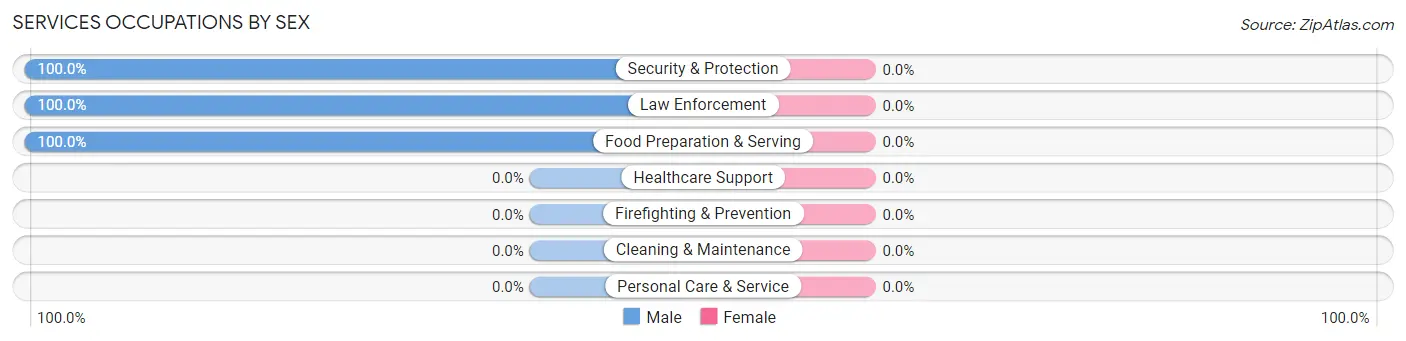
Services Occupations by Sex
| Occupation | Male | Female |
| Healthcare Support | 0 (0.0%) | 0 (0.0%) |
| Security & Protection | 7 (100.0%) | 0 (0.0%) |
| Firefighting & Prevention | 0 (0.0%) | 0 (0.0%) |
| Law Enforcement | 7 (100.0%) | 0 (0.0%) |
| Food Preparation & Serving | 50 (100.0%) | 0 (0.0%) |
| Cleaning & Maintenance | 0 (0.0%) | 0 (0.0%) |
| Personal Care & Service | 0 (0.0%) | 0 (0.0%) |
| Total (Category) | 57 (100.0%) | 0 (0.0%) |
| Total (Overall) | 160 (73.7%) | 57 (26.3%) |
Sales and Office Occupations
The most common Sales and Office occupations in Sheatown are Office & Administration (42 | 19.4%), and Sales & Related (18 | 8.3%).
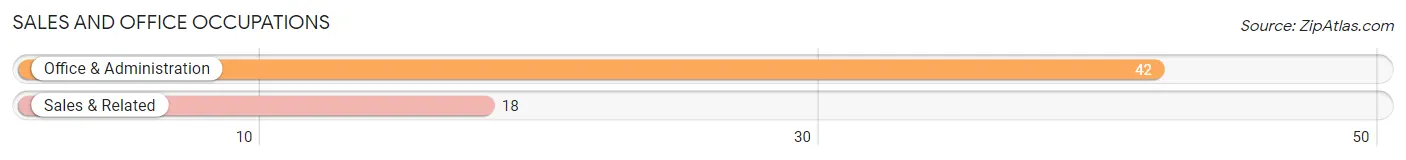
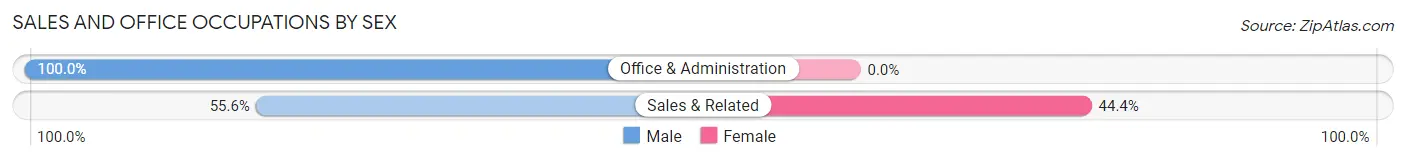
Sales and Office Occupations by Sex
| Occupation | Male | Female |
| Sales & Related | 10 (55.6%) | 8 (44.4%) |
| Office & Administration | 42 (100.0%) | 0 (0.0%) |
| Total (Category) | 52 (86.7%) | 8 (13.3%) |
| Total (Overall) | 160 (73.7%) | 57 (26.3%) |
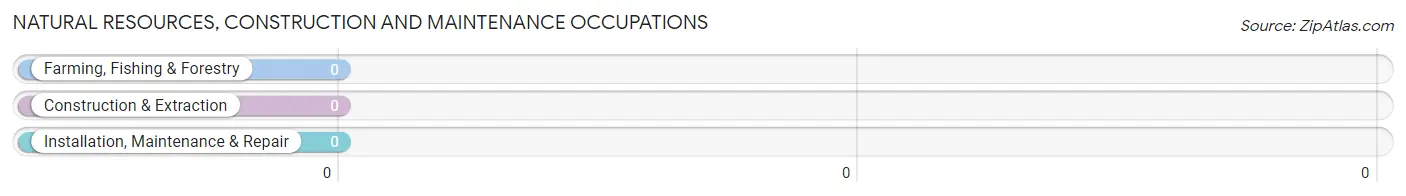
Natural Resources, Construction and Maintenance Occupations
Natural Resources, Construction and Maintenance Occupations by Sex
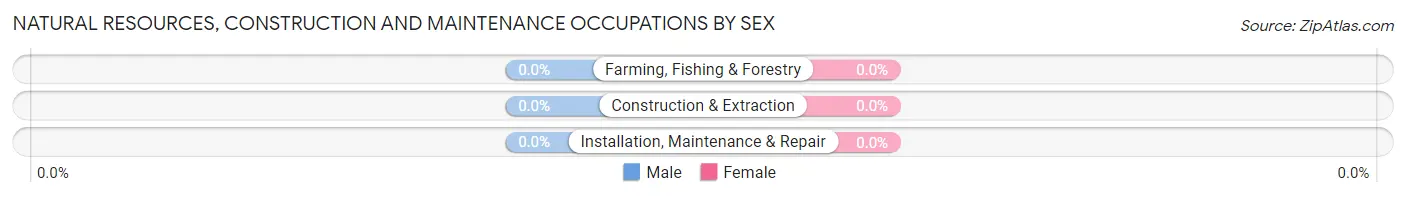
| Occupation | Male | Female |
| Farming, Fishing & Forestry | 0 (0.0%) | 0 (0.0%) |
| Construction & Extraction | 0 (0.0%) | 0 (0.0%) |
| Installation, Maintenance & Repair | 0 (0.0%) | 0 (0.0%) |
| Total (Category) | 0 (0.0%) | 0 (0.0%) |
| Total (Overall) | 160 (73.7%) | 57 (26.3%) |
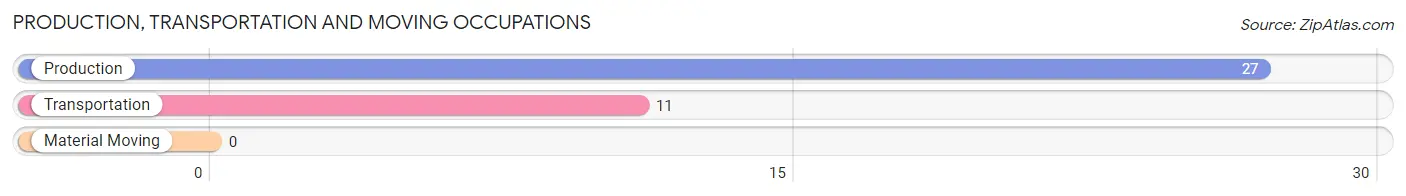
Production, Transportation and Moving Occupations
The most common Production, Transportation and Moving occupations in Sheatown are Production (27 | 12.4%), and Transportation (11 | 5.1%).
Production, Transportation and Moving Occupations by Sex
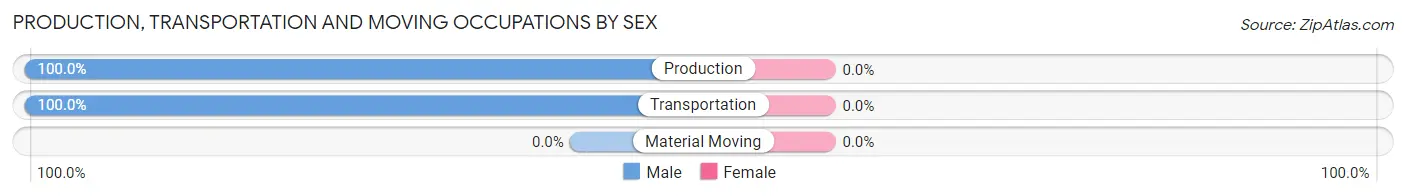
| Occupation | Male | Female |
| Production | 27 (100.0%) | 0 (0.0%) |
| Transportation | 11 (100.0%) | 0 (0.0%) |
| Material Moving | 0 (0.0%) | 0 (0.0%) |
| Total (Category) | 38 (100.0%) | 0 (0.0%) |
| Total (Overall) | 160 (73.7%) | 57 (26.3%) |
Employment Industries by Sex in Sheatown
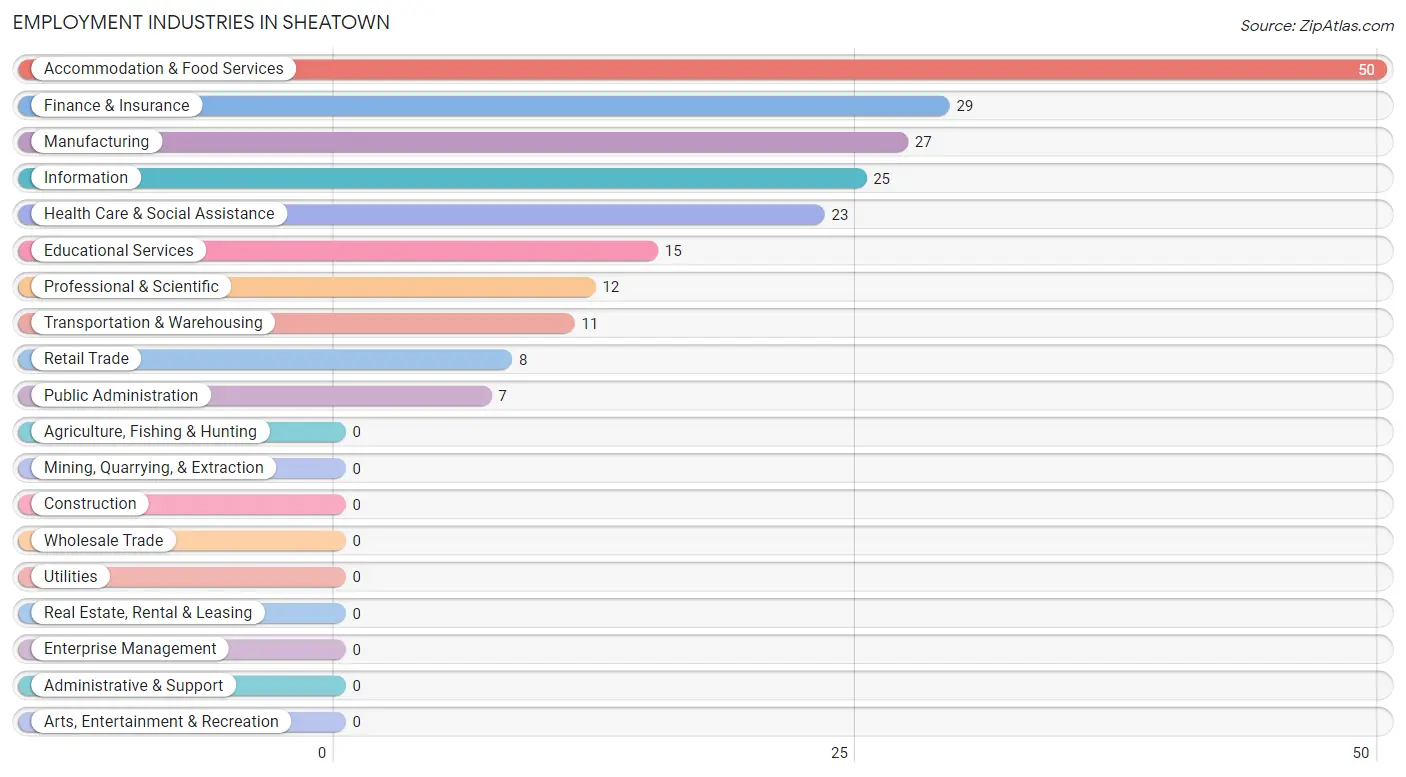
Employment Industries in Sheatown
The major employment industries in Sheatown include Accommodation & Food Services (50 | 23.0%), Finance & Insurance (29 | 13.4%), Manufacturing (27 | 12.4%), Information (25 | 11.5%), and Health Care & Social Assistance (23 | 10.6%).
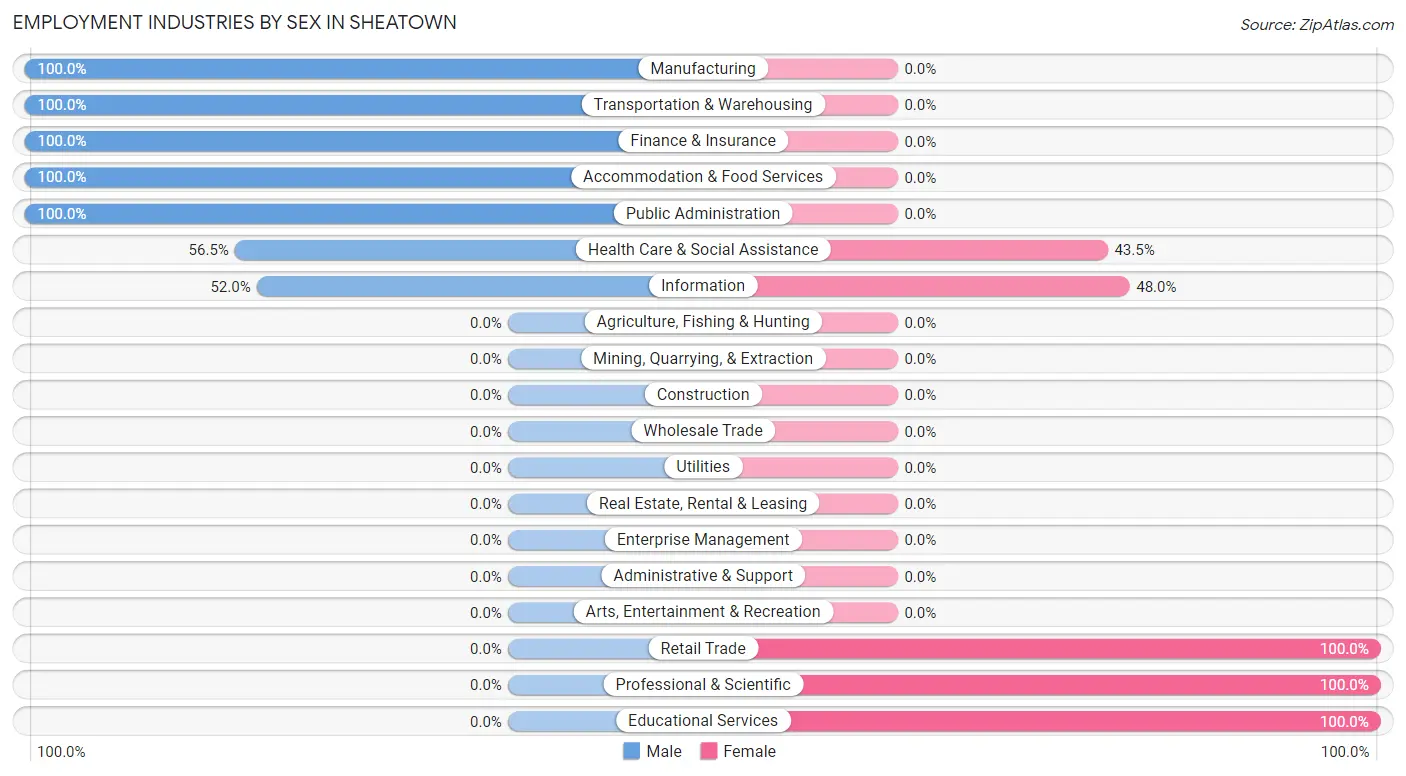
Employment Industries by Sex in Sheatown
The Sheatown industries that see more men than women are Manufacturing (100.0%), Transportation & Warehousing (100.0%), and Finance & Insurance (100.0%), whereas the industries that tend to have a higher number of women are Retail Trade (100.0%), Professional & Scientific (100.0%), and Educational Services (100.0%).
| Industry | Male | Female |
| Agriculture, Fishing & Hunting | 0 (0.0%) | 0 (0.0%) |
| Mining, Quarrying, & Extraction | 0 (0.0%) | 0 (0.0%) |
| Construction | 0 (0.0%) | 0 (0.0%) |
| Manufacturing | 27 (100.0%) | 0 (0.0%) |
| Wholesale Trade | 0 (0.0%) | 0 (0.0%) |
| Retail Trade | 0 (0.0%) | 8 (100.0%) |
| Transportation & Warehousing | 11 (100.0%) | 0 (0.0%) |
| Utilities | 0 (0.0%) | 0 (0.0%) |
| Information | 13 (52.0%) | 12 (48.0%) |
| Finance & Insurance | 29 (100.0%) | 0 (0.0%) |
| Real Estate, Rental & Leasing | 0 (0.0%) | 0 (0.0%) |
| Professional & Scientific | 0 (0.0%) | 12 (100.0%) |
| Enterprise Management | 0 (0.0%) | 0 (0.0%) |
| Administrative & Support | 0 (0.0%) | 0 (0.0%) |
| Educational Services | 0 (0.0%) | 15 (100.0%) |
| Health Care & Social Assistance | 13 (56.5%) | 10 (43.5%) |
| Arts, Entertainment & Recreation | 0 (0.0%) | 0 (0.0%) |
| Accommodation & Food Services | 50 (100.0%) | 0 (0.0%) |
| Public Administration | 7 (100.0%) | 0 (0.0%) |
| Total | 160 (73.7%) | 57 (26.3%) |
Education in Sheatown
School Enrollment in Sheatown
The most common levels of schooling among the 138 students in Sheatown are middle school (52 | 37.7%), college / undergraduate (50 | 36.2%), and kindergarten (12 | 8.7%).
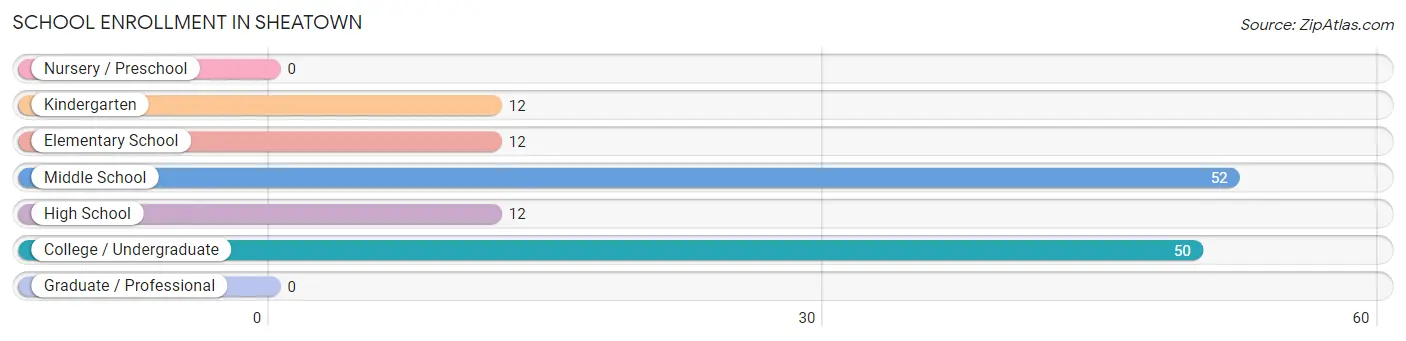
| School Level | # Students | % Students |
| Nursery / Preschool | 0 | 0.0% |
| Kindergarten | 12 | 8.7% |
| Elementary School | 12 | 8.7% |
| Middle School | 52 | 37.7% |
| High School | 12 | 8.7% |
| College / Undergraduate | 50 | 36.2% |
| Graduate / Professional | 0 | 0.0% |
| Total | 138 | 100.0% |
School Enrollment by Age by Funding Source in Sheatown
Out of a total of 138 students who are enrolled in schools in Sheatown, 36 (26.1%) attend a private institution, while the remaining 102 (73.9%) are enrolled in public schools. The age group of 5 to 9 year old has the highest likelihood of being enrolled in private schools, with 24 (100.0% in the age bracket) enrolled. Conversely, the age group of 10 to 14 year olds has the lowest likelihood of being enrolled in a private school, with 52 (100.0% in the age bracket) attending a public institution.
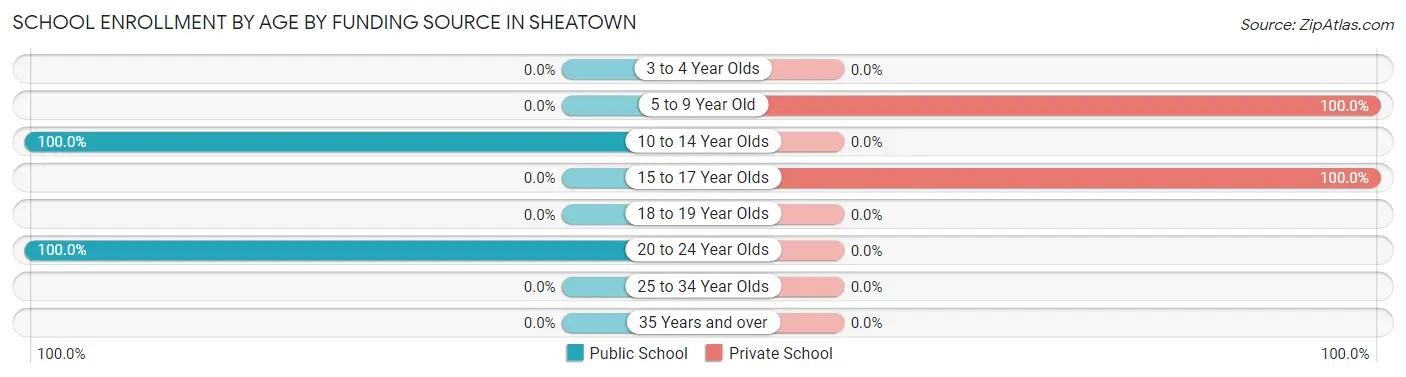
| Age Bracket | Public School | Private School |
| 3 to 4 Year Olds | 0 (0.0%) | 0 (0.0%) |
| 5 to 9 Year Old | 0 (0.0%) | 24 (100.0%) |
| 10 to 14 Year Olds | 52 (100.0%) | 0 (0.0%) |
| 15 to 17 Year Olds | 0 (0.0%) | 12 (100.0%) |
| 18 to 19 Year Olds | 0 (0.0%) | 0 (0.0%) |
| 20 to 24 Year Olds | 50 (100.0%) | 0 (0.0%) |
| 25 to 34 Year Olds | 0 (0.0%) | 0 (0.0%) |
| 35 Years and over | 0 (0.0%) | 0 (0.0%) |
| Total | 102 (73.9%) | 36 (26.1%) |
Educational Attainment by Field of Study in Sheatown
Computers & mathematics (33 | 22.9%), education (31 | 21.5%), arts & humanities (24 | 16.7%), psychology (18 | 12.5%), and bio, nature & agricultural (17 | 11.8%) are the most common fields of study among 144 individuals in Sheatown who have obtained a bachelor's degree or higher.
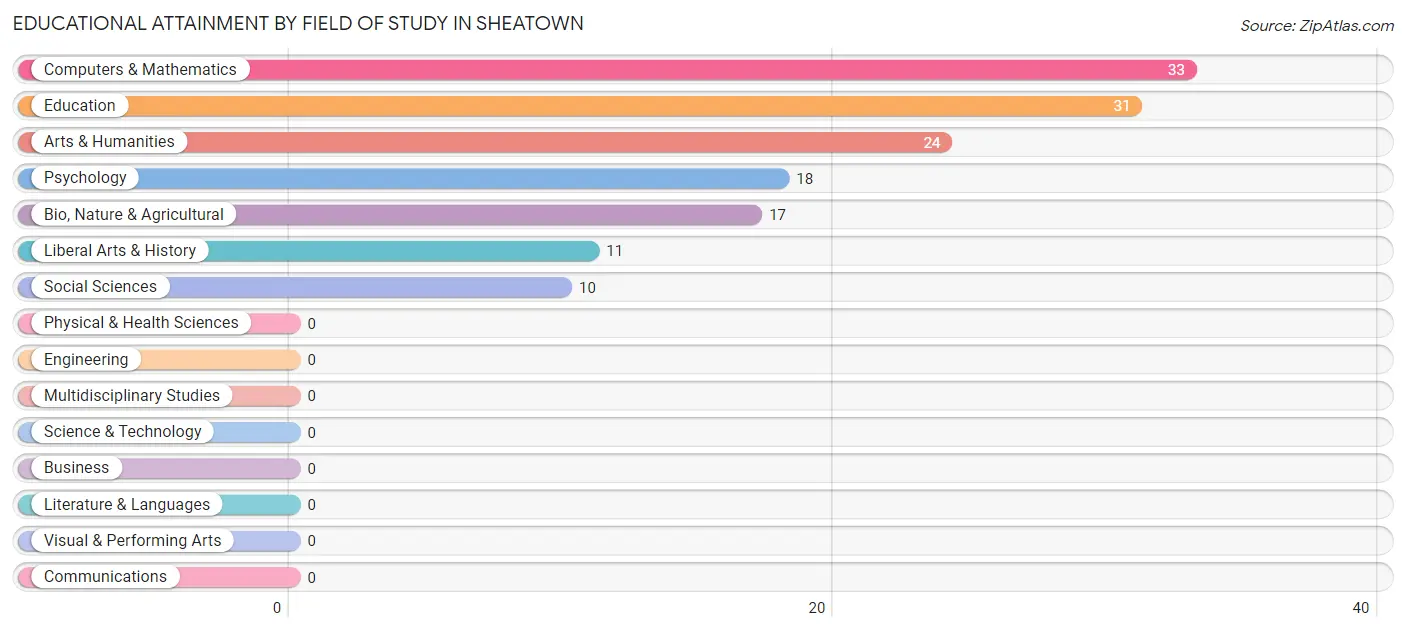
| Field of Study | # Graduates | % Graduates |
| Computers & Mathematics | 33 | 22.9% |
| Bio, Nature & Agricultural | 17 | 11.8% |
| Physical & Health Sciences | 0 | 0.0% |
| Psychology | 18 | 12.5% |
| Social Sciences | 10 | 6.9% |
| Engineering | 0 | 0.0% |
| Multidisciplinary Studies | 0 | 0.0% |
| Science & Technology | 0 | 0.0% |
| Business | 0 | 0.0% |
| Education | 31 | 21.5% |
| Literature & Languages | 0 | 0.0% |
| Liberal Arts & History | 11 | 7.6% |
| Visual & Performing Arts | 0 | 0.0% |
| Communications | 0 | 0.0% |
| Arts & Humanities | 24 | 16.7% |
| Total | 144 | 100.0% |
Transportation & Commute in Sheatown
Vehicle Availability by Sex in Sheatown
The most prevalent vehicle ownership categories in Sheatown are males with no vehicle (98, accounting for 61.3%) and females with no vehicle (0, making up 171.9%).
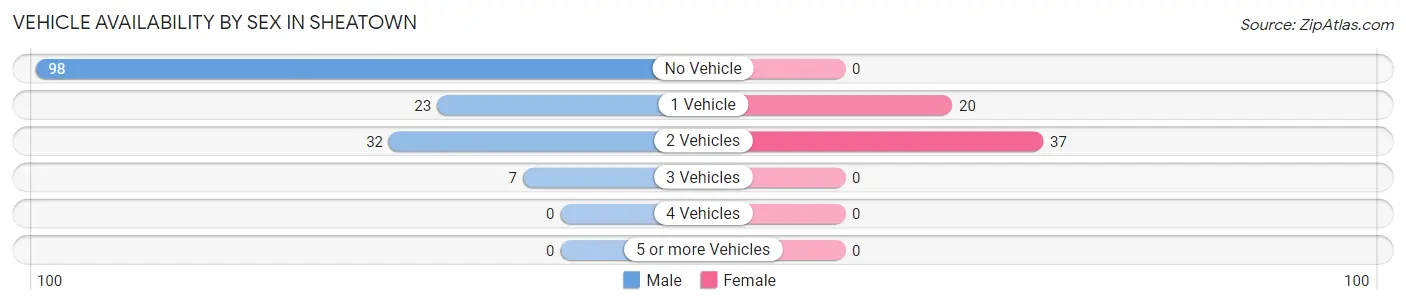
| Vehicles Available | Male | Female |
| No Vehicle | 98 (61.3%) | 0 (0.0%) |
| 1 Vehicle | 23 (14.4%) | 20 (35.1%) |
| 2 Vehicles | 32 (20.0%) | 37 (64.9%) |
| 3 Vehicles | 7 (4.4%) | 0 (0.0%) |
| 4 Vehicles | 0 (0.0%) | 0 (0.0%) |
| 5 or more Vehicles | 0 (0.0%) | 0 (0.0%) |
| Total | 160 (100.0%) | 57 (100.0%) |
Commute Time in Sheatown
The most frequently occuring commute durations in Sheatown are 25 to 29 minutes (50 commuters, 27.8%), 20 to 24 minutes (29 commuters, 16.1%), and 90 or more minutes (29 commuters, 16.1%).
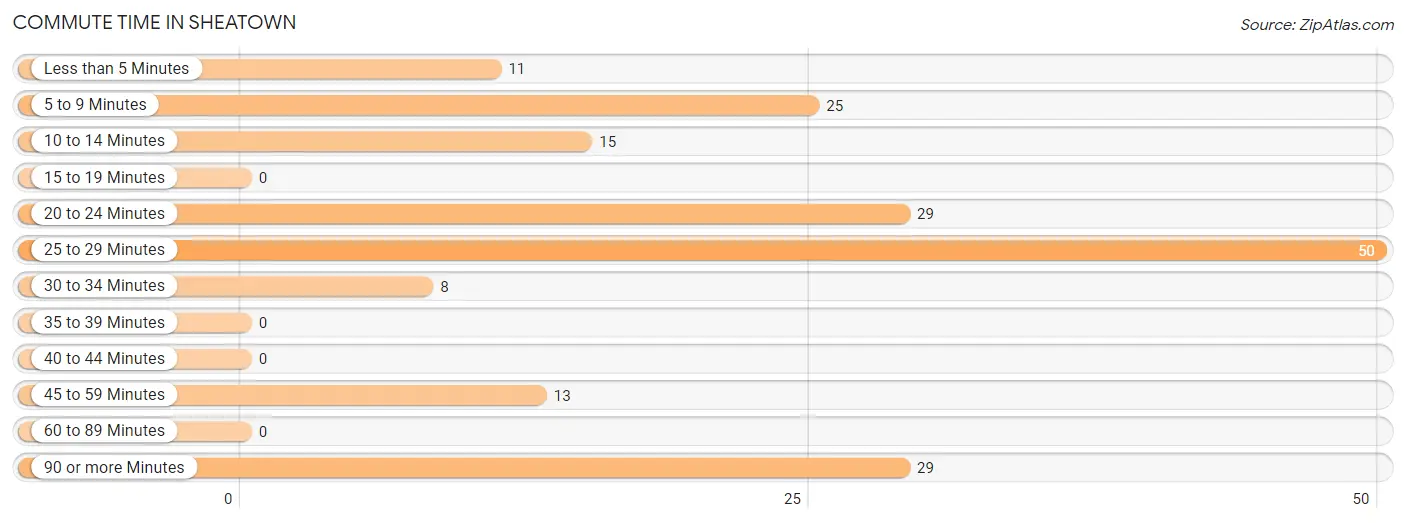
| Commute Time | # Commuters | % Commuters |
| Less than 5 Minutes | 11 | 6.1% |
| 5 to 9 Minutes | 25 | 13.9% |
| 10 to 14 Minutes | 15 | 8.3% |
| 15 to 19 Minutes | 0 | 0.0% |
| 20 to 24 Minutes | 29 | 16.1% |
| 25 to 29 Minutes | 50 | 27.8% |
| 30 to 34 Minutes | 8 | 4.4% |
| 35 to 39 Minutes | 0 | 0.0% |
| 40 to 44 Minutes | 0 | 0.0% |
| 45 to 59 Minutes | 13 | 7.2% |
| 60 to 89 Minutes | 0 | 0.0% |
| 90 or more Minutes | 29 | 16.1% |
Commute Time by Sex in Sheatown
The most common commute times in Sheatown are 25 to 29 minutes (50 commuters, 34.0%) for males and 5 to 9 minutes (25 commuters, 75.8%) for females.
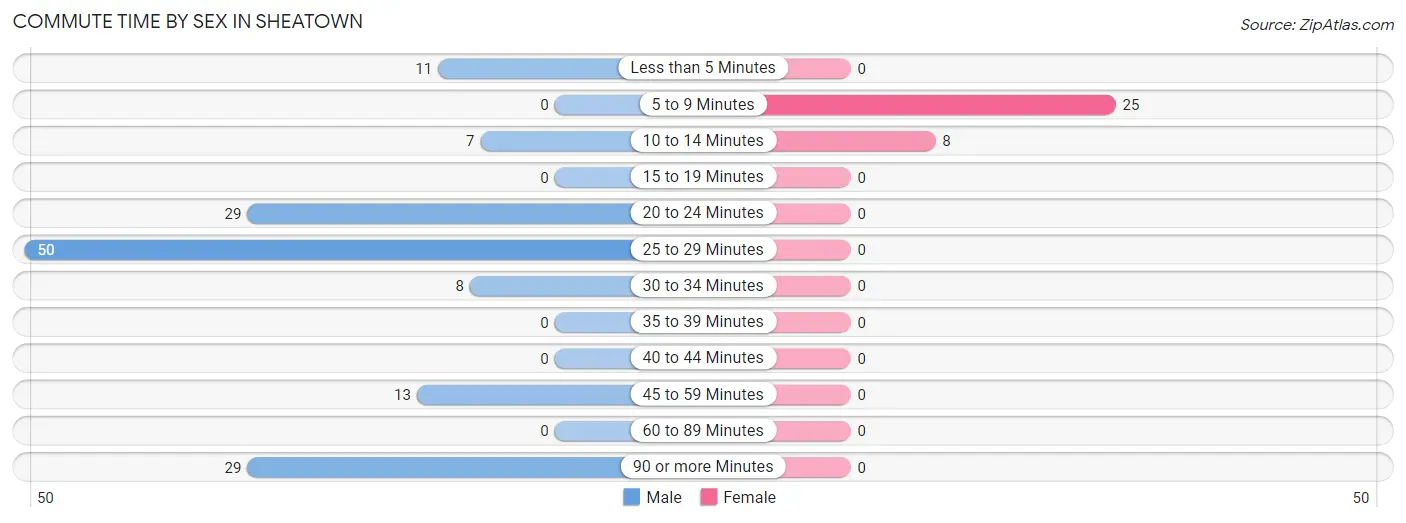
| Commute Time | Male | Female |
| Less than 5 Minutes | 11 (7.5%) | 0 (0.0%) |
| 5 to 9 Minutes | 0 (0.0%) | 25 (75.8%) |
| 10 to 14 Minutes | 7 (4.8%) | 8 (24.2%) |
| 15 to 19 Minutes | 0 (0.0%) | 0 (0.0%) |
| 20 to 24 Minutes | 29 (19.7%) | 0 (0.0%) |
| 25 to 29 Minutes | 50 (34.0%) | 0 (0.0%) |
| 30 to 34 Minutes | 8 (5.4%) | 0 (0.0%) |
| 35 to 39 Minutes | 0 (0.0%) | 0 (0.0%) |
| 40 to 44 Minutes | 0 (0.0%) | 0 (0.0%) |
| 45 to 59 Minutes | 13 (8.8%) | 0 (0.0%) |
| 60 to 89 Minutes | 0 (0.0%) | 0 (0.0%) |
| 90 or more Minutes | 29 (19.7%) | 0 (0.0%) |
Time of Departure to Work by Sex in Sheatown
The most frequent times of departure to work in Sheatown are 12:00 AM to 4:59 AM (50, 34.0%) for males and 6:30 AM to 6:59 AM (17, 51.5%) for females.
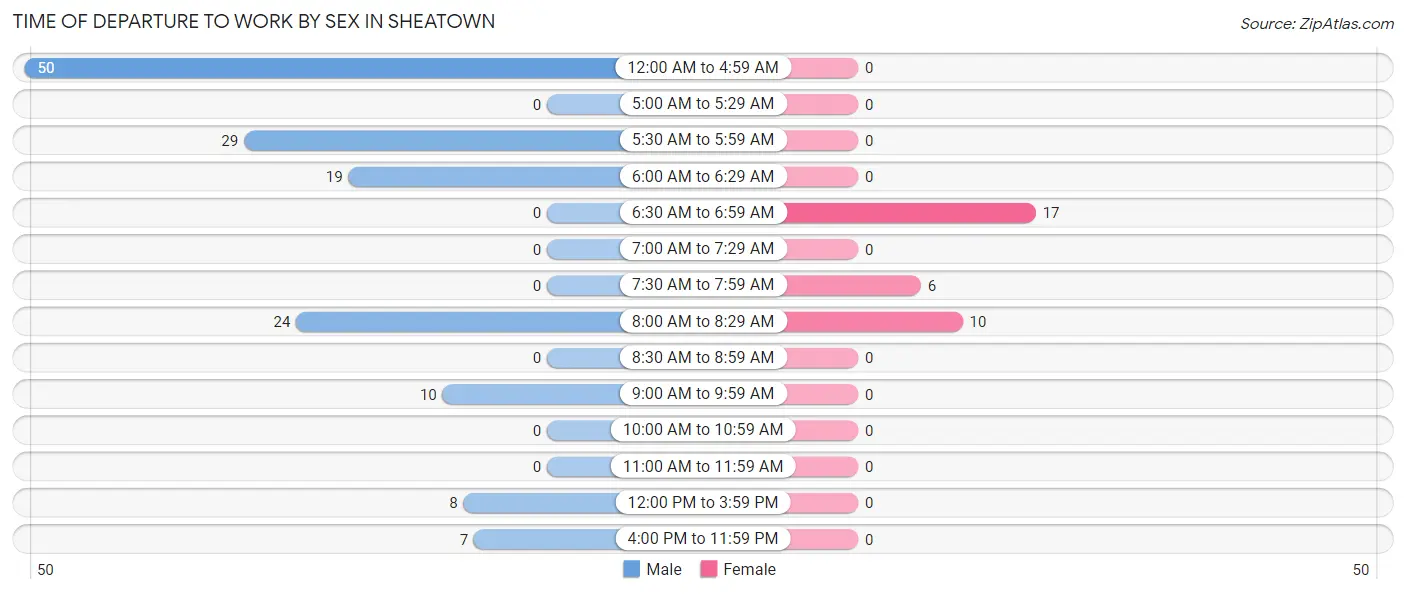
| Time of Departure | Male | Female |
| 12:00 AM to 4:59 AM | 50 (34.0%) | 0 (0.0%) |
| 5:00 AM to 5:29 AM | 0 (0.0%) | 0 (0.0%) |
| 5:30 AM to 5:59 AM | 29 (19.7%) | 0 (0.0%) |
| 6:00 AM to 6:29 AM | 19 (12.9%) | 0 (0.0%) |
| 6:30 AM to 6:59 AM | 0 (0.0%) | 17 (51.5%) |
| 7:00 AM to 7:29 AM | 0 (0.0%) | 0 (0.0%) |
| 7:30 AM to 7:59 AM | 0 (0.0%) | 6 (18.2%) |
| 8:00 AM to 8:29 AM | 24 (16.3%) | 10 (30.3%) |
| 8:30 AM to 8:59 AM | 0 (0.0%) | 0 (0.0%) |
| 9:00 AM to 9:59 AM | 10 (6.8%) | 0 (0.0%) |
| 10:00 AM to 10:59 AM | 0 (0.0%) | 0 (0.0%) |
| 11:00 AM to 11:59 AM | 0 (0.0%) | 0 (0.0%) |
| 12:00 PM to 3:59 PM | 8 (5.4%) | 0 (0.0%) |
| 4:00 PM to 11:59 PM | 7 (4.8%) | 0 (0.0%) |
| Total | 147 (100.0%) | 33 (100.0%) |
Housing Occupancy in Sheatown
Occupancy by Ownership in Sheatown
Of the total 256 dwellings in Sheatown, owner-occupied units account for 159 (62.1%), while renter-occupied units make up 97 (37.9%).
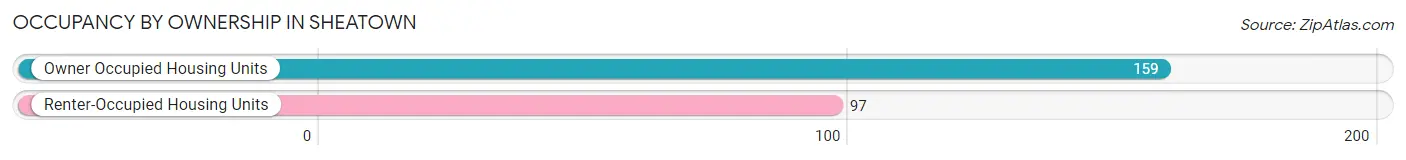
| Occupancy | # Housing Units | % Housing Units |
| Owner Occupied Housing Units | 159 | 62.1% |
| Renter-Occupied Housing Units | 97 | 37.9% |
| Total Occupied Housing Units | 256 | 100.0% |
Occupancy by Household Size in Sheatown
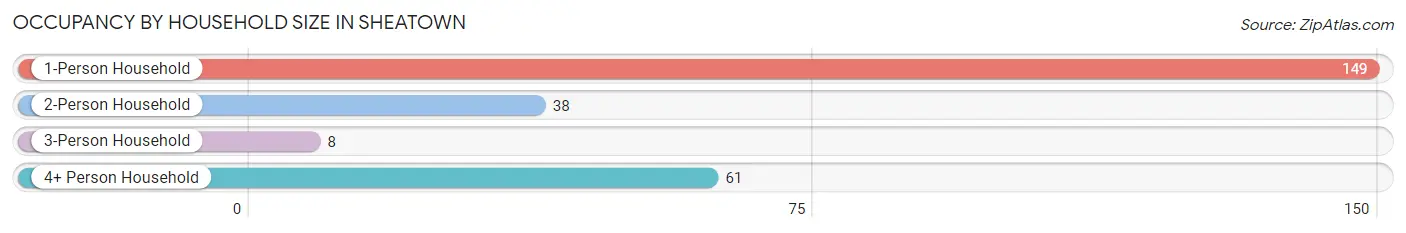
| Household Size | # Housing Units | % Housing Units |
| 1-Person Household | 149 | 58.2% |
| 2-Person Household | 38 | 14.8% |
| 3-Person Household | 8 | 3.1% |
| 4+ Person Household | 61 | 23.8% |
| Total Housing Units | 256 | 100.0% |
Occupancy by Ownership by Household Size in Sheatown
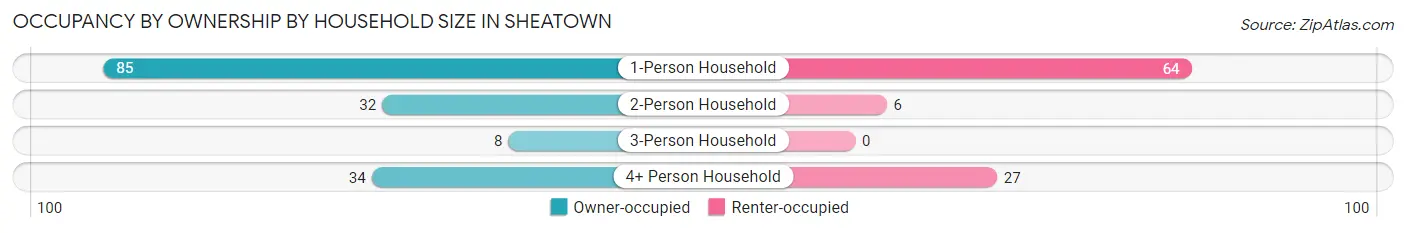
| Household Size | Owner-occupied | Renter-occupied |
| 1-Person Household | 85 (57.1%) | 64 (42.9%) |
| 2-Person Household | 32 (84.2%) | 6 (15.8%) |
| 3-Person Household | 8 (100.0%) | 0 (0.0%) |
| 4+ Person Household | 34 (55.7%) | 27 (44.3%) |
| Total Housing Units | 159 (62.1%) | 97 (37.9%) |
Occupancy by Educational Attainment in Sheatown
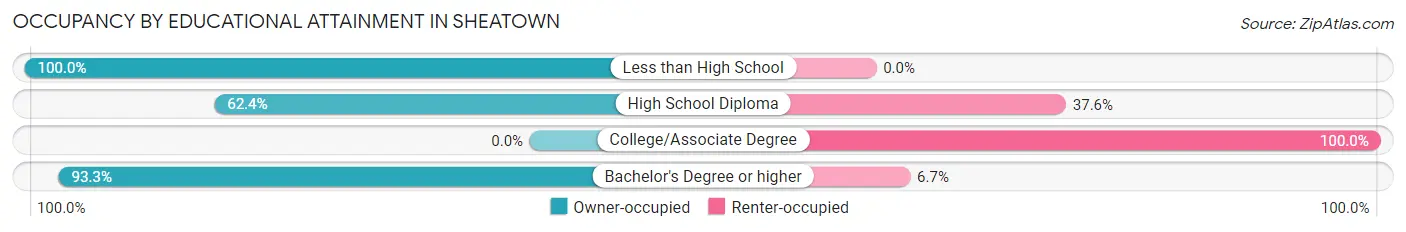
| Household Size | Owner-occupied | Renter-occupied |
| Less than High School | 8 (100.0%) | 0 (0.0%) |
| High School Diploma | 68 (62.4%) | 41 (37.6%) |
| College/Associate Degree | 0 (0.0%) | 50 (100.0%) |
| Bachelor's Degree or higher | 83 (93.3%) | 6 (6.7%) |
Occupancy by Age of Householder in Sheatown
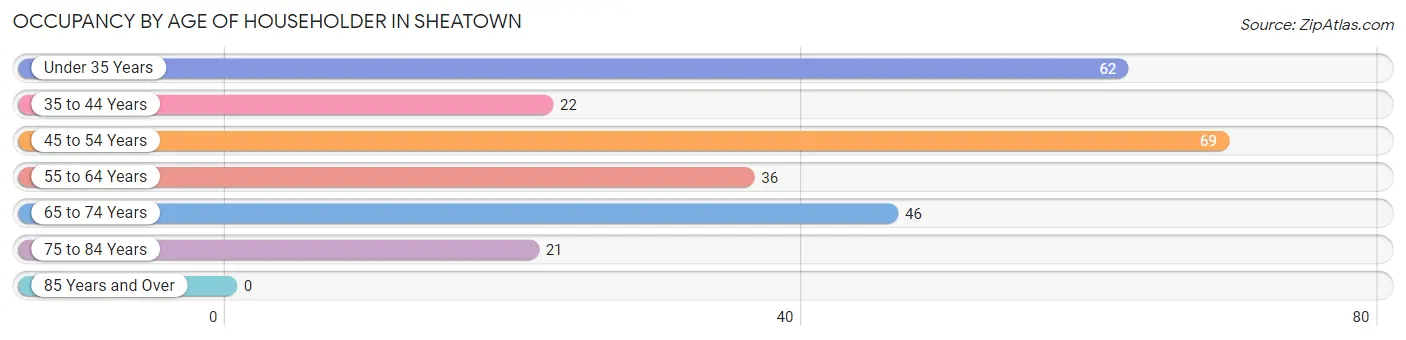
| Age Bracket | # Households | % Households |
| Under 35 Years | 62 | 24.2% |
| 35 to 44 Years | 22 | 8.6% |
| 45 to 54 Years | 69 | 27.0% |
| 55 to 64 Years | 36 | 14.1% |
| 65 to 74 Years | 46 | 18.0% |
| 75 to 84 Years | 21 | 8.2% |
| 85 Years and Over | 0 | 0.0% |
| Total | 256 | 100.0% |
Housing Finances in Sheatown
Median Income by Occupancy in Sheatown
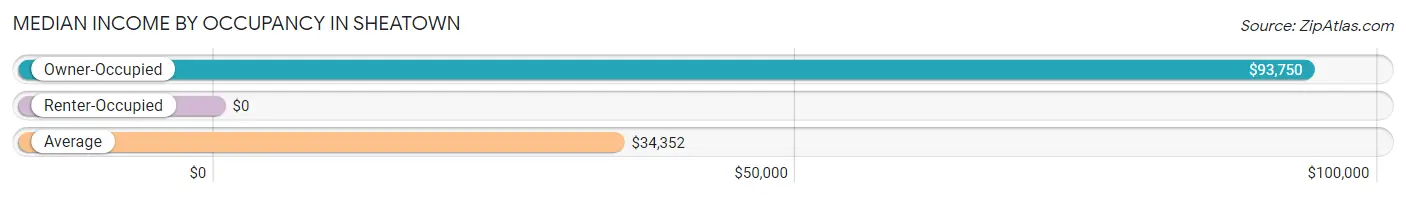
| Occupancy Type | # Households | Median Income |
| Owner-Occupied | 159 (62.1%) | $93,750 |
| Renter-Occupied | 97 (37.9%) | $0 |
| Average | 256 (100.0%) | $34,352 |
Occupancy by Householder Income Bracket in Sheatown
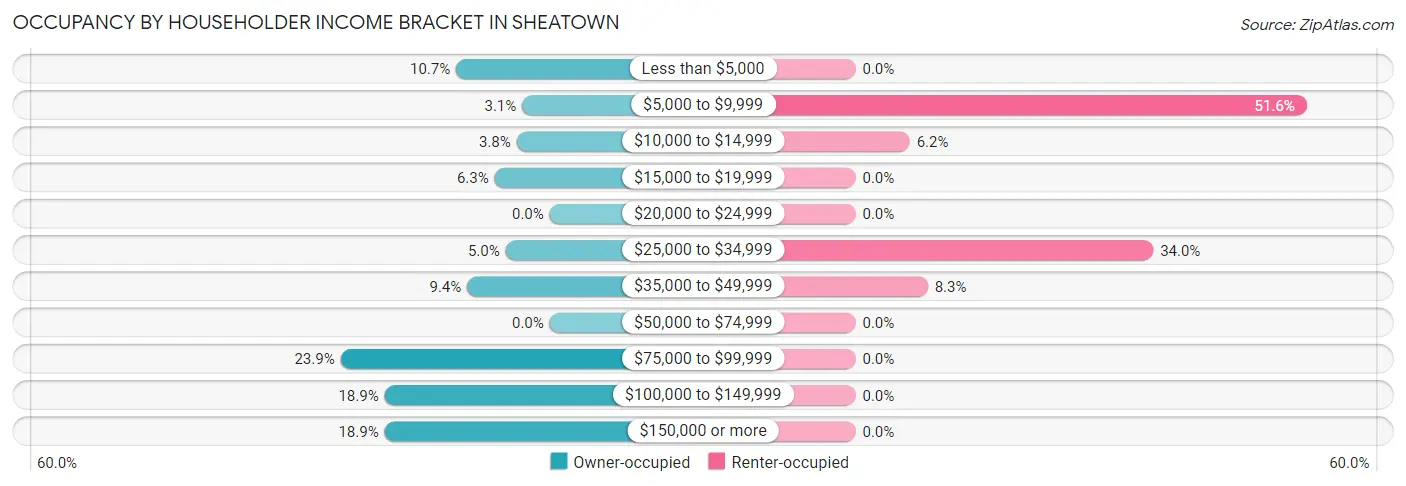
| Income Bracket | Owner-occupied | Renter-occupied |
| Less than $5,000 | 17 (10.7%) | 0 (0.0%) |
| $5,000 to $9,999 | 5 (3.1%) | 50 (51.5%) |
| $10,000 to $14,999 | 6 (3.8%) | 6 (6.2%) |
| $15,000 to $19,999 | 10 (6.3%) | 0 (0.0%) |
| $20,000 to $24,999 | 0 (0.0%) | 0 (0.0%) |
| $25,000 to $34,999 | 8 (5.0%) | 33 (34.0%) |
| $35,000 to $49,999 | 15 (9.4%) | 8 (8.3%) |
| $50,000 to $74,999 | 0 (0.0%) | 0 (0.0%) |
| $75,000 to $99,999 | 38 (23.9%) | 0 (0.0%) |
| $100,000 to $149,999 | 30 (18.9%) | 0 (0.0%) |
| $150,000 or more | 30 (18.9%) | 0 (0.0%) |
| Total | 159 (100.0%) | 97 (100.0%) |
Monthly Housing Cost Tiers in Sheatown
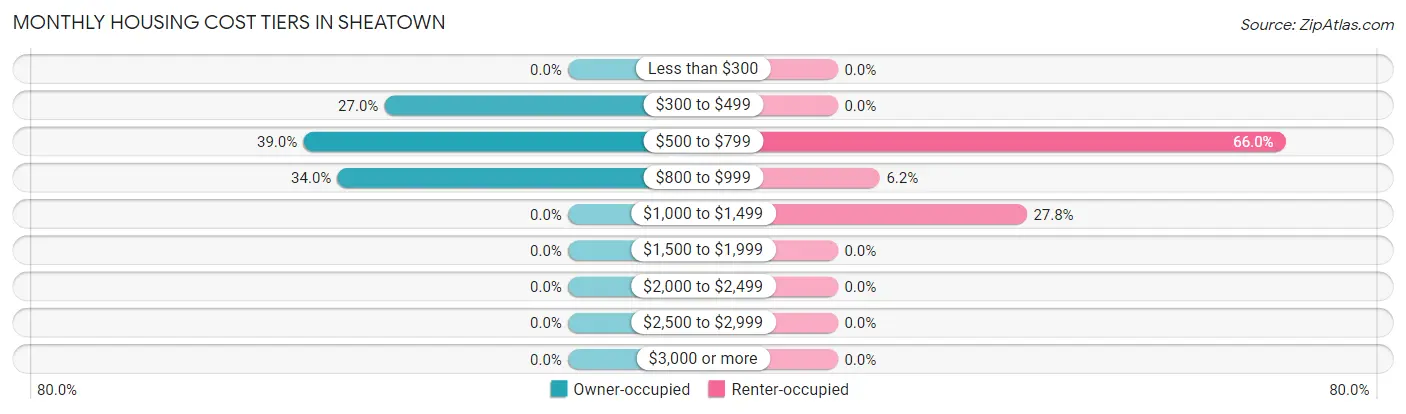
| Monthly Cost | Owner-occupied | Renter-occupied |
| Less than $300 | 0 (0.0%) | 0 (0.0%) |
| $300 to $499 | 43 (27.0%) | 0 (0.0%) |
| $500 to $799 | 62 (39.0%) | 64 (66.0%) |
| $800 to $999 | 54 (34.0%) | 6 (6.2%) |
| $1,000 to $1,499 | 0 (0.0%) | 27 (27.8%) |
| $1,500 to $1,999 | 0 (0.0%) | 0 (0.0%) |
| $2,000 to $2,499 | 0 (0.0%) | 0 (0.0%) |
| $2,500 to $2,999 | 0 (0.0%) | 0 (0.0%) |
| $3,000 or more | 0 (0.0%) | 0 (0.0%) |
| Total | 159 (100.0%) | 97 (100.0%) |
Physical Housing Characteristics in Sheatown
Housing Structures in Sheatown
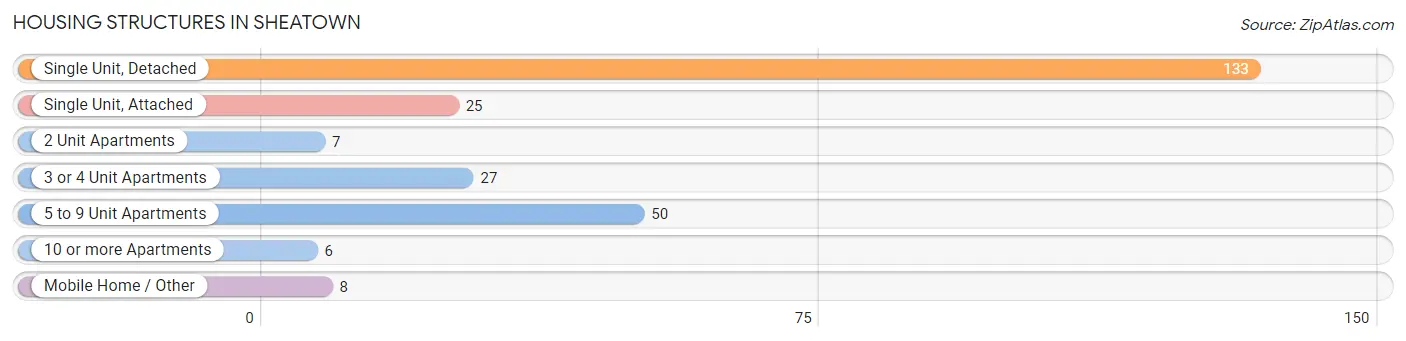
| Structure Type | # Housing Units | % Housing Units |
| Single Unit, Detached | 133 | 51.9% |
| Single Unit, Attached | 25 | 9.8% |
| 2 Unit Apartments | 7 | 2.7% |
| 3 or 4 Unit Apartments | 27 | 10.5% |
| 5 to 9 Unit Apartments | 50 | 19.5% |
| 10 or more Apartments | 6 | 2.3% |
| Mobile Home / Other | 8 | 3.1% |
| Total | 256 | 100.0% |
Housing Structures by Occupancy in Sheatown
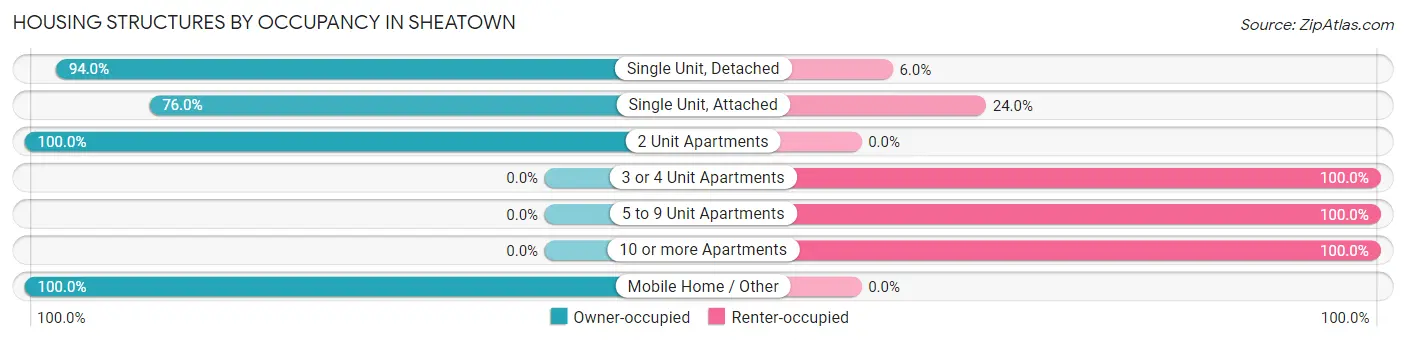
| Structure Type | Owner-occupied | Renter-occupied |
| Single Unit, Detached | 125 (94.0%) | 8 (6.0%) |
| Single Unit, Attached | 19 (76.0%) | 6 (24.0%) |
| 2 Unit Apartments | 7 (100.0%) | 0 (0.0%) |
| 3 or 4 Unit Apartments | 0 (0.0%) | 27 (100.0%) |
| 5 to 9 Unit Apartments | 0 (0.0%) | 50 (100.0%) |
| 10 or more Apartments | 0 (0.0%) | 6 (100.0%) |
| Mobile Home / Other | 8 (100.0%) | 0 (0.0%) |
| Total | 159 (62.1%) | 97 (37.9%) |
Housing Structures by Number of Rooms in Sheatown
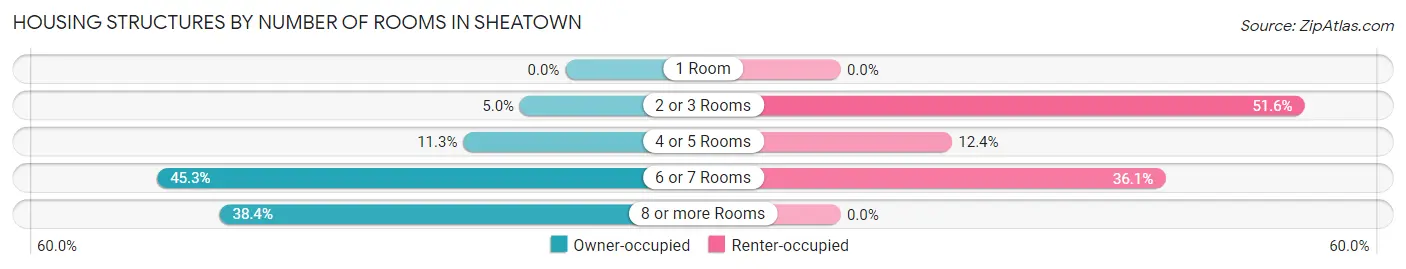
| Number of Rooms | Owner-occupied | Renter-occupied |
| 1 Room | 0 (0.0%) | 0 (0.0%) |
| 2 or 3 Rooms | 8 (5.0%) | 50 (51.5%) |
| 4 or 5 Rooms | 18 (11.3%) | 12 (12.4%) |
| 6 or 7 Rooms | 72 (45.3%) | 35 (36.1%) |
| 8 or more Rooms | 61 (38.4%) | 0 (0.0%) |
| Total | 159 (100.0%) | 97 (100.0%) |
Housing Structure by Heating Type in Sheatown
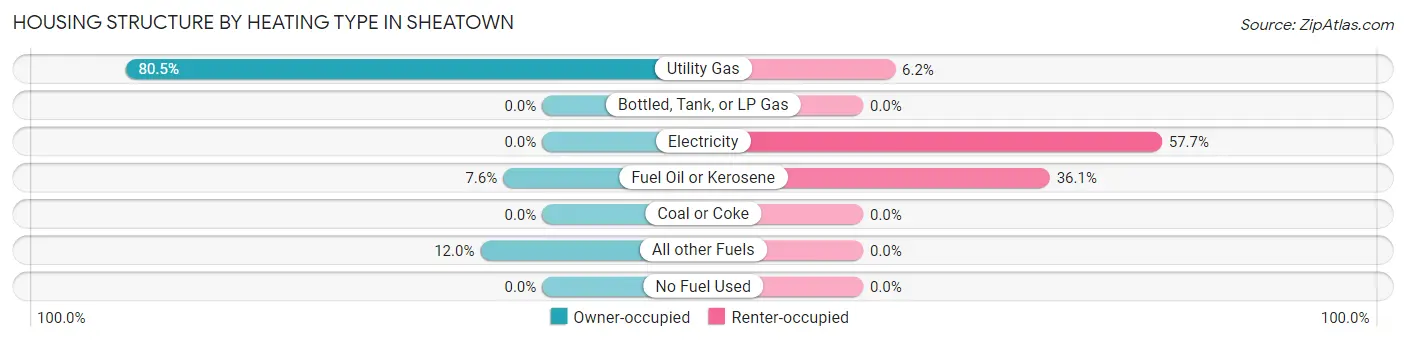
| Heating Type | Owner-occupied | Renter-occupied |
| Utility Gas | 128 (80.5%) | 6 (6.2%) |
| Bottled, Tank, or LP Gas | 0 (0.0%) | 0 (0.0%) |
| Electricity | 0 (0.0%) | 56 (57.7%) |
| Fuel Oil or Kerosene | 12 (7.5%) | 35 (36.1%) |
| Coal or Coke | 0 (0.0%) | 0 (0.0%) |
| All other Fuels | 19 (11.9%) | 0 (0.0%) |
| No Fuel Used | 0 (0.0%) | 0 (0.0%) |
| Total | 159 (100.0%) | 97 (100.0%) |
Household Vehicle Usage in Sheatown
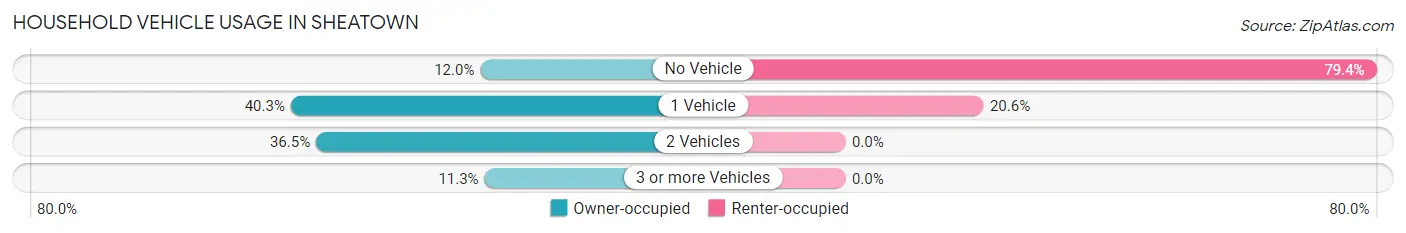
| Vehicles per Household | Owner-occupied | Renter-occupied |
| No Vehicle | 19 (11.9%) | 77 (79.4%) |
| 1 Vehicle | 64 (40.3%) | 20 (20.6%) |
| 2 Vehicles | 58 (36.5%) | 0 (0.0%) |
| 3 or more Vehicles | 18 (11.3%) | 0 (0.0%) |
| Total | 159 (100.0%) | 97 (100.0%) |
Real Estate & Mortgages in Sheatown
Real Estate and Mortgage Overview in Sheatown
| Characteristic | Without Mortgage | With Mortgage |
| Housing Units | 95 | 64 |
| Median Property Value | $113,400 | $0 |
| Median Household Income | - | - |
| Monthly Housing Costs | $518 | $0 |
| Real Estate Taxes | $1,307 | $0 |
Property Value by Mortgage Status in Sheatown
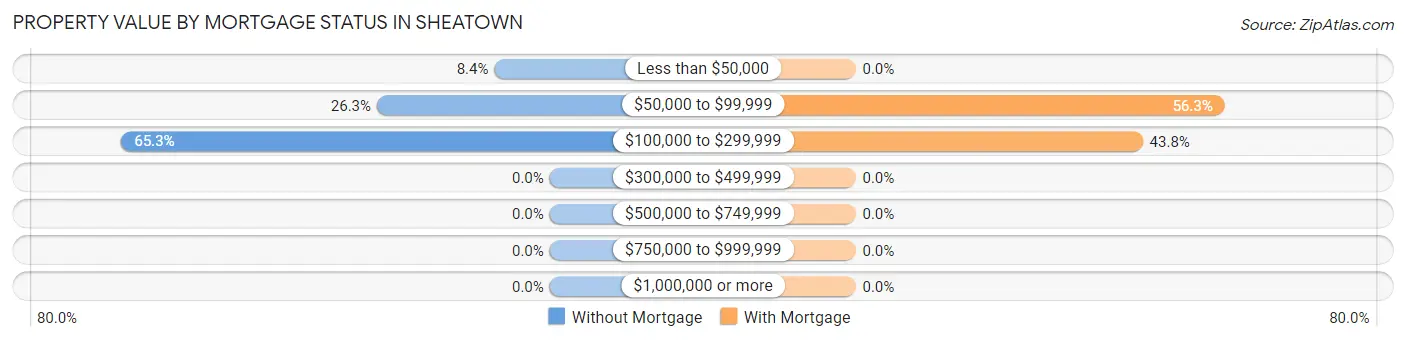
| Property Value | Without Mortgage | With Mortgage |
| Less than $50,000 | 8 (8.4%) | 0 (0.0%) |
| $50,000 to $99,999 | 25 (26.3%) | 36 (56.2%) |
| $100,000 to $299,999 | 62 (65.3%) | 28 (43.8%) |
| $300,000 to $499,999 | 0 (0.0%) | 0 (0.0%) |
| $500,000 to $749,999 | 0 (0.0%) | 0 (0.0%) |
| $750,000 to $999,999 | 0 (0.0%) | 0 (0.0%) |
| $1,000,000 or more | 0 (0.0%) | 0 (0.0%) |
| Total | 95 (100.0%) | 64 (100.0%) |
Household Income by Mortgage Status in Sheatown
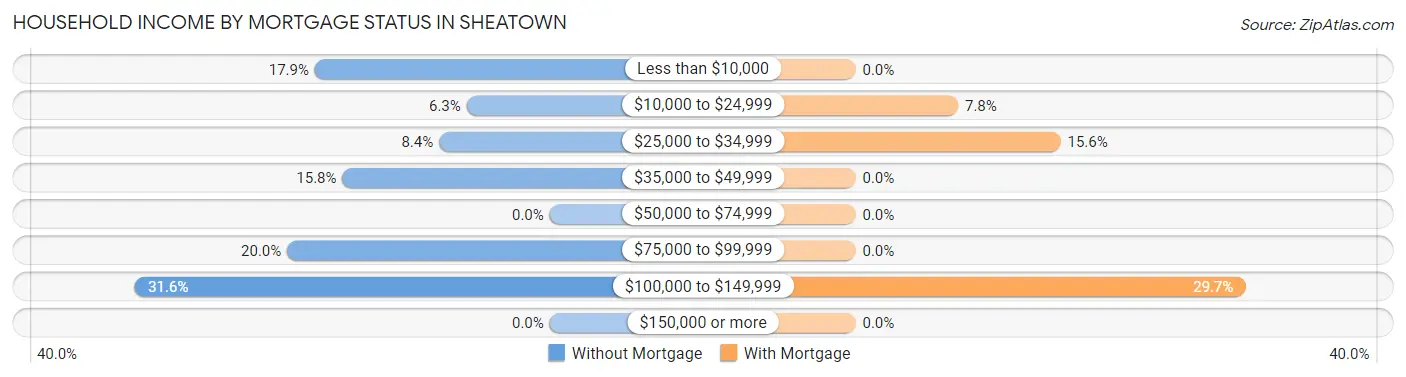
| Household Income | Without Mortgage | With Mortgage |
| Less than $10,000 | 17 (17.9%) | 0 (0.0%) |
| $10,000 to $24,999 | 6 (6.3%) | 5 (7.8%) |
| $25,000 to $34,999 | 8 (8.4%) | 10 (15.6%) |
| $35,000 to $49,999 | 15 (15.8%) | 0 (0.0%) |
| $50,000 to $74,999 | 0 (0.0%) | 0 (0.0%) |
| $75,000 to $99,999 | 19 (20.0%) | 0 (0.0%) |
| $100,000 to $149,999 | 30 (31.6%) | 19 (29.7%) |
| $150,000 or more | 0 (0.0%) | 0 (0.0%) |
| Total | 95 (100.0%) | 64 (100.0%) |
Property Value to Household Income Ratio in Sheatown
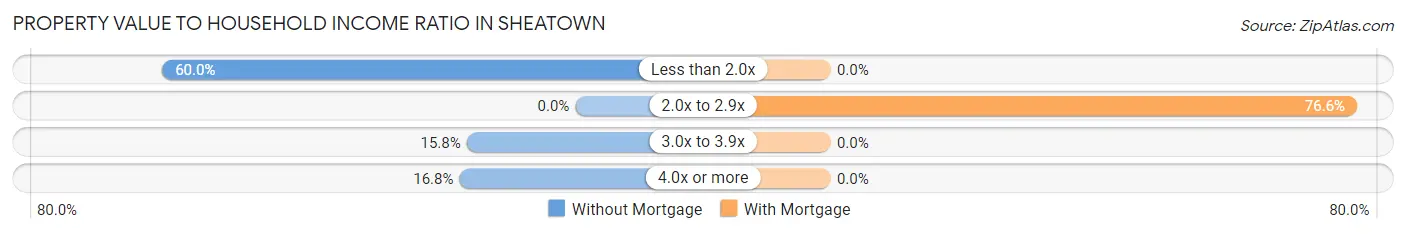
| Value-to-Income Ratio | Without Mortgage | With Mortgage |
| Less than 2.0x | 57 (60.0%) | 0 (0.0%) |
| 2.0x to 2.9x | 0 (0.0%) | 49 (76.6%) |
| 3.0x to 3.9x | 15 (15.8%) | 0 (0.0%) |
| 4.0x or more | 16 (16.8%) | 0 (0.0%) |
| Total | 95 (100.0%) | 64 (100.0%) |
Real Estate Taxes by Mortgage Status in Sheatown
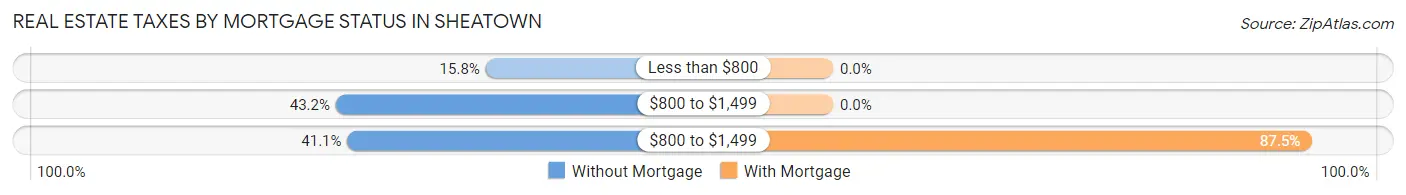
| Property Taxes | Without Mortgage | With Mortgage |
| Less than $800 | 15 (15.8%) | 0 (0.0%) |
| $800 to $1,499 | 41 (43.2%) | 0 (0.0%) |
| $800 to $1,499 | 39 (41.0%) | 56 (87.5%) |
| Total | 95 (100.0%) | 64 (100.0%) |
Health & Disability in Sheatown
Health Insurance Coverage by Age in Sheatown
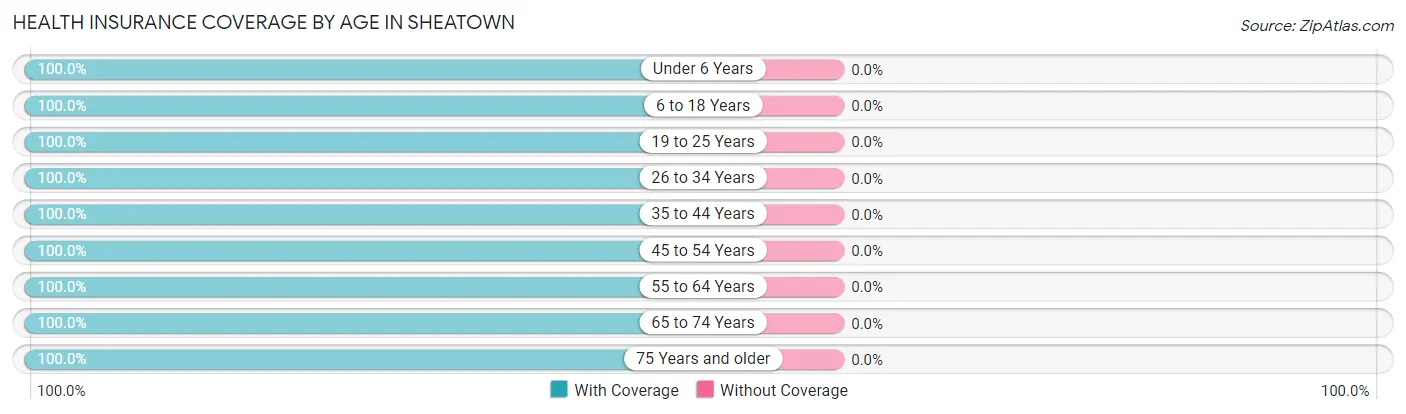
| Age Bracket | With Coverage | Without Coverage |
| Under 6 Years | 49 (100.0%) | 0 (0.0%) |
| 6 to 18 Years | 151 (100.0%) | 0 (0.0%) |
| 19 to 25 Years | 79 (100.0%) | 0 (0.0%) |
| 26 to 34 Years | 25 (100.0%) | 0 (0.0%) |
| 35 to 44 Years | 46 (100.0%) | 0 (0.0%) |
| 45 to 54 Years | 95 (100.0%) | 0 (0.0%) |
| 55 to 64 Years | 43 (100.0%) | 0 (0.0%) |
| 65 to 74 Years | 59 (100.0%) | 0 (0.0%) |
| 75 Years and older | 28 (100.0%) | 0 (0.0%) |
| Total | 575 (100.0%) | 0 (0.0%) |
Health Insurance Coverage by Citizenship Status in Sheatown
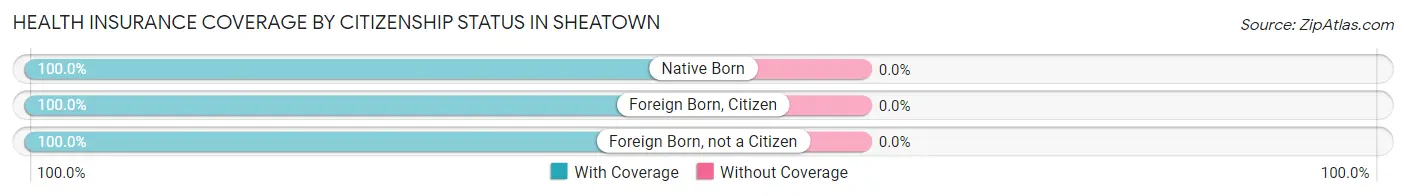
| Citizenship Status | With Coverage | Without Coverage |
| Native Born | 49 (100.0%) | 0 (0.0%) |
| Foreign Born, Citizen | 151 (100.0%) | 0 (0.0%) |
| Foreign Born, not a Citizen | 79 (100.0%) | 0 (0.0%) |
Health Insurance Coverage by Household Income in Sheatown
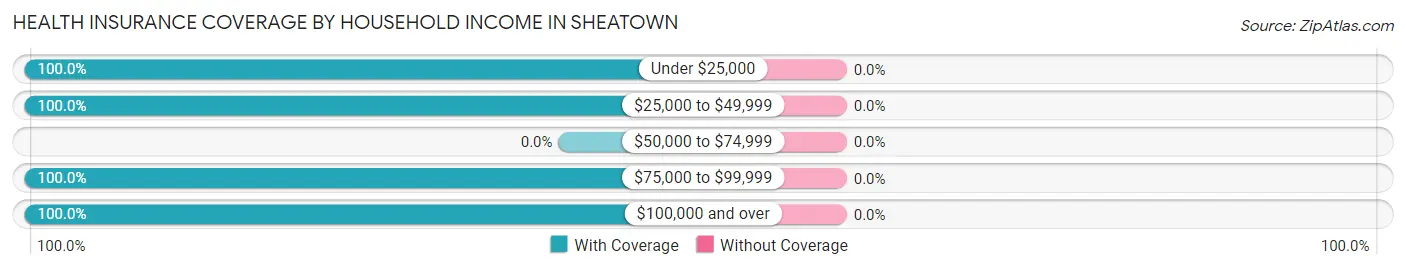
| Household Income | With Coverage | Without Coverage |
| Under $25,000 | 94 (100.0%) | 0 (0.0%) |
| $25,000 to $49,999 | 234 (100.0%) | 0 (0.0%) |
| $50,000 to $74,999 | 0 (0.0%) | 0 (0.0%) |
| $75,000 to $99,999 | 91 (100.0%) | 0 (0.0%) |
| $100,000 and over | 156 (100.0%) | 0 (0.0%) |
Public vs Private Health Insurance Coverage by Age in Sheatown
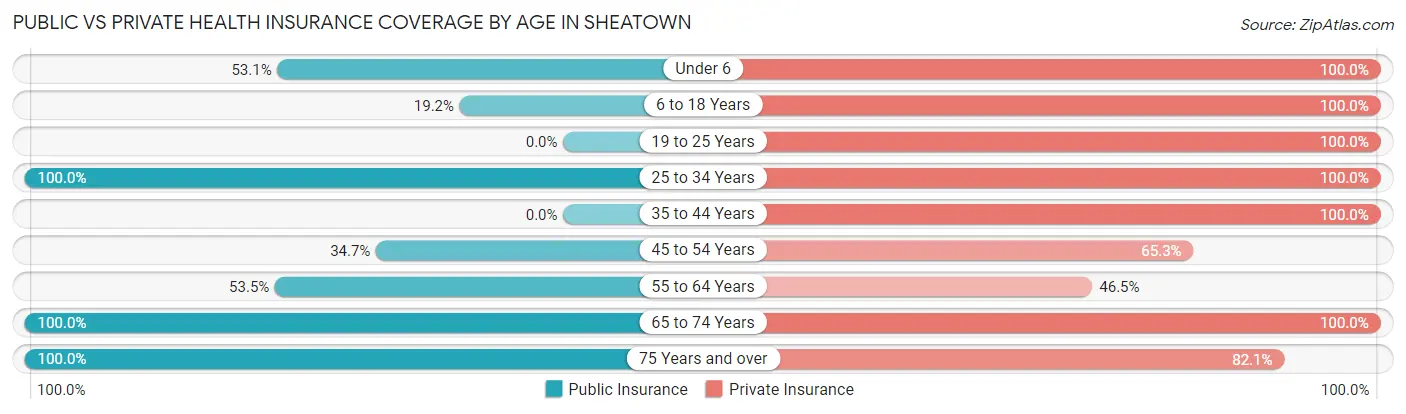
| Age Bracket | Public Insurance | Private Insurance |
| Under 6 | 26 (53.1%) | 49 (100.0%) |
| 6 to 18 Years | 29 (19.2%) | 151 (100.0%) |
| 19 to 25 Years | 0 (0.0%) | 79 (100.0%) |
| 25 to 34 Years | 25 (100.0%) | 25 (100.0%) |
| 35 to 44 Years | 0 (0.0%) | 46 (100.0%) |
| 45 to 54 Years | 33 (34.7%) | 62 (65.3%) |
| 55 to 64 Years | 23 (53.5%) | 20 (46.5%) |
| 65 to 74 Years | 59 (100.0%) | 59 (100.0%) |
| 75 Years and over | 28 (100.0%) | 23 (82.1%) |
| Total | 223 (38.8%) | 514 (89.4%) |
Disability Status by Sex by Age in Sheatown
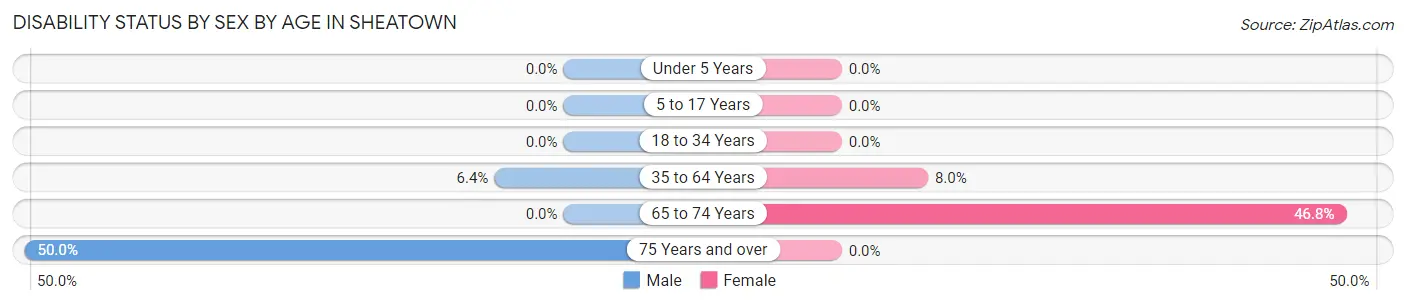
| Age Bracket | Male | Female |
| Under 5 Years | 0 (0.0%) | 0 (0.0%) |
| 5 to 17 Years | 0 (0.0%) | 0 (0.0%) |
| 18 to 34 Years | 0 (0.0%) | 0 (0.0%) |
| 35 to 64 Years | 7 (6.4%) | 6 (8.0%) |
| 65 to 74 Years | 0 (0.0%) | 22 (46.8%) |
| 75 Years and over | 8 (50.0%) | 0 (0.0%) |
Disability Class by Sex by Age in Sheatown
Disability Class: Hearing Difficulty
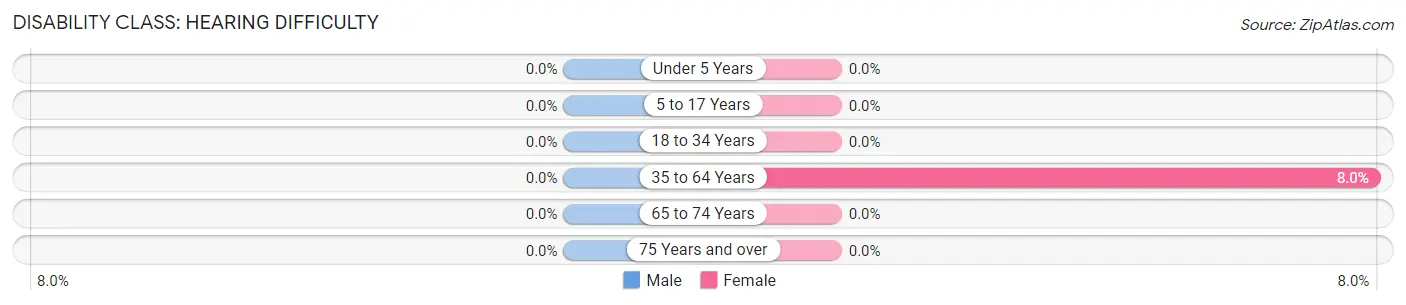
| Age Bracket | Male | Female |
| Under 5 Years | 0 (0.0%) | 0 (0.0%) |
| 5 to 17 Years | 0 (0.0%) | 0 (0.0%) |
| 18 to 34 Years | 0 (0.0%) | 0 (0.0%) |
| 35 to 64 Years | 0 (0.0%) | 6 (8.0%) |
| 65 to 74 Years | 0 (0.0%) | 0 (0.0%) |
| 75 Years and over | 0 (0.0%) | 0 (0.0%) |
Disability Class: Vision Difficulty
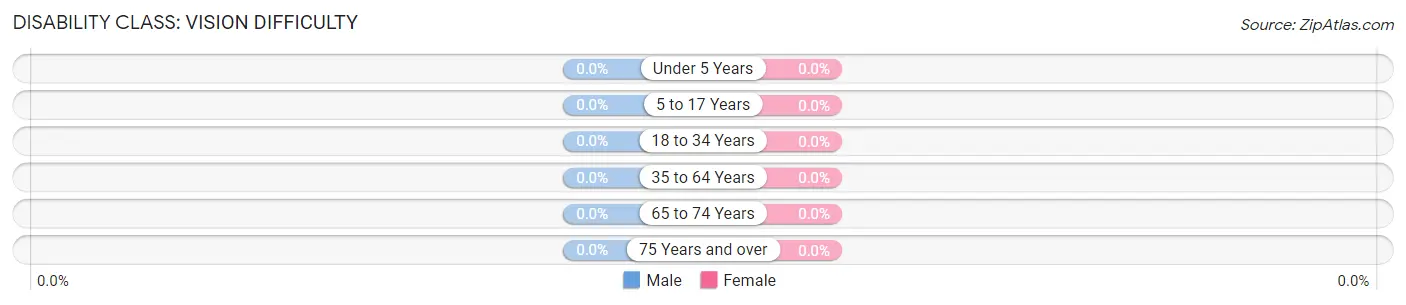
| Age Bracket | Male | Female |
| Under 5 Years | 0 (0.0%) | 0 (0.0%) |
| 5 to 17 Years | 0 (0.0%) | 0 (0.0%) |
| 18 to 34 Years | 0 (0.0%) | 0 (0.0%) |
| 35 to 64 Years | 0 (0.0%) | 0 (0.0%) |
| 65 to 74 Years | 0 (0.0%) | 0 (0.0%) |
| 75 Years and over | 0 (0.0%) | 0 (0.0%) |
Disability Class: Cognitive Difficulty
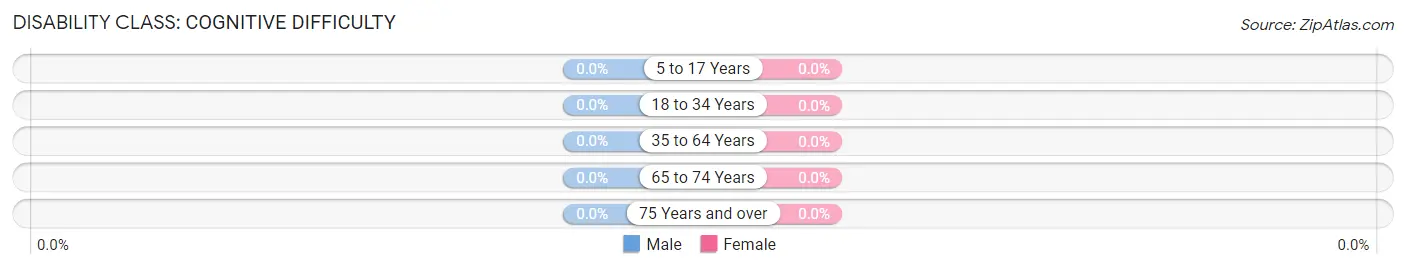
| Age Bracket | Male | Female |
| 5 to 17 Years | 0 (0.0%) | 0 (0.0%) |
| 18 to 34 Years | 0 (0.0%) | 0 (0.0%) |
| 35 to 64 Years | 0 (0.0%) | 0 (0.0%) |
| 65 to 74 Years | 0 (0.0%) | 0 (0.0%) |
| 75 Years and over | 0 (0.0%) | 0 (0.0%) |
Disability Class: Ambulatory Difficulty
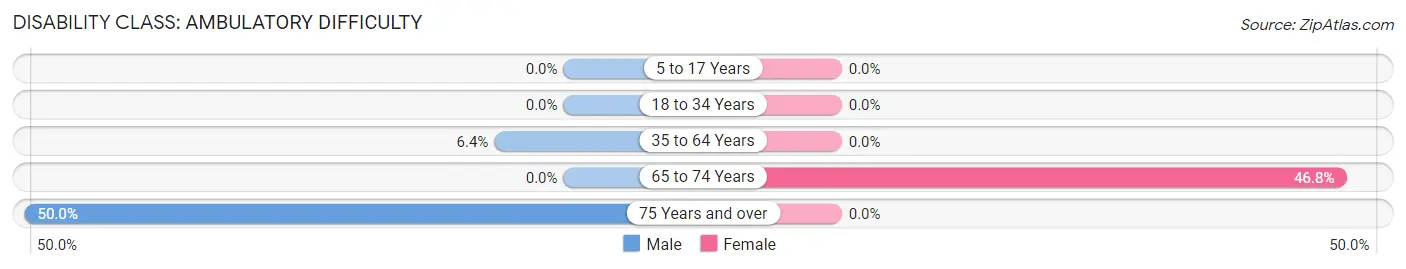
| Age Bracket | Male | Female |
| 5 to 17 Years | 0 (0.0%) | 0 (0.0%) |
| 18 to 34 Years | 0 (0.0%) | 0 (0.0%) |
| 35 to 64 Years | 7 (6.4%) | 0 (0.0%) |
| 65 to 74 Years | 0 (0.0%) | 22 (46.8%) |
| 75 Years and over | 8 (50.0%) | 0 (0.0%) |
Disability Class: Self-Care Difficulty
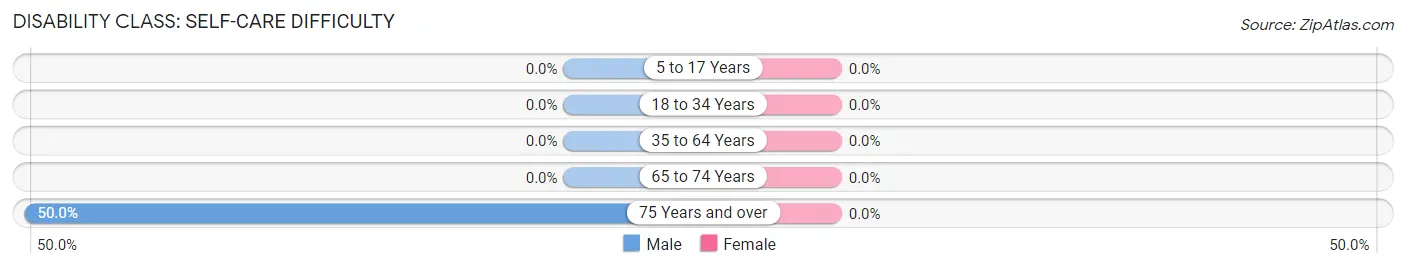
| Age Bracket | Male | Female |
| 5 to 17 Years | 0 (0.0%) | 0 (0.0%) |
| 18 to 34 Years | 0 (0.0%) | 0 (0.0%) |
| 35 to 64 Years | 0 (0.0%) | 0 (0.0%) |
| 65 to 74 Years | 0 (0.0%) | 0 (0.0%) |
| 75 Years and over | 8 (50.0%) | 0 (0.0%) |
Technology Access in Sheatown
Computing Device Access in Sheatown
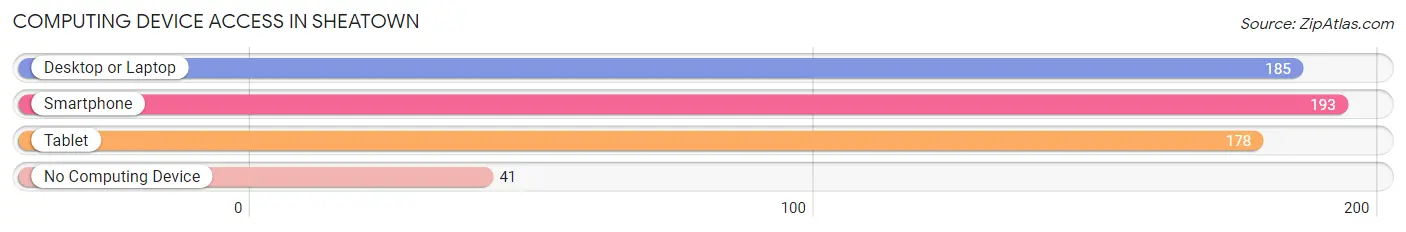
| Device Type | # Households | % Households |
| Desktop or Laptop | 185 | 72.3% |
| Smartphone | 193 | 75.4% |
| Tablet | 178 | 69.5% |
| No Computing Device | 41 | 16.0% |
| Total | 256 | 100.0% |
Internet Access in Sheatown
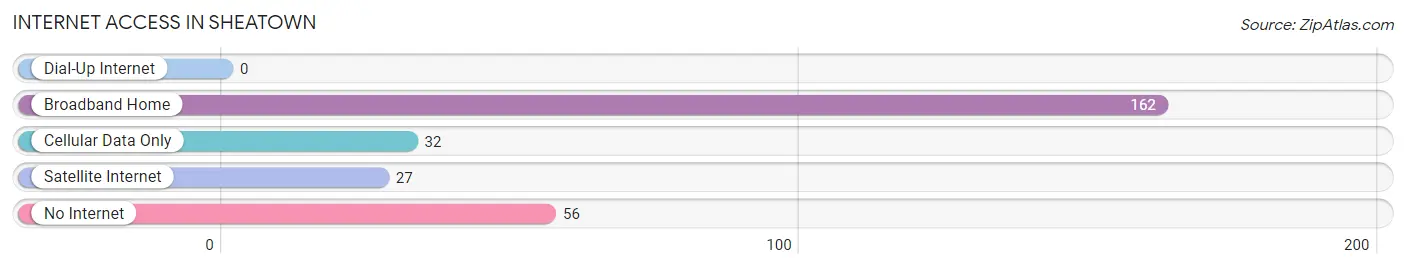
| Internet Type | # Households | % Households |
| Dial-Up Internet | 0 | 0.0% |
| Broadband Home | 162 | 63.3% |
| Cellular Data Only | 32 | 12.5% |
| Satellite Internet | 27 | 10.5% |
| No Internet | 56 | 21.9% |
| Total | 256 | 100.0% |
Sheatown Summary
Sheatown, Pennsylvania is a small borough located in Schuylkill County, Pennsylvania. It is situated in the southern part of the county, approximately 10 miles south of Pottsville. The population of Sheatown was 1,845 as of the 2010 census.
History
Sheatown was founded in 1845 by a group of German immigrants who had settled in the area. The town was named after the Sheatown Creek, which runs through the area. The creek was named after the Sheatown Indians, a Native American tribe that had lived in the area prior to the arrival of the Europeans.
The town was originally a farming community, but it soon developed into a coal mining town. The coal industry was the main source of employment for the town’s residents until the mid-20th century. The town also had a number of small businesses, including a general store, a blacksmith shop, and a hotel.
Geography
Sheatown is located in the southern part of Schuylkill County, approximately 10 miles south of Pottsville. The town is situated in the Appalachian Mountains, and is surrounded by rolling hills and forests. The Sheatown Creek runs through the town, and is a popular spot for fishing and swimming.
The climate in Sheatown is humid continental, with hot summers and cold winters. The average annual temperature is around 50 degrees Fahrenheit.
Economy
The economy of Sheatown is largely based on agriculture and tourism. The town is home to a number of small farms, which produce a variety of crops, including corn, soybeans, and hay. The town also has a number of small businesses, including restaurants, shops, and a hotel.
Tourism is an important part of the local economy. The town is home to a number of attractions, including the Sheatown Creek, which is a popular spot for fishing and swimming. The town also has a number of historic sites, including the Sheatown Hotel, which was built in 1845.
Demographics
As of the 2010 census, the population of Sheatown was 1,845. The racial makeup of the town was 97.3% White, 0.7% African American, 0.2% Native American, 0.2% Asian, and 1.6% from other races. The median household income was $37,917, and the median family income was $45,625.
The town has a large number of residents who are of German descent. The town also has a small number of residents who are of Irish, Italian, and Polish descent. The town has a number of churches, including the Sheatown United Methodist Church, the Sheatown Lutheran Church, and the Sheatown Presbyterian Church.
Conclusion
Sheatown, Pennsylvania is a small borough located in Schuylkill County, Pennsylvania. It is situated in the southern part of the county, approximately 10 miles south of Pottsville. The town was founded in 1845 by a group of German immigrants, and was originally a farming community. The town later developed into a coal mining town, and the coal industry was the main source of employment for the town’s residents until the mid-20th century. The economy of Sheatown is largely based on agriculture and tourism, and the town is home to a number of small farms and businesses. The population of Sheatown was 1,845 as of the 2010 census, and the town has a large number of residents who are of German descent.
Common Questions
What is the Total Population of Sheatown?
Total Population of Sheatown is 684.
What is the Total Male Population of Sheatown?
Total Male Population of Sheatown is 433.
What is the Total Female Population of Sheatown?
Total Female Population of Sheatown is 251.
What is the Ratio of Males per 100 Females in Sheatown?
There are 172.51 Males per 100 Females in Sheatown.
What is the Ratio of Females per 100 Males in Sheatown?
There are 57.97 Females per 100 Males in Sheatown.
What is the Median Population Age in Sheatown?
Median Population Age in Sheatown is 42.7 Years.
What is the Average Family Size in Sheatown
Average Family Size in Sheatown is 4.0 People.
What is the Average Household Size in Sheatown
Average Household Size in Sheatown is 2.2 People.
What is Per Capita Income in Sheatown?
Per Capita income in Sheatown is $29,621.
What is the Median Family Income in Sheatown?
Median Family Income in Sheatown is $94,276.
What is the Median Household income in Sheatown?
Median Household Income in Sheatown is $34,352.
What is Income or Wage Gap in Sheatown?
Income or Wage Gap in Sheatown is 46.8%.
Women in Sheatown earn 53.2 cents for every dollar earned by a man.
What is Inequality or Gini Index in Sheatown?
Inequality or Gini Index in Sheatown is 0.57.
How Large is the Labor Force in Sheatown?
There are 253 People in the Labor Forcein in Sheatown.
What is the Percentage of People in the Labor Force in Sheatown?
49.3% of People are in the Labor Force in Sheatown.
What is the Unemployment Rate in Sheatown?
Unemployment Rate in Sheatown is 14.2%.