Schellsburg borough, PA
Schellsburg borough Overview
299
TOTAL POPULATION
178
MALE POPULATION
121
FEMALE POPULATION
147.11
MALES / 100 FEMALES
67.98
FEMALES / 100 MALES
48.4
MEDIAN AGE
2.7
AVG FAMILY SIZE
2.4
AVG HOUSEHOLD SIZE
$36,630
PER CAPITA INCOME
$85,000
AVG FAMILY INCOME
$62,250
AVG HOUSEHOLD INCOME
37.7%
WAGE / INCOME GAP [ % ]
62.3¢/ $1
WAGE / INCOME GAP [ $ ]
0.42
INEQUALITY / GINI INDEX
134
LABOR FORCE [ PEOPLE ]
53.6%
PERCENT IN LABOR FORCE
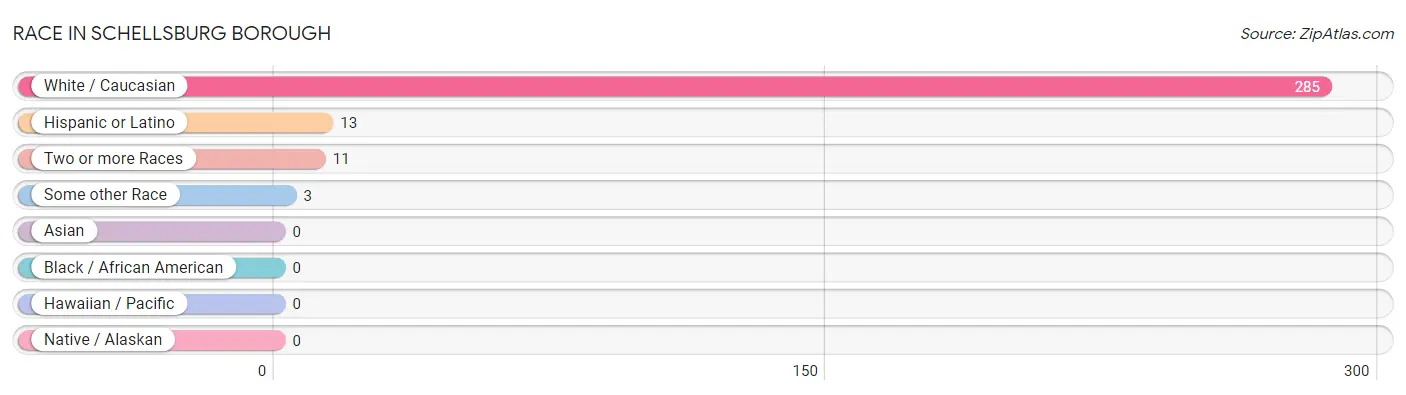
Race in Schellsburg borough
The most populous races in Schellsburg borough are White / Caucasian (285 | 95.3%), Hispanic or Latino (13 | 4.3%), and Two or more Races (11 | 3.7%).
| Race | # Population | % Population |
| Asian | 0 | 0.0% |
| Black / African American | 0 | 0.0% |
| Hawaiian / Pacific | 0 | 0.0% |
| Hispanic or Latino | 13 | 4.3% |
| Native / Alaskan | 0 | 0.0% |
| White / Caucasian | 285 | 95.3% |
| Two or more Races | 11 | 3.7% |
| Some other Race | 3 | 1.0% |
| Total | 299 | 100.0% |
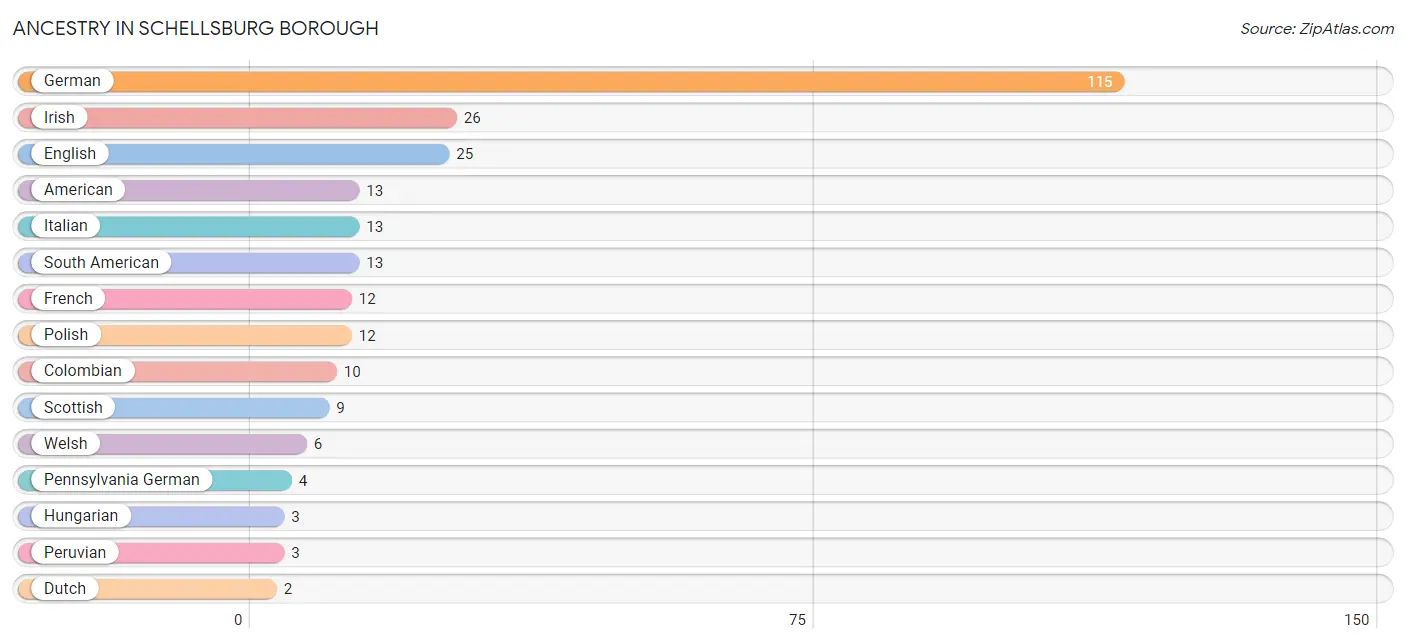
Ancestry in Schellsburg borough
The most populous ancestries reported in Schellsburg borough are German (115 | 38.5%), Irish (26 | 8.7%), English (25 | 8.4%), American (13 | 4.3%), and Italian (13 | 4.3%), together accounting for 64.2% of all Schellsburg borough residents.
| Ancestry | # Population | % Population |
| American | 13 | 4.3% |
| Colombian | 10 | 3.3% |
| Dutch | 2 | 0.7% |
| English | 25 | 8.4% |
| European | 1 | 0.3% |
| French | 12 | 4.0% |
| German | 115 | 38.5% |
| Hungarian | 3 | 1.0% |
| Irish | 26 | 8.7% |
| Italian | 13 | 4.3% |
| Norwegian | 2 | 0.7% |
| Pennsylvania German | 4 | 1.3% |
| Peruvian | 3 | 1.0% |
| Polish | 12 | 4.0% |
| Russian | 1 | 0.3% |
| Scottish | 9 | 3.0% |
| South American | 13 | 4.3% |
| Welsh | 6 | 2.0% | View All 18 Rows |
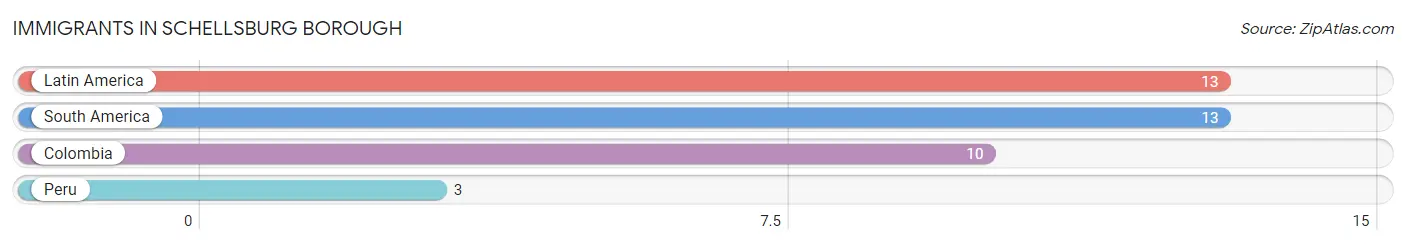
Immigrants in Schellsburg borough
The most numerous immigrant groups reported in Schellsburg borough came from Latin America (13 | 4.3%), South America (13 | 4.3%), Colombia (10 | 3.3%), and Peru (3 | 1.0%), together accounting for 13.0% of all Schellsburg borough residents.
| Immigration Origin | # Population | % Population |
| Colombia | 10 | 3.3% |
| Latin America | 13 | 4.3% |
| Peru | 3 | 1.0% |
| South America | 13 | 4.3% | View All 4 Rows |
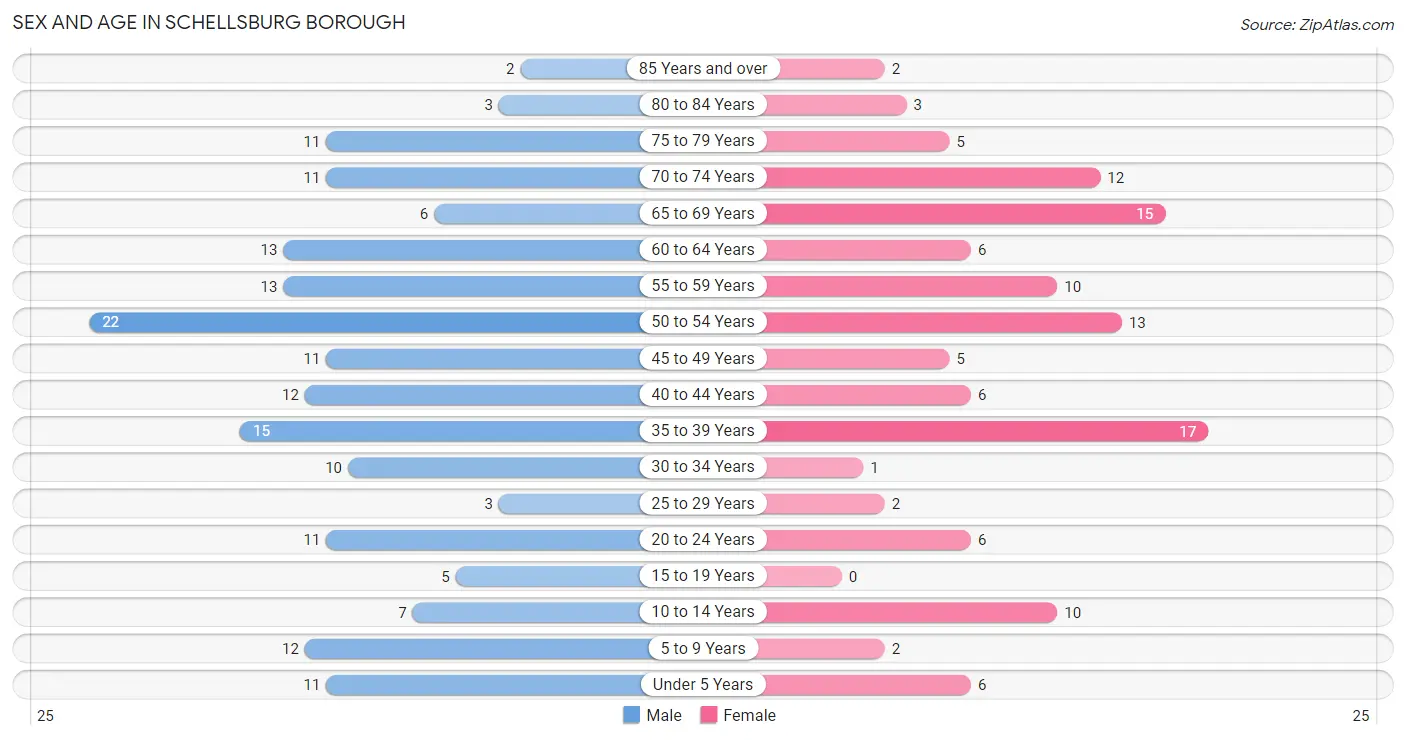
Sex and Age in Schellsburg borough
Sex and Age in Schellsburg borough
The most populous age groups in Schellsburg borough are 50 to 54 Years (22 | 12.4%) for men and 35 to 39 Years (17 | 14.1%) for women.
| Age Bracket | Male | Female |
| Under 5 Years | 11 (6.2%) | 6 (5.0%) |
| 5 to 9 Years | 12 (6.7%) | 2 (1.7%) |
| 10 to 14 Years | 7 (3.9%) | 10 (8.3%) |
| 15 to 19 Years | 5 (2.8%) | 0 (0.0%) |
| 20 to 24 Years | 11 (6.2%) | 6 (5.0%) |
| 25 to 29 Years | 3 (1.7%) | 2 (1.7%) |
| 30 to 34 Years | 10 (5.6%) | 1 (0.8%) |
| 35 to 39 Years | 15 (8.4%) | 17 (14.1%) |
| 40 to 44 Years | 12 (6.7%) | 6 (5.0%) |
| 45 to 49 Years | 11 (6.2%) | 5 (4.1%) |
| 50 to 54 Years | 22 (12.4%) | 13 (10.7%) |
| 55 to 59 Years | 13 (7.3%) | 10 (8.3%) |
| 60 to 64 Years | 13 (7.3%) | 6 (5.0%) |
| 65 to 69 Years | 6 (3.4%) | 15 (12.4%) |
| 70 to 74 Years | 11 (6.2%) | 12 (9.9%) |
| 75 to 79 Years | 11 (6.2%) | 5 (4.1%) |
| 80 to 84 Years | 3 (1.7%) | 3 (2.5%) |
| 85 Years and over | 2 (1.1%) | 2 (1.7%) |
| Total | 178 (100.0%) | 121 (100.0%) |
Families and Households in Schellsburg borough
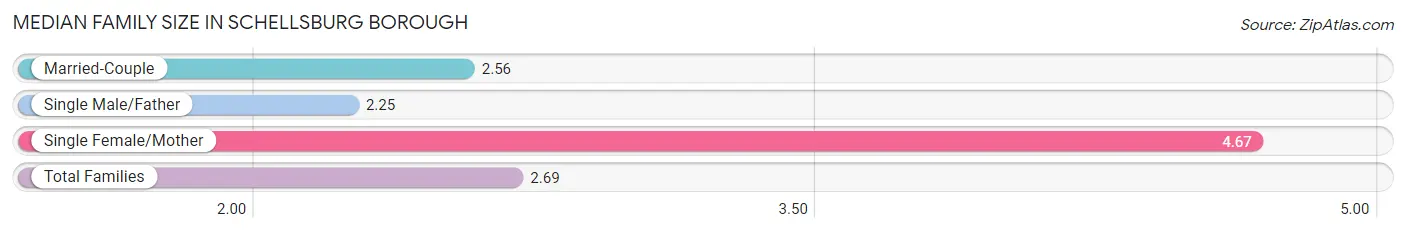
Median Family Size in Schellsburg borough
The median family size in Schellsburg borough is 2.69 persons per family, with single female/mother families (6 | 6.8%) accounting for the largest median family size of 4.67 persons per family. On the other hand, single male/father families (4 | 4.5%) represent the smallest median family size with 2.25 persons per family.
| Family Type | # Families | Family Size |
| Married-Couple | 78 (88.6%) | 2.56 |
| Single Male/Father | 4 (4.5%) | 2.25 |
| Single Female/Mother | 6 (6.8%) | 4.67 |
| Total Families | 88 (100.0%) | 2.69 |
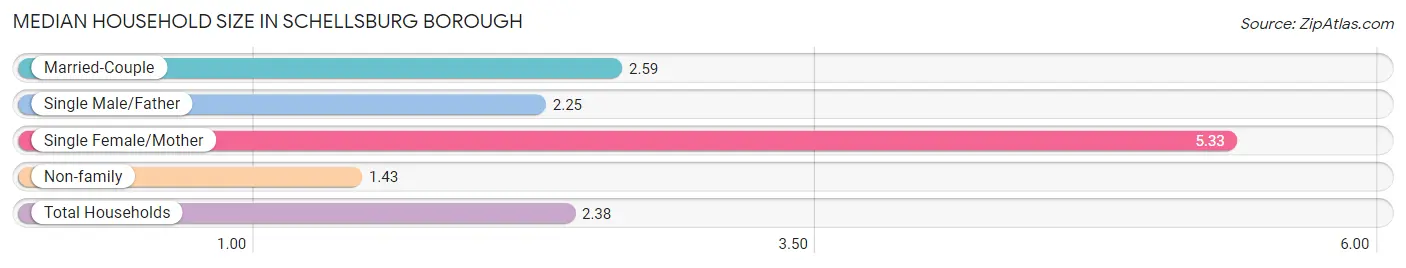
Median Household Size in Schellsburg borough
The median household size in Schellsburg borough is 2.38 persons per household, with single female/mother households (6 | 4.9%) accounting for the largest median household size of 5.33 persons per household. non-family households (35 | 28.5%) represent the smallest median household size with 1.43 persons per household.
| Household Type | # Households | Household Size |
| Married-Couple | 78 (63.4%) | 2.59 |
| Single Male/Father | 4 (3.3%) | 2.25 |
| Single Female/Mother | 6 (4.9%) | 5.33 |
| Non-family | 35 (28.5%) | 1.43 |
| Total Households | 123 (100.0%) | 2.38 |
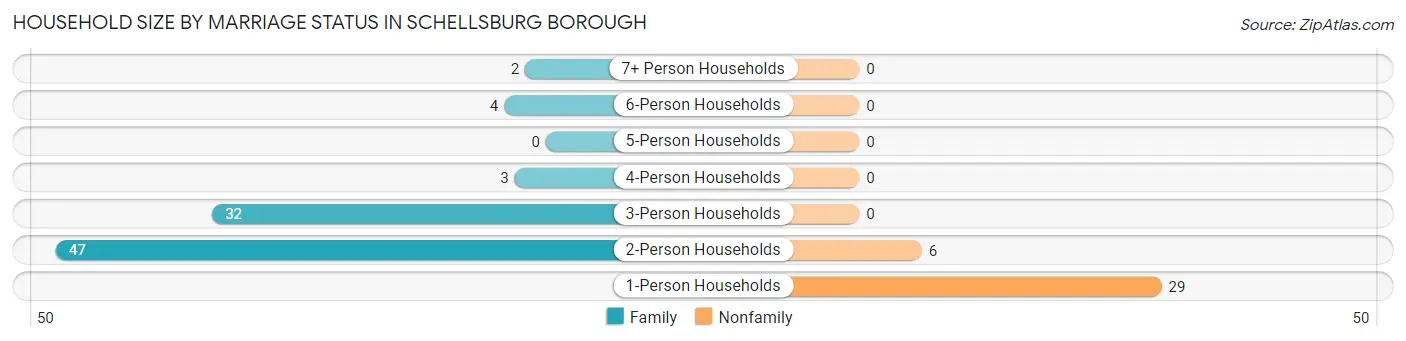
Household Size by Marriage Status in Schellsburg borough
Out of a total of 123 households in Schellsburg borough, 88 (71.5%) are family households, while 35 (28.5%) are nonfamily households. The most numerous type of family households are 2-person households, comprising 47, and the most common type of nonfamily households are 1-person households, comprising 29.
| Household Size | Family Households | Nonfamily Households |
| 1-Person Households | - | 29 (23.6%) |
| 2-Person Households | 47 (38.2%) | 6 (4.9%) |
| 3-Person Households | 32 (26.0%) | 0 (0.0%) |
| 4-Person Households | 3 (2.4%) | 0 (0.0%) |
| 5-Person Households | 0 (0.0%) | 0 (0.0%) |
| 6-Person Households | 4 (3.3%) | 0 (0.0%) |
| 7+ Person Households | 2 (1.6%) | 0 (0.0%) |
| Total | 88 (71.5%) | 35 (28.5%) |
Female Fertility in Schellsburg borough
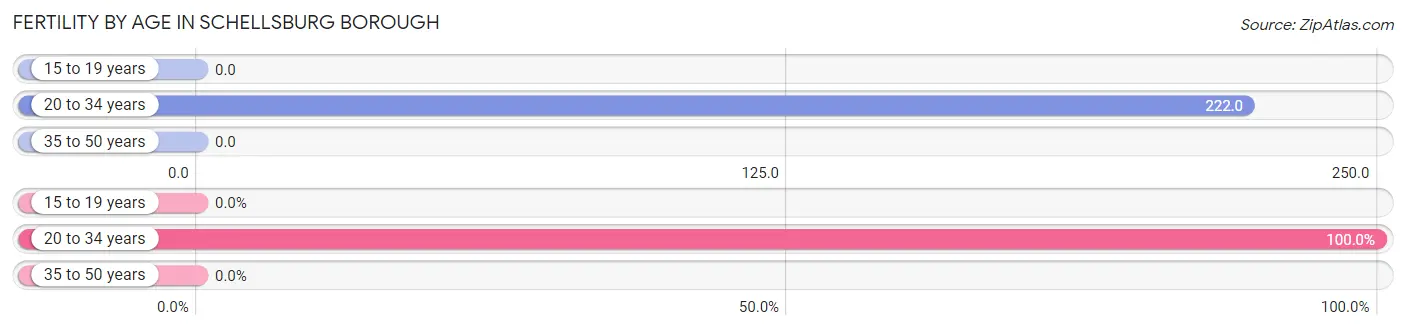
Fertility by Age in Schellsburg borough
Average fertility rate in Schellsburg borough is 54.0 births per 1,000 women. Women in the age bracket of 20 to 34 years have the highest fertility rate with 222.0 births per 1,000 women. Women in the age bracket of 20 to 34 years acount for 100.0% of all women with births.
| Age Bracket | Women with Births | Births / 1,000 Women |
| 15 to 19 years | 0 (0.0%) | 0.0 |
| 20 to 34 years | 2 (100.0%) | 222.0 |
| 35 to 50 years | 0 (0.0%) | 0.0 |
| Total | 2 (100.0%) | 54.0 |
Fertility by Age by Marriage Status in Schellsburg borough
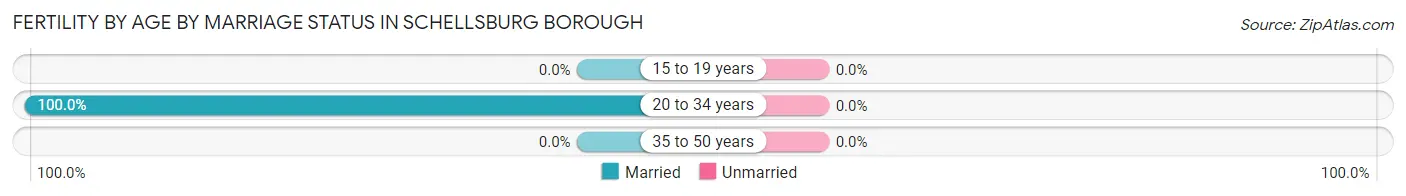
| Age Bracket | Married | Unmarried |
| 15 to 19 years | 0 (0.0%) | 0 (0.0%) |
| 20 to 34 years | 2 (100.0%) | 0 (0.0%) |
| 35 to 50 years | 0 (0.0%) | 0 (0.0%) |
| Total | 2 (100.0%) | 0 (0.0%) |
Fertility by Education in Schellsburg borough
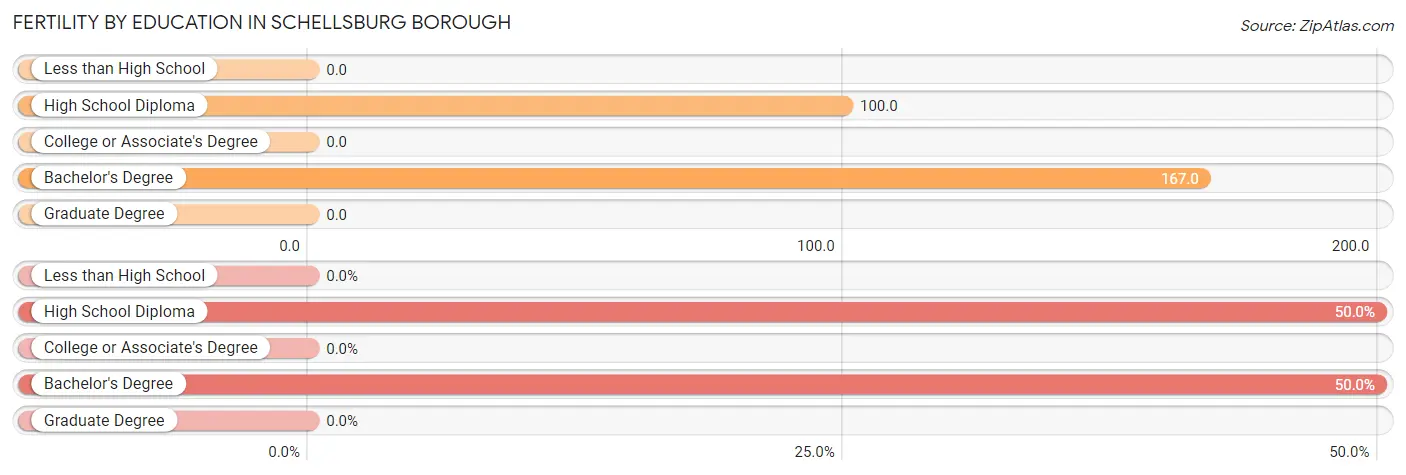
| Educational Attainment | Women with Births | Births / 1,000 Women |
| Less than High School | 0 (0.0%) | 0.0 |
| High School Diploma | 1 (50.0%) | 100.0 |
| College or Associate's Degree | 0 (0.0%) | 0.0 |
| Bachelor's Degree | 1 (50.0%) | 167.0 |
| Graduate Degree | 0 (0.0%) | 0.0 |
| Total | 2 (100.0%) | 54.0 |
Fertility by Education by Marriage Status in Schellsburg borough
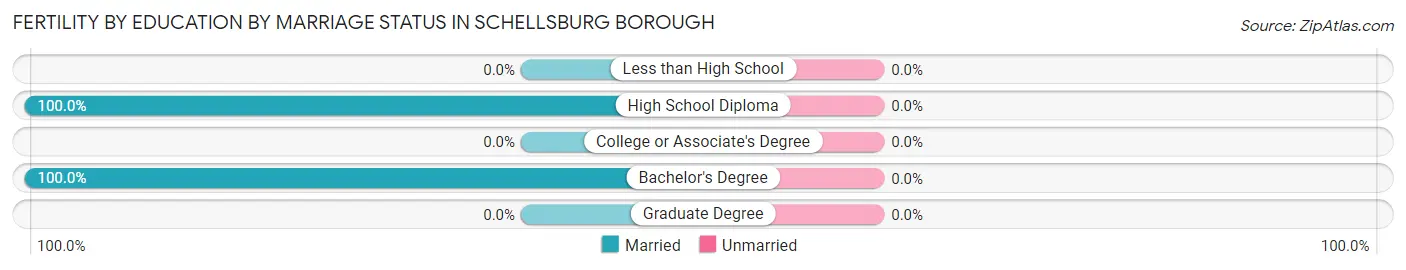
| Educational Attainment | Married | Unmarried |
| Less than High School | 0 (0.0%) | 0 (0.0%) |
| High School Diploma | 1 (100.0%) | 0 (0.0%) |
| College or Associate's Degree | 0 (0.0%) | 0 (0.0%) |
| Bachelor's Degree | 1 (100.0%) | 0 (0.0%) |
| Graduate Degree | 0 (0.0%) | 0 (0.0%) |
| Total | 2 (100.0%) | 0 (0.0%) |
Income in Schellsburg borough
Income Overview in Schellsburg borough
Per Capita Income in Schellsburg borough is $36,630, while median incomes of families and households are $85,000 and $62,250 respectively.
| Characteristic | Number | Measure |
| Per Capita Income | 299 | $36,630 |
| Median Family Income | 88 | $85,000 |
| Mean Family Income | 88 | $102,881 |
| Median Household Income | 123 | $62,250 |
| Mean Household Income | 123 | $86,427 |
| Income Deficit | 88 | $0 |
| Wage / Income Gap (%) | 299 | 37.66% |
| Wage / Income Gap ($) | 299 | 62.34¢ per $1 |
| Gini / Inequality Index | 299 | 0.42 |
Earnings by Sex in Schellsburg borough
Average Earnings in Schellsburg borough are $39,375, $48,125 for men and $30,000 for women, a difference of 37.7%.
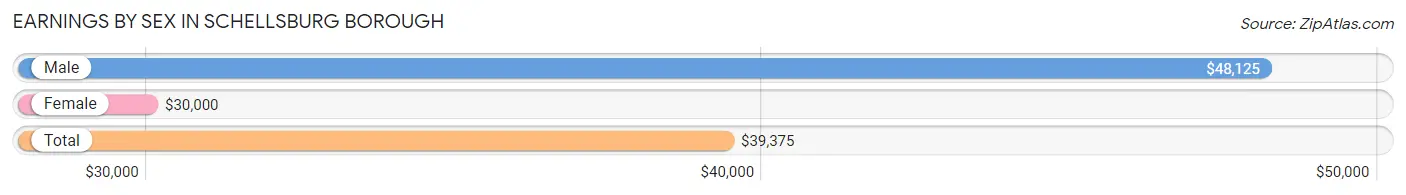
| Sex | Number | Average Earnings |
| Male | 97 (67.8%) | $48,125 |
| Female | 46 (32.2%) | $30,000 |
| Total | 143 (100.0%) | $39,375 |
Earnings by Sex by Income Bracket in Schellsburg borough
The most common earnings brackets in Schellsburg borough are $100,000+ for men (20 | 20.6%) and $40,000 to $44,999 for women (8 | 17.4%).
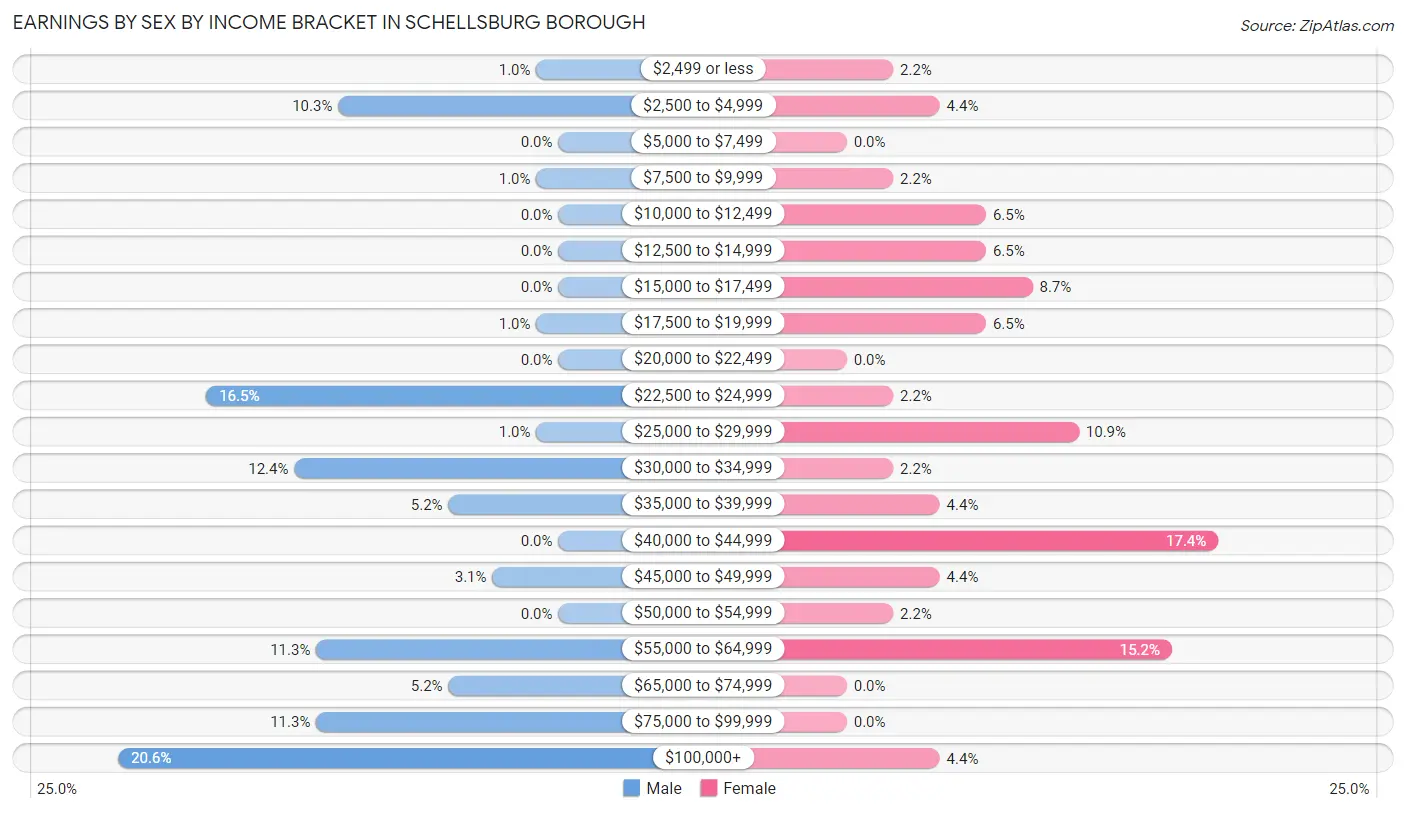
| Income | Male | Female |
| $2,499 or less | 1 (1.0%) | 1 (2.2%) |
| $2,500 to $4,999 | 10 (10.3%) | 2 (4.3%) |
| $5,000 to $7,499 | 0 (0.0%) | 0 (0.0%) |
| $7,500 to $9,999 | 1 (1.0%) | 1 (2.2%) |
| $10,000 to $12,499 | 0 (0.0%) | 3 (6.5%) |
| $12,500 to $14,999 | 0 (0.0%) | 3 (6.5%) |
| $15,000 to $17,499 | 0 (0.0%) | 4 (8.7%) |
| $17,500 to $19,999 | 1 (1.0%) | 3 (6.5%) |
| $20,000 to $22,499 | 0 (0.0%) | 0 (0.0%) |
| $22,500 to $24,999 | 16 (16.5%) | 1 (2.2%) |
| $25,000 to $29,999 | 1 (1.0%) | 5 (10.9%) |
| $30,000 to $34,999 | 12 (12.4%) | 1 (2.2%) |
| $35,000 to $39,999 | 5 (5.1%) | 2 (4.3%) |
| $40,000 to $44,999 | 0 (0.0%) | 8 (17.4%) |
| $45,000 to $49,999 | 3 (3.1%) | 2 (4.3%) |
| $50,000 to $54,999 | 0 (0.0%) | 1 (2.2%) |
| $55,000 to $64,999 | 11 (11.3%) | 7 (15.2%) |
| $65,000 to $74,999 | 5 (5.1%) | 0 (0.0%) |
| $75,000 to $99,999 | 11 (11.3%) | 0 (0.0%) |
| $100,000+ | 20 (20.6%) | 2 (4.3%) |
| Total | 97 (100.0%) | 46 (100.0%) |
Earnings by Sex by Educational Attainment in Schellsburg borough
Average earnings in Schellsburg borough are $56,607 for men and $33,750 for women, a difference of 40.4%. Men with an educational attainment of high school diploma enjoy the highest average annual earnings of $73,333, while those with graduate degree education earn the least with $23,942. Women with an educational attainment of college or associate's degree earn the most with the average annual earnings of $55,625, while those with less than high school education have the smallest earnings of $26,750.
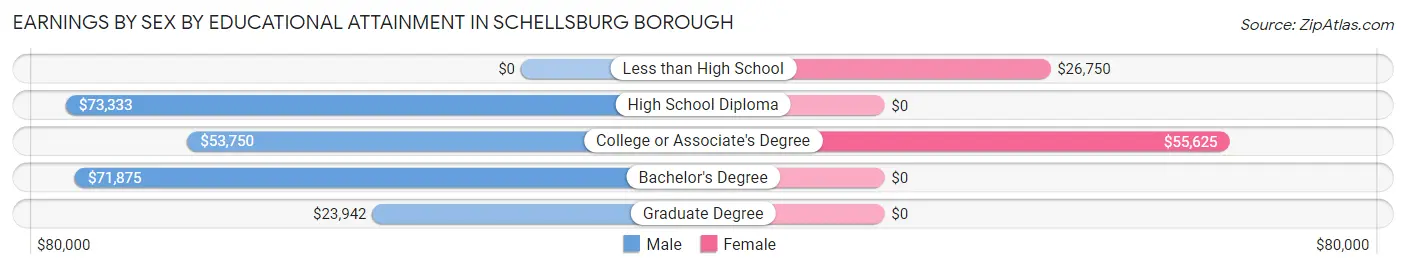
| Educational Attainment | Male Income | Female Income |
| Less than High School | - | - |
| High School Diploma | $73,333 | $0 |
| College or Associate's Degree | $53,750 | $55,625 |
| Bachelor's Degree | $71,875 | $0 |
| Graduate Degree | $23,942 | $0 |
| Total | $56,607 | $33,750 |
Family Income in Schellsburg borough
Family Income Brackets in Schellsburg borough
According to the Schellsburg borough family income data, there are 21 families falling into the $100,000 to $149,999 income range, which is the most common income bracket and makes up 23.9% of all families.
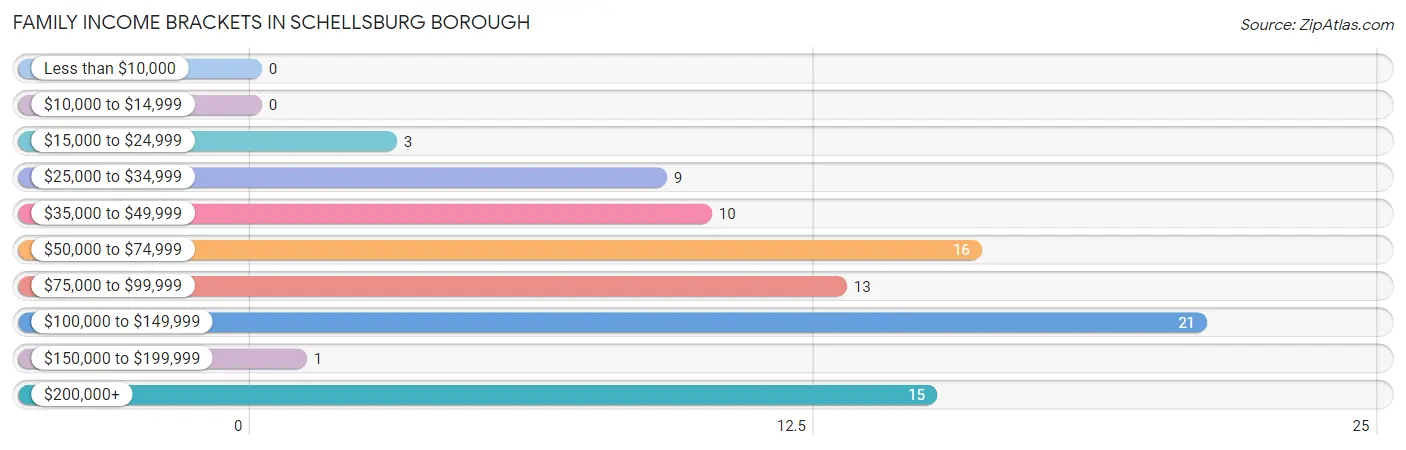
| Income Bracket | # Families | % Families |
| Less than $10,000 | 0 | 0.0% |
| $10,000 to $14,999 | 0 | 0.0% |
| $15,000 to $24,999 | 3 | 3.4% |
| $25,000 to $34,999 | 9 | 10.2% |
| $35,000 to $49,999 | 10 | 11.4% |
| $50,000 to $74,999 | 16 | 18.2% |
| $75,000 to $99,999 | 13 | 14.8% |
| $100,000 to $149,999 | 21 | 23.9% |
| $150,000 to $199,999 | 1 | 1.1% |
| $200,000+ | 15 | 17.0% |
Family Income by Famaliy Size in Schellsburg borough
2-person families (47 | 53.4%) account for the highest median family income in Schellsburg borough with $56,250 per family, while 2-person families (47 | 53.4%) have the highest median income of $28,125 per family member.
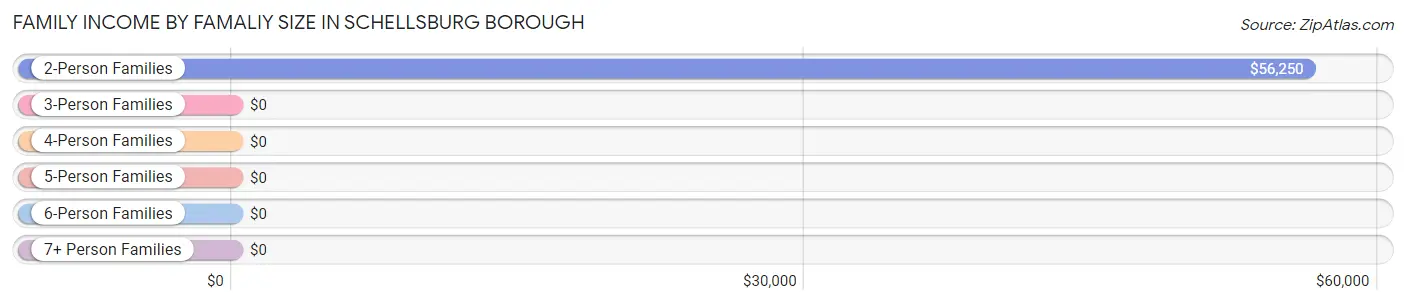
| Income Bracket | # Families | Median Income |
| 2-Person Families | 47 (53.4%) | $56,250 |
| 3-Person Families | 33 (37.5%) | $0 |
| 4-Person Families | 3 (3.4%) | $0 |
| 5-Person Families | 2 (2.3%) | $0 |
| 6-Person Families | 2 (2.3%) | $0 |
| 7+ Person Families | 1 (1.1%) | $0 |
| Total | 88 (100.0%) | $85,000 |
Family Income by Number of Earners in Schellsburg borough
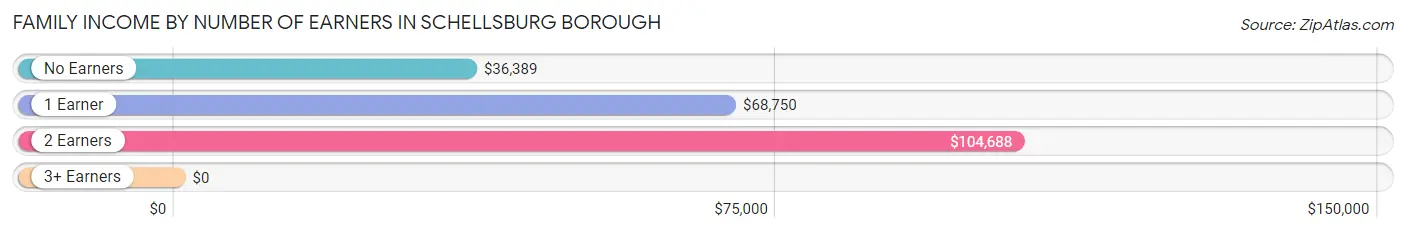
| Number of Earners | # Families | Median Income |
| No Earners | 28 (31.8%) | $36,389 |
| 1 Earner | 13 (14.8%) | $68,750 |
| 2 Earners | 45 (51.1%) | $104,688 |
| 3+ Earners | 2 (2.3%) | $0 |
| Total | 88 (100.0%) | $85,000 |
Household Income in Schellsburg borough
Household Income Brackets in Schellsburg borough
With 23 households falling in the category, the $100,000 to $149,999 income range is the most frequent in Schellsburg borough, accounting for 18.7% of all households.
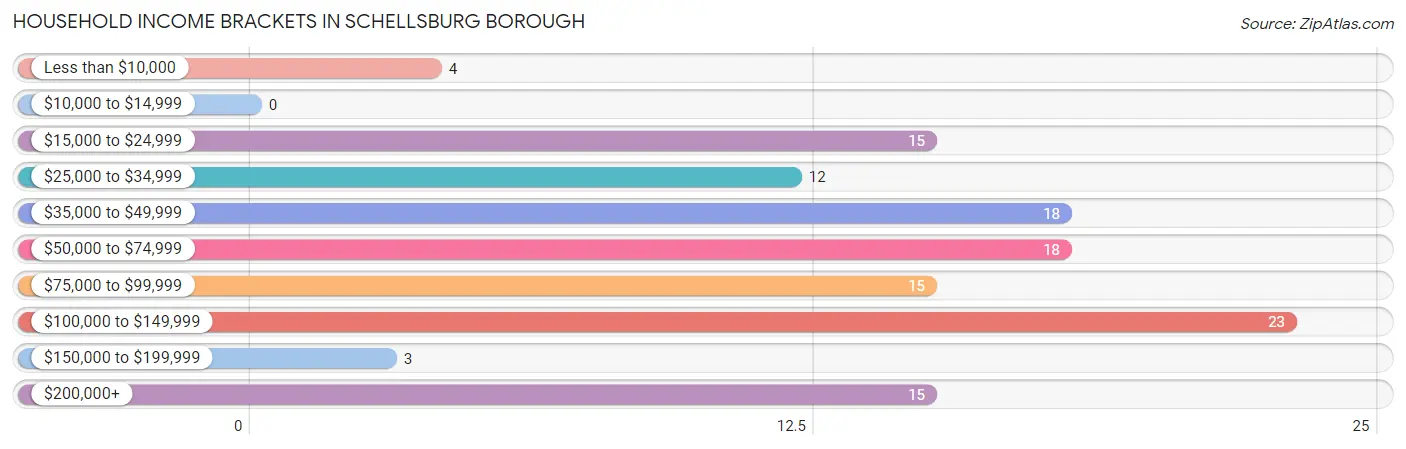
| Income Bracket | # Households | % Households |
| Less than $10,000 | 4 | 3.3% |
| $10,000 to $14,999 | 0 | 0.0% |
| $15,000 to $24,999 | 15 | 12.2% |
| $25,000 to $34,999 | 12 | 9.8% |
| $35,000 to $49,999 | 18 | 14.6% |
| $50,000 to $74,999 | 18 | 14.6% |
| $75,000 to $99,999 | 15 | 12.2% |
| $100,000 to $149,999 | 23 | 18.7% |
| $150,000 to $199,999 | 3 | 2.4% |
| $200,000+ | 15 | 12.2% |
Household Income by Householder Age in Schellsburg borough
The median household income in Schellsburg borough is $62,250, with the highest median household income of $112,750 found in the 45 to 64 years age bracket for the primary householder. A total of 51 households (41.5%) fall into this category.
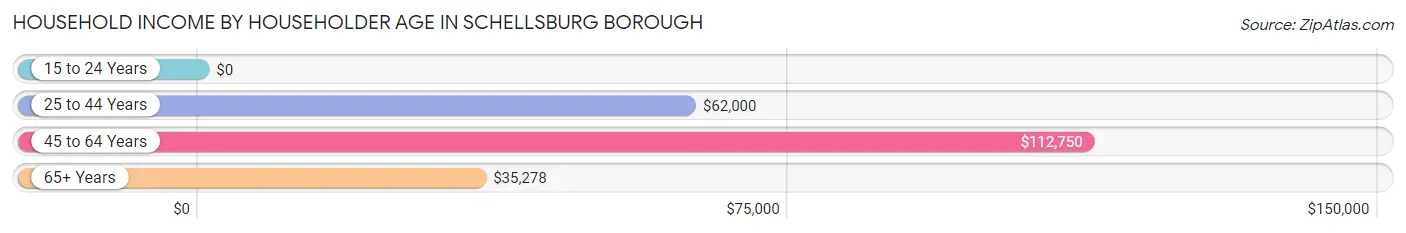
| Income Bracket | # Households | Median Income |
| 15 to 24 Years | 0 (0.0%) | $0 |
| 25 to 44 Years | 32 (26.0%) | $62,000 |
| 45 to 64 Years | 51 (41.5%) | $112,750 |
| 65+ Years | 40 (32.5%) | $35,278 |
| Total | 123 (100.0%) | $62,250 |
Poverty in Schellsburg borough
Income Below Poverty by Sex and Age in Schellsburg borough
With 7.3% poverty level for males and 14.3% for females among the residents of Schellsburg borough, 15 year old males and under 5 year old females are the most vulnerable to poverty, with 1 males (100.0%) and 5 females (100.0%) in their respective age groups living below the poverty level.
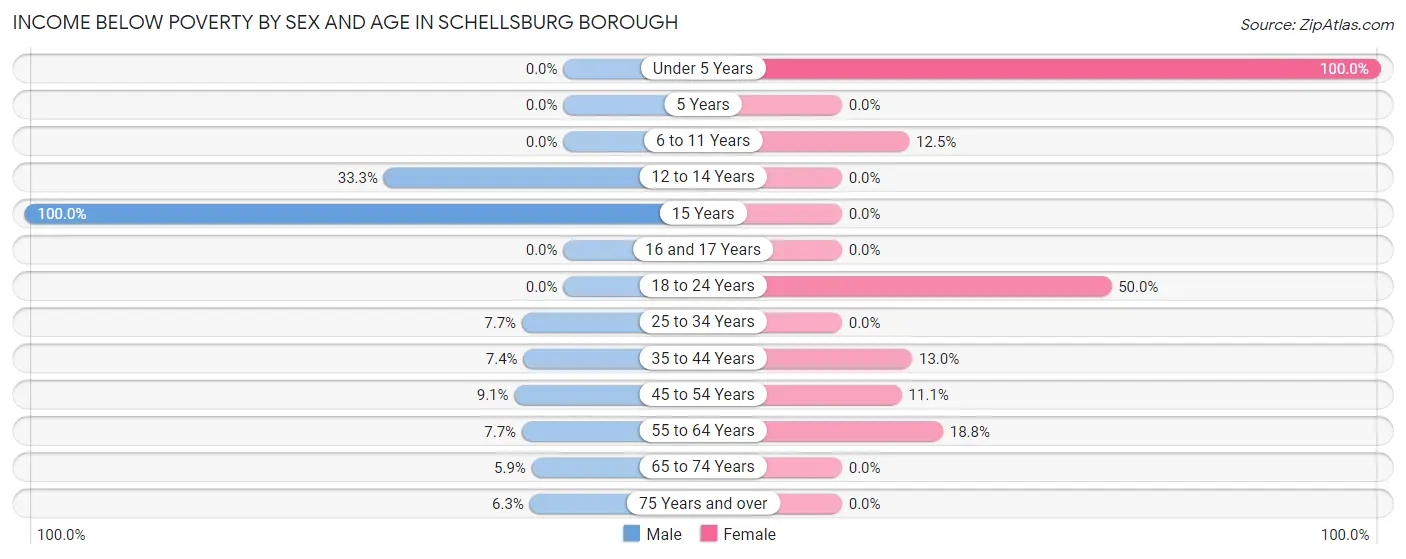
| Age Bracket | Male | Female |
| Under 5 Years | 0 (0.0%) | 5 (100.0%) |
| 5 Years | 0 (0.0%) | 0 (0.0%) |
| 6 to 11 Years | 0 (0.0%) | 1 (12.5%) |
| 12 to 14 Years | 2 (33.3%) | 0 (0.0%) |
| 15 Years | 1 (100.0%) | 0 (0.0%) |
| 16 and 17 Years | 0 (0.0%) | 0 (0.0%) |
| 18 to 24 Years | 0 (0.0%) | 3 (50.0%) |
| 25 to 34 Years | 1 (7.7%) | 0 (0.0%) |
| 35 to 44 Years | 2 (7.4%) | 3 (13.0%) |
| 45 to 54 Years | 3 (9.1%) | 2 (11.1%) |
| 55 to 64 Years | 2 (7.7%) | 3 (18.8%) |
| 65 to 74 Years | 1 (5.9%) | 0 (0.0%) |
| 75 Years and over | 1 (6.2%) | 0 (0.0%) |
| Total | 13 (7.3%) | 17 (14.3%) |
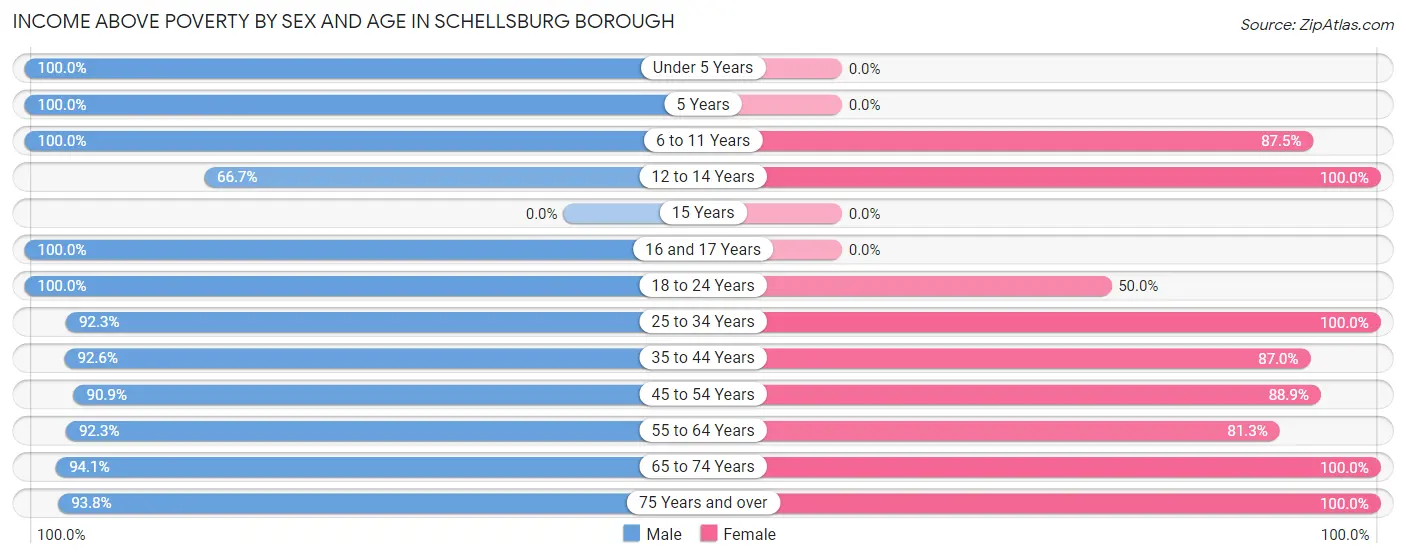
Income Above Poverty by Sex and Age in Schellsburg borough
According to the poverty statistics in Schellsburg borough, males aged under 5 years and females aged 12 to 14 years are the age groups that are most secure financially, with 100.0% of males and 100.0% of females in these age groups living above the poverty line.
| Age Bracket | Male | Female |
| Under 5 Years | 11 (100.0%) | 0 (0.0%) |
| 5 Years | 2 (100.0%) | 0 (0.0%) |
| 6 to 11 Years | 10 (100.0%) | 7 (87.5%) |
| 12 to 14 Years | 4 (66.7%) | 3 (100.0%) |
| 15 Years | 0 (0.0%) | 0 (0.0%) |
| 16 and 17 Years | 4 (100.0%) | 0 (0.0%) |
| 18 to 24 Years | 11 (100.0%) | 3 (50.0%) |
| 25 to 34 Years | 12 (92.3%) | 3 (100.0%) |
| 35 to 44 Years | 25 (92.6%) | 20 (87.0%) |
| 45 to 54 Years | 30 (90.9%) | 16 (88.9%) |
| 55 to 64 Years | 24 (92.3%) | 13 (81.2%) |
| 65 to 74 Years | 16 (94.1%) | 27 (100.0%) |
| 75 Years and over | 15 (93.8%) | 10 (100.0%) |
| Total | 164 (92.7%) | 102 (85.7%) |
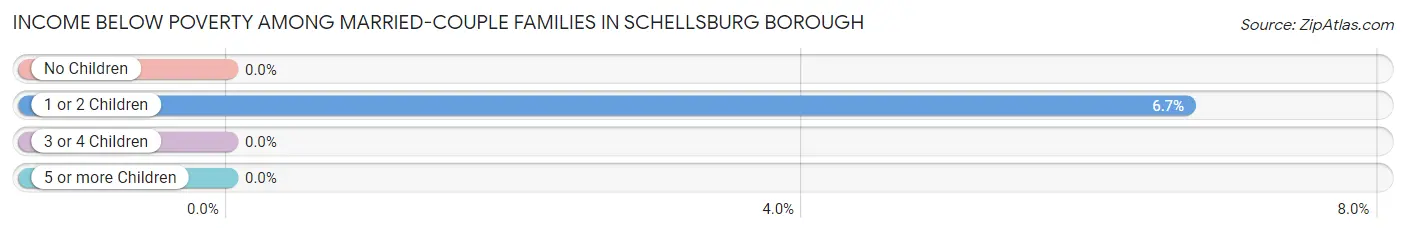
Income Below Poverty Among Married-Couple Families in Schellsburg borough
The poverty statistics for married-couple families in Schellsburg borough show that 1.3% or 1 of the total 78 families live below the poverty line. Families with 1 or 2 children have the highest poverty rate of 6.7%, comprising of 1 families. On the other hand, families with no children have the lowest poverty rate of 0.0%, which includes 0 families.
| Children | Above Poverty | Below Poverty |
| No Children | 61 (100.0%) | 0 (0.0%) |
| 1 or 2 Children | 14 (93.3%) | 1 (6.7%) |
| 3 or 4 Children | 2 (100.0%) | 0 (0.0%) |
| 5 or more Children | 0 (0.0%) | 0 (0.0%) |
| Total | 77 (98.7%) | 1 (1.3%) |
Income Below Poverty Among Single-Parent Households in Schellsburg borough
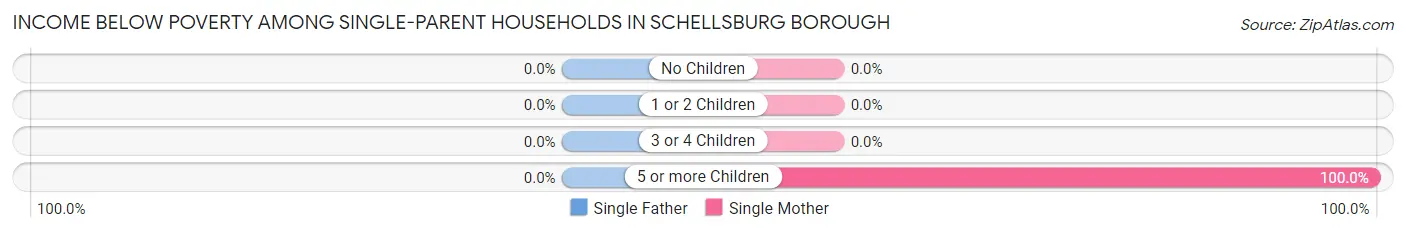
| Children | Single Father | Single Mother |
| No Children | 0 (0.0%) | 0 (0.0%) |
| 1 or 2 Children | 0 (0.0%) | 0 (0.0%) |
| 3 or 4 Children | 0 (0.0%) | 0 (0.0%) |
| 5 or more Children | 0 (0.0%) | 1 (100.0%) |
| Total | 0 (0.0%) | 1 (16.7%) |
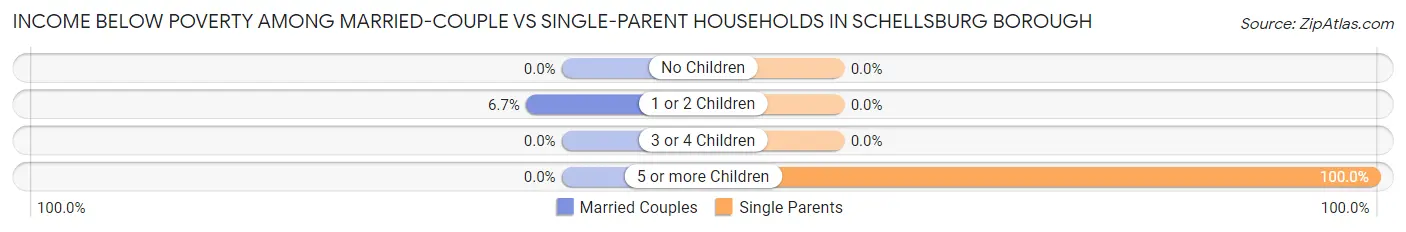
Income Below Poverty Among Married-Couple vs Single-Parent Households in Schellsburg borough
The poverty data for Schellsburg borough shows that 1 of the married-couple family households (1.3%) and 1 of the single-parent households (10.0%) are living below the poverty level. Within the married-couple family households, those with 1 or 2 children have the highest poverty rate, with 1 households (6.7%) falling below the poverty line. Among the single-parent households, those with 5 or more children have the highest poverty rate, with 1 household (100.0%) living below poverty.
| Children | Married-Couple Families | Single-Parent Households |
| No Children | 0 (0.0%) | 0 (0.0%) |
| 1 or 2 Children | 1 (6.7%) | 0 (0.0%) |
| 3 or 4 Children | 0 (0.0%) | 0 (0.0%) |
| 5 or more Children | 0 (0.0%) | 1 (100.0%) |
| Total | 1 (1.3%) | 1 (10.0%) |
Employment Characteristics in Schellsburg borough
Employment by Class of Employer in Schellsburg borough
Among the 133 employed individuals in Schellsburg borough, private company employees (97 | 72.9%), state government employees (15 | 11.3%), and not-for-profit organizations (10 | 7.5%) make up the most common classes of employment.
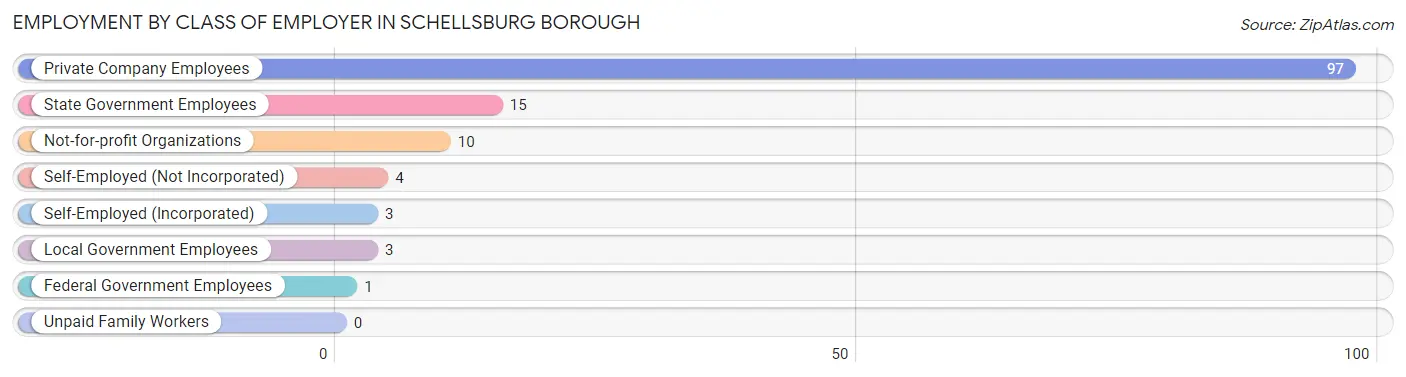
| Employer Class | # Employees | % Employees |
| Private Company Employees | 97 | 72.9% |
| Self-Employed (Incorporated) | 3 | 2.3% |
| Self-Employed (Not Incorporated) | 4 | 3.0% |
| Not-for-profit Organizations | 10 | 7.5% |
| Local Government Employees | 3 | 2.3% |
| State Government Employees | 15 | 11.3% |
| Federal Government Employees | 1 | 0.7% |
| Unpaid Family Workers | 0 | 0.0% |
| Total | 133 | 100.0% |
Employment Status by Age in Schellsburg borough
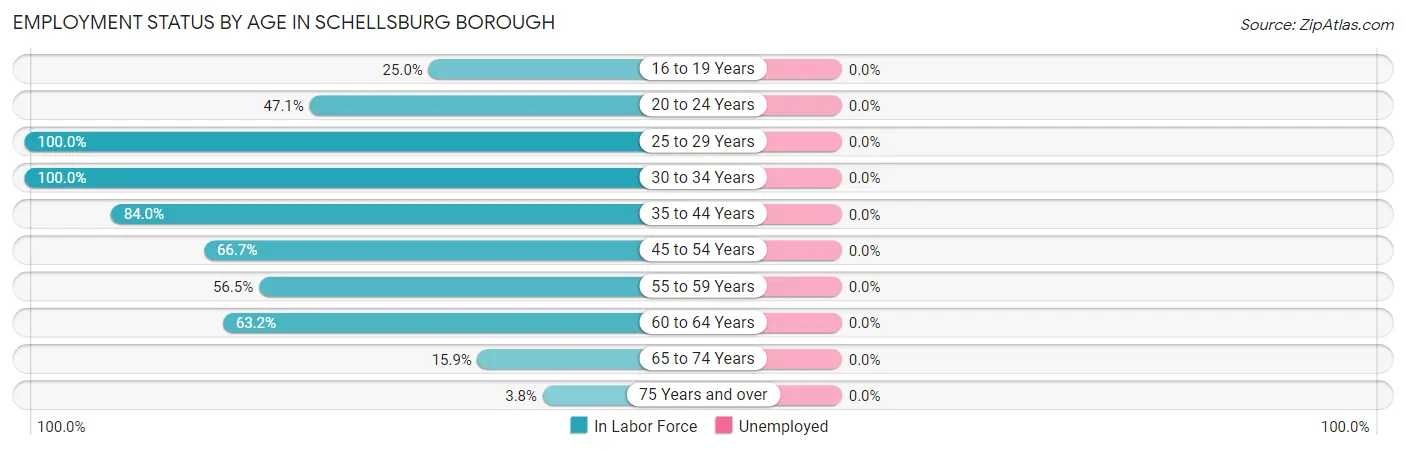
| Age Bracket | In Labor Force | Unemployed |
| 16 to 19 Years | 1 (25.0%) | 0 (0.0%) |
| 20 to 24 Years | 8 (47.1%) | 0 (0.0%) |
| 25 to 29 Years | 5 (100.0%) | 0 (0.0%) |
| 30 to 34 Years | 11 (100.0%) | 0 (0.0%) |
| 35 to 44 Years | 42 (84.0%) | 0 (0.0%) |
| 45 to 54 Years | 34 (66.7%) | 0 (0.0%) |
| 55 to 59 Years | 13 (56.5%) | 0 (0.0%) |
| 60 to 64 Years | 12 (63.2%) | 0 (0.0%) |
| 65 to 74 Years | 7 (15.9%) | 0 (0.0%) |
| 75 Years and over | 1 (3.8%) | 0 (0.0%) |
| Total | 134 (53.6%) | 0 (0.0%) |
Employment Status by Educational Attainment in Schellsburg borough
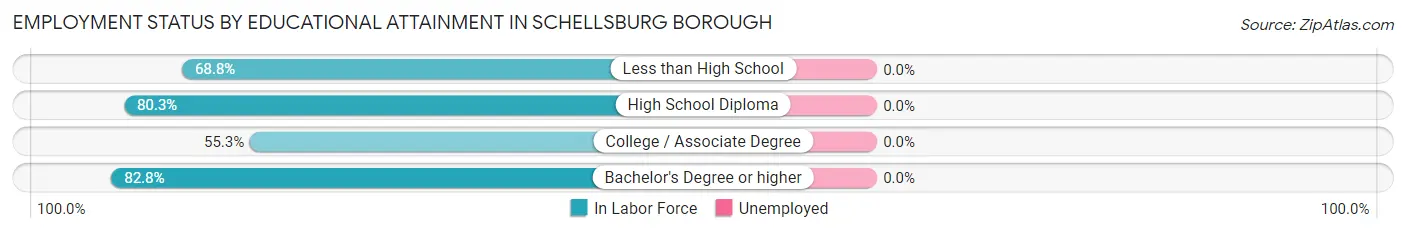
| Educational Attainment | In Labor Force | Unemployed |
| Less than High School | 11 (68.8%) | 0 (0.0%) |
| High School Diploma | 61 (80.3%) | 0 (0.0%) |
| College / Associate Degree | 21 (55.3%) | 0 (0.0%) |
| Bachelor's Degree or higher | 24 (82.8%) | 0 (0.0%) |
| Total | 117 (73.6%) | 0 (0.0%) |
Employment Occupations by Sex in Schellsburg borough
Management, Business, Science and Arts Occupations
The most common Management, Business, Science and Arts occupations in Schellsburg borough are Management (26 | 19.4%), Community & Social Service (14 | 10.4%), Education Instruction & Library (11 | 8.2%), Health Diagnosing & Treating (7 | 5.2%), and Computers, Engineering & Science (6 | 4.5%).
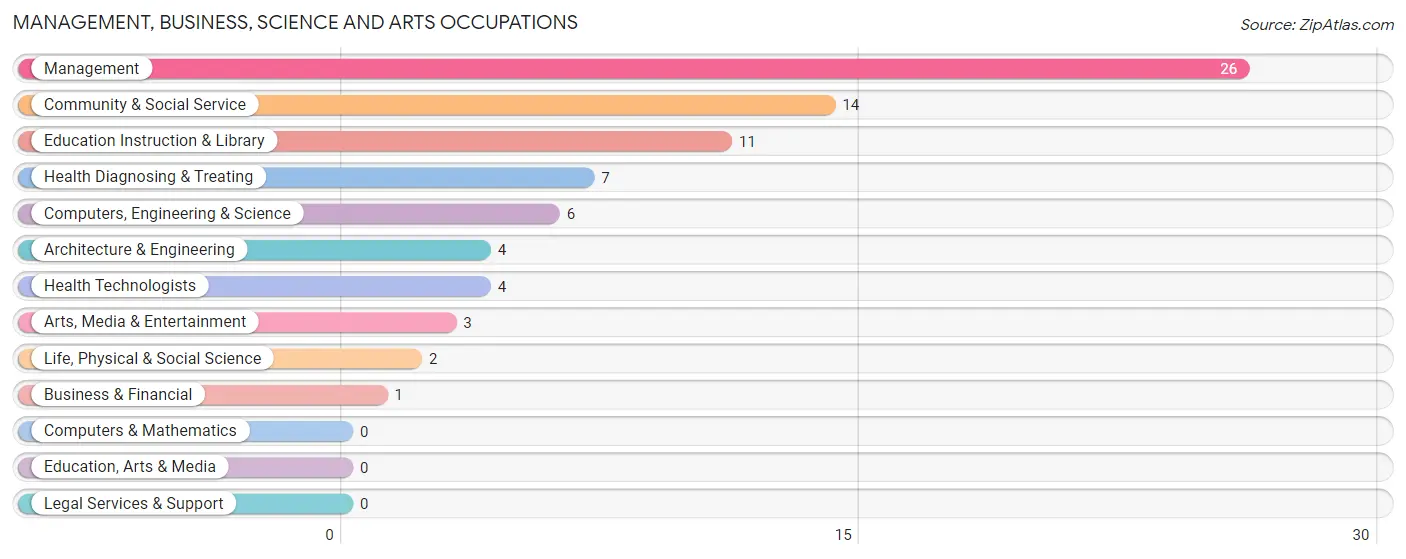
Management, Business, Science and Arts Occupations by Sex
Within the Management, Business, Science and Arts occupations in Schellsburg borough, the most male-oriented occupations are Business & Financial (100.0%), Computers, Engineering & Science (100.0%), and Architecture & Engineering (100.0%), while the most female-oriented occupations are Health Technologists (100.0%), Health Diagnosing & Treating (85.7%), and Management (23.1%).
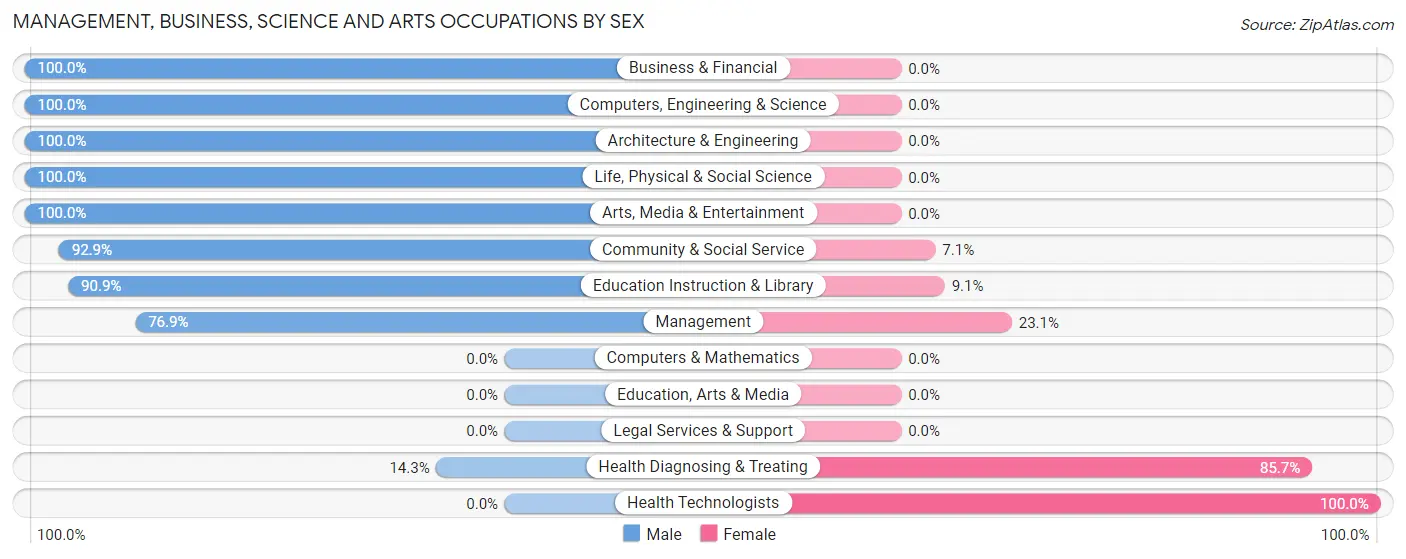
| Occupation | Male | Female |
| Management | 20 (76.9%) | 6 (23.1%) |
| Business & Financial | 1 (100.0%) | 0 (0.0%) |
| Computers, Engineering & Science | 6 (100.0%) | 0 (0.0%) |
| Computers & Mathematics | 0 (0.0%) | 0 (0.0%) |
| Architecture & Engineering | 4 (100.0%) | 0 (0.0%) |
| Life, Physical & Social Science | 2 (100.0%) | 0 (0.0%) |
| Community & Social Service | 13 (92.9%) | 1 (7.1%) |
| Education, Arts & Media | 0 (0.0%) | 0 (0.0%) |
| Legal Services & Support | 0 (0.0%) | 0 (0.0%) |
| Education Instruction & Library | 10 (90.9%) | 1 (9.1%) |
| Arts, Media & Entertainment | 3 (100.0%) | 0 (0.0%) |
| Health Diagnosing & Treating | 1 (14.3%) | 6 (85.7%) |
| Health Technologists | 0 (0.0%) | 4 (100.0%) |
| Total (Category) | 41 (75.9%) | 13 (24.1%) |
| Total (Overall) | 88 (65.7%) | 46 (34.3%) |
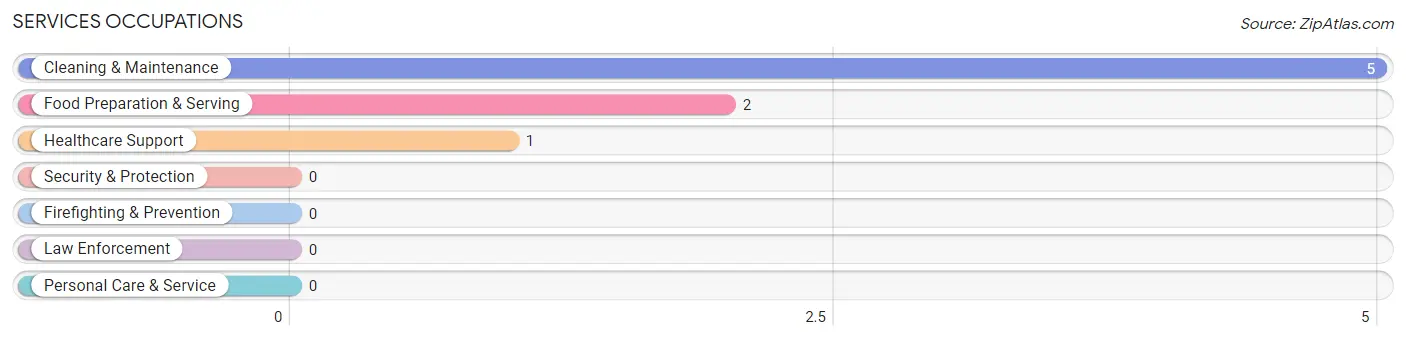
Services Occupations
The most common Services occupations in Schellsburg borough are Cleaning & Maintenance (5 | 3.7%), Food Preparation & Serving (2 | 1.5%), and Healthcare Support (1 | 0.7%).
Services Occupations by Sex
Within the Services occupations in Schellsburg borough, the most male-oriented occupations are Cleaning & Maintenance (100.0%), and Food Preparation & Serving (50.0%), while the most female-oriented occupations are Healthcare Support (100.0%), and Food Preparation & Serving (50.0%).
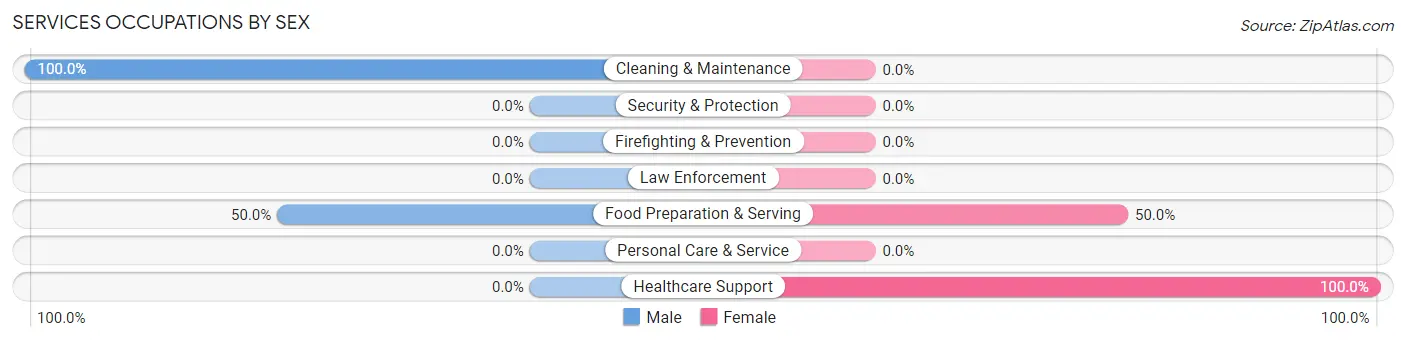
| Occupation | Male | Female |
| Healthcare Support | 0 (0.0%) | 1 (100.0%) |
| Security & Protection | 0 (0.0%) | 0 (0.0%) |
| Firefighting & Prevention | 0 (0.0%) | 0 (0.0%) |
| Law Enforcement | 0 (0.0%) | 0 (0.0%) |
| Food Preparation & Serving | 1 (50.0%) | 1 (50.0%) |
| Cleaning & Maintenance | 5 (100.0%) | 0 (0.0%) |
| Personal Care & Service | 0 (0.0%) | 0 (0.0%) |
| Total (Category) | 6 (75.0%) | 2 (25.0%) |
| Total (Overall) | 88 (65.7%) | 46 (34.3%) |
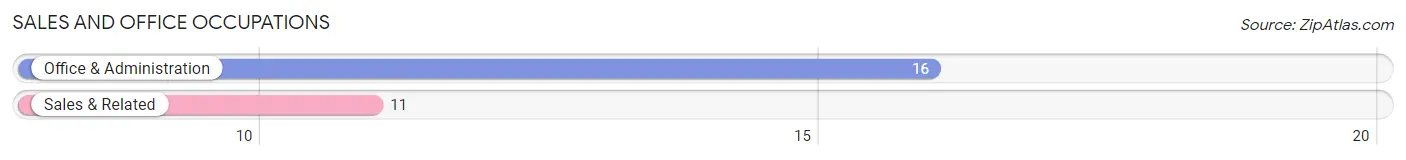
Sales and Office Occupations
The most common Sales and Office occupations in Schellsburg borough are Office & Administration (16 | 11.9%), and Sales & Related (11 | 8.2%).
Sales and Office Occupations by Sex
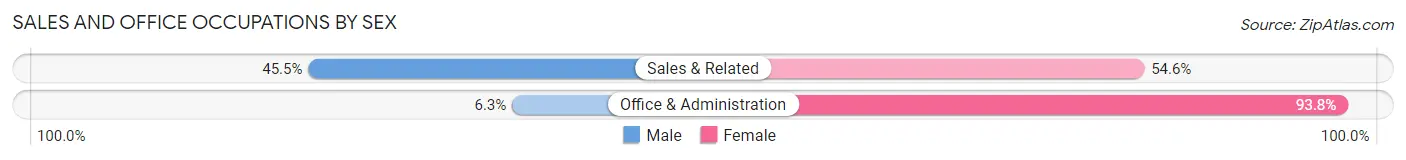
| Occupation | Male | Female |
| Sales & Related | 5 (45.5%) | 6 (54.5%) |
| Office & Administration | 1 (6.2%) | 15 (93.8%) |
| Total (Category) | 6 (22.2%) | 21 (77.8%) |
| Total (Overall) | 88 (65.7%) | 46 (34.3%) |
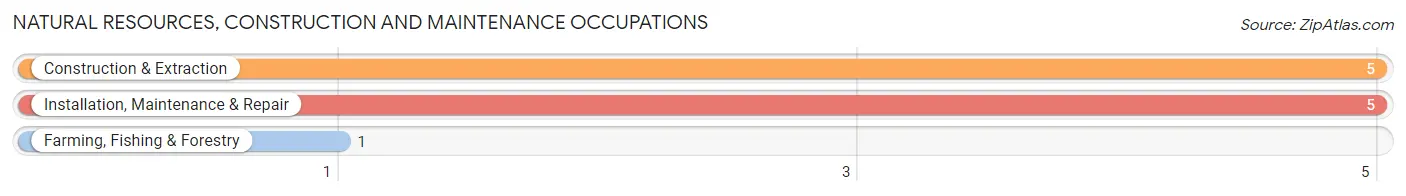
Natural Resources, Construction and Maintenance Occupations
The most common Natural Resources, Construction and Maintenance occupations in Schellsburg borough are Construction & Extraction (5 | 3.7%), Installation, Maintenance & Repair (5 | 3.7%), and Farming, Fishing & Forestry (1 | 0.7%).
Natural Resources, Construction and Maintenance Occupations by Sex
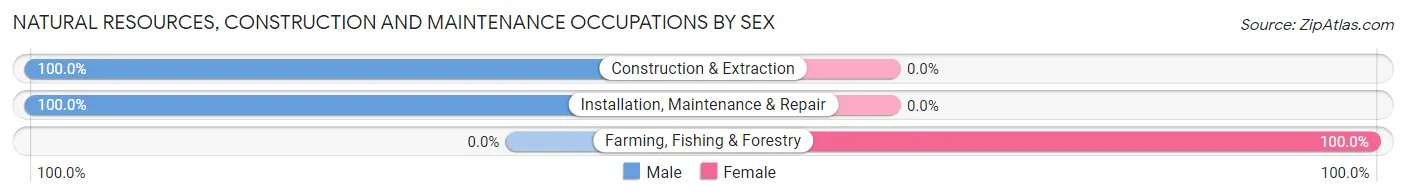
| Occupation | Male | Female |
| Farming, Fishing & Forestry | 0 (0.0%) | 1 (100.0%) |
| Construction & Extraction | 5 (100.0%) | 0 (0.0%) |
| Installation, Maintenance & Repair | 5 (100.0%) | 0 (0.0%) |
| Total (Category) | 10 (90.9%) | 1 (9.1%) |
| Total (Overall) | 88 (65.7%) | 46 (34.3%) |
Production, Transportation and Moving Occupations
The most common Production, Transportation and Moving occupations in Schellsburg borough are Production (16 | 11.9%), Material Moving (12 | 9.0%), and Transportation (6 | 4.5%).
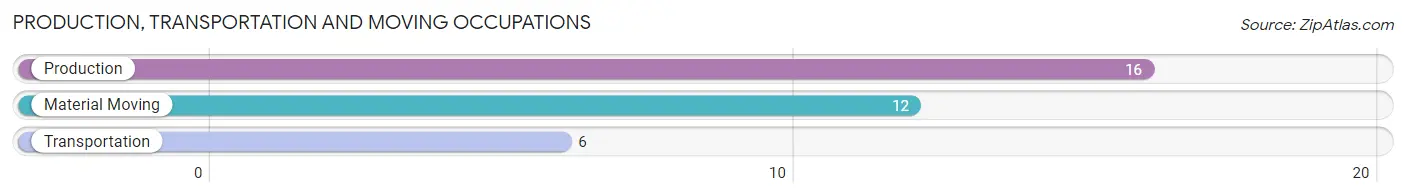
Production, Transportation and Moving Occupations by Sex
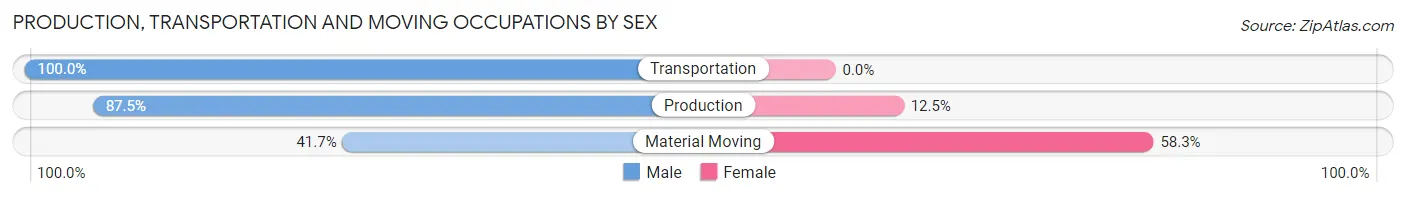
| Occupation | Male | Female |
| Production | 14 (87.5%) | 2 (12.5%) |
| Transportation | 6 (100.0%) | 0 (0.0%) |
| Material Moving | 5 (41.7%) | 7 (58.3%) |
| Total (Category) | 25 (73.5%) | 9 (26.5%) |
| Total (Overall) | 88 (65.7%) | 46 (34.3%) |
Employment Industries by Sex in Schellsburg borough
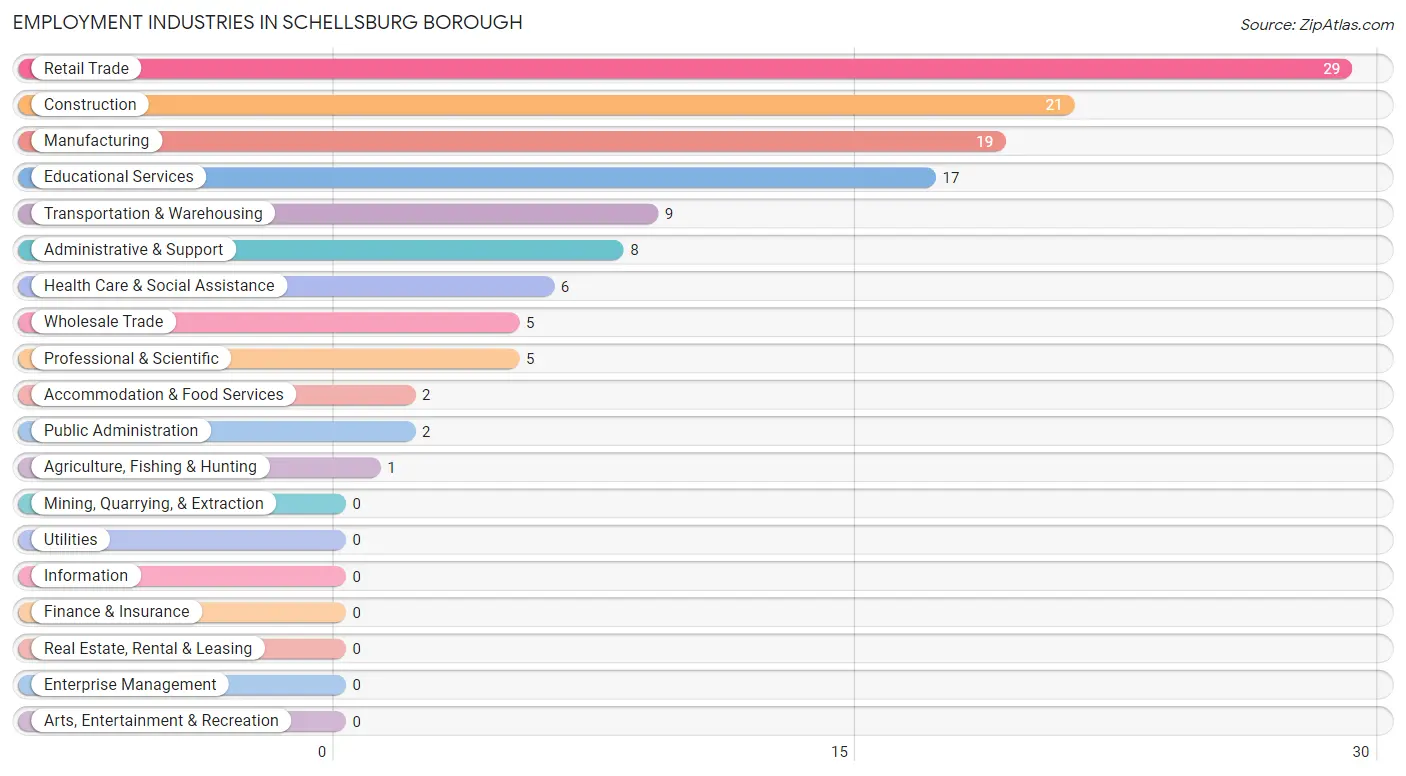
Employment Industries in Schellsburg borough
The major employment industries in Schellsburg borough include Retail Trade (29 | 21.6%), Construction (21 | 15.7%), Manufacturing (19 | 14.2%), Educational Services (17 | 12.7%), and Transportation & Warehousing (9 | 6.7%).
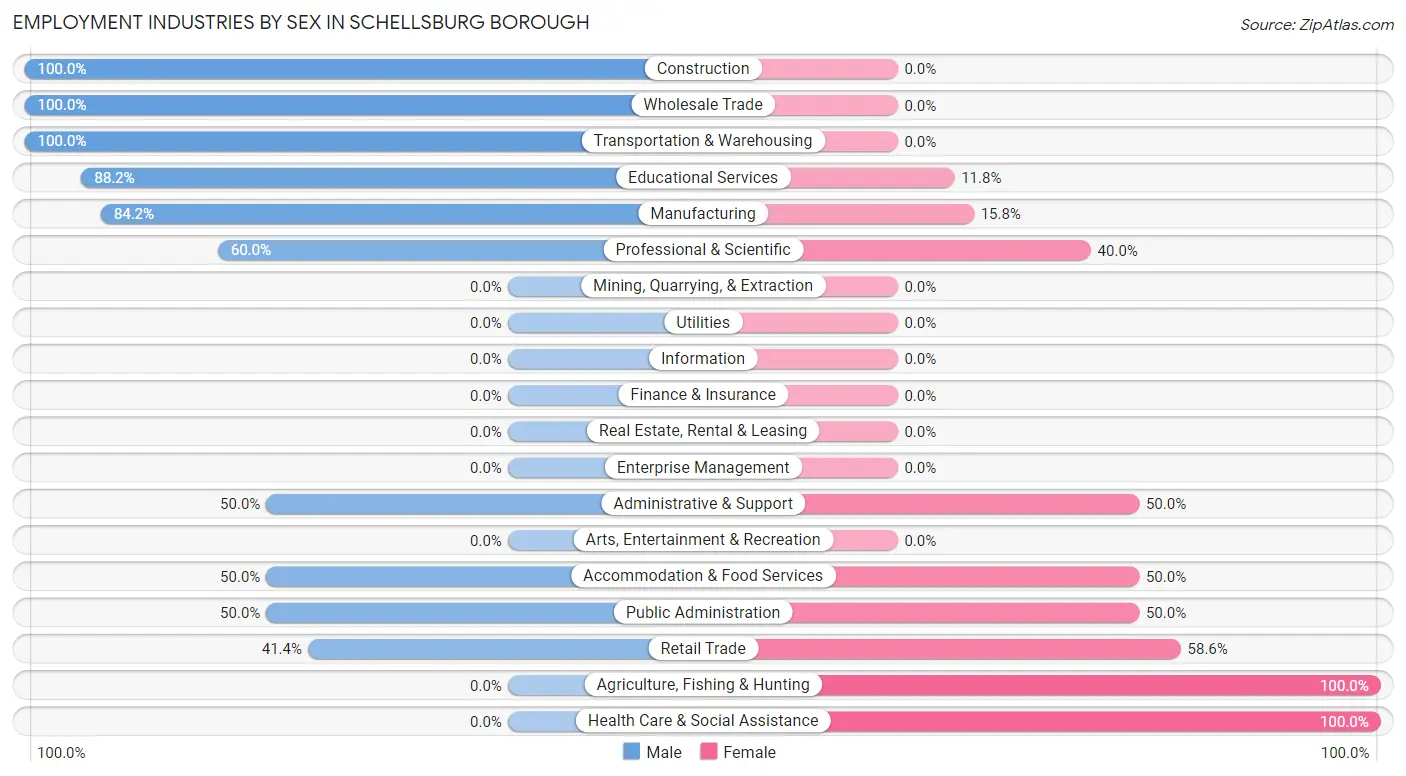
Employment Industries by Sex in Schellsburg borough
The Schellsburg borough industries that see more men than women are Construction (100.0%), Wholesale Trade (100.0%), and Transportation & Warehousing (100.0%), whereas the industries that tend to have a higher number of women are Agriculture, Fishing & Hunting (100.0%), Health Care & Social Assistance (100.0%), and Retail Trade (58.6%).
| Industry | Male | Female |
| Agriculture, Fishing & Hunting | 0 (0.0%) | 1 (100.0%) |
| Mining, Quarrying, & Extraction | 0 (0.0%) | 0 (0.0%) |
| Construction | 21 (100.0%) | 0 (0.0%) |
| Manufacturing | 16 (84.2%) | 3 (15.8%) |
| Wholesale Trade | 5 (100.0%) | 0 (0.0%) |
| Retail Trade | 12 (41.4%) | 17 (58.6%) |
| Transportation & Warehousing | 9 (100.0%) | 0 (0.0%) |
| Utilities | 0 (0.0%) | 0 (0.0%) |
| Information | 0 (0.0%) | 0 (0.0%) |
| Finance & Insurance | 0 (0.0%) | 0 (0.0%) |
| Real Estate, Rental & Leasing | 0 (0.0%) | 0 (0.0%) |
| Professional & Scientific | 3 (60.0%) | 2 (40.0%) |
| Enterprise Management | 0 (0.0%) | 0 (0.0%) |
| Administrative & Support | 4 (50.0%) | 4 (50.0%) |
| Educational Services | 15 (88.2%) | 2 (11.8%) |
| Health Care & Social Assistance | 0 (0.0%) | 6 (100.0%) |
| Arts, Entertainment & Recreation | 0 (0.0%) | 0 (0.0%) |
| Accommodation & Food Services | 1 (50.0%) | 1 (50.0%) |
| Public Administration | 1 (50.0%) | 1 (50.0%) |
| Total | 88 (65.7%) | 46 (34.3%) |
Education in Schellsburg borough
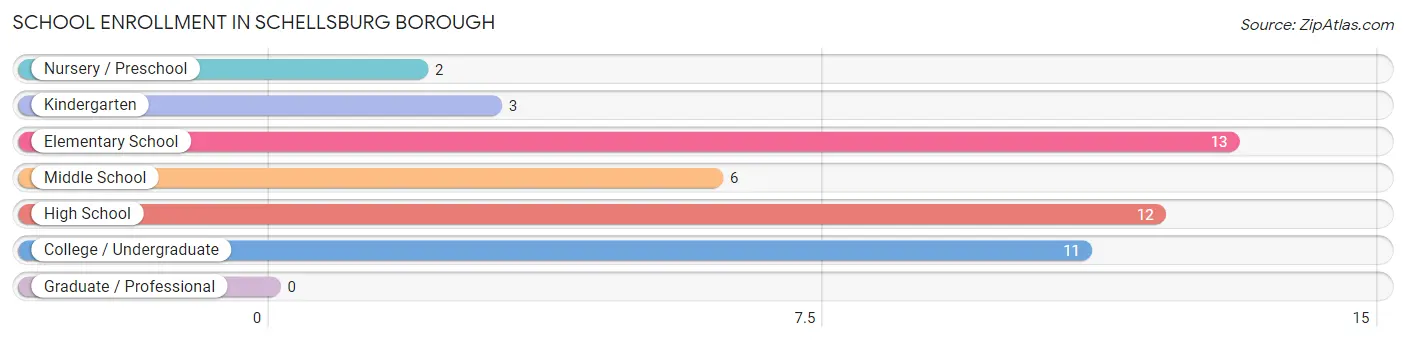
School Enrollment in Schellsburg borough
The most common levels of schooling among the 47 students in Schellsburg borough are elementary school (13 | 27.7%), high school (12 | 25.5%), and college / undergraduate (11 | 23.4%).
| School Level | # Students | % Students |
| Nursery / Preschool | 2 | 4.3% |
| Kindergarten | 3 | 6.4% |
| Elementary School | 13 | 27.7% |
| Middle School | 6 | 12.8% |
| High School | 12 | 25.5% |
| College / Undergraduate | 11 | 23.4% |
| Graduate / Professional | 0 | 0.0% |
| Total | 47 | 100.0% |
School Enrollment by Age by Funding Source in Schellsburg borough
Out of a total of 47 students who are enrolled in schools in Schellsburg borough, 2 (4.3%) attend a private institution, while the remaining 45 (95.7%) are enrolled in public schools. The age group of 35 years and over has the highest likelihood of being enrolled in private schools, with 1 (33.3% in the age bracket) enrolled. Conversely, the age group of 3 to 4 year olds has the lowest likelihood of being enrolled in a private school, with 2 (100.0% in the age bracket) attending a public institution.
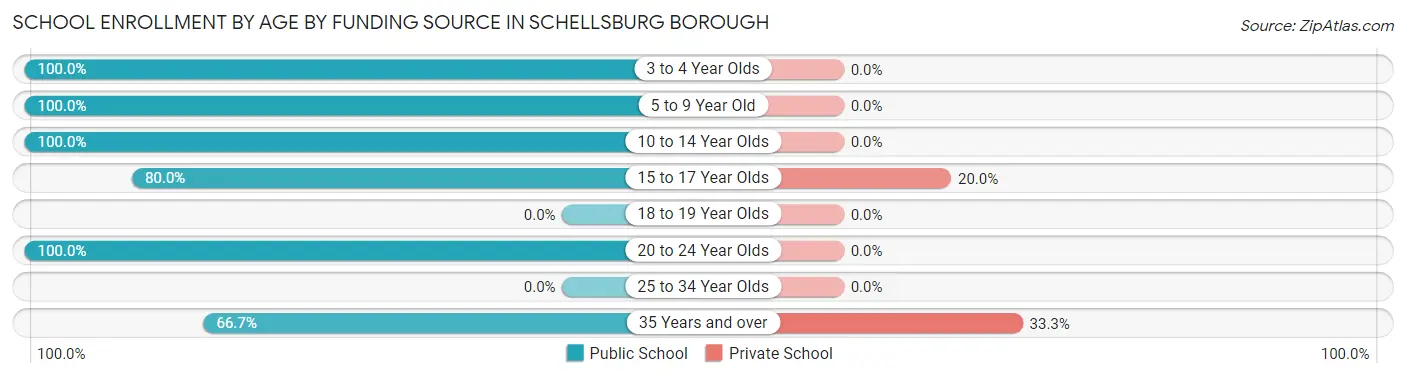
| Age Bracket | Public School | Private School |
| 3 to 4 Year Olds | 2 (100.0%) | 0 (0.0%) |
| 5 to 9 Year Old | 13 (100.0%) | 0 (0.0%) |
| 10 to 14 Year Olds | 16 (100.0%) | 0 (0.0%) |
| 15 to 17 Year Olds | 4 (80.0%) | 1 (20.0%) |
| 18 to 19 Year Olds | 0 (0.0%) | 0 (0.0%) |
| 20 to 24 Year Olds | 8 (100.0%) | 0 (0.0%) |
| 25 to 34 Year Olds | 0 (0.0%) | 0 (0.0%) |
| 35 Years and over | 2 (66.7%) | 1 (33.3%) |
| Total | 45 (95.7%) | 2 (4.3%) |
Educational Attainment by Field of Study in Schellsburg borough
Literature & languages (13 | 31.7%), psychology (10 | 24.4%), education (5 | 12.2%), science & technology (4 | 9.8%), and social sciences (3 | 7.3%) are the most common fields of study among 41 individuals in Schellsburg borough who have obtained a bachelor's degree or higher.
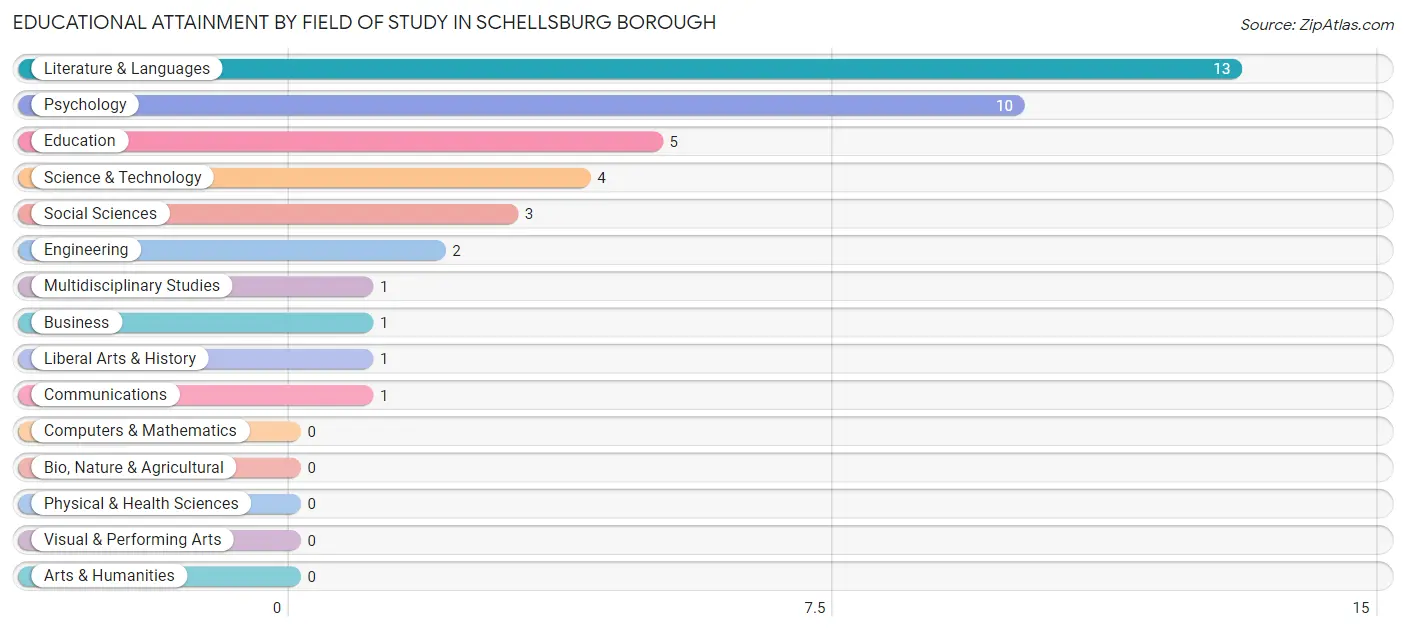
| Field of Study | # Graduates | % Graduates |
| Computers & Mathematics | 0 | 0.0% |
| Bio, Nature & Agricultural | 0 | 0.0% |
| Physical & Health Sciences | 0 | 0.0% |
| Psychology | 10 | 24.4% |
| Social Sciences | 3 | 7.3% |
| Engineering | 2 | 4.9% |
| Multidisciplinary Studies | 1 | 2.4% |
| Science & Technology | 4 | 9.8% |
| Business | 1 | 2.4% |
| Education | 5 | 12.2% |
| Literature & Languages | 13 | 31.7% |
| Liberal Arts & History | 1 | 2.4% |
| Visual & Performing Arts | 0 | 0.0% |
| Communications | 1 | 2.4% |
| Arts & Humanities | 0 | 0.0% |
| Total | 41 | 100.0% |
Transportation & Commute in Schellsburg borough
Vehicle Availability by Sex in Schellsburg borough
The most prevalent vehicle ownership categories in Schellsburg borough are males with 3 vehicles (31, accounting for 35.2%) and females with 3 vehicles (13, making up 68.9%).
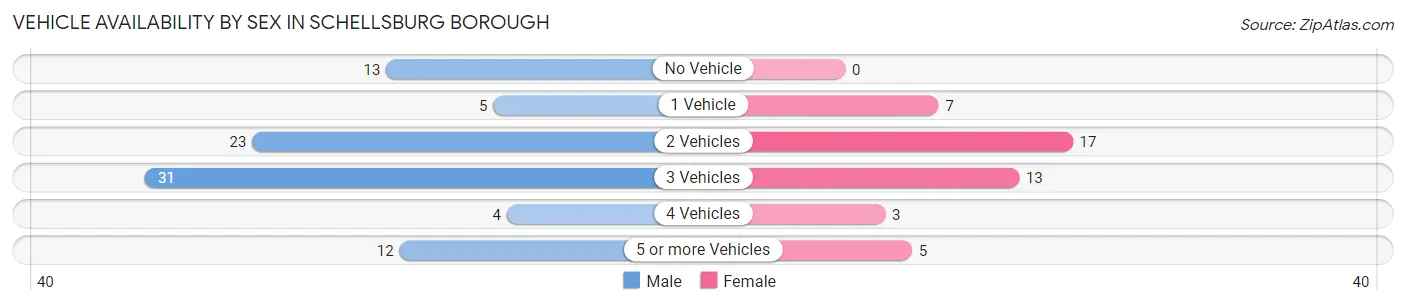
| Vehicles Available | Male | Female |
| No Vehicle | 13 (14.8%) | 0 (0.0%) |
| 1 Vehicle | 5 (5.7%) | 7 (15.6%) |
| 2 Vehicles | 23 (26.1%) | 17 (37.8%) |
| 3 Vehicles | 31 (35.2%) | 13 (28.9%) |
| 4 Vehicles | 4 (4.5%) | 3 (6.7%) |
| 5 or more Vehicles | 12 (13.6%) | 5 (11.1%) |
| Total | 88 (100.0%) | 45 (100.0%) |
Commute Time in Schellsburg borough
The most frequently occuring commute durations in Schellsburg borough are 10 to 14 minutes (21 commuters, 18.3%), 15 to 19 minutes (21 commuters, 18.3%), and 30 to 34 minutes (21 commuters, 18.3%).
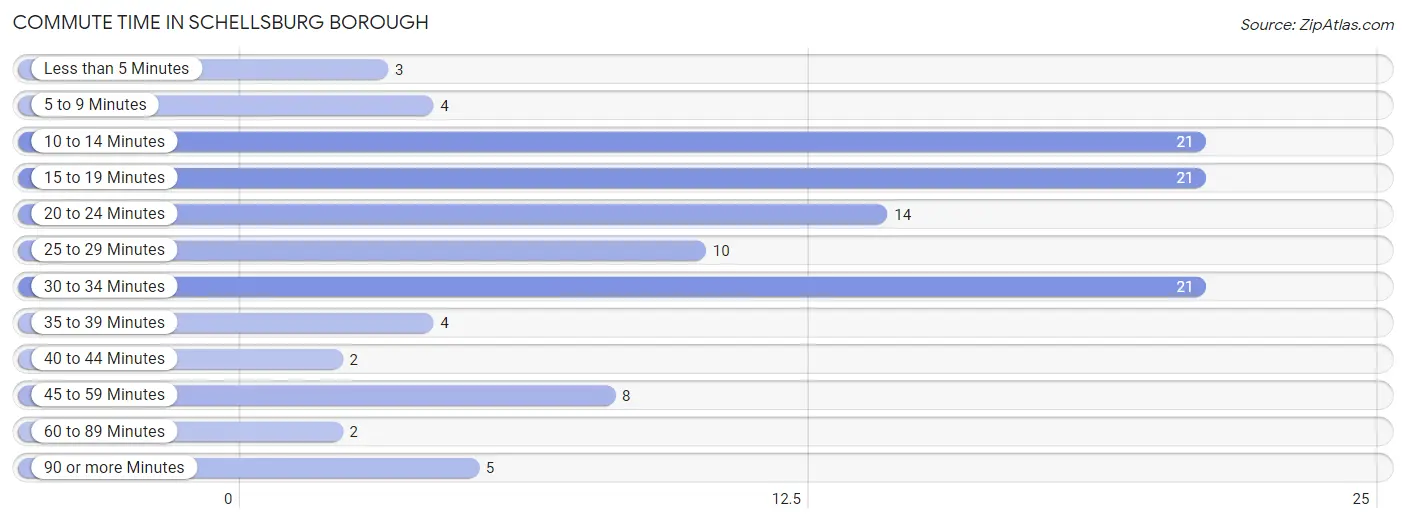
| Commute Time | # Commuters | % Commuters |
| Less than 5 Minutes | 3 | 2.6% |
| 5 to 9 Minutes | 4 | 3.5% |
| 10 to 14 Minutes | 21 | 18.3% |
| 15 to 19 Minutes | 21 | 18.3% |
| 20 to 24 Minutes | 14 | 12.2% |
| 25 to 29 Minutes | 10 | 8.7% |
| 30 to 34 Minutes | 21 | 18.3% |
| 35 to 39 Minutes | 4 | 3.5% |
| 40 to 44 Minutes | 2 | 1.7% |
| 45 to 59 Minutes | 8 | 7.0% |
| 60 to 89 Minutes | 2 | 1.7% |
| 90 or more Minutes | 5 | 4.3% |
Commute Time by Sex in Schellsburg borough
The most common commute times in Schellsburg borough are 10 to 14 minutes (16 commuters, 22.2%) for males and 15 to 19 minutes (14 commuters, 32.6%) for females.
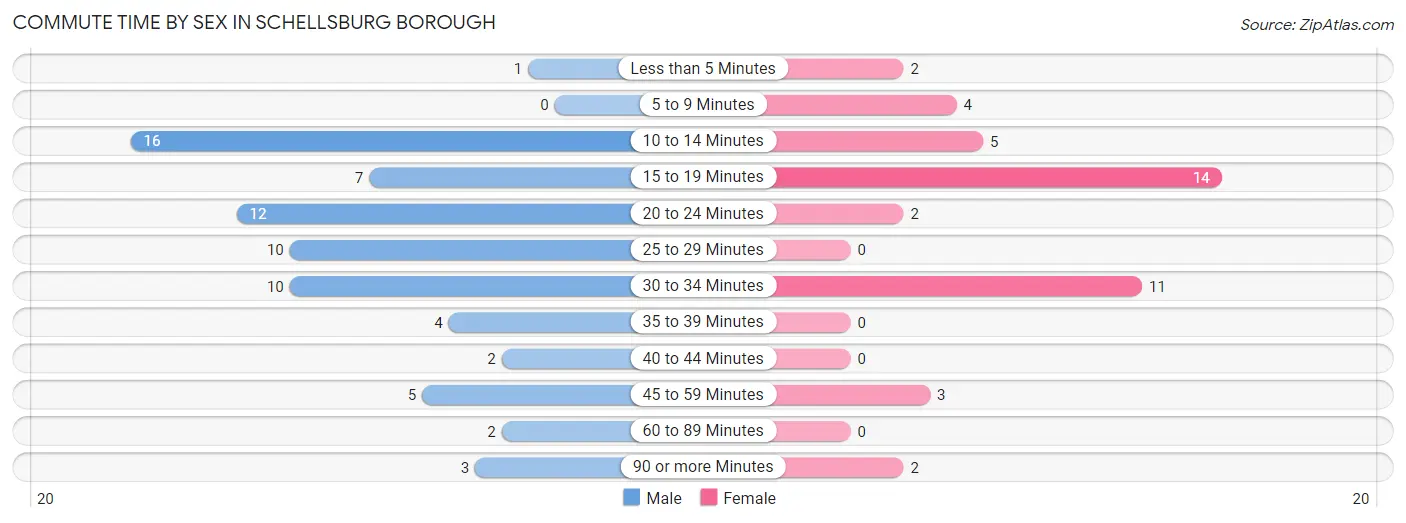
| Commute Time | Male | Female |
| Less than 5 Minutes | 1 (1.4%) | 2 (4.6%) |
| 5 to 9 Minutes | 0 (0.0%) | 4 (9.3%) |
| 10 to 14 Minutes | 16 (22.2%) | 5 (11.6%) |
| 15 to 19 Minutes | 7 (9.7%) | 14 (32.6%) |
| 20 to 24 Minutes | 12 (16.7%) | 2 (4.6%) |
| 25 to 29 Minutes | 10 (13.9%) | 0 (0.0%) |
| 30 to 34 Minutes | 10 (13.9%) | 11 (25.6%) |
| 35 to 39 Minutes | 4 (5.6%) | 0 (0.0%) |
| 40 to 44 Minutes | 2 (2.8%) | 0 (0.0%) |
| 45 to 59 Minutes | 5 (6.9%) | 3 (7.0%) |
| 60 to 89 Minutes | 2 (2.8%) | 0 (0.0%) |
| 90 or more Minutes | 3 (4.2%) | 2 (4.6%) |
Time of Departure to Work by Sex in Schellsburg borough
The most frequent times of departure to work in Schellsburg borough are 6:30 AM to 6:59 AM (16, 22.2%) for males and 6:30 AM to 6:59 AM (11, 25.6%) for females.
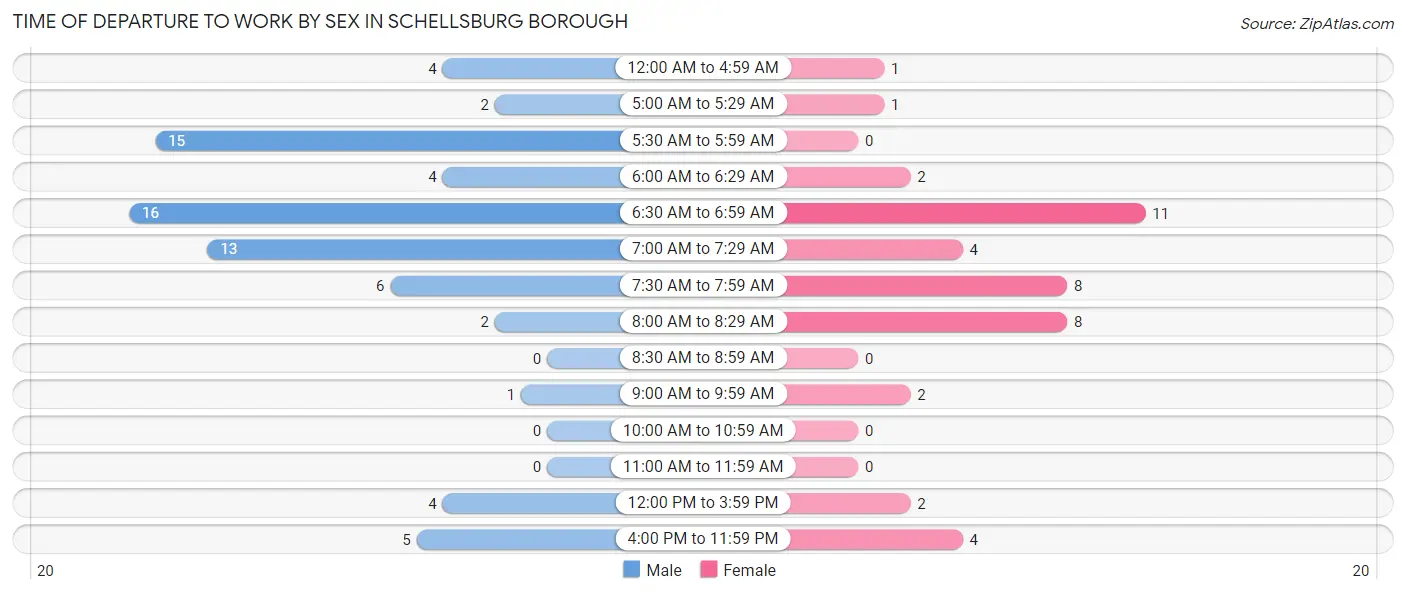
| Time of Departure | Male | Female |
| 12:00 AM to 4:59 AM | 4 (5.6%) | 1 (2.3%) |
| 5:00 AM to 5:29 AM | 2 (2.8%) | 1 (2.3%) |
| 5:30 AM to 5:59 AM | 15 (20.8%) | 0 (0.0%) |
| 6:00 AM to 6:29 AM | 4 (5.6%) | 2 (4.6%) |
| 6:30 AM to 6:59 AM | 16 (22.2%) | 11 (25.6%) |
| 7:00 AM to 7:29 AM | 13 (18.1%) | 4 (9.3%) |
| 7:30 AM to 7:59 AM | 6 (8.3%) | 8 (18.6%) |
| 8:00 AM to 8:29 AM | 2 (2.8%) | 8 (18.6%) |
| 8:30 AM to 8:59 AM | 0 (0.0%) | 0 (0.0%) |
| 9:00 AM to 9:59 AM | 1 (1.4%) | 2 (4.6%) |
| 10:00 AM to 10:59 AM | 0 (0.0%) | 0 (0.0%) |
| 11:00 AM to 11:59 AM | 0 (0.0%) | 0 (0.0%) |
| 12:00 PM to 3:59 PM | 4 (5.6%) | 2 (4.6%) |
| 4:00 PM to 11:59 PM | 5 (6.9%) | 4 (9.3%) |
| Total | 72 (100.0%) | 43 (100.0%) |
Housing Occupancy in Schellsburg borough
Occupancy by Ownership in Schellsburg borough
Of the total 123 dwellings in Schellsburg borough, owner-occupied units account for 86 (69.9%), while renter-occupied units make up 37 (30.1%).
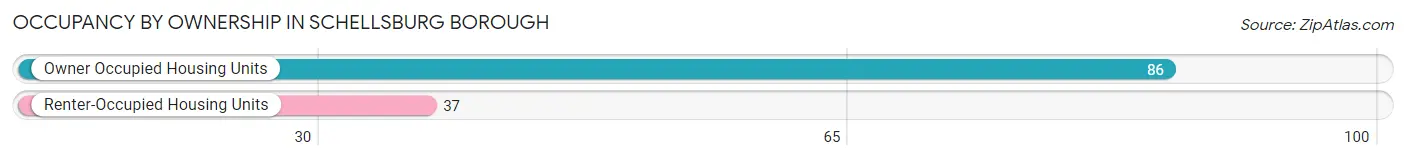
| Occupancy | # Housing Units | % Housing Units |
| Owner Occupied Housing Units | 86 | 69.9% |
| Renter-Occupied Housing Units | 37 | 30.1% |
| Total Occupied Housing Units | 123 | 100.0% |
Occupancy by Household Size in Schellsburg borough
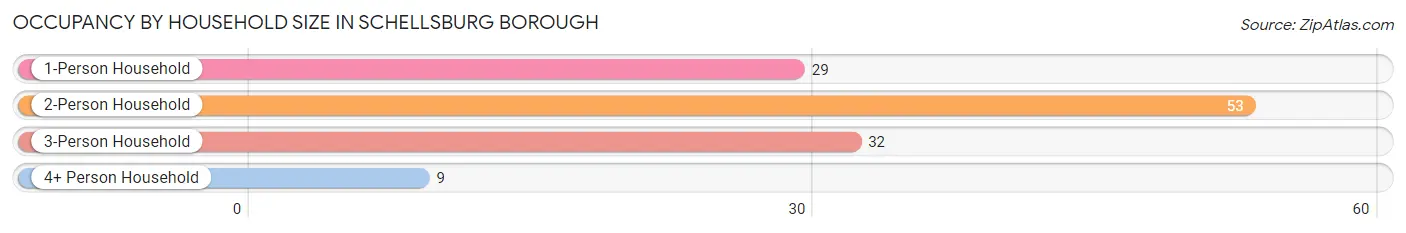
| Household Size | # Housing Units | % Housing Units |
| 1-Person Household | 29 | 23.6% |
| 2-Person Household | 53 | 43.1% |
| 3-Person Household | 32 | 26.0% |
| 4+ Person Household | 9 | 7.3% |
| Total Housing Units | 123 | 100.0% |
Occupancy by Ownership by Household Size in Schellsburg borough
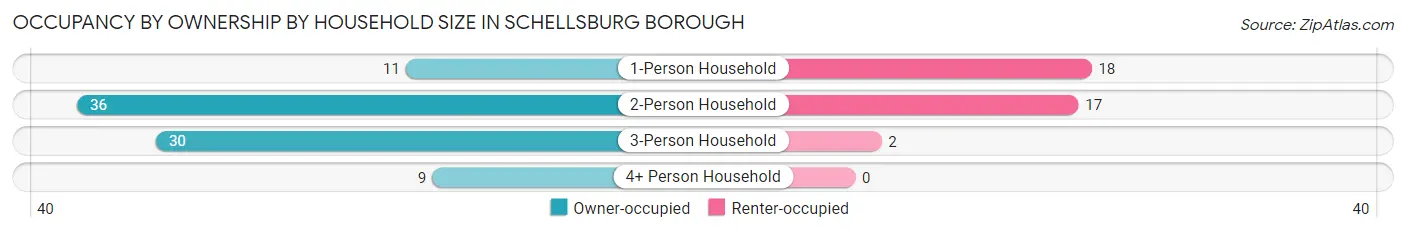
| Household Size | Owner-occupied | Renter-occupied |
| 1-Person Household | 11 (37.9%) | 18 (62.1%) |
| 2-Person Household | 36 (67.9%) | 17 (32.1%) |
| 3-Person Household | 30 (93.8%) | 2 (6.2%) |
| 4+ Person Household | 9 (100.0%) | 0 (0.0%) |
| Total Housing Units | 86 (69.9%) | 37 (30.1%) |
Occupancy by Educational Attainment in Schellsburg borough
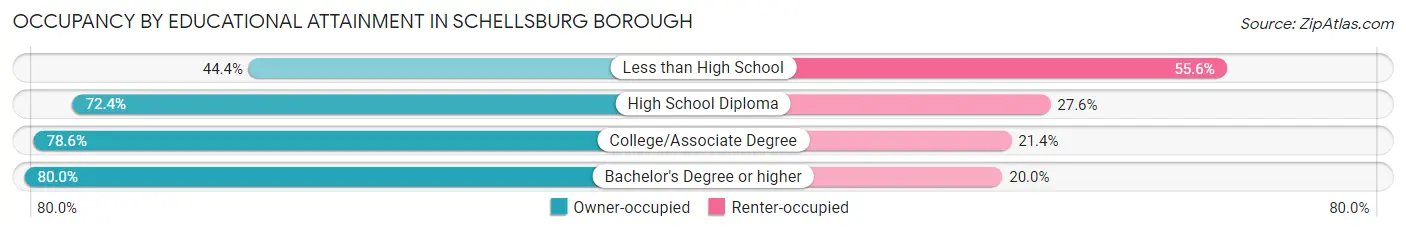
| Household Size | Owner-occupied | Renter-occupied |
| Less than High School | 8 (44.4%) | 10 (55.6%) |
| High School Diploma | 55 (72.4%) | 21 (27.6%) |
| College/Associate Degree | 11 (78.6%) | 3 (21.4%) |
| Bachelor's Degree or higher | 12 (80.0%) | 3 (20.0%) |
Occupancy by Age of Householder in Schellsburg borough
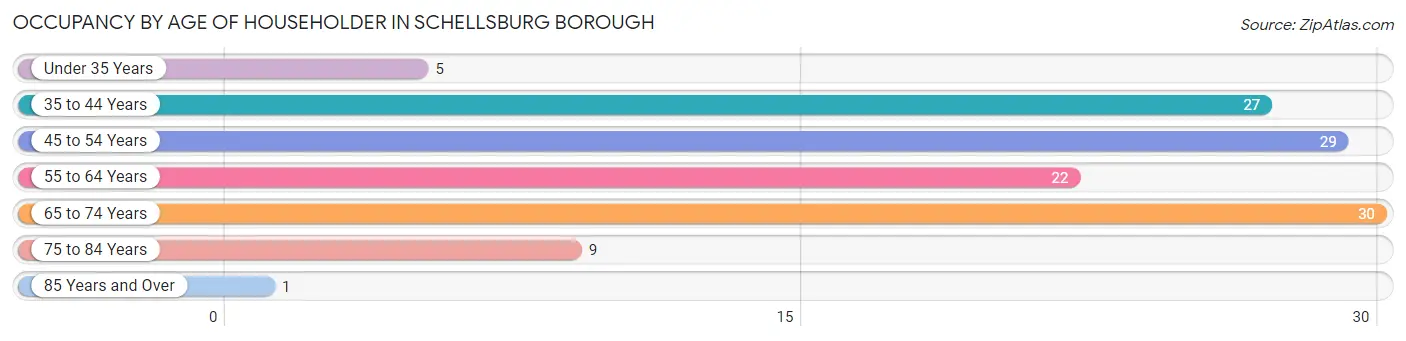
| Age Bracket | # Households | % Households |
| Under 35 Years | 5 | 4.1% |
| 35 to 44 Years | 27 | 22.0% |
| 45 to 54 Years | 29 | 23.6% |
| 55 to 64 Years | 22 | 17.9% |
| 65 to 74 Years | 30 | 24.4% |
| 75 to 84 Years | 9 | 7.3% |
| 85 Years and Over | 1 | 0.8% |
| Total | 123 | 100.0% |
Housing Finances in Schellsburg borough
Median Income by Occupancy in Schellsburg borough
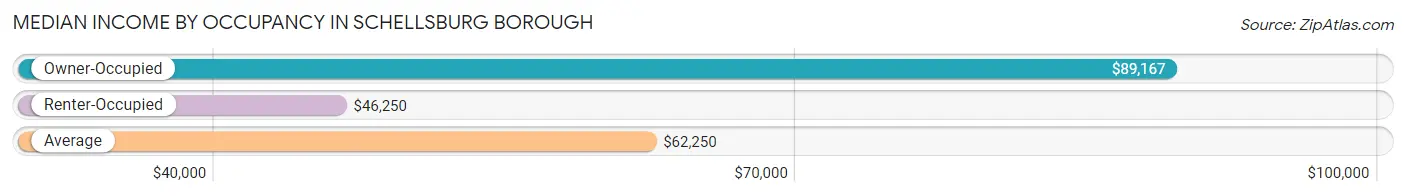
| Occupancy Type | # Households | Median Income |
| Owner-Occupied | 86 (69.9%) | $89,167 |
| Renter-Occupied | 37 (30.1%) | $46,250 |
| Average | 123 (100.0%) | $62,250 |
Occupancy by Householder Income Bracket in Schellsburg borough
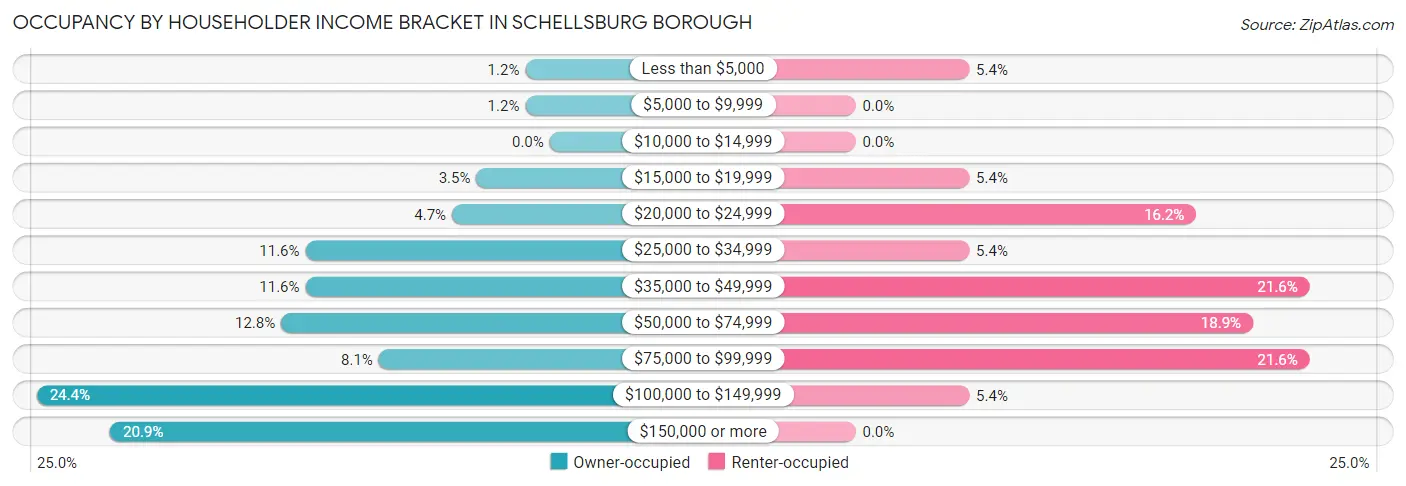
| Income Bracket | Owner-occupied | Renter-occupied |
| Less than $5,000 | 1 (1.2%) | 2 (5.4%) |
| $5,000 to $9,999 | 1 (1.2%) | 0 (0.0%) |
| $10,000 to $14,999 | 0 (0.0%) | 0 (0.0%) |
| $15,000 to $19,999 | 3 (3.5%) | 2 (5.4%) |
| $20,000 to $24,999 | 4 (4.6%) | 6 (16.2%) |
| $25,000 to $34,999 | 10 (11.6%) | 2 (5.4%) |
| $35,000 to $49,999 | 10 (11.6%) | 8 (21.6%) |
| $50,000 to $74,999 | 11 (12.8%) | 7 (18.9%) |
| $75,000 to $99,999 | 7 (8.1%) | 8 (21.6%) |
| $100,000 to $149,999 | 21 (24.4%) | 2 (5.4%) |
| $150,000 or more | 18 (20.9%) | 0 (0.0%) |
| Total | 86 (100.0%) | 37 (100.0%) |
Monthly Housing Cost Tiers in Schellsburg borough
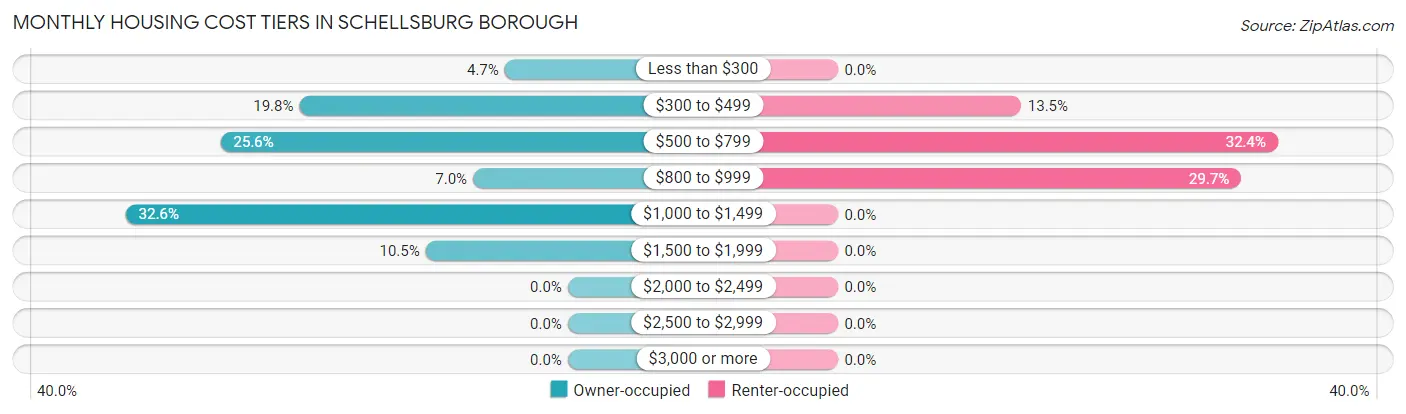
| Monthly Cost | Owner-occupied | Renter-occupied |
| Less than $300 | 4 (4.6%) | 0 (0.0%) |
| $300 to $499 | 17 (19.8%) | 5 (13.5%) |
| $500 to $799 | 22 (25.6%) | 12 (32.4%) |
| $800 to $999 | 6 (7.0%) | 11 (29.7%) |
| $1,000 to $1,499 | 28 (32.6%) | 0 (0.0%) |
| $1,500 to $1,999 | 9 (10.5%) | 0 (0.0%) |
| $2,000 to $2,499 | 0 (0.0%) | 0 (0.0%) |
| $2,500 to $2,999 | 0 (0.0%) | 0 (0.0%) |
| $3,000 or more | 0 (0.0%) | 0 (0.0%) |
| Total | 86 (100.0%) | 37 (100.0%) |
Physical Housing Characteristics in Schellsburg borough
Housing Structures in Schellsburg borough
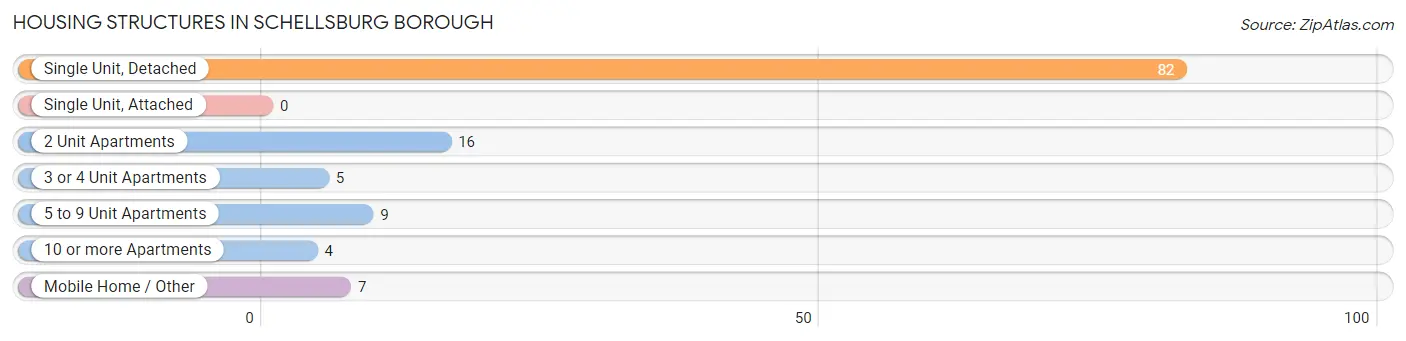
| Structure Type | # Housing Units | % Housing Units |
| Single Unit, Detached | 82 | 66.7% |
| Single Unit, Attached | 0 | 0.0% |
| 2 Unit Apartments | 16 | 13.0% |
| 3 or 4 Unit Apartments | 5 | 4.1% |
| 5 to 9 Unit Apartments | 9 | 7.3% |
| 10 or more Apartments | 4 | 3.3% |
| Mobile Home / Other | 7 | 5.7% |
| Total | 123 | 100.0% |
Housing Structures by Occupancy in Schellsburg borough
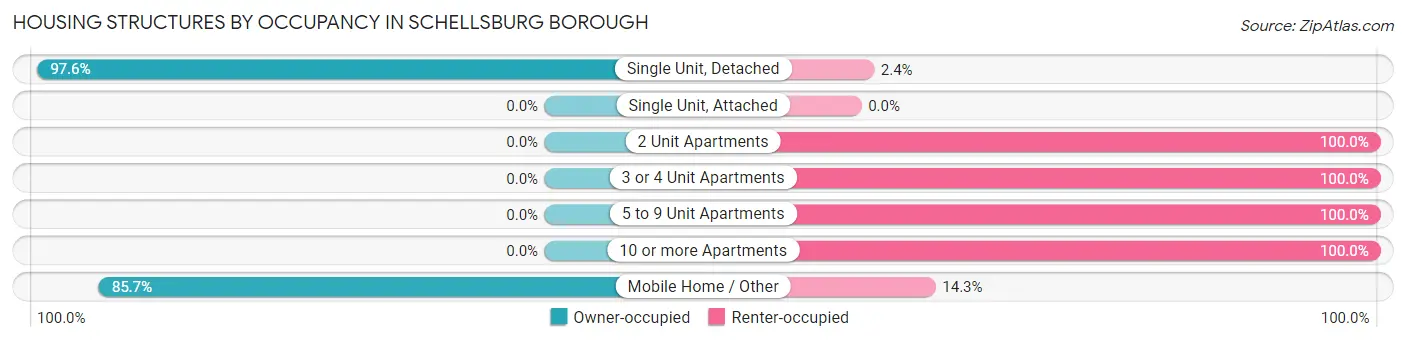
| Structure Type | Owner-occupied | Renter-occupied |
| Single Unit, Detached | 80 (97.6%) | 2 (2.4%) |
| Single Unit, Attached | 0 (0.0%) | 0 (0.0%) |
| 2 Unit Apartments | 0 (0.0%) | 16 (100.0%) |
| 3 or 4 Unit Apartments | 0 (0.0%) | 5 (100.0%) |
| 5 to 9 Unit Apartments | 0 (0.0%) | 9 (100.0%) |
| 10 or more Apartments | 0 (0.0%) | 4 (100.0%) |
| Mobile Home / Other | 6 (85.7%) | 1 (14.3%) |
| Total | 86 (69.9%) | 37 (30.1%) |
Housing Structures by Number of Rooms in Schellsburg borough
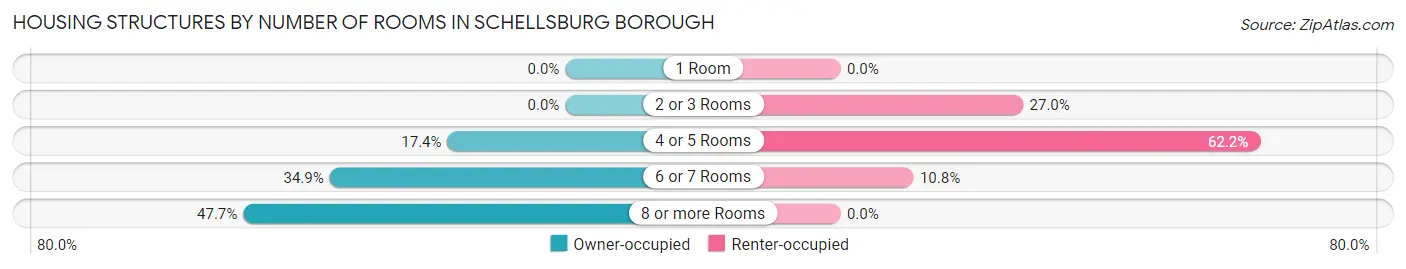
| Number of Rooms | Owner-occupied | Renter-occupied |
| 1 Room | 0 (0.0%) | 0 (0.0%) |
| 2 or 3 Rooms | 0 (0.0%) | 10 (27.0%) |
| 4 or 5 Rooms | 15 (17.4%) | 23 (62.2%) |
| 6 or 7 Rooms | 30 (34.9%) | 4 (10.8%) |
| 8 or more Rooms | 41 (47.7%) | 0 (0.0%) |
| Total | 86 (100.0%) | 37 (100.0%) |
Housing Structure by Heating Type in Schellsburg borough
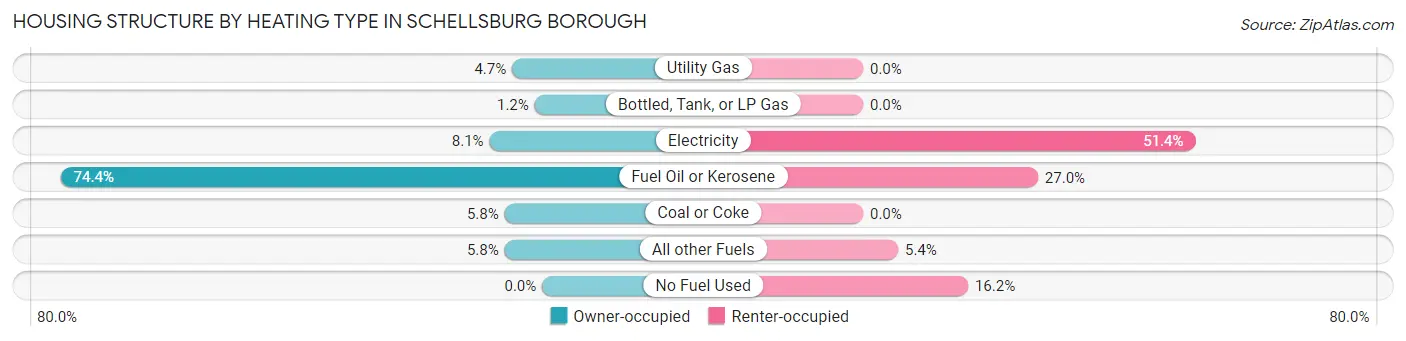
| Heating Type | Owner-occupied | Renter-occupied |
| Utility Gas | 4 (4.6%) | 0 (0.0%) |
| Bottled, Tank, or LP Gas | 1 (1.2%) | 0 (0.0%) |
| Electricity | 7 (8.1%) | 19 (51.3%) |
| Fuel Oil or Kerosene | 64 (74.4%) | 10 (27.0%) |
| Coal or Coke | 5 (5.8%) | 0 (0.0%) |
| All other Fuels | 5 (5.8%) | 2 (5.4%) |
| No Fuel Used | 0 (0.0%) | 6 (16.2%) |
| Total | 86 (100.0%) | 37 (100.0%) |
Household Vehicle Usage in Schellsburg borough
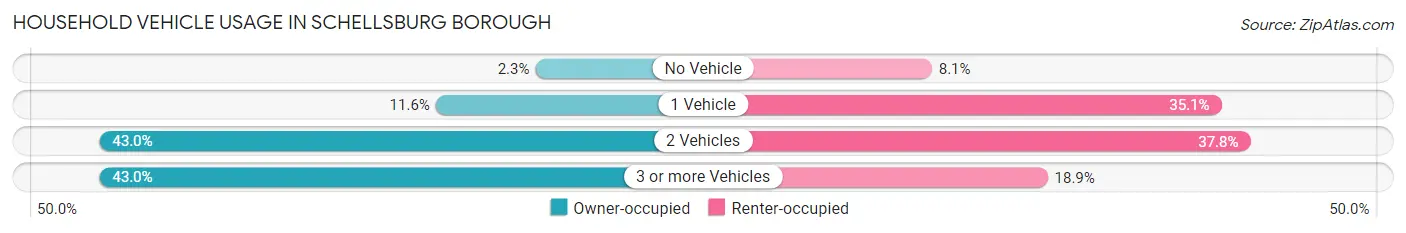
| Vehicles per Household | Owner-occupied | Renter-occupied |
| No Vehicle | 2 (2.3%) | 3 (8.1%) |
| 1 Vehicle | 10 (11.6%) | 13 (35.1%) |
| 2 Vehicles | 37 (43.0%) | 14 (37.8%) |
| 3 or more Vehicles | 37 (43.0%) | 7 (18.9%) |
| Total | 86 (100.0%) | 37 (100.0%) |
Real Estate & Mortgages in Schellsburg borough
Real Estate and Mortgage Overview in Schellsburg borough
| Characteristic | Without Mortgage | With Mortgage |
| Housing Units | 37 | 49 |
| Median Property Value | $131,300 | $120,800 |
| Median Household Income | $50,625 | $16 |
| Monthly Housing Costs | $469 | $0 |
| Real Estate Taxes | $1,341 | $0 |
Property Value by Mortgage Status in Schellsburg borough
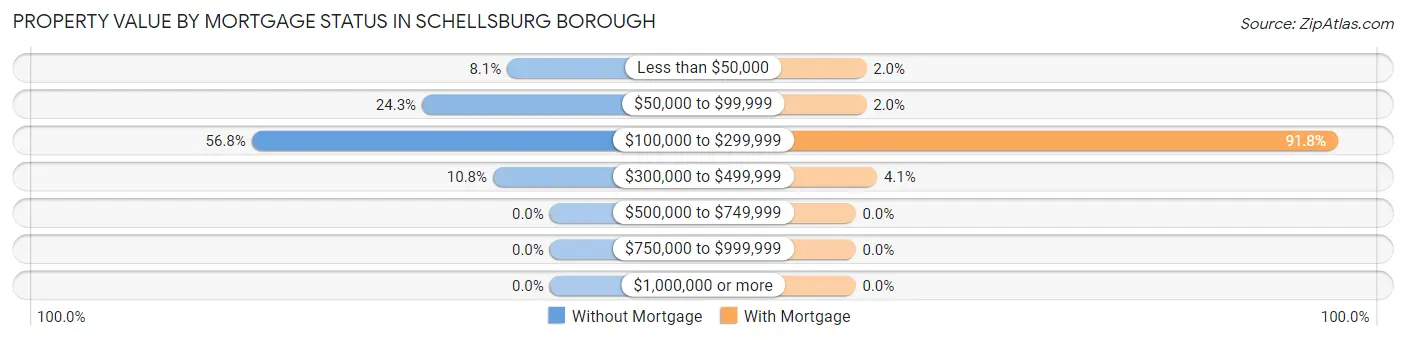
| Property Value | Without Mortgage | With Mortgage |
| Less than $50,000 | 3 (8.1%) | 1 (2.0%) |
| $50,000 to $99,999 | 9 (24.3%) | 1 (2.0%) |
| $100,000 to $299,999 | 21 (56.8%) | 45 (91.8%) |
| $300,000 to $499,999 | 4 (10.8%) | 2 (4.1%) |
| $500,000 to $749,999 | 0 (0.0%) | 0 (0.0%) |
| $750,000 to $999,999 | 0 (0.0%) | 0 (0.0%) |
| $1,000,000 or more | 0 (0.0%) | 0 (0.0%) |
| Total | 37 (100.0%) | 49 (100.0%) |
Household Income by Mortgage Status in Schellsburg borough
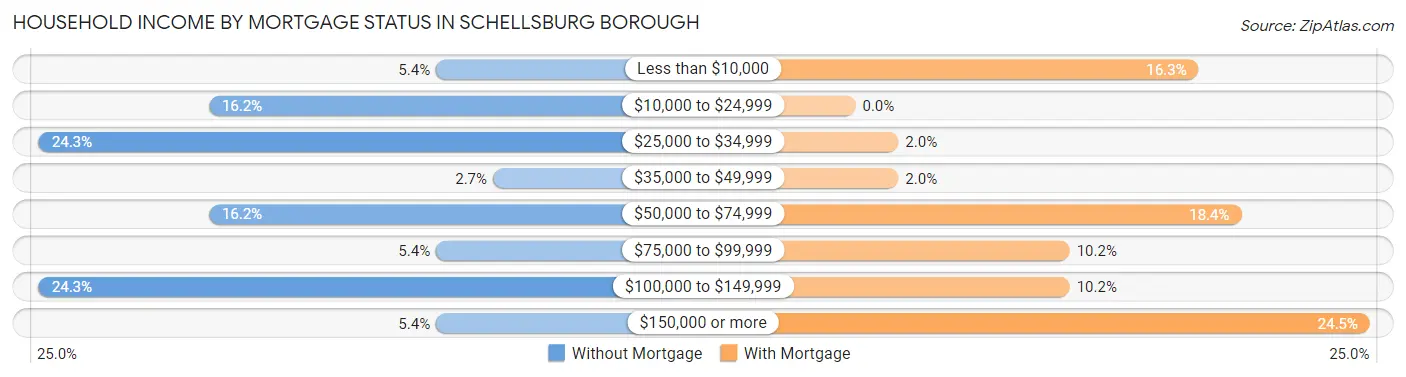
| Household Income | Without Mortgage | With Mortgage |
| Less than $10,000 | 2 (5.4%) | 8 (16.3%) |
| $10,000 to $24,999 | 6 (16.2%) | 0 (0.0%) |
| $25,000 to $34,999 | 9 (24.3%) | 1 (2.0%) |
| $35,000 to $49,999 | 1 (2.7%) | 1 (2.0%) |
| $50,000 to $74,999 | 6 (16.2%) | 9 (18.4%) |
| $75,000 to $99,999 | 2 (5.4%) | 5 (10.2%) |
| $100,000 to $149,999 | 9 (24.3%) | 5 (10.2%) |
| $150,000 or more | 2 (5.4%) | 12 (24.5%) |
| Total | 37 (100.0%) | 49 (100.0%) |
Property Value to Household Income Ratio in Schellsburg borough
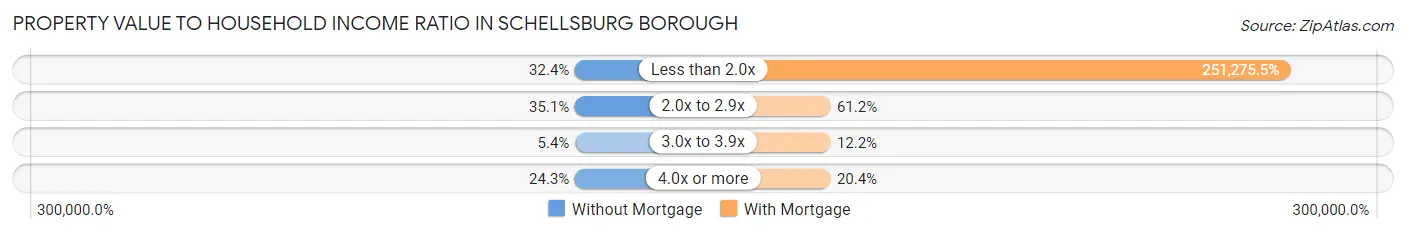
| Value-to-Income Ratio | Without Mortgage | With Mortgage |
| Less than 2.0x | 12 (32.4%) | 123,125 (251,275.5%) |
| 2.0x to 2.9x | 13 (35.1%) | 30 (61.2%) |
| 3.0x to 3.9x | 2 (5.4%) | 6 (12.2%) |
| 4.0x or more | 9 (24.3%) | 10 (20.4%) |
| Total | 37 (100.0%) | 49 (100.0%) |
Real Estate Taxes by Mortgage Status in Schellsburg borough
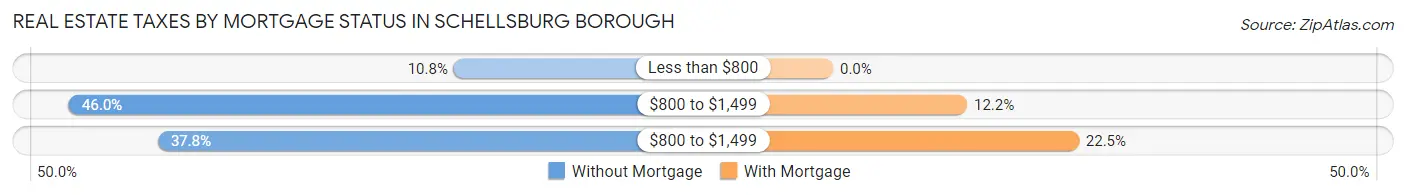
| Property Taxes | Without Mortgage | With Mortgage |
| Less than $800 | 4 (10.8%) | 0 (0.0%) |
| $800 to $1,499 | 17 (46.0%) | 6 (12.2%) |
| $800 to $1,499 | 14 (37.8%) | 11 (22.5%) |
| Total | 37 (100.0%) | 49 (100.0%) |
Health & Disability in Schellsburg borough
Health Insurance Coverage by Age in Schellsburg borough
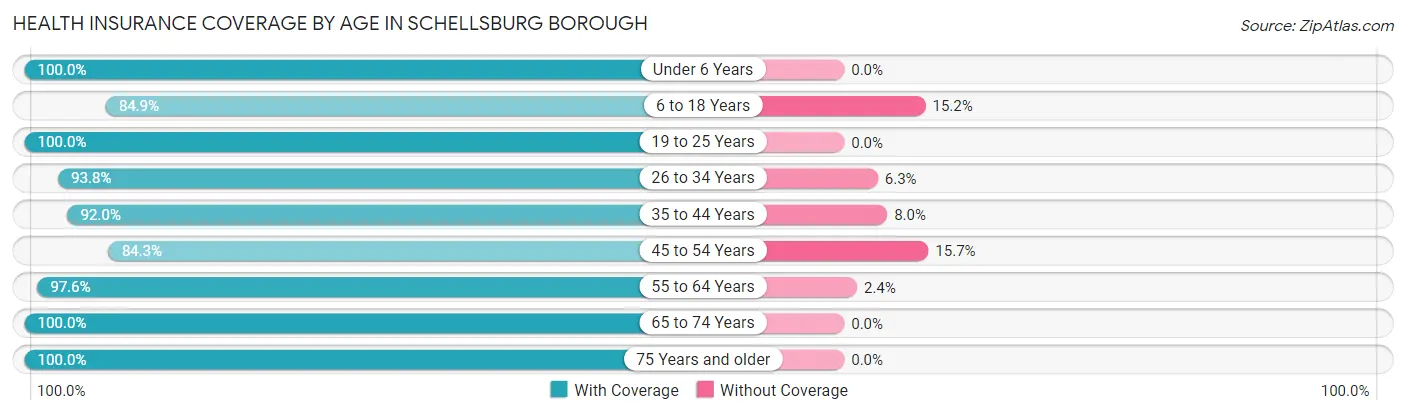
| Age Bracket | With Coverage | Without Coverage |
| Under 6 Years | 20 (100.0%) | 0 (0.0%) |
| 6 to 18 Years | 28 (84.9%) | 5 (15.1%) |
| 19 to 25 Years | 17 (100.0%) | 0 (0.0%) |
| 26 to 34 Years | 15 (93.8%) | 1 (6.2%) |
| 35 to 44 Years | 46 (92.0%) | 4 (8.0%) |
| 45 to 54 Years | 43 (84.3%) | 8 (15.7%) |
| 55 to 64 Years | 41 (97.6%) | 1 (2.4%) |
| 65 to 74 Years | 44 (100.0%) | 0 (0.0%) |
| 75 Years and older | 26 (100.0%) | 0 (0.0%) |
| Total | 280 (93.6%) | 19 (6.4%) |
Health Insurance Coverage by Citizenship Status in Schellsburg borough
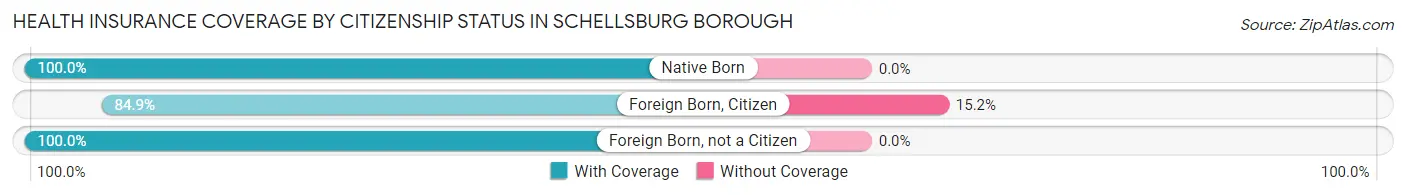
| Citizenship Status | With Coverage | Without Coverage |
| Native Born | 20 (100.0%) | 0 (0.0%) |
| Foreign Born, Citizen | 28 (84.9%) | 5 (15.1%) |
| Foreign Born, not a Citizen | 17 (100.0%) | 0 (0.0%) |
Health Insurance Coverage by Household Income in Schellsburg borough
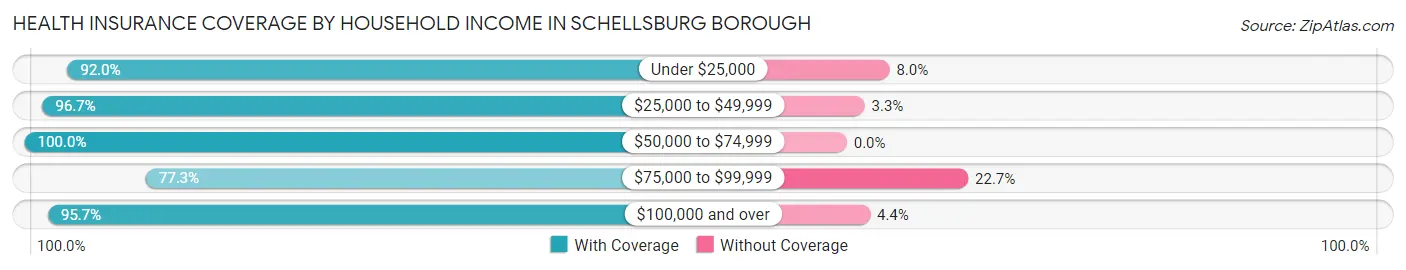
| Household Income | With Coverage | Without Coverage |
| Under $25,000 | 23 (92.0%) | 2 (8.0%) |
| $25,000 to $49,999 | 58 (96.7%) | 2 (3.3%) |
| $50,000 to $74,999 | 49 (100.0%) | 0 (0.0%) |
| $75,000 to $99,999 | 34 (77.3%) | 10 (22.7%) |
| $100,000 and over | 110 (95.7%) | 5 (4.3%) |
Public vs Private Health Insurance Coverage by Age in Schellsburg borough
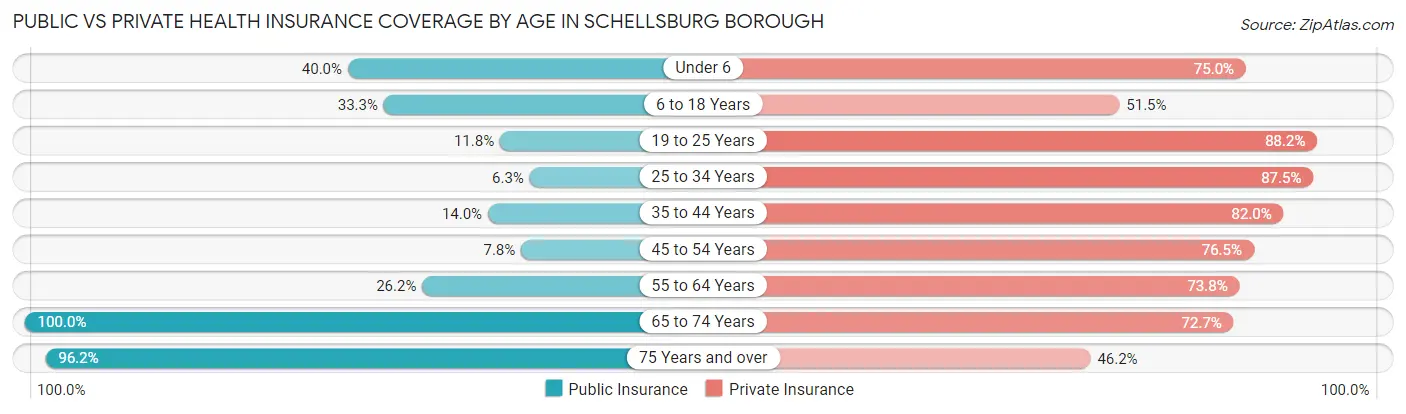
| Age Bracket | Public Insurance | Private Insurance |
| Under 6 | 8 (40.0%) | 15 (75.0%) |
| 6 to 18 Years | 11 (33.3%) | 17 (51.5%) |
| 19 to 25 Years | 2 (11.8%) | 15 (88.2%) |
| 25 to 34 Years | 1 (6.2%) | 14 (87.5%) |
| 35 to 44 Years | 7 (14.0%) | 41 (82.0%) |
| 45 to 54 Years | 4 (7.8%) | 39 (76.5%) |
| 55 to 64 Years | 11 (26.2%) | 31 (73.8%) |
| 65 to 74 Years | 44 (100.0%) | 32 (72.7%) |
| 75 Years and over | 25 (96.2%) | 12 (46.2%) |
| Total | 113 (37.8%) | 216 (72.2%) |
Disability Status by Sex by Age in Schellsburg borough
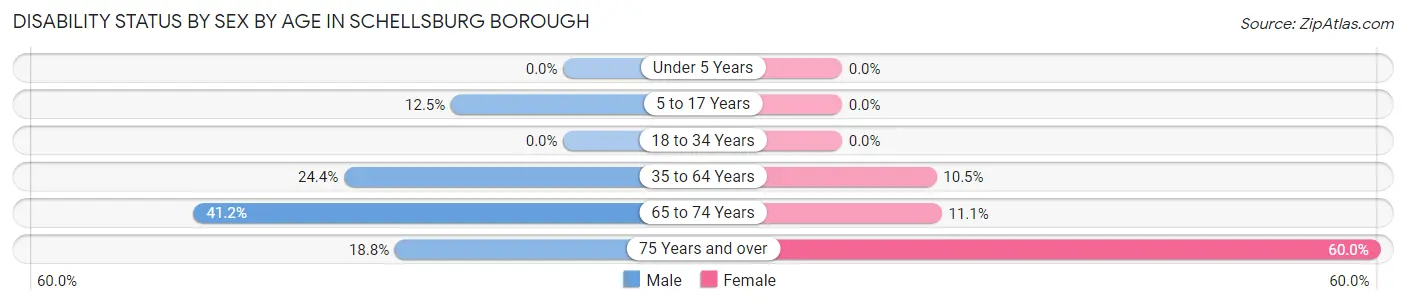
| Age Bracket | Male | Female |
| Under 5 Years | 0 (0.0%) | 0 (0.0%) |
| 5 to 17 Years | 3 (12.5%) | 0 (0.0%) |
| 18 to 34 Years | 0 (0.0%) | 0 (0.0%) |
| 35 to 64 Years | 21 (24.4%) | 6 (10.5%) |
| 65 to 74 Years | 7 (41.2%) | 3 (11.1%) |
| 75 Years and over | 3 (18.8%) | 6 (60.0%) |
Disability Class by Sex by Age in Schellsburg borough
Disability Class: Hearing Difficulty
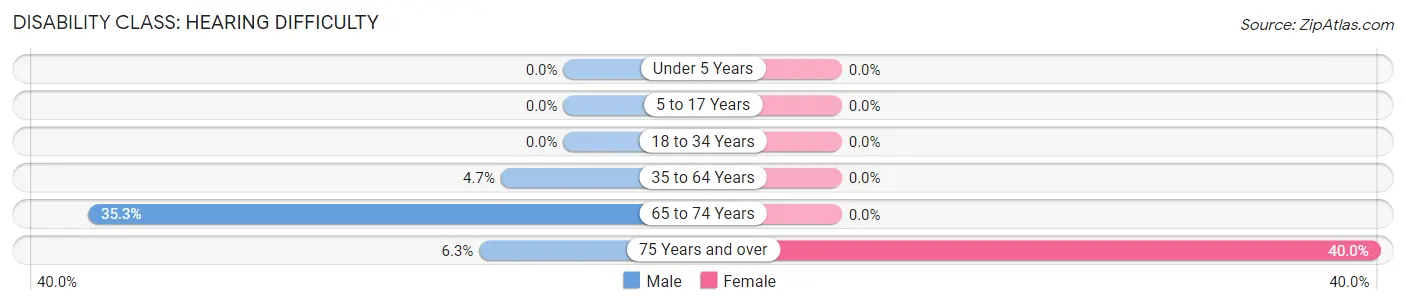
| Age Bracket | Male | Female |
| Under 5 Years | 0 (0.0%) | 0 (0.0%) |
| 5 to 17 Years | 0 (0.0%) | 0 (0.0%) |
| 18 to 34 Years | 0 (0.0%) | 0 (0.0%) |
| 35 to 64 Years | 4 (4.6%) | 0 (0.0%) |
| 65 to 74 Years | 6 (35.3%) | 0 (0.0%) |
| 75 Years and over | 1 (6.2%) | 4 (40.0%) |
Disability Class: Vision Difficulty
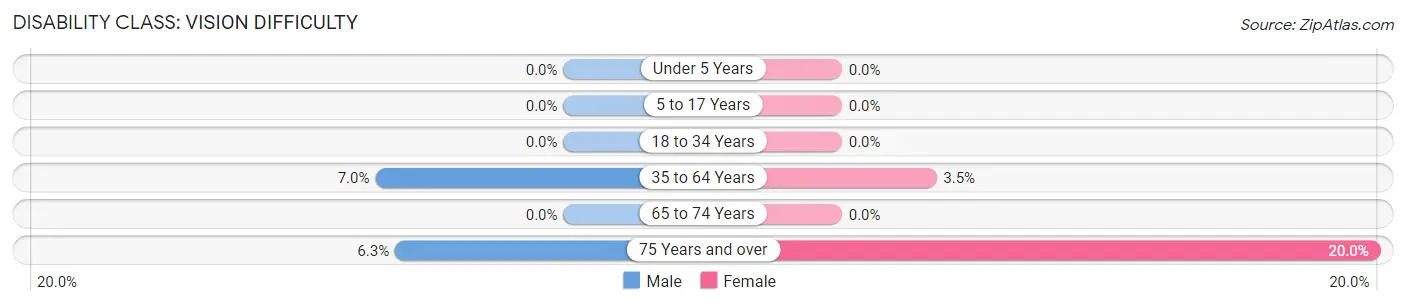
| Age Bracket | Male | Female |
| Under 5 Years | 0 (0.0%) | 0 (0.0%) |
| 5 to 17 Years | 0 (0.0%) | 0 (0.0%) |
| 18 to 34 Years | 0 (0.0%) | 0 (0.0%) |
| 35 to 64 Years | 6 (7.0%) | 2 (3.5%) |
| 65 to 74 Years | 0 (0.0%) | 0 (0.0%) |
| 75 Years and over | 1 (6.2%) | 2 (20.0%) |
Disability Class: Cognitive Difficulty
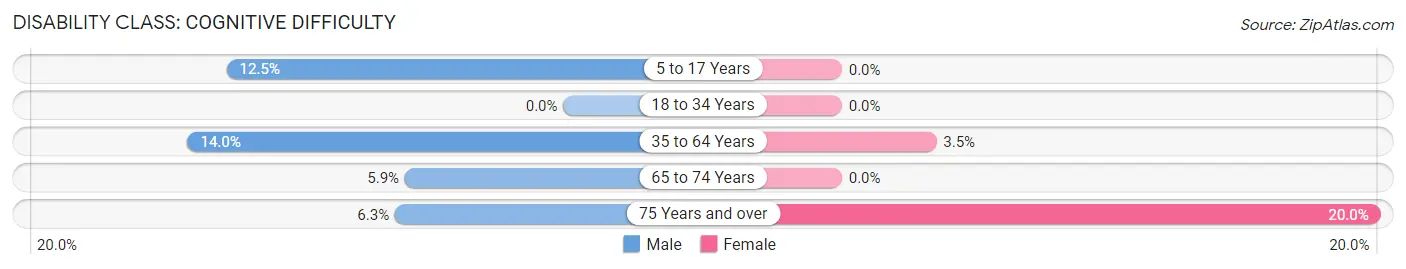
| Age Bracket | Male | Female |
| 5 to 17 Years | 3 (12.5%) | 0 (0.0%) |
| 18 to 34 Years | 0 (0.0%) | 0 (0.0%) |
| 35 to 64 Years | 12 (14.0%) | 2 (3.5%) |
| 65 to 74 Years | 1 (5.9%) | 0 (0.0%) |
| 75 Years and over | 1 (6.2%) | 2 (20.0%) |
Disability Class: Ambulatory Difficulty
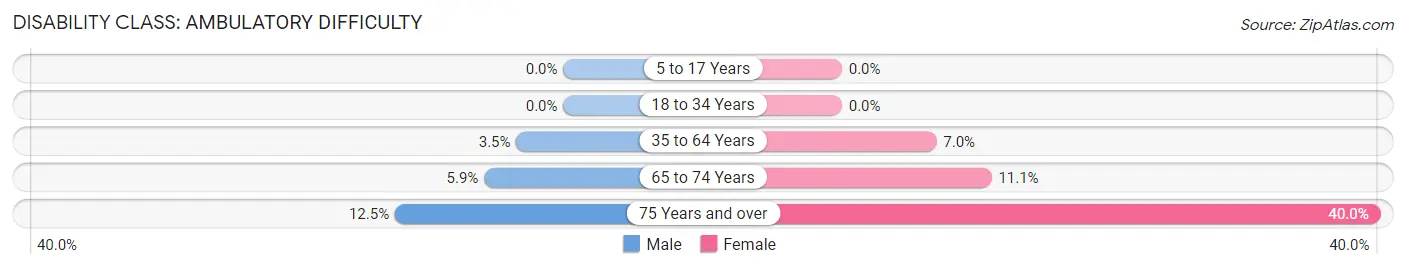
| Age Bracket | Male | Female |
| 5 to 17 Years | 0 (0.0%) | 0 (0.0%) |
| 18 to 34 Years | 0 (0.0%) | 0 (0.0%) |
| 35 to 64 Years | 3 (3.5%) | 4 (7.0%) |
| 65 to 74 Years | 1 (5.9%) | 3 (11.1%) |
| 75 Years and over | 2 (12.5%) | 4 (40.0%) |
Disability Class: Self-Care Difficulty
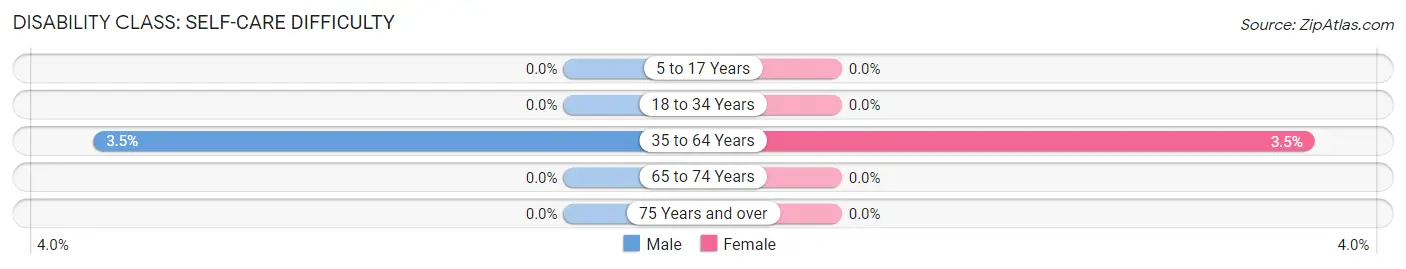
| Age Bracket | Male | Female |
| 5 to 17 Years | 0 (0.0%) | 0 (0.0%) |
| 18 to 34 Years | 0 (0.0%) | 0 (0.0%) |
| 35 to 64 Years | 3 (3.5%) | 2 (3.5%) |
| 65 to 74 Years | 0 (0.0%) | 0 (0.0%) |
| 75 Years and over | 0 (0.0%) | 0 (0.0%) |
Technology Access in Schellsburg borough
Computing Device Access in Schellsburg borough
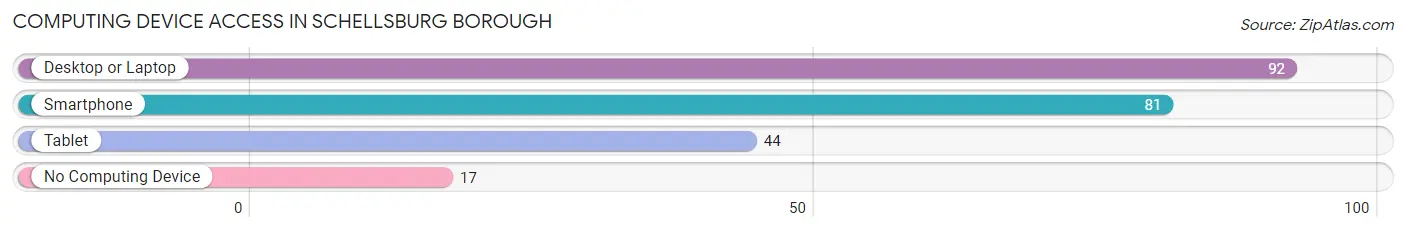
| Device Type | # Households | % Households |
| Desktop or Laptop | 92 | 74.8% |
| Smartphone | 81 | 65.8% |
| Tablet | 44 | 35.8% |
| No Computing Device | 17 | 13.8% |
| Total | 123 | 100.0% |
Internet Access in Schellsburg borough
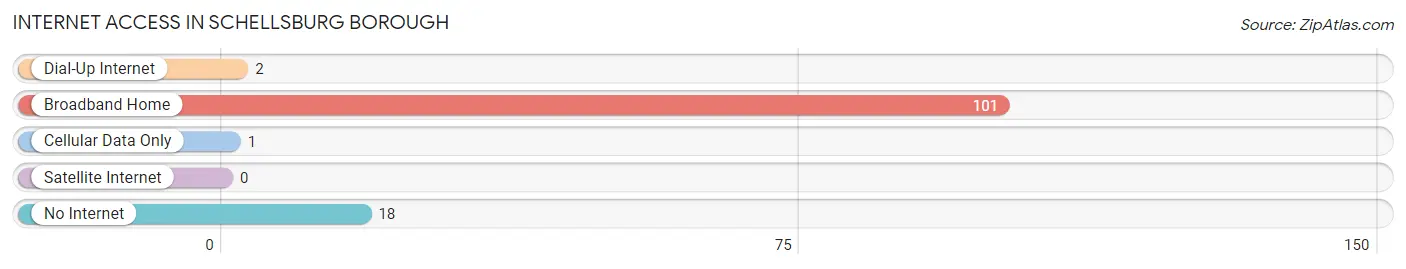
| Internet Type | # Households | % Households |
| Dial-Up Internet | 2 | 1.6% |
| Broadband Home | 101 | 82.1% |
| Cellular Data Only | 1 | 0.8% |
| Satellite Internet | 0 | 0.0% |
| No Internet | 18 | 14.6% |
| Total | 123 | 100.0% |
Schellsburg borough Summary
Schellsburg Borough is a small borough located in Bedford County, Pennsylvania. It is situated in the Allegheny Mountains, approximately 20 miles east of the city of Altoona. The borough has a population of approximately 500 people and covers an area of 0.3 square miles.
History
Schellsburg Borough was founded in 1790 by John Schell, a German immigrant. He purchased the land from the local Native American tribes and established a trading post. The town was originally known as Schell's Town, but was later changed to Schellsburg. The town grew slowly over the years, and by the mid-1800s, it had become a thriving community.
The town was incorporated as a borough in 1876. During this time, the town was home to several businesses, including a hotel, a general store, a blacksmith shop, and a sawmill. The town also had a post office, a school, and a church.
In the early 1900s, the town began to decline. The sawmill closed, and the population began to dwindle. By the 1950s, the population had dropped to just over 200 people.
Geography
Schellsburg Borough is located in the Allegheny Mountains of Bedford County, Pennsylvania. It is situated at an elevation of 1,890 feet above sea level. The borough is surrounded by the townships of Napier, Bedford, and St. Clairsville.
The borough is located in a rural area and is surrounded by rolling hills and forests. The nearby town of Bedford is the closest major city, located approximately 20 miles away.
Economy
The economy of Schellsburg Borough is largely based on agriculture and tourism. The town is home to several small farms, which produce a variety of crops, including corn, soybeans, and hay. The town also has several small businesses, including a general store, a restaurant, and a bed and breakfast.
The town is also a popular tourist destination. It is home to several historic sites, including the Schellsburg Historic District, which is listed on the National Register of Historic Places. The town also hosts several annual events, including the Schellsburg Heritage Festival and the Schellsburg Car Show.
Demographics
As of the 2010 census, the population of Schellsburg Borough was 498 people. The racial makeup of the borough was 97.2% White, 0.6% African American, 0.2% Native American, 0.2% Asian, 0.2% from other races, and 1.8% from two or more races. Hispanic or Latino of any race were 0.8% of the population.
The median household income in the borough was $37,500, and the median family income was $41,250. The per capita income was $17,845. About 11.2% of families and 13.2% of the population were below the poverty line, including 16.7% of those under age 18 and 8.3% of those age 65 or over.
Common Questions
What is the Total Population of Schellsburg borough?
Total Population of Schellsburg borough is 299.
What is the Total Male Population of Schellsburg borough?
Total Male Population of Schellsburg borough is 178.
What is the Total Female Population of Schellsburg borough?
Total Female Population of Schellsburg borough is 121.
What is the Ratio of Males per 100 Females in Schellsburg borough?
There are 147.11 Males per 100 Females in Schellsburg borough.
What is the Ratio of Females per 100 Males in Schellsburg borough?
There are 67.98 Females per 100 Males in Schellsburg borough.
What is the Median Population Age in Schellsburg borough?
Median Population Age in Schellsburg borough is 48.4 Years.
What is the Average Family Size in Schellsburg borough
Average Family Size in Schellsburg borough is 2.7 People.
What is the Average Household Size in Schellsburg borough
Average Household Size in Schellsburg borough is 2.4 People.
What is Per Capita Income in Schellsburg borough?
Per Capita income in Schellsburg borough is $36,630.
What is the Median Family Income in Schellsburg borough?
Median Family Income in Schellsburg borough is $85,000.
What is the Median Household income in Schellsburg borough?
Median Household Income in Schellsburg borough is $62,250.
What is Income or Wage Gap in Schellsburg borough?
Income or Wage Gap in Schellsburg borough is 37.7%.
Women in Schellsburg borough earn 62.3 cents for every dollar earned by a man.
What is Inequality or Gini Index in Schellsburg borough?
Inequality or Gini Index in Schellsburg borough is 0.42.
How Large is the Labor Force in Schellsburg borough?
There are 134 People in the Labor Forcein in Schellsburg borough.
What is the Percentage of People in the Labor Force in Schellsburg borough?
53.6% of People are in the Labor Force in Schellsburg borough.