Forksville borough, PA
Forksville borough Overview
127
TOTAL POPULATION
64
MALE POPULATION
63
FEMALE POPULATION
101.59
MALES / 100 FEMALES
98.44
FEMALES / 100 MALES
57.9
MEDIAN AGE
3.1
AVG FAMILY SIZE
1.9
AVG HOUSEHOLD SIZE
$31,587
PER CAPITA INCOME
$48,333
AVG HOUSEHOLD INCOME
37.4%
WAGE / INCOME GAP [ % ]
62.6¢/ $1
WAGE / INCOME GAP [ $ ]
0.49
INEQUALITY / GINI INDEX
49
LABOR FORCE [ PEOPLE ]
45.4%
PERCENT IN LABOR FORCE
2.0%
UNEMPLOYMENT RATE
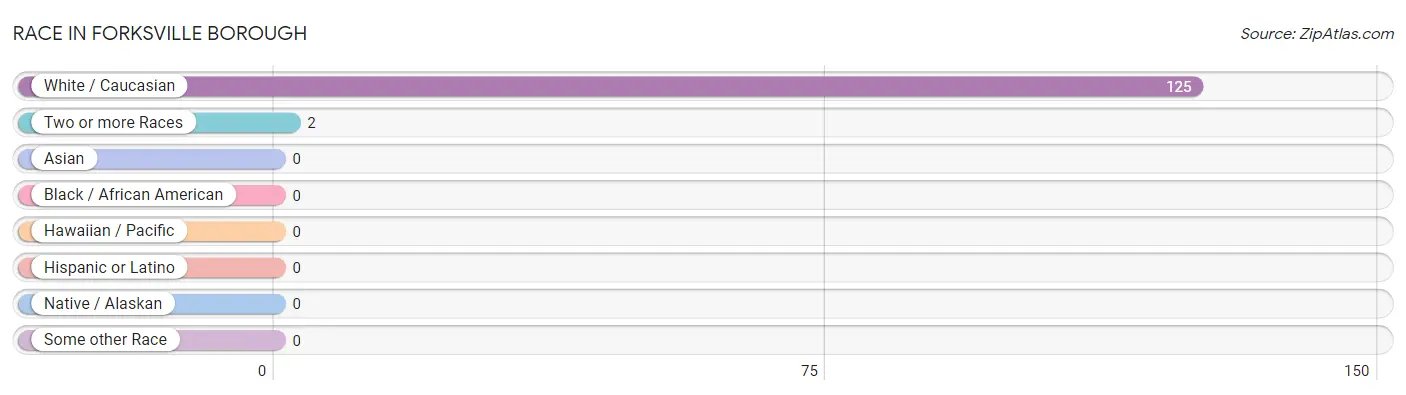
Race in Forksville borough
The most populous races in Forksville borough are White / Caucasian (125 | 98.4%), and Two or more Races (2 | 1.6%).
| Race | # Population | % Population |
| Asian | 0 | 0.0% |
| Black / African American | 0 | 0.0% |
| Hawaiian / Pacific | 0 | 0.0% |
| Hispanic or Latino | 0 | 0.0% |
| Native / Alaskan | 0 | 0.0% |
| White / Caucasian | 125 | 98.4% |
| Two or more Races | 2 | 1.6% |
| Some other Race | 0 | 0.0% |
| Total | 127 | 100.0% |
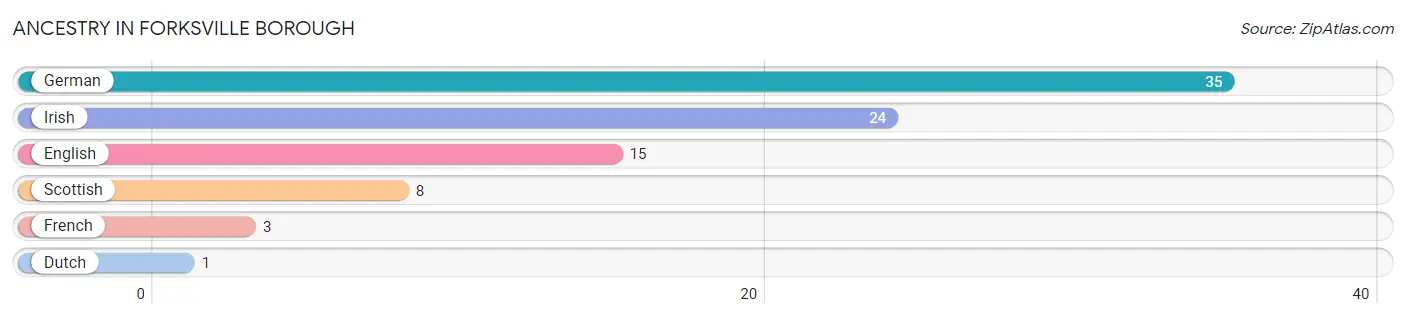
Ancestry in Forksville borough
The most populous ancestries reported in Forksville borough are German (35 | 27.6%), Irish (24 | 18.9%), English (15 | 11.8%), Scottish (8 | 6.3%), and French (3 | 2.4%), together accounting for 66.9% of all Forksville borough residents.
| Ancestry | # Population | % Population |
| Dutch | 1 | 0.8% |
| English | 15 | 11.8% |
| French | 3 | 2.4% |
| German | 35 | 27.6% |
| Irish | 24 | 18.9% |
| Scottish | 8 | 6.3% | View All 6 Rows |
Immigrants in Forksville borough

| Immigration Origin | # Population | % Population | View All 0 Rows |
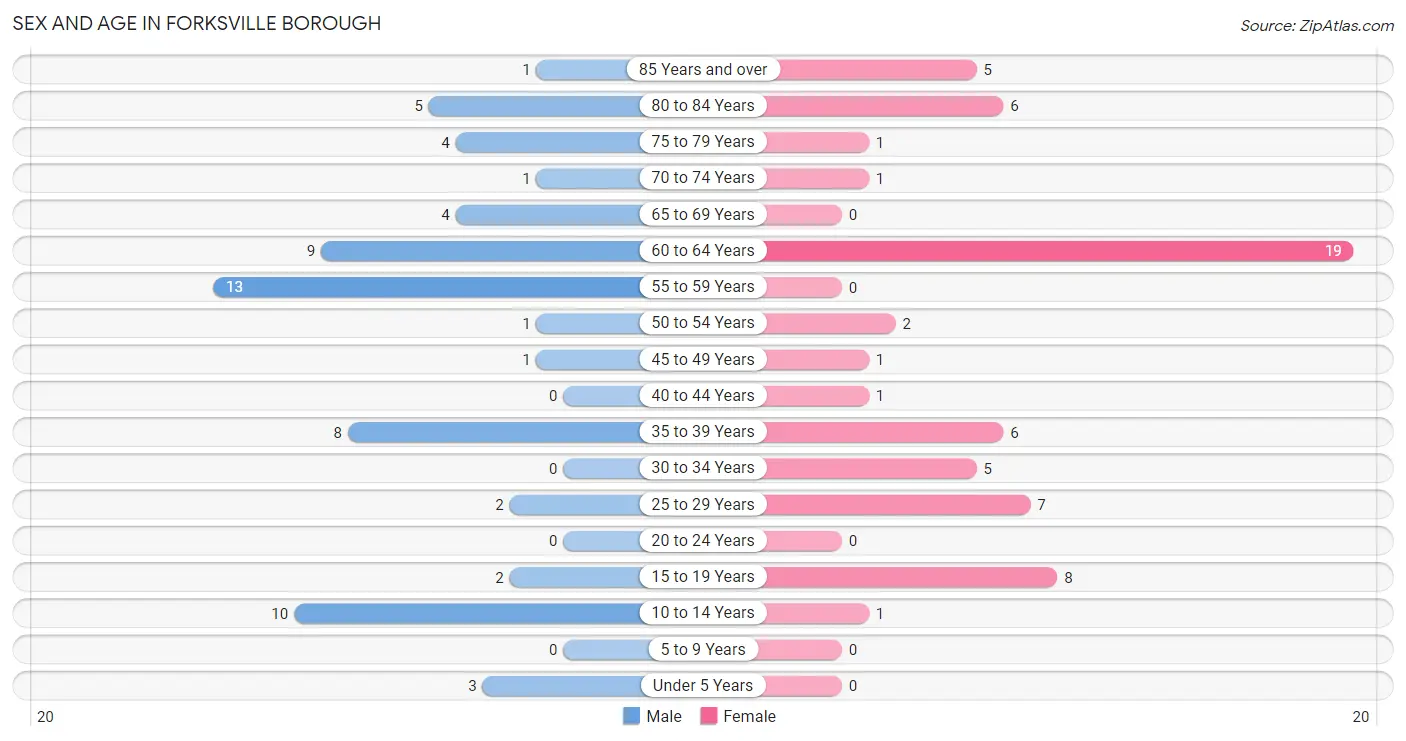
Sex and Age in Forksville borough
Sex and Age in Forksville borough
The most populous age groups in Forksville borough are 55 to 59 Years (13 | 20.3%) for men and 60 to 64 Years (19 | 30.2%) for women.
| Age Bracket | Male | Female |
| Under 5 Years | 3 (4.7%) | 0 (0.0%) |
| 5 to 9 Years | 0 (0.0%) | 0 (0.0%) |
| 10 to 14 Years | 10 (15.6%) | 1 (1.6%) |
| 15 to 19 Years | 2 (3.1%) | 8 (12.7%) |
| 20 to 24 Years | 0 (0.0%) | 0 (0.0%) |
| 25 to 29 Years | 2 (3.1%) | 7 (11.1%) |
| 30 to 34 Years | 0 (0.0%) | 5 (7.9%) |
| 35 to 39 Years | 8 (12.5%) | 6 (9.5%) |
| 40 to 44 Years | 0 (0.0%) | 1 (1.6%) |
| 45 to 49 Years | 1 (1.6%) | 1 (1.6%) |
| 50 to 54 Years | 1 (1.6%) | 2 (3.2%) |
| 55 to 59 Years | 13 (20.3%) | 0 (0.0%) |
| 60 to 64 Years | 9 (14.1%) | 19 (30.2%) |
| 65 to 69 Years | 4 (6.2%) | 0 (0.0%) |
| 70 to 74 Years | 1 (1.6%) | 1 (1.6%) |
| 75 to 79 Years | 4 (6.2%) | 1 (1.6%) |
| 80 to 84 Years | 5 (7.8%) | 6 (9.5%) |
| 85 Years and over | 1 (1.6%) | 5 (7.9%) |
| Total | 64 (100.0%) | 63 (100.0%) |
Families and Households in Forksville borough
Median Family Size in Forksville borough

| Family Type | # Families | Family Size |
| Married-Couple | 16 (57.1%) | 3.19 |
| Single Male/Father | 0 (0.0%) | - |
| Single Female/Mother | 12 (42.9%) | 3.08 |
| Total Families | 28 (100.0%) | 3.14 |
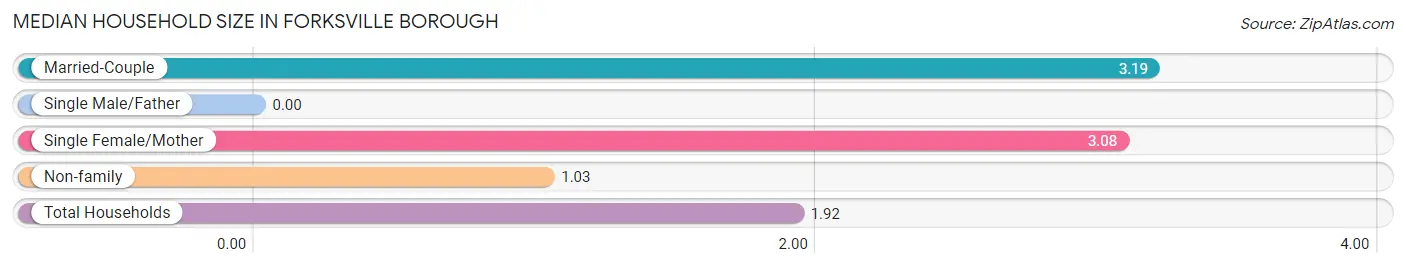
Median Household Size in Forksville borough
| Household Type | # Households | Household Size |
| Married-Couple | 16 (24.2%) | 3.19 |
| Single Male/Father | 0 (0.0%) | - |
| Single Female/Mother | 12 (18.2%) | 3.08 |
| Non-family | 38 (57.6%) | 1.03 |
| Total Households | 66 (100.0%) | 1.92 |
Household Size by Marriage Status in Forksville borough
Out of a total of 66 households in Forksville borough, 28 (42.4%) are family households, while 38 (57.6%) are nonfamily households. The most numerous type of family households are 2-person households, comprising 14, and the most common type of nonfamily households are 1-person households, comprising 36.
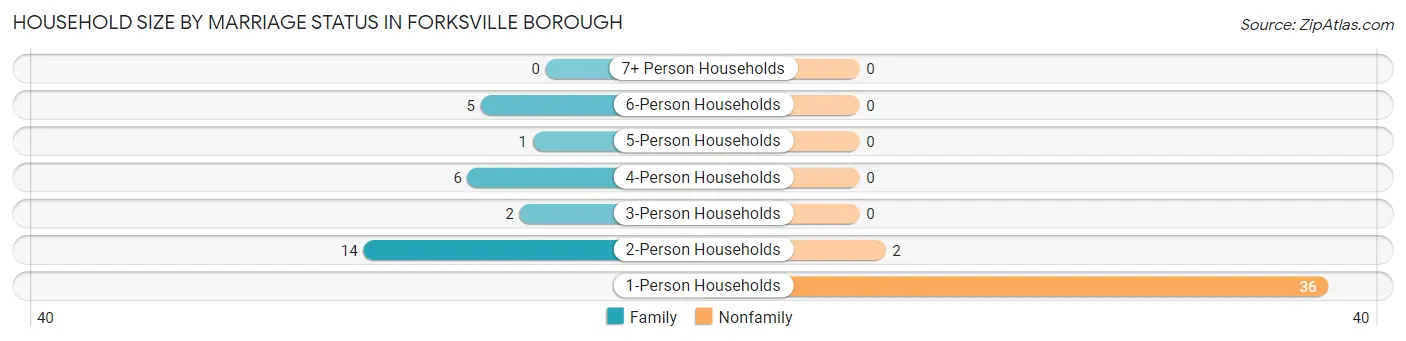
| Household Size | Family Households | Nonfamily Households |
| 1-Person Households | - | 36 (54.5%) |
| 2-Person Households | 14 (21.2%) | 2 (3.0%) |
| 3-Person Households | 2 (3.0%) | 0 (0.0%) |
| 4-Person Households | 6 (9.1%) | 0 (0.0%) |
| 5-Person Households | 1 (1.5%) | 0 (0.0%) |
| 6-Person Households | 5 (7.6%) | 0 (0.0%) |
| 7+ Person Households | 0 (0.0%) | 0 (0.0%) |
| Total | 28 (42.4%) | 38 (57.6%) |
Female Fertility in Forksville borough
Fertility by Age in Forksville borough
| Age Bracket | Women with Births | Births / 1,000 Women |
| 15 to 19 years | 0 (0.0%) | 0.0 |
| 20 to 34 years | 0 (0.0%) | 0.0 |
| 35 to 50 years | 0 (0.0%) | 0.0 |
| Total | 0 (0.0%) | 0.0 |
Fertility by Age by Marriage Status in Forksville borough
| Age Bracket | Married | Unmarried |
| 15 to 19 years | 0 (0.0%) | 0 (0.0%) |
| 20 to 34 years | 0 (0.0%) | 0 (0.0%) |
| 35 to 50 years | 0 (0.0%) | 0 (0.0%) |
| Total | 0 (0.0%) | 0 (0.0%) |
Fertility by Education in Forksville borough
| Educational Attainment | Women with Births | Births / 1,000 Women |
| Less than High School | 0 (0.0%) | 0.0 |
| High School Diploma | 0 (0.0%) | 0.0 |
| College or Associate's Degree | 0 (0.0%) | 0.0 |
| Bachelor's Degree | 0 (0.0%) | 0.0 |
| Graduate Degree | 0 (0.0%) | 0.0 |
| Total | 0 (0.0%) | 0.0 |
Fertility by Education by Marriage Status in Forksville borough

| Educational Attainment | Married | Unmarried |
| Less than High School | 0 (0.0%) | 0 (0.0%) |
| High School Diploma | 0 (0.0%) | 0 (0.0%) |
| College or Associate's Degree | 0 (0.0%) | 0 (0.0%) |
| Bachelor's Degree | 0 (0.0%) | 0 (0.0%) |
| Graduate Degree | 0 (0.0%) | 0 (0.0%) |
| Total | 0 (0.0%) | 0 (0.0%) |
Income in Forksville borough
Income Overview in Forksville borough
| Characteristic | Number | Measure |
| Per Capita Income | 127 | $31,587 |
| Median Family Income | 28 | $0 |
| Mean Family Income | 28 | $86,021 |
| Median Household Income | 66 | $48,333 |
| Mean Household Income | 66 | $59,762 |
| Income Deficit | 28 | $0 |
| Wage / Income Gap (%) | 127 | 37.36% |
| Wage / Income Gap ($) | 127 | 62.64¢ per $1 |
| Gini / Inequality Index | 127 | 0.49 |
Earnings by Sex in Forksville borough
Average Earnings in Forksville borough are $47,857, $75,625 for men and $47,375 for women, a difference of 37.4%.
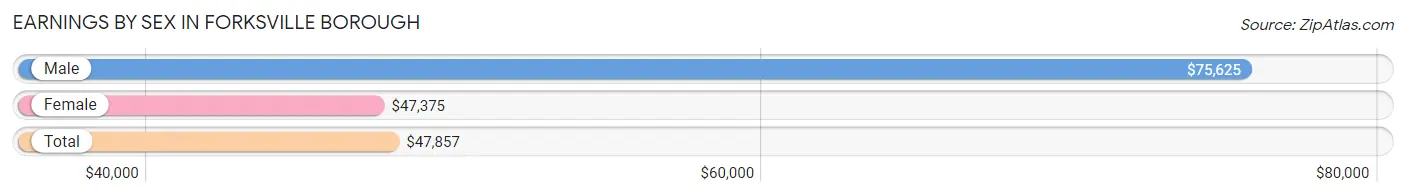
| Sex | Number | Average Earnings |
| Male | 19 (36.5%) | $75,625 |
| Female | 33 (63.5%) | $47,375 |
| Total | 52 (100.0%) | $47,857 |
Earnings by Sex by Income Bracket in Forksville borough
The most common earnings brackets in Forksville borough are $75,000 to $99,999 for men (6 | 31.6%) and $45,000 to $49,999 for women (24 | 72.7%).
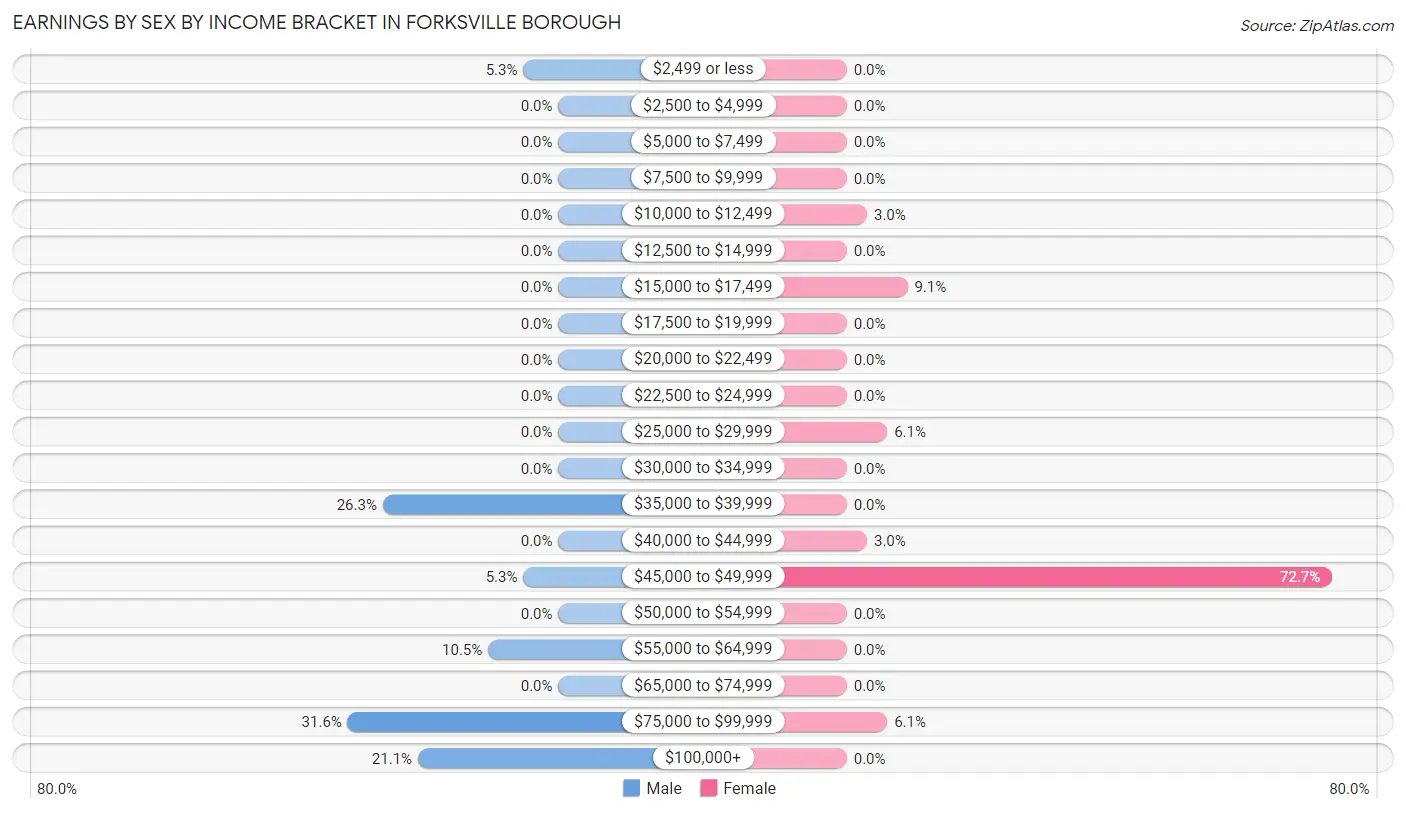
| Income | Male | Female |
| $2,499 or less | 1 (5.3%) | 0 (0.0%) |
| $2,500 to $4,999 | 0 (0.0%) | 0 (0.0%) |
| $5,000 to $7,499 | 0 (0.0%) | 0 (0.0%) |
| $7,500 to $9,999 | 0 (0.0%) | 0 (0.0%) |
| $10,000 to $12,499 | 0 (0.0%) | 1 (3.0%) |
| $12,500 to $14,999 | 0 (0.0%) | 0 (0.0%) |
| $15,000 to $17,499 | 0 (0.0%) | 3 (9.1%) |
| $17,500 to $19,999 | 0 (0.0%) | 0 (0.0%) |
| $20,000 to $22,499 | 0 (0.0%) | 0 (0.0%) |
| $22,500 to $24,999 | 0 (0.0%) | 0 (0.0%) |
| $25,000 to $29,999 | 0 (0.0%) | 2 (6.1%) |
| $30,000 to $34,999 | 0 (0.0%) | 0 (0.0%) |
| $35,000 to $39,999 | 5 (26.3%) | 0 (0.0%) |
| $40,000 to $44,999 | 0 (0.0%) | 1 (3.0%) |
| $45,000 to $49,999 | 1 (5.3%) | 24 (72.7%) |
| $50,000 to $54,999 | 0 (0.0%) | 0 (0.0%) |
| $55,000 to $64,999 | 2 (10.5%) | 0 (0.0%) |
| $65,000 to $74,999 | 0 (0.0%) | 0 (0.0%) |
| $75,000 to $99,999 | 6 (31.6%) | 2 (6.1%) |
| $100,000+ | 4 (21.0%) | 0 (0.0%) |
| Total | 19 (100.0%) | 33 (100.0%) |
Earnings by Sex by Educational Attainment in Forksville borough
Average earnings in Forksville borough are $75,625 for men and $47,679 for women, a difference of 36.9%. Men with an educational attainment of high school diploma enjoy the highest average annual earnings of $46,250, while those with high school diploma education earn the least with $46,250. Women with an educational attainment of college or associate's degree earn the most with the average annual earnings of $47,750, while those with high school diploma education have the smallest earnings of $46,875.
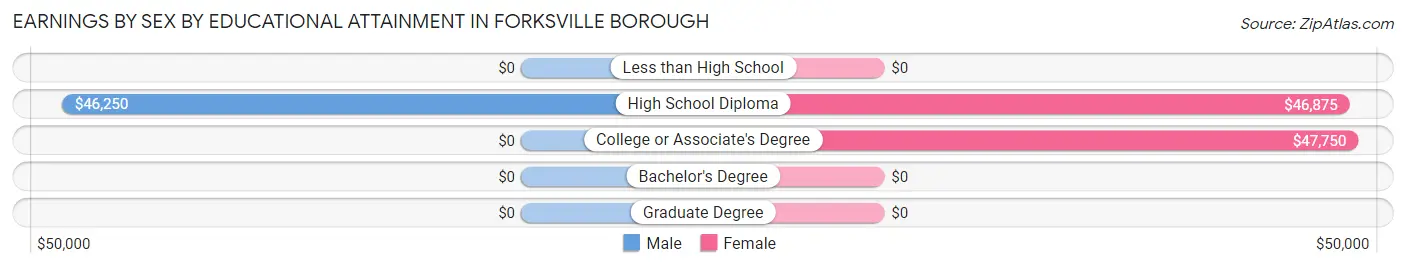
| Educational Attainment | Male Income | Female Income |
| Less than High School | - | - |
| High School Diploma | $46,250 | $46,875 |
| College or Associate's Degree | - | - |
| Bachelor's Degree | - | - |
| Graduate Degree | - | - |
| Total | $75,625 | $47,679 |
Family Income in Forksville borough
Family Income Brackets in Forksville borough
According to the Forksville borough family income data, there are 7 families falling into the $50,000 to $74,999 income range, which is the most common income bracket and makes up 25.0% of all families.
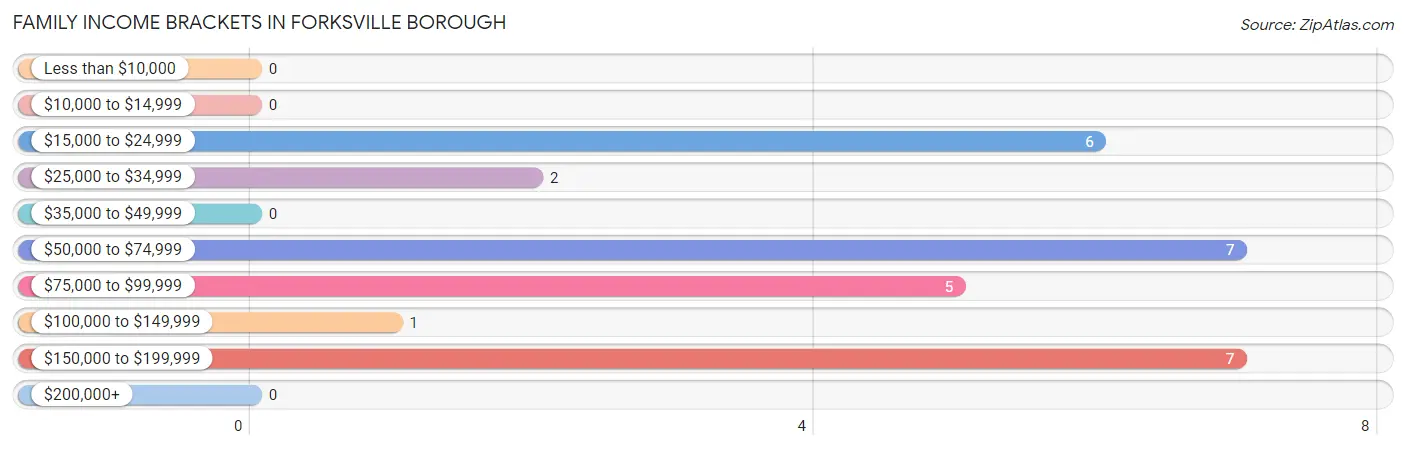
| Income Bracket | # Families | % Families |
| Less than $10,000 | 0 | 0.0% |
| $10,000 to $14,999 | 0 | 0.0% |
| $15,000 to $24,999 | 6 | 21.4% |
| $25,000 to $34,999 | 2 | 7.1% |
| $35,000 to $49,999 | 0 | 0.0% |
| $50,000 to $74,999 | 7 | 25.0% |
| $75,000 to $99,999 | 5 | 17.9% |
| $100,000 to $149,999 | 1 | 3.6% |
| $150,000 to $199,999 | 7 | 25.0% |
| $200,000+ | 0 | 0.0% |
Family Income by Famaliy Size in Forksville borough
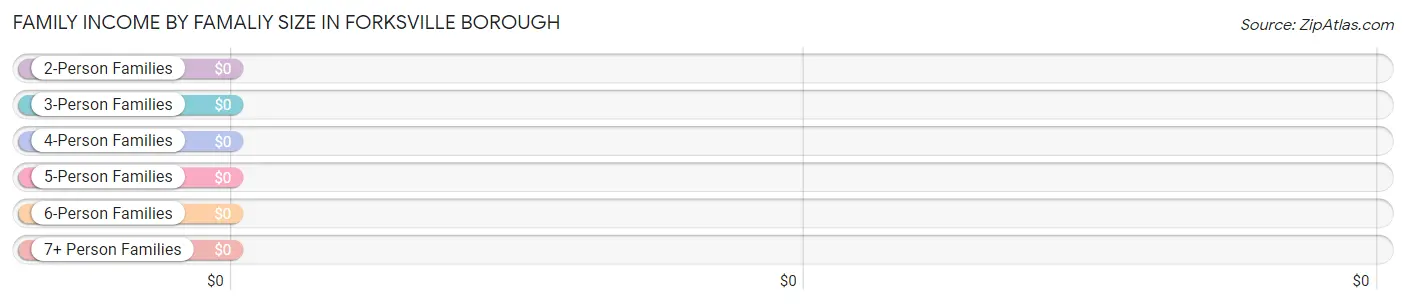
| Income Bracket | # Families | Median Income |
| 2-Person Families | 14 (50.0%) | $0 |
| 3-Person Families | 2 (7.1%) | $0 |
| 4-Person Families | 6 (21.4%) | $0 |
| 5-Person Families | 1 (3.6%) | $0 |
| 6-Person Families | 5 (17.9%) | $0 |
| 7+ Person Families | 0 (0.0%) | $0 |
| Total | 28 (100.0%) | $0 |
Family Income by Number of Earners in Forksville borough
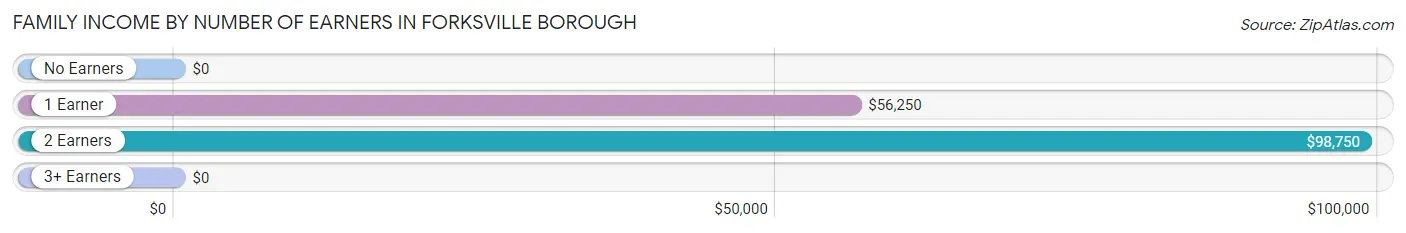
| Number of Earners | # Families | Median Income |
| No Earners | 9 (32.1%) | $0 |
| 1 Earner | 8 (28.6%) | $56,250 |
| 2 Earners | 5 (17.9%) | $98,750 |
| 3+ Earners | 6 (21.4%) | $0 |
| Total | 28 (100.0%) | $0 |
Household Income in Forksville borough
Household Income Brackets in Forksville borough
With 14 households falling in the category, the $50,000 to $74,999 income range is the most frequent in Forksville borough, accounting for 21.2% of all households.

| Income Bracket | # Households | % Households |
| Less than $10,000 | 5 | 7.6% |
| $10,000 to $14,999 | 11 | 16.7% |
| $15,000 to $24,999 | 6 | 9.1% |
| $25,000 to $34,999 | 2 | 3.0% |
| $35,000 to $49,999 | 11 | 16.7% |
| $50,000 to $74,999 | 14 | 21.2% |
| $75,000 to $99,999 | 5 | 7.6% |
| $100,000 to $149,999 | 5 | 7.6% |
| $150,000 to $199,999 | 7 | 10.6% |
| $200,000+ | 0 | 0.0% |
Household Income by Householder Age in Forksville borough
The median household income in Forksville borough is $48,333, with the highest median household income of $56,250 found in the 25 to 44 years age bracket for the primary householder. A total of 22 households (33.3%) fall into this category.
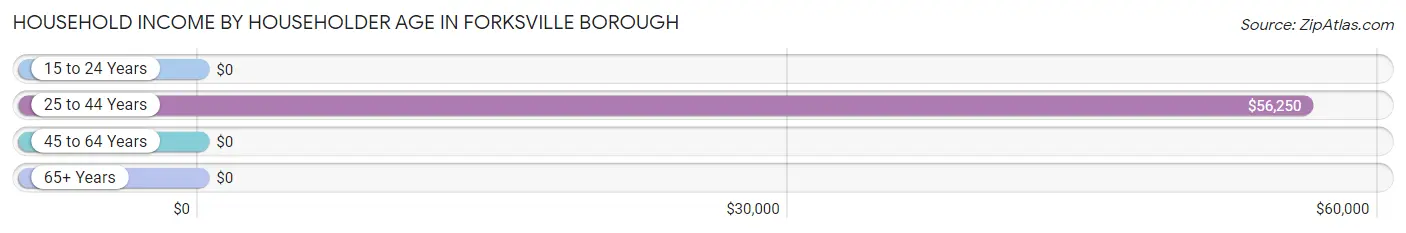
| Income Bracket | # Households | Median Income |
| 15 to 24 Years | 0 (0.0%) | $0 |
| 25 to 44 Years | 22 (33.3%) | $56,250 |
| 45 to 64 Years | 24 (36.4%) | $0 |
| 65+ Years | 20 (30.3%) | $0 |
| Total | 66 (100.0%) | $48,333 |
Poverty in Forksville borough
Income Below Poverty by Sex and Age in Forksville borough
With 25.0% poverty level for males and 25.4% for females among the residents of Forksville borough, 65 to 74 year old males and 55 to 64 year old females are the most vulnerable to poverty, with 4 males (80.0%) and 11 females (57.9%) in their respective age groups living below the poverty level.
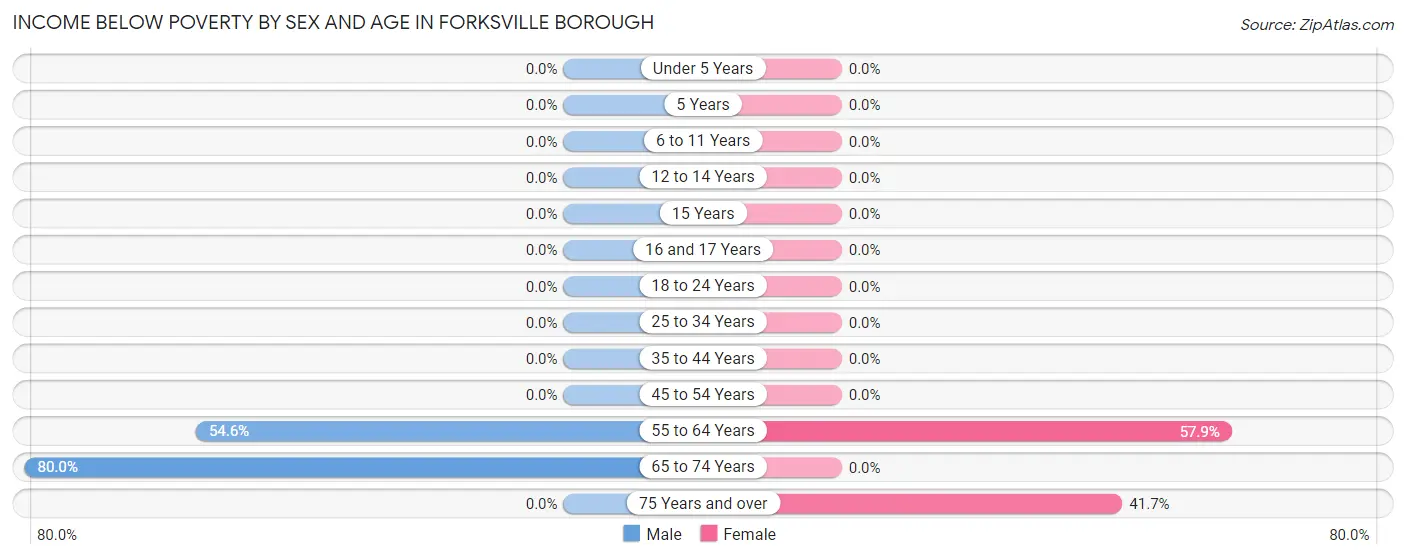
| Age Bracket | Male | Female |
| Under 5 Years | 0 (0.0%) | 0 (0.0%) |
| 5 Years | 0 (0.0%) | 0 (0.0%) |
| 6 to 11 Years | 0 (0.0%) | 0 (0.0%) |
| 12 to 14 Years | 0 (0.0%) | 0 (0.0%) |
| 15 Years | 0 (0.0%) | 0 (0.0%) |
| 16 and 17 Years | 0 (0.0%) | 0 (0.0%) |
| 18 to 24 Years | 0 (0.0%) | 0 (0.0%) |
| 25 to 34 Years | 0 (0.0%) | 0 (0.0%) |
| 35 to 44 Years | 0 (0.0%) | 0 (0.0%) |
| 45 to 54 Years | 0 (0.0%) | 0 (0.0%) |
| 55 to 64 Years | 12 (54.5%) | 11 (57.9%) |
| 65 to 74 Years | 4 (80.0%) | 0 (0.0%) |
| 75 Years and over | 0 (0.0%) | 5 (41.7%) |
| Total | 16 (25.0%) | 16 (25.4%) |
Income Above Poverty by Sex and Age in Forksville borough
According to the poverty statistics in Forksville borough, males aged under 5 years and females aged 12 to 14 years are the age groups that are most secure financially, with 100.0% of males and 100.0% of females in these age groups living above the poverty line.
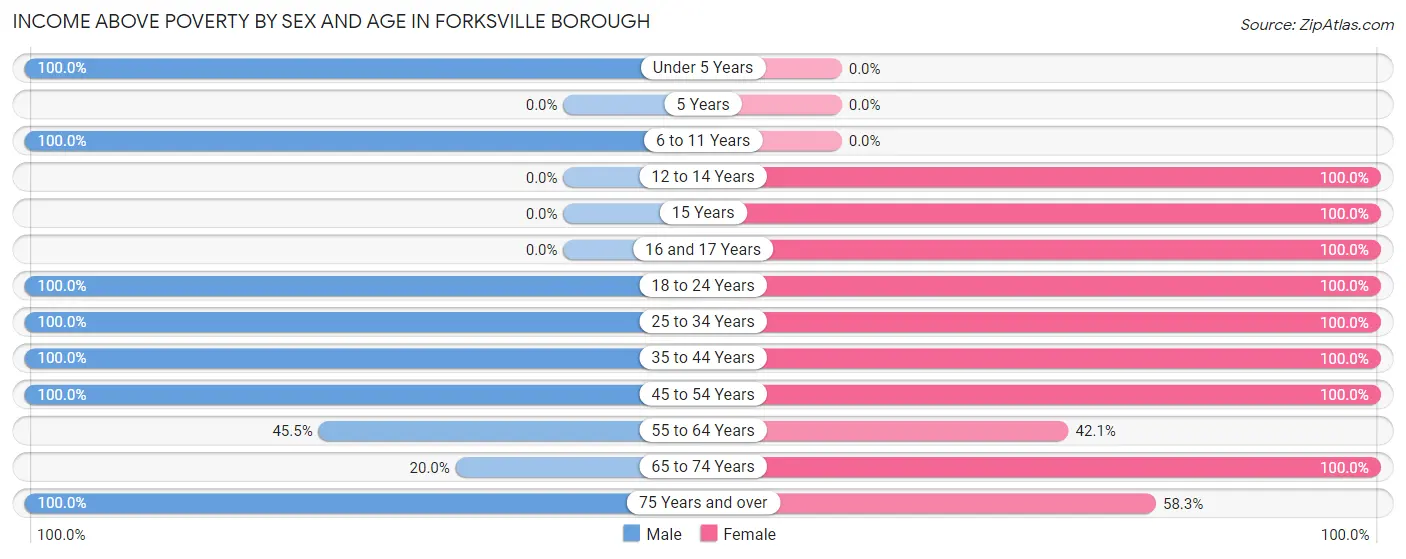
| Age Bracket | Male | Female |
| Under 5 Years | 3 (100.0%) | 0 (0.0%) |
| 5 Years | 0 (0.0%) | 0 (0.0%) |
| 6 to 11 Years | 10 (100.0%) | 0 (0.0%) |
| 12 to 14 Years | 0 (0.0%) | 1 (100.0%) |
| 15 Years | 0 (0.0%) | 5 (100.0%) |
| 16 and 17 Years | 0 (0.0%) | 2 (100.0%) |
| 18 to 24 Years | 2 (100.0%) | 1 (100.0%) |
| 25 to 34 Years | 2 (100.0%) | 12 (100.0%) |
| 35 to 44 Years | 8 (100.0%) | 7 (100.0%) |
| 45 to 54 Years | 2 (100.0%) | 3 (100.0%) |
| 55 to 64 Years | 10 (45.5%) | 8 (42.1%) |
| 65 to 74 Years | 1 (20.0%) | 1 (100.0%) |
| 75 Years and over | 10 (100.0%) | 7 (58.3%) |
| Total | 48 (75.0%) | 47 (74.6%) |
Income Below Poverty Among Married-Couple Families in Forksville borough
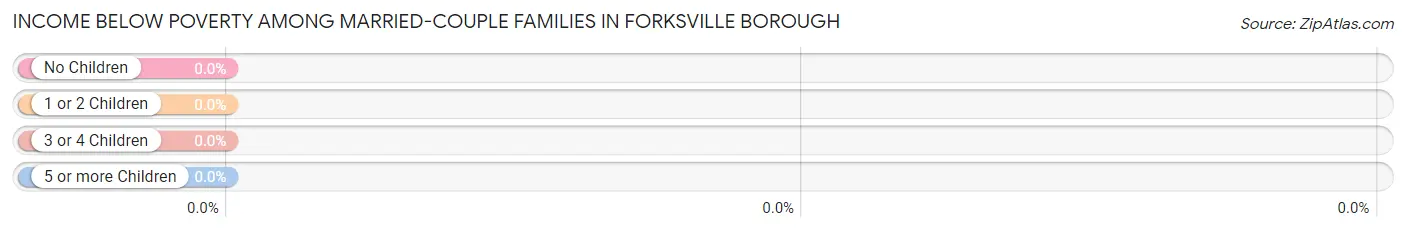
| Children | Above Poverty | Below Poverty |
| No Children | 10 (100.0%) | 0 (0.0%) |
| 1 or 2 Children | 0 (0.0%) | 0 (0.0%) |
| 3 or 4 Children | 6 (100.0%) | 0 (0.0%) |
| 5 or more Children | 0 (0.0%) | 0 (0.0%) |
| Total | 16 (100.0%) | 0 (0.0%) |
Income Below Poverty Among Single-Parent Households in Forksville borough
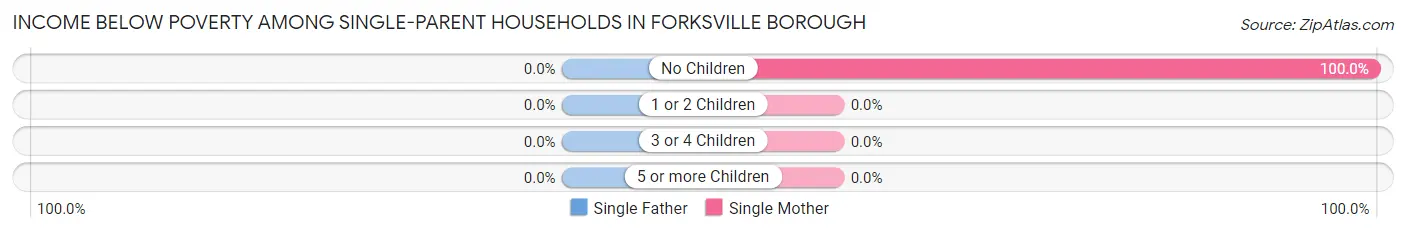
| Children | Single Father | Single Mother |
| No Children | 0 (0.0%) | 5 (100.0%) |
| 1 or 2 Children | 0 (0.0%) | 0 (0.0%) |
| 3 or 4 Children | 0 (0.0%) | 0 (0.0%) |
| 5 or more Children | 0 (0.0%) | 0 (0.0%) |
| Total | 0 (0.0%) | 5 (41.7%) |
Income Below Poverty Among Married-Couple vs Single-Parent Households in Forksville borough
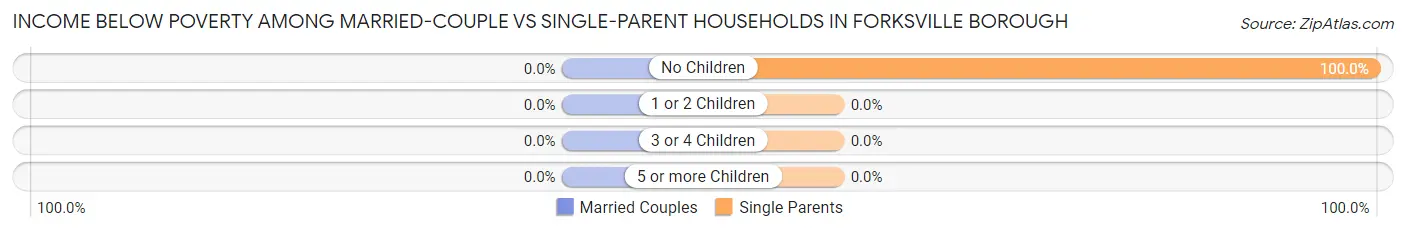
| Children | Married-Couple Families | Single-Parent Households |
| No Children | 0 (0.0%) | 5 (100.0%) |
| 1 or 2 Children | 0 (0.0%) | 0 (0.0%) |
| 3 or 4 Children | 0 (0.0%) | 0 (0.0%) |
| 5 or more Children | 0 (0.0%) | 0 (0.0%) |
| Total | 0 (0.0%) | 5 (41.7%) |
Employment Characteristics in Forksville borough
Employment by Class of Employer in Forksville borough
Among the 47 employed individuals in Forksville borough, private company employees (29 | 61.7%), not-for-profit organizations (9 | 19.2%), and self-employed (not incorporated) (4 | 8.5%) make up the most common classes of employment.
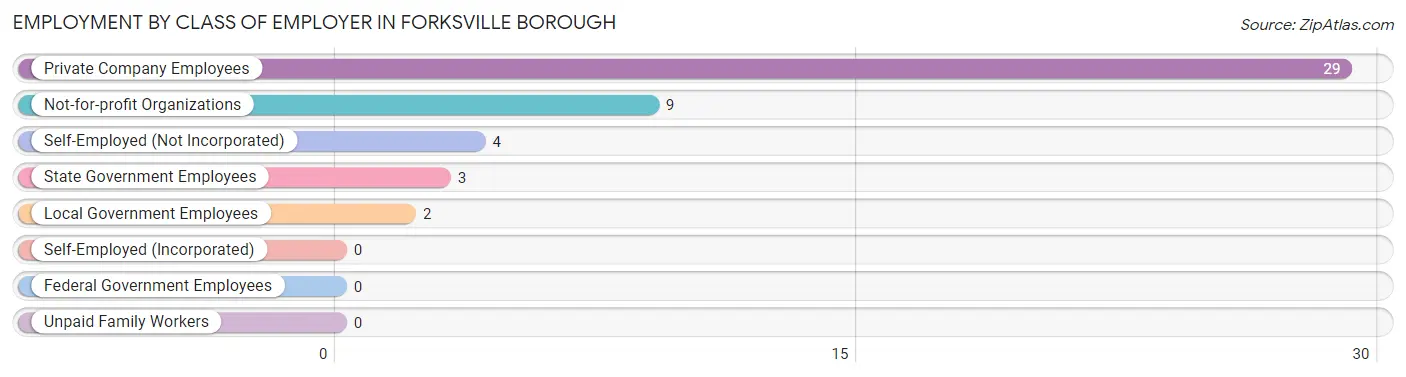
| Employer Class | # Employees | % Employees |
| Private Company Employees | 29 | 61.7% |
| Self-Employed (Incorporated) | 0 | 0.0% |
| Self-Employed (Not Incorporated) | 4 | 8.5% |
| Not-for-profit Organizations | 9 | 19.2% |
| Local Government Employees | 2 | 4.3% |
| State Government Employees | 3 | 6.4% |
| Federal Government Employees | 0 | 0.0% |
| Unpaid Family Workers | 0 | 0.0% |
| Total | 47 | 100.0% |
Employment Status by Age in Forksville borough
According to the labor force statistics for Forksville borough, out of the total population over 16 years of age (108), 45.4% or 49 individuals are in the labor force, with 2.0% or 1 of them unemployed. The age group with the highest labor force participation rate is 25 to 29 years, with 100.0% or 9 individuals in the labor force. Within the labor force, the 25 to 29 years age range has the highest percentage of unemployed individuals, with 11.1% or 1 of them being unemployed.
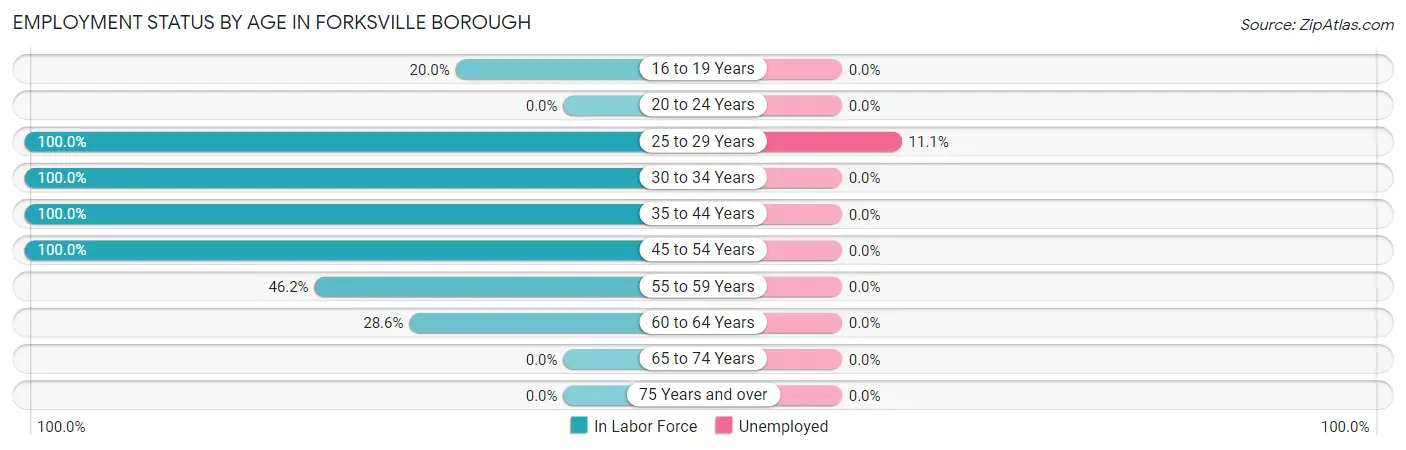
| Age Bracket | In Labor Force | Unemployed |
| 16 to 19 Years | 1 (20.0%) | 0 (0.0%) |
| 20 to 24 Years | 0 (0.0%) | 0 (0.0%) |
| 25 to 29 Years | 9 (100.0%) | 1 (11.1%) |
| 30 to 34 Years | 5 (100.0%) | 0 (0.0%) |
| 35 to 44 Years | 15 (100.0%) | 0 (0.0%) |
| 45 to 54 Years | 5 (100.0%) | 0 (0.0%) |
| 55 to 59 Years | 6 (46.2%) | 0 (0.0%) |
| 60 to 64 Years | 8 (28.6%) | 0 (0.0%) |
| 65 to 74 Years | 0 (0.0%) | 0 (0.0%) |
| 75 Years and over | 0 (0.0%) | 0 (0.0%) |
| Total | 49 (45.4%) | 1 (2.0%) |
Employment Status by Educational Attainment in Forksville borough
According to labor force statistics for Forksville borough, 64.0% of individuals (48) out of the total population between 25 and 64 years of age (75) are in the labor force, with 2.1% or 1 of them being unemployed. The group with the highest labor force participation rate are those with the educational attainment of less than high school, with 100.0% or 4 individuals in the labor force. Within the labor force, individuals with college / associate degree education have the highest percentage of unemployment, with 7.1% or 1 of them being unemployed.
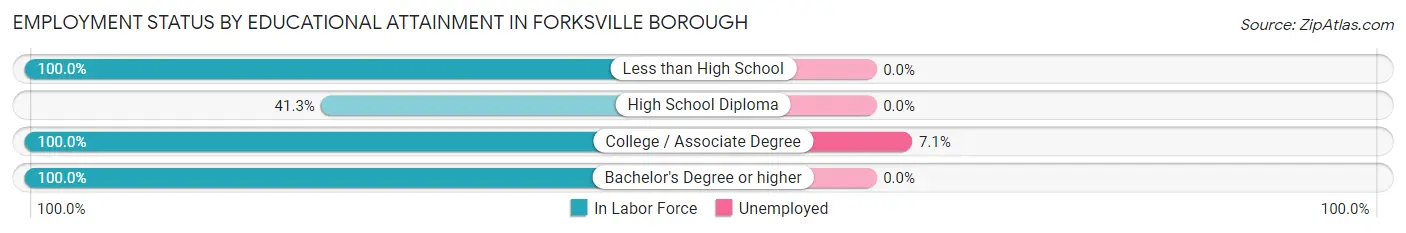
| Educational Attainment | In Labor Force | Unemployed |
| Less than High School | 4 (100.0%) | 0 (0.0%) |
| High School Diploma | 19 (41.3%) | 0 (0.0%) |
| College / Associate Degree | 14 (100.0%) | 1 (7.1%) |
| Bachelor's Degree or higher | 11 (100.0%) | 0 (0.0%) |
| Total | 48 (64.0%) | 2 (2.1%) |
Employment Occupations by Sex in Forksville borough
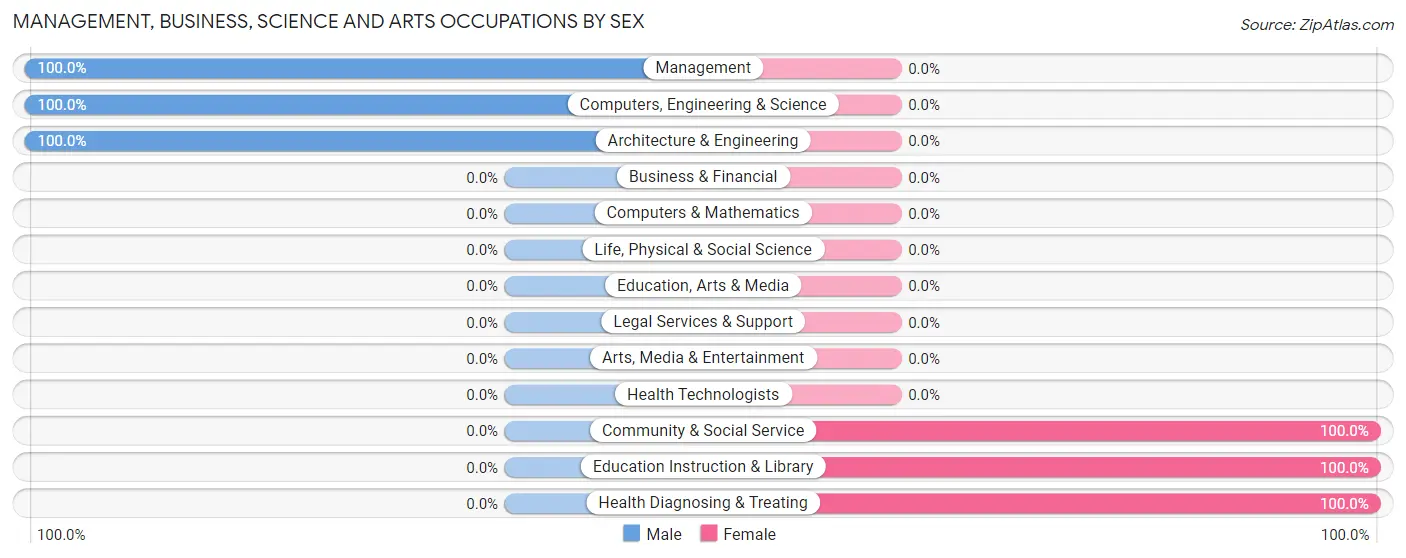
Management, Business, Science and Arts Occupations
The most common Management, Business, Science and Arts occupations in Forksville borough are Health Diagnosing & Treating (6 | 12.5%), Community & Social Service (5 | 10.4%), Education Instruction & Library (5 | 10.4%), Management (4 | 8.3%), and Computers, Engineering & Science (2 | 4.2%).
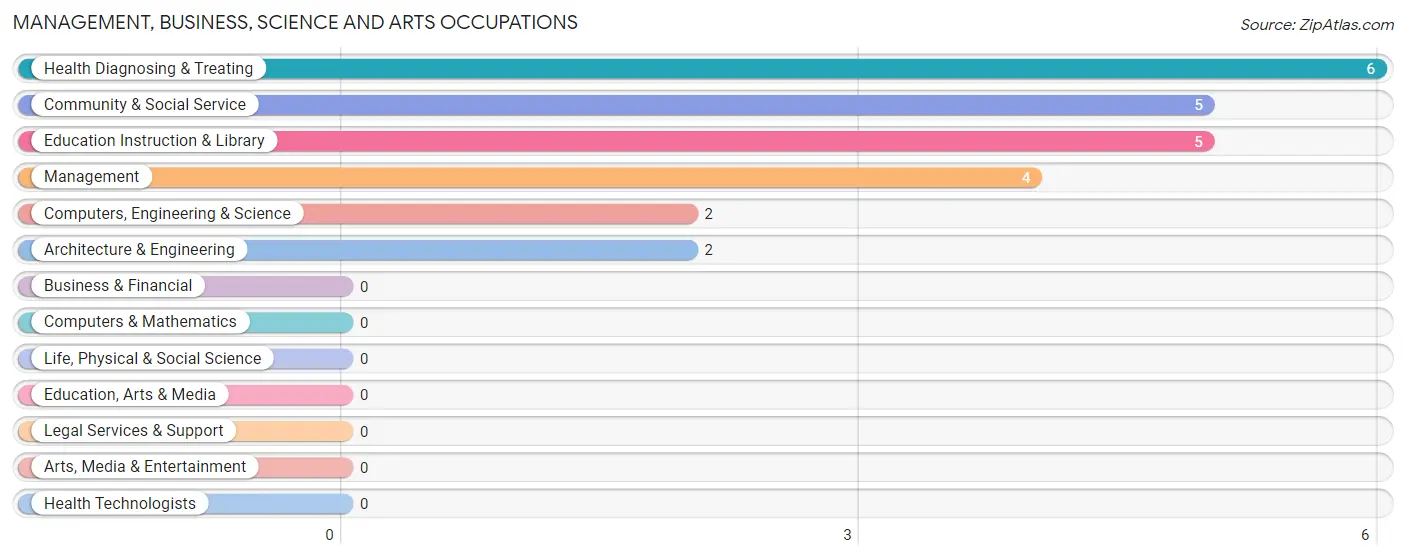
Management, Business, Science and Arts Occupations by Sex
Within the Management, Business, Science and Arts occupations in Forksville borough, the most male-oriented occupations are Management (100.0%), Computers, Engineering & Science (100.0%), and Architecture & Engineering (100.0%), while the most female-oriented occupations are Community & Social Service (100.0%), Education Instruction & Library (100.0%), and Health Diagnosing & Treating (100.0%).
| Occupation | Male | Female |
| Management | 4 (100.0%) | 0 (0.0%) |
| Business & Financial | 0 (0.0%) | 0 (0.0%) |
| Computers, Engineering & Science | 2 (100.0%) | 0 (0.0%) |
| Computers & Mathematics | 0 (0.0%) | 0 (0.0%) |
| Architecture & Engineering | 2 (100.0%) | 0 (0.0%) |
| Life, Physical & Social Science | 0 (0.0%) | 0 (0.0%) |
| Community & Social Service | 0 (0.0%) | 5 (100.0%) |
| Education, Arts & Media | 0 (0.0%) | 0 (0.0%) |
| Legal Services & Support | 0 (0.0%) | 0 (0.0%) |
| Education Instruction & Library | 0 (0.0%) | 5 (100.0%) |
| Arts, Media & Entertainment | 0 (0.0%) | 0 (0.0%) |
| Health Diagnosing & Treating | 0 (0.0%) | 6 (100.0%) |
| Health Technologists | 0 (0.0%) | 0 (0.0%) |
| Total (Category) | 6 (35.3%) | 11 (64.7%) |
| Total (Overall) | 17 (35.4%) | 31 (64.6%) |
Services Occupations
The most common Services occupations in Forksville borough are Healthcare Support (1 | 2.1%), Security & Protection (1 | 2.1%), and Law Enforcement (1 | 2.1%).
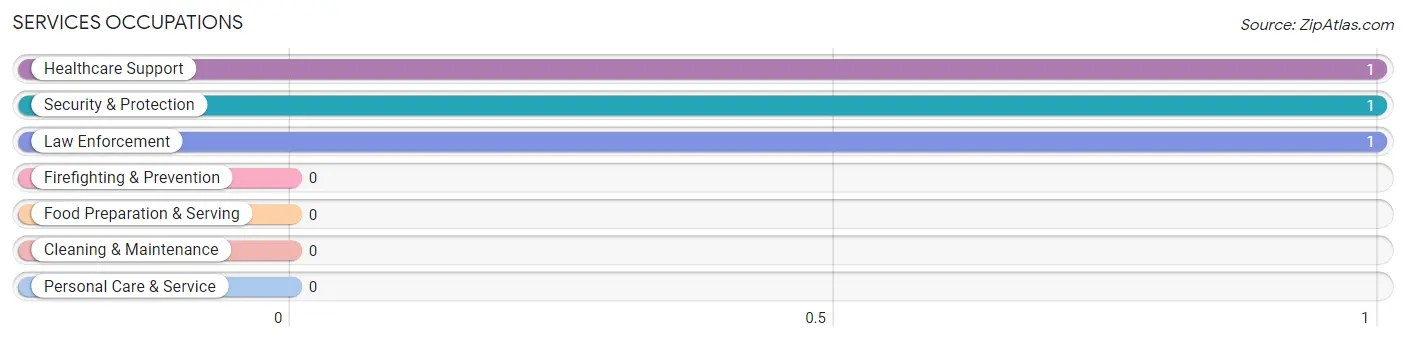
Services Occupations by Sex
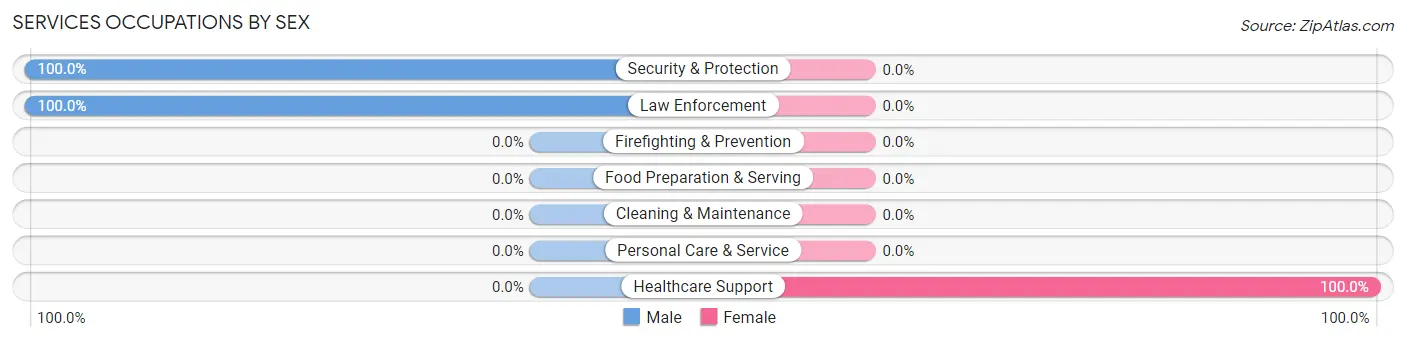
| Occupation | Male | Female |
| Healthcare Support | 0 (0.0%) | 1 (100.0%) |
| Security & Protection | 1 (100.0%) | 0 (0.0%) |
| Firefighting & Prevention | 0 (0.0%) | 0 (0.0%) |
| Law Enforcement | 1 (100.0%) | 0 (0.0%) |
| Food Preparation & Serving | 0 (0.0%) | 0 (0.0%) |
| Cleaning & Maintenance | 0 (0.0%) | 0 (0.0%) |
| Personal Care & Service | 0 (0.0%) | 0 (0.0%) |
| Total (Category) | 1 (50.0%) | 1 (50.0%) |
| Total (Overall) | 17 (35.4%) | 31 (64.6%) |
Sales and Office Occupations
The most common Sales and Office occupations in Forksville borough are , and Office & Administration (10 | 20.8%).
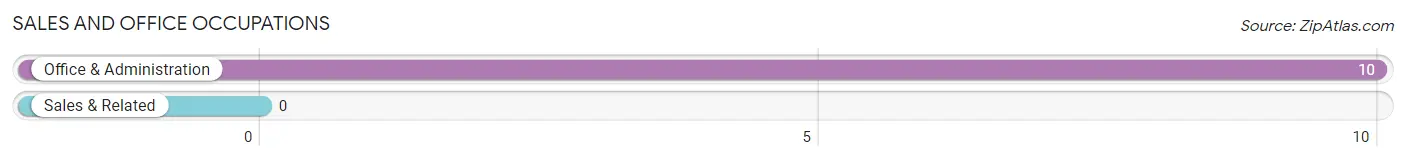
Sales and Office Occupations by Sex
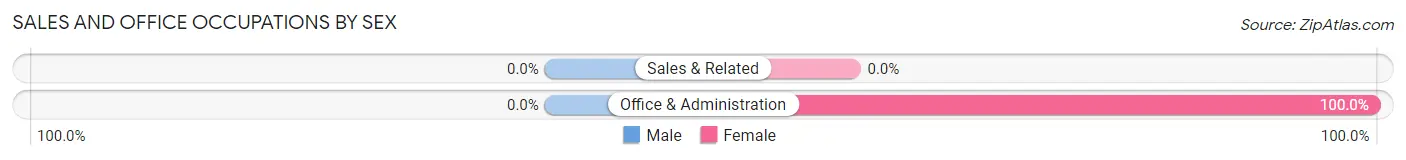
| Occupation | Male | Female |
| Sales & Related | 0 (0.0%) | 0 (0.0%) |
| Office & Administration | 0 (0.0%) | 10 (100.0%) |
| Total (Category) | 0 (0.0%) | 10 (100.0%) |
| Total (Overall) | 17 (35.4%) | 31 (64.6%) |
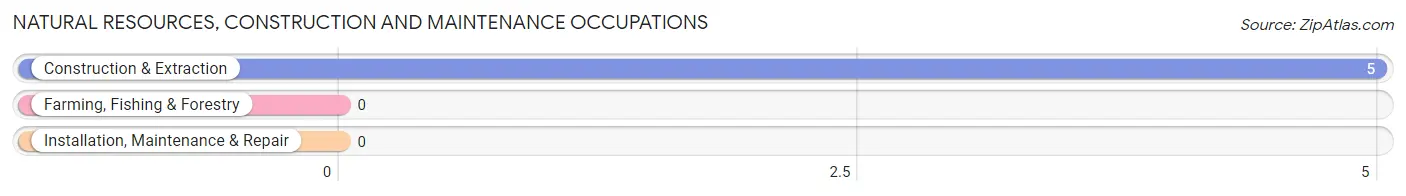
Natural Resources, Construction and Maintenance Occupations
The most common Natural Resources, Construction and Maintenance occupations in Forksville borough are , and Construction & Extraction (5 | 10.4%).
Natural Resources, Construction and Maintenance Occupations by Sex
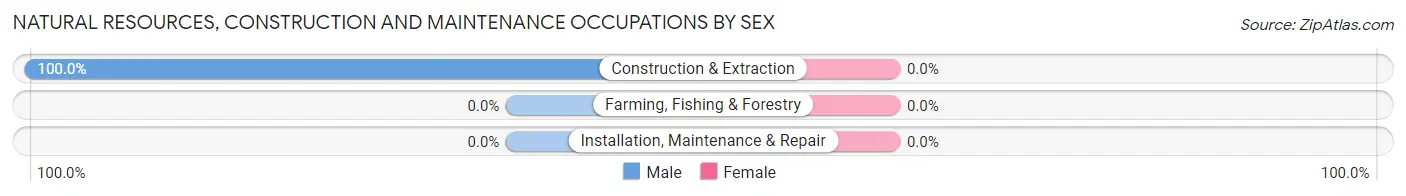
| Occupation | Male | Female |
| Farming, Fishing & Forestry | 0 (0.0%) | 0 (0.0%) |
| Construction & Extraction | 5 (100.0%) | 0 (0.0%) |
| Installation, Maintenance & Repair | 0 (0.0%) | 0 (0.0%) |
| Total (Category) | 5 (100.0%) | 0 (0.0%) |
| Total (Overall) | 17 (35.4%) | 31 (64.6%) |
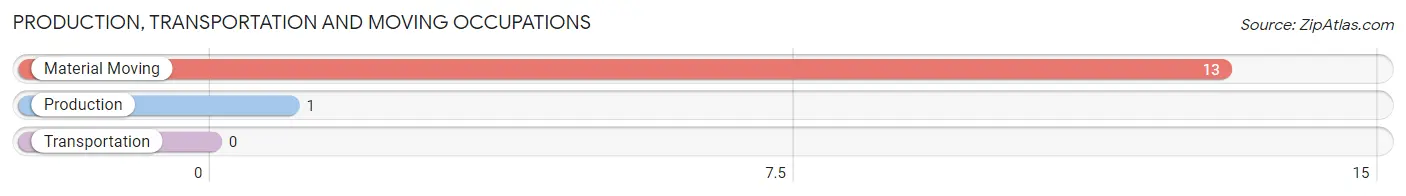
Production, Transportation and Moving Occupations
The most common Production, Transportation and Moving occupations in Forksville borough are Material Moving (13 | 27.1%), and Production (1 | 2.1%).
Production, Transportation and Moving Occupations by Sex
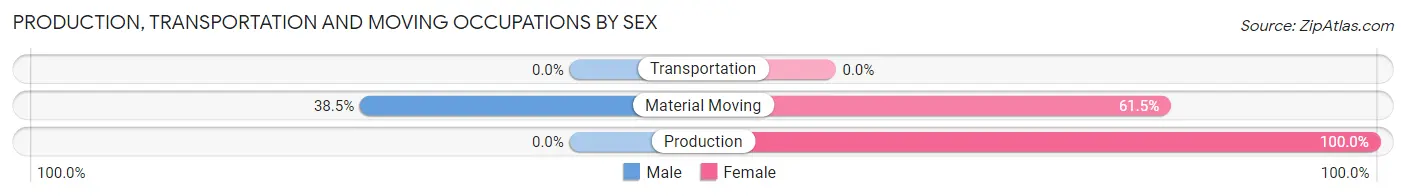
| Occupation | Male | Female |
| Production | 0 (0.0%) | 1 (100.0%) |
| Transportation | 0 (0.0%) | 0 (0.0%) |
| Material Moving | 5 (38.5%) | 8 (61.5%) |
| Total (Category) | 5 (35.7%) | 9 (64.3%) |
| Total (Overall) | 17 (35.4%) | 31 (64.6%) |
Employment Industries by Sex in Forksville borough
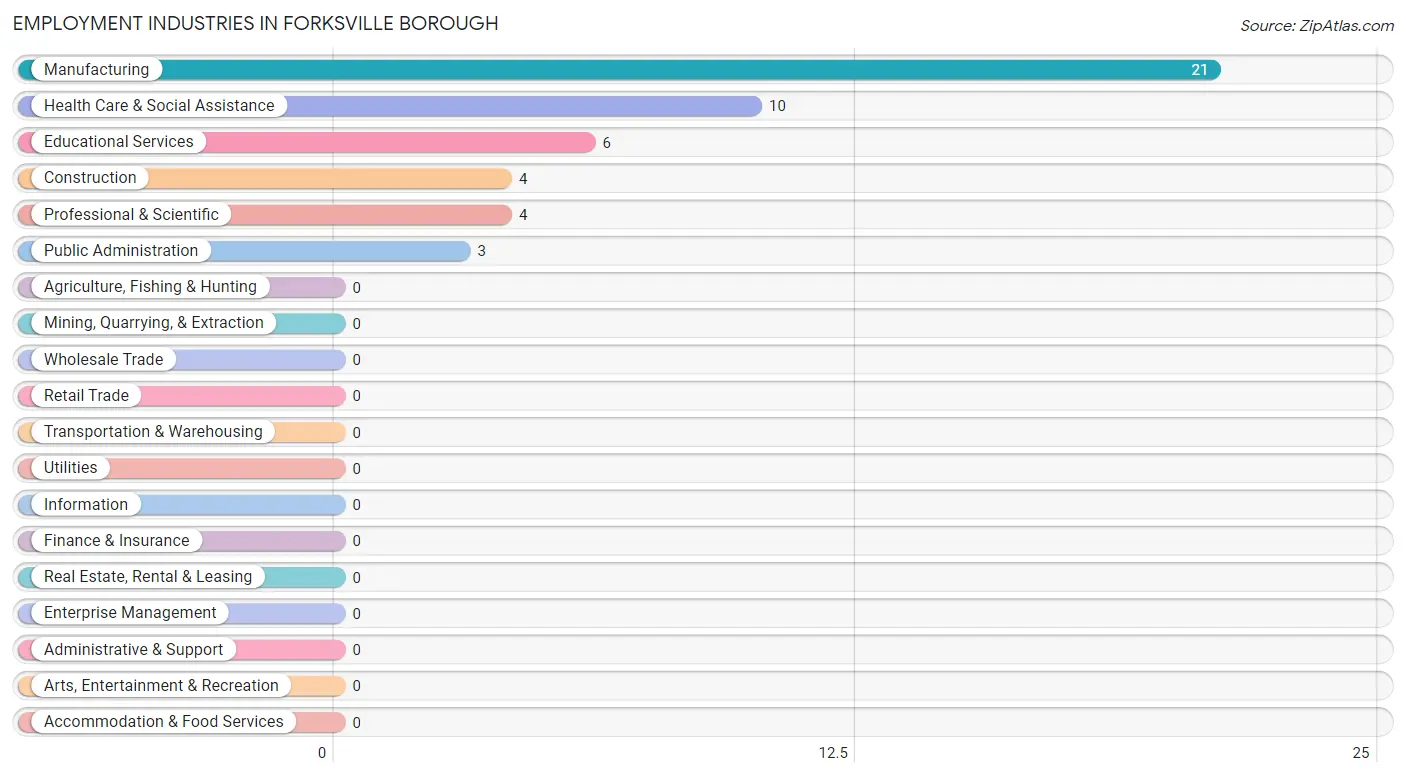
Employment Industries in Forksville borough
The major employment industries in Forksville borough include Manufacturing (21 | 43.8%), Health Care & Social Assistance (10 | 20.8%), Educational Services (6 | 12.5%), Construction (4 | 8.3%), and Professional & Scientific (4 | 8.3%).
Employment Industries by Sex in Forksville borough
The Forksville borough industries that see more men than women are Construction (100.0%), Professional & Scientific (100.0%), and Public Administration (100.0%), whereas the industries that tend to have a higher number of women are Health Care & Social Assistance (100.0%), Educational Services (83.3%), and Manufacturing (76.2%).
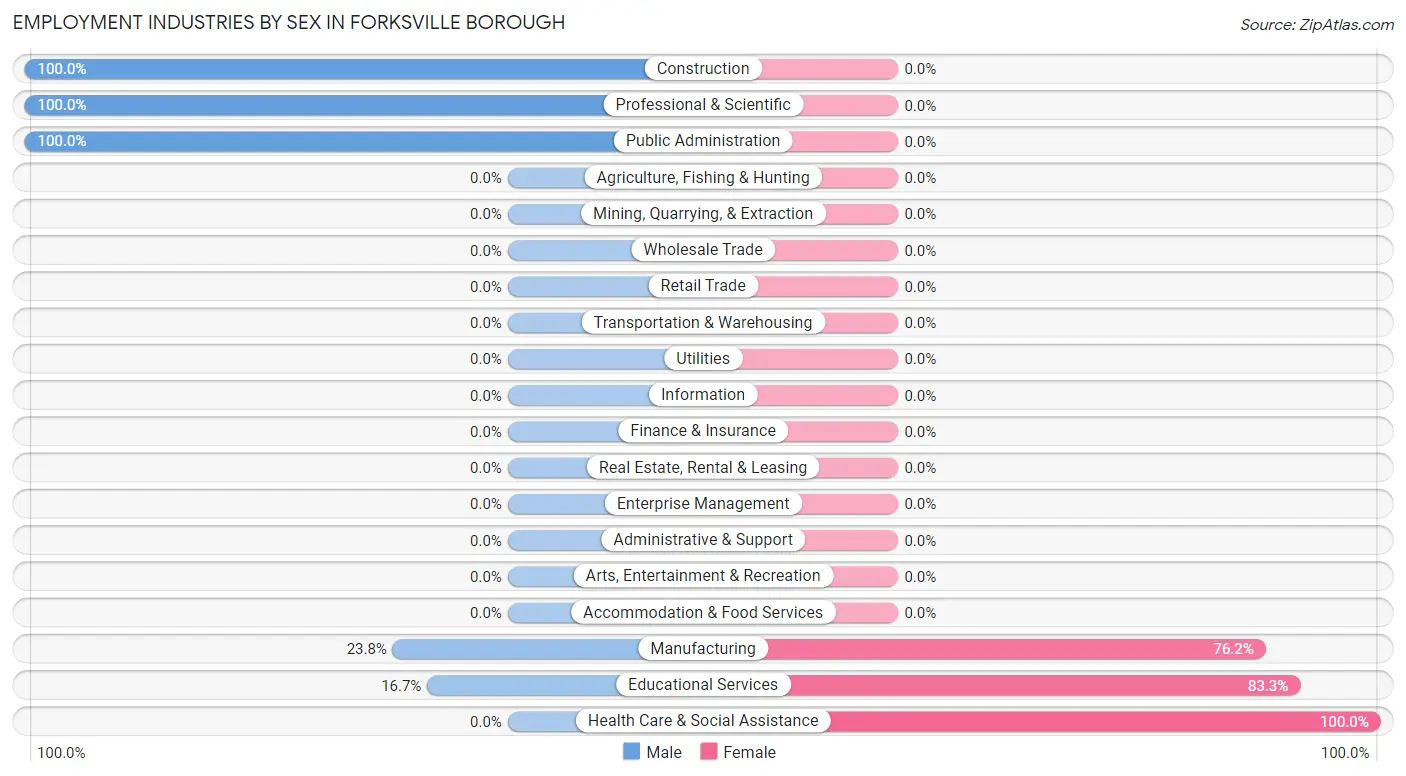
| Industry | Male | Female |
| Agriculture, Fishing & Hunting | 0 (0.0%) | 0 (0.0%) |
| Mining, Quarrying, & Extraction | 0 (0.0%) | 0 (0.0%) |
| Construction | 4 (100.0%) | 0 (0.0%) |
| Manufacturing | 5 (23.8%) | 16 (76.2%) |
| Wholesale Trade | 0 (0.0%) | 0 (0.0%) |
| Retail Trade | 0 (0.0%) | 0 (0.0%) |
| Transportation & Warehousing | 0 (0.0%) | 0 (0.0%) |
| Utilities | 0 (0.0%) | 0 (0.0%) |
| Information | 0 (0.0%) | 0 (0.0%) |
| Finance & Insurance | 0 (0.0%) | 0 (0.0%) |
| Real Estate, Rental & Leasing | 0 (0.0%) | 0 (0.0%) |
| Professional & Scientific | 4 (100.0%) | 0 (0.0%) |
| Enterprise Management | 0 (0.0%) | 0 (0.0%) |
| Administrative & Support | 0 (0.0%) | 0 (0.0%) |
| Educational Services | 1 (16.7%) | 5 (83.3%) |
| Health Care & Social Assistance | 0 (0.0%) | 10 (100.0%) |
| Arts, Entertainment & Recreation | 0 (0.0%) | 0 (0.0%) |
| Accommodation & Food Services | 0 (0.0%) | 0 (0.0%) |
| Public Administration | 3 (100.0%) | 0 (0.0%) |
| Total | 17 (35.4%) | 31 (64.6%) |
Education in Forksville borough
School Enrollment in Forksville borough
The most common levels of schooling among the 19 students in Forksville borough are middle school (9 | 47.4%), high school (7 | 36.8%), and elementary school (2 | 10.5%).

| School Level | # Students | % Students |
| Nursery / Preschool | 0 | 0.0% |
| Kindergarten | 0 | 0.0% |
| Elementary School | 2 | 10.5% |
| Middle School | 9 | 47.4% |
| High School | 7 | 36.8% |
| College / Undergraduate | 1 | 5.3% |
| Graduate / Professional | 0 | 0.0% |
| Total | 19 | 100.0% |
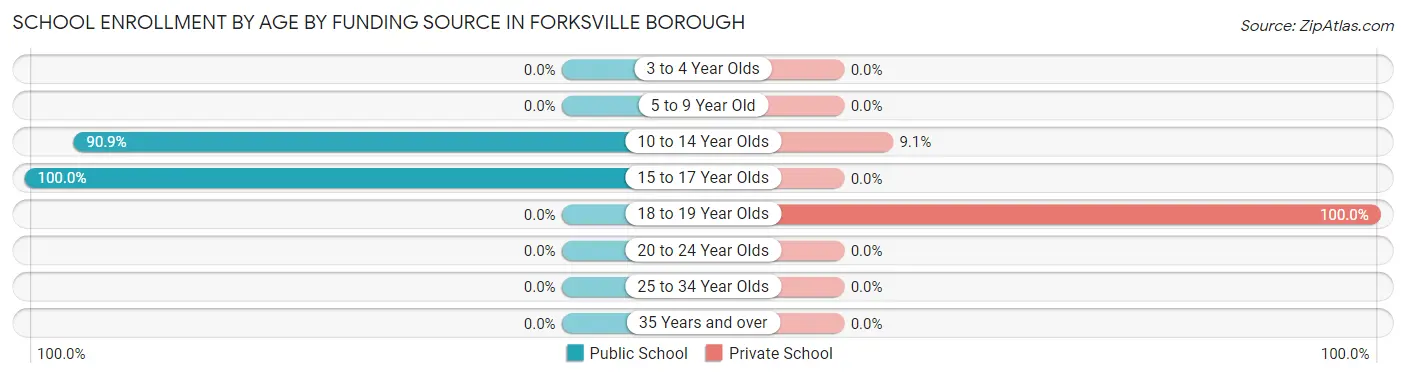
School Enrollment by Age by Funding Source in Forksville borough
Out of a total of 19 students who are enrolled in schools in Forksville borough, 2 (10.5%) attend a private institution, while the remaining 17 (89.5%) are enrolled in public schools. The age group of 18 to 19 year olds has the highest likelihood of being enrolled in private schools, with 1 (100.0% in the age bracket) enrolled. Conversely, the age group of 15 to 17 year olds has the lowest likelihood of being enrolled in a private school, with 7 (100.0% in the age bracket) attending a public institution.
| Age Bracket | Public School | Private School |
| 3 to 4 Year Olds | 0 (0.0%) | 0 (0.0%) |
| 5 to 9 Year Old | 0 (0.0%) | 0 (0.0%) |
| 10 to 14 Year Olds | 10 (90.9%) | 1 (9.1%) |
| 15 to 17 Year Olds | 7 (100.0%) | 0 (0.0%) |
| 18 to 19 Year Olds | 0 (0.0%) | 1 (100.0%) |
| 20 to 24 Year Olds | 0 (0.0%) | 0 (0.0%) |
| 25 to 34 Year Olds | 0 (0.0%) | 0 (0.0%) |
| 35 Years and over | 0 (0.0%) | 0 (0.0%) |
| Total | 17 (89.5%) | 2 (10.5%) |
Educational Attainment by Field of Study in Forksville borough
Education (8 | 38.1%), bio, nature & agricultural (6 | 28.6%), communications (4 | 19.1%), science & technology (2 | 9.5%), and business (1 | 4.8%) are the most common fields of study among 21 individuals in Forksville borough who have obtained a bachelor's degree or higher.
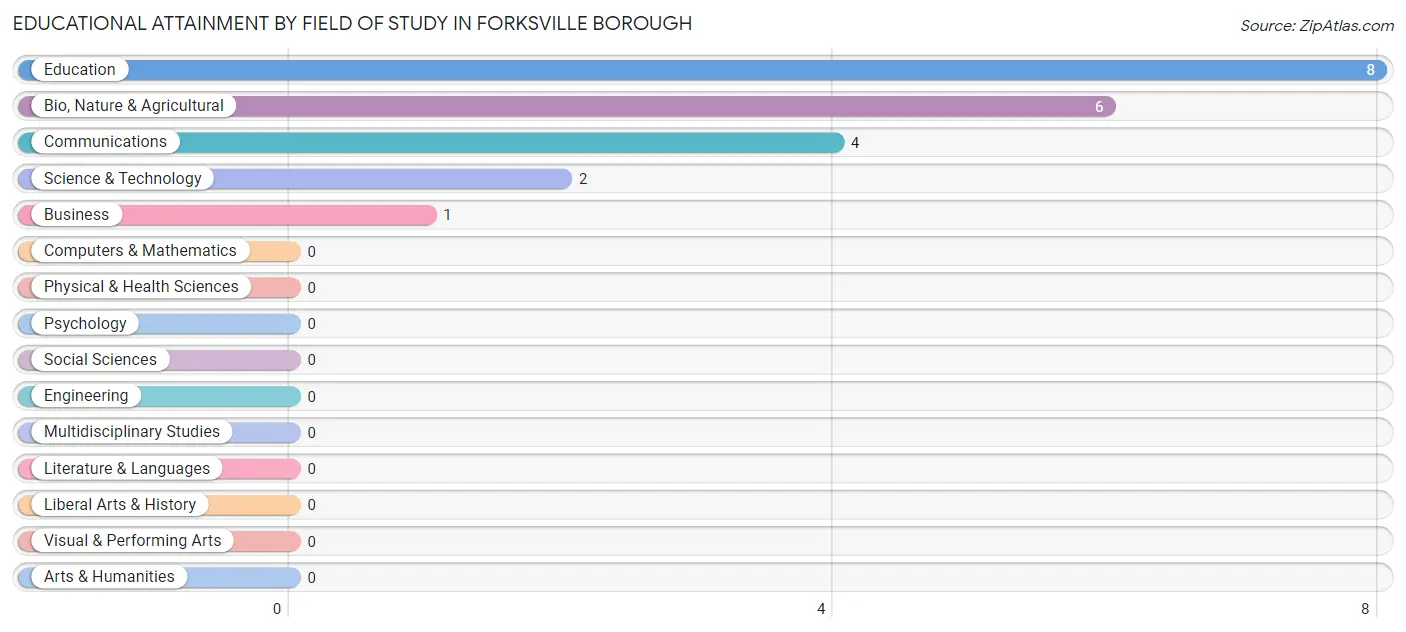
| Field of Study | # Graduates | % Graduates |
| Computers & Mathematics | 0 | 0.0% |
| Bio, Nature & Agricultural | 6 | 28.6% |
| Physical & Health Sciences | 0 | 0.0% |
| Psychology | 0 | 0.0% |
| Social Sciences | 0 | 0.0% |
| Engineering | 0 | 0.0% |
| Multidisciplinary Studies | 0 | 0.0% |
| Science & Technology | 2 | 9.5% |
| Business | 1 | 4.8% |
| Education | 8 | 38.1% |
| Literature & Languages | 0 | 0.0% |
| Liberal Arts & History | 0 | 0.0% |
| Visual & Performing Arts | 0 | 0.0% |
| Communications | 4 | 19.1% |
| Arts & Humanities | 0 | 0.0% |
| Total | 21 | 100.0% |
Transportation & Commute in Forksville borough
Vehicle Availability by Sex in Forksville borough
The most prevalent vehicle ownership categories in Forksville borough are males with 1 vehicle (10, accounting for 58.8%) and females with 1 vehicle (11, making up 33.3%).
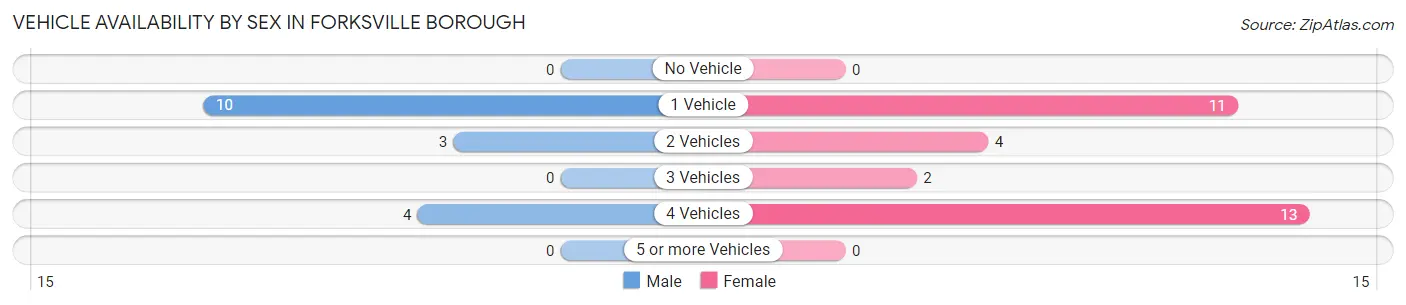
| Vehicles Available | Male | Female |
| No Vehicle | 0 (0.0%) | 0 (0.0%) |
| 1 Vehicle | 10 (58.8%) | 11 (36.7%) |
| 2 Vehicles | 3 (17.6%) | 4 (13.3%) |
| 3 Vehicles | 0 (0.0%) | 2 (6.7%) |
| 4 Vehicles | 4 (23.5%) | 13 (43.3%) |
| 5 or more Vehicles | 0 (0.0%) | 0 (0.0%) |
| Total | 17 (100.0%) | 30 (100.0%) |
Commute Time in Forksville borough
The most frequently occuring commute durations in Forksville borough are 45 to 59 minutes (12 commuters, 26.7%), 5 to 9 minutes (10 commuters, 22.2%), and 20 to 24 minutes (10 commuters, 22.2%).
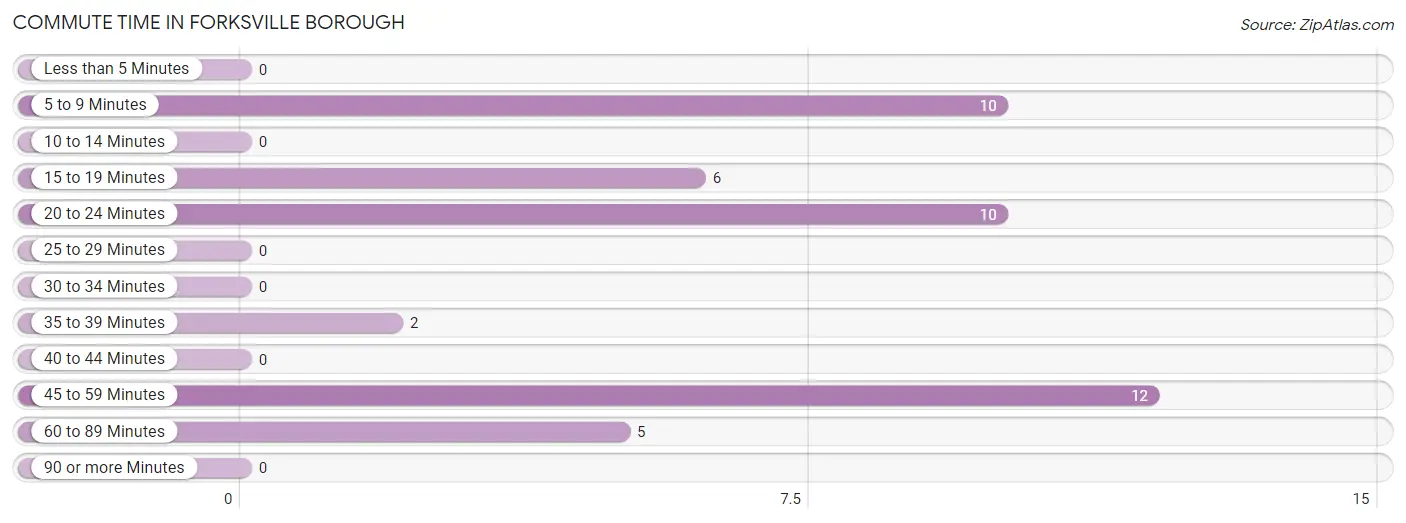
| Commute Time | # Commuters | % Commuters |
| Less than 5 Minutes | 0 | 0.0% |
| 5 to 9 Minutes | 10 | 22.2% |
| 10 to 14 Minutes | 0 | 0.0% |
| 15 to 19 Minutes | 6 | 13.3% |
| 20 to 24 Minutes | 10 | 22.2% |
| 25 to 29 Minutes | 0 | 0.0% |
| 30 to 34 Minutes | 0 | 0.0% |
| 35 to 39 Minutes | 2 | 4.4% |
| 40 to 44 Minutes | 0 | 0.0% |
| 45 to 59 Minutes | 12 | 26.7% |
| 60 to 89 Minutes | 5 | 11.1% |
| 90 or more Minutes | 0 | 0.0% |
Commute Time by Sex in Forksville borough
The most common commute times in Forksville borough are 45 to 59 minutes (5 commuters, 33.3%) for males and 20 to 24 minutes (9 commuters, 30.0%) for females.
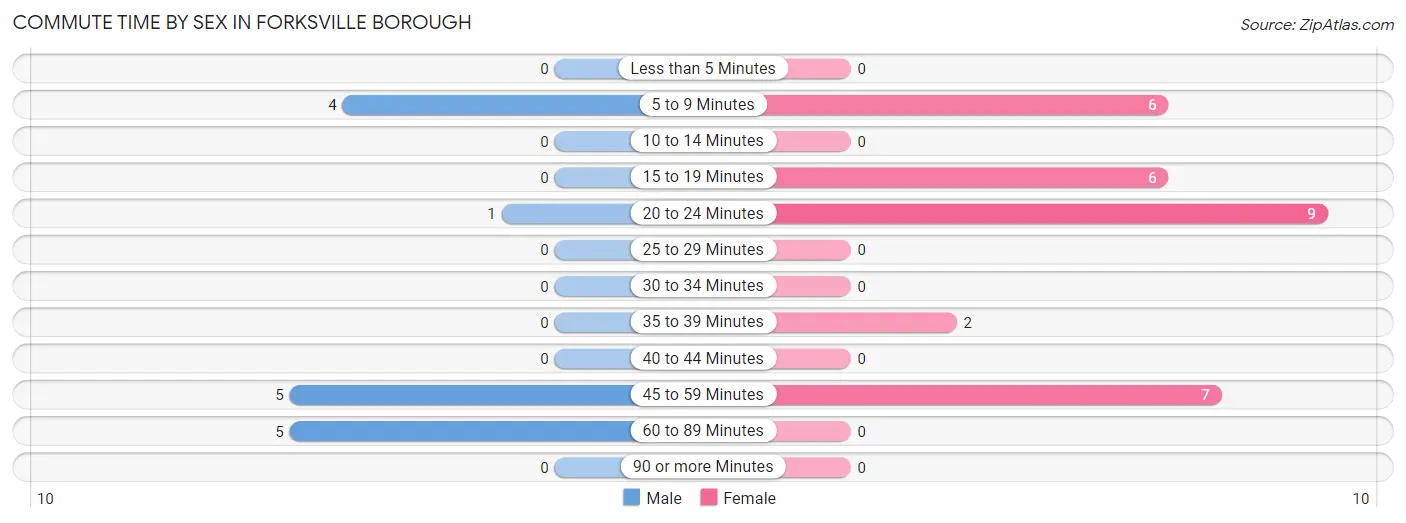
| Commute Time | Male | Female |
| Less than 5 Minutes | 0 (0.0%) | 0 (0.0%) |
| 5 to 9 Minutes | 4 (26.7%) | 6 (20.0%) |
| 10 to 14 Minutes | 0 (0.0%) | 0 (0.0%) |
| 15 to 19 Minutes | 0 (0.0%) | 6 (20.0%) |
| 20 to 24 Minutes | 1 (6.7%) | 9 (30.0%) |
| 25 to 29 Minutes | 0 (0.0%) | 0 (0.0%) |
| 30 to 34 Minutes | 0 (0.0%) | 0 (0.0%) |
| 35 to 39 Minutes | 0 (0.0%) | 2 (6.7%) |
| 40 to 44 Minutes | 0 (0.0%) | 0 (0.0%) |
| 45 to 59 Minutes | 5 (33.3%) | 7 (23.3%) |
| 60 to 89 Minutes | 5 (33.3%) | 0 (0.0%) |
| 90 or more Minutes | 0 (0.0%) | 0 (0.0%) |
Time of Departure to Work by Sex in Forksville borough
The most frequent times of departure to work in Forksville borough are 6:00 AM to 6:29 AM (5, 33.3%) for males and 8:30 AM to 8:59 AM (8, 26.7%) for females.
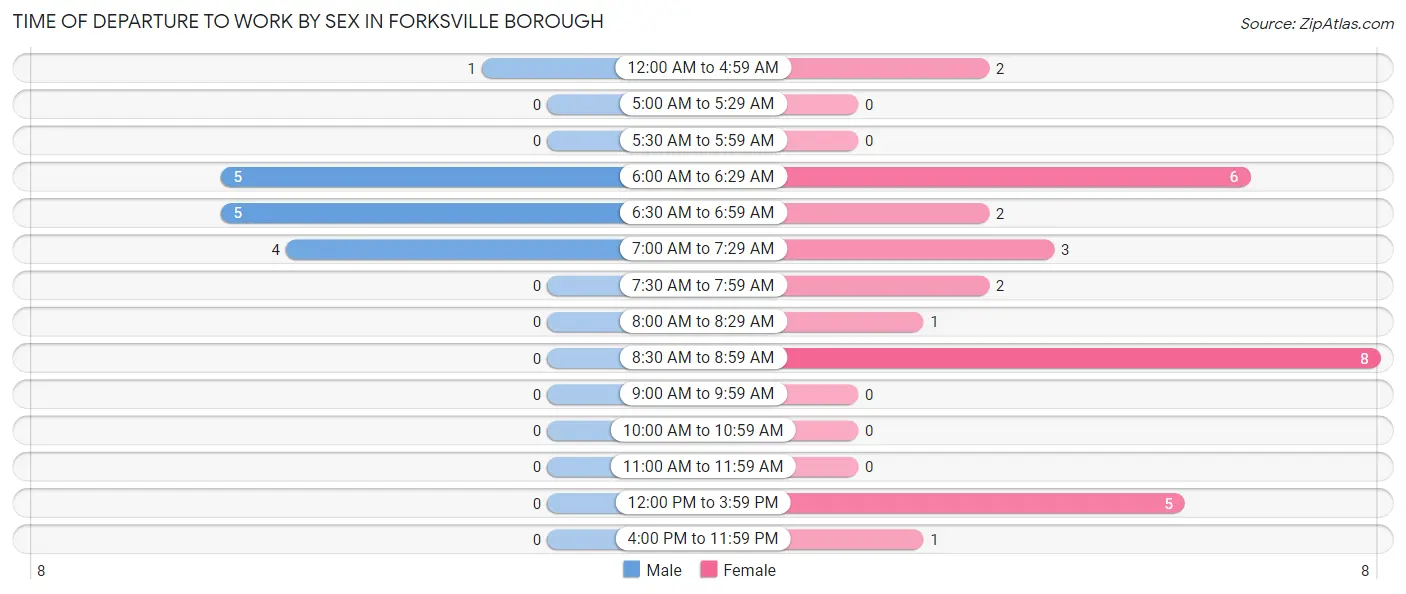
| Time of Departure | Male | Female |
| 12:00 AM to 4:59 AM | 1 (6.7%) | 2 (6.7%) |
| 5:00 AM to 5:29 AM | 0 (0.0%) | 0 (0.0%) |
| 5:30 AM to 5:59 AM | 0 (0.0%) | 0 (0.0%) |
| 6:00 AM to 6:29 AM | 5 (33.3%) | 6 (20.0%) |
| 6:30 AM to 6:59 AM | 5 (33.3%) | 2 (6.7%) |
| 7:00 AM to 7:29 AM | 4 (26.7%) | 3 (10.0%) |
| 7:30 AM to 7:59 AM | 0 (0.0%) | 2 (6.7%) |
| 8:00 AM to 8:29 AM | 0 (0.0%) | 1 (3.3%) |
| 8:30 AM to 8:59 AM | 0 (0.0%) | 8 (26.7%) |
| 9:00 AM to 9:59 AM | 0 (0.0%) | 0 (0.0%) |
| 10:00 AM to 10:59 AM | 0 (0.0%) | 0 (0.0%) |
| 11:00 AM to 11:59 AM | 0 (0.0%) | 0 (0.0%) |
| 12:00 PM to 3:59 PM | 0 (0.0%) | 5 (16.7%) |
| 4:00 PM to 11:59 PM | 0 (0.0%) | 1 (3.3%) |
| Total | 15 (100.0%) | 30 (100.0%) |
Housing Occupancy in Forksville borough
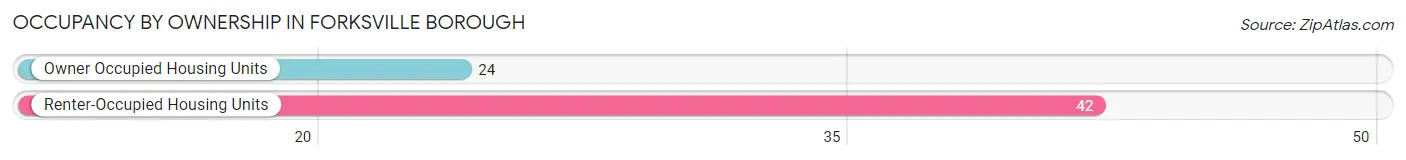
Occupancy by Ownership in Forksville borough
Of the total 66 dwellings in Forksville borough, owner-occupied units account for 24 (36.4%), while renter-occupied units make up 42 (63.6%).
| Occupancy | # Housing Units | % Housing Units |
| Owner Occupied Housing Units | 24 | 36.4% |
| Renter-Occupied Housing Units | 42 | 63.6% |
| Total Occupied Housing Units | 66 | 100.0% |
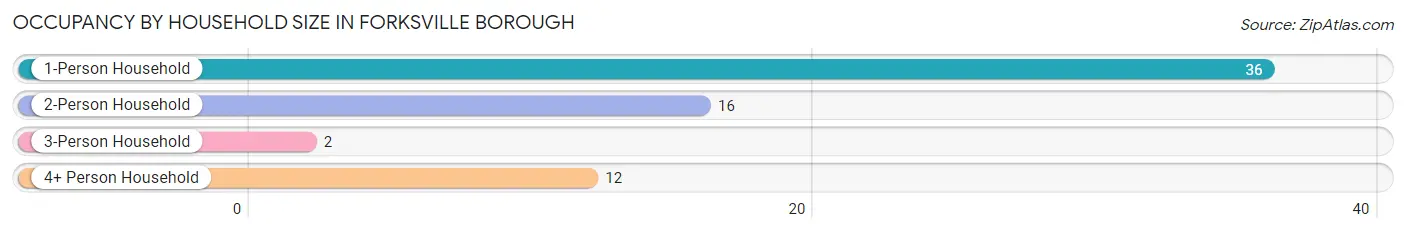
Occupancy by Household Size in Forksville borough
| Household Size | # Housing Units | % Housing Units |
| 1-Person Household | 36 | 54.5% |
| 2-Person Household | 16 | 24.2% |
| 3-Person Household | 2 | 3.0% |
| 4+ Person Household | 12 | 18.2% |
| Total Housing Units | 66 | 100.0% |
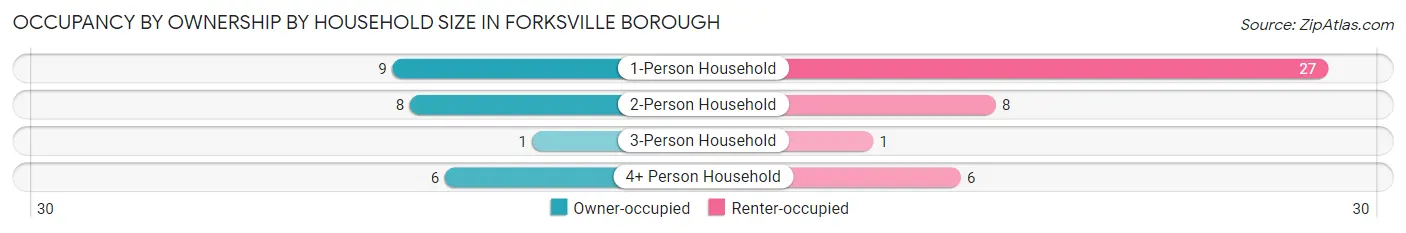
Occupancy by Ownership by Household Size in Forksville borough
| Household Size | Owner-occupied | Renter-occupied |
| 1-Person Household | 9 (25.0%) | 27 (75.0%) |
| 2-Person Household | 8 (50.0%) | 8 (50.0%) |
| 3-Person Household | 1 (50.0%) | 1 (50.0%) |
| 4+ Person Household | 6 (50.0%) | 6 (50.0%) |
| Total Housing Units | 24 (36.4%) | 42 (63.6%) |
Occupancy by Educational Attainment in Forksville borough
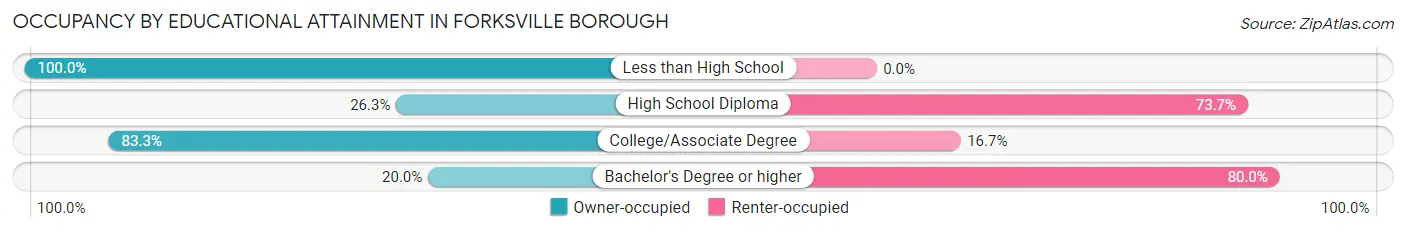
| Household Size | Owner-occupied | Renter-occupied |
| Less than High School | 1 (100.0%) | 0 (0.0%) |
| High School Diploma | 10 (26.3%) | 28 (73.7%) |
| College/Associate Degree | 10 (83.3%) | 2 (16.7%) |
| Bachelor's Degree or higher | 3 (20.0%) | 12 (80.0%) |
Occupancy by Age of Householder in Forksville borough
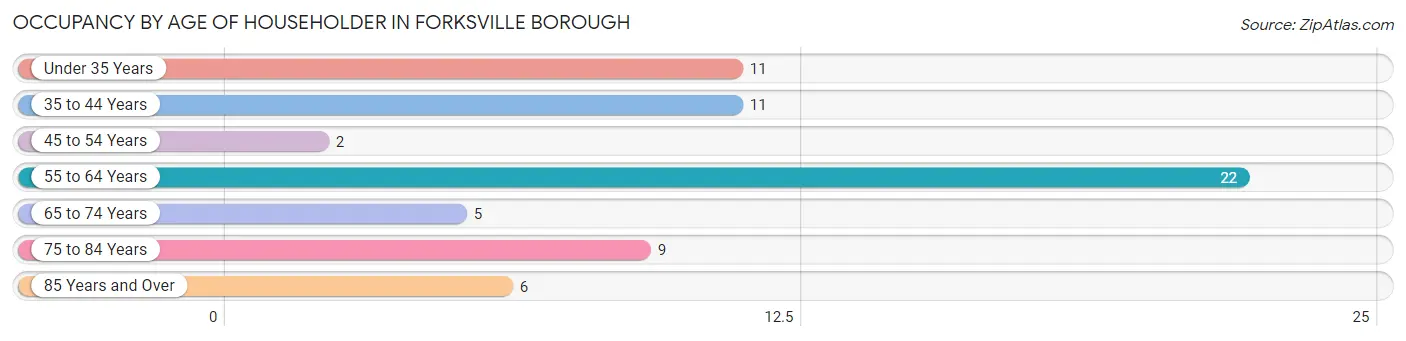
| Age Bracket | # Households | % Households |
| Under 35 Years | 11 | 16.7% |
| 35 to 44 Years | 11 | 16.7% |
| 45 to 54 Years | 2 | 3.0% |
| 55 to 64 Years | 22 | 33.3% |
| 65 to 74 Years | 5 | 7.6% |
| 75 to 84 Years | 9 | 13.6% |
| 85 Years and Over | 6 | 9.1% |
| Total | 66 | 100.0% |
Housing Finances in Forksville borough
Median Income by Occupancy in Forksville borough
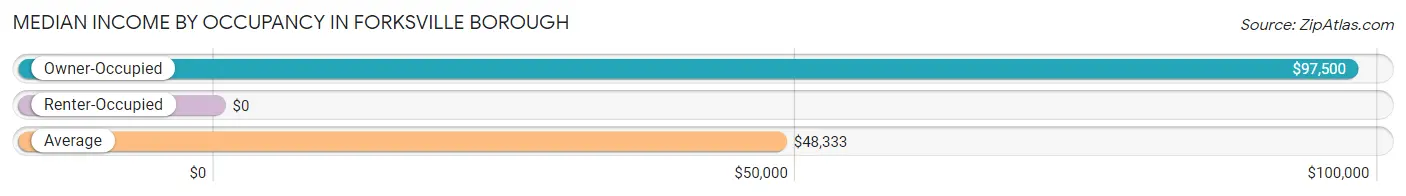
| Occupancy Type | # Households | Median Income |
| Owner-Occupied | 24 (36.4%) | $97,500 |
| Renter-Occupied | 42 (63.6%) | $0 |
| Average | 66 (100.0%) | $48,333 |
Occupancy by Householder Income Bracket in Forksville borough
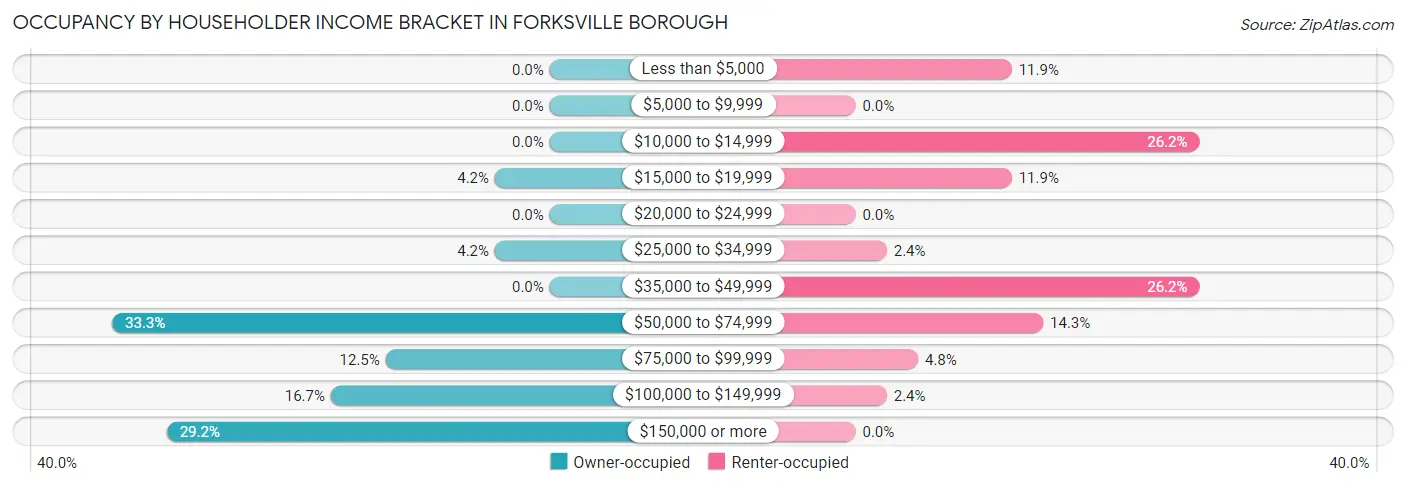
| Income Bracket | Owner-occupied | Renter-occupied |
| Less than $5,000 | 0 (0.0%) | 5 (11.9%) |
| $5,000 to $9,999 | 0 (0.0%) | 0 (0.0%) |
| $10,000 to $14,999 | 0 (0.0%) | 11 (26.2%) |
| $15,000 to $19,999 | 1 (4.2%) | 5 (11.9%) |
| $20,000 to $24,999 | 0 (0.0%) | 0 (0.0%) |
| $25,000 to $34,999 | 1 (4.2%) | 1 (2.4%) |
| $35,000 to $49,999 | 0 (0.0%) | 11 (26.2%) |
| $50,000 to $74,999 | 8 (33.3%) | 6 (14.3%) |
| $75,000 to $99,999 | 3 (12.5%) | 2 (4.8%) |
| $100,000 to $149,999 | 4 (16.7%) | 1 (2.4%) |
| $150,000 or more | 7 (29.2%) | 0 (0.0%) |
| Total | 24 (100.0%) | 42 (100.0%) |
Monthly Housing Cost Tiers in Forksville borough
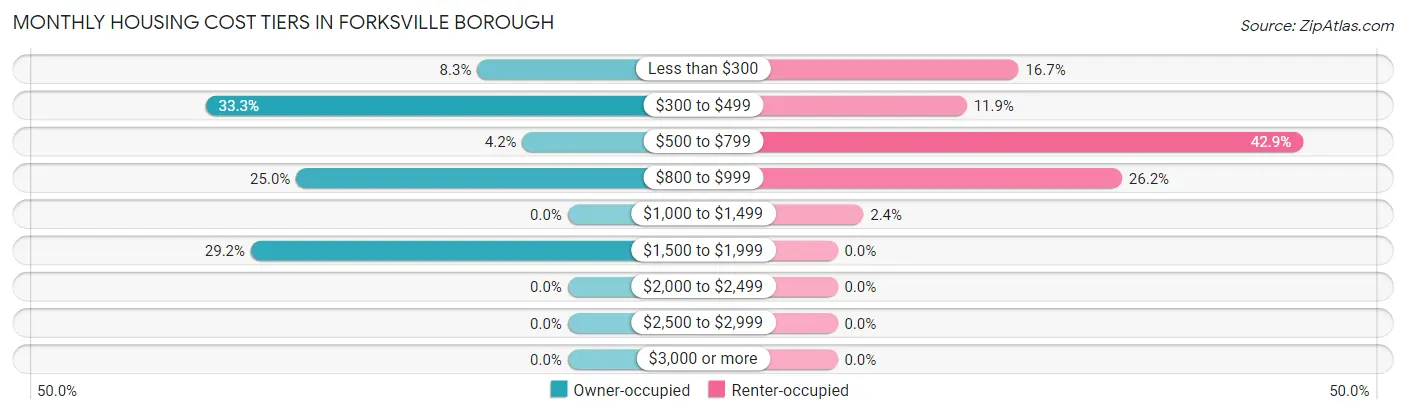
| Monthly Cost | Owner-occupied | Renter-occupied |
| Less than $300 | 2 (8.3%) | 7 (16.7%) |
| $300 to $499 | 8 (33.3%) | 5 (11.9%) |
| $500 to $799 | 1 (4.2%) | 18 (42.9%) |
| $800 to $999 | 6 (25.0%) | 11 (26.2%) |
| $1,000 to $1,499 | 0 (0.0%) | 1 (2.4%) |
| $1,500 to $1,999 | 7 (29.2%) | 0 (0.0%) |
| $2,000 to $2,499 | 0 (0.0%) | 0 (0.0%) |
| $2,500 to $2,999 | 0 (0.0%) | 0 (0.0%) |
| $3,000 or more | 0 (0.0%) | 0 (0.0%) |
| Total | 24 (100.0%) | 42 (100.0%) |
Physical Housing Characteristics in Forksville borough
Housing Structures in Forksville borough
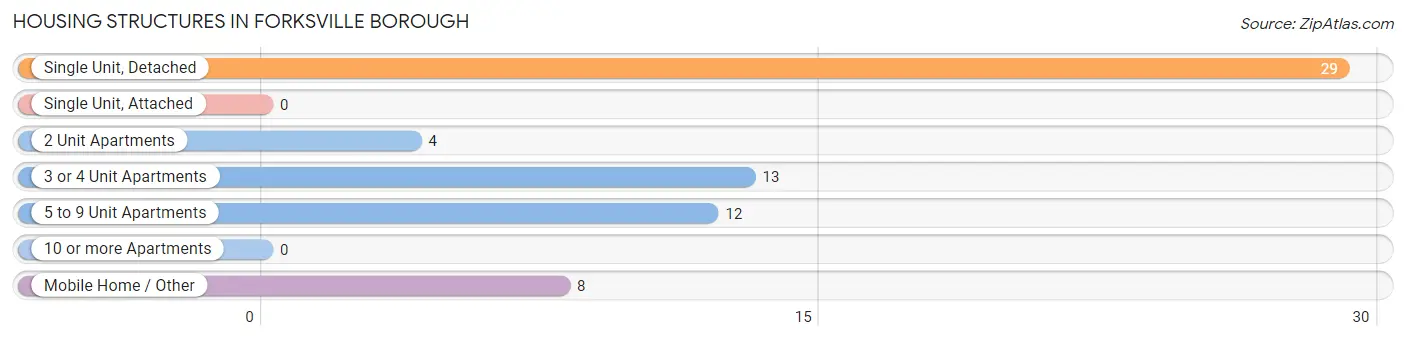
| Structure Type | # Housing Units | % Housing Units |
| Single Unit, Detached | 29 | 43.9% |
| Single Unit, Attached | 0 | 0.0% |
| 2 Unit Apartments | 4 | 6.1% |
| 3 or 4 Unit Apartments | 13 | 19.7% |
| 5 to 9 Unit Apartments | 12 | 18.2% |
| 10 or more Apartments | 0 | 0.0% |
| Mobile Home / Other | 8 | 12.1% |
| Total | 66 | 100.0% |
Housing Structures by Occupancy in Forksville borough
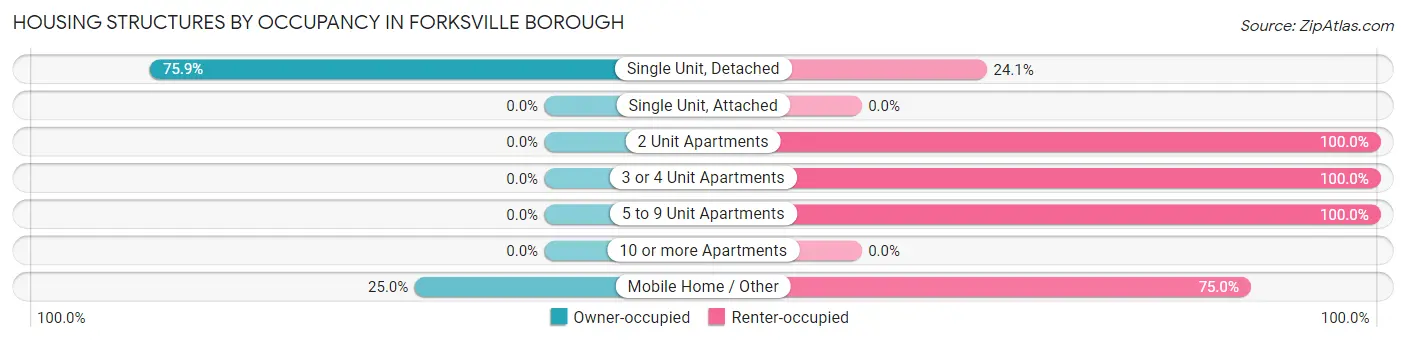
| Structure Type | Owner-occupied | Renter-occupied |
| Single Unit, Detached | 22 (75.9%) | 7 (24.1%) |
| Single Unit, Attached | 0 (0.0%) | 0 (0.0%) |
| 2 Unit Apartments | 0 (0.0%) | 4 (100.0%) |
| 3 or 4 Unit Apartments | 0 (0.0%) | 13 (100.0%) |
| 5 to 9 Unit Apartments | 0 (0.0%) | 12 (100.0%) |
| 10 or more Apartments | 0 (0.0%) | 0 (0.0%) |
| Mobile Home / Other | 2 (25.0%) | 6 (75.0%) |
| Total | 24 (36.4%) | 42 (63.6%) |
Housing Structures by Number of Rooms in Forksville borough
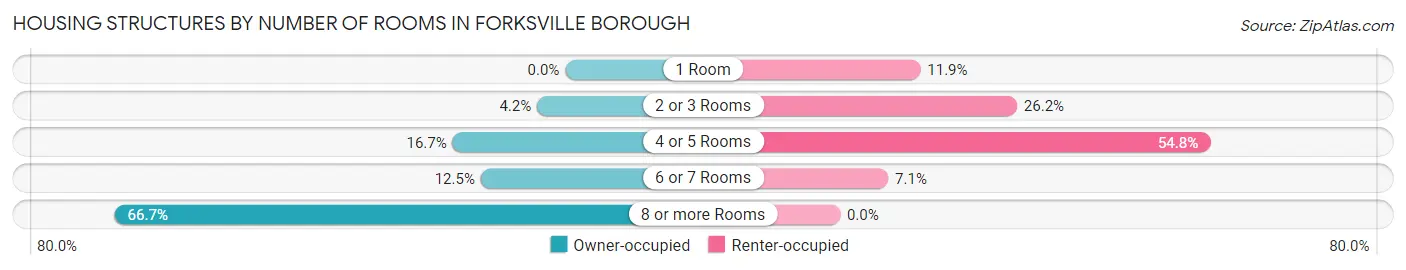
| Number of Rooms | Owner-occupied | Renter-occupied |
| 1 Room | 0 (0.0%) | 5 (11.9%) |
| 2 or 3 Rooms | 1 (4.2%) | 11 (26.2%) |
| 4 or 5 Rooms | 4 (16.7%) | 23 (54.8%) |
| 6 or 7 Rooms | 3 (12.5%) | 3 (7.1%) |
| 8 or more Rooms | 16 (66.7%) | 0 (0.0%) |
| Total | 24 (100.0%) | 42 (100.0%) |
Housing Structure by Heating Type in Forksville borough
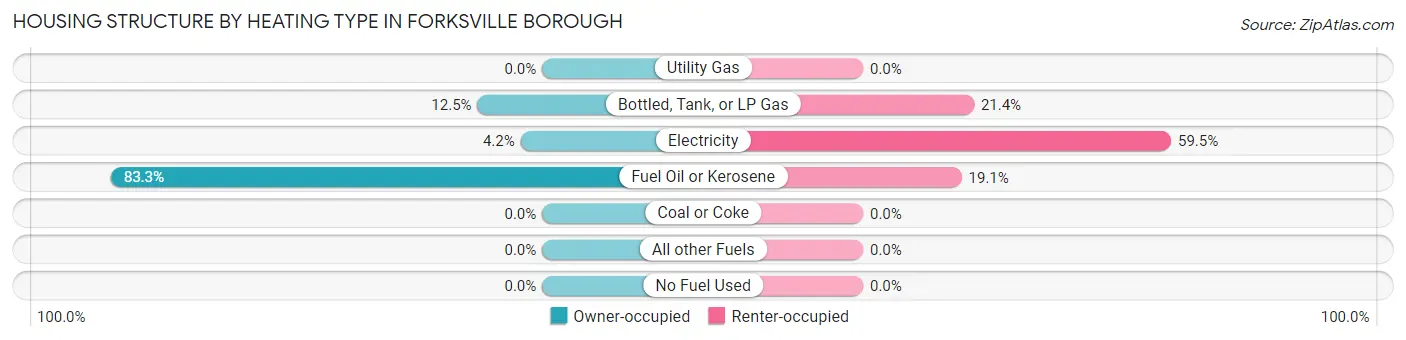
| Heating Type | Owner-occupied | Renter-occupied |
| Utility Gas | 0 (0.0%) | 0 (0.0%) |
| Bottled, Tank, or LP Gas | 3 (12.5%) | 9 (21.4%) |
| Electricity | 1 (4.2%) | 25 (59.5%) |
| Fuel Oil or Kerosene | 20 (83.3%) | 8 (19.1%) |
| Coal or Coke | 0 (0.0%) | 0 (0.0%) |
| All other Fuels | 0 (0.0%) | 0 (0.0%) |
| No Fuel Used | 0 (0.0%) | 0 (0.0%) |
| Total | 24 (100.0%) | 42 (100.0%) |
Household Vehicle Usage in Forksville borough
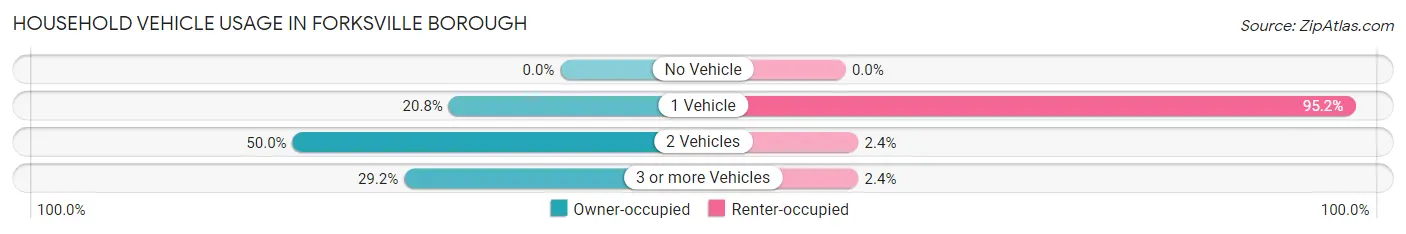
| Vehicles per Household | Owner-occupied | Renter-occupied |
| No Vehicle | 0 (0.0%) | 0 (0.0%) |
| 1 Vehicle | 5 (20.8%) | 40 (95.2%) |
| 2 Vehicles | 12 (50.0%) | 1 (2.4%) |
| 3 or more Vehicles | 7 (29.2%) | 1 (2.4%) |
| Total | 24 (100.0%) | 42 (100.0%) |
Real Estate & Mortgages in Forksville borough
Real Estate and Mortgage Overview in Forksville borough
| Characteristic | Without Mortgage | With Mortgage |
| Housing Units | 12 | 12 |
| Median Property Value | $162,500 | $133,300 |
| Median Household Income | $52,000 | $7 |
| Monthly Housing Costs | $350 | $0 |
| Real Estate Taxes | $950 | $0 |
Property Value by Mortgage Status in Forksville borough
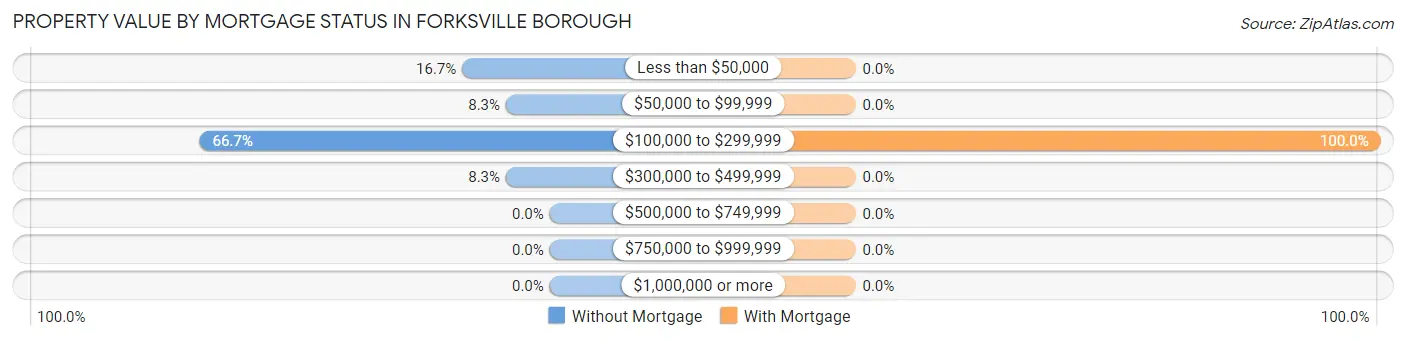
| Property Value | Without Mortgage | With Mortgage |
| Less than $50,000 | 2 (16.7%) | 0 (0.0%) |
| $50,000 to $99,999 | 1 (8.3%) | 0 (0.0%) |
| $100,000 to $299,999 | 8 (66.7%) | 12 (100.0%) |
| $300,000 to $499,999 | 1 (8.3%) | 0 (0.0%) |
| $500,000 to $749,999 | 0 (0.0%) | 0 (0.0%) |
| $750,000 to $999,999 | 0 (0.0%) | 0 (0.0%) |
| $1,000,000 or more | 0 (0.0%) | 0 (0.0%) |
| Total | 12 (100.0%) | 12 (100.0%) |
Household Income by Mortgage Status in Forksville borough
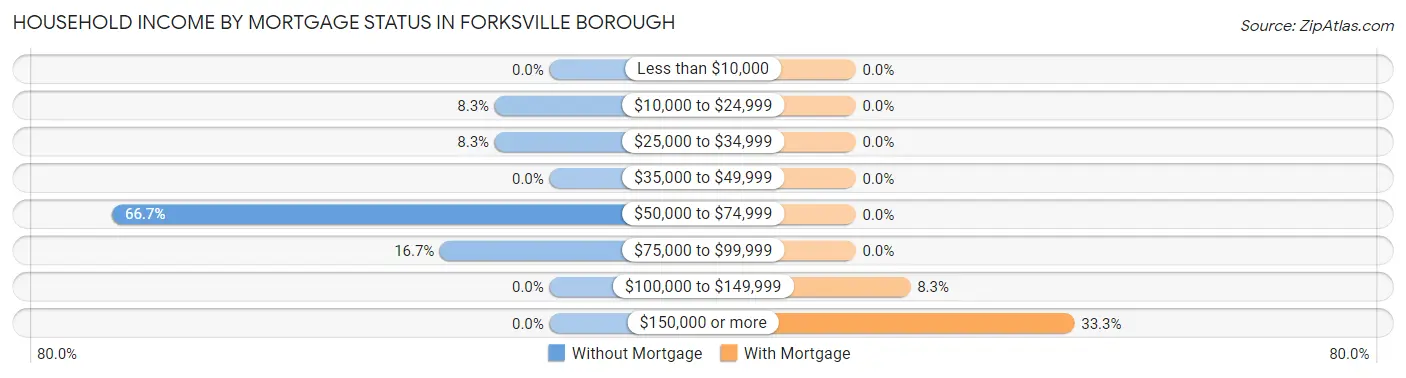
| Household Income | Without Mortgage | With Mortgage |
| Less than $10,000 | 0 (0.0%) | 0 (0.0%) |
| $10,000 to $24,999 | 1 (8.3%) | 0 (0.0%) |
| $25,000 to $34,999 | 1 (8.3%) | 0 (0.0%) |
| $35,000 to $49,999 | 0 (0.0%) | 0 (0.0%) |
| $50,000 to $74,999 | 8 (66.7%) | 0 (0.0%) |
| $75,000 to $99,999 | 2 (16.7%) | 0 (0.0%) |
| $100,000 to $149,999 | 0 (0.0%) | 1 (8.3%) |
| $150,000 or more | 0 (0.0%) | 4 (33.3%) |
| Total | 12 (100.0%) | 12 (100.0%) |
Property Value to Household Income Ratio in Forksville borough
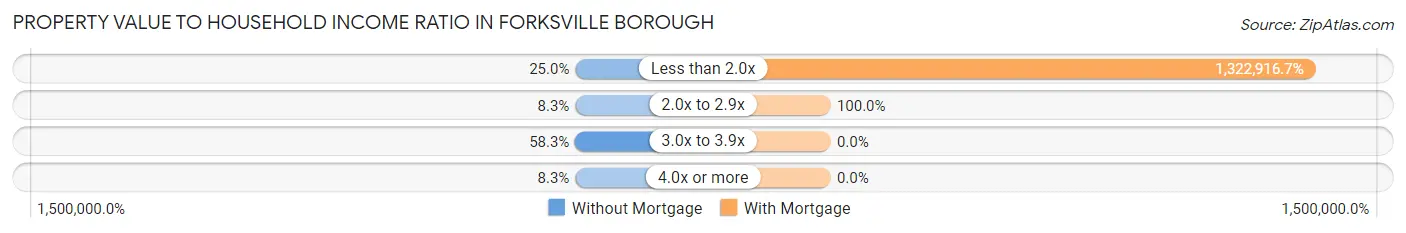
| Value-to-Income Ratio | Without Mortgage | With Mortgage |
| Less than 2.0x | 3 (25.0%) | 158,750 (1,322,916.7%) |
| 2.0x to 2.9x | 1 (8.3%) | 12 (100.0%) |
| 3.0x to 3.9x | 7 (58.3%) | 0 (0.0%) |
| 4.0x or more | 1 (8.3%) | 0 (0.0%) |
| Total | 12 (100.0%) | 12 (100.0%) |
Real Estate Taxes by Mortgage Status in Forksville borough
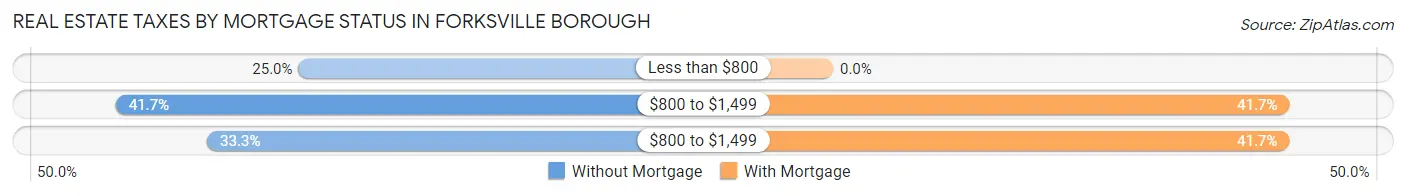
| Property Taxes | Without Mortgage | With Mortgage |
| Less than $800 | 3 (25.0%) | 0 (0.0%) |
| $800 to $1,499 | 5 (41.7%) | 5 (41.7%) |
| $800 to $1,499 | 4 (33.3%) | 5 (41.7%) |
| Total | 12 (100.0%) | 12 (100.0%) |
Health & Disability in Forksville borough
Health Insurance Coverage by Age in Forksville borough
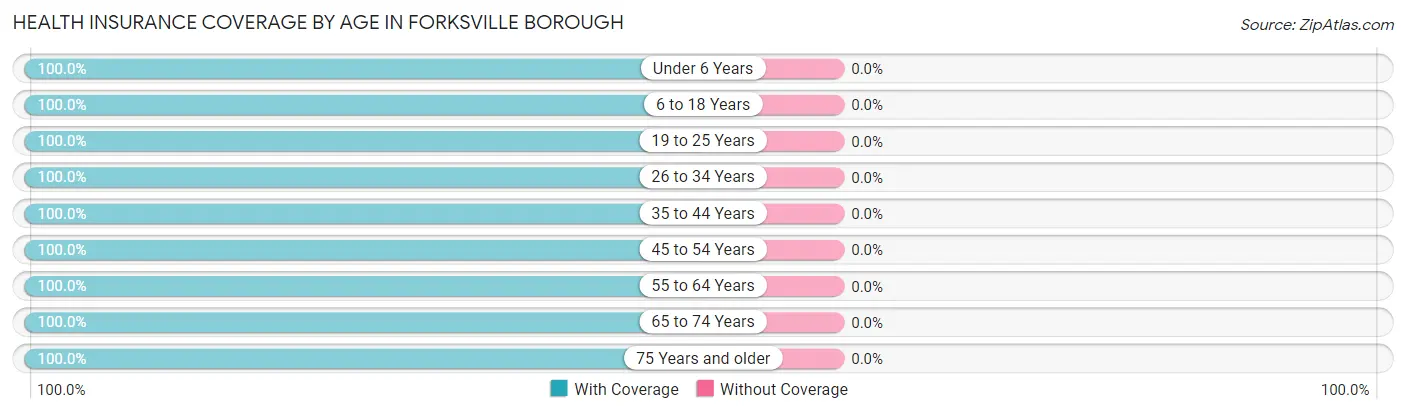
| Age Bracket | With Coverage | Without Coverage |
| Under 6 Years | 3 (100.0%) | 0 (0.0%) |
| 6 to 18 Years | 20 (100.0%) | 0 (0.0%) |
| 19 to 25 Years | 4 (100.0%) | 0 (0.0%) |
| 26 to 34 Years | 11 (100.0%) | 0 (0.0%) |
| 35 to 44 Years | 15 (100.0%) | 0 (0.0%) |
| 45 to 54 Years | 5 (100.0%) | 0 (0.0%) |
| 55 to 64 Years | 41 (100.0%) | 0 (0.0%) |
| 65 to 74 Years | 6 (100.0%) | 0 (0.0%) |
| 75 Years and older | 22 (100.0%) | 0 (0.0%) |
| Total | 127 (100.0%) | 0 (0.0%) |
Health Insurance Coverage by Citizenship Status in Forksville borough
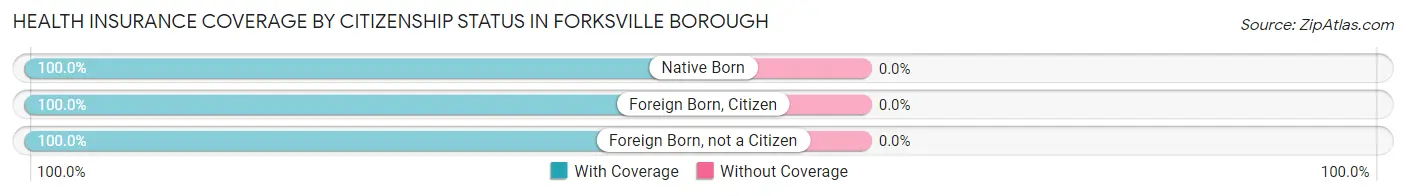
| Citizenship Status | With Coverage | Without Coverage |
| Native Born | 3 (100.0%) | 0 (0.0%) |
| Foreign Born, Citizen | 20 (100.0%) | 0 (0.0%) |
| Foreign Born, not a Citizen | 4 (100.0%) | 0 (0.0%) |
Health Insurance Coverage by Household Income in Forksville borough
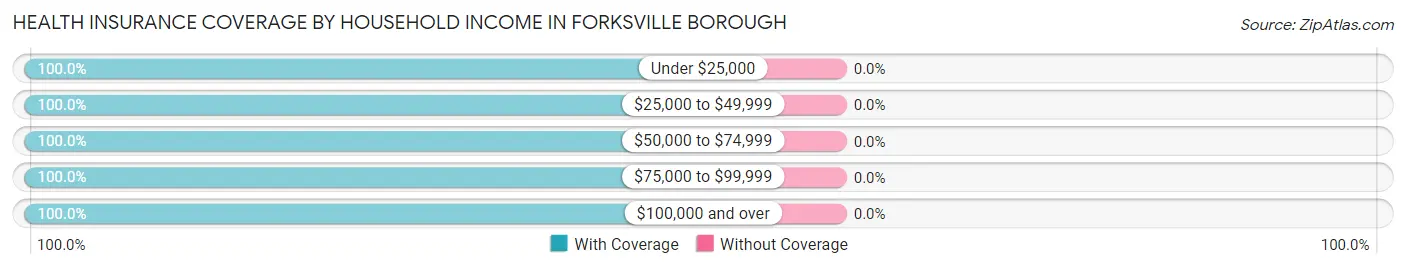
| Household Income | With Coverage | Without Coverage |
| Under $25,000 | 34 (100.0%) | 0 (0.0%) |
| $25,000 to $49,999 | 17 (100.0%) | 0 (0.0%) |
| $50,000 to $74,999 | 27 (100.0%) | 0 (0.0%) |
| $75,000 to $99,999 | 15 (100.0%) | 0 (0.0%) |
| $100,000 and over | 34 (100.0%) | 0 (0.0%) |
Public vs Private Health Insurance Coverage by Age in Forksville borough
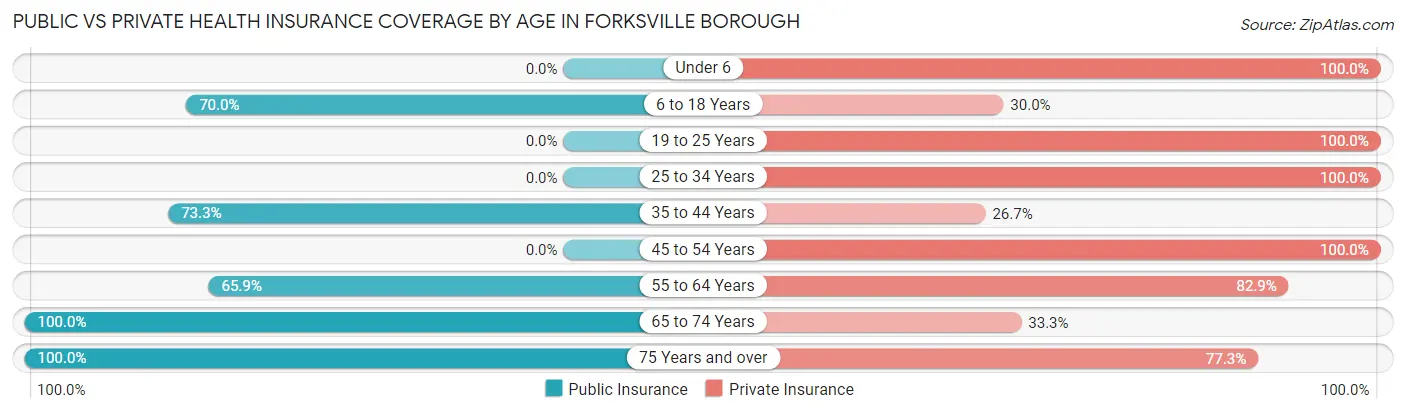
| Age Bracket | Public Insurance | Private Insurance |
| Under 6 | 0 (0.0%) | 3 (100.0%) |
| 6 to 18 Years | 14 (70.0%) | 6 (30.0%) |
| 19 to 25 Years | 0 (0.0%) | 4 (100.0%) |
| 25 to 34 Years | 0 (0.0%) | 11 (100.0%) |
| 35 to 44 Years | 11 (73.3%) | 4 (26.7%) |
| 45 to 54 Years | 0 (0.0%) | 5 (100.0%) |
| 55 to 64 Years | 27 (65.8%) | 34 (82.9%) |
| 65 to 74 Years | 6 (100.0%) | 2 (33.3%) |
| 75 Years and over | 22 (100.0%) | 17 (77.3%) |
| Total | 80 (63.0%) | 86 (67.7%) |
Disability Status by Sex by Age in Forksville borough
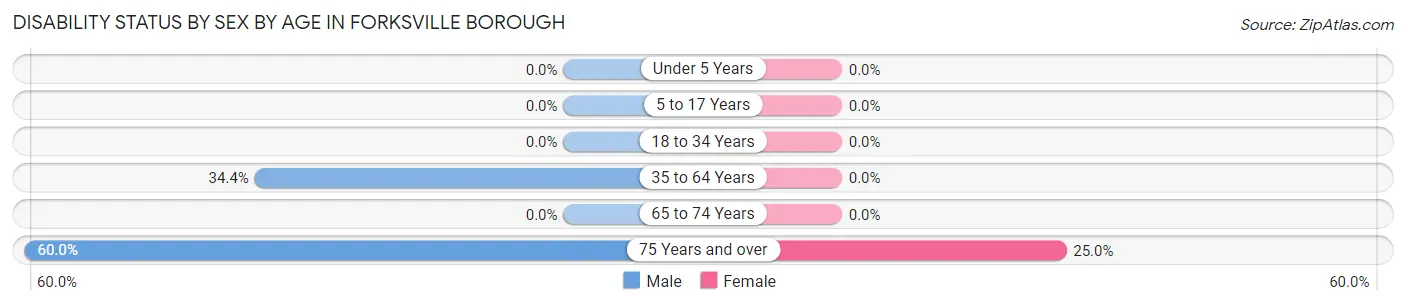
| Age Bracket | Male | Female |
| Under 5 Years | 0 (0.0%) | 0 (0.0%) |
| 5 to 17 Years | 0 (0.0%) | 0 (0.0%) |
| 18 to 34 Years | 0 (0.0%) | 0 (0.0%) |
| 35 to 64 Years | 11 (34.4%) | 0 (0.0%) |
| 65 to 74 Years | 0 (0.0%) | 0 (0.0%) |
| 75 Years and over | 6 (60.0%) | 3 (25.0%) |
Disability Class by Sex by Age in Forksville borough
Disability Class: Hearing Difficulty
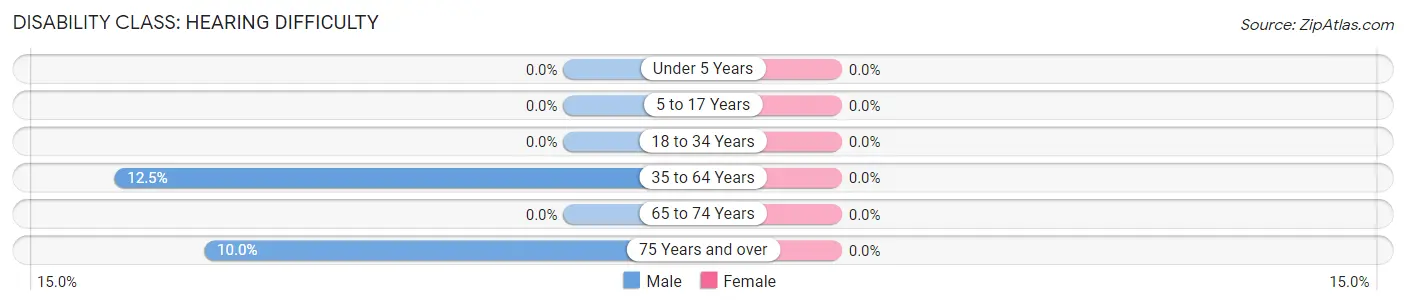
| Age Bracket | Male | Female |
| Under 5 Years | 0 (0.0%) | 0 (0.0%) |
| 5 to 17 Years | 0 (0.0%) | 0 (0.0%) |
| 18 to 34 Years | 0 (0.0%) | 0 (0.0%) |
| 35 to 64 Years | 4 (12.5%) | 0 (0.0%) |
| 65 to 74 Years | 0 (0.0%) | 0 (0.0%) |
| 75 Years and over | 1 (10.0%) | 0 (0.0%) |
Disability Class: Vision Difficulty
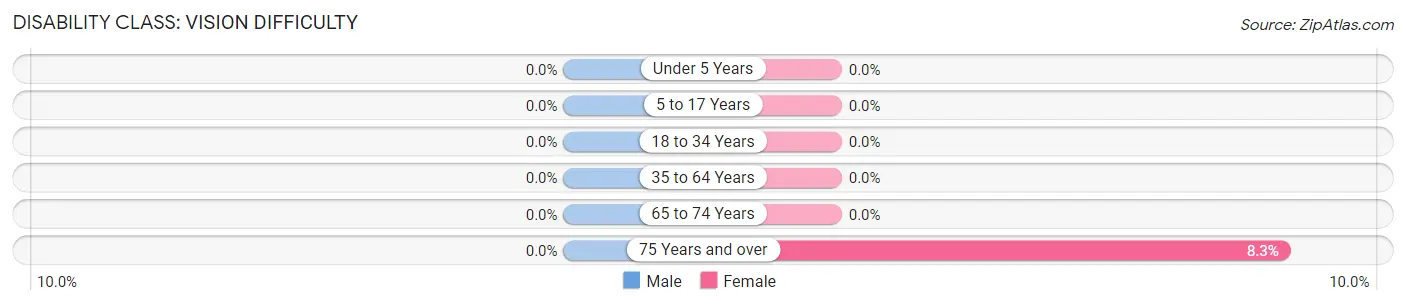
| Age Bracket | Male | Female |
| Under 5 Years | 0 (0.0%) | 0 (0.0%) |
| 5 to 17 Years | 0 (0.0%) | 0 (0.0%) |
| 18 to 34 Years | 0 (0.0%) | 0 (0.0%) |
| 35 to 64 Years | 0 (0.0%) | 0 (0.0%) |
| 65 to 74 Years | 0 (0.0%) | 0 (0.0%) |
| 75 Years and over | 0 (0.0%) | 1 (8.3%) |
Disability Class: Cognitive Difficulty

| Age Bracket | Male | Female |
| 5 to 17 Years | 0 (0.0%) | 0 (0.0%) |
| 18 to 34 Years | 0 (0.0%) | 0 (0.0%) |
| 35 to 64 Years | 0 (0.0%) | 0 (0.0%) |
| 65 to 74 Years | 0 (0.0%) | 0 (0.0%) |
| 75 Years and over | 0 (0.0%) | 0 (0.0%) |
Disability Class: Ambulatory Difficulty
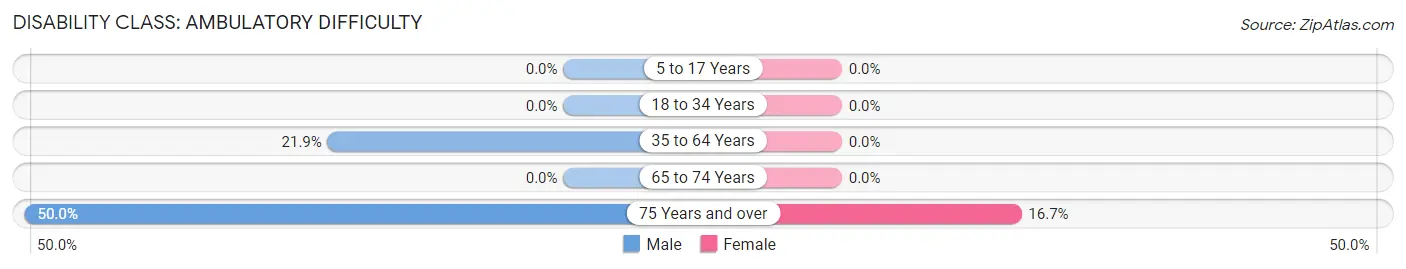
| Age Bracket | Male | Female |
| 5 to 17 Years | 0 (0.0%) | 0 (0.0%) |
| 18 to 34 Years | 0 (0.0%) | 0 (0.0%) |
| 35 to 64 Years | 7 (21.9%) | 0 (0.0%) |
| 65 to 74 Years | 0 (0.0%) | 0 (0.0%) |
| 75 Years and over | 5 (50.0%) | 2 (16.7%) |
Disability Class: Self-Care Difficulty
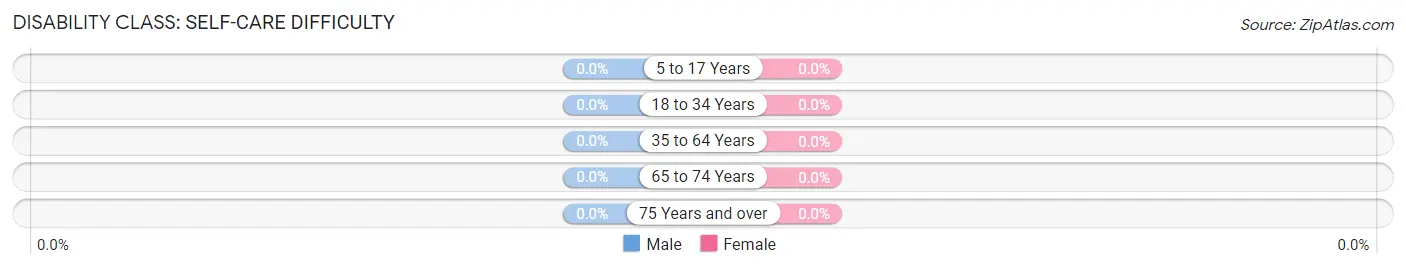
| Age Bracket | Male | Female |
| 5 to 17 Years | 0 (0.0%) | 0 (0.0%) |
| 18 to 34 Years | 0 (0.0%) | 0 (0.0%) |
| 35 to 64 Years | 0 (0.0%) | 0 (0.0%) |
| 65 to 74 Years | 0 (0.0%) | 0 (0.0%) |
| 75 Years and over | 0 (0.0%) | 0 (0.0%) |
Technology Access in Forksville borough
Computing Device Access in Forksville borough
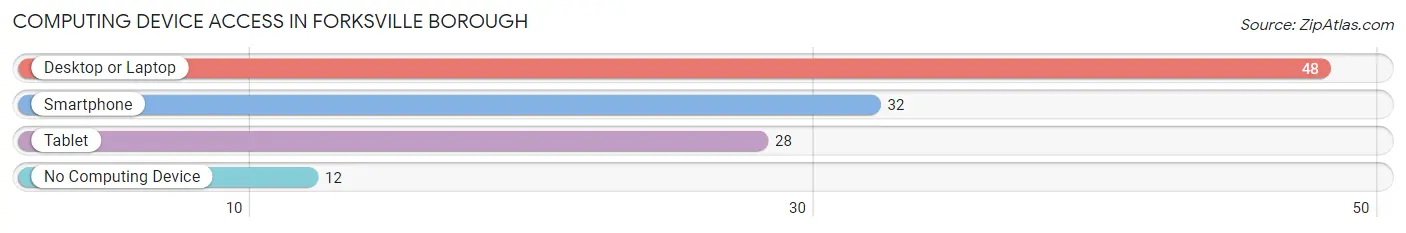
| Device Type | # Households | % Households |
| Desktop or Laptop | 48 | 72.7% |
| Smartphone | 32 | 48.5% |
| Tablet | 28 | 42.4% |
| No Computing Device | 12 | 18.2% |
| Total | 66 | 100.0% |
Internet Access in Forksville borough
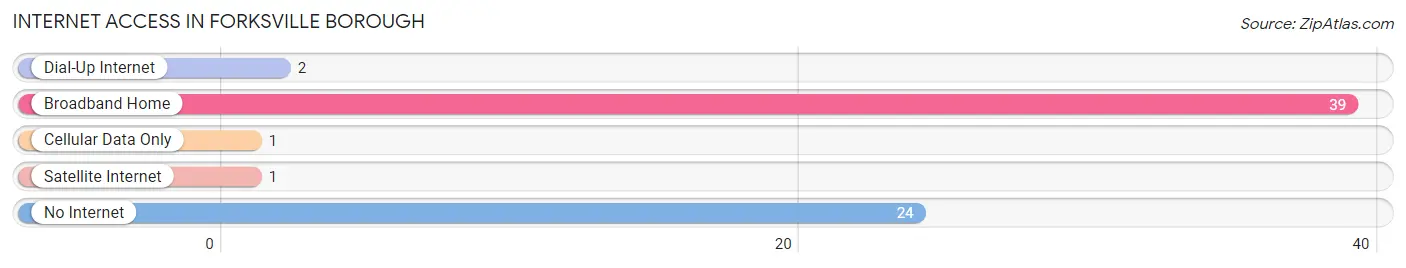
| Internet Type | # Households | % Households |
| Dial-Up Internet | 2 | 3.0% |
| Broadband Home | 39 | 59.1% |
| Cellular Data Only | 1 | 1.5% |
| Satellite Internet | 1 | 1.5% |
| No Internet | 24 | 36.4% |
| Total | 66 | 100.0% |
Forksville borough Summary
Forksville Borough is a small borough located in Sullivan County, Pennsylvania. It is situated in the Endless Mountains region of the state, and is part of the larger Sullivan County area. The borough is home to a population of just over 500 people, and is a rural community with a strong sense of community and history.
Geography
Forksville Borough is located in the Endless Mountains region of Pennsylvania, in the northern part of Sullivan County. The borough is situated in the valley of the Loyalsock Creek, and is surrounded by mountains and hills. The borough is located at an elevation of 1,400 feet, and is approximately 10 miles from the county seat of Laporte. The borough is located in a rural area, and is surrounded by forests and farmland.
The climate in Forksville Borough is typical of the region, with cold winters and warm summers. The average annual temperature is around 50 degrees Fahrenheit, and the average annual precipitation is around 40 inches.
Economy
The economy of Forksville Borough is largely based on agriculture and tourism. The borough is home to several small farms, which produce a variety of crops, including corn, soybeans, hay, and vegetables. The borough is also home to several small businesses, including a general store, a restaurant, and a gas station.
Tourism is an important part of the economy of Forksville Borough. The borough is home to several attractions, including the Forksville Covered Bridge, the Forksville General Store, and the Forksville Historic District. The borough is also home to several outdoor recreation areas, including the Loyalsock Creek Trail and the Loyalsock State Forest.
Demographics
As of the 2010 census, the population of Forksville Borough was 514. The racial makeup of the borough was 97.3% White, 0.6% African American, 0.2% Native American, 0.4% Asian, and 1.5% from two or more races. Hispanic or Latino of any race were 0.8% of the population.
The median household income in Forksville Borough was $37,500, and the median family income was $45,000. The per capita income was $19,000. About 11.3% of families and 14.2% of the population were below the poverty line, including 18.2% of those under age 18 and 8.3% of those age 65 or over.
History
Forksville Borough was founded in 1820, and was originally known as Forksville. The borough was named for the forks of the Loyalsock Creek, which runs through the borough. The borough was incorporated in 1845, and has remained a small, rural community ever since.
The borough was an important stop on the stagecoach route between Williamsport and Towanda, and was home to several inns and taverns. The borough was also home to several mills, including a sawmill, a gristmill, and a woolen mill.
The borough was home to several Civil War veterans, and was the site of a skirmish between Union and Confederate forces in 1863. The borough was also home to several prominent citizens, including the first mayor of Forksville, John B. Smith.
Today, Forksville Borough is a small, rural community with a strong sense of community and history. The borough is home to several attractions, including the Forksville Covered Bridge, the Forksville General Store, and the Forksville Historic District. The borough is also home to several outdoor recreation areas, including the Loyalsock Creek Trail and the Loyalsock State Forest.
Common Questions
What is the Total Population of Forksville borough?
Total Population of Forksville borough is 127.
What is the Total Male Population of Forksville borough?
Total Male Population of Forksville borough is 64.
What is the Total Female Population of Forksville borough?
Total Female Population of Forksville borough is 63.
What is the Ratio of Males per 100 Females in Forksville borough?
There are 101.59 Males per 100 Females in Forksville borough.
What is the Ratio of Females per 100 Males in Forksville borough?
There are 98.44 Females per 100 Males in Forksville borough.
What is the Median Population Age in Forksville borough?
Median Population Age in Forksville borough is 57.9 Years.
What is the Average Family Size in Forksville borough
Average Family Size in Forksville borough is 3.1 People.
What is the Average Household Size in Forksville borough
Average Household Size in Forksville borough is 1.9 People.
What is Per Capita Income in Forksville borough?
Per Capita income in Forksville borough is $31,587.
What is the Median Household income in Forksville borough?
Median Household Income in Forksville borough is $48,333.
What is Income or Wage Gap in Forksville borough?
Income or Wage Gap in Forksville borough is 37.4%.
Women in Forksville borough earn 62.6 cents for every dollar earned by a man.
What is Inequality or Gini Index in Forksville borough?
Inequality or Gini Index in Forksville borough is 0.49.
How Large is the Labor Force in Forksville borough?
There are 49 People in the Labor Forcein in Forksville borough.
What is the Percentage of People in the Labor Force in Forksville borough?
45.4% of People are in the Labor Force in Forksville borough.
What is the Unemployment Rate in Forksville borough?
Unemployment Rate in Forksville borough is 2.0%.