Cities with the Highest Percentage of Population Employed in Material Moving in Kansas
RELATED REPORTS & OPTIONS
Material Moving
Kansas
Compare Cities
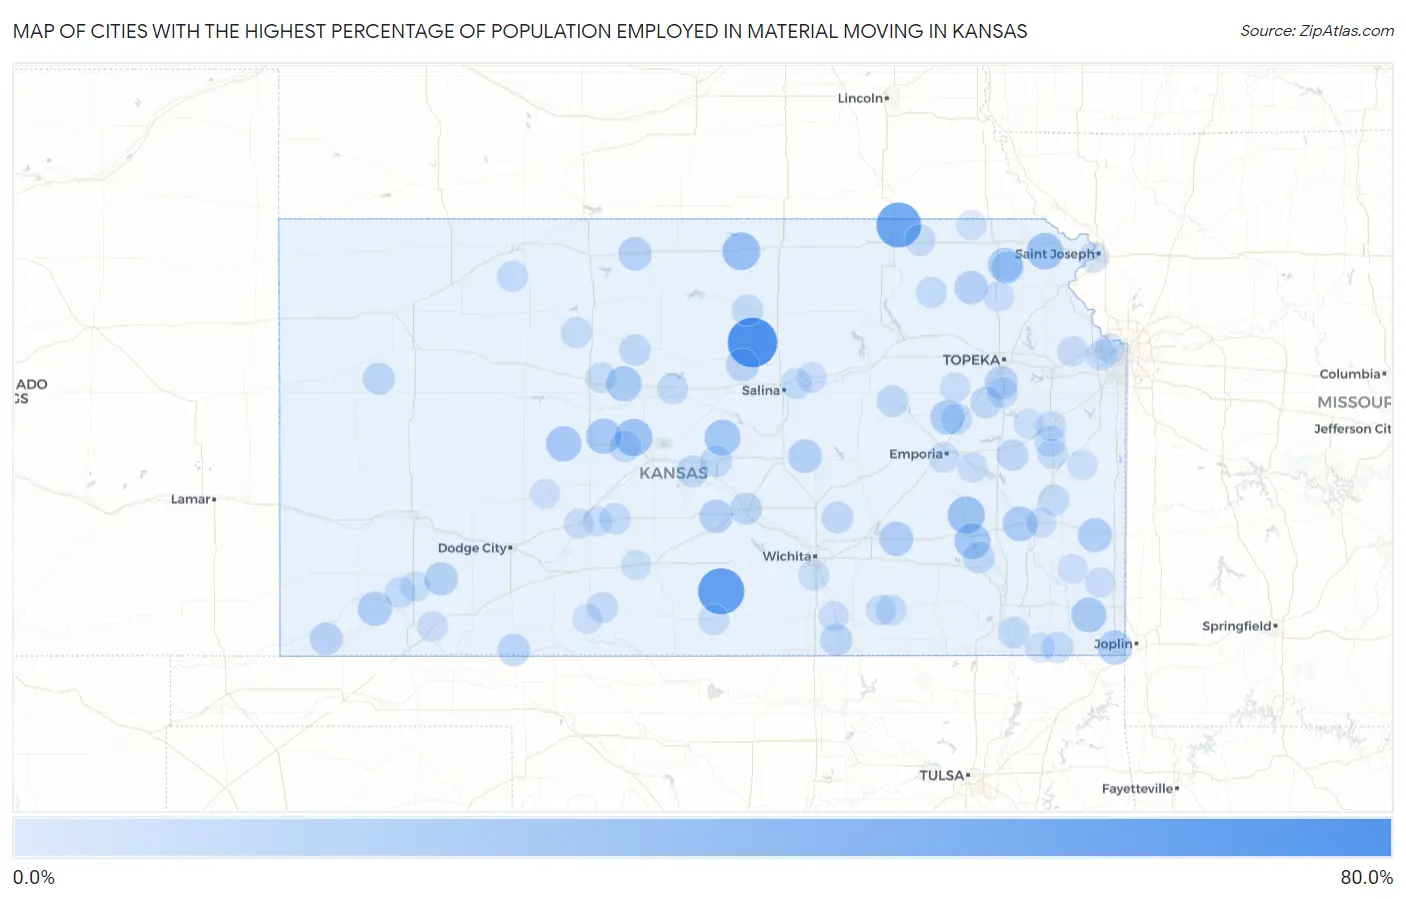
Map of Cities with the Highest Percentage of Population Employed in Material Moving in Kansas
0.0%
80.0%
Cities with the Highest Percentage of Population Employed in Material Moving in Kansas
| City | % Employed | vs State | vs National | |
| 1. | Ada | 77.8% | 4.2%(+73.5)#1 | 3.8%(+73.9)#41 |
| 2. | Spivey | 65.4% | 4.2%(+61.1)#2 | 3.8%(+61.6)#52 |
| 3. | Oketo | 60.4% | 4.2%(+56.2)#3 | 3.8%(+56.6)#66 |
| 4. | Zeandale | 59.3% | 4.2%(+55.0)#4 | 3.8%(+55.4)#69 |
| 5. | Garland | 50.0% | 4.2%(+45.8)#5 | 3.8%(+46.2)#109 |
| 6. | Newbury | 45.5% | 4.2%(+41.2)#6 | 3.8%(+41.6)#122 |
| 7. | Burdick | 42.9% | 4.2%(+38.6)#7 | 3.8%(+39.0)#136 |
| 8. | Formoso | 34.8% | 4.2%(+30.5)#8 | 3.8%(+31.0)#221 |
| 9. | Olmitz | 33.3% | 4.2%(+29.1)#9 | 3.8%(+29.5)#243 |
| 10. | Virgil | 33.3% | 4.2%(+29.1)#10 | 3.8%(+29.5)#247 |
| 11. | Murdock | 31.2% | 4.2%(+27.0)#11 | 3.8%(+27.4)#284 |
| 12. | Leona | 30.8% | 4.2%(+26.5)#12 | 3.8%(+26.9)#292 |
| 13. | Geneseo | 28.4% | 4.2%(+24.2)#13 | 3.8%(+24.6)#345 |
| 14. | Toronto | 28.4% | 4.2%(+24.2)#14 | 3.8%(+24.6)#346 |
| 15. | St. Benedict | 28.1% | 4.2%(+23.9)#15 | 3.8%(+24.3)#352 |
| 16. | Bison | 26.7% | 4.2%(+22.4)#16 | 3.8%(+22.8)#386 |
| 17. | Alexander | 26.7% | 4.2%(+22.4)#17 | 3.8%(+22.8)#388 |
| 18. | Gorham | 25.9% | 4.2%(+21.7)#18 | 3.8%(+22.1)#406 |
| 19. | West Mineral | 25.5% | 4.2%(+21.3)#19 | 3.8%(+21.7)#424 |
| 20. | Ringo | 25.0% | 4.2%(+20.8)#20 | 3.8%(+21.2)#445 |
| 21. | Piqua | 24.2% | 4.2%(+20.0)#21 | 3.8%(+20.4)#479 |
| 22. | Kickapoo Site 7 | 23.5% | 4.2%(+19.3)#22 | 3.8%(+19.7)#508 |
| 23. | Allen | 23.0% | 4.2%(+18.8)#23 | 3.8%(+19.2)#536 |
| 24. | Moscow | 22.9% | 4.2%(+18.7)#24 | 3.8%(+19.1)#541 |
| 25. | Lowell | 22.8% | 4.2%(+18.5)#25 | 3.8%(+18.9)#554 |
| 26. | Rosalia | 22.2% | 4.2%(+18.0)#26 | 3.8%(+18.4)#579 |
| 27. | Redfield | 22.2% | 4.2%(+18.0)#27 | 3.8%(+18.4)#580 |
| 28. | Canton | 20.9% | 4.2%(+16.7)#28 | 3.8%(+17.1)#659 |
| 29. | Williamstown | 20.6% | 4.2%(+16.3)#29 | 3.8%(+16.8)#686 |
| 30. | Abbyville | 20.0% | 4.2%(+15.8)#30 | 3.8%(+16.2)#727 |
| 31. | Soldier | 20.0% | 4.2%(+15.8)#31 | 3.8%(+16.2)#728 |
| 32. | Athol | 20.0% | 4.2%(+15.8)#32 | 3.8%(+16.2)#732 |
| 33. | Copeland | 19.7% | 4.2%(+15.4)#33 | 3.8%(+15.8)#750 |
| 34. | Wakarusa | 18.8% | 4.2%(+14.5)#34 | 3.8%(+14.9)#820 |
| 35. | Rolla | 18.1% | 4.2%(+13.9)#35 | 3.8%(+14.3)#901 |
| 36. | Beverly | 17.9% | 4.2%(+13.6)#36 | 3.8%(+14.0)#923 |
| 37. | South Mound | 17.9% | 4.2%(+13.6)#37 | 3.8%(+14.0)#925 |
| 38. | Kickapoo Tribal Center | 16.7% | 4.2%(+12.4)#38 | 3.8%(+12.8)#1,085 |
| 39. | Englewood | 16.7% | 4.2%(+12.4)#39 | 3.8%(+12.8)#1,087 |
| 40. | Niles | 16.1% | 4.2%(+11.9)#40 | 3.8%(+12.3)#1,174 |
| 41. | Geuda Springs | 15.5% | 4.2%(+11.3)#41 | 3.8%(+11.7)#1,274 |
| 42. | Russell Springs | 15.4% | 4.2%(+11.1)#42 | 3.8%(+11.6)#1,312 |
| 43. | South Hutchinson | 14.9% | 4.2%(+10.7)#43 | 3.8%(+11.1)#1,398 |
| 44. | Raymond | 14.6% | 4.2%(+10.4)#44 | 3.8%(+10.8)#1,459 |
| 45. | Whitewater | 14.6% | 4.2%(+10.3)#45 | 3.8%(+10.8)#1,475 |
| 46. | Albert | 14.3% | 4.2%(+10.0)#46 | 3.8%(+10.5)#1,538 |
| 47. | Parkerville | 14.3% | 4.2%(+10.0)#47 | 3.8%(+10.5)#1,543 |
| 48. | Coyville | 14.3% | 4.2%(+10.0)#48 | 3.8%(+10.5)#1,551 |
| 49. | Lyons | 14.3% | 4.2%(+10.0)#49 | 3.8%(+10.4)#1,557 |
| 50. | Burlingame | 13.9% | 4.2%(+9.70)#50 | 3.8%(+10.1)#1,628 |
| 51. | Waverly | 13.9% | 4.2%(+9.67)#51 | 3.8%(+10.1)#1,637 |
| 52. | Paradise | 13.8% | 4.2%(+9.55)#52 | 3.8%(+9.96)#1,672 |
| 53. | Liberty | 13.6% | 4.2%(+9.40)#53 | 3.8%(+9.81)#1,720 |
| 54. | Belpre | 13.6% | 4.2%(+9.40)#54 | 3.8%(+9.81)#1,726 |
| 55. | Simpson | 13.1% | 4.2%(+8.88)#55 | 3.8%(+9.28)#1,887 |
| 56. | Admire | 13.0% | 4.2%(+8.80)#56 | 3.8%(+9.21)#1,907 |
| 57. | Bartlett | 12.9% | 4.2%(+8.66)#57 | 3.8%(+9.07)#1,964 |
| 58. | Zurich | 12.5% | 4.2%(+8.26)#58 | 3.8%(+8.67)#2,114 |
| 59. | Lone Elm | 12.5% | 4.2%(+8.26)#59 | 3.8%(+8.67)#2,117 |
| 60. | Wheaton | 12.2% | 4.2%(+8.01)#60 | 3.8%(+8.41)#2,205 |
| 61. | Satanta | 12.2% | 4.2%(+7.96)#61 | 3.8%(+8.37)#2,219 |
| 62. | New Cambria | 12.1% | 4.2%(+7.85)#62 | 3.8%(+8.26)#2,262 |
| 63. | Lenora | 12.0% | 4.2%(+7.76)#63 | 3.8%(+8.17)#2,289 |
| 64. | Beattie | 11.9% | 4.2%(+7.70)#64 | 3.8%(+8.11)#2,312 |
| 65. | Dorrance | 11.8% | 4.2%(+7.53)#65 | 3.8%(+7.93)#2,390 |
| 66. | Cambridge | 11.8% | 4.2%(+7.53)#66 | 3.8%(+7.93)#2,396 |
| 67. | Wilmore | 11.8% | 4.2%(+7.53)#67 | 3.8%(+7.93)#2,403 |
| 68. | Princeton | 11.6% | 4.2%(+7.37)#68 | 3.8%(+7.78)#2,455 |
| 69. | Edwardsville | 11.5% | 4.2%(+7.25)#69 | 3.8%(+7.66)#2,503 |
| 70. | Carbondale | 11.5% | 4.2%(+7.25)#70 | 3.8%(+7.65)#2,505 |
| 71. | Catharine | 11.2% | 4.2%(+7.00)#71 | 3.8%(+7.41)#2,612 |
| 72. | Richmond | 11.0% | 4.2%(+6.79)#72 | 3.8%(+7.20)#2,716 |
| 73. | Attica | 11.0% | 4.2%(+6.74)#73 | 3.8%(+7.15)#2,743 |
| 74. | Haysville | 10.9% | 4.2%(+6.64)#74 | 3.8%(+7.05)#2,790 |
| 75. | Tonganoxie | 10.7% | 4.2%(+6.45)#75 | 3.8%(+6.86)#2,876 |
| 76. | Elwood | 10.3% | 4.2%(+6.06)#76 | 3.8%(+6.47)#3,104 |
| 77. | Solomon | 10.1% | 4.2%(+5.87)#77 | 3.8%(+6.28)#3,214 |
| 78. | Emporia | 10.1% | 4.2%(+5.84)#78 | 3.8%(+6.25)#3,241 |
| 79. | Holton | 9.9% | 4.2%(+5.69)#79 | 3.8%(+6.10)#3,342 |
| 80. | Ottawa | 9.7% | 4.2%(+5.50)#80 | 3.8%(+5.91)#3,476 |
| 81. | Kinsley | 9.6% | 4.2%(+5.40)#81 | 3.8%(+5.80)#3,552 |
| 82. | Sublette | 9.6% | 4.2%(+5.39)#82 | 3.8%(+5.80)#3,559 |
| 83. | Kismet | 9.5% | 4.2%(+5.30)#83 | 3.8%(+5.71)#3,613 |
| 84. | Burden | 9.5% | 4.2%(+5.28)#84 | 3.8%(+5.69)#3,626 |
| 85. | Gas | 9.5% | 4.2%(+5.27)#85 | 3.8%(+5.68)#3,648 |
| 86. | Hartford | 9.5% | 4.2%(+5.24)#86 | 3.8%(+5.65)#3,672 |
| 87. | Eskridge | 9.5% | 4.2%(+5.23)#87 | 3.8%(+5.64)#3,687 |
| 88. | Oxford | 9.4% | 4.2%(+5.21)#88 | 3.8%(+5.62)#3,708 |
| 89. | Pomona | 9.4% | 4.2%(+5.20)#89 | 3.8%(+5.61)#3,717 |
| 90. | Cullison | 9.4% | 4.2%(+5.14)#90 | 3.8%(+5.54)#3,774 |
| 91. | Girard | 9.3% | 4.2%(+5.02)#91 | 3.8%(+5.43)#3,850 |
| 92. | Kansas City | 9.1% | 4.2%(+4.88)#92 | 3.8%(+5.29)#3,972 |
| 93. | Coldwater | 9.1% | 4.2%(+4.85)#93 | 3.8%(+5.26)#3,997 |
| 94. | Bern | 8.9% | 4.2%(+4.65)#94 | 3.8%(+5.06)#4,154 |
| 95. | Hanston | 8.9% | 4.2%(+4.63)#95 | 3.8%(+5.04)#4,171 |
| 96. | Walnut | 8.8% | 4.2%(+4.61)#96 | 3.8%(+5.02)#4,193 |
| 97. | Monument | 8.8% | 4.2%(+4.58)#97 | 3.8%(+4.99)#4,218 |
| 98. | Edna | 8.8% | 4.2%(+4.55)#98 | 3.8%(+4.96)#4,238 |
| 99. | Parker | 8.6% | 4.2%(+4.40)#99 | 3.8%(+4.81)#4,370 |
| 100. | Lewis | 8.5% | 4.2%(+4.28)#100 | 3.8%(+4.69)#4,482 |
Common Questions
What are the Top 10 Cities with the Highest Percentage of Population Employed in Material Moving in Kansas?
Top 10 Cities with the Highest Percentage of Population Employed in Material Moving in Kansas are:
What city has the Highest Percentage of Population Employed in Material Moving in Kansas?
Ada has the Highest Percentage of Population Employed in Material Moving in Kansas with 77.8%.
What is the Percentage of Population Employed in Material Moving in the State of Kansas?
Percentage of Population Employed in Material Moving in Kansas is 4.2%.
What is the Percentage of Population Employed in Material Moving in the United States?
Percentage of Population Employed in Material Moving in the United States is 3.8%.