Elgin borough, PA
Elgin borough Overview
232
TOTAL POPULATION
136
MALE POPULATION
96
FEMALE POPULATION
141.67
MALES / 100 FEMALES
70.59
FEMALES / 100 MALES
54.4
MEDIAN AGE
3.6
AVG FAMILY SIZE
3.0
AVG HOUSEHOLD SIZE
$22,337
PER CAPITA INCOME
$57,321
AVG FAMILY INCOME
$55,982
AVG HOUSEHOLD INCOME
0.39
INEQUALITY / GINI INDEX
105
LABOR FORCE [ PEOPLE ]
52.5%
PERCENT IN LABOR FORCE
2.9%
UNEMPLOYMENT RATE
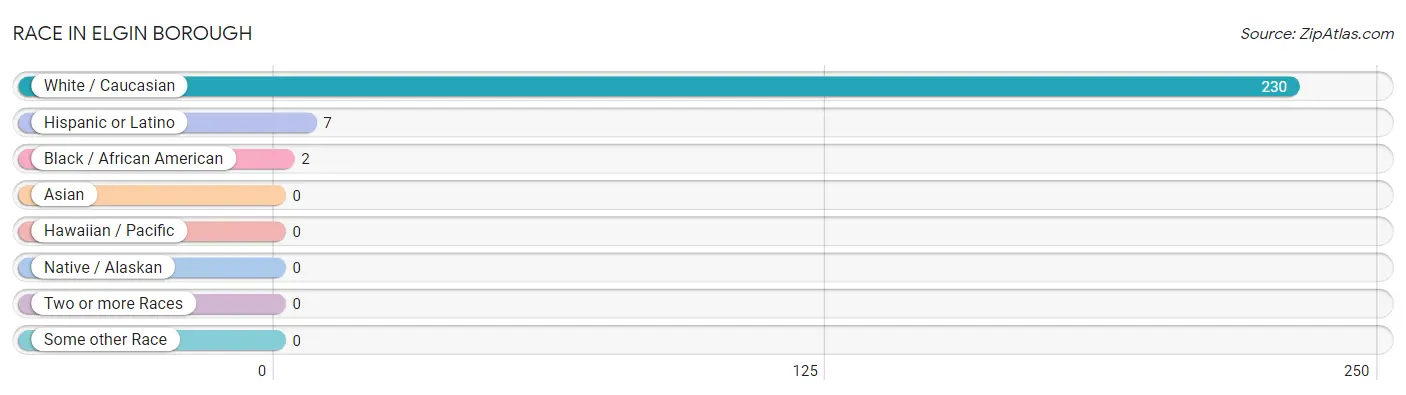
Race in Elgin borough
The most populous races in Elgin borough are White / Caucasian (230 | 99.1%), Hispanic or Latino (7 | 3.0%), and Black / African American (2 | 0.9%).
| Race | # Population | % Population |
| Asian | 0 | 0.0% |
| Black / African American | 2 | 0.9% |
| Hawaiian / Pacific | 0 | 0.0% |
| Hispanic or Latino | 7 | 3.0% |
| Native / Alaskan | 0 | 0.0% |
| White / Caucasian | 230 | 99.1% |
| Two or more Races | 0 | 0.0% |
| Some other Race | 0 | 0.0% |
| Total | 232 | 100.0% |
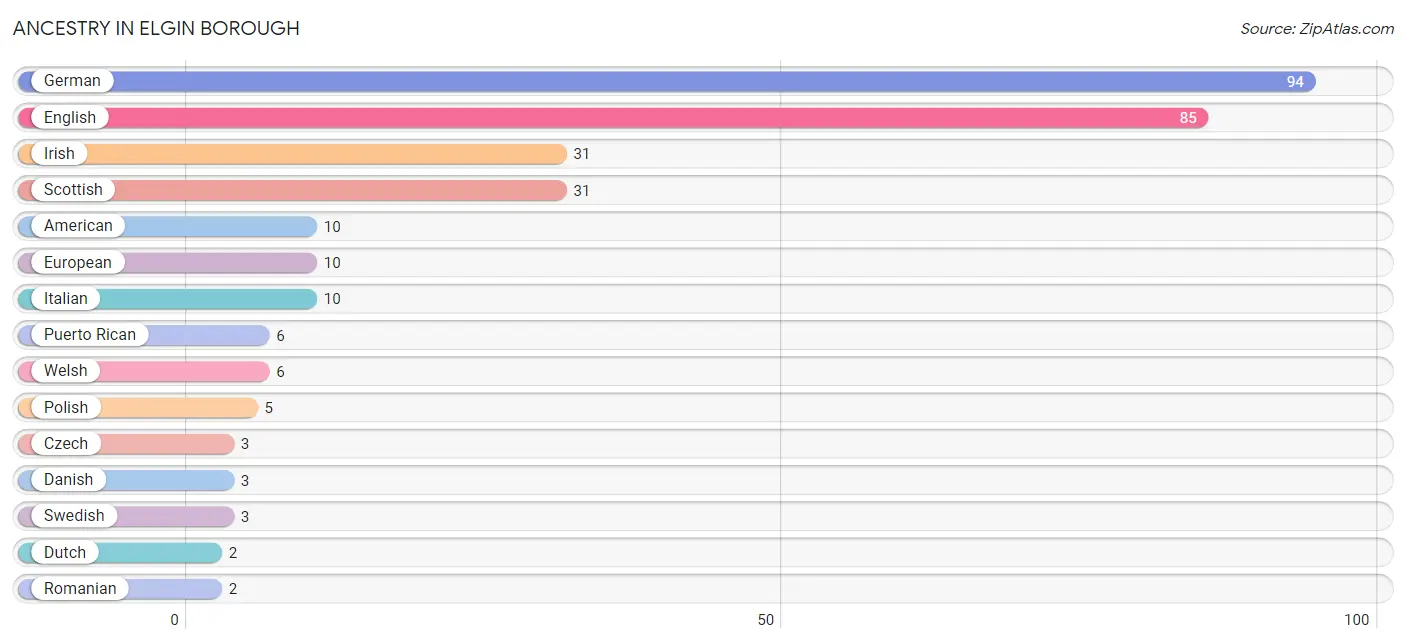
Ancestry in Elgin borough
The most populous ancestries reported in Elgin borough are German (94 | 40.5%), English (85 | 36.6%), Irish (31 | 13.4%), Scottish (31 | 13.4%), and American (10 | 4.3%), together accounting for 108.2% of all Elgin borough residents.
| Ancestry | # Population | % Population |
| American | 10 | 4.3% |
| Czech | 3 | 1.3% |
| Danish | 3 | 1.3% |
| Dutch | 2 | 0.9% |
| English | 85 | 36.6% |
| European | 10 | 4.3% |
| German | 94 | 40.5% |
| Irish | 31 | 13.4% |
| Italian | 10 | 4.3% |
| Mexican | 1 | 0.4% |
| Polish | 5 | 2.2% |
| Puerto Rican | 6 | 2.6% |
| Romanian | 2 | 0.9% |
| Scandinavian | 2 | 0.9% |
| Scotch-Irish | 2 | 0.9% |
| Scottish | 31 | 13.4% |
| Swedish | 3 | 1.3% |
| Welsh | 6 | 2.6% | View All 18 Rows |
Immigrants in Elgin borough

| Immigration Origin | # Population | % Population | View All 0 Rows |
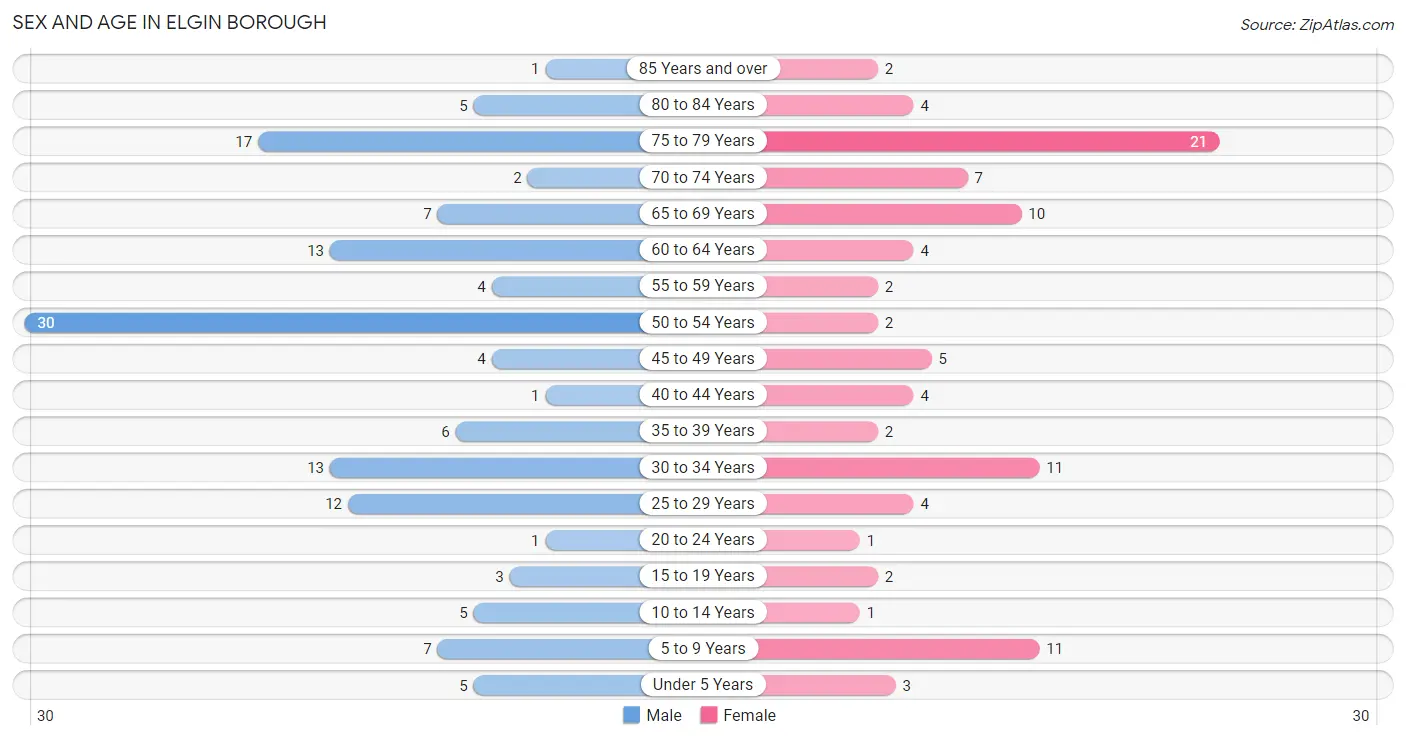
Sex and Age in Elgin borough
Sex and Age in Elgin borough
The most populous age groups in Elgin borough are 50 to 54 Years (30 | 22.1%) for men and 75 to 79 Years (21 | 21.9%) for women.
| Age Bracket | Male | Female |
| Under 5 Years | 5 (3.7%) | 3 (3.1%) |
| 5 to 9 Years | 7 (5.1%) | 11 (11.5%) |
| 10 to 14 Years | 5 (3.7%) | 1 (1.0%) |
| 15 to 19 Years | 3 (2.2%) | 2 (2.1%) |
| 20 to 24 Years | 1 (0.7%) | 1 (1.0%) |
| 25 to 29 Years | 12 (8.8%) | 4 (4.2%) |
| 30 to 34 Years | 13 (9.6%) | 11 (11.5%) |
| 35 to 39 Years | 6 (4.4%) | 2 (2.1%) |
| 40 to 44 Years | 1 (0.7%) | 4 (4.2%) |
| 45 to 49 Years | 4 (2.9%) | 5 (5.2%) |
| 50 to 54 Years | 30 (22.1%) | 2 (2.1%) |
| 55 to 59 Years | 4 (2.9%) | 2 (2.1%) |
| 60 to 64 Years | 13 (9.6%) | 4 (4.2%) |
| 65 to 69 Years | 7 (5.1%) | 10 (10.4%) |
| 70 to 74 Years | 2 (1.5%) | 7 (7.3%) |
| 75 to 79 Years | 17 (12.5%) | 21 (21.9%) |
| 80 to 84 Years | 5 (3.7%) | 4 (4.2%) |
| 85 Years and over | 1 (0.7%) | 2 (2.1%) |
| Total | 136 (100.0%) | 96 (100.0%) |
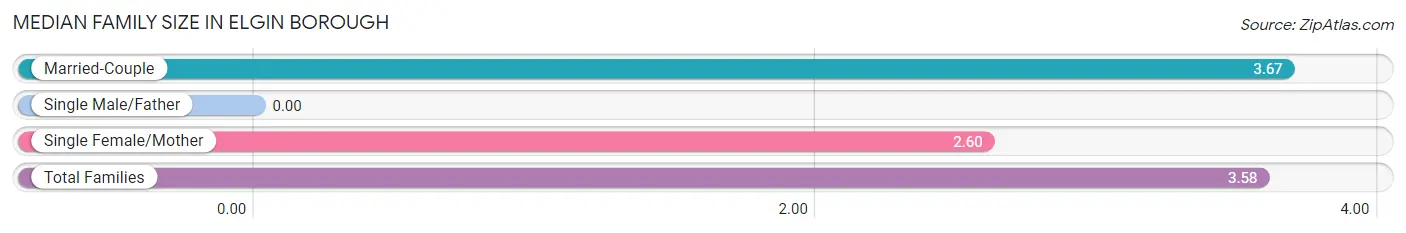
Families and Households in Elgin borough
Median Family Size in Elgin borough
| Family Type | # Families | Family Size |
| Married-Couple | 55 (91.7%) | 3.67 |
| Single Male/Father | 0 (0.0%) | - |
| Single Female/Mother | 5 (8.3%) | 2.60 |
| Total Families | 60 (100.0%) | 3.58 |
Median Household Size in Elgin borough
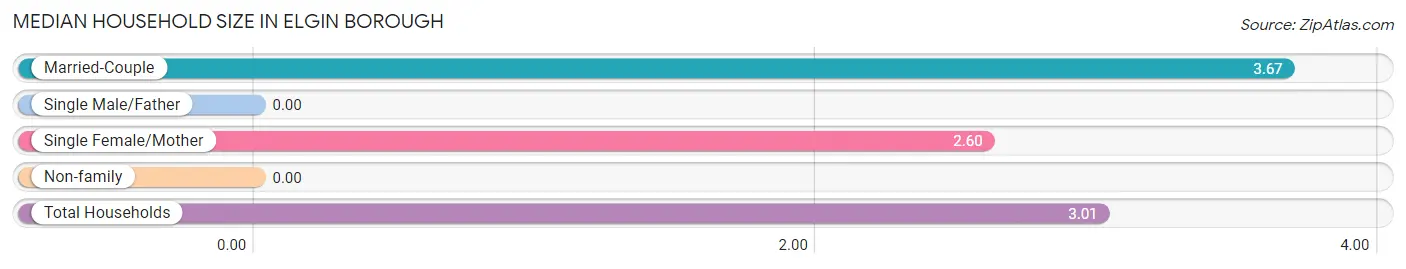
| Household Type | # Households | Household Size |
| Married-Couple | 55 (71.4%) | 3.67 |
| Single Male/Father | 0 (0.0%) | - |
| Single Female/Mother | 5 (6.5%) | 2.60 |
| Non-family | 17 (22.1%) | - |
| Total Households | 77 (100.0%) | 3.01 |
Household Size by Marriage Status in Elgin borough
Out of a total of 77 households in Elgin borough, 60 (77.9%) are family households, while 17 (22.1%) are nonfamily households. The most numerous type of family households are 2-person households, comprising 22, and the most common type of nonfamily households are 1-person households, comprising 17.
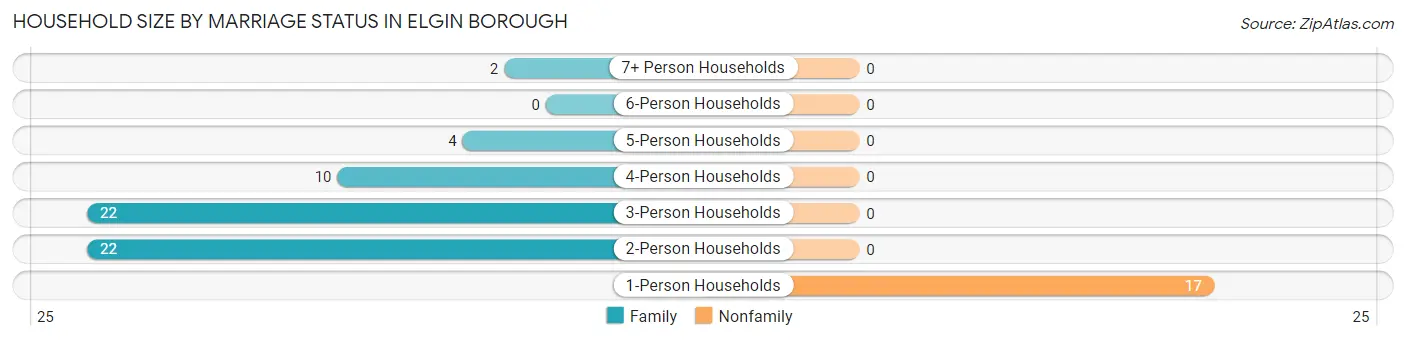
| Household Size | Family Households | Nonfamily Households |
| 1-Person Households | - | 17 (22.1%) |
| 2-Person Households | 22 (28.6%) | 0 (0.0%) |
| 3-Person Households | 22 (28.6%) | 0 (0.0%) |
| 4-Person Households | 10 (13.0%) | 0 (0.0%) |
| 5-Person Households | 4 (5.2%) | 0 (0.0%) |
| 6-Person Households | 0 (0.0%) | 0 (0.0%) |
| 7+ Person Households | 2 (2.6%) | 0 (0.0%) |
| Total | 60 (77.9%) | 17 (22.1%) |
Female Fertility in Elgin borough
Fertility by Age in Elgin borough
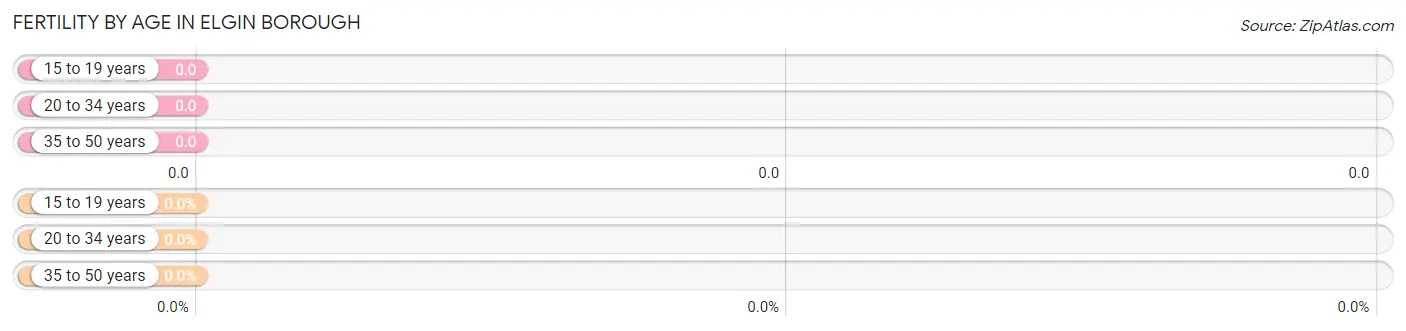
| Age Bracket | Women with Births | Births / 1,000 Women |
| 15 to 19 years | 0 (0.0%) | 0.0 |
| 20 to 34 years | 0 (0.0%) | 0.0 |
| 35 to 50 years | 0 (0.0%) | 0.0 |
| Total | 0 (0.0%) | 0.0 |
Fertility by Age by Marriage Status in Elgin borough
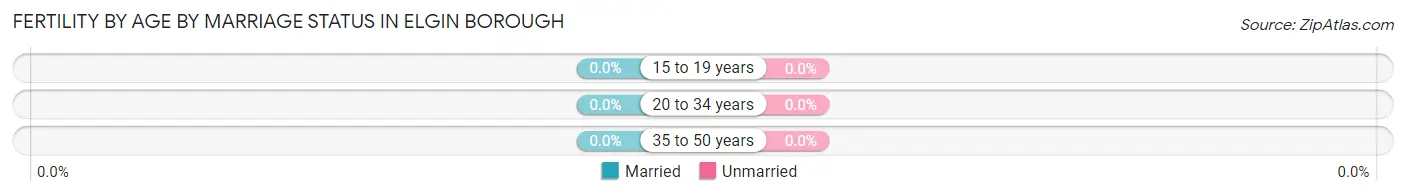
| Age Bracket | Married | Unmarried |
| 15 to 19 years | 0 (0.0%) | 0 (0.0%) |
| 20 to 34 years | 0 (0.0%) | 0 (0.0%) |
| 35 to 50 years | 0 (0.0%) | 0 (0.0%) |
| Total | 0 (0.0%) | 0 (0.0%) |
Fertility by Education in Elgin borough
| Educational Attainment | Women with Births | Births / 1,000 Women |
| Less than High School | 0 (0.0%) | 0.0 |
| High School Diploma | 0 (0.0%) | 0.0 |
| College or Associate's Degree | 0 (0.0%) | 0.0 |
| Bachelor's Degree | 0 (0.0%) | 0.0 |
| Graduate Degree | 0 (0.0%) | 0.0 |
| Total | 0 (0.0%) | 0.0 |
Fertility by Education by Marriage Status in Elgin borough
| Educational Attainment | Married | Unmarried |
| Less than High School | 0 (0.0%) | 0 (0.0%) |
| High School Diploma | 0 (0.0%) | 0 (0.0%) |
| College or Associate's Degree | 0 (0.0%) | 0 (0.0%) |
| Bachelor's Degree | 0 (0.0%) | 0 (0.0%) |
| Graduate Degree | 0 (0.0%) | 0 (0.0%) |
| Total | 0 (0.0%) | 0 (0.0%) |
Income in Elgin borough
Income Overview in Elgin borough
Per Capita Income in Elgin borough is $22,337, while median incomes of families and households are $57,321 and $55,982 respectively.
| Characteristic | Number | Measure |
| Per Capita Income | 232 | $22,337 |
| Median Family Income | 60 | $57,321 |
| Mean Family Income | 60 | $75,298 |
| Median Household Income | 77 | $55,982 |
| Mean Household Income | 77 | $63,895 |
| Income Deficit | 60 | $0 |
| Wage / Income Gap (%) | 232 | 0.00% |
| Wage / Income Gap ($) | 232 | 100.00¢ per $1 |
| Gini / Inequality Index | 232 | 0.39 |
Earnings by Sex in Elgin borough
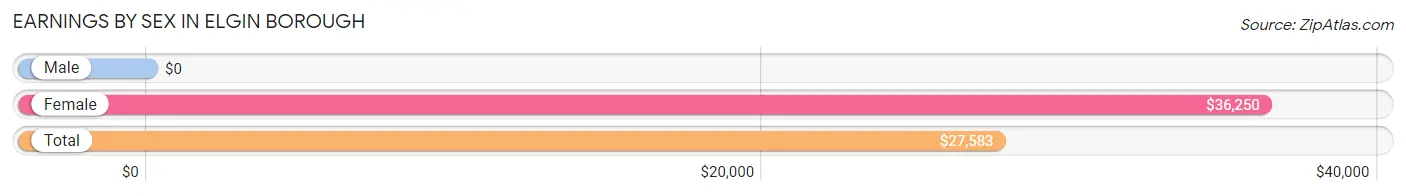
| Sex | Number | Average Earnings |
| Male | 75 (68.8%) | $0 |
| Female | 34 (31.2%) | $36,250 |
| Total | 109 (100.0%) | $27,583 |
Earnings by Sex by Income Bracket in Elgin borough
The most common earnings brackets in Elgin borough are $2,500 to $4,999 for men (28 | 37.3%) and $40,000 to $44,999 for women (6 | 17.6%).

| Income | Male | Female |
| $2,499 or less | 1 (1.3%) | 1 (2.9%) |
| $2,500 to $4,999 | 28 (37.3%) | 2 (5.9%) |
| $5,000 to $7,499 | 0 (0.0%) | 2 (5.9%) |
| $7,500 to $9,999 | 3 (4.0%) | 1 (2.9%) |
| $10,000 to $12,499 | 0 (0.0%) | 0 (0.0%) |
| $12,500 to $14,999 | 0 (0.0%) | 0 (0.0%) |
| $15,000 to $17,499 | 7 (9.3%) | 3 (8.8%) |
| $17,500 to $19,999 | 2 (2.7%) | 2 (5.9%) |
| $20,000 to $22,499 | 1 (1.3%) | 0 (0.0%) |
| $22,500 to $24,999 | 0 (0.0%) | 0 (0.0%) |
| $25,000 to $29,999 | 12 (16.0%) | 4 (11.8%) |
| $30,000 to $34,999 | 0 (0.0%) | 2 (5.9%) |
| $35,000 to $39,999 | 0 (0.0%) | 1 (2.9%) |
| $40,000 to $44,999 | 1 (1.3%) | 6 (17.6%) |
| $45,000 to $49,999 | 0 (0.0%) | 1 (2.9%) |
| $50,000 to $54,999 | 2 (2.7%) | 0 (0.0%) |
| $55,000 to $64,999 | 11 (14.7%) | 4 (11.8%) |
| $65,000 to $74,999 | 1 (1.3%) | 4 (11.8%) |
| $75,000 to $99,999 | 6 (8.0%) | 1 (2.9%) |
| $100,000+ | 0 (0.0%) | 0 (0.0%) |
| Total | 75 (100.0%) | 34 (100.0%) |
Earnings by Sex by Educational Attainment in Elgin borough
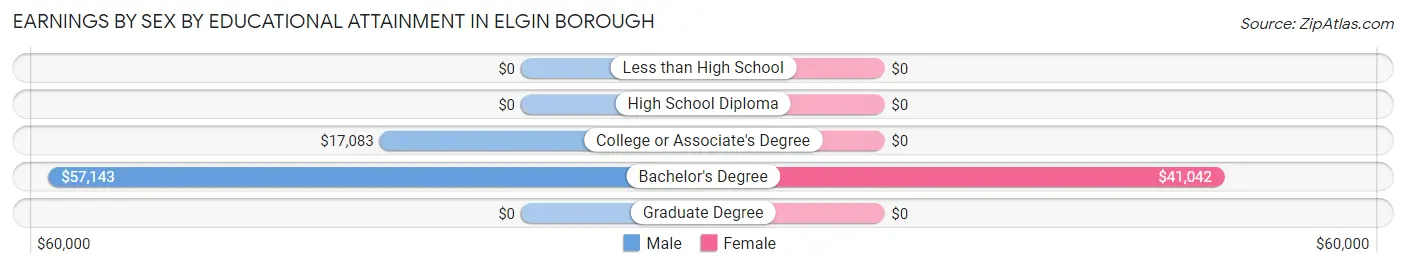
| Educational Attainment | Male Income | Female Income |
| Less than High School | - | - |
| High School Diploma | - | - |
| College or Associate's Degree | $17,083 | $0 |
| Bachelor's Degree | $57,143 | $41,042 |
| Graduate Degree | - | - |
| Total | - | - |
Family Income in Elgin borough
Family Income Brackets in Elgin borough
According to the Elgin borough family income data, there are 24 families falling into the $50,000 to $74,999 income range, which is the most common income bracket and makes up 40.0% of all families.
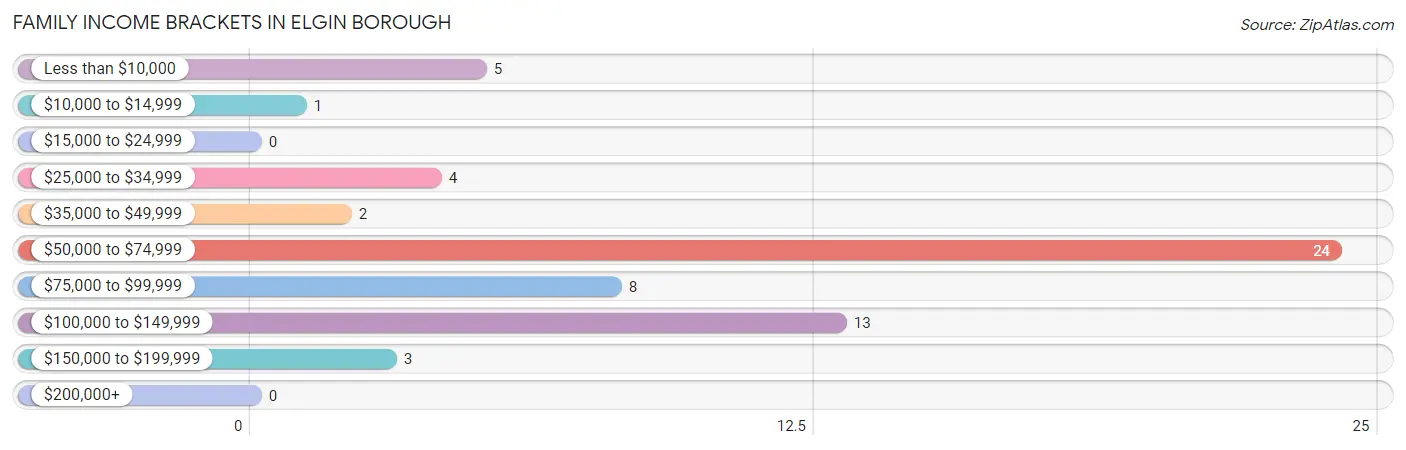
| Income Bracket | # Families | % Families |
| Less than $10,000 | 5 | 8.3% |
| $10,000 to $14,999 | 1 | 1.7% |
| $15,000 to $24,999 | 0 | 0.0% |
| $25,000 to $34,999 | 4 | 6.7% |
| $35,000 to $49,999 | 2 | 3.3% |
| $50,000 to $74,999 | 24 | 40.0% |
| $75,000 to $99,999 | 8 | 13.3% |
| $100,000 to $149,999 | 13 | 21.7% |
| $150,000 to $199,999 | 3 | 5.0% |
| $200,000+ | 0 | 0.0% |
Family Income by Famaliy Size in Elgin borough
4-person families (10 | 16.7%) account for the highest median family income in Elgin borough with $140,417 per family, while 4-person families (10 | 16.7%) have the highest median income of $35,104 per family member.
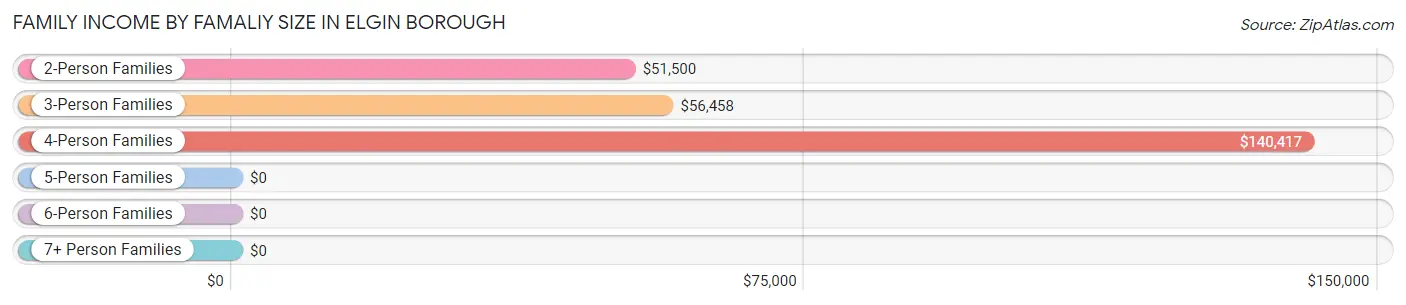
| Income Bracket | # Families | Median Income |
| 2-Person Families | 22 (36.7%) | $51,500 |
| 3-Person Families | 22 (36.7%) | $56,458 |
| 4-Person Families | 10 (16.7%) | $140,417 |
| 5-Person Families | 4 (6.7%) | $0 |
| 6-Person Families | 0 (0.0%) | $0 |
| 7+ Person Families | 2 (3.3%) | $0 |
| Total | 60 (100.0%) | $57,321 |
Family Income by Number of Earners in Elgin borough
The median family income in Elgin borough is $57,321, with families comprising 3+ earners (10) having the highest median family income of $140,417, while families with no earners (18) have the lowest median family income of $30,000, accounting for 16.7% and 30.0% of families, respectively.
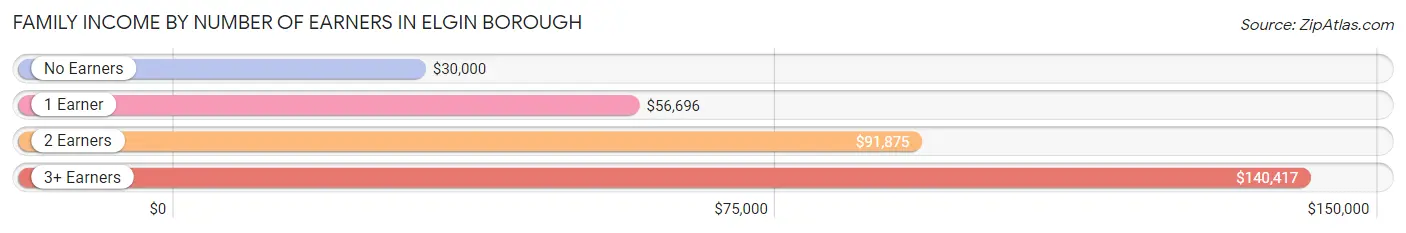
| Number of Earners | # Families | Median Income |
| No Earners | 18 (30.0%) | $30,000 |
| 1 Earner | 19 (31.7%) | $56,696 |
| 2 Earners | 13 (21.7%) | $91,875 |
| 3+ Earners | 10 (16.7%) | $140,417 |
| Total | 60 (100.0%) | $57,321 |
Household Income in Elgin borough
Household Income Brackets in Elgin borough
With 25 households falling in the category, the $50,000 to $74,999 income range is the most frequent in Elgin borough, accounting for 32.5% of all households.
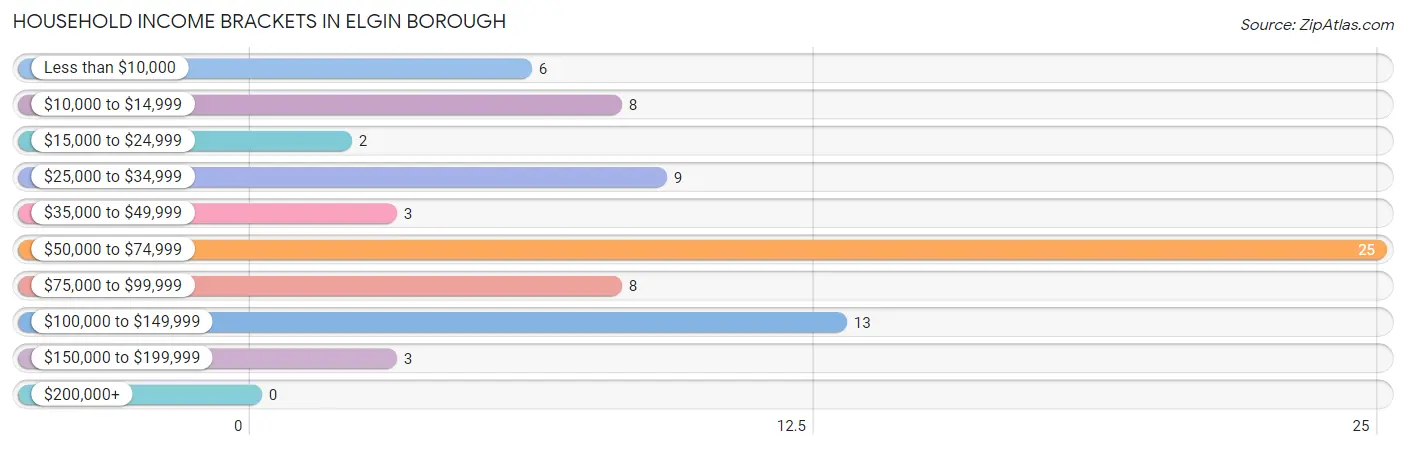
| Income Bracket | # Households | % Households |
| Less than $10,000 | 6 | 7.8% |
| $10,000 to $14,999 | 8 | 10.4% |
| $15,000 to $24,999 | 2 | 2.6% |
| $25,000 to $34,999 | 9 | 11.7% |
| $35,000 to $49,999 | 3 | 3.9% |
| $50,000 to $74,999 | 25 | 32.5% |
| $75,000 to $99,999 | 8 | 10.4% |
| $100,000 to $149,999 | 13 | 16.9% |
| $150,000 to $199,999 | 3 | 3.9% |
| $200,000+ | 0 | 0.0% |
Household Income by Householder Age in Elgin borough
The median household income in Elgin borough is $55,982, with the highest median household income of $55,104 found in the 65+ years age bracket for the primary householder. A total of 37 households (48.0%) fall into this category.
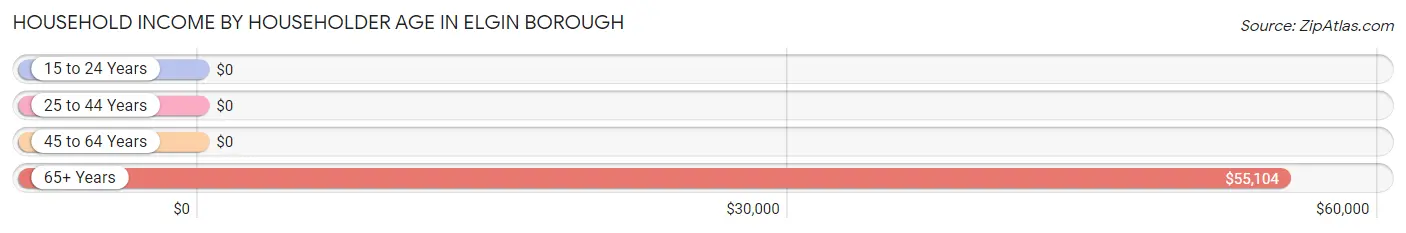
| Income Bracket | # Households | Median Income |
| 15 to 24 Years | 0 (0.0%) | $0 |
| 25 to 44 Years | 19 (24.7%) | $0 |
| 45 to 64 Years | 21 (27.3%) | $0 |
| 65+ Years | 37 (48.0%) | $55,104 |
| Total | 77 (100.0%) | $55,982 |
Poverty in Elgin borough
Income Below Poverty by Sex and Age in Elgin borough
With 11.0% poverty level for males and 7.3% for females among the residents of Elgin borough, 16 and 17 year old males and 12 to 14 year old females are the most vulnerable to poverty, with 2 males (100.0%) and 1 females (100.0%) in their respective age groups living below the poverty level.
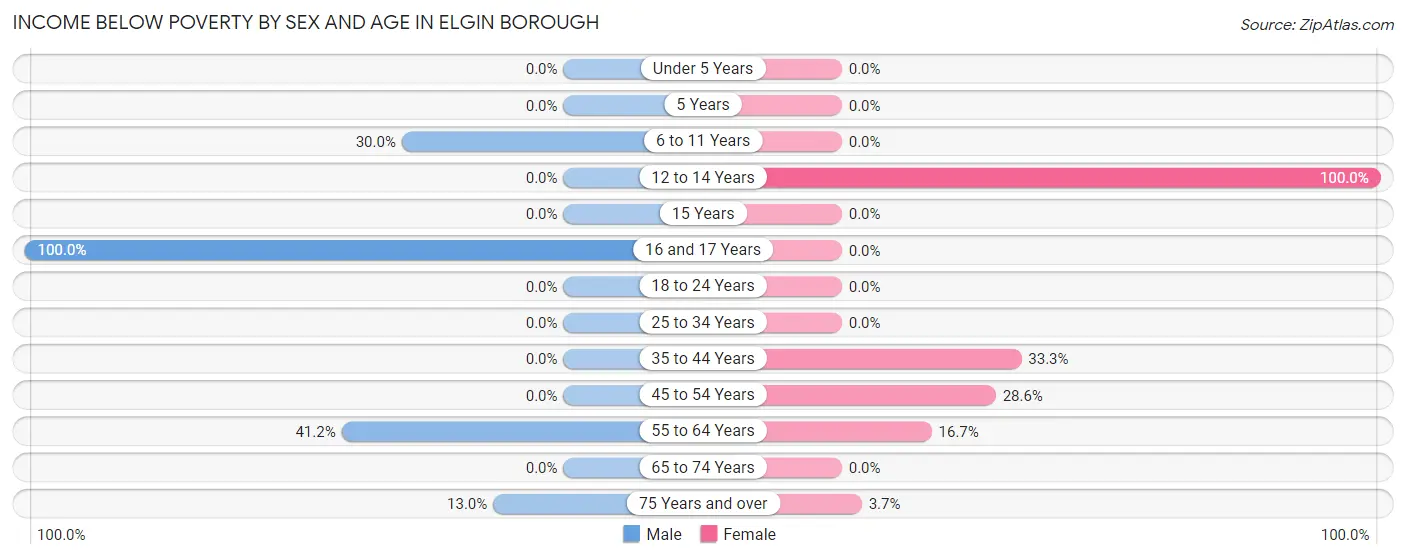
| Age Bracket | Male | Female |
| Under 5 Years | 0 (0.0%) | 0 (0.0%) |
| 5 Years | 0 (0.0%) | 0 (0.0%) |
| 6 to 11 Years | 3 (30.0%) | 0 (0.0%) |
| 12 to 14 Years | 0 (0.0%) | 1 (100.0%) |
| 15 Years | 0 (0.0%) | 0 (0.0%) |
| 16 and 17 Years | 2 (100.0%) | 0 (0.0%) |
| 18 to 24 Years | 0 (0.0%) | 0 (0.0%) |
| 25 to 34 Years | 0 (0.0%) | 0 (0.0%) |
| 35 to 44 Years | 0 (0.0%) | 2 (33.3%) |
| 45 to 54 Years | 0 (0.0%) | 2 (28.6%) |
| 55 to 64 Years | 7 (41.2%) | 1 (16.7%) |
| 65 to 74 Years | 0 (0.0%) | 0 (0.0%) |
| 75 Years and over | 3 (13.0%) | 1 (3.7%) |
| Total | 15 (11.0%) | 7 (7.3%) |
Income Above Poverty by Sex and Age in Elgin borough
According to the poverty statistics in Elgin borough, males aged under 5 years and females aged under 5 years are the age groups that are most secure financially, with 100.0% of males and 100.0% of females in these age groups living above the poverty line.
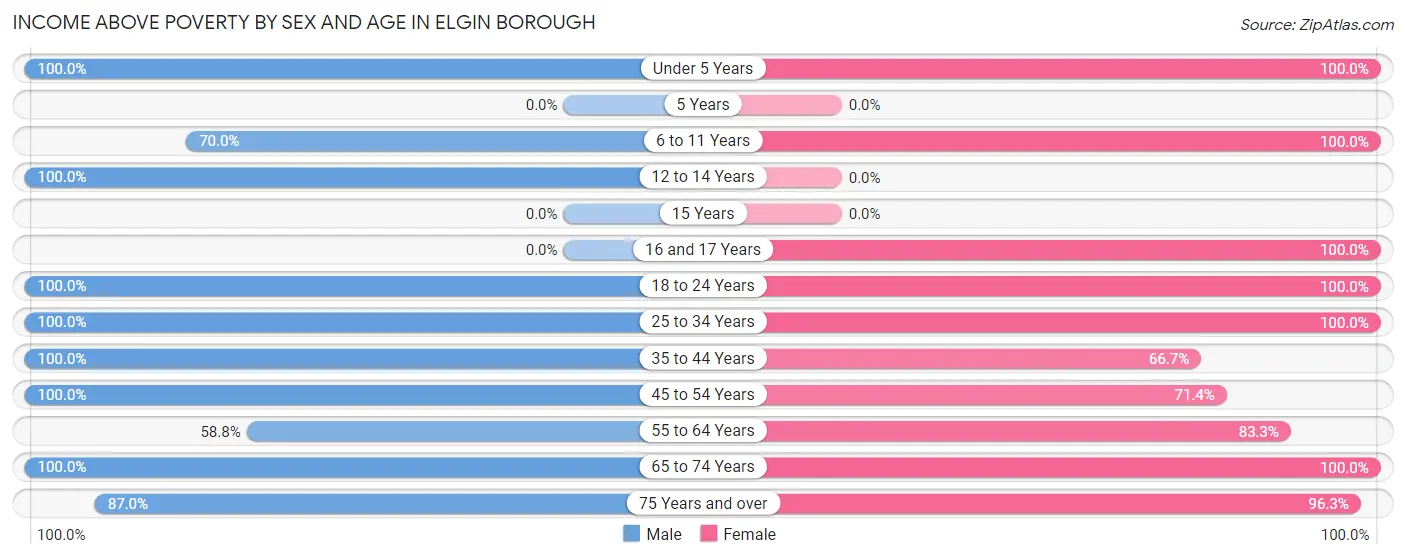
| Age Bracket | Male | Female |
| Under 5 Years | 5 (100.0%) | 3 (100.0%) |
| 5 Years | 0 (0.0%) | 0 (0.0%) |
| 6 to 11 Years | 7 (70.0%) | 11 (100.0%) |
| 12 to 14 Years | 2 (100.0%) | 0 (0.0%) |
| 15 Years | 0 (0.0%) | 0 (0.0%) |
| 16 and 17 Years | 0 (0.0%) | 1 (100.0%) |
| 18 to 24 Years | 2 (100.0%) | 2 (100.0%) |
| 25 to 34 Years | 25 (100.0%) | 15 (100.0%) |
| 35 to 44 Years | 7 (100.0%) | 4 (66.7%) |
| 45 to 54 Years | 34 (100.0%) | 5 (71.4%) |
| 55 to 64 Years | 10 (58.8%) | 5 (83.3%) |
| 65 to 74 Years | 9 (100.0%) | 17 (100.0%) |
| 75 Years and over | 20 (87.0%) | 26 (96.3%) |
| Total | 121 (89.0%) | 89 (92.7%) |
Income Below Poverty Among Married-Couple Families in Elgin borough
The poverty statistics for married-couple families in Elgin borough show that 3.6% or 2 of the total 55 families live below the poverty line. Families with no children have the highest poverty rate of 4.5%, comprising of 2 families. On the other hand, families with 1 or 2 children have the lowest poverty rate of 0.0%, which includes 0 families.
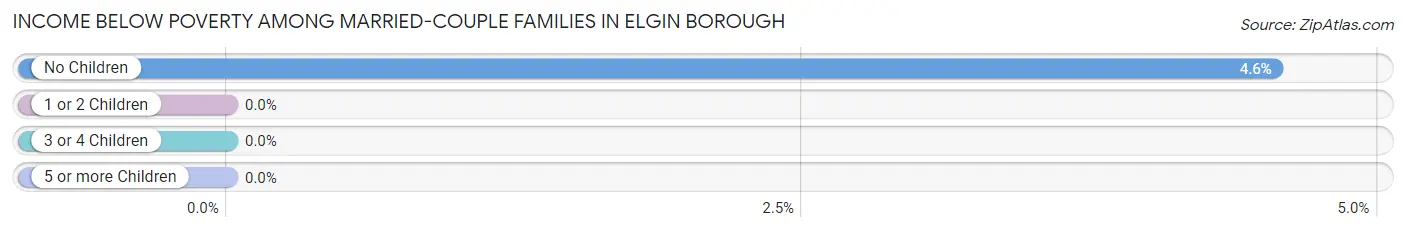
| Children | Above Poverty | Below Poverty |
| No Children | 42 (95.5%) | 2 (4.5%) |
| 1 or 2 Children | 7 (100.0%) | 0 (0.0%) |
| 3 or 4 Children | 2 (100.0%) | 0 (0.0%) |
| 5 or more Children | 2 (100.0%) | 0 (0.0%) |
| Total | 53 (96.4%) | 2 (3.6%) |
Income Below Poverty Among Single-Parent Households in Elgin borough
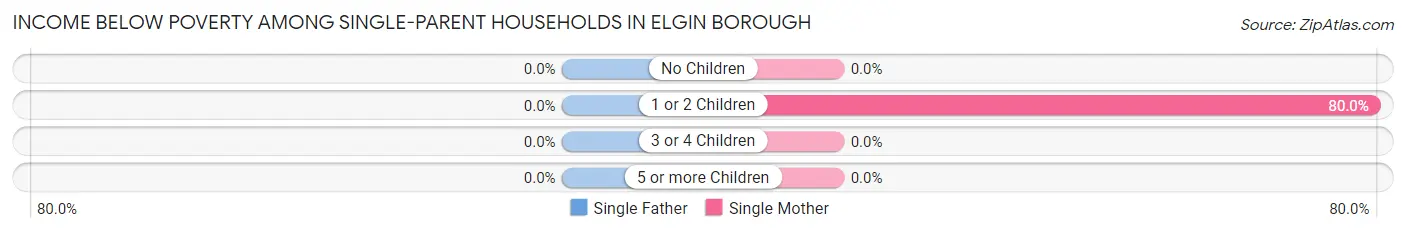
| Children | Single Father | Single Mother |
| No Children | 0 (0.0%) | 0 (0.0%) |
| 1 or 2 Children | 0 (0.0%) | 4 (80.0%) |
| 3 or 4 Children | 0 (0.0%) | 0 (0.0%) |
| 5 or more Children | 0 (0.0%) | 0 (0.0%) |
| Total | 0 (0.0%) | 4 (80.0%) |
Income Below Poverty Among Married-Couple vs Single-Parent Households in Elgin borough
The poverty data for Elgin borough shows that 2 of the married-couple family households (3.6%) and 4 of the single-parent households (80.0%) are living below the poverty level. Within the married-couple family households, those with no children have the highest poverty rate, with 2 households (4.5%) falling below the poverty line. Among the single-parent households, those with 1 or 2 children have the highest poverty rate, with 4 household (80.0%) living below poverty.
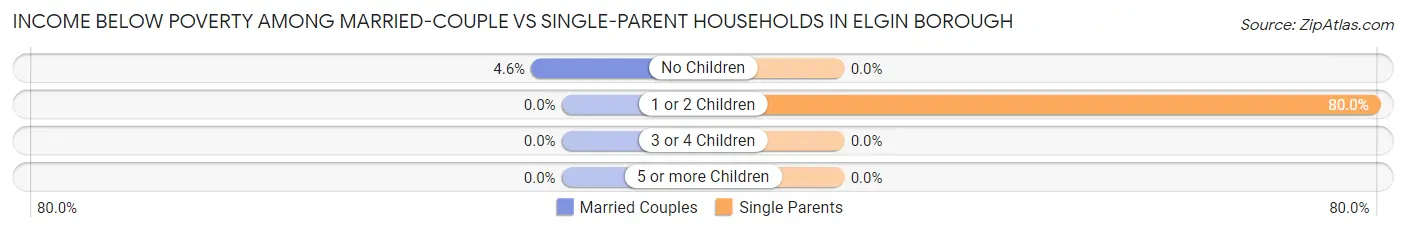
| Children | Married-Couple Families | Single-Parent Households |
| No Children | 2 (4.5%) | 0 (0.0%) |
| 1 or 2 Children | 0 (0.0%) | 4 (80.0%) |
| 3 or 4 Children | 0 (0.0%) | 0 (0.0%) |
| 5 or more Children | 0 (0.0%) | 0 (0.0%) |
| Total | 2 (3.6%) | 4 (80.0%) |
Employment Characteristics in Elgin borough
Employment by Class of Employer in Elgin borough
Among the 100 employed individuals in Elgin borough, private company employees (77 | 77.0%), not-for-profit organizations (8 | 8.0%), and state government employees (5 | 5.0%) make up the most common classes of employment.
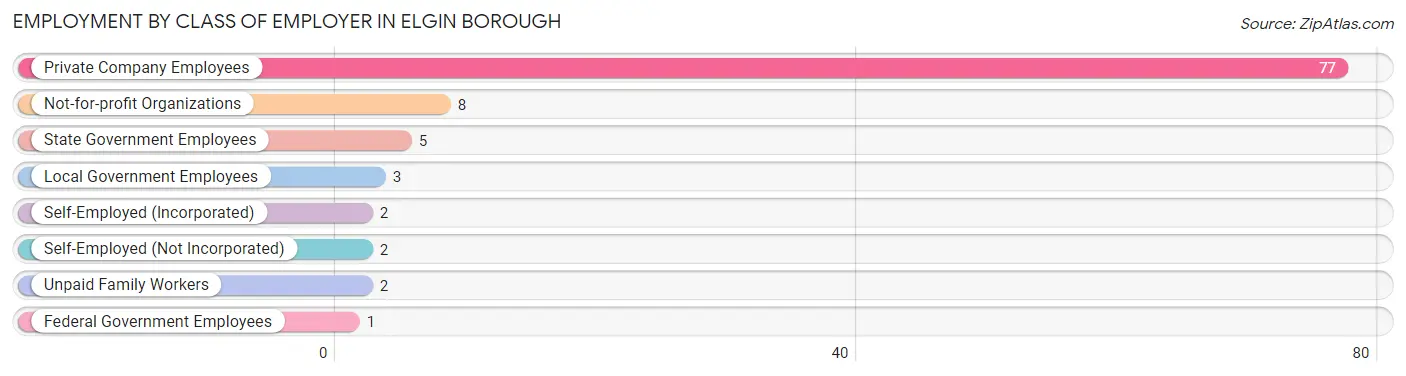
| Employer Class | # Employees | % Employees |
| Private Company Employees | 77 | 77.0% |
| Self-Employed (Incorporated) | 2 | 2.0% |
| Self-Employed (Not Incorporated) | 2 | 2.0% |
| Not-for-profit Organizations | 8 | 8.0% |
| Local Government Employees | 3 | 3.0% |
| State Government Employees | 5 | 5.0% |
| Federal Government Employees | 1 | 1.0% |
| Unpaid Family Workers | 2 | 2.0% |
| Total | 100 | 100.0% |
Employment Status by Age in Elgin borough
According to the labor force statistics for Elgin borough, out of the total population over 16 years of age (200), 52.5% or 105 individuals are in the labor force, with 2.9% or 3 of them unemployed. The age group with the highest labor force participation rate is 20 to 24 years, with 100.0% or 2 individuals in the labor force. Within the labor force, the 45 to 54 years age range has the highest percentage of unemployed individuals, with 7.7% or 3 of them being unemployed.
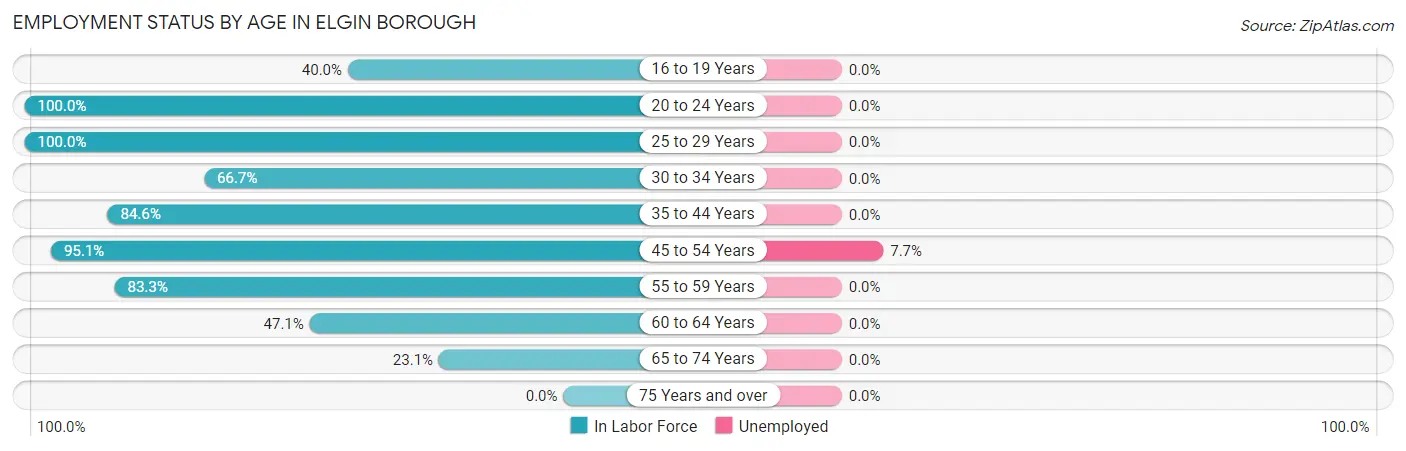
| Age Bracket | In Labor Force | Unemployed |
| 16 to 19 Years | 2 (40.0%) | 0 (0.0%) |
| 20 to 24 Years | 2 (100.0%) | 0 (0.0%) |
| 25 to 29 Years | 16 (100.0%) | 0 (0.0%) |
| 30 to 34 Years | 16 (66.7%) | 0 (0.0%) |
| 35 to 44 Years | 11 (84.6%) | 0 (0.0%) |
| 45 to 54 Years | 39 (95.1%) | 3 (7.7%) |
| 55 to 59 Years | 5 (83.3%) | 0 (0.0%) |
| 60 to 64 Years | 8 (47.1%) | 0 (0.0%) |
| 65 to 74 Years | 6 (23.1%) | 0 (0.0%) |
| 75 Years and over | 0 (0.0%) | 0 (0.0%) |
| Total | 105 (52.5%) | 3 (2.9%) |
Employment Status by Educational Attainment in Elgin borough
According to labor force statistics for Elgin borough, 81.2% of individuals (95) out of the total population between 25 and 64 years of age (117) are in the labor force, with 3.2% or 3 of them being unemployed. The group with the highest labor force participation rate are those with the educational attainment of bachelor's degree or higher, with 96.0% or 24 individuals in the labor force. Within the labor force, individuals with high school diploma education have the highest percentage of unemployment, with 4.8% or 3 of them being unemployed.
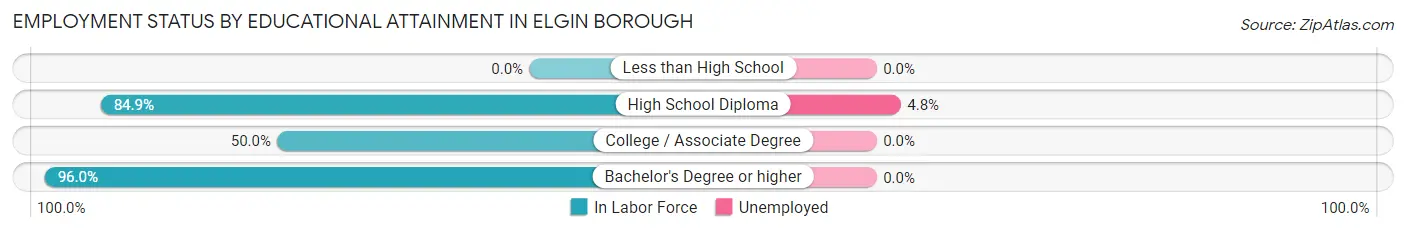
| Educational Attainment | In Labor Force | Unemployed |
| Less than High School | 0 (0.0%) | 0 (0.0%) |
| High School Diploma | 62 (84.9%) | 4 (4.8%) |
| College / Associate Degree | 9 (50.0%) | 0 (0.0%) |
| Bachelor's Degree or higher | 24 (96.0%) | 0 (0.0%) |
| Total | 95 (81.2%) | 4 (3.2%) |
Employment Occupations by Sex in Elgin borough
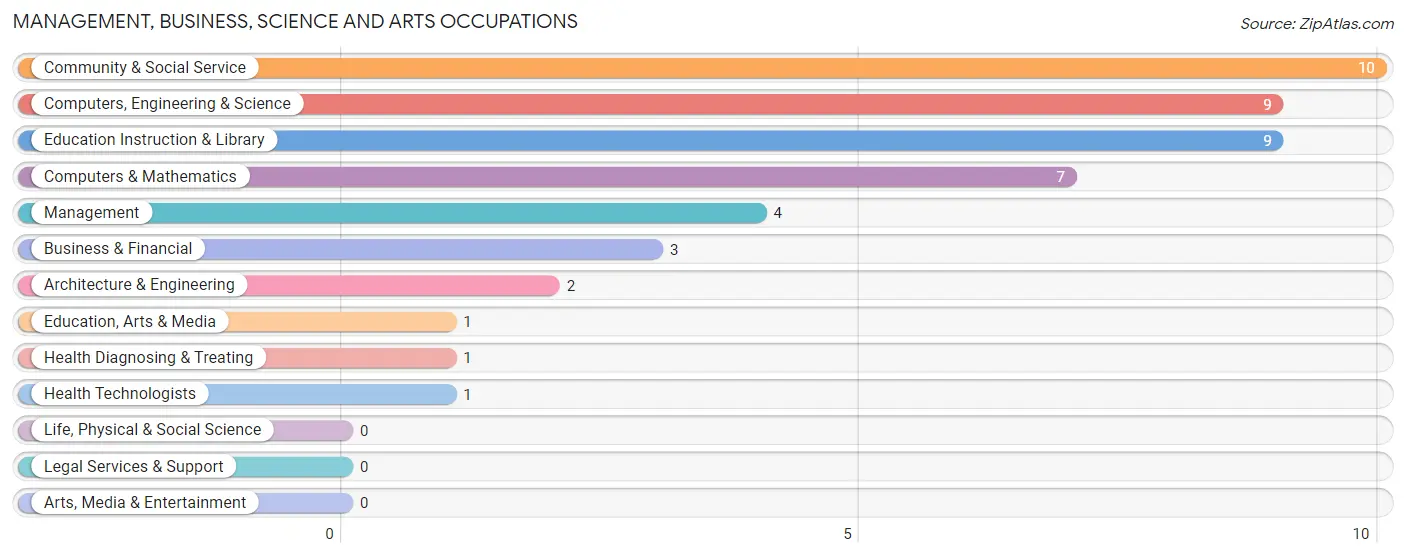
Management, Business, Science and Arts Occupations
The most common Management, Business, Science and Arts occupations in Elgin borough are Community & Social Service (10 | 9.8%), Computers, Engineering & Science (9 | 8.8%), Education Instruction & Library (9 | 8.8%), Computers & Mathematics (7 | 6.9%), and Management (4 | 3.9%).
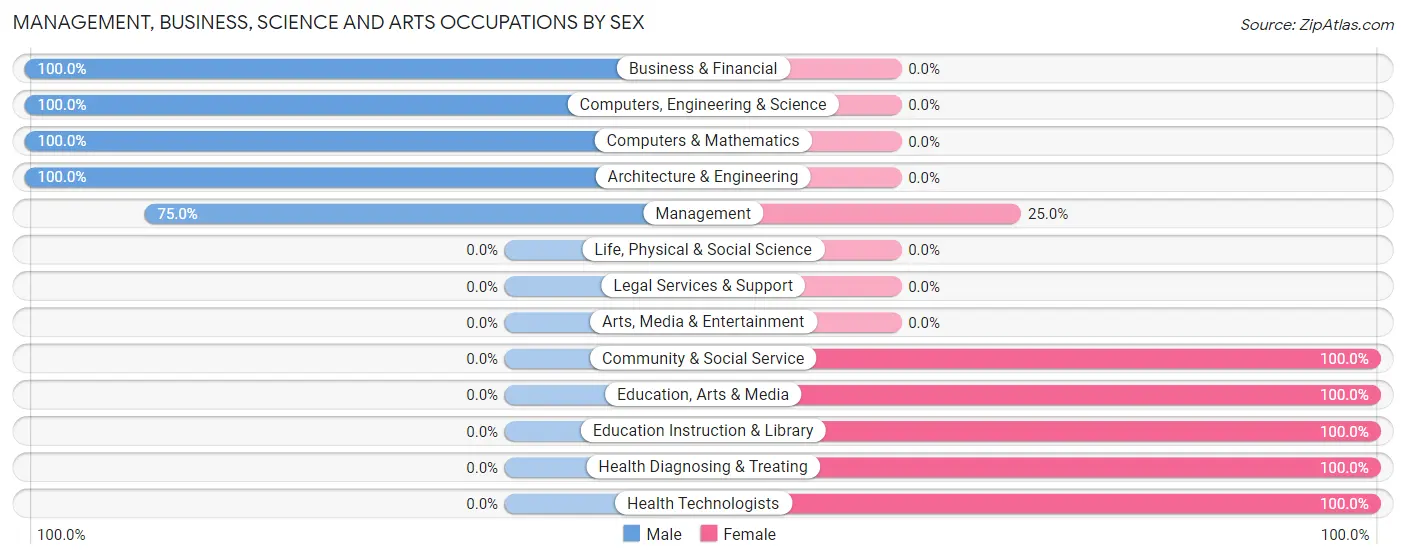
Management, Business, Science and Arts Occupations by Sex
Within the Management, Business, Science and Arts occupations in Elgin borough, the most male-oriented occupations are Business & Financial (100.0%), Computers, Engineering & Science (100.0%), and Computers & Mathematics (100.0%), while the most female-oriented occupations are Community & Social Service (100.0%), Education, Arts & Media (100.0%), and Education Instruction & Library (100.0%).
| Occupation | Male | Female |
| Management | 3 (75.0%) | 1 (25.0%) |
| Business & Financial | 3 (100.0%) | 0 (0.0%) |
| Computers, Engineering & Science | 9 (100.0%) | 0 (0.0%) |
| Computers & Mathematics | 7 (100.0%) | 0 (0.0%) |
| Architecture & Engineering | 2 (100.0%) | 0 (0.0%) |
| Life, Physical & Social Science | 0 (0.0%) | 0 (0.0%) |
| Community & Social Service | 0 (0.0%) | 10 (100.0%) |
| Education, Arts & Media | 0 (0.0%) | 1 (100.0%) |
| Legal Services & Support | 0 (0.0%) | 0 (0.0%) |
| Education Instruction & Library | 0 (0.0%) | 9 (100.0%) |
| Arts, Media & Entertainment | 0 (0.0%) | 0 (0.0%) |
| Health Diagnosing & Treating | 0 (0.0%) | 1 (100.0%) |
| Health Technologists | 0 (0.0%) | 1 (100.0%) |
| Total (Category) | 15 (55.6%) | 12 (44.4%) |
| Total (Overall) | 68 (66.7%) | 34 (33.3%) |
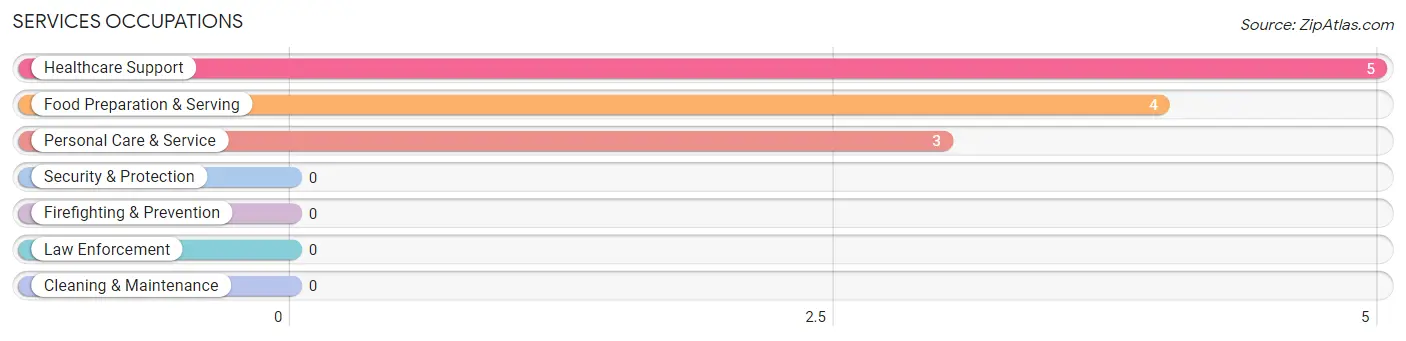
Services Occupations
The most common Services occupations in Elgin borough are Healthcare Support (5 | 4.9%), Food Preparation & Serving (4 | 3.9%), and Personal Care & Service (3 | 2.9%).
Services Occupations by Sex
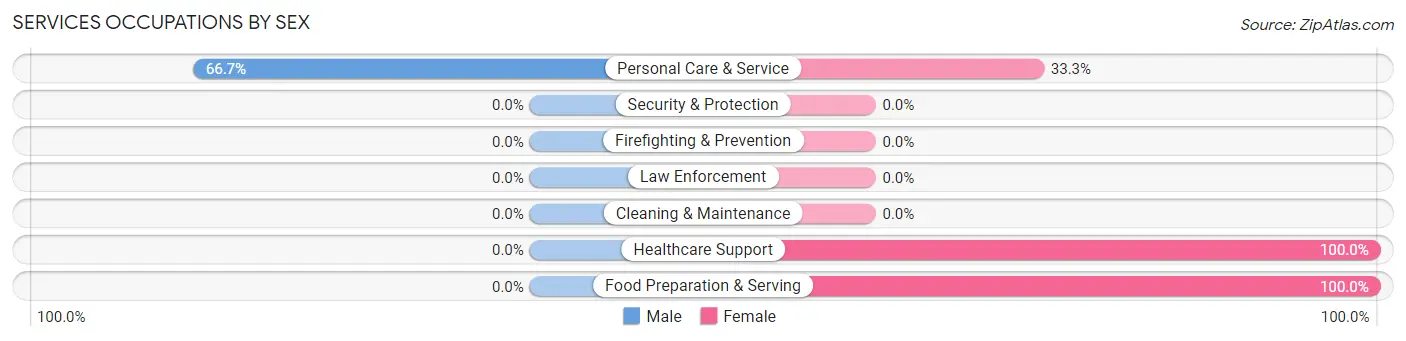
| Occupation | Male | Female |
| Healthcare Support | 0 (0.0%) | 5 (100.0%) |
| Security & Protection | 0 (0.0%) | 0 (0.0%) |
| Firefighting & Prevention | 0 (0.0%) | 0 (0.0%) |
| Law Enforcement | 0 (0.0%) | 0 (0.0%) |
| Food Preparation & Serving | 0 (0.0%) | 4 (100.0%) |
| Cleaning & Maintenance | 0 (0.0%) | 0 (0.0%) |
| Personal Care & Service | 2 (66.7%) | 1 (33.3%) |
| Total (Category) | 2 (16.7%) | 10 (83.3%) |
| Total (Overall) | 68 (66.7%) | 34 (33.3%) |
Sales and Office Occupations
The most common Sales and Office occupations in Elgin borough are Office & Administration (12 | 11.8%), and Sales & Related (6 | 5.9%).

Sales and Office Occupations by Sex
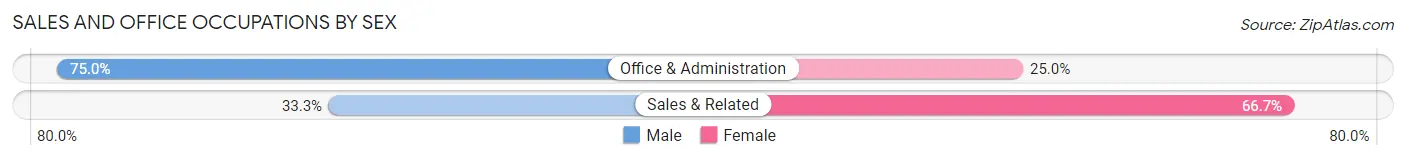
| Occupation | Male | Female |
| Sales & Related | 2 (33.3%) | 4 (66.7%) |
| Office & Administration | 9 (75.0%) | 3 (25.0%) |
| Total (Category) | 11 (61.1%) | 7 (38.9%) |
| Total (Overall) | 68 (66.7%) | 34 (33.3%) |
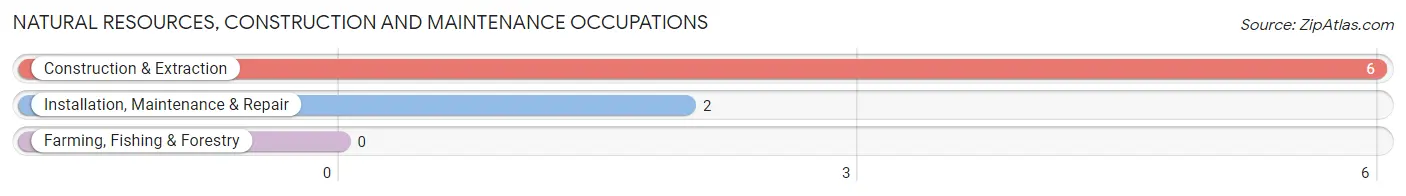
Natural Resources, Construction and Maintenance Occupations
The most common Natural Resources, Construction and Maintenance occupations in Elgin borough are Construction & Extraction (6 | 5.9%), and Installation, Maintenance & Repair (2 | 2.0%).
Natural Resources, Construction and Maintenance Occupations by Sex
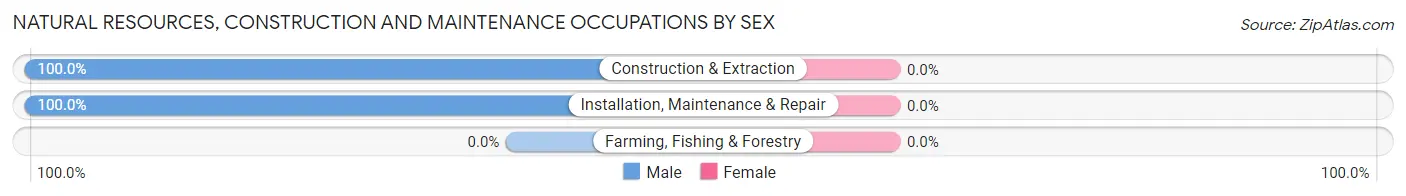
| Occupation | Male | Female |
| Farming, Fishing & Forestry | 0 (0.0%) | 0 (0.0%) |
| Construction & Extraction | 6 (100.0%) | 0 (0.0%) |
| Installation, Maintenance & Repair | 2 (100.0%) | 0 (0.0%) |
| Total (Category) | 8 (100.0%) | 0 (0.0%) |
| Total (Overall) | 68 (66.7%) | 34 (33.3%) |
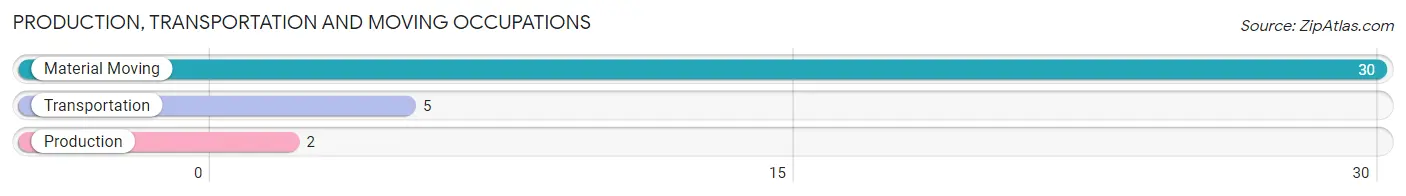
Production, Transportation and Moving Occupations
The most common Production, Transportation and Moving occupations in Elgin borough are Material Moving (30 | 29.4%), Transportation (5 | 4.9%), and Production (2 | 2.0%).
Production, Transportation and Moving Occupations by Sex
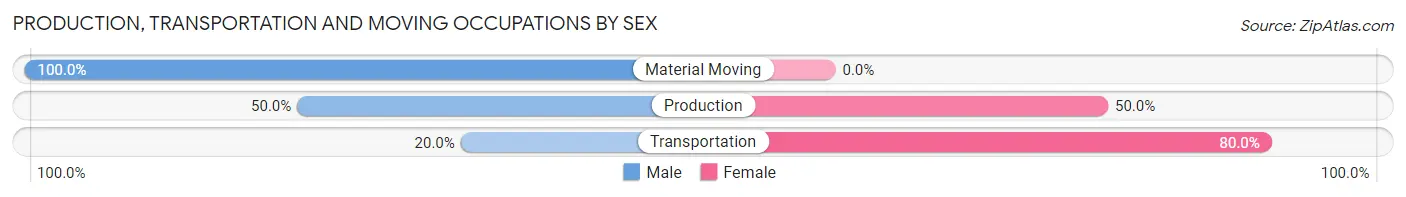
| Occupation | Male | Female |
| Production | 1 (50.0%) | 1 (50.0%) |
| Transportation | 1 (20.0%) | 4 (80.0%) |
| Material Moving | 30 (100.0%) | 0 (0.0%) |
| Total (Category) | 32 (86.5%) | 5 (13.5%) |
| Total (Overall) | 68 (66.7%) | 34 (33.3%) |
Employment Industries by Sex in Elgin borough
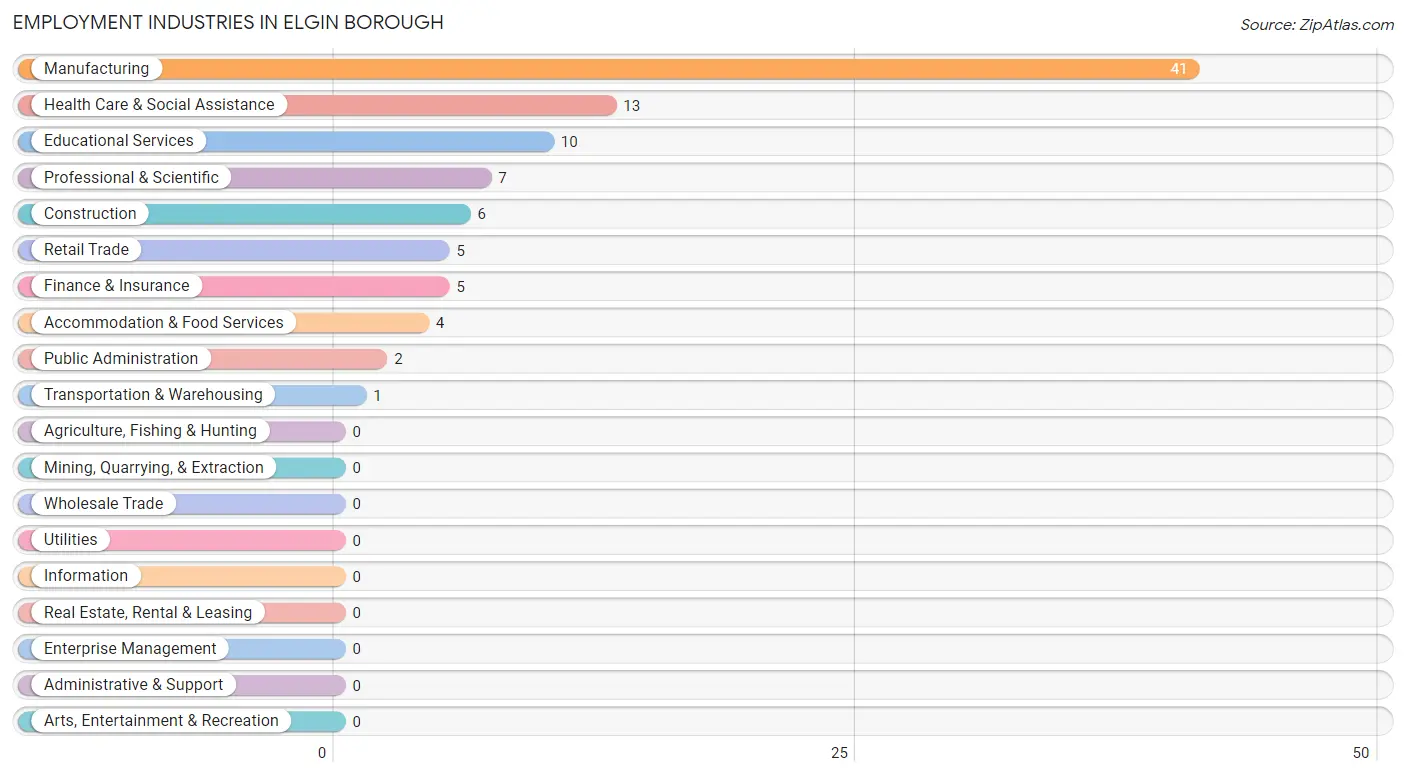
Employment Industries in Elgin borough
The major employment industries in Elgin borough include Manufacturing (41 | 40.2%), Health Care & Social Assistance (13 | 12.8%), Educational Services (10 | 9.8%), Professional & Scientific (7 | 6.9%), and Construction (6 | 5.9%).
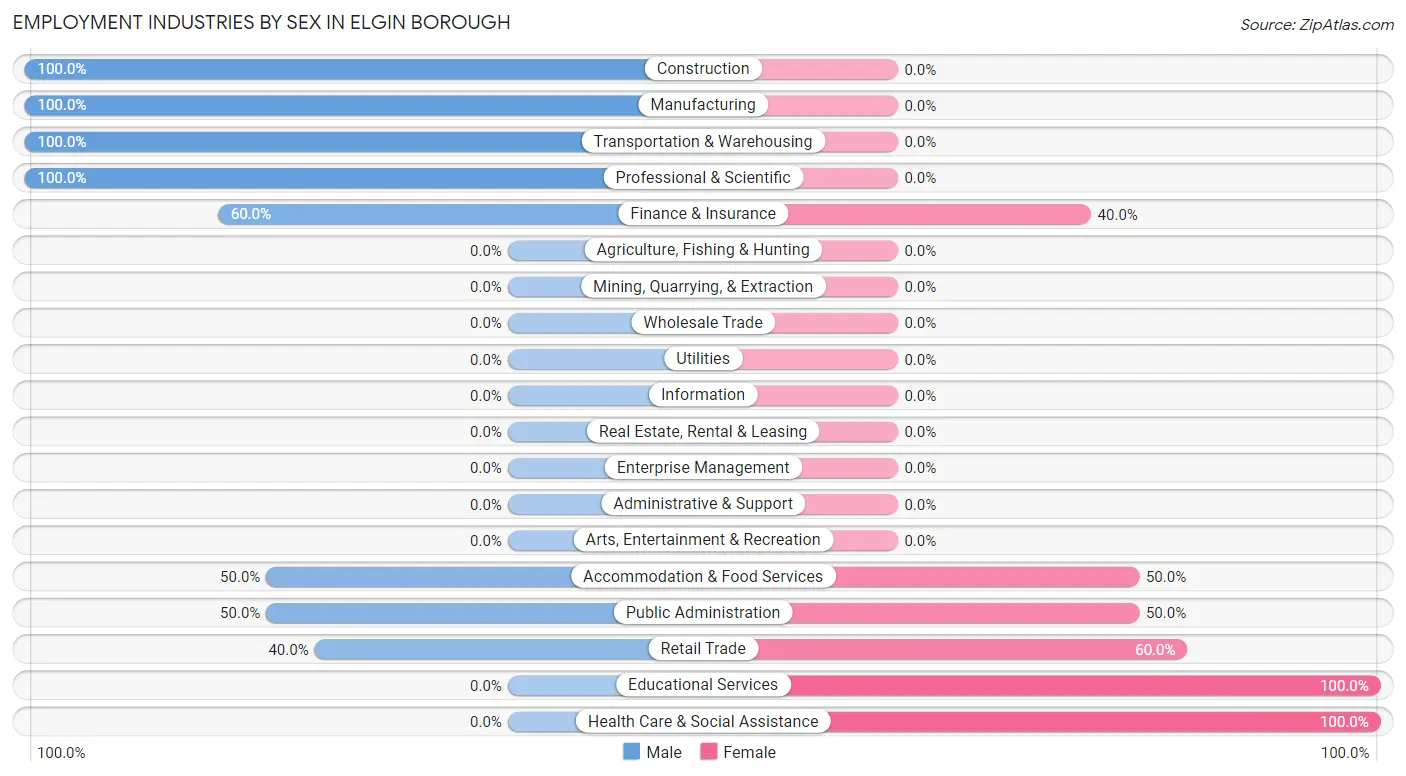
Employment Industries by Sex in Elgin borough
The Elgin borough industries that see more men than women are Construction (100.0%), Manufacturing (100.0%), and Transportation & Warehousing (100.0%), whereas the industries that tend to have a higher number of women are Educational Services (100.0%), Health Care & Social Assistance (100.0%), and Retail Trade (60.0%).
| Industry | Male | Female |
| Agriculture, Fishing & Hunting | 0 (0.0%) | 0 (0.0%) |
| Mining, Quarrying, & Extraction | 0 (0.0%) | 0 (0.0%) |
| Construction | 6 (100.0%) | 0 (0.0%) |
| Manufacturing | 41 (100.0%) | 0 (0.0%) |
| Wholesale Trade | 0 (0.0%) | 0 (0.0%) |
| Retail Trade | 2 (40.0%) | 3 (60.0%) |
| Transportation & Warehousing | 1 (100.0%) | 0 (0.0%) |
| Utilities | 0 (0.0%) | 0 (0.0%) |
| Information | 0 (0.0%) | 0 (0.0%) |
| Finance & Insurance | 3 (60.0%) | 2 (40.0%) |
| Real Estate, Rental & Leasing | 0 (0.0%) | 0 (0.0%) |
| Professional & Scientific | 7 (100.0%) | 0 (0.0%) |
| Enterprise Management | 0 (0.0%) | 0 (0.0%) |
| Administrative & Support | 0 (0.0%) | 0 (0.0%) |
| Educational Services | 0 (0.0%) | 10 (100.0%) |
| Health Care & Social Assistance | 0 (0.0%) | 13 (100.0%) |
| Arts, Entertainment & Recreation | 0 (0.0%) | 0 (0.0%) |
| Accommodation & Food Services | 2 (50.0%) | 2 (50.0%) |
| Public Administration | 1 (50.0%) | 1 (50.0%) |
| Total | 68 (66.7%) | 34 (33.3%) |
Education in Elgin borough
School Enrollment in Elgin borough
The most common levels of schooling among the 32 students in Elgin borough are elementary school (16 | 50.0%), middle school (5 | 15.6%), and high school (4 | 12.5%).
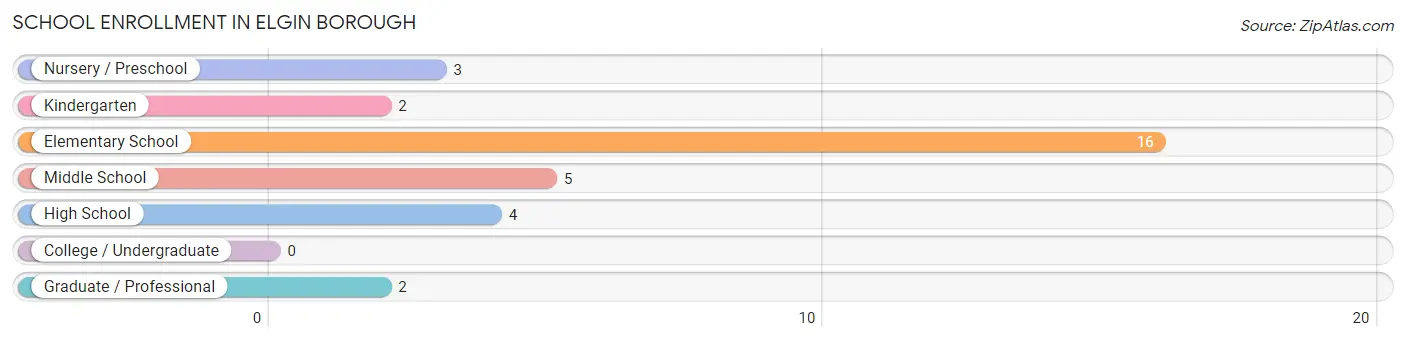
| School Level | # Students | % Students |
| Nursery / Preschool | 3 | 9.4% |
| Kindergarten | 2 | 6.2% |
| Elementary School | 16 | 50.0% |
| Middle School | 5 | 15.6% |
| High School | 4 | 12.5% |
| College / Undergraduate | 0 | 0.0% |
| Graduate / Professional | 2 | 6.2% |
| Total | 32 | 100.0% |
School Enrollment by Age by Funding Source in Elgin borough
Out of a total of 32 students who are enrolled in schools in Elgin borough, 6 (18.8%) attend a private institution, while the remaining 26 (81.2%) are enrolled in public schools. The age group of 25 to 34 year olds has the highest likelihood of being enrolled in private schools, with 2 (100.0% in the age bracket) enrolled. Conversely, the age group of 3 to 4 year olds has the lowest likelihood of being enrolled in a private school, with 3 (100.0% in the age bracket) attending a public institution.
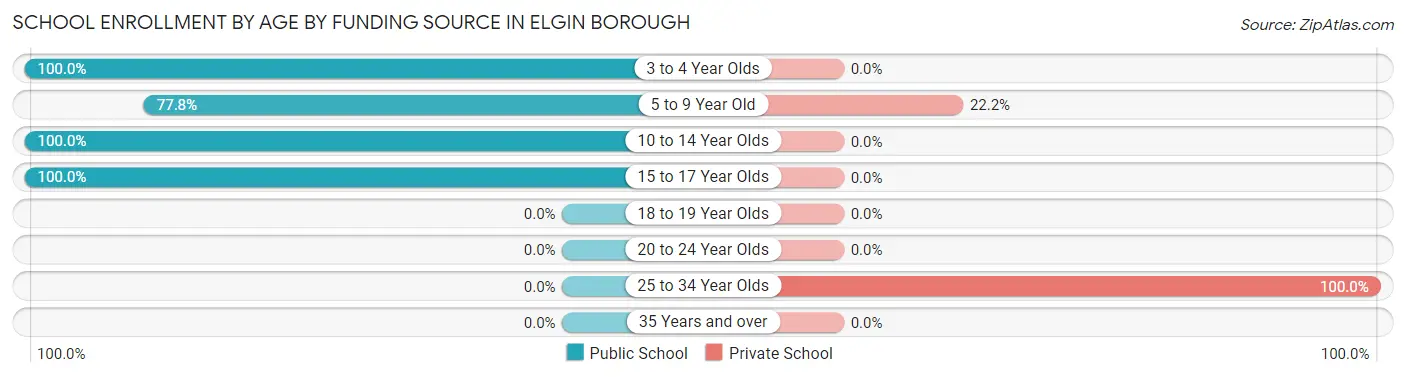
| Age Bracket | Public School | Private School |
| 3 to 4 Year Olds | 3 (100.0%) | 0 (0.0%) |
| 5 to 9 Year Old | 14 (77.8%) | 4 (22.2%) |
| 10 to 14 Year Olds | 6 (100.0%) | 0 (0.0%) |
| 15 to 17 Year Olds | 3 (100.0%) | 0 (0.0%) |
| 18 to 19 Year Olds | 0 (0.0%) | 0 (0.0%) |
| 20 to 24 Year Olds | 0 (0.0%) | 0 (0.0%) |
| 25 to 34 Year Olds | 0 (0.0%) | 2 (100.0%) |
| 35 Years and over | 0 (0.0%) | 0 (0.0%) |
| Total | 26 (81.3%) | 6 (18.8%) |
Educational Attainment by Field of Study in Elgin borough
Computers & mathematics (7 | 25.9%), science & technology (6 | 22.2%), education (5 | 18.5%), business (3 | 11.1%), and physical & health sciences (2 | 7.4%) are the most common fields of study among 27 individuals in Elgin borough who have obtained a bachelor's degree or higher.
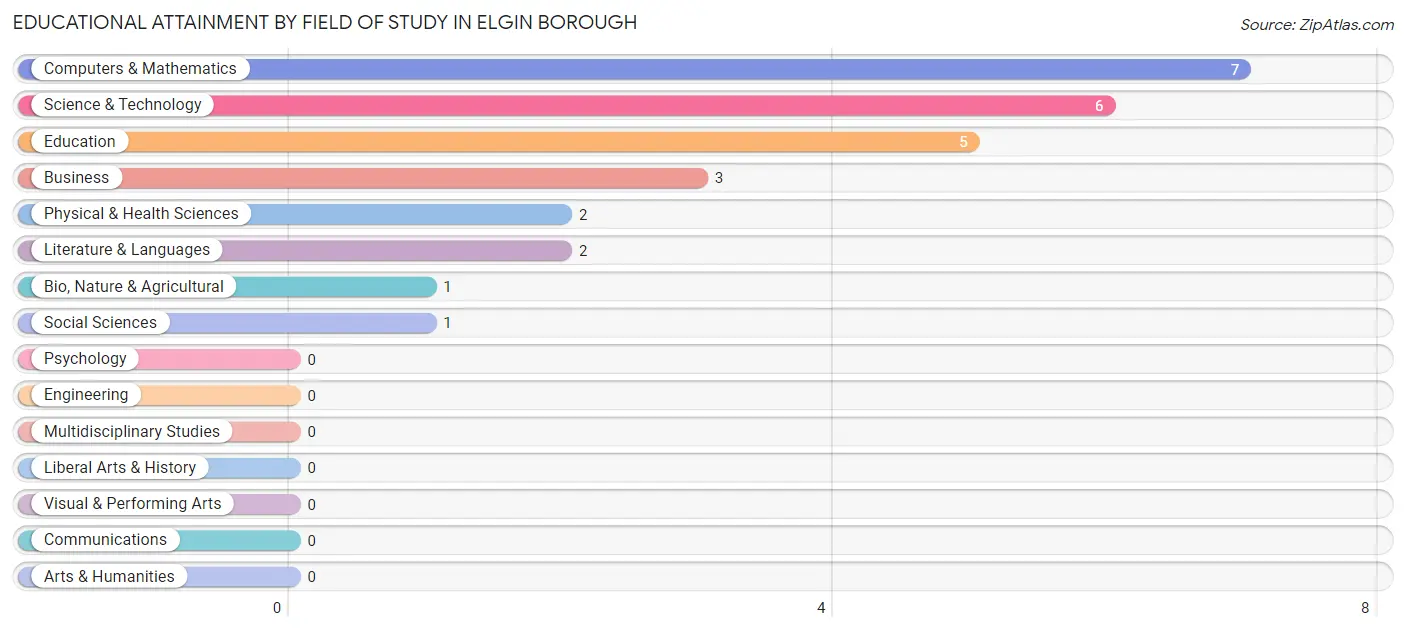
| Field of Study | # Graduates | % Graduates |
| Computers & Mathematics | 7 | 25.9% |
| Bio, Nature & Agricultural | 1 | 3.7% |
| Physical & Health Sciences | 2 | 7.4% |
| Psychology | 0 | 0.0% |
| Social Sciences | 1 | 3.7% |
| Engineering | 0 | 0.0% |
| Multidisciplinary Studies | 0 | 0.0% |
| Science & Technology | 6 | 22.2% |
| Business | 3 | 11.1% |
| Education | 5 | 18.5% |
| Literature & Languages | 2 | 7.4% |
| Liberal Arts & History | 0 | 0.0% |
| Visual & Performing Arts | 0 | 0.0% |
| Communications | 0 | 0.0% |
| Arts & Humanities | 0 | 0.0% |
| Total | 27 | 100.0% |
Transportation & Commute in Elgin borough
Vehicle Availability by Sex in Elgin borough
The most prevalent vehicle ownership categories in Elgin borough are males with 3 vehicles (36, accounting for 54.5%) and females with 3 vehicles (8, making up 105.9%).
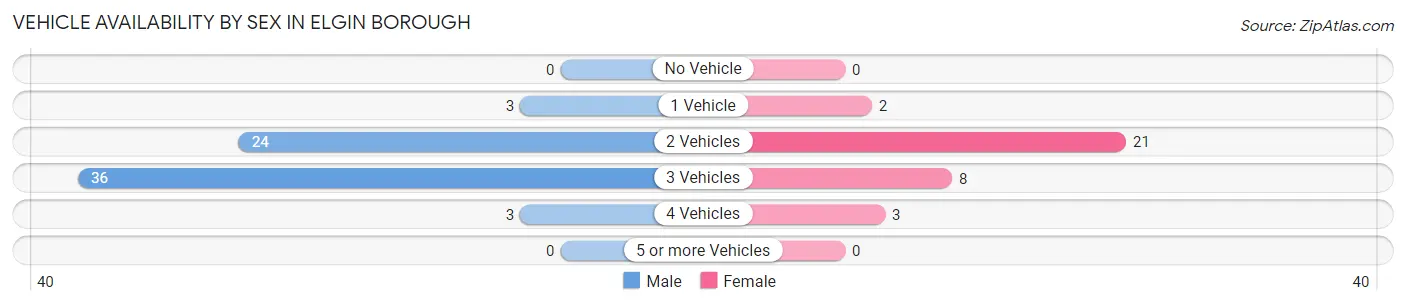
| Vehicles Available | Male | Female |
| No Vehicle | 0 (0.0%) | 0 (0.0%) |
| 1 Vehicle | 3 (4.5%) | 2 (5.9%) |
| 2 Vehicles | 24 (36.4%) | 21 (61.8%) |
| 3 Vehicles | 36 (54.5%) | 8 (23.5%) |
| 4 Vehicles | 3 (4.5%) | 3 (8.8%) |
| 5 or more Vehicles | 0 (0.0%) | 0 (0.0%) |
| Total | 66 (100.0%) | 34 (100.0%) |
Commute Time in Elgin borough
The most frequently occuring commute durations in Elgin borough are 30 to 34 minutes (35 commuters, 38.0%), 10 to 14 minutes (13 commuters, 14.1%), and 15 to 19 minutes (13 commuters, 14.1%).
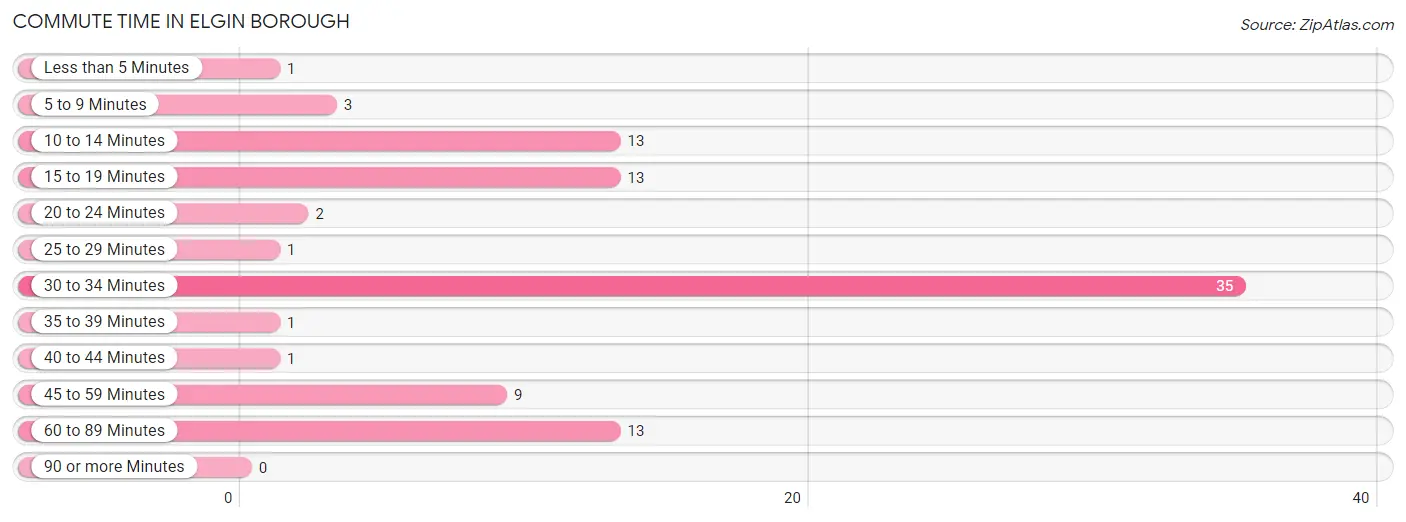
| Commute Time | # Commuters | % Commuters |
| Less than 5 Minutes | 1 | 1.1% |
| 5 to 9 Minutes | 3 | 3.3% |
| 10 to 14 Minutes | 13 | 14.1% |
| 15 to 19 Minutes | 13 | 14.1% |
| 20 to 24 Minutes | 2 | 2.2% |
| 25 to 29 Minutes | 1 | 1.1% |
| 30 to 34 Minutes | 35 | 38.0% |
| 35 to 39 Minutes | 1 | 1.1% |
| 40 to 44 Minutes | 1 | 1.1% |
| 45 to 59 Minutes | 9 | 9.8% |
| 60 to 89 Minutes | 13 | 14.1% |
| 90 or more Minutes | 0 | 0.0% |
Commute Time by Sex in Elgin borough
The most common commute times in Elgin borough are 30 to 34 minutes (30 commuters, 49.2%) for males and 15 to 19 minutes (8 commuters, 25.8%) for females.
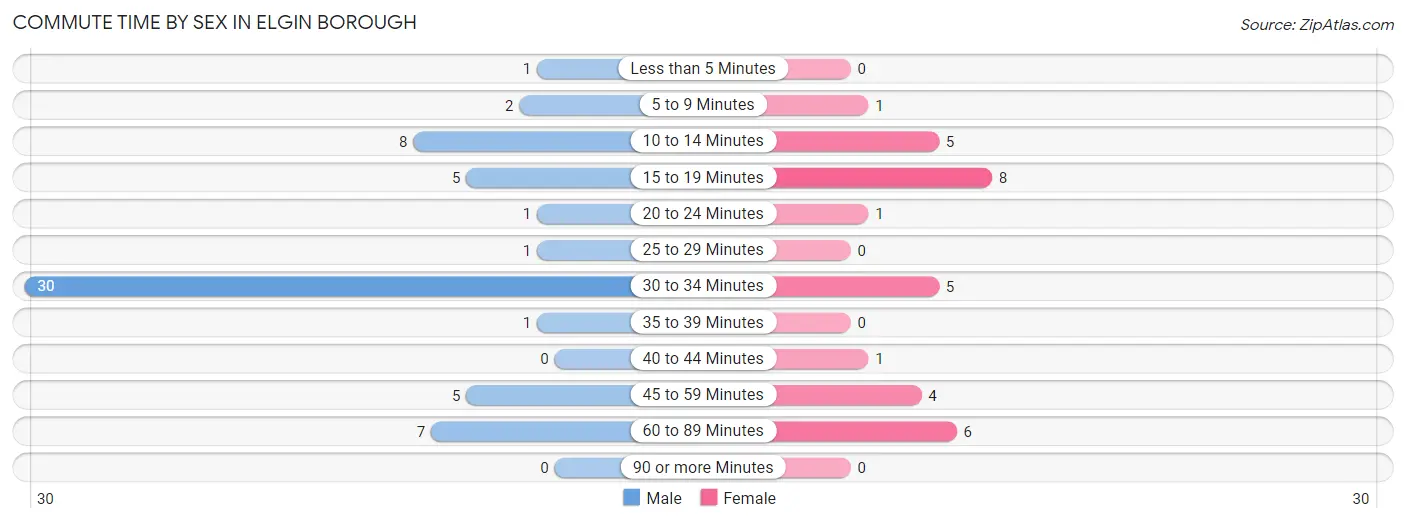
| Commute Time | Male | Female |
| Less than 5 Minutes | 1 (1.6%) | 0 (0.0%) |
| 5 to 9 Minutes | 2 (3.3%) | 1 (3.2%) |
| 10 to 14 Minutes | 8 (13.1%) | 5 (16.1%) |
| 15 to 19 Minutes | 5 (8.2%) | 8 (25.8%) |
| 20 to 24 Minutes | 1 (1.6%) | 1 (3.2%) |
| 25 to 29 Minutes | 1 (1.6%) | 0 (0.0%) |
| 30 to 34 Minutes | 30 (49.2%) | 5 (16.1%) |
| 35 to 39 Minutes | 1 (1.6%) | 0 (0.0%) |
| 40 to 44 Minutes | 0 (0.0%) | 1 (3.2%) |
| 45 to 59 Minutes | 5 (8.2%) | 4 (12.9%) |
| 60 to 89 Minutes | 7 (11.5%) | 6 (19.4%) |
| 90 or more Minutes | 0 (0.0%) | 0 (0.0%) |
Time of Departure to Work by Sex in Elgin borough
The most frequent times of departure to work in Elgin borough are 6:00 AM to 6:29 AM (29, 47.5%) for males and 7:00 AM to 7:29 AM (11, 35.5%) for females.
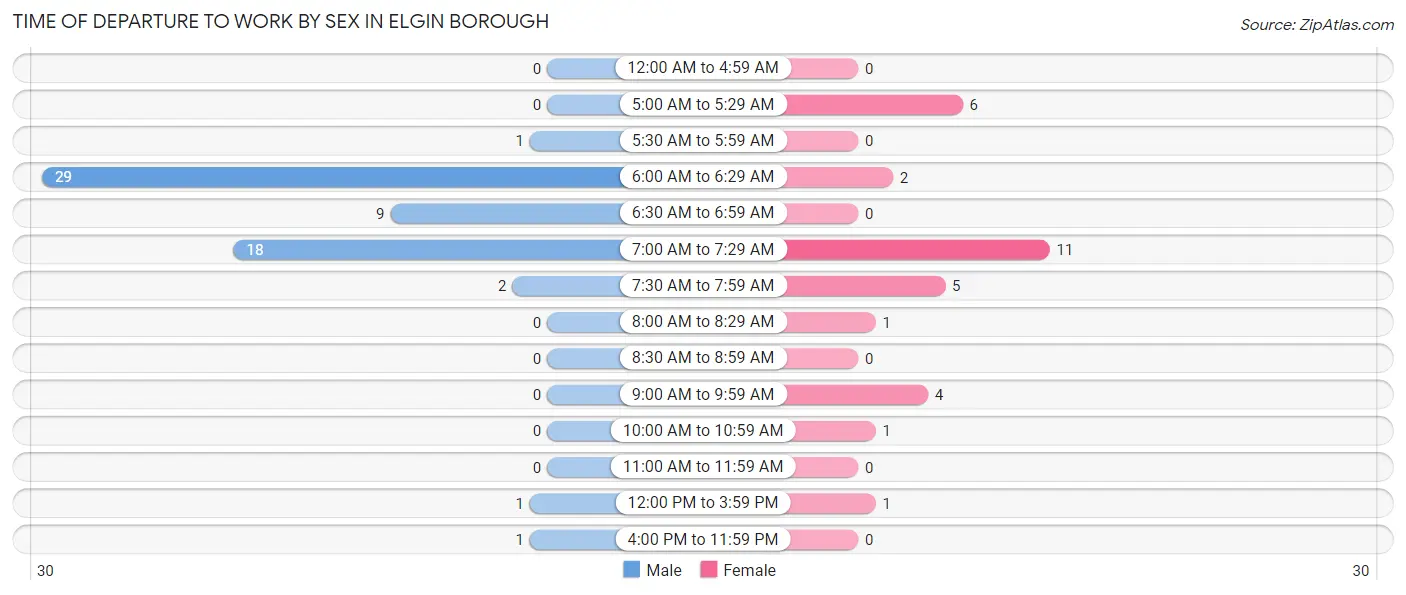
| Time of Departure | Male | Female |
| 12:00 AM to 4:59 AM | 0 (0.0%) | 0 (0.0%) |
| 5:00 AM to 5:29 AM | 0 (0.0%) | 6 (19.4%) |
| 5:30 AM to 5:59 AM | 1 (1.6%) | 0 (0.0%) |
| 6:00 AM to 6:29 AM | 29 (47.5%) | 2 (6.5%) |
| 6:30 AM to 6:59 AM | 9 (14.7%) | 0 (0.0%) |
| 7:00 AM to 7:29 AM | 18 (29.5%) | 11 (35.5%) |
| 7:30 AM to 7:59 AM | 2 (3.3%) | 5 (16.1%) |
| 8:00 AM to 8:29 AM | 0 (0.0%) | 1 (3.2%) |
| 8:30 AM to 8:59 AM | 0 (0.0%) | 0 (0.0%) |
| 9:00 AM to 9:59 AM | 0 (0.0%) | 4 (12.9%) |
| 10:00 AM to 10:59 AM | 0 (0.0%) | 1 (3.2%) |
| 11:00 AM to 11:59 AM | 0 (0.0%) | 0 (0.0%) |
| 12:00 PM to 3:59 PM | 1 (1.6%) | 1 (3.2%) |
| 4:00 PM to 11:59 PM | 1 (1.6%) | 0 (0.0%) |
| Total | 61 (100.0%) | 31 (100.0%) |
Housing Occupancy in Elgin borough
Occupancy by Ownership in Elgin borough
Of the total 77 dwellings in Elgin borough, owner-occupied units account for 66 (85.7%), while renter-occupied units make up 11 (14.3%).
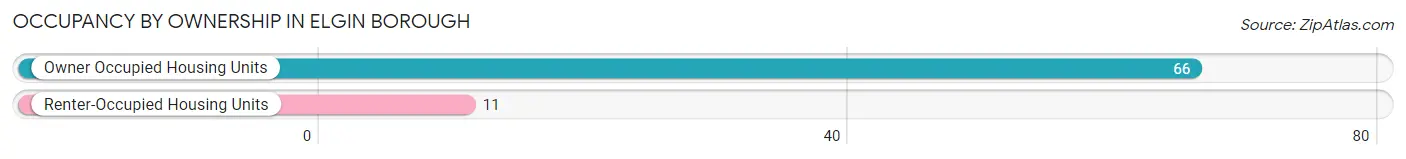
| Occupancy | # Housing Units | % Housing Units |
| Owner Occupied Housing Units | 66 | 85.7% |
| Renter-Occupied Housing Units | 11 | 14.3% |
| Total Occupied Housing Units | 77 | 100.0% |
Occupancy by Household Size in Elgin borough
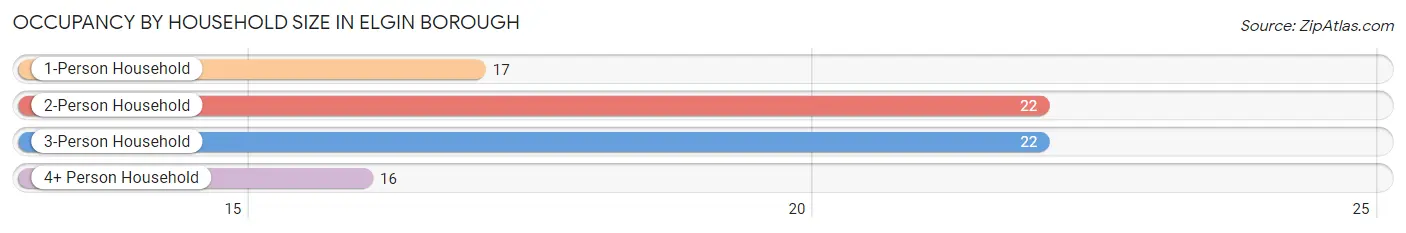
| Household Size | # Housing Units | % Housing Units |
| 1-Person Household | 17 | 22.1% |
| 2-Person Household | 22 | 28.6% |
| 3-Person Household | 22 | 28.6% |
| 4+ Person Household | 16 | 20.8% |
| Total Housing Units | 77 | 100.0% |
Occupancy by Ownership by Household Size in Elgin borough
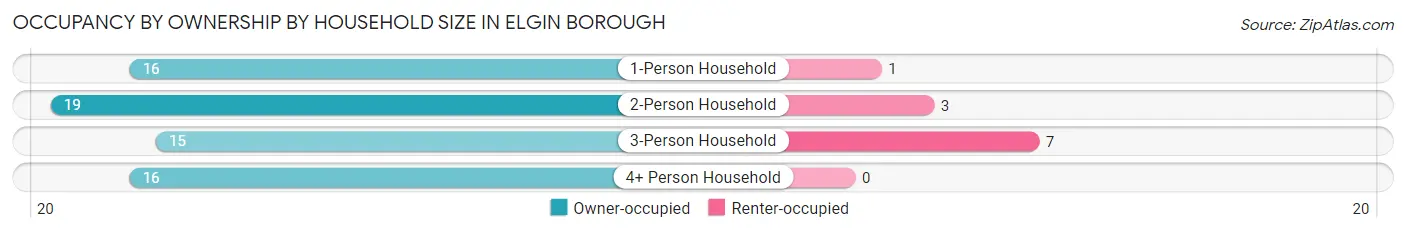
| Household Size | Owner-occupied | Renter-occupied |
| 1-Person Household | 16 (94.1%) | 1 (5.9%) |
| 2-Person Household | 19 (86.4%) | 3 (13.6%) |
| 3-Person Household | 15 (68.2%) | 7 (31.8%) |
| 4+ Person Household | 16 (100.0%) | 0 (0.0%) |
| Total Housing Units | 66 (85.7%) | 11 (14.3%) |
Occupancy by Educational Attainment in Elgin borough
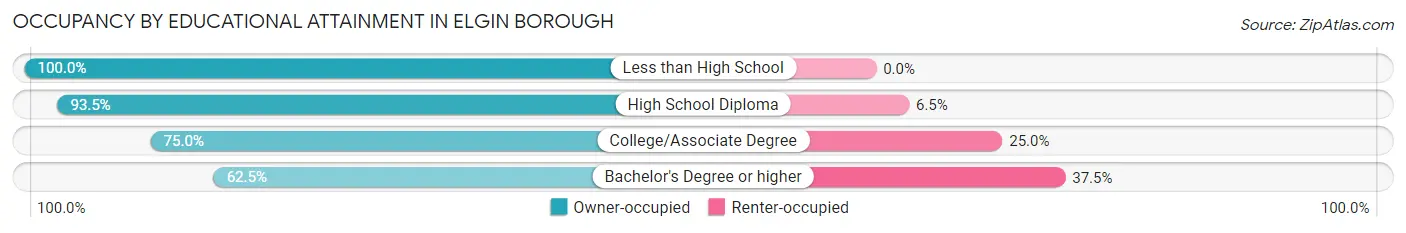
| Household Size | Owner-occupied | Renter-occupied |
| Less than High School | 3 (100.0%) | 0 (0.0%) |
| High School Diploma | 43 (93.5%) | 3 (6.5%) |
| College/Associate Degree | 15 (75.0%) | 5 (25.0%) |
| Bachelor's Degree or higher | 5 (62.5%) | 3 (37.5%) |
Occupancy by Age of Householder in Elgin borough
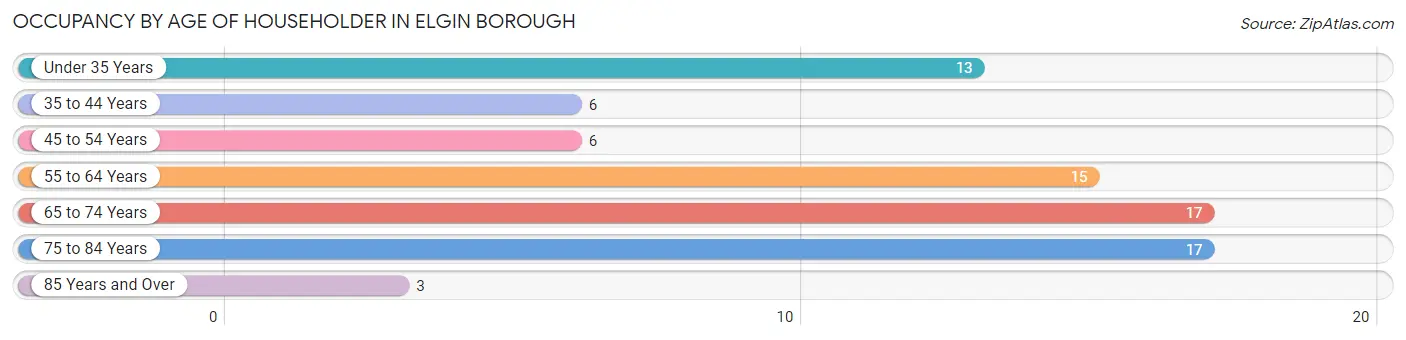
| Age Bracket | # Households | % Households |
| Under 35 Years | 13 | 16.9% |
| 35 to 44 Years | 6 | 7.8% |
| 45 to 54 Years | 6 | 7.8% |
| 55 to 64 Years | 15 | 19.5% |
| 65 to 74 Years | 17 | 22.1% |
| 75 to 84 Years | 17 | 22.1% |
| 85 Years and Over | 3 | 3.9% |
| Total | 77 | 100.0% |
Housing Finances in Elgin borough
Median Income by Occupancy in Elgin borough
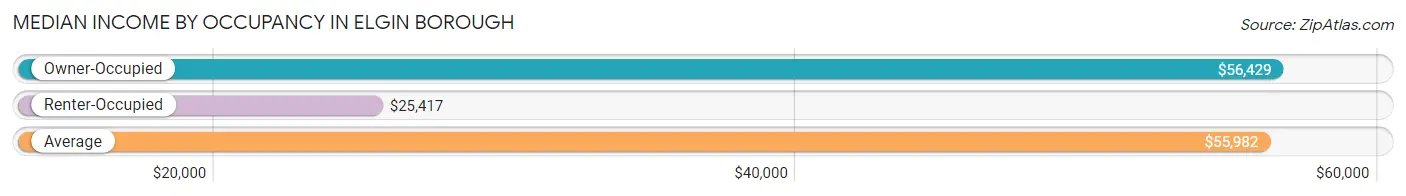
| Occupancy Type | # Households | Median Income |
| Owner-Occupied | 66 (85.7%) | $56,429 |
| Renter-Occupied | 11 (14.3%) | $25,417 |
| Average | 77 (100.0%) | $55,982 |
Occupancy by Householder Income Bracket in Elgin borough
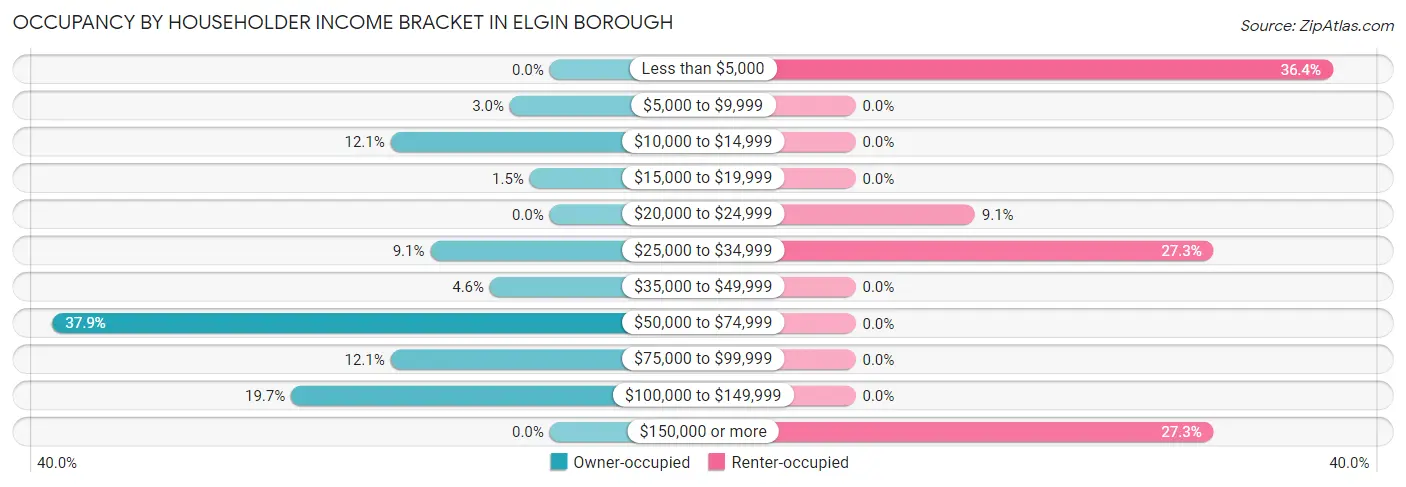
| Income Bracket | Owner-occupied | Renter-occupied |
| Less than $5,000 | 0 (0.0%) | 4 (36.4%) |
| $5,000 to $9,999 | 2 (3.0%) | 0 (0.0%) |
| $10,000 to $14,999 | 8 (12.1%) | 0 (0.0%) |
| $15,000 to $19,999 | 1 (1.5%) | 0 (0.0%) |
| $20,000 to $24,999 | 0 (0.0%) | 1 (9.1%) |
| $25,000 to $34,999 | 6 (9.1%) | 3 (27.3%) |
| $35,000 to $49,999 | 3 (4.5%) | 0 (0.0%) |
| $50,000 to $74,999 | 25 (37.9%) | 0 (0.0%) |
| $75,000 to $99,999 | 8 (12.1%) | 0 (0.0%) |
| $100,000 to $149,999 | 13 (19.7%) | 0 (0.0%) |
| $150,000 or more | 0 (0.0%) | 3 (27.3%) |
| Total | 66 (100.0%) | 11 (100.0%) |
Monthly Housing Cost Tiers in Elgin borough
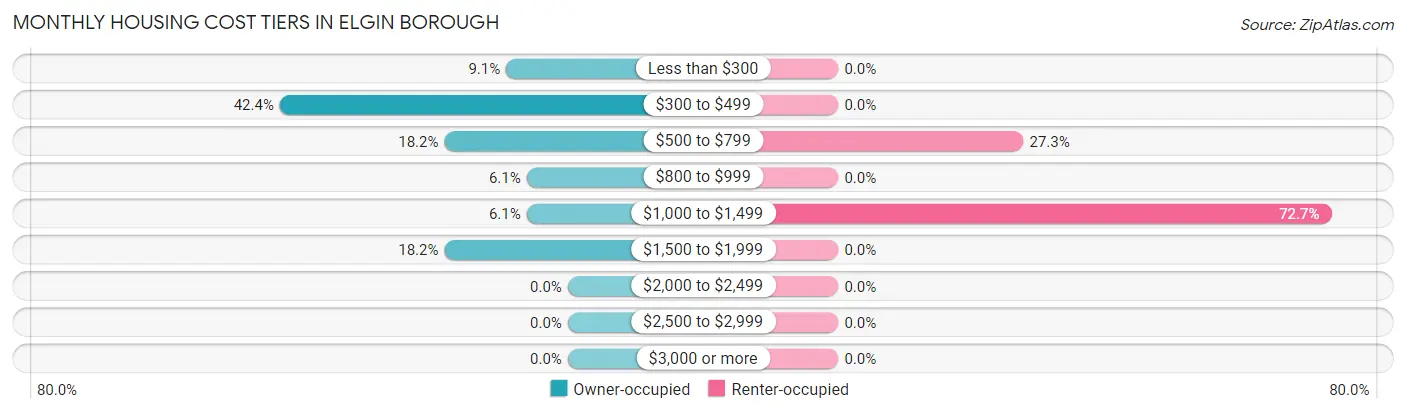
| Monthly Cost | Owner-occupied | Renter-occupied |
| Less than $300 | 6 (9.1%) | 0 (0.0%) |
| $300 to $499 | 28 (42.4%) | 0 (0.0%) |
| $500 to $799 | 12 (18.2%) | 3 (27.3%) |
| $800 to $999 | 4 (6.1%) | 0 (0.0%) |
| $1,000 to $1,499 | 4 (6.1%) | 8 (72.7%) |
| $1,500 to $1,999 | 12 (18.2%) | 0 (0.0%) |
| $2,000 to $2,499 | 0 (0.0%) | 0 (0.0%) |
| $2,500 to $2,999 | 0 (0.0%) | 0 (0.0%) |
| $3,000 or more | 0 (0.0%) | 0 (0.0%) |
| Total | 66 (100.0%) | 11 (100.0%) |
Physical Housing Characteristics in Elgin borough
Housing Structures in Elgin borough
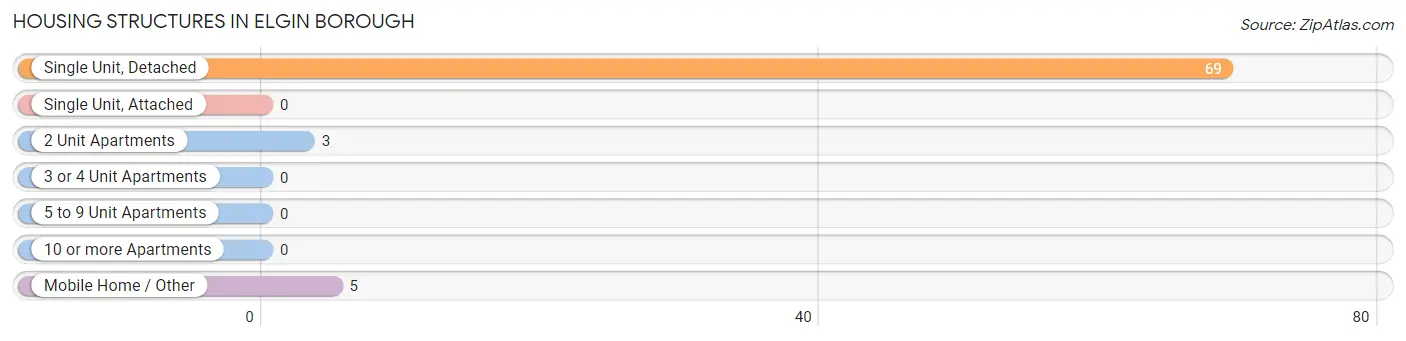
| Structure Type | # Housing Units | % Housing Units |
| Single Unit, Detached | 69 | 89.6% |
| Single Unit, Attached | 0 | 0.0% |
| 2 Unit Apartments | 3 | 3.9% |
| 3 or 4 Unit Apartments | 0 | 0.0% |
| 5 to 9 Unit Apartments | 0 | 0.0% |
| 10 or more Apartments | 0 | 0.0% |
| Mobile Home / Other | 5 | 6.5% |
| Total | 77 | 100.0% |
Housing Structures by Occupancy in Elgin borough
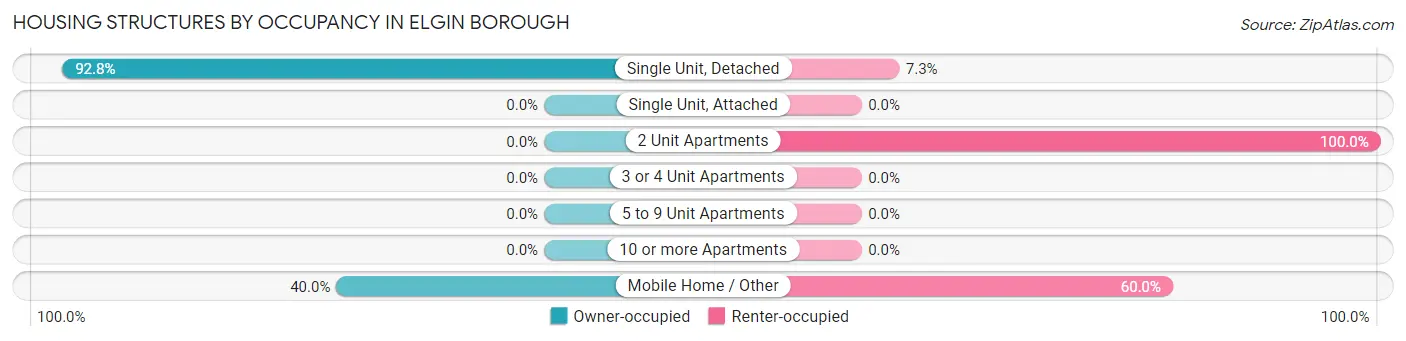
| Structure Type | Owner-occupied | Renter-occupied |
| Single Unit, Detached | 64 (92.7%) | 5 (7.2%) |
| Single Unit, Attached | 0 (0.0%) | 0 (0.0%) |
| 2 Unit Apartments | 0 (0.0%) | 3 (100.0%) |
| 3 or 4 Unit Apartments | 0 (0.0%) | 0 (0.0%) |
| 5 to 9 Unit Apartments | 0 (0.0%) | 0 (0.0%) |
| 10 or more Apartments | 0 (0.0%) | 0 (0.0%) |
| Mobile Home / Other | 2 (40.0%) | 3 (60.0%) |
| Total | 66 (85.7%) | 11 (14.3%) |
Housing Structures by Number of Rooms in Elgin borough
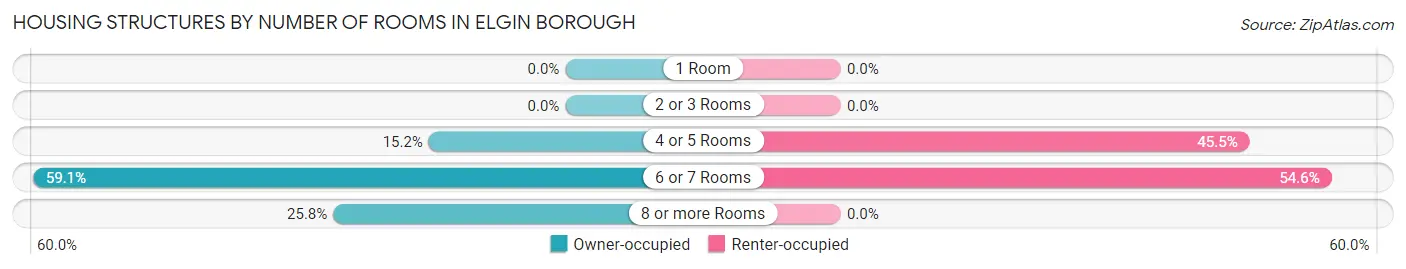
| Number of Rooms | Owner-occupied | Renter-occupied |
| 1 Room | 0 (0.0%) | 0 (0.0%) |
| 2 or 3 Rooms | 0 (0.0%) | 0 (0.0%) |
| 4 or 5 Rooms | 10 (15.1%) | 5 (45.5%) |
| 6 or 7 Rooms | 39 (59.1%) | 6 (54.5%) |
| 8 or more Rooms | 17 (25.8%) | 0 (0.0%) |
| Total | 66 (100.0%) | 11 (100.0%) |
Housing Structure by Heating Type in Elgin borough
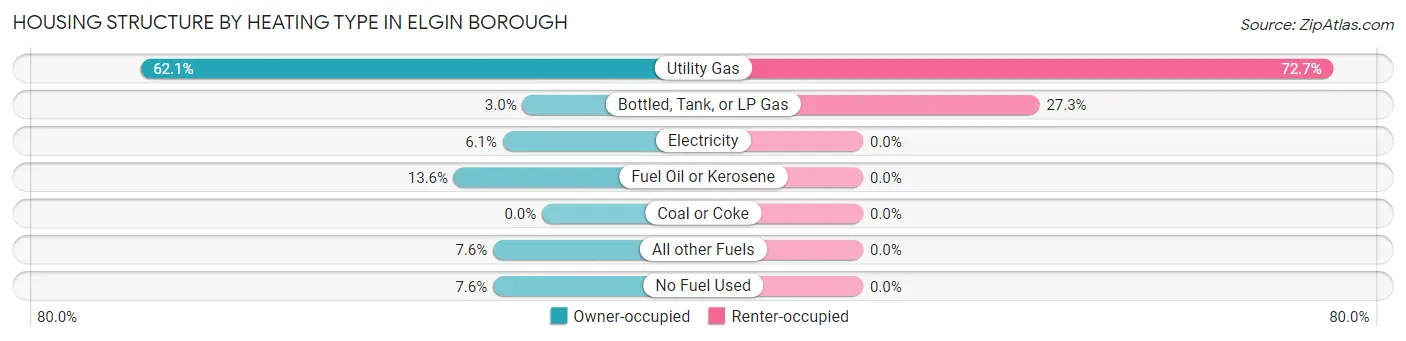
| Heating Type | Owner-occupied | Renter-occupied |
| Utility Gas | 41 (62.1%) | 8 (72.7%) |
| Bottled, Tank, or LP Gas | 2 (3.0%) | 3 (27.3%) |
| Electricity | 4 (6.1%) | 0 (0.0%) |
| Fuel Oil or Kerosene | 9 (13.6%) | 0 (0.0%) |
| Coal or Coke | 0 (0.0%) | 0 (0.0%) |
| All other Fuels | 5 (7.6%) | 0 (0.0%) |
| No Fuel Used | 5 (7.6%) | 0 (0.0%) |
| Total | 66 (100.0%) | 11 (100.0%) |
Household Vehicle Usage in Elgin borough
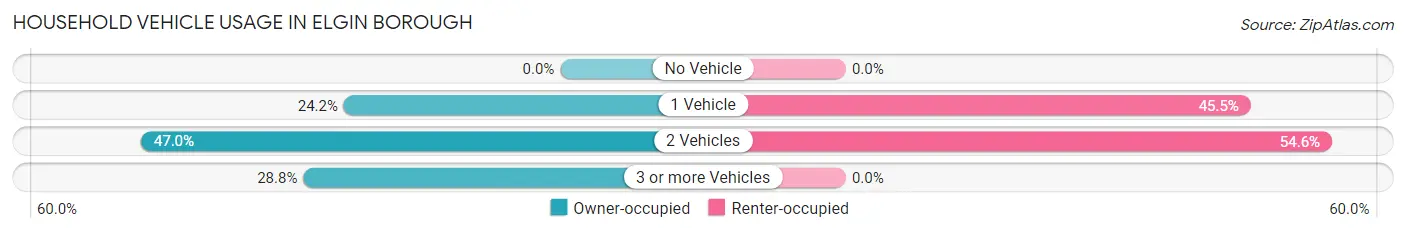
| Vehicles per Household | Owner-occupied | Renter-occupied |
| No Vehicle | 0 (0.0%) | 0 (0.0%) |
| 1 Vehicle | 16 (24.2%) | 5 (45.5%) |
| 2 Vehicles | 31 (47.0%) | 6 (54.5%) |
| 3 or more Vehicles | 19 (28.8%) | 0 (0.0%) |
| Total | 66 (100.0%) | 11 (100.0%) |
Real Estate & Mortgages in Elgin borough
Real Estate and Mortgage Overview in Elgin borough
| Characteristic | Without Mortgage | With Mortgage |
| Housing Units | 39 | 27 |
| Median Property Value | $86,500 | $92,500 |
| Median Household Income | $51,750 | $0 |
| Monthly Housing Costs | $431 | $0 |
| Real Estate Taxes | $1,635 | $0 |
Property Value by Mortgage Status in Elgin borough
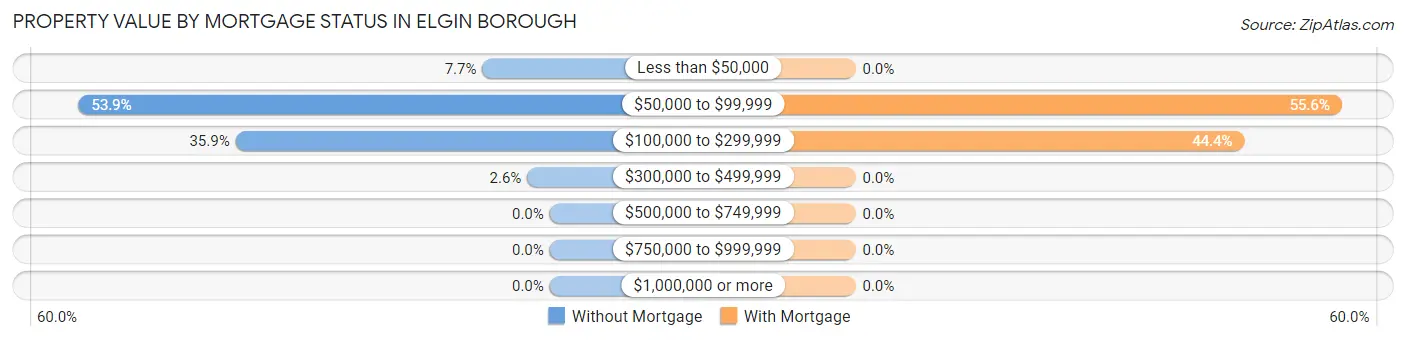
| Property Value | Without Mortgage | With Mortgage |
| Less than $50,000 | 3 (7.7%) | 0 (0.0%) |
| $50,000 to $99,999 | 21 (53.8%) | 15 (55.6%) |
| $100,000 to $299,999 | 14 (35.9%) | 12 (44.4%) |
| $300,000 to $499,999 | 1 (2.6%) | 0 (0.0%) |
| $500,000 to $749,999 | 0 (0.0%) | 0 (0.0%) |
| $750,000 to $999,999 | 0 (0.0%) | 0 (0.0%) |
| $1,000,000 or more | 0 (0.0%) | 0 (0.0%) |
| Total | 39 (100.0%) | 27 (100.0%) |
Household Income by Mortgage Status in Elgin borough
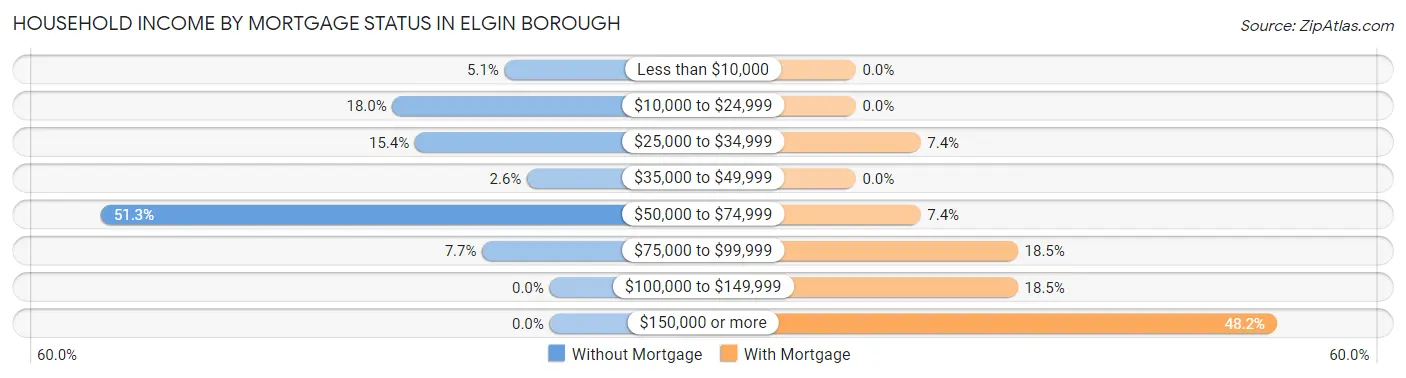
| Household Income | Without Mortgage | With Mortgage |
| Less than $10,000 | 2 (5.1%) | 0 (0.0%) |
| $10,000 to $24,999 | 7 (17.9%) | 0 (0.0%) |
| $25,000 to $34,999 | 6 (15.4%) | 2 (7.4%) |
| $35,000 to $49,999 | 1 (2.6%) | 0 (0.0%) |
| $50,000 to $74,999 | 20 (51.3%) | 2 (7.4%) |
| $75,000 to $99,999 | 3 (7.7%) | 5 (18.5%) |
| $100,000 to $149,999 | 0 (0.0%) | 5 (18.5%) |
| $150,000 or more | 0 (0.0%) | 13 (48.1%) |
| Total | 39 (100.0%) | 27 (100.0%) |
Property Value to Household Income Ratio in Elgin borough
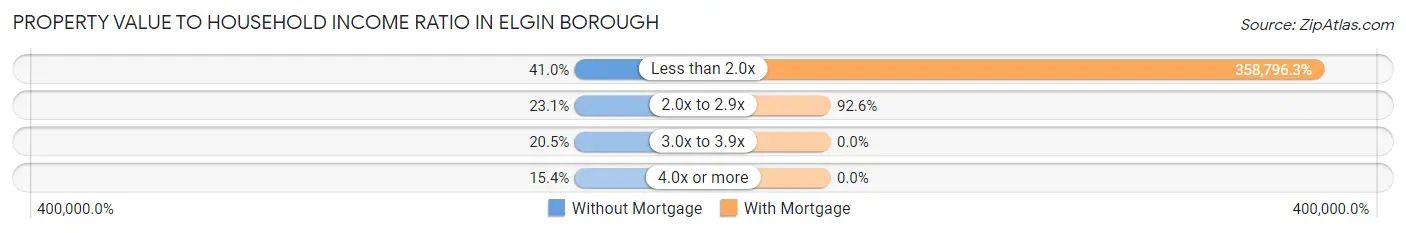
| Value-to-Income Ratio | Without Mortgage | With Mortgage |
| Less than 2.0x | 16 (41.0%) | 96,875 (358,796.3%) |
| 2.0x to 2.9x | 9 (23.1%) | 25 (92.6%) |
| 3.0x to 3.9x | 8 (20.5%) | 0 (0.0%) |
| 4.0x or more | 6 (15.4%) | 0 (0.0%) |
| Total | 39 (100.0%) | 27 (100.0%) |
Real Estate Taxes by Mortgage Status in Elgin borough
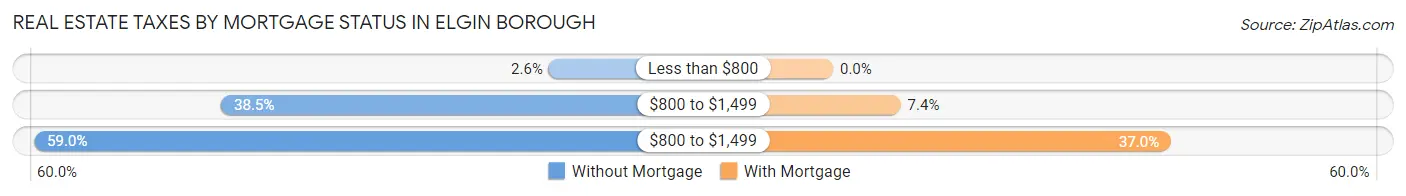
| Property Taxes | Without Mortgage | With Mortgage |
| Less than $800 | 1 (2.6%) | 0 (0.0%) |
| $800 to $1,499 | 15 (38.5%) | 2 (7.4%) |
| $800 to $1,499 | 23 (59.0%) | 10 (37.0%) |
| Total | 39 (100.0%) | 27 (100.0%) |
Health & Disability in Elgin borough
Health Insurance Coverage by Age in Elgin borough
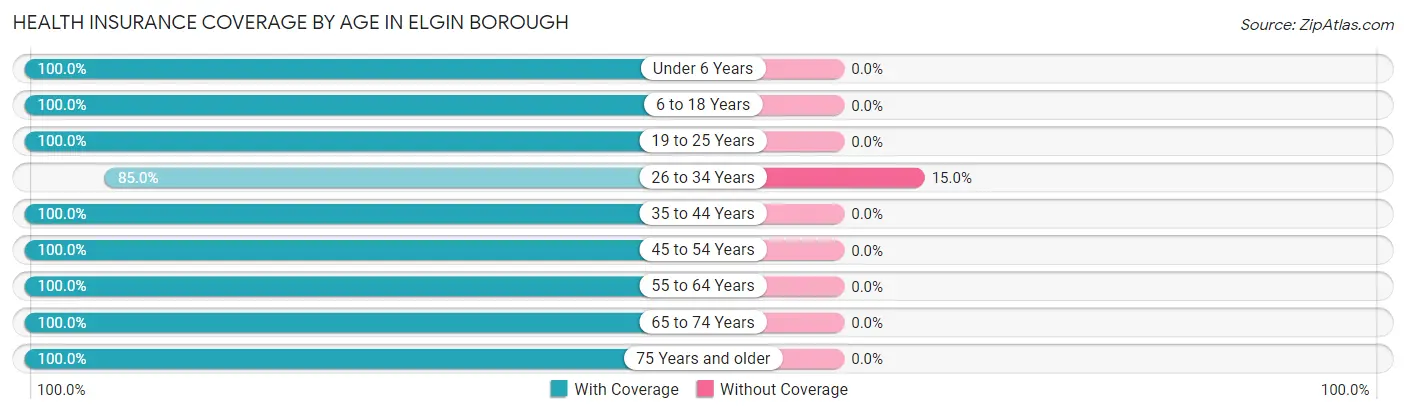
| Age Bracket | With Coverage | Without Coverage |
| Under 6 Years | 8 (100.0%) | 0 (0.0%) |
| 6 to 18 Years | 27 (100.0%) | 0 (0.0%) |
| 19 to 25 Years | 4 (100.0%) | 0 (0.0%) |
| 26 to 34 Years | 34 (85.0%) | 6 (15.0%) |
| 35 to 44 Years | 13 (100.0%) | 0 (0.0%) |
| 45 to 54 Years | 41 (100.0%) | 0 (0.0%) |
| 55 to 64 Years | 23 (100.0%) | 0 (0.0%) |
| 65 to 74 Years | 26 (100.0%) | 0 (0.0%) |
| 75 Years and older | 50 (100.0%) | 0 (0.0%) |
| Total | 226 (97.4%) | 6 (2.6%) |
Health Insurance Coverage by Citizenship Status in Elgin borough
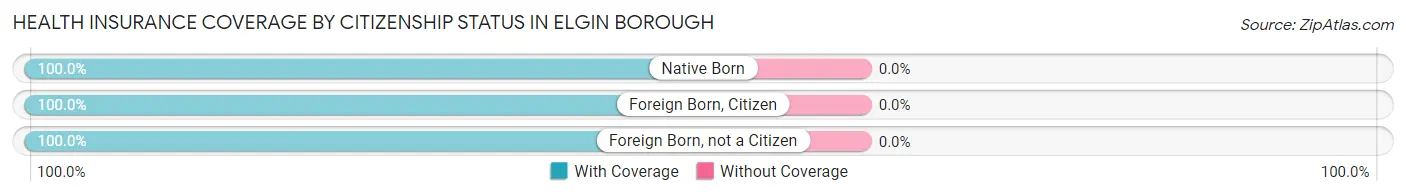
| Citizenship Status | With Coverage | Without Coverage |
| Native Born | 8 (100.0%) | 0 (0.0%) |
| Foreign Born, Citizen | 27 (100.0%) | 0 (0.0%) |
| Foreign Born, not a Citizen | 4 (100.0%) | 0 (0.0%) |
Health Insurance Coverage by Household Income in Elgin borough
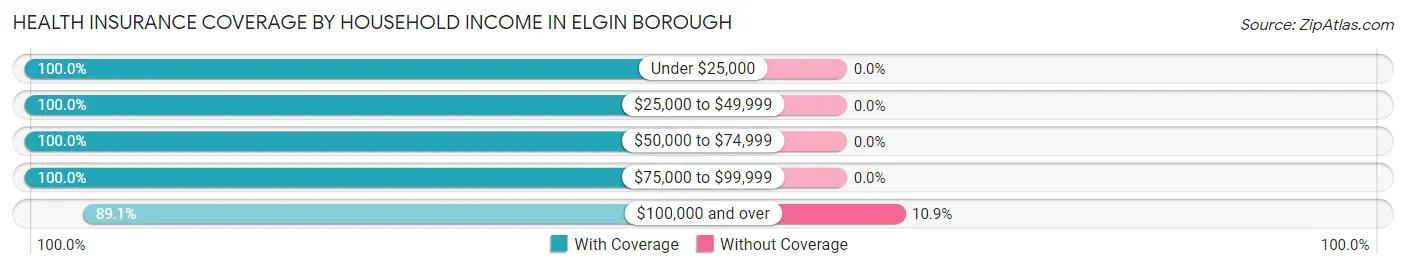
| Household Income | With Coverage | Without Coverage |
| Under $25,000 | 24 (100.0%) | 0 (0.0%) |
| $25,000 to $49,999 | 18 (100.0%) | 0 (0.0%) |
| $50,000 to $74,999 | 100 (100.0%) | 0 (0.0%) |
| $75,000 to $99,999 | 35 (100.0%) | 0 (0.0%) |
| $100,000 and over | 49 (89.1%) | 6 (10.9%) |
Public vs Private Health Insurance Coverage by Age in Elgin borough
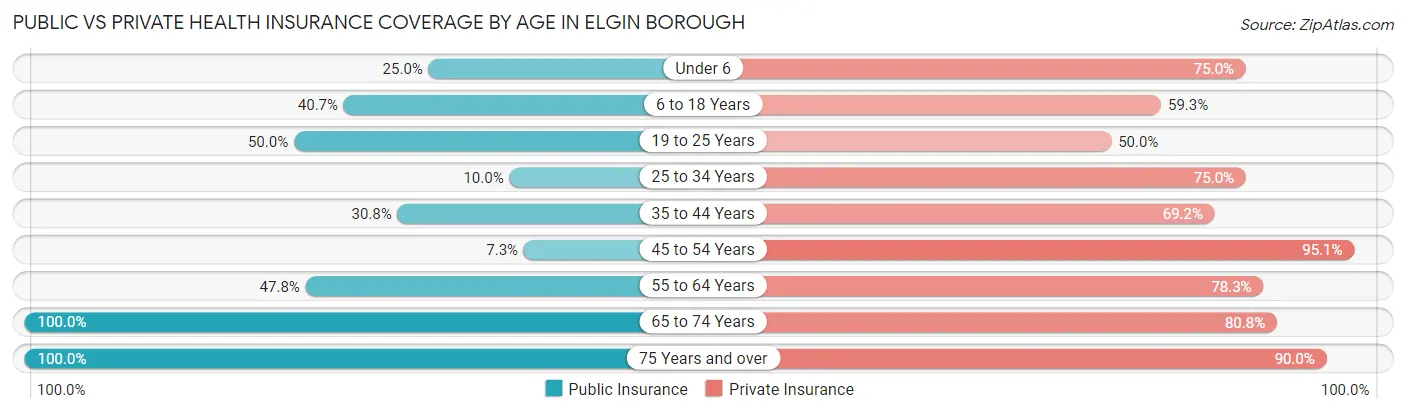
| Age Bracket | Public Insurance | Private Insurance |
| Under 6 | 2 (25.0%) | 6 (75.0%) |
| 6 to 18 Years | 11 (40.7%) | 16 (59.3%) |
| 19 to 25 Years | 2 (50.0%) | 2 (50.0%) |
| 25 to 34 Years | 4 (10.0%) | 30 (75.0%) |
| 35 to 44 Years | 4 (30.8%) | 9 (69.2%) |
| 45 to 54 Years | 3 (7.3%) | 39 (95.1%) |
| 55 to 64 Years | 11 (47.8%) | 18 (78.3%) |
| 65 to 74 Years | 26 (100.0%) | 21 (80.8%) |
| 75 Years and over | 50 (100.0%) | 45 (90.0%) |
| Total | 113 (48.7%) | 186 (80.2%) |
Disability Status by Sex by Age in Elgin borough
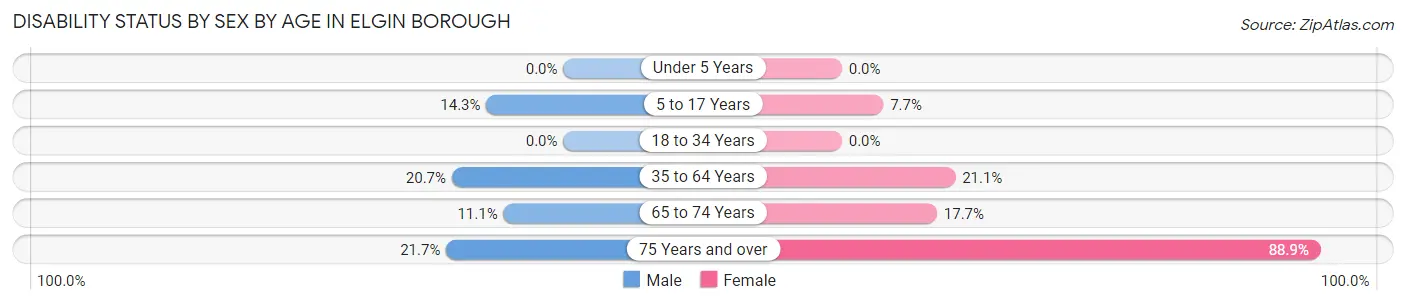
| Age Bracket | Male | Female |
| Under 5 Years | 0 (0.0%) | 0 (0.0%) |
| 5 to 17 Years | 2 (14.3%) | 1 (7.7%) |
| 18 to 34 Years | 0 (0.0%) | 0 (0.0%) |
| 35 to 64 Years | 12 (20.7%) | 4 (21.0%) |
| 65 to 74 Years | 1 (11.1%) | 3 (17.6%) |
| 75 Years and over | 5 (21.7%) | 24 (88.9%) |
Disability Class by Sex by Age in Elgin borough
Disability Class: Hearing Difficulty
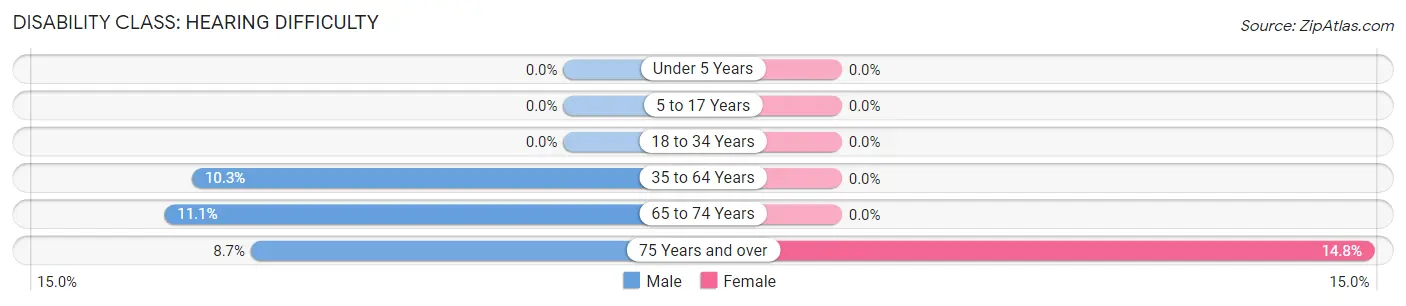
| Age Bracket | Male | Female |
| Under 5 Years | 0 (0.0%) | 0 (0.0%) |
| 5 to 17 Years | 0 (0.0%) | 0 (0.0%) |
| 18 to 34 Years | 0 (0.0%) | 0 (0.0%) |
| 35 to 64 Years | 6 (10.3%) | 0 (0.0%) |
| 65 to 74 Years | 1 (11.1%) | 0 (0.0%) |
| 75 Years and over | 2 (8.7%) | 4 (14.8%) |
Disability Class: Vision Difficulty
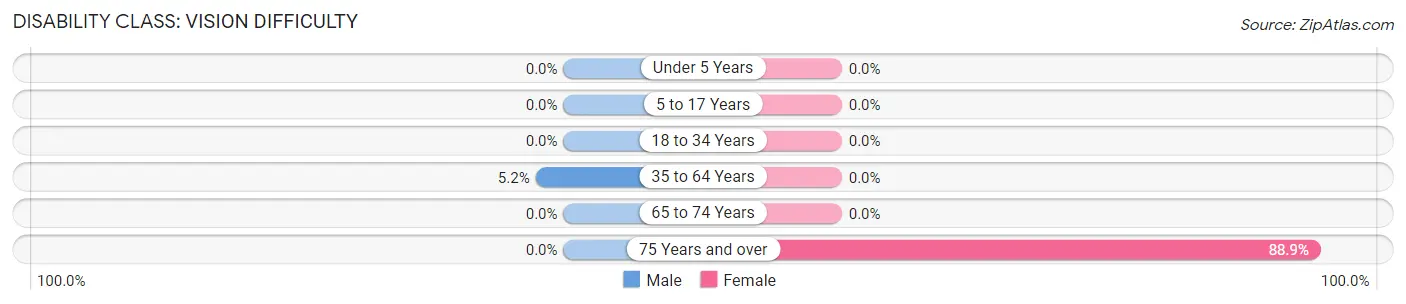
| Age Bracket | Male | Female |
| Under 5 Years | 0 (0.0%) | 0 (0.0%) |
| 5 to 17 Years | 0 (0.0%) | 0 (0.0%) |
| 18 to 34 Years | 0 (0.0%) | 0 (0.0%) |
| 35 to 64 Years | 3 (5.2%) | 0 (0.0%) |
| 65 to 74 Years | 0 (0.0%) | 0 (0.0%) |
| 75 Years and over | 0 (0.0%) | 24 (88.9%) |
Disability Class: Cognitive Difficulty
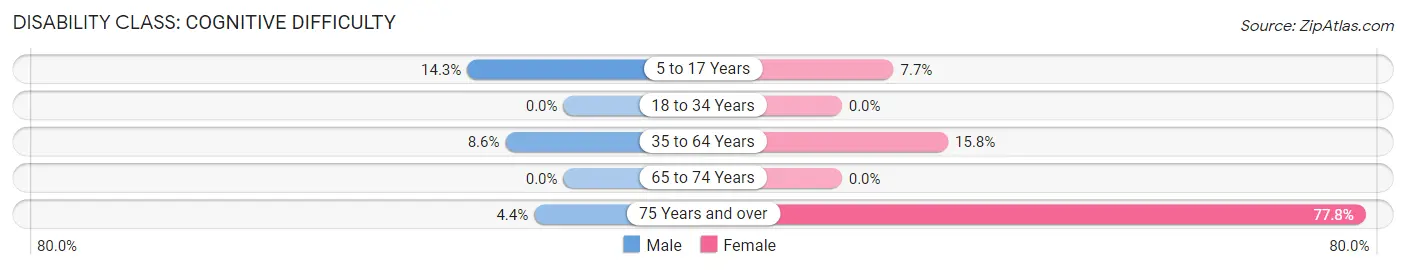
| Age Bracket | Male | Female |
| 5 to 17 Years | 2 (14.3%) | 1 (7.7%) |
| 18 to 34 Years | 0 (0.0%) | 0 (0.0%) |
| 35 to 64 Years | 5 (8.6%) | 3 (15.8%) |
| 65 to 74 Years | 0 (0.0%) | 0 (0.0%) |
| 75 Years and over | 1 (4.3%) | 21 (77.8%) |
Disability Class: Ambulatory Difficulty
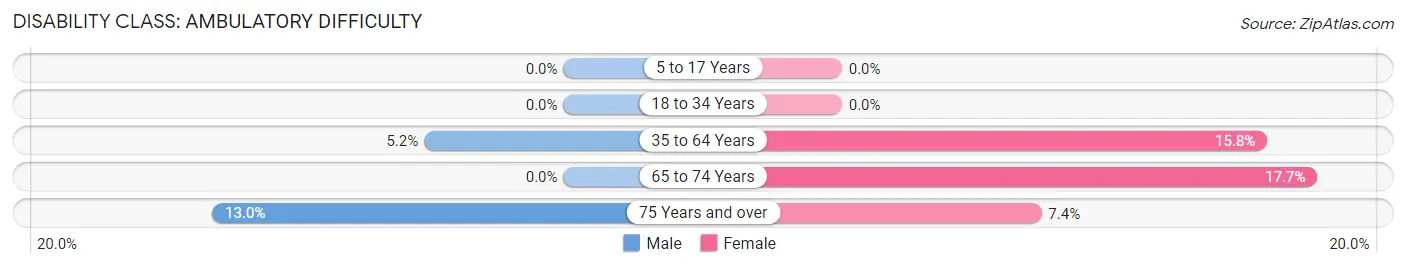
| Age Bracket | Male | Female |
| 5 to 17 Years | 0 (0.0%) | 0 (0.0%) |
| 18 to 34 Years | 0 (0.0%) | 0 (0.0%) |
| 35 to 64 Years | 3 (5.2%) | 3 (15.8%) |
| 65 to 74 Years | 0 (0.0%) | 3 (17.6%) |
| 75 Years and over | 3 (13.0%) | 2 (7.4%) |
Disability Class: Self-Care Difficulty

| Age Bracket | Male | Female |
| 5 to 17 Years | 0 (0.0%) | 0 (0.0%) |
| 18 to 34 Years | 0 (0.0%) | 0 (0.0%) |
| 35 to 64 Years | 0 (0.0%) | 2 (10.5%) |
| 65 to 74 Years | 0 (0.0%) | 0 (0.0%) |
| 75 Years and over | 1 (4.3%) | 2 (7.4%) |
Technology Access in Elgin borough
Computing Device Access in Elgin borough
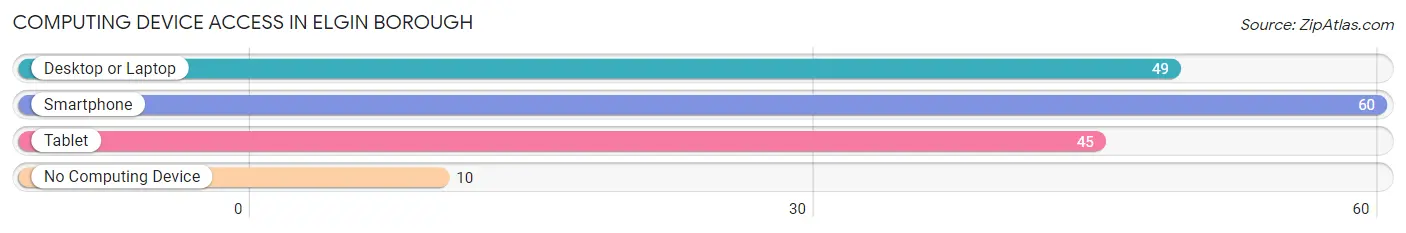
| Device Type | # Households | % Households |
| Desktop or Laptop | 49 | 63.6% |
| Smartphone | 60 | 77.9% |
| Tablet | 45 | 58.4% |
| No Computing Device | 10 | 13.0% |
| Total | 77 | 100.0% |
Internet Access in Elgin borough
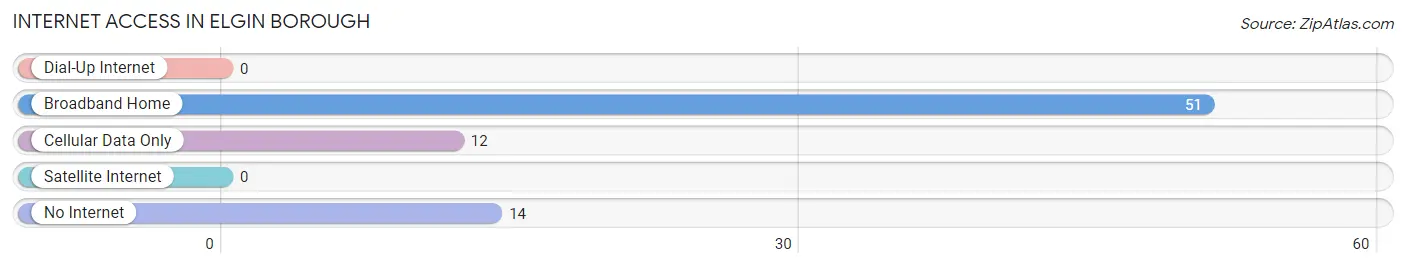
| Internet Type | # Households | % Households |
| Dial-Up Internet | 0 | 0.0% |
| Broadband Home | 51 | 66.2% |
| Cellular Data Only | 12 | 15.6% |
| Satellite Internet | 0 | 0.0% |
| No Internet | 14 | 18.2% |
| Total | 77 | 100.0% |
Elgin borough Summary
Elgin Borough is a small borough located in the state of Pennsylvania. It is situated in the northwest corner of the state, in the county of Warren. The borough is bordered by the townships of Conewango, Mead, and Sheffield. Elgin Borough is home to a population of approximately 1,000 people, and is part of the Warren County School District.
History
Elgin Borough was founded in 1845 by a group of settlers from the nearby town of Sheffield. The settlers were looking for a place to settle and build a community, and they chose the area that is now Elgin Borough. The town was named after the nearby Elgin Creek, which was named after the Elgin family who had settled in the area in the early 1800s.
The first settlers of Elgin Borough were mostly farmers, and the town quickly grew to become a thriving agricultural community. The town was also home to a number of small businesses, including a sawmill, a gristmill, and a blacksmith shop.
In the late 1800s, the town began to experience a period of growth and development. The railroad was extended to Elgin Borough in 1887, and the town soon became a popular destination for tourists and vacationers. The town also became a popular spot for hunting and fishing, and the population of Elgin Borough began to grow.
By the early 1900s, Elgin Borough had become a bustling small town. The town was home to a number of businesses, including a bank, a post office, a hotel, and a number of stores. The town also had a number of churches, and a school was built in the early 1900s.
Geography
Elgin Borough is located in the northwest corner of Pennsylvania, in the county of Warren. The borough is bordered by the townships of Conewango, Mead, and Sheffield. Elgin Borough is situated in a rural area, and is surrounded by rolling hills and forests. The borough is located approximately 30 miles from the city of Erie, and is approximately 90 miles from the state capital of Harrisburg.
The climate in Elgin Borough is typical of the region, with cold winters and warm summers. The average temperature in the winter is around 25 degrees Fahrenheit, and the average temperature in the summer is around 75 degrees Fahrenheit. The area receives an average of 40 inches of precipitation per year.
Economy
The economy of Elgin Borough is largely based on agriculture and tourism. The town is home to a number of farms, and the surrounding area is known for its production of dairy products, fruits, and vegetables. The town is also home to a number of small businesses, including restaurants, shops, and other services.
Tourism is also an important part of the economy of Elgin Borough. The town is home to a number of attractions, including the Elgin Creek Wildlife Area, the Elgin Creek Nature Center, and the Elgin Creek State Park. The town is also home to a number of festivals and events throughout the year, including the Elgin County Fair and the Elgin County Music Festival.
Demographics
As of the 2010 census, the population of Elgin Borough was 1,000 people. The racial makeup of the town was 97.2% White, 0.7% African American, 0.2% Native American, 0.2% Asian, 0.2% from other races, and 1.7% from two or more races. The median household income in Elgin Borough was $37,500, and the median family income was $45,000. The per capita income in Elgin Borough was $18,000.
Common Questions
What is the Total Population of Elgin borough?
Total Population of Elgin borough is 232.
What is the Total Male Population of Elgin borough?
Total Male Population of Elgin borough is 136.
What is the Total Female Population of Elgin borough?
Total Female Population of Elgin borough is 96.
What is the Ratio of Males per 100 Females in Elgin borough?
There are 141.67 Males per 100 Females in Elgin borough.
What is the Ratio of Females per 100 Males in Elgin borough?
There are 70.59 Females per 100 Males in Elgin borough.
What is the Median Population Age in Elgin borough?
Median Population Age in Elgin borough is 54.4 Years.
What is the Average Family Size in Elgin borough
Average Family Size in Elgin borough is 3.6 People.
What is the Average Household Size in Elgin borough
Average Household Size in Elgin borough is 3.0 People.
What is Per Capita Income in Elgin borough?
Per Capita income in Elgin borough is $22,337.
What is the Median Family Income in Elgin borough?
Median Family Income in Elgin borough is $57,321.
What is the Median Household income in Elgin borough?
Median Household Income in Elgin borough is $55,982.
What is Inequality or Gini Index in Elgin borough?
Inequality or Gini Index in Elgin borough is 0.39.
How Large is the Labor Force in Elgin borough?
There are 105 People in the Labor Forcein in Elgin borough.
What is the Percentage of People in the Labor Force in Elgin borough?
52.5% of People are in the Labor Force in Elgin borough.
What is the Unemployment Rate in Elgin borough?
Unemployment Rate in Elgin borough is 2.9%.