Hooversville borough, PA
Hooversville borough Overview
722
TOTAL POPULATION
396
MALE POPULATION
326
FEMALE POPULATION
121.47
MALES / 100 FEMALES
82.32
FEMALES / 100 MALES
43.5
MEDIAN AGE
3.2
AVG FAMILY SIZE
2.5
AVG HOUSEHOLD SIZE
$23,719
PER CAPITA INCOME
$61,319
AVG FAMILY INCOME
$43,750
AVG HOUSEHOLD INCOME
13.4%
WAGE / INCOME GAP [ % ]
86.6¢/ $1
WAGE / INCOME GAP [ $ ]
0.35
INEQUALITY / GINI INDEX
352
LABOR FORCE [ PEOPLE ]
58.9%
PERCENT IN LABOR FORCE
3.1%
UNEMPLOYMENT RATE
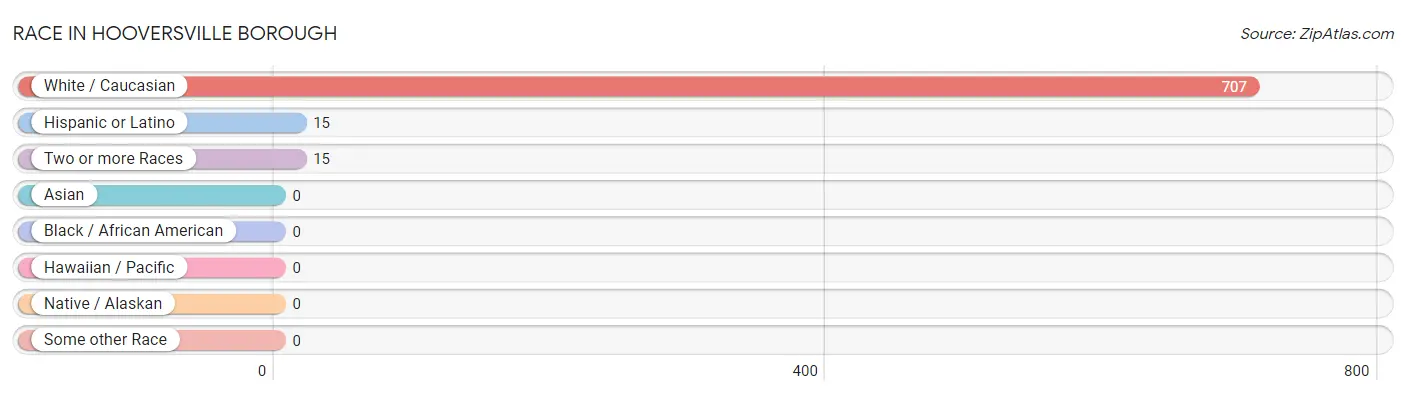
Race in Hooversville borough
The most populous races in Hooversville borough are White / Caucasian (707 | 97.9%), Hispanic or Latino (15 | 2.1%), and Two or more Races (15 | 2.1%).
| Race | # Population | % Population |
| Asian | 0 | 0.0% |
| Black / African American | 0 | 0.0% |
| Hawaiian / Pacific | 0 | 0.0% |
| Hispanic or Latino | 15 | 2.1% |
| Native / Alaskan | 0 | 0.0% |
| White / Caucasian | 707 | 97.9% |
| Two or more Races | 15 | 2.1% |
| Some other Race | 0 | 0.0% |
| Total | 722 | 100.0% |
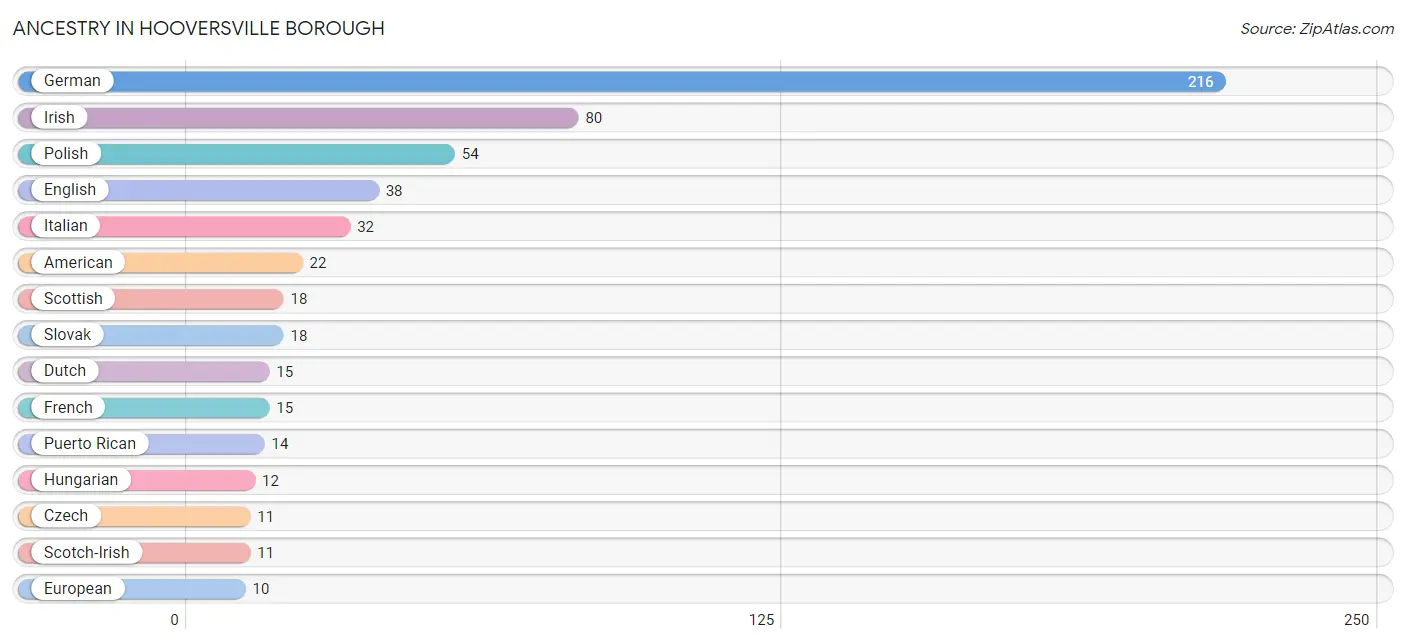
Ancestry in Hooversville borough
The most populous ancestries reported in Hooversville borough are German (216 | 29.9%), Irish (80 | 11.1%), Polish (54 | 7.5%), English (38 | 5.3%), and Italian (32 | 4.4%), together accounting for 58.2% of all Hooversville borough residents.
| Ancestry | # Population | % Population |
| American | 22 | 3.0% |
| Austrian | 6 | 0.8% |
| British | 5 | 0.7% |
| Croatian | 2 | 0.3% |
| Czech | 11 | 1.5% |
| Dutch | 15 | 2.1% |
| English | 38 | 5.3% |
| European | 10 | 1.4% |
| French | 15 | 2.1% |
| German | 216 | 29.9% |
| Hungarian | 12 | 1.7% |
| Irish | 80 | 11.1% |
| Italian | 32 | 4.4% |
| Mexican | 1 | 0.1% |
| Polish | 54 | 7.5% |
| Portuguese | 2 | 0.3% |
| Puerto Rican | 14 | 1.9% |
| Russian | 6 | 0.8% |
| Scotch-Irish | 11 | 1.5% |
| Scottish | 18 | 2.5% |
| Serbian | 1 | 0.1% |
| Slovak | 18 | 2.5% |
| Slovene | 4 | 0.5% |
| Welsh | 3 | 0.4% | View All 24 Rows |
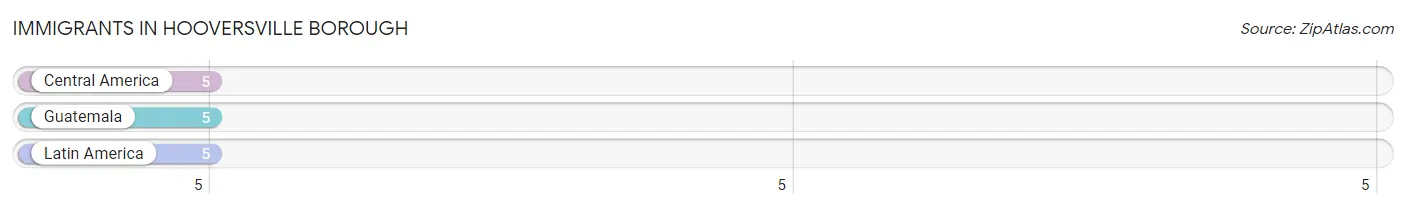
Immigrants in Hooversville borough
The most numerous immigrant groups reported in Hooversville borough came from Central America (5 | 0.7%), Guatemala (5 | 0.7%), and Latin America (5 | 0.7%), together accounting for 2.1% of all Hooversville borough residents.
| Immigration Origin | # Population | % Population |
| Central America | 5 | 0.7% |
| Guatemala | 5 | 0.7% |
| Latin America | 5 | 0.7% | View All 3 Rows |
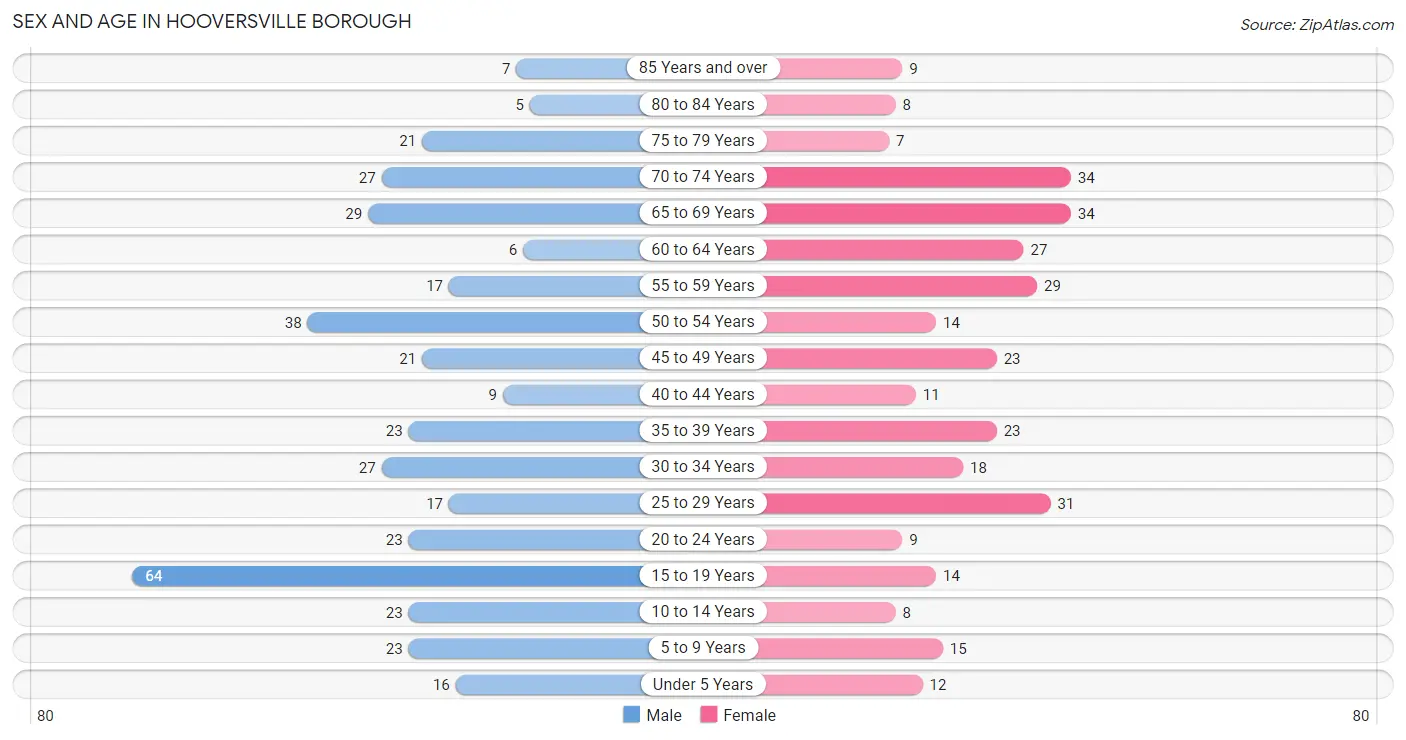
Sex and Age in Hooversville borough
Sex and Age in Hooversville borough
The most populous age groups in Hooversville borough are 15 to 19 Years (64 | 16.2%) for men and 65 to 69 Years (34 | 10.4%) for women.
| Age Bracket | Male | Female |
| Under 5 Years | 16 (4.0%) | 12 (3.7%) |
| 5 to 9 Years | 23 (5.8%) | 15 (4.6%) |
| 10 to 14 Years | 23 (5.8%) | 8 (2.5%) |
| 15 to 19 Years | 64 (16.2%) | 14 (4.3%) |
| 20 to 24 Years | 23 (5.8%) | 9 (2.8%) |
| 25 to 29 Years | 17 (4.3%) | 31 (9.5%) |
| 30 to 34 Years | 27 (6.8%) | 18 (5.5%) |
| 35 to 39 Years | 23 (5.8%) | 23 (7.1%) |
| 40 to 44 Years | 9 (2.3%) | 11 (3.4%) |
| 45 to 49 Years | 21 (5.3%) | 23 (7.1%) |
| 50 to 54 Years | 38 (9.6%) | 14 (4.3%) |
| 55 to 59 Years | 17 (4.3%) | 29 (8.9%) |
| 60 to 64 Years | 6 (1.5%) | 27 (8.3%) |
| 65 to 69 Years | 29 (7.3%) | 34 (10.4%) |
| 70 to 74 Years | 27 (6.8%) | 34 (10.4%) |
| 75 to 79 Years | 21 (5.3%) | 7 (2.1%) |
| 80 to 84 Years | 5 (1.3%) | 8 (2.5%) |
| 85 Years and over | 7 (1.8%) | 9 (2.8%) |
| Total | 396 (100.0%) | 326 (100.0%) |
Families and Households in Hooversville borough
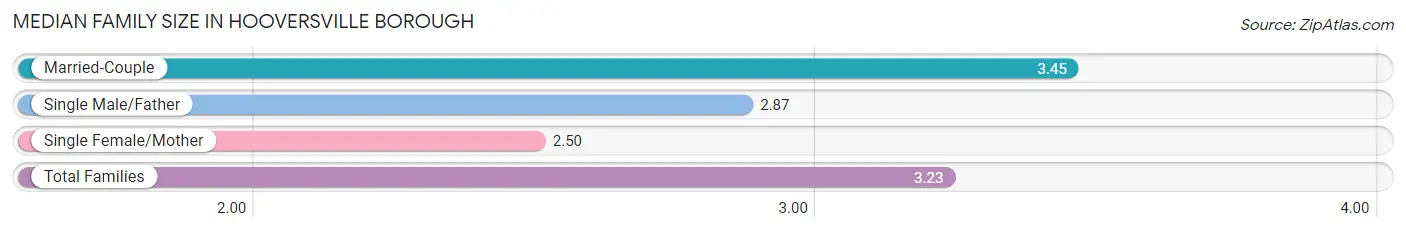
Median Family Size in Hooversville borough
The median family size in Hooversville borough is 3.23 persons per family, with married-couple families (130 | 71.8%) accounting for the largest median family size of 3.45 persons per family. On the other hand, single female/mother families (28 | 15.5%) represent the smallest median family size with 2.50 persons per family.
| Family Type | # Families | Family Size |
| Married-Couple | 130 (71.8%) | 3.45 |
| Single Male/Father | 23 (12.7%) | 2.87 |
| Single Female/Mother | 28 (15.5%) | 2.50 |
| Total Families | 181 (100.0%) | 3.23 |
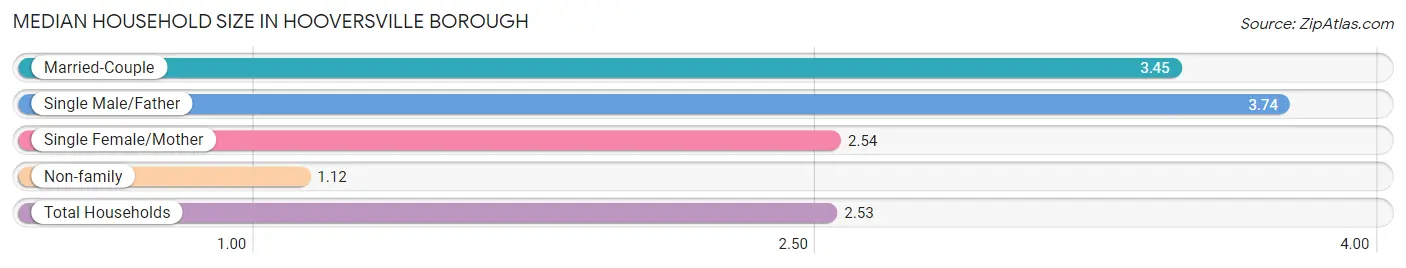
Median Household Size in Hooversville borough
The median household size in Hooversville borough is 2.53 persons per household, with single male/father households (23 | 8.1%) accounting for the largest median household size of 3.74 persons per household. non-family households (104 | 36.5%) represent the smallest median household size with 1.12 persons per household.
| Household Type | # Households | Household Size |
| Married-Couple | 130 (45.6%) | 3.45 |
| Single Male/Father | 23 (8.1%) | 3.74 |
| Single Female/Mother | 28 (9.8%) | 2.54 |
| Non-family | 104 (36.5%) | 1.12 |
| Total Households | 285 (100.0%) | 2.53 |
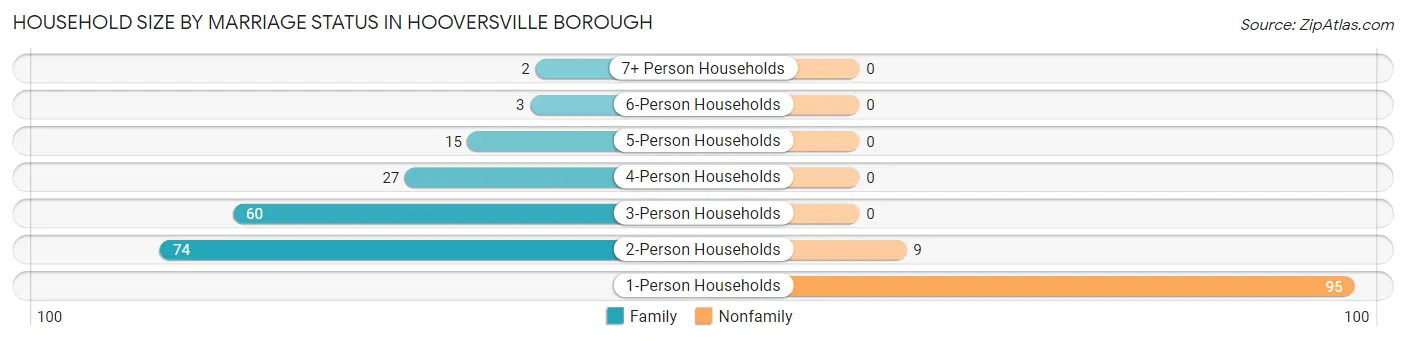
Household Size by Marriage Status in Hooversville borough
Out of a total of 285 households in Hooversville borough, 181 (63.5%) are family households, while 104 (36.5%) are nonfamily households. The most numerous type of family households are 2-person households, comprising 74, and the most common type of nonfamily households are 1-person households, comprising 95.
| Household Size | Family Households | Nonfamily Households |
| 1-Person Households | - | 95 (33.3%) |
| 2-Person Households | 74 (26.0%) | 9 (3.2%) |
| 3-Person Households | 60 (21.0%) | 0 (0.0%) |
| 4-Person Households | 27 (9.5%) | 0 (0.0%) |
| 5-Person Households | 15 (5.3%) | 0 (0.0%) |
| 6-Person Households | 3 (1.1%) | 0 (0.0%) |
| 7+ Person Households | 2 (0.7%) | 0 (0.0%) |
| Total | 181 (63.5%) | 104 (36.5%) |
Female Fertility in Hooversville borough
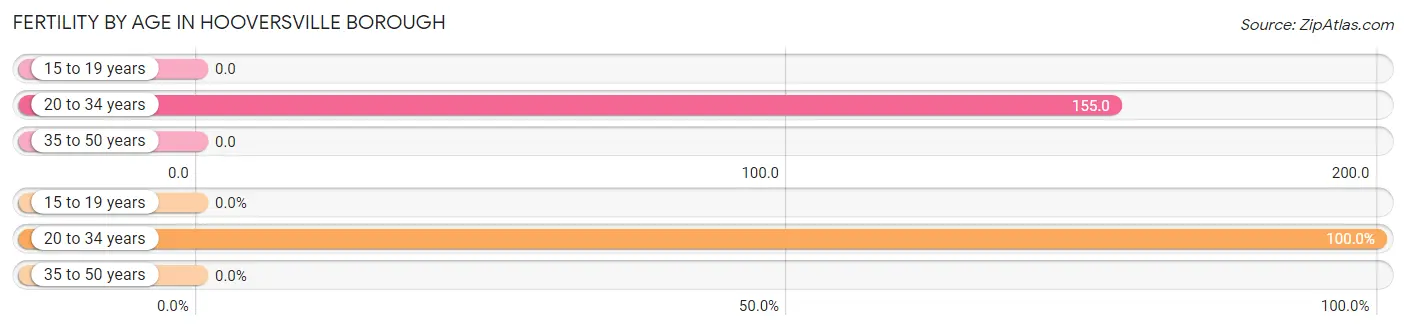
Fertility by Age in Hooversville borough
Average fertility rate in Hooversville borough is 68.0 births per 1,000 women. Women in the age bracket of 20 to 34 years have the highest fertility rate with 155.0 births per 1,000 women. Women in the age bracket of 20 to 34 years acount for 100.0% of all women with births.
| Age Bracket | Women with Births | Births / 1,000 Women |
| 15 to 19 years | 0 (0.0%) | 0.0 |
| 20 to 34 years | 9 (100.0%) | 155.0 |
| 35 to 50 years | 0 (0.0%) | 0.0 |
| Total | 9 (100.0%) | 68.0 |
Fertility by Age by Marriage Status in Hooversville borough
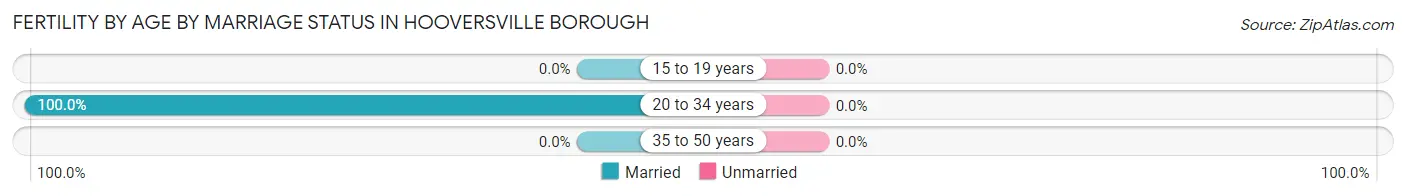
| Age Bracket | Married | Unmarried |
| 15 to 19 years | 0 (0.0%) | 0 (0.0%) |
| 20 to 34 years | 9 (100.0%) | 0 (0.0%) |
| 35 to 50 years | 0 (0.0%) | 0 (0.0%) |
| Total | 9 (100.0%) | 0 (0.0%) |
Fertility by Education in Hooversville borough
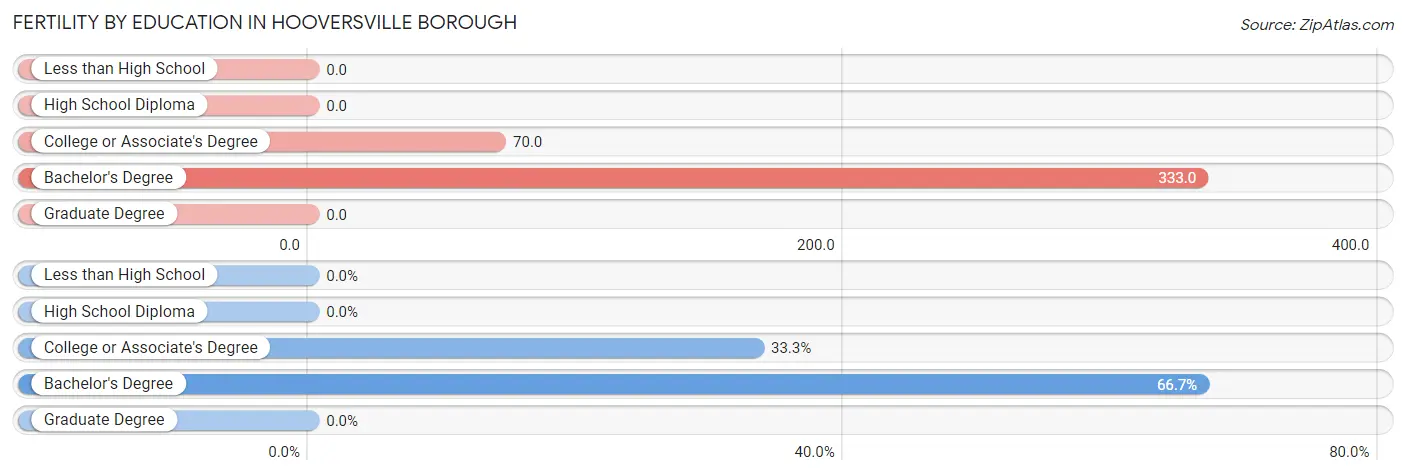
| Educational Attainment | Women with Births | Births / 1,000 Women |
| Less than High School | 0 (0.0%) | 0.0 |
| High School Diploma | 0 (0.0%) | 0.0 |
| College or Associate's Degree | 3 (33.3%) | 70.0 |
| Bachelor's Degree | 6 (66.7%) | 333.0 |
| Graduate Degree | 0 (0.0%) | 0.0 |
| Total | 9 (100.0%) | 68.0 |
Fertility by Education by Marriage Status in Hooversville borough
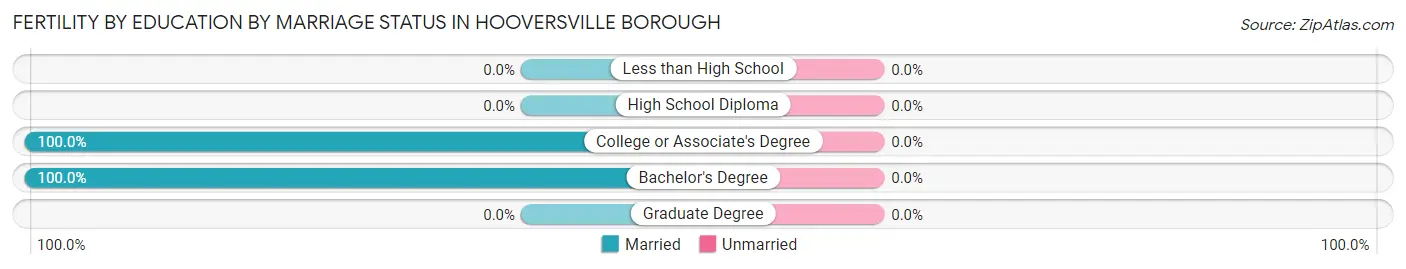
| Educational Attainment | Married | Unmarried |
| Less than High School | 0 (0.0%) | 0 (0.0%) |
| High School Diploma | 0 (0.0%) | 0 (0.0%) |
| College or Associate's Degree | 3 (100.0%) | 0 (0.0%) |
| Bachelor's Degree | 6 (100.0%) | 0 (0.0%) |
| Graduate Degree | 0 (0.0%) | 0 (0.0%) |
| Total | 9 (100.0%) | 0 (0.0%) |
Income in Hooversville borough
Income Overview in Hooversville borough
Per Capita Income in Hooversville borough is $23,719, while median incomes of families and households are $61,319 and $43,750 respectively.
| Characteristic | Number | Measure |
| Per Capita Income | 722 | $23,719 |
| Median Family Income | 181 | $61,319 |
| Mean Family Income | 181 | $71,348 |
| Median Household Income | 285 | $43,750 |
| Mean Household Income | 285 | $58,568 |
| Income Deficit | 181 | $0 |
| Wage / Income Gap (%) | 722 | 13.44% |
| Wage / Income Gap ($) | 722 | 86.56¢ per $1 |
| Gini / Inequality Index | 722 | 0.35 |
Earnings by Sex in Hooversville borough
Average Earnings in Hooversville borough are $26,538, $25,156 for men and $29,063 for women, a difference of 13.4%.
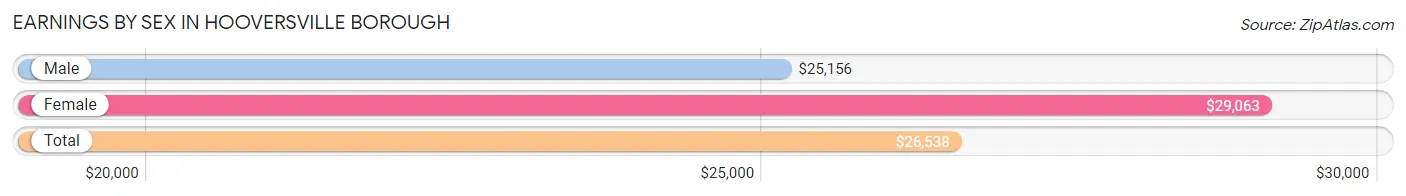
| Sex | Number | Average Earnings |
| Male | 223 (59.3%) | $25,156 |
| Female | 153 (40.7%) | $29,063 |
| Total | 376 (100.0%) | $26,538 |
Earnings by Sex by Income Bracket in Hooversville borough
The most common earnings brackets in Hooversville borough are $2,499 or less for men (34 | 15.2%) and $30,000 to $34,999 for women (37 | 24.2%).
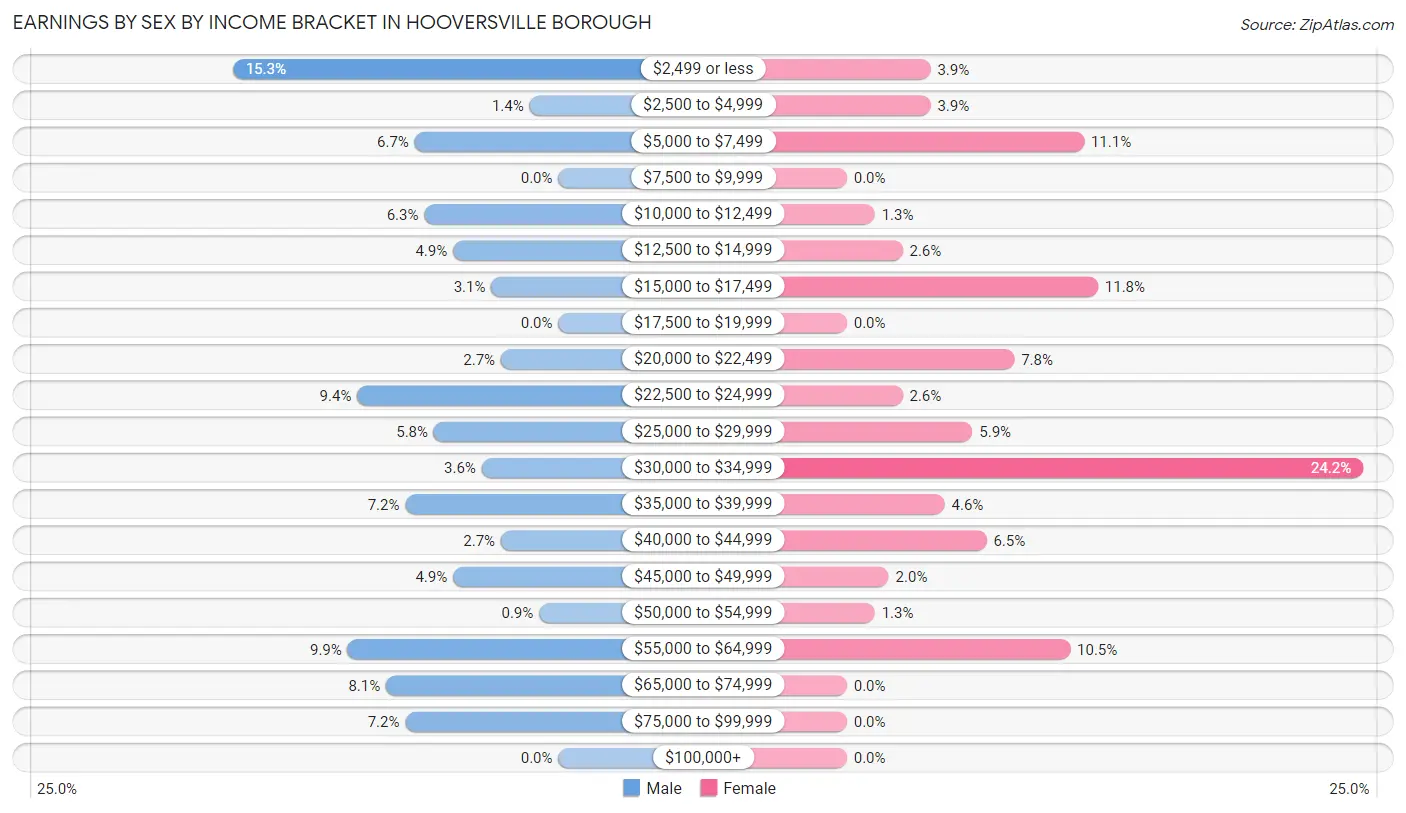
| Income | Male | Female |
| $2,499 or less | 34 (15.2%) | 6 (3.9%) |
| $2,500 to $4,999 | 3 (1.3%) | 6 (3.9%) |
| $5,000 to $7,499 | 15 (6.7%) | 17 (11.1%) |
| $7,500 to $9,999 | 0 (0.0%) | 0 (0.0%) |
| $10,000 to $12,499 | 14 (6.3%) | 2 (1.3%) |
| $12,500 to $14,999 | 11 (4.9%) | 4 (2.6%) |
| $15,000 to $17,499 | 7 (3.1%) | 18 (11.8%) |
| $17,500 to $19,999 | 0 (0.0%) | 0 (0.0%) |
| $20,000 to $22,499 | 6 (2.7%) | 12 (7.8%) |
| $22,500 to $24,999 | 21 (9.4%) | 4 (2.6%) |
| $25,000 to $29,999 | 13 (5.8%) | 9 (5.9%) |
| $30,000 to $34,999 | 8 (3.6%) | 37 (24.2%) |
| $35,000 to $39,999 | 16 (7.2%) | 7 (4.6%) |
| $40,000 to $44,999 | 6 (2.7%) | 10 (6.5%) |
| $45,000 to $49,999 | 11 (4.9%) | 3 (2.0%) |
| $50,000 to $54,999 | 2 (0.9%) | 2 (1.3%) |
| $55,000 to $64,999 | 22 (9.9%) | 16 (10.5%) |
| $65,000 to $74,999 | 18 (8.1%) | 0 (0.0%) |
| $75,000 to $99,999 | 16 (7.2%) | 0 (0.0%) |
| $100,000+ | 0 (0.0%) | 0 (0.0%) |
| Total | 223 (100.0%) | 153 (100.0%) |
Earnings by Sex by Educational Attainment in Hooversville borough
Average earnings in Hooversville borough are $33,750 for men and $30,100 for women, a difference of 10.8%. Men with an educational attainment of bachelor's degree enjoy the highest average annual earnings of $48,036, while those with high school diploma education earn the least with $27,250. Women with an educational attainment of bachelor's degree earn the most with the average annual earnings of $32,917, while those with college or associate's degree education have the smallest earnings of $26,250.
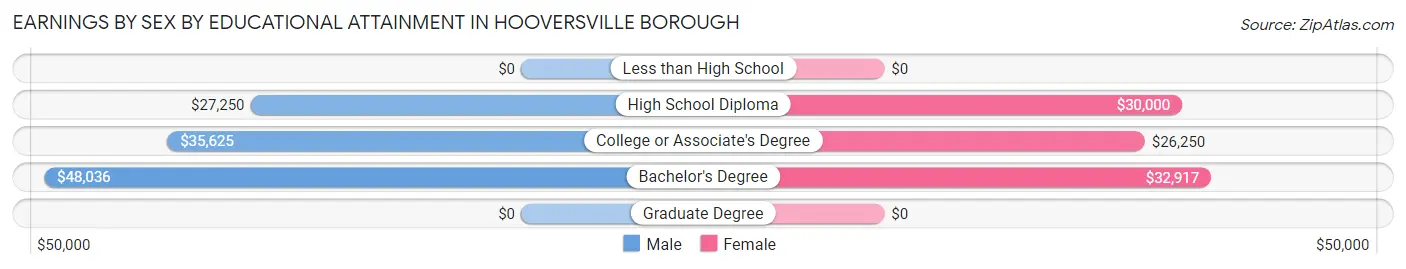
| Educational Attainment | Male Income | Female Income |
| Less than High School | - | - |
| High School Diploma | $27,250 | $30,000 |
| College or Associate's Degree | $35,625 | $26,250 |
| Bachelor's Degree | $48,036 | $32,917 |
| Graduate Degree | - | - |
| Total | $33,750 | $30,100 |
Family Income in Hooversville borough
Family Income Brackets in Hooversville borough
According to the Hooversville borough family income data, there are 44 families falling into the $50,000 to $74,999 income range, which is the most common income bracket and makes up 24.3% of all families.
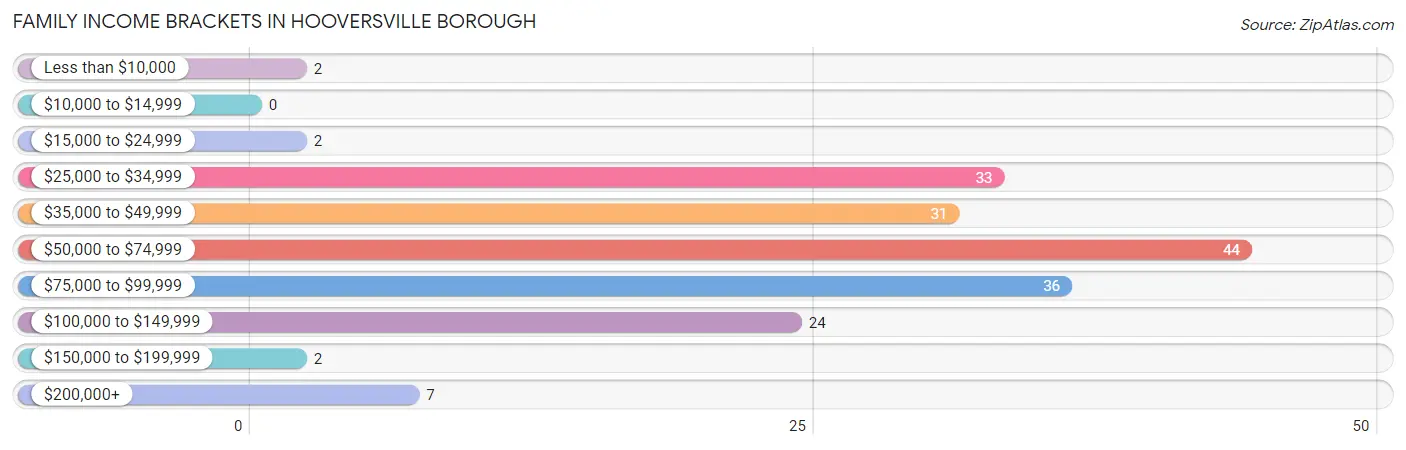
| Income Bracket | # Families | % Families |
| Less than $10,000 | 2 | 1.1% |
| $10,000 to $14,999 | 0 | 0.0% |
| $15,000 to $24,999 | 2 | 1.1% |
| $25,000 to $34,999 | 33 | 18.2% |
| $35,000 to $49,999 | 31 | 17.1% |
| $50,000 to $74,999 | 44 | 24.3% |
| $75,000 to $99,999 | 36 | 19.9% |
| $100,000 to $149,999 | 24 | 13.3% |
| $150,000 to $199,999 | 2 | 1.1% |
| $200,000+ | 7 | 3.9% |
Family Income by Famaliy Size in Hooversville borough
5-person families (10 | 5.5%) account for the highest median family income in Hooversville borough with $250,001 per family, while 5-person families (10 | 5.5%) have the highest median income of $50,000 per family member.
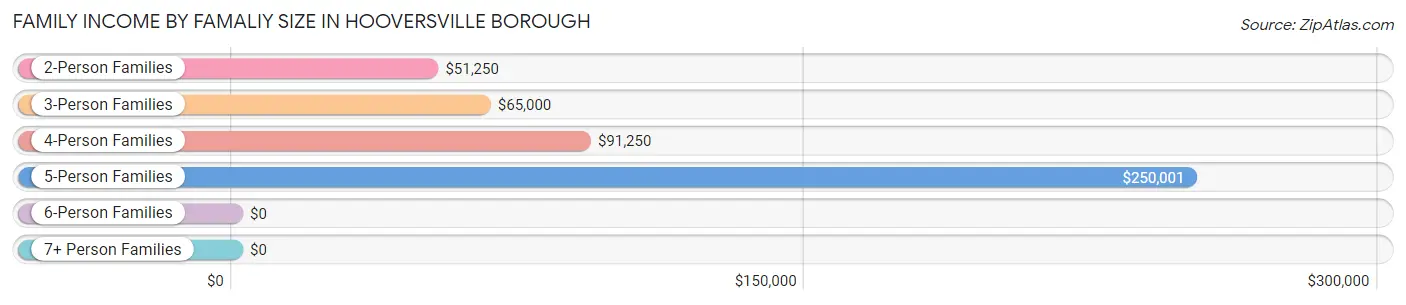
| Income Bracket | # Families | Median Income |
| 2-Person Families | 74 (40.9%) | $51,250 |
| 3-Person Families | 64 (35.4%) | $65,000 |
| 4-Person Families | 30 (16.6%) | $91,250 |
| 5-Person Families | 10 (5.5%) | $250,001 |
| 6-Person Families | 3 (1.7%) | $0 |
| 7+ Person Families | 0 (0.0%) | $0 |
| Total | 181 (100.0%) | $61,319 |
Family Income by Number of Earners in Hooversville borough
The median family income in Hooversville borough is $61,319, with families comprising 3+ earners (30) having the highest median family income of $106,786, while families with no earners (31) have the lowest median family income of $43,750, accounting for 16.6% and 17.1% of families, respectively.
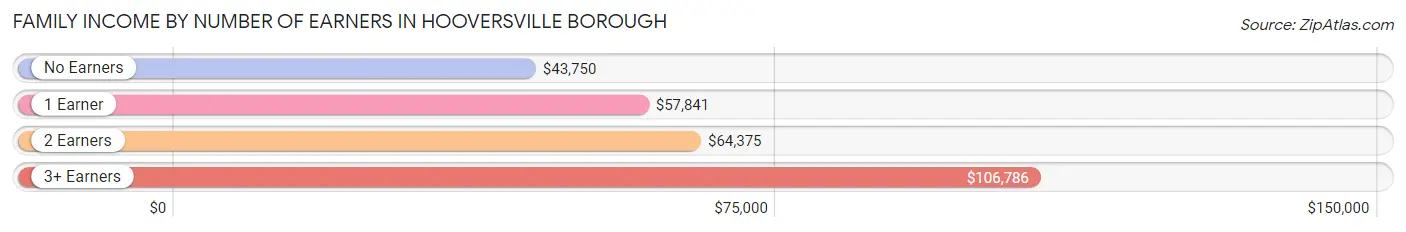
| Number of Earners | # Families | Median Income |
| No Earners | 31 (17.1%) | $43,750 |
| 1 Earner | 63 (34.8%) | $57,841 |
| 2 Earners | 57 (31.5%) | $64,375 |
| 3+ Earners | 30 (16.6%) | $106,786 |
| Total | 181 (100.0%) | $61,319 |
Household Income in Hooversville borough
Household Income Brackets in Hooversville borough
With 70 households falling in the category, the $25,000 to $34,999 income range is the most frequent in Hooversville borough, accounting for 24.6% of all households. In contrast, only 2 households (0.7%) fall into the $150,000 to $199,999 income bracket, making it the least populous group.
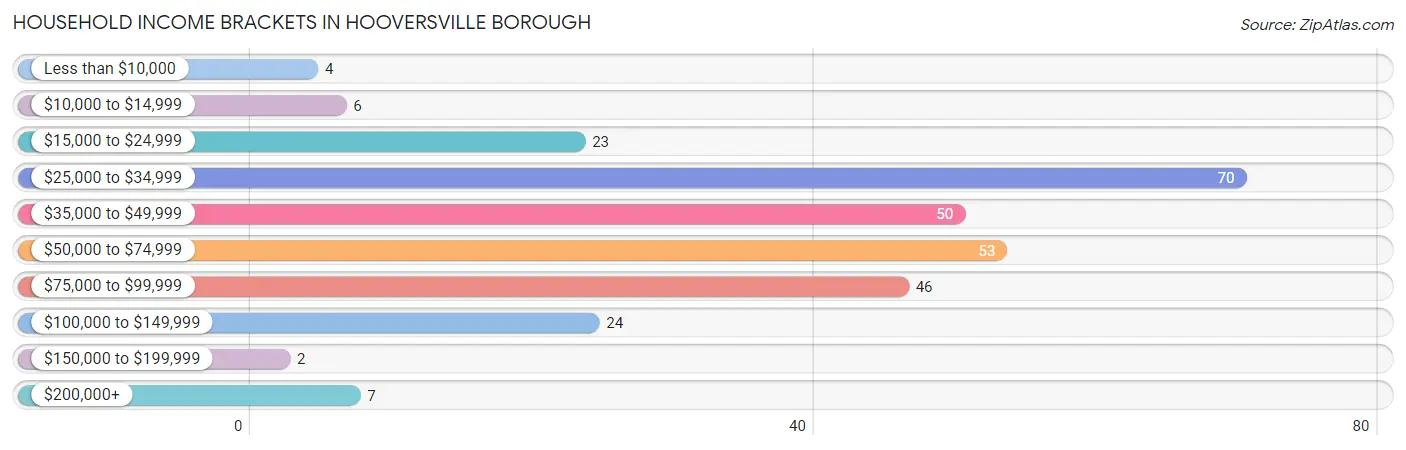
| Income Bracket | # Households | % Households |
| Less than $10,000 | 4 | 1.4% |
| $10,000 to $14,999 | 6 | 2.1% |
| $15,000 to $24,999 | 23 | 8.1% |
| $25,000 to $34,999 | 70 | 24.6% |
| $35,000 to $49,999 | 50 | 17.5% |
| $50,000 to $74,999 | 53 | 18.6% |
| $75,000 to $99,999 | 46 | 16.1% |
| $100,000 to $149,999 | 24 | 8.4% |
| $150,000 to $199,999 | 2 | 0.7% |
| $200,000+ | 7 | 2.5% |
Household Income by Householder Age in Hooversville borough
The median household income in Hooversville borough is $43,750, with the highest median household income of $61,389 found in the 25 to 44 years age bracket for the primary householder. A total of 78 households (27.4%) fall into this category. Meanwhile, the 15 to 24 years age bracket for the primary householder has the lowest median household income of $0, with 1 households (0.4%) in this group.
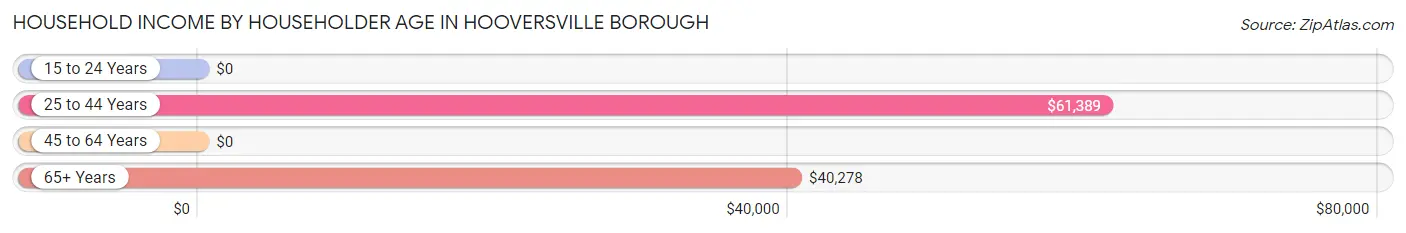
| Income Bracket | # Households | Median Income |
| 15 to 24 Years | 1 (0.4%) | $0 |
| 25 to 44 Years | 78 (27.4%) | $61,389 |
| 45 to 64 Years | 100 (35.1%) | $0 |
| 65+ Years | 106 (37.2%) | $40,278 |
| Total | 285 (100.0%) | $43,750 |
Poverty in Hooversville borough
Income Below Poverty by Sex and Age in Hooversville borough
With 6.5% poverty level for males and 11.1% for females among the residents of Hooversville borough, 12 to 14 year old males and 6 to 11 year old females are the most vulnerable to poverty, with 2 males (33.3%) and 8 females (53.3%) in their respective age groups living below the poverty level.
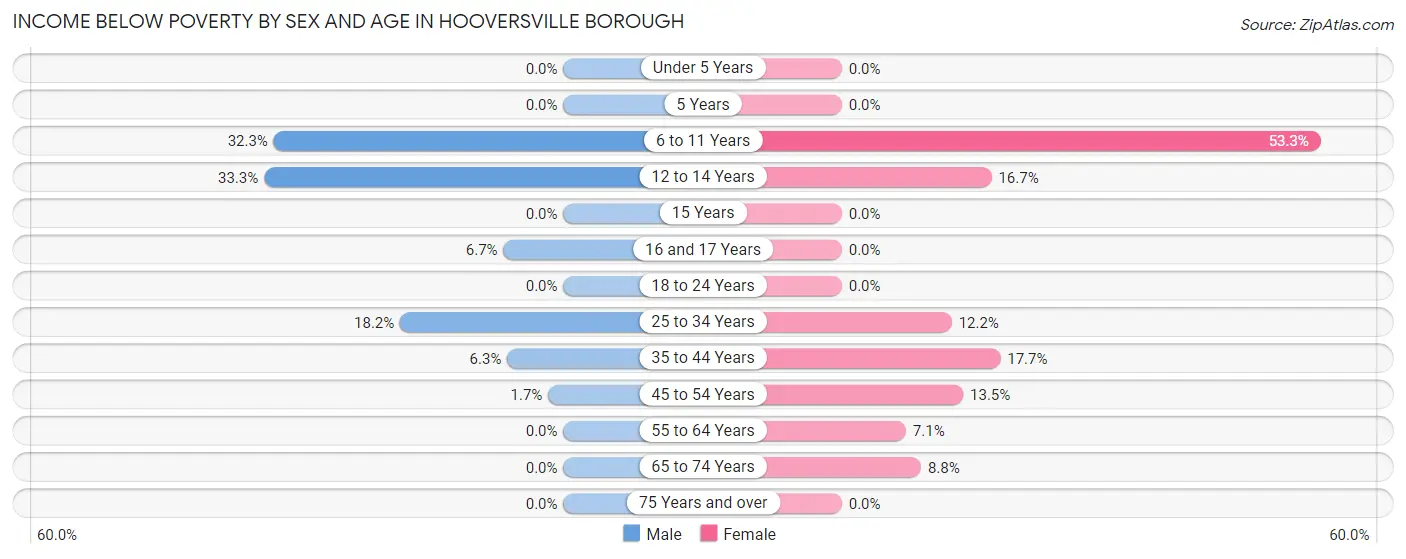
| Age Bracket | Male | Female |
| Under 5 Years | 0 (0.0%) | 0 (0.0%) |
| 5 Years | 0 (0.0%) | 0 (0.0%) |
| 6 to 11 Years | 10 (32.3%) | 8 (53.3%) |
| 12 to 14 Years | 2 (33.3%) | 1 (16.7%) |
| 15 Years | 0 (0.0%) | 0 (0.0%) |
| 16 and 17 Years | 2 (6.7%) | 0 (0.0%) |
| 18 to 24 Years | 0 (0.0%) | 0 (0.0%) |
| 25 to 34 Years | 8 (18.2%) | 6 (12.2%) |
| 35 to 44 Years | 2 (6.2%) | 6 (17.6%) |
| 45 to 54 Years | 1 (1.7%) | 5 (13.5%) |
| 55 to 64 Years | 0 (0.0%) | 4 (7.1%) |
| 65 to 74 Years | 0 (0.0%) | 6 (8.8%) |
| 75 Years and over | 0 (0.0%) | 0 (0.0%) |
| Total | 25 (6.5%) | 36 (11.1%) |
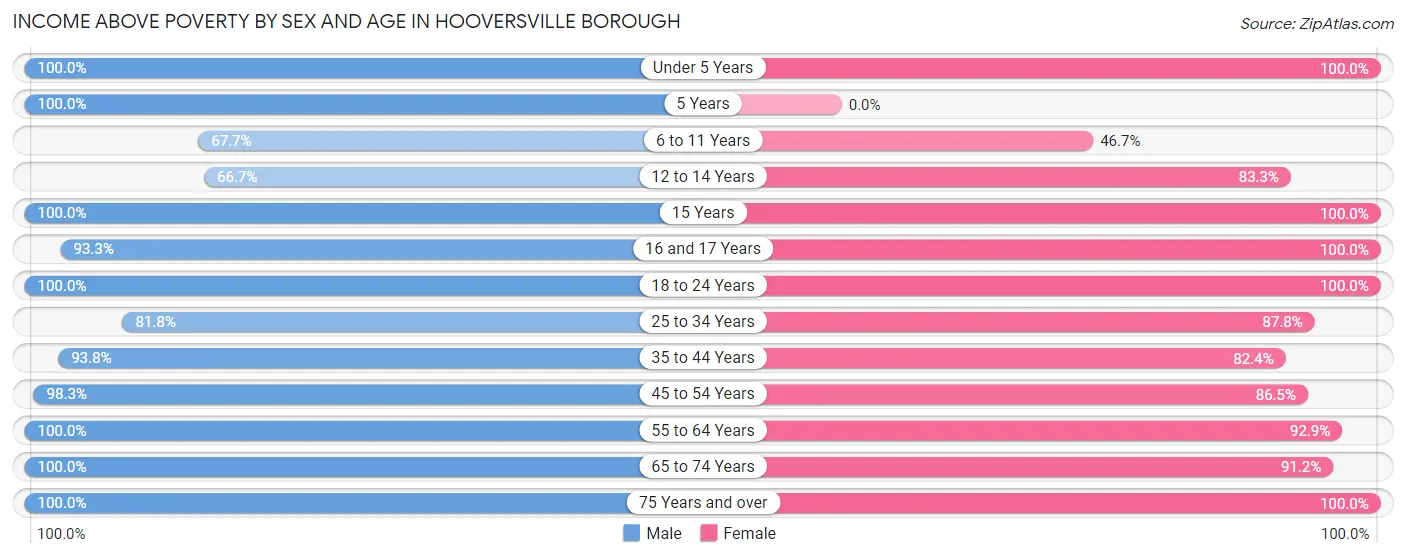
Income Above Poverty by Sex and Age in Hooversville borough
According to the poverty statistics in Hooversville borough, males aged under 5 years and females aged under 5 years are the age groups that are most secure financially, with 100.0% of males and 100.0% of females in these age groups living above the poverty line.
| Age Bracket | Male | Female |
| Under 5 Years | 12 (100.0%) | 12 (100.0%) |
| 5 Years | 2 (100.0%) | 0 (0.0%) |
| 6 to 11 Years | 21 (67.7%) | 7 (46.7%) |
| 12 to 14 Years | 4 (66.7%) | 5 (83.3%) |
| 15 Years | 20 (100.0%) | 7 (100.0%) |
| 16 and 17 Years | 28 (93.3%) | 3 (100.0%) |
| 18 to 24 Years | 37 (100.0%) | 13 (100.0%) |
| 25 to 34 Years | 36 (81.8%) | 43 (87.8%) |
| 35 to 44 Years | 30 (93.8%) | 28 (82.4%) |
| 45 to 54 Years | 58 (98.3%) | 32 (86.5%) |
| 55 to 64 Years | 23 (100.0%) | 52 (92.9%) |
| 65 to 74 Years | 56 (100.0%) | 62 (91.2%) |
| 75 Years and over | 33 (100.0%) | 24 (100.0%) |
| Total | 360 (93.5%) | 288 (88.9%) |
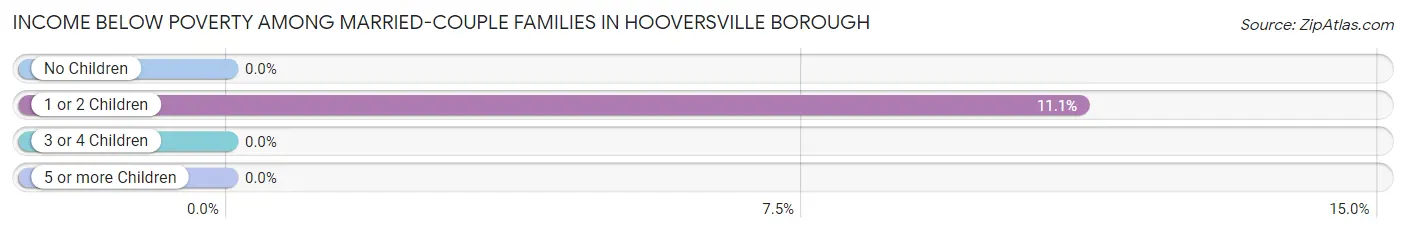
Income Below Poverty Among Married-Couple Families in Hooversville borough
The poverty statistics for married-couple families in Hooversville borough show that 4.6% or 6 of the total 130 families live below the poverty line. Families with 1 or 2 children have the highest poverty rate of 11.1%, comprising of 6 families. On the other hand, families with no children have the lowest poverty rate of 0.0%, which includes 0 families.
| Children | Above Poverty | Below Poverty |
| No Children | 72 (100.0%) | 0 (0.0%) |
| 1 or 2 Children | 48 (88.9%) | 6 (11.1%) |
| 3 or 4 Children | 4 (100.0%) | 0 (0.0%) |
| 5 or more Children | 0 (0.0%) | 0 (0.0%) |
| Total | 124 (95.4%) | 6 (4.6%) |
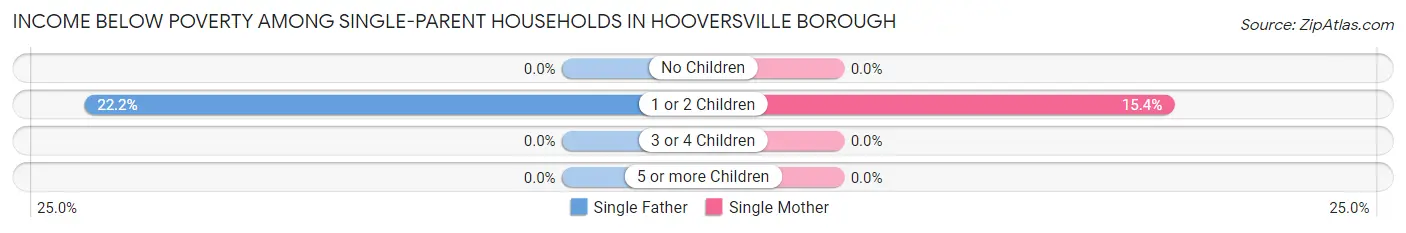
Income Below Poverty Among Single-Parent Households in Hooversville borough
According to the poverty data in Hooversville borough, 8.7% or 2 single-father households and 7.1% or 2 single-mother households are living below the poverty line. Among single-father households, those with 1 or 2 children have the highest poverty rate, with 2 households (22.2%) experiencing poverty. Likewise, among single-mother households, those with 1 or 2 children have the highest poverty rate, with 2 households (15.4%) falling below the poverty line.
| Children | Single Father | Single Mother |
| No Children | 0 (0.0%) | 0 (0.0%) |
| 1 or 2 Children | 2 (22.2%) | 2 (15.4%) |
| 3 or 4 Children | 0 (0.0%) | 0 (0.0%) |
| 5 or more Children | 0 (0.0%) | 0 (0.0%) |
| Total | 2 (8.7%) | 2 (7.1%) |
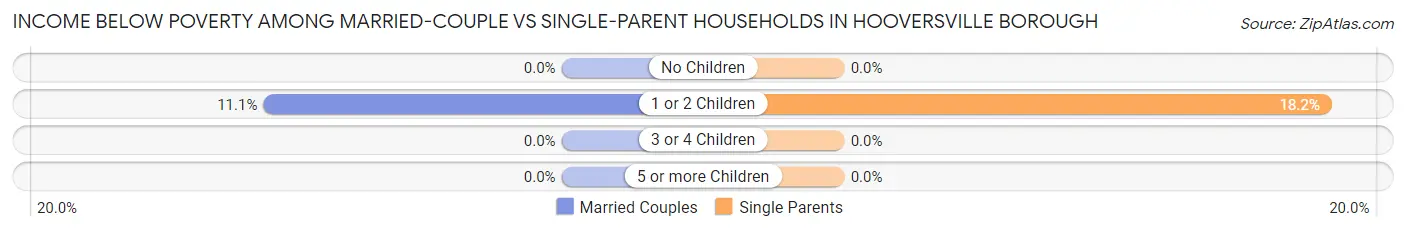
Income Below Poverty Among Married-Couple vs Single-Parent Households in Hooversville borough
The poverty data for Hooversville borough shows that 6 of the married-couple family households (4.6%) and 4 of the single-parent households (7.8%) are living below the poverty level. Within the married-couple family households, those with 1 or 2 children have the highest poverty rate, with 6 households (11.1%) falling below the poverty line. Among the single-parent households, those with 1 or 2 children have the highest poverty rate, with 4 household (18.2%) living below poverty.
| Children | Married-Couple Families | Single-Parent Households |
| No Children | 0 (0.0%) | 0 (0.0%) |
| 1 or 2 Children | 6 (11.1%) | 4 (18.2%) |
| 3 or 4 Children | 0 (0.0%) | 0 (0.0%) |
| 5 or more Children | 0 (0.0%) | 0 (0.0%) |
| Total | 6 (4.6%) | 4 (7.8%) |
Employment Characteristics in Hooversville borough
Employment by Class of Employer in Hooversville borough
Among the 319 employed individuals in Hooversville borough, private company employees (232 | 72.7%), local government employees (28 | 8.8%), and not-for-profit organizations (19 | 6.0%) make up the most common classes of employment.
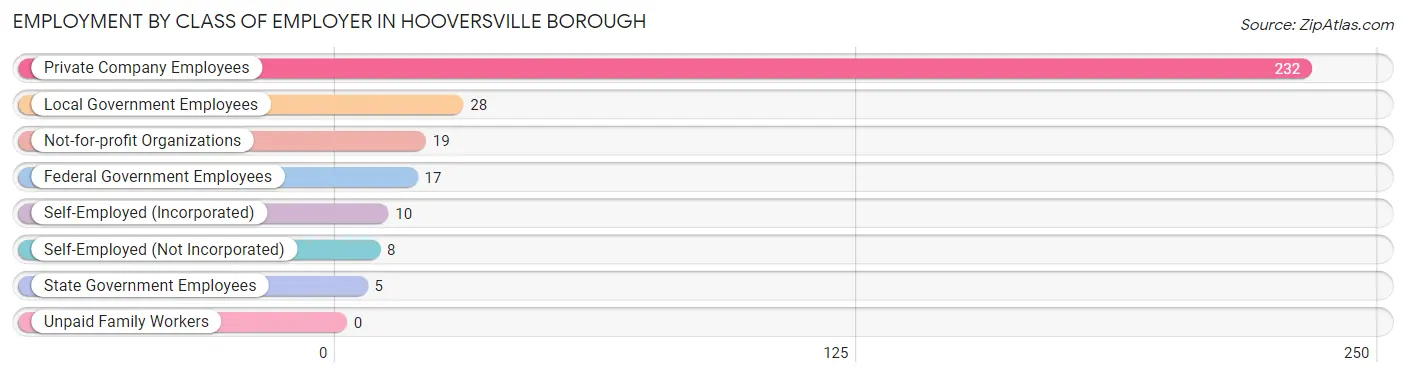
| Employer Class | # Employees | % Employees |
| Private Company Employees | 232 | 72.7% |
| Self-Employed (Incorporated) | 10 | 3.1% |
| Self-Employed (Not Incorporated) | 8 | 2.5% |
| Not-for-profit Organizations | 19 | 6.0% |
| Local Government Employees | 28 | 8.8% |
| State Government Employees | 5 | 1.6% |
| Federal Government Employees | 17 | 5.3% |
| Unpaid Family Workers | 0 | 0.0% |
| Total | 319 | 100.0% |
Employment Status by Age in Hooversville borough
According to the labor force statistics for Hooversville borough, out of the total population over 16 years of age (598), 58.9% or 352 individuals are in the labor force, with 3.1% or 11 of them unemployed. The age group with the highest labor force participation rate is 30 to 34 years, with 100.0% or 45 individuals in the labor force. Within the labor force, the 16 to 19 years age range has the highest percentage of unemployed individuals, with 17.5% or 7 of them being unemployed.
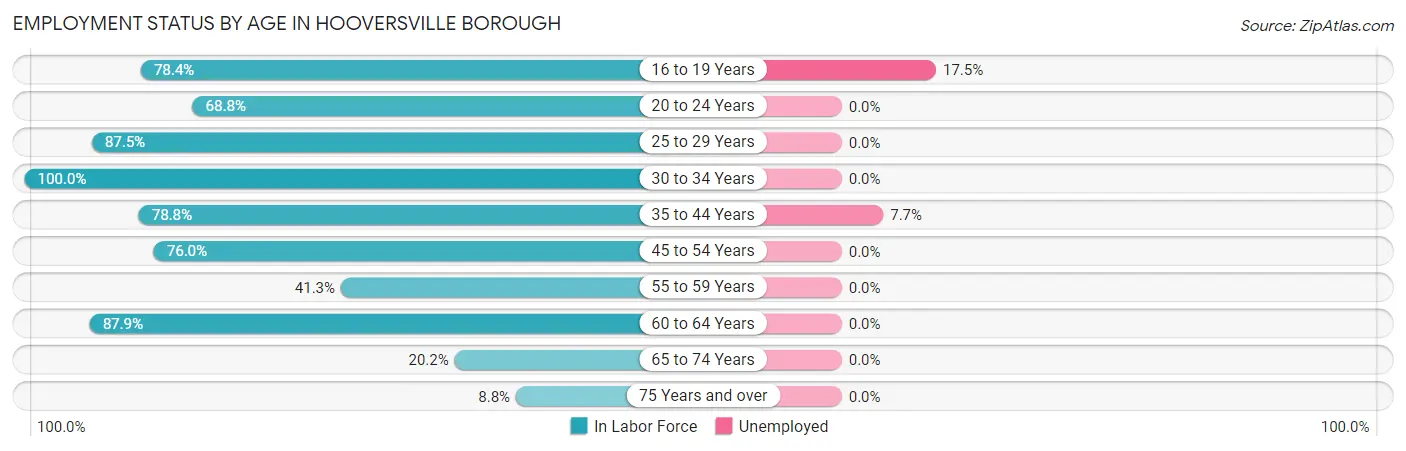
| Age Bracket | In Labor Force | Unemployed |
| 16 to 19 Years | 40 (78.4%) | 7 (17.5%) |
| 20 to 24 Years | 22 (68.8%) | 0 (0.0%) |
| 25 to 29 Years | 42 (87.5%) | 0 (0.0%) |
| 30 to 34 Years | 45 (100.0%) | 0 (0.0%) |
| 35 to 44 Years | 52 (78.8%) | 4 (7.7%) |
| 45 to 54 Years | 73 (76.0%) | 0 (0.0%) |
| 55 to 59 Years | 19 (41.3%) | 0 (0.0%) |
| 60 to 64 Years | 29 (87.9%) | 0 (0.0%) |
| 65 to 74 Years | 25 (20.2%) | 0 (0.0%) |
| 75 Years and over | 5 (8.8%) | 0 (0.0%) |
| Total | 352 (58.9%) | 11 (3.1%) |
Employment Status by Educational Attainment in Hooversville borough
According to labor force statistics for Hooversville borough, 77.8% of individuals (260) out of the total population between 25 and 64 years of age (334) are in the labor force, with 1.6% or 4 of them being unemployed. The group with the highest labor force participation rate are those with the educational attainment of bachelor's degree or higher, with 85.7% or 30 individuals in the labor force. Within the labor force, individuals with less than high school education have the highest percentage of unemployment, with 20.0% or 2 of them being unemployed.
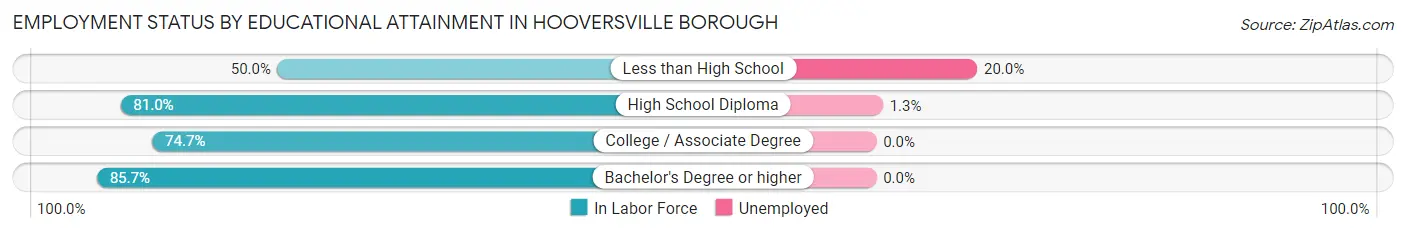
| Educational Attainment | In Labor Force | Unemployed |
| Less than High School | 10 (50.0%) | 4 (20.0%) |
| High School Diploma | 149 (81.0%) | 2 (1.3%) |
| College / Associate Degree | 71 (74.7%) | 0 (0.0%) |
| Bachelor's Degree or higher | 30 (85.7%) | 0 (0.0%) |
| Total | 260 (77.8%) | 5 (1.6%) |
Employment Occupations by Sex in Hooversville borough
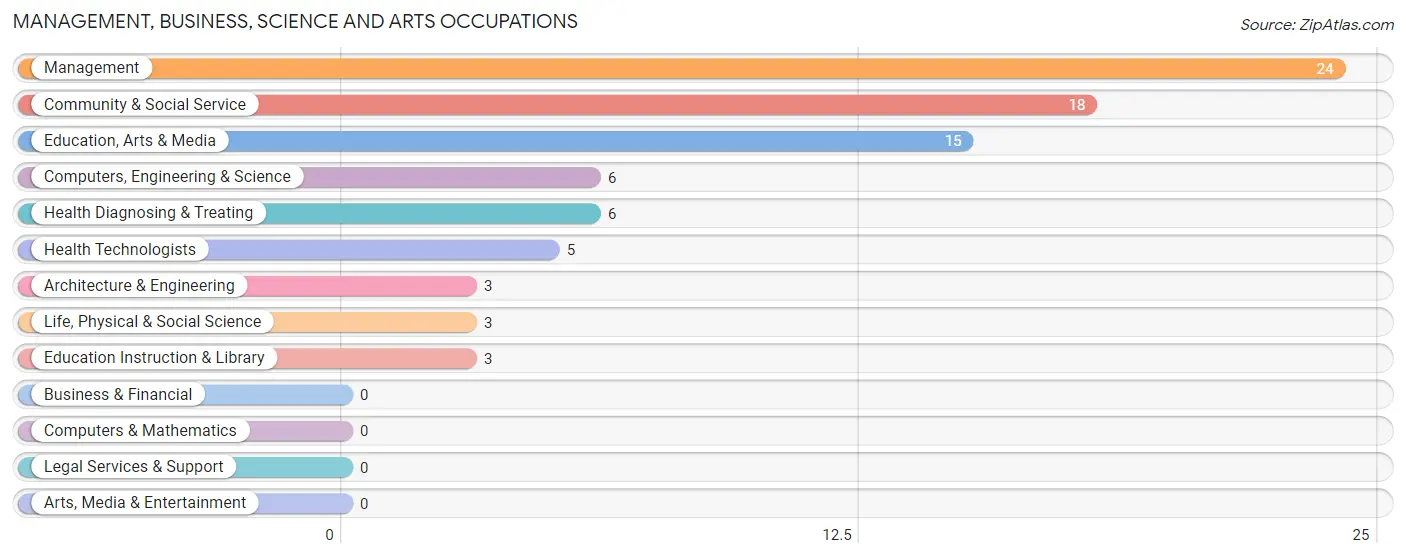
Management, Business, Science and Arts Occupations
The most common Management, Business, Science and Arts occupations in Hooversville borough are Management (24 | 7.1%), Community & Social Service (18 | 5.3%), Education, Arts & Media (15 | 4.4%), Computers, Engineering & Science (6 | 1.8%), and Health Diagnosing & Treating (6 | 1.8%).
Management, Business, Science and Arts Occupations by Sex
Within the Management, Business, Science and Arts occupations in Hooversville borough, the most male-oriented occupations are Computers, Engineering & Science (100.0%), Architecture & Engineering (100.0%), and Life, Physical & Social Science (100.0%), while the most female-oriented occupations are Education Instruction & Library (100.0%), Health Diagnosing & Treating (100.0%), and Health Technologists (100.0%).
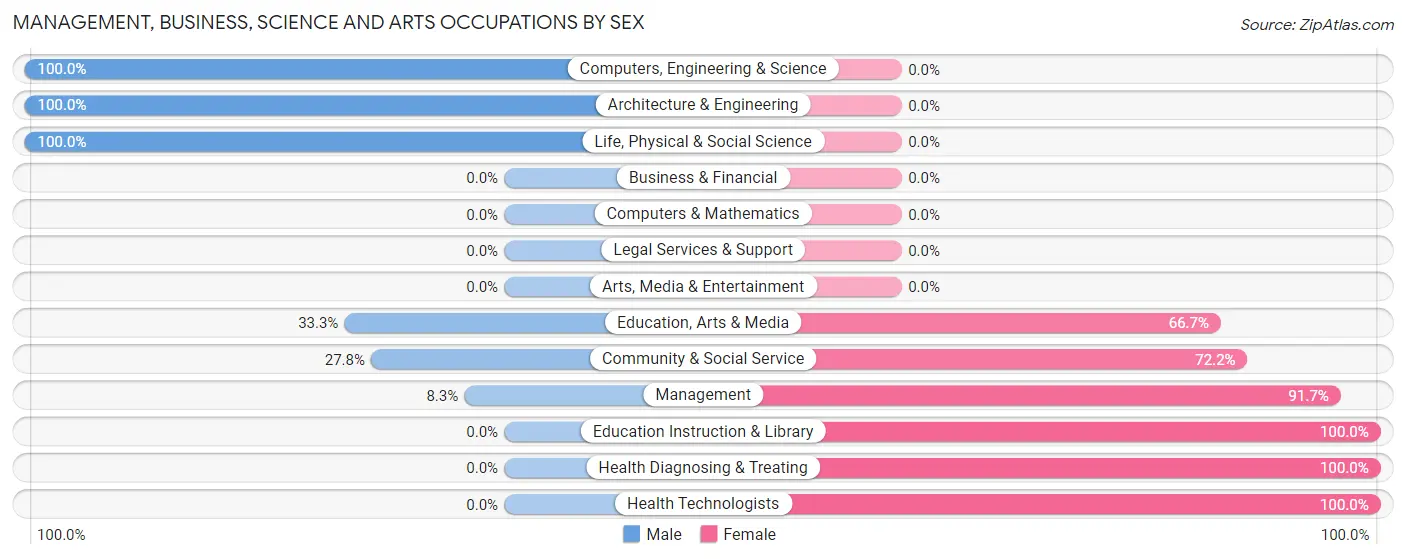
| Occupation | Male | Female |
| Management | 2 (8.3%) | 22 (91.7%) |
| Business & Financial | 0 (0.0%) | 0 (0.0%) |
| Computers, Engineering & Science | 6 (100.0%) | 0 (0.0%) |
| Computers & Mathematics | 0 (0.0%) | 0 (0.0%) |
| Architecture & Engineering | 3 (100.0%) | 0 (0.0%) |
| Life, Physical & Social Science | 3 (100.0%) | 0 (0.0%) |
| Community & Social Service | 5 (27.8%) | 13 (72.2%) |
| Education, Arts & Media | 5 (33.3%) | 10 (66.7%) |
| Legal Services & Support | 0 (0.0%) | 0 (0.0%) |
| Education Instruction & Library | 0 (0.0%) | 3 (100.0%) |
| Arts, Media & Entertainment | 0 (0.0%) | 0 (0.0%) |
| Health Diagnosing & Treating | 0 (0.0%) | 6 (100.0%) |
| Health Technologists | 0 (0.0%) | 5 (100.0%) |
| Total (Category) | 13 (24.1%) | 41 (75.9%) |
| Total (Overall) | 194 (57.2%) | 145 (42.8%) |
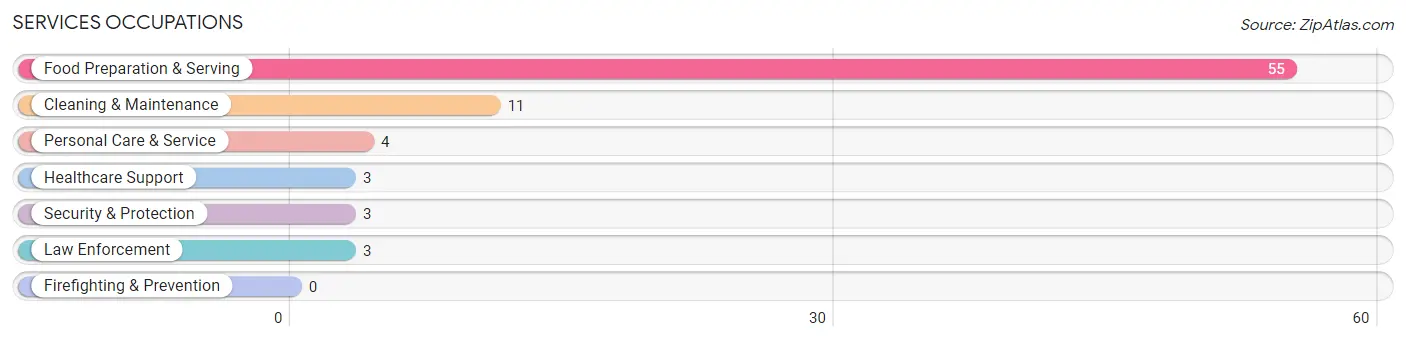
Services Occupations
The most common Services occupations in Hooversville borough are Food Preparation & Serving (55 | 16.2%), Cleaning & Maintenance (11 | 3.2%), Personal Care & Service (4 | 1.2%), Healthcare Support (3 | 0.9%), and Security & Protection (3 | 0.9%).
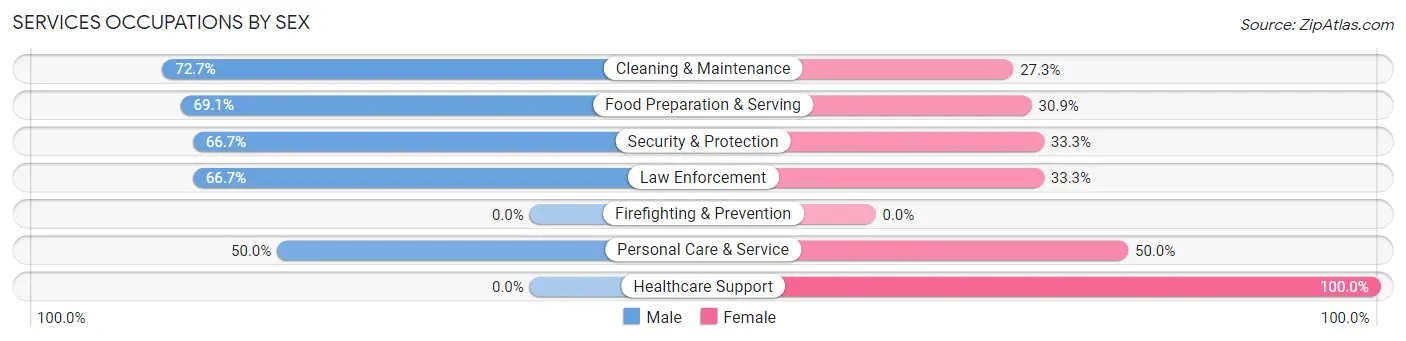
Services Occupations by Sex
Within the Services occupations in Hooversville borough, the most male-oriented occupations are Cleaning & Maintenance (72.7%), Food Preparation & Serving (69.1%), and Security & Protection (66.7%), while the most female-oriented occupations are Healthcare Support (100.0%), Personal Care & Service (50.0%), and Security & Protection (33.3%).
| Occupation | Male | Female |
| Healthcare Support | 0 (0.0%) | 3 (100.0%) |
| Security & Protection | 2 (66.7%) | 1 (33.3%) |
| Firefighting & Prevention | 0 (0.0%) | 0 (0.0%) |
| Law Enforcement | 2 (66.7%) | 1 (33.3%) |
| Food Preparation & Serving | 38 (69.1%) | 17 (30.9%) |
| Cleaning & Maintenance | 8 (72.7%) | 3 (27.3%) |
| Personal Care & Service | 2 (50.0%) | 2 (50.0%) |
| Total (Category) | 50 (65.8%) | 26 (34.2%) |
| Total (Overall) | 194 (57.2%) | 145 (42.8%) |
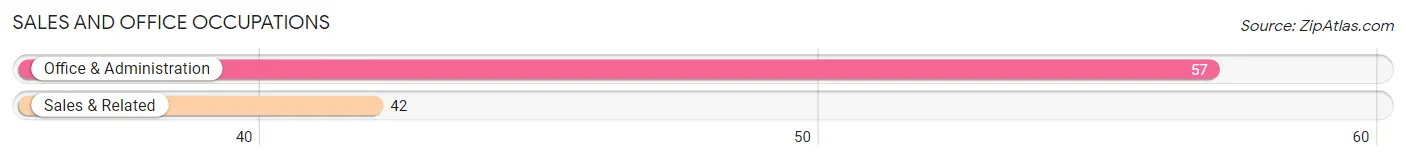
Sales and Office Occupations
The most common Sales and Office occupations in Hooversville borough are Office & Administration (57 | 16.8%), and Sales & Related (42 | 12.4%).
Sales and Office Occupations by Sex
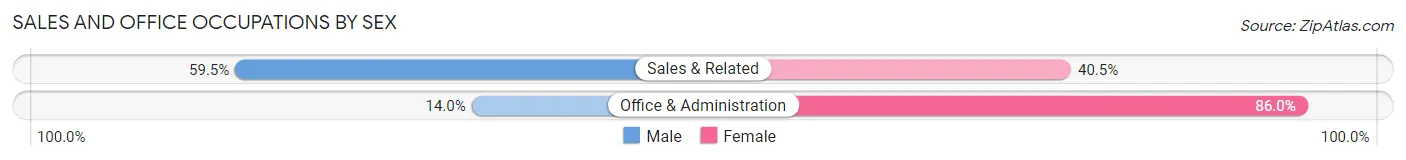
| Occupation | Male | Female |
| Sales & Related | 25 (59.5%) | 17 (40.5%) |
| Office & Administration | 8 (14.0%) | 49 (86.0%) |
| Total (Category) | 33 (33.3%) | 66 (66.7%) |
| Total (Overall) | 194 (57.2%) | 145 (42.8%) |
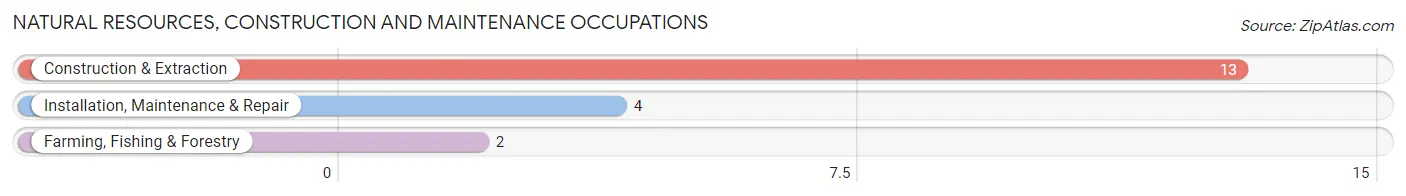
Natural Resources, Construction and Maintenance Occupations
The most common Natural Resources, Construction and Maintenance occupations in Hooversville borough are Construction & Extraction (13 | 3.8%), Installation, Maintenance & Repair (4 | 1.2%), and Farming, Fishing & Forestry (2 | 0.6%).
Natural Resources, Construction and Maintenance Occupations by Sex
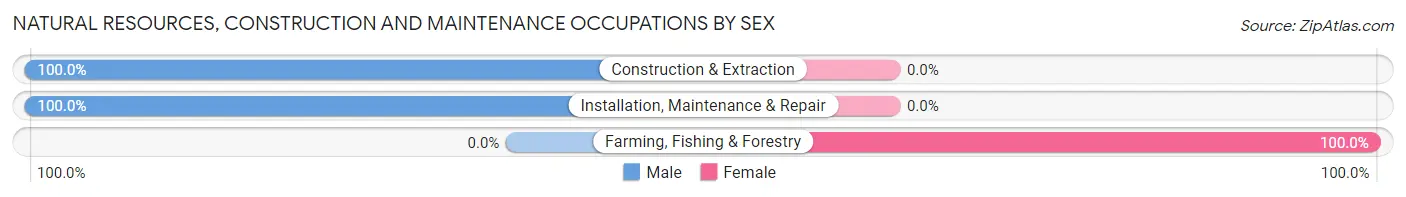
| Occupation | Male | Female |
| Farming, Fishing & Forestry | 0 (0.0%) | 2 (100.0%) |
| Construction & Extraction | 13 (100.0%) | 0 (0.0%) |
| Installation, Maintenance & Repair | 4 (100.0%) | 0 (0.0%) |
| Total (Category) | 17 (89.5%) | 2 (10.5%) |
| Total (Overall) | 194 (57.2%) | 145 (42.8%) |
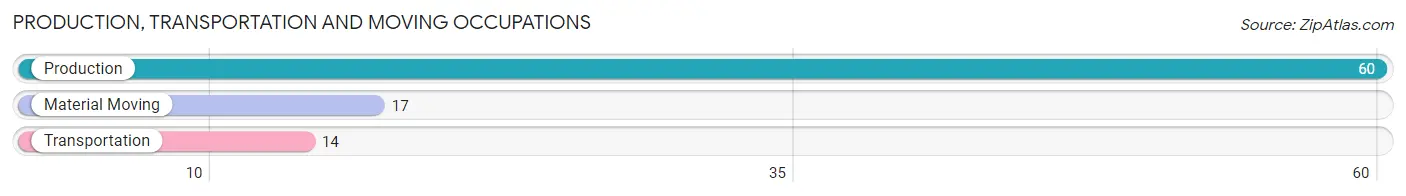
Production, Transportation and Moving Occupations
The most common Production, Transportation and Moving occupations in Hooversville borough are Production (60 | 17.7%), Material Moving (17 | 5.0%), and Transportation (14 | 4.1%).
Production, Transportation and Moving Occupations by Sex
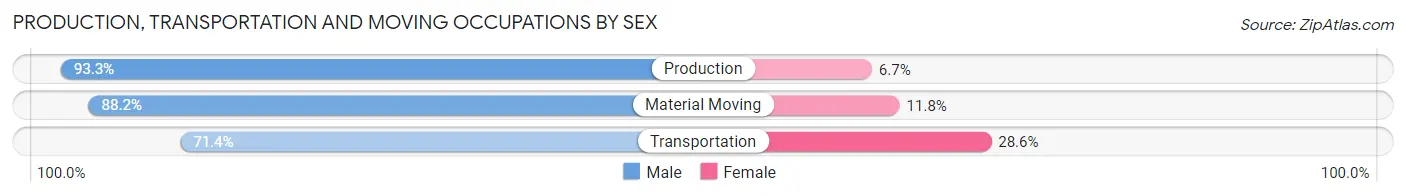
| Occupation | Male | Female |
| Production | 56 (93.3%) | 4 (6.7%) |
| Transportation | 10 (71.4%) | 4 (28.6%) |
| Material Moving | 15 (88.2%) | 2 (11.8%) |
| Total (Category) | 81 (89.0%) | 10 (11.0%) |
| Total (Overall) | 194 (57.2%) | 145 (42.8%) |
Employment Industries by Sex in Hooversville borough
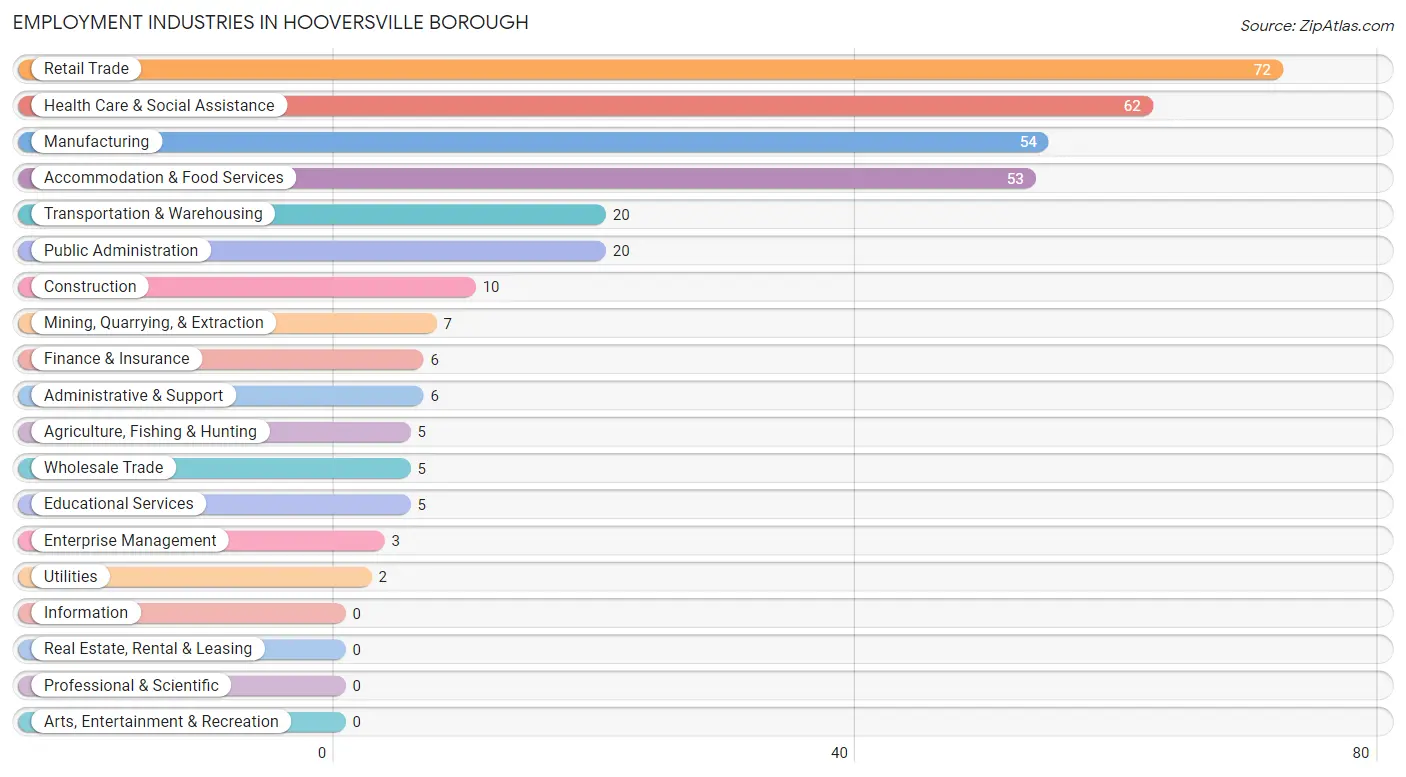
Employment Industries in Hooversville borough
The major employment industries in Hooversville borough include Retail Trade (72 | 21.2%), Health Care & Social Assistance (62 | 18.3%), Manufacturing (54 | 15.9%), Accommodation & Food Services (53 | 15.6%), and Transportation & Warehousing (20 | 5.9%).
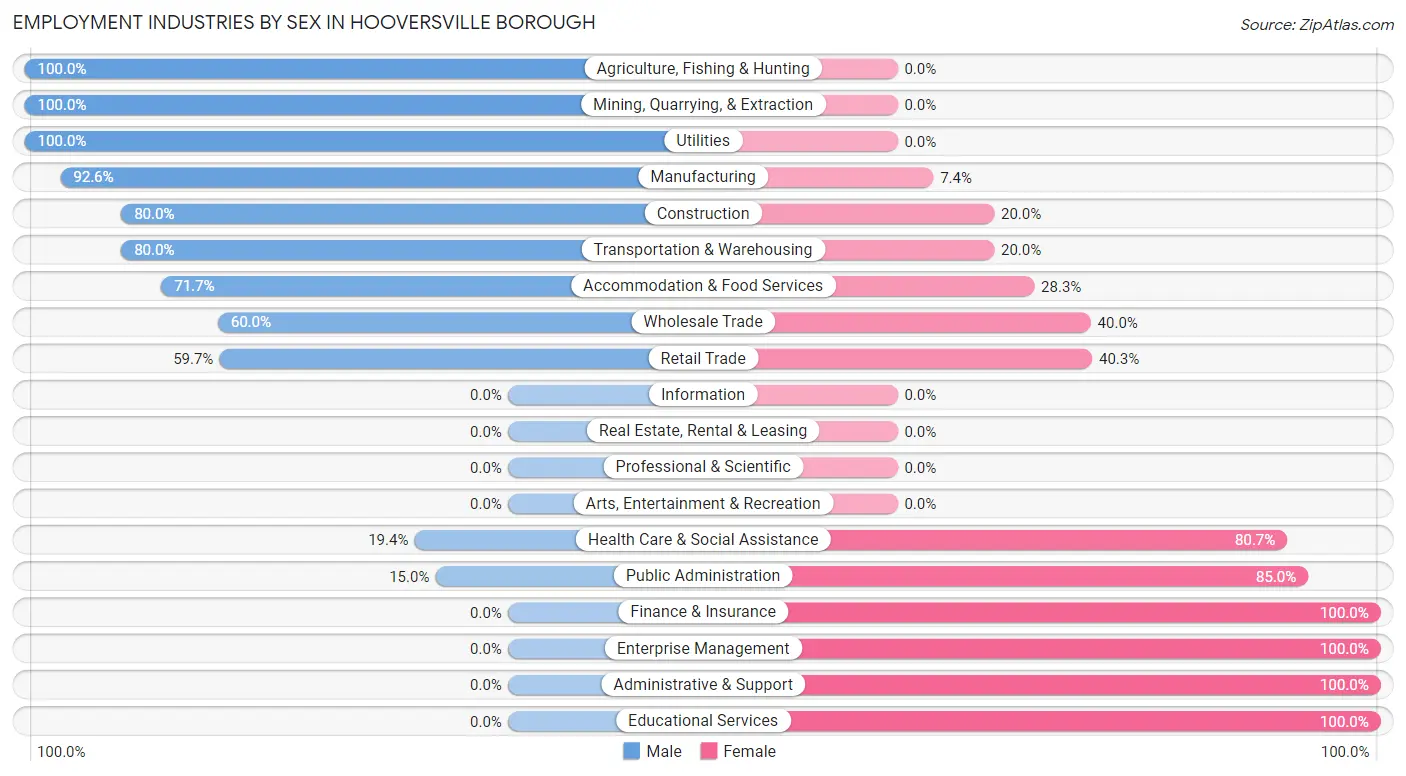
Employment Industries by Sex in Hooversville borough
The Hooversville borough industries that see more men than women are Agriculture, Fishing & Hunting (100.0%), Mining, Quarrying, & Extraction (100.0%), and Utilities (100.0%), whereas the industries that tend to have a higher number of women are Finance & Insurance (100.0%), Enterprise Management (100.0%), and Administrative & Support (100.0%).
| Industry | Male | Female |
| Agriculture, Fishing & Hunting | 5 (100.0%) | 0 (0.0%) |
| Mining, Quarrying, & Extraction | 7 (100.0%) | 0 (0.0%) |
| Construction | 8 (80.0%) | 2 (20.0%) |
| Manufacturing | 50 (92.6%) | 4 (7.4%) |
| Wholesale Trade | 3 (60.0%) | 2 (40.0%) |
| Retail Trade | 43 (59.7%) | 29 (40.3%) |
| Transportation & Warehousing | 16 (80.0%) | 4 (20.0%) |
| Utilities | 2 (100.0%) | 0 (0.0%) |
| Information | 0 (0.0%) | 0 (0.0%) |
| Finance & Insurance | 0 (0.0%) | 6 (100.0%) |
| Real Estate, Rental & Leasing | 0 (0.0%) | 0 (0.0%) |
| Professional & Scientific | 0 (0.0%) | 0 (0.0%) |
| Enterprise Management | 0 (0.0%) | 3 (100.0%) |
| Administrative & Support | 0 (0.0%) | 6 (100.0%) |
| Educational Services | 0 (0.0%) | 5 (100.0%) |
| Health Care & Social Assistance | 12 (19.4%) | 50 (80.6%) |
| Arts, Entertainment & Recreation | 0 (0.0%) | 0 (0.0%) |
| Accommodation & Food Services | 38 (71.7%) | 15 (28.3%) |
| Public Administration | 3 (15.0%) | 17 (85.0%) |
| Total | 194 (57.2%) | 145 (42.8%) |
Education in Hooversville borough
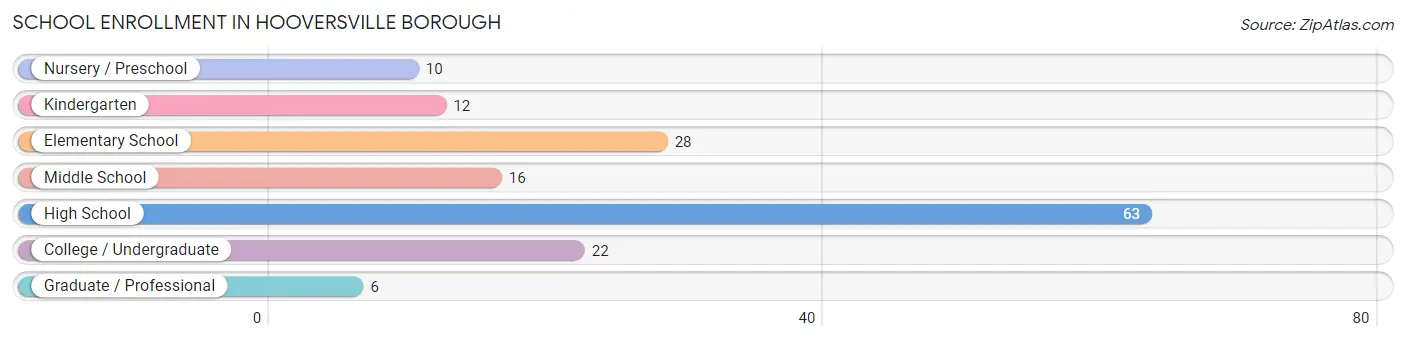
School Enrollment in Hooversville borough
The most common levels of schooling among the 157 students in Hooversville borough are high school (63 | 40.1%), elementary school (28 | 17.8%), and college / undergraduate (22 | 14.0%).
| School Level | # Students | % Students |
| Nursery / Preschool | 10 | 6.4% |
| Kindergarten | 12 | 7.6% |
| Elementary School | 28 | 17.8% |
| Middle School | 16 | 10.2% |
| High School | 63 | 40.1% |
| College / Undergraduate | 22 | 14.0% |
| Graduate / Professional | 6 | 3.8% |
| Total | 157 | 100.0% |
School Enrollment by Age by Funding Source in Hooversville borough
Out of a total of 157 students who are enrolled in schools in Hooversville borough, 22 (14.0%) attend a private institution, while the remaining 135 (86.0%) are enrolled in public schools. The age group of 20 to 24 year olds has the highest likelihood of being enrolled in private schools, with 8 (44.4% in the age bracket) enrolled. Conversely, the age group of 3 to 4 year olds has the lowest likelihood of being enrolled in a private school, with 10 (100.0% in the age bracket) attending a public institution.
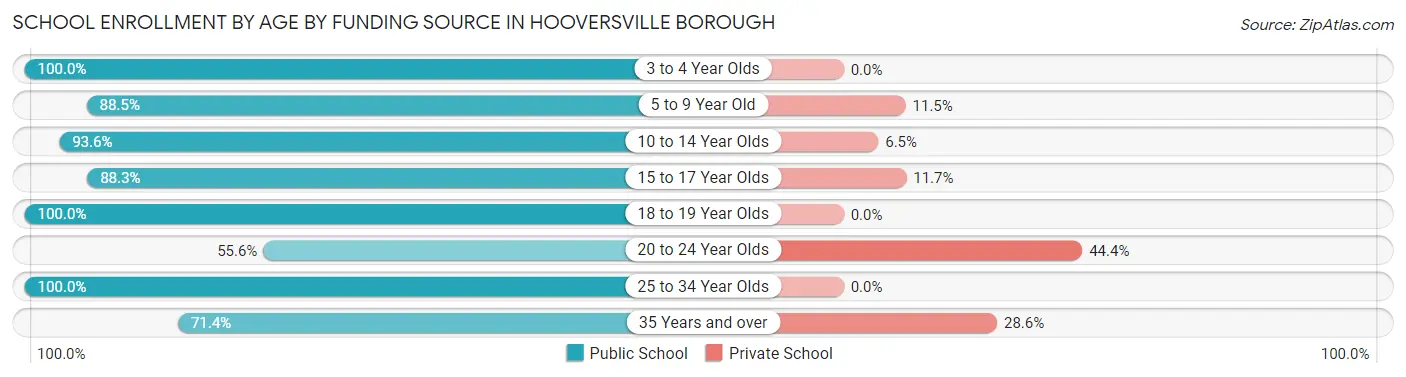
| Age Bracket | Public School | Private School |
| 3 to 4 Year Olds | 10 (100.0%) | 0 (0.0%) |
| 5 to 9 Year Old | 23 (88.5%) | 3 (11.5%) |
| 10 to 14 Year Olds | 29 (93.5%) | 2 (6.5%) |
| 15 to 17 Year Olds | 53 (88.3%) | 7 (11.7%) |
| 18 to 19 Year Olds | 2 (100.0%) | 0 (0.0%) |
| 20 to 24 Year Olds | 10 (55.6%) | 8 (44.4%) |
| 25 to 34 Year Olds | 3 (100.0%) | 0 (0.0%) |
| 35 Years and over | 5 (71.4%) | 2 (28.6%) |
| Total | 135 (86.0%) | 22 (14.0%) |
Educational Attainment by Field of Study in Hooversville borough
Engineering (7 | 15.6%), education (7 | 15.6%), psychology (6 | 13.3%), business (6 | 13.3%), and literature & languages (5 | 11.1%) are the most common fields of study among 45 individuals in Hooversville borough who have obtained a bachelor's degree or higher.
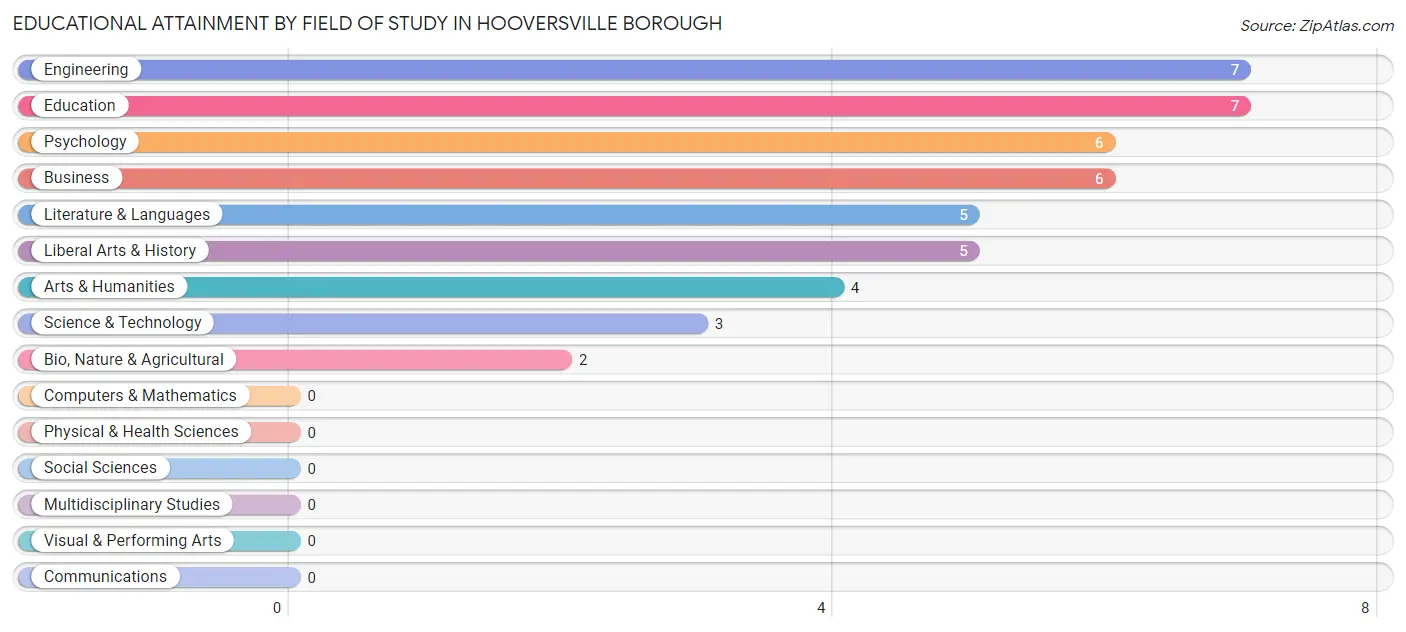
| Field of Study | # Graduates | % Graduates |
| Computers & Mathematics | 0 | 0.0% |
| Bio, Nature & Agricultural | 2 | 4.4% |
| Physical & Health Sciences | 0 | 0.0% |
| Psychology | 6 | 13.3% |
| Social Sciences | 0 | 0.0% |
| Engineering | 7 | 15.6% |
| Multidisciplinary Studies | 0 | 0.0% |
| Science & Technology | 3 | 6.7% |
| Business | 6 | 13.3% |
| Education | 7 | 15.6% |
| Literature & Languages | 5 | 11.1% |
| Liberal Arts & History | 5 | 11.1% |
| Visual & Performing Arts | 0 | 0.0% |
| Communications | 0 | 0.0% |
| Arts & Humanities | 4 | 8.9% |
| Total | 45 | 100.0% |
Transportation & Commute in Hooversville borough
Vehicle Availability by Sex in Hooversville borough
The most prevalent vehicle ownership categories in Hooversville borough are males with 2 vehicles (64, accounting for 34.8%) and females with 2 vehicles (34, making up 47.4%).
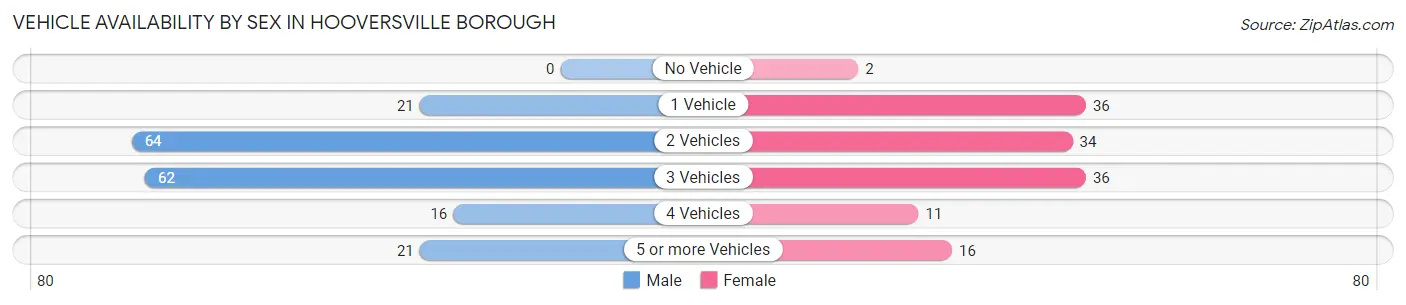
| Vehicles Available | Male | Female |
| No Vehicle | 0 (0.0%) | 2 (1.5%) |
| 1 Vehicle | 21 (11.4%) | 36 (26.7%) |
| 2 Vehicles | 64 (34.8%) | 34 (25.2%) |
| 3 Vehicles | 62 (33.7%) | 36 (26.7%) |
| 4 Vehicles | 16 (8.7%) | 11 (8.2%) |
| 5 or more Vehicles | 21 (11.4%) | 16 (11.8%) |
| Total | 184 (100.0%) | 135 (100.0%) |
Commute Time in Hooversville borough
The most frequently occuring commute durations in Hooversville borough are 30 to 34 minutes (97 commuters, 31.2%), 20 to 24 minutes (46 commuters, 14.8%), and 25 to 29 minutes (34 commuters, 10.9%).
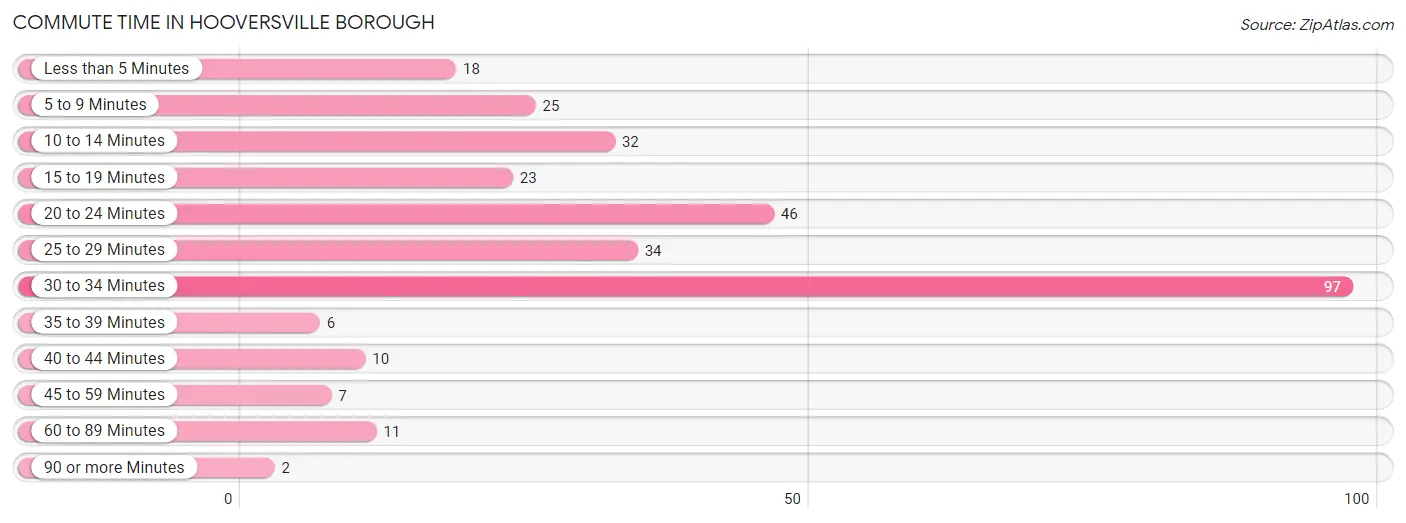
| Commute Time | # Commuters | % Commuters |
| Less than 5 Minutes | 18 | 5.8% |
| 5 to 9 Minutes | 25 | 8.0% |
| 10 to 14 Minutes | 32 | 10.3% |
| 15 to 19 Minutes | 23 | 7.4% |
| 20 to 24 Minutes | 46 | 14.8% |
| 25 to 29 Minutes | 34 | 10.9% |
| 30 to 34 Minutes | 97 | 31.2% |
| 35 to 39 Minutes | 6 | 1.9% |
| 40 to 44 Minutes | 10 | 3.2% |
| 45 to 59 Minutes | 7 | 2.2% |
| 60 to 89 Minutes | 11 | 3.5% |
| 90 or more Minutes | 2 | 0.6% |
Commute Time by Sex in Hooversville borough
The most common commute times in Hooversville borough are 30 to 34 minutes (54 commuters, 29.8%) for males and 30 to 34 minutes (43 commuters, 33.1%) for females.
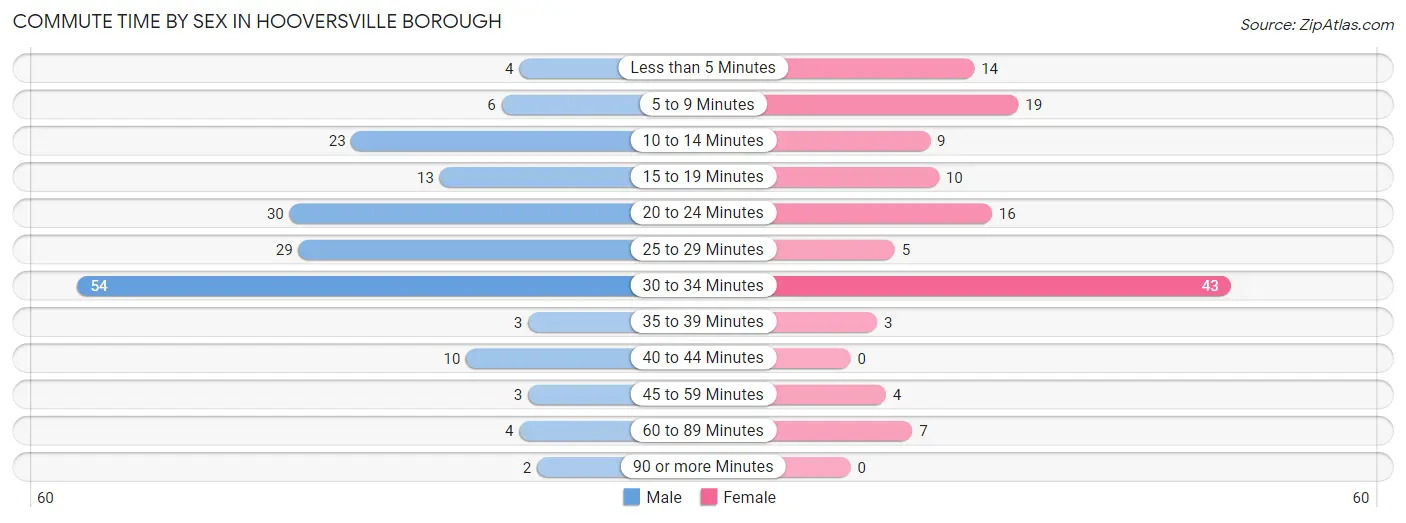
| Commute Time | Male | Female |
| Less than 5 Minutes | 4 (2.2%) | 14 (10.8%) |
| 5 to 9 Minutes | 6 (3.3%) | 19 (14.6%) |
| 10 to 14 Minutes | 23 (12.7%) | 9 (6.9%) |
| 15 to 19 Minutes | 13 (7.2%) | 10 (7.7%) |
| 20 to 24 Minutes | 30 (16.6%) | 16 (12.3%) |
| 25 to 29 Minutes | 29 (16.0%) | 5 (3.8%) |
| 30 to 34 Minutes | 54 (29.8%) | 43 (33.1%) |
| 35 to 39 Minutes | 3 (1.7%) | 3 (2.3%) |
| 40 to 44 Minutes | 10 (5.5%) | 0 (0.0%) |
| 45 to 59 Minutes | 3 (1.7%) | 4 (3.1%) |
| 60 to 89 Minutes | 4 (2.2%) | 7 (5.4%) |
| 90 or more Minutes | 2 (1.1%) | 0 (0.0%) |
Time of Departure to Work by Sex in Hooversville borough
The most frequent times of departure to work in Hooversville borough are 12:00 PM to 3:59 PM (36, 19.9%) for males and 7:00 AM to 7:29 AM (35, 26.9%) for females.
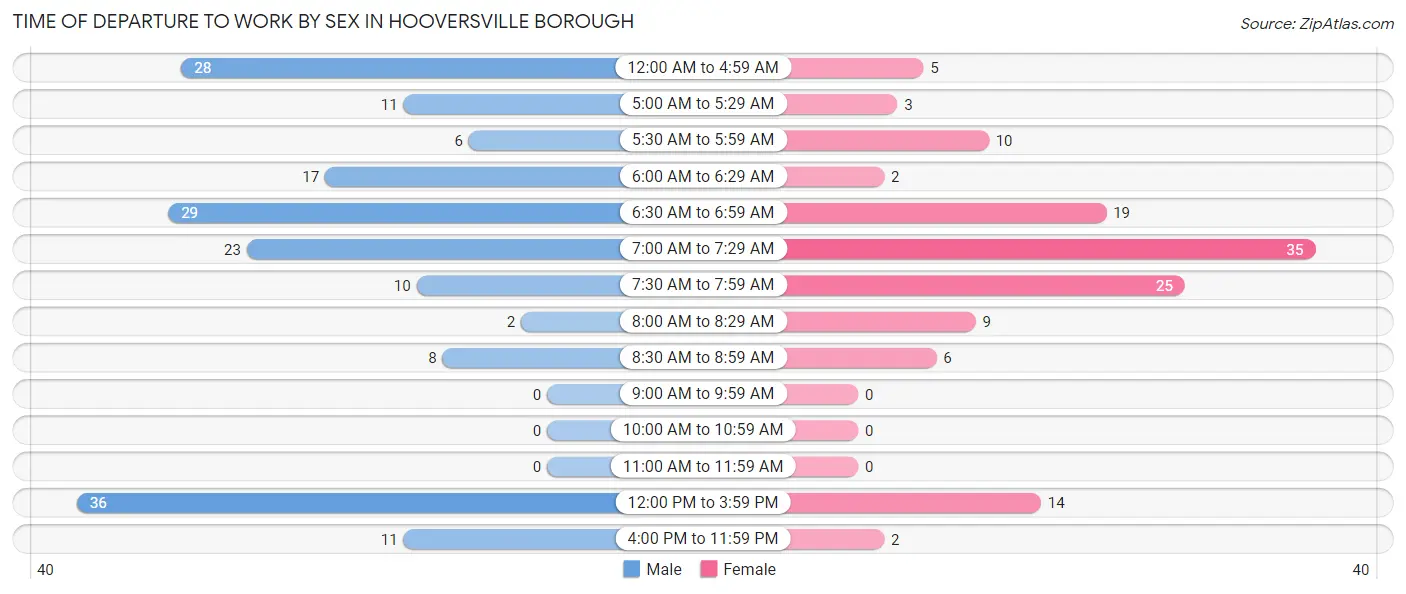
| Time of Departure | Male | Female |
| 12:00 AM to 4:59 AM | 28 (15.5%) | 5 (3.8%) |
| 5:00 AM to 5:29 AM | 11 (6.1%) | 3 (2.3%) |
| 5:30 AM to 5:59 AM | 6 (3.3%) | 10 (7.7%) |
| 6:00 AM to 6:29 AM | 17 (9.4%) | 2 (1.5%) |
| 6:30 AM to 6:59 AM | 29 (16.0%) | 19 (14.6%) |
| 7:00 AM to 7:29 AM | 23 (12.7%) | 35 (26.9%) |
| 7:30 AM to 7:59 AM | 10 (5.5%) | 25 (19.2%) |
| 8:00 AM to 8:29 AM | 2 (1.1%) | 9 (6.9%) |
| 8:30 AM to 8:59 AM | 8 (4.4%) | 6 (4.6%) |
| 9:00 AM to 9:59 AM | 0 (0.0%) | 0 (0.0%) |
| 10:00 AM to 10:59 AM | 0 (0.0%) | 0 (0.0%) |
| 11:00 AM to 11:59 AM | 0 (0.0%) | 0 (0.0%) |
| 12:00 PM to 3:59 PM | 36 (19.9%) | 14 (10.8%) |
| 4:00 PM to 11:59 PM | 11 (6.1%) | 2 (1.5%) |
| Total | 181 (100.0%) | 130 (100.0%) |
Housing Occupancy in Hooversville borough
Occupancy by Ownership in Hooversville borough
Of the total 285 dwellings in Hooversville borough, owner-occupied units account for 237 (83.2%), while renter-occupied units make up 48 (16.8%).
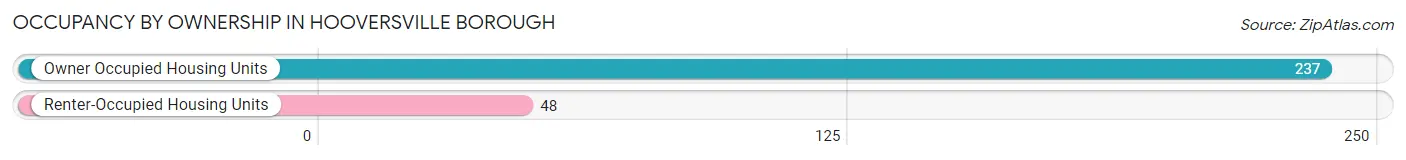
| Occupancy | # Housing Units | % Housing Units |
| Owner Occupied Housing Units | 237 | 83.2% |
| Renter-Occupied Housing Units | 48 | 16.8% |
| Total Occupied Housing Units | 285 | 100.0% |
Occupancy by Household Size in Hooversville borough
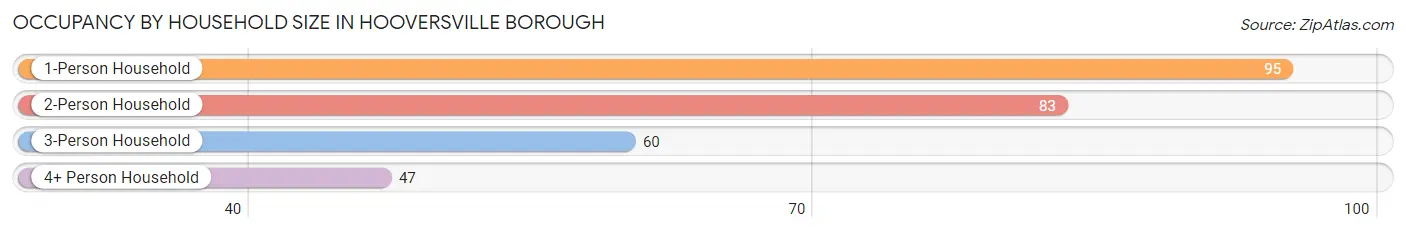
| Household Size | # Housing Units | % Housing Units |
| 1-Person Household | 95 | 33.3% |
| 2-Person Household | 83 | 29.1% |
| 3-Person Household | 60 | 21.0% |
| 4+ Person Household | 47 | 16.5% |
| Total Housing Units | 285 | 100.0% |
Occupancy by Ownership by Household Size in Hooversville borough
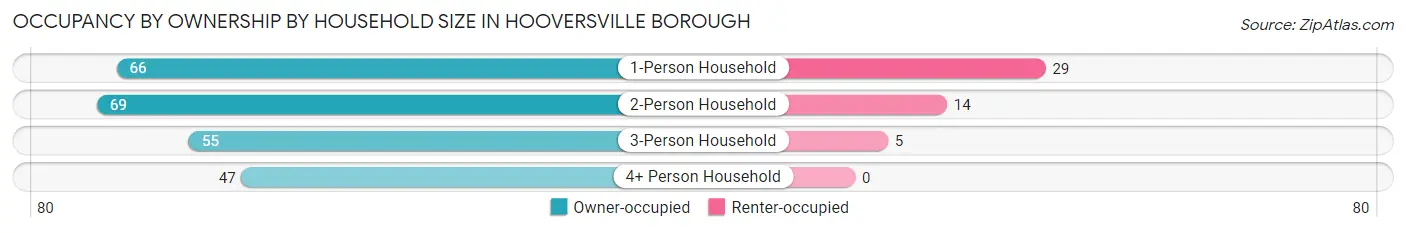
| Household Size | Owner-occupied | Renter-occupied |
| 1-Person Household | 66 (69.5%) | 29 (30.5%) |
| 2-Person Household | 69 (83.1%) | 14 (16.9%) |
| 3-Person Household | 55 (91.7%) | 5 (8.3%) |
| 4+ Person Household | 47 (100.0%) | 0 (0.0%) |
| Total Housing Units | 237 (83.2%) | 48 (16.8%) |
Occupancy by Educational Attainment in Hooversville borough
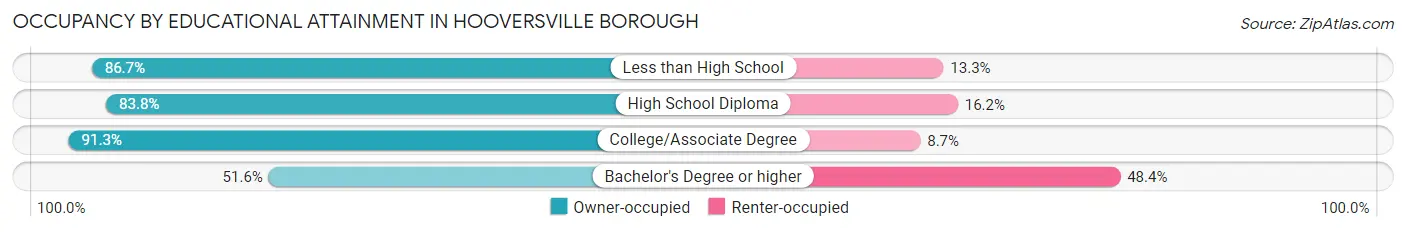
| Household Size | Owner-occupied | Renter-occupied |
| Less than High School | 13 (86.7%) | 2 (13.3%) |
| High School Diploma | 114 (83.8%) | 22 (16.2%) |
| College/Associate Degree | 94 (91.3%) | 9 (8.7%) |
| Bachelor's Degree or higher | 16 (51.6%) | 15 (48.4%) |
Occupancy by Age of Householder in Hooversville borough
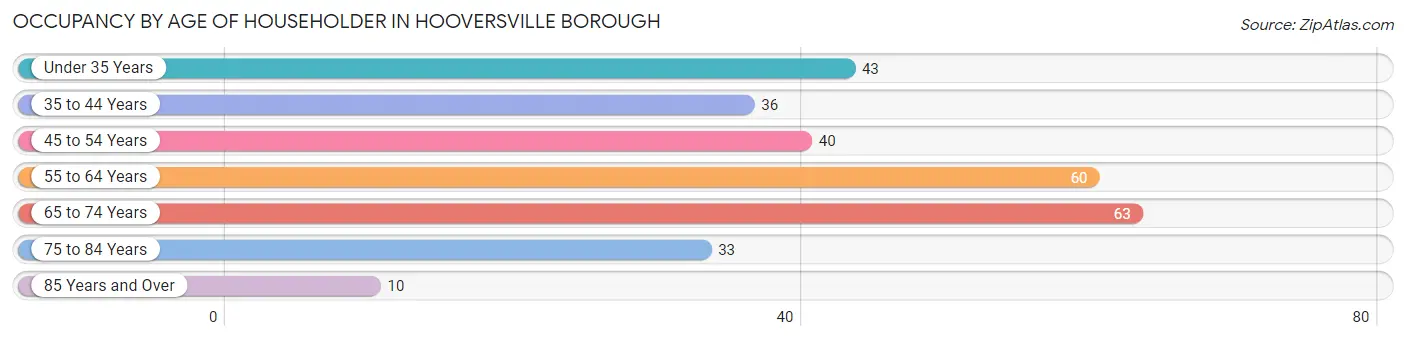
| Age Bracket | # Households | % Households |
| Under 35 Years | 43 | 15.1% |
| 35 to 44 Years | 36 | 12.6% |
| 45 to 54 Years | 40 | 14.0% |
| 55 to 64 Years | 60 | 21.0% |
| 65 to 74 Years | 63 | 22.1% |
| 75 to 84 Years | 33 | 11.6% |
| 85 Years and Over | 10 | 3.5% |
| Total | 285 | 100.0% |
Housing Finances in Hooversville borough
Median Income by Occupancy in Hooversville borough
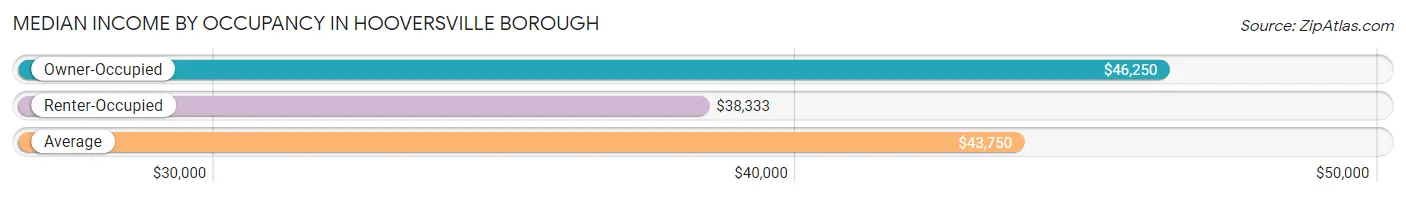
| Occupancy Type | # Households | Median Income |
| Owner-Occupied | 237 (83.2%) | $46,250 |
| Renter-Occupied | 48 (16.8%) | $38,333 |
| Average | 285 (100.0%) | $43,750 |
Occupancy by Householder Income Bracket in Hooversville borough
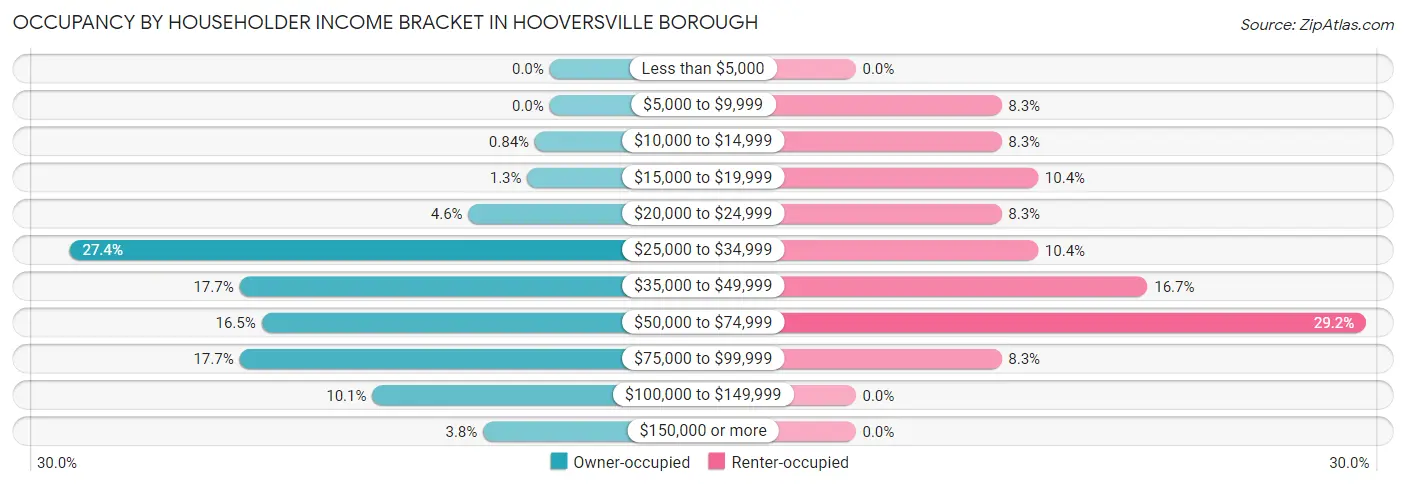
| Income Bracket | Owner-occupied | Renter-occupied |
| Less than $5,000 | 0 (0.0%) | 0 (0.0%) |
| $5,000 to $9,999 | 0 (0.0%) | 4 (8.3%) |
| $10,000 to $14,999 | 2 (0.8%) | 4 (8.3%) |
| $15,000 to $19,999 | 3 (1.3%) | 5 (10.4%) |
| $20,000 to $24,999 | 11 (4.6%) | 4 (8.3%) |
| $25,000 to $34,999 | 65 (27.4%) | 5 (10.4%) |
| $35,000 to $49,999 | 42 (17.7%) | 8 (16.7%) |
| $50,000 to $74,999 | 39 (16.5%) | 14 (29.2%) |
| $75,000 to $99,999 | 42 (17.7%) | 4 (8.3%) |
| $100,000 to $149,999 | 24 (10.1%) | 0 (0.0%) |
| $150,000 or more | 9 (3.8%) | 0 (0.0%) |
| Total | 237 (100.0%) | 48 (100.0%) |
Monthly Housing Cost Tiers in Hooversville borough
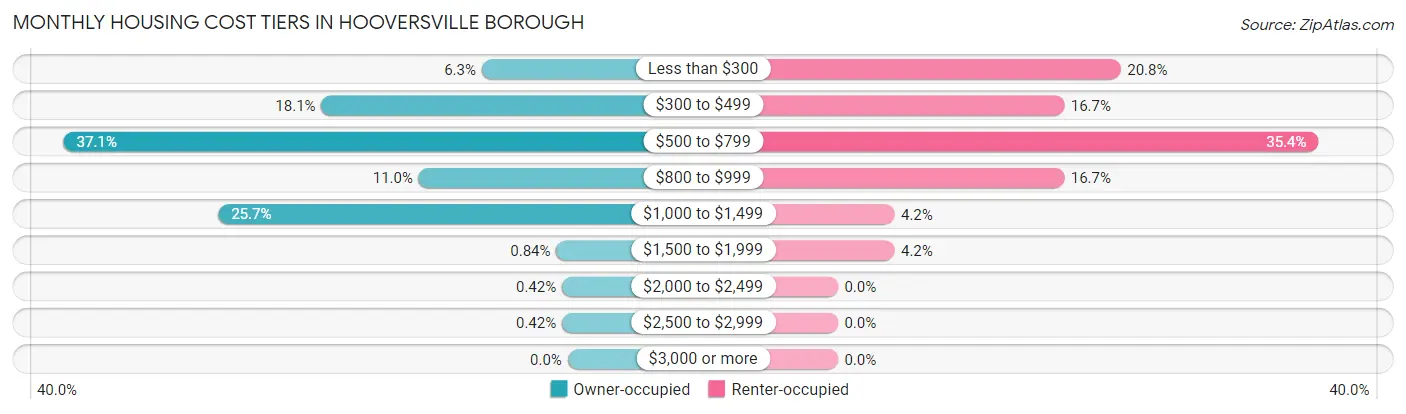
| Monthly Cost | Owner-occupied | Renter-occupied |
| Less than $300 | 15 (6.3%) | 10 (20.8%) |
| $300 to $499 | 43 (18.1%) | 8 (16.7%) |
| $500 to $799 | 88 (37.1%) | 17 (35.4%) |
| $800 to $999 | 26 (11.0%) | 8 (16.7%) |
| $1,000 to $1,499 | 61 (25.7%) | 2 (4.2%) |
| $1,500 to $1,999 | 2 (0.8%) | 2 (4.2%) |
| $2,000 to $2,499 | 1 (0.4%) | 0 (0.0%) |
| $2,500 to $2,999 | 1 (0.4%) | 0 (0.0%) |
| $3,000 or more | 0 (0.0%) | 0 (0.0%) |
| Total | 237 (100.0%) | 48 (100.0%) |
Physical Housing Characteristics in Hooversville borough
Housing Structures in Hooversville borough
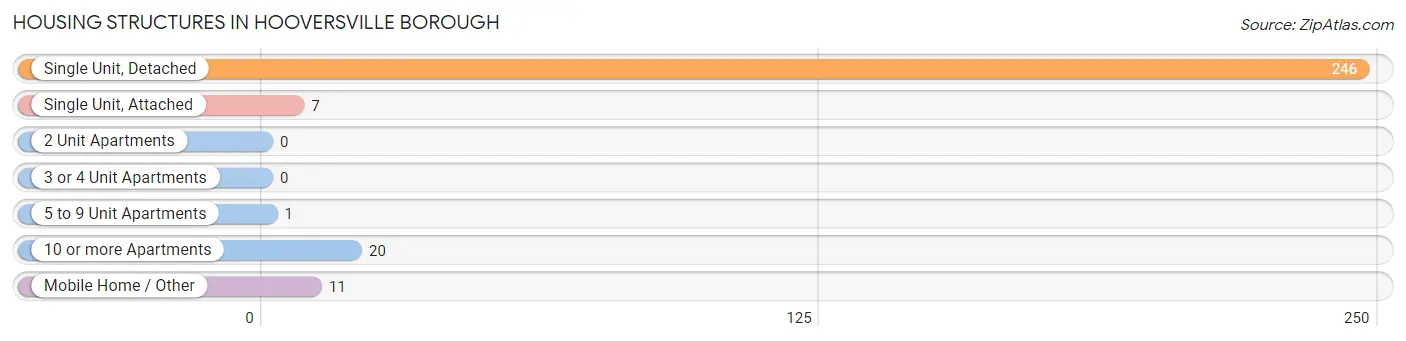
| Structure Type | # Housing Units | % Housing Units |
| Single Unit, Detached | 246 | 86.3% |
| Single Unit, Attached | 7 | 2.5% |
| 2 Unit Apartments | 0 | 0.0% |
| 3 or 4 Unit Apartments | 0 | 0.0% |
| 5 to 9 Unit Apartments | 1 | 0.4% |
| 10 or more Apartments | 20 | 7.0% |
| Mobile Home / Other | 11 | 3.9% |
| Total | 285 | 100.0% |
Housing Structures by Occupancy in Hooversville borough
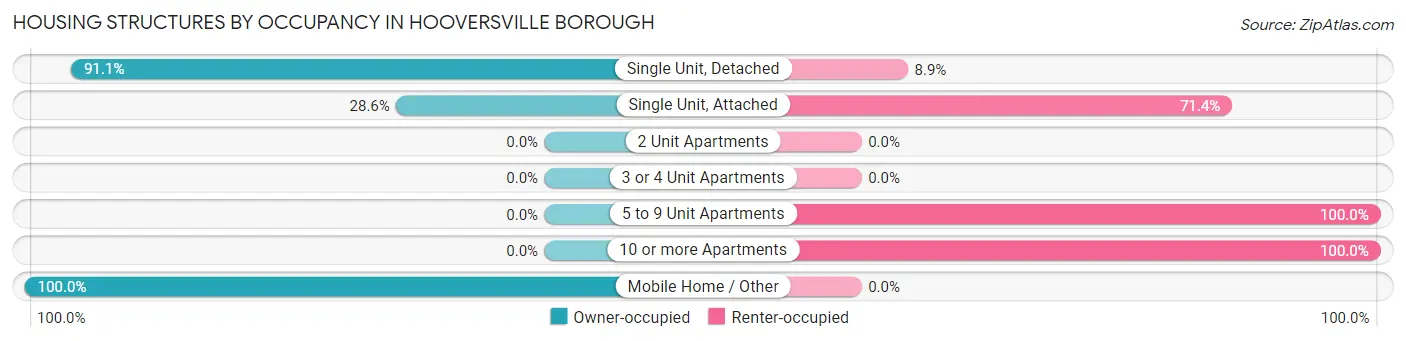
| Structure Type | Owner-occupied | Renter-occupied |
| Single Unit, Detached | 224 (91.1%) | 22 (8.9%) |
| Single Unit, Attached | 2 (28.6%) | 5 (71.4%) |
| 2 Unit Apartments | 0 (0.0%) | 0 (0.0%) |
| 3 or 4 Unit Apartments | 0 (0.0%) | 0 (0.0%) |
| 5 to 9 Unit Apartments | 0 (0.0%) | 1 (100.0%) |
| 10 or more Apartments | 0 (0.0%) | 20 (100.0%) |
| Mobile Home / Other | 11 (100.0%) | 0 (0.0%) |
| Total | 237 (83.2%) | 48 (16.8%) |
Housing Structures by Number of Rooms in Hooversville borough
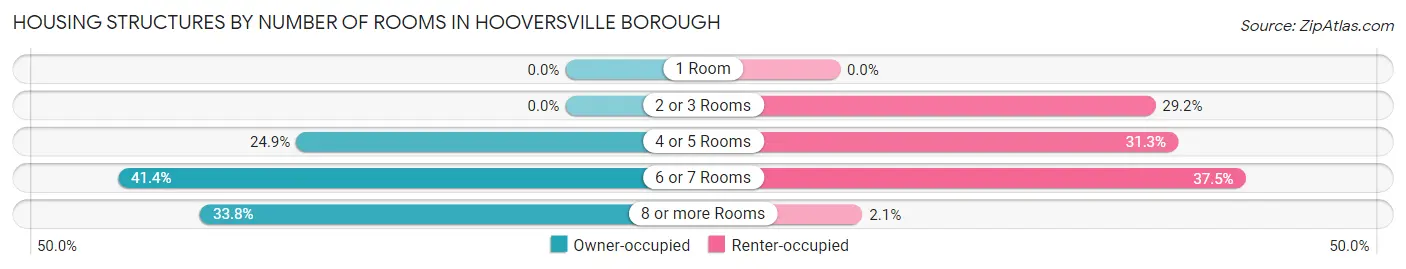
| Number of Rooms | Owner-occupied | Renter-occupied |
| 1 Room | 0 (0.0%) | 0 (0.0%) |
| 2 or 3 Rooms | 0 (0.0%) | 14 (29.2%) |
| 4 or 5 Rooms | 59 (24.9%) | 15 (31.2%) |
| 6 or 7 Rooms | 98 (41.3%) | 18 (37.5%) |
| 8 or more Rooms | 80 (33.8%) | 1 (2.1%) |
| Total | 237 (100.0%) | 48 (100.0%) |
Housing Structure by Heating Type in Hooversville borough
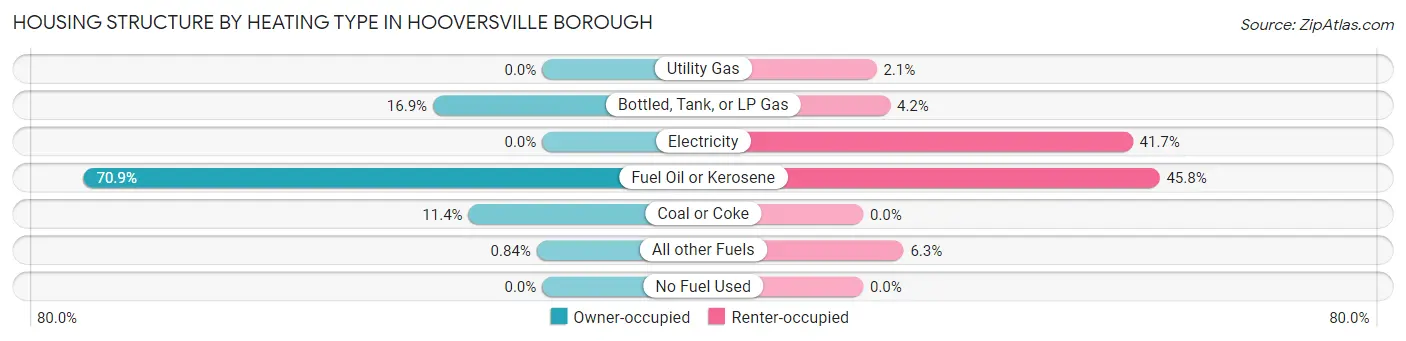
| Heating Type | Owner-occupied | Renter-occupied |
| Utility Gas | 0 (0.0%) | 1 (2.1%) |
| Bottled, Tank, or LP Gas | 40 (16.9%) | 2 (4.2%) |
| Electricity | 0 (0.0%) | 20 (41.7%) |
| Fuel Oil or Kerosene | 168 (70.9%) | 22 (45.8%) |
| Coal or Coke | 27 (11.4%) | 0 (0.0%) |
| All other Fuels | 2 (0.8%) | 3 (6.2%) |
| No Fuel Used | 0 (0.0%) | 0 (0.0%) |
| Total | 237 (100.0%) | 48 (100.0%) |
Household Vehicle Usage in Hooversville borough
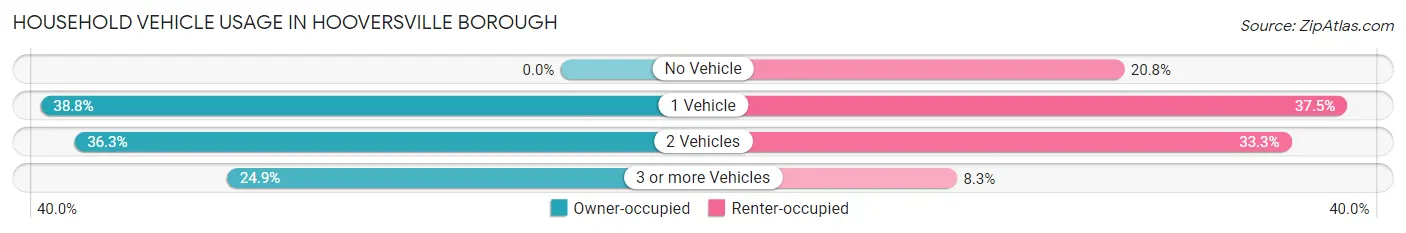
| Vehicles per Household | Owner-occupied | Renter-occupied |
| No Vehicle | 0 (0.0%) | 10 (20.8%) |
| 1 Vehicle | 92 (38.8%) | 18 (37.5%) |
| 2 Vehicles | 86 (36.3%) | 16 (33.3%) |
| 3 or more Vehicles | 59 (24.9%) | 4 (8.3%) |
| Total | 237 (100.0%) | 48 (100.0%) |
Real Estate & Mortgages in Hooversville borough
Real Estate and Mortgage Overview in Hooversville borough
| Characteristic | Without Mortgage | With Mortgage |
| Housing Units | 122 | 115 |
| Median Property Value | $69,300 | $85,200 |
| Median Household Income | $37,500 | $9 |
| Monthly Housing Costs | $508 | $0 |
| Real Estate Taxes | $818 | $0 |
Property Value by Mortgage Status in Hooversville borough
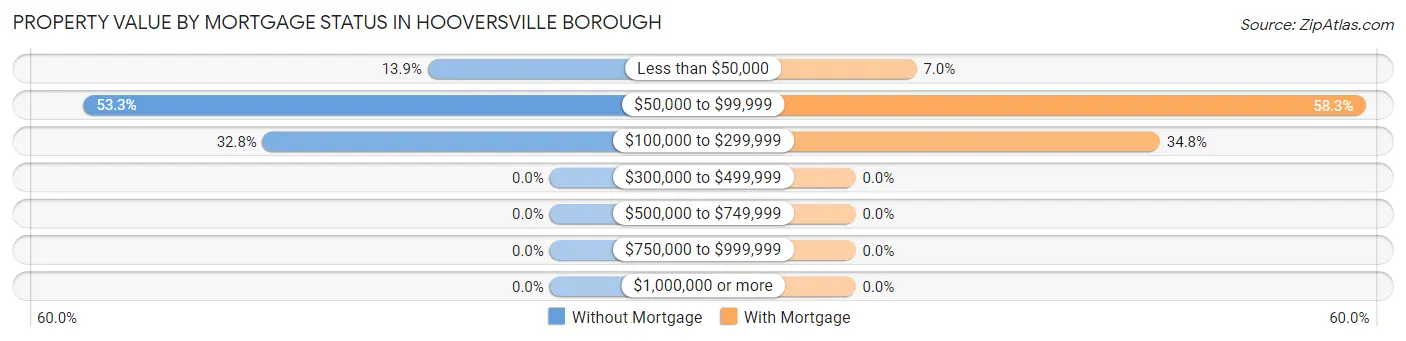
| Property Value | Without Mortgage | With Mortgage |
| Less than $50,000 | 17 (13.9%) | 8 (7.0%) |
| $50,000 to $99,999 | 65 (53.3%) | 67 (58.3%) |
| $100,000 to $299,999 | 40 (32.8%) | 40 (34.8%) |
| $300,000 to $499,999 | 0 (0.0%) | 0 (0.0%) |
| $500,000 to $749,999 | 0 (0.0%) | 0 (0.0%) |
| $750,000 to $999,999 | 0 (0.0%) | 0 (0.0%) |
| $1,000,000 or more | 0 (0.0%) | 0 (0.0%) |
| Total | 122 (100.0%) | 115 (100.0%) |
Household Income by Mortgage Status in Hooversville borough
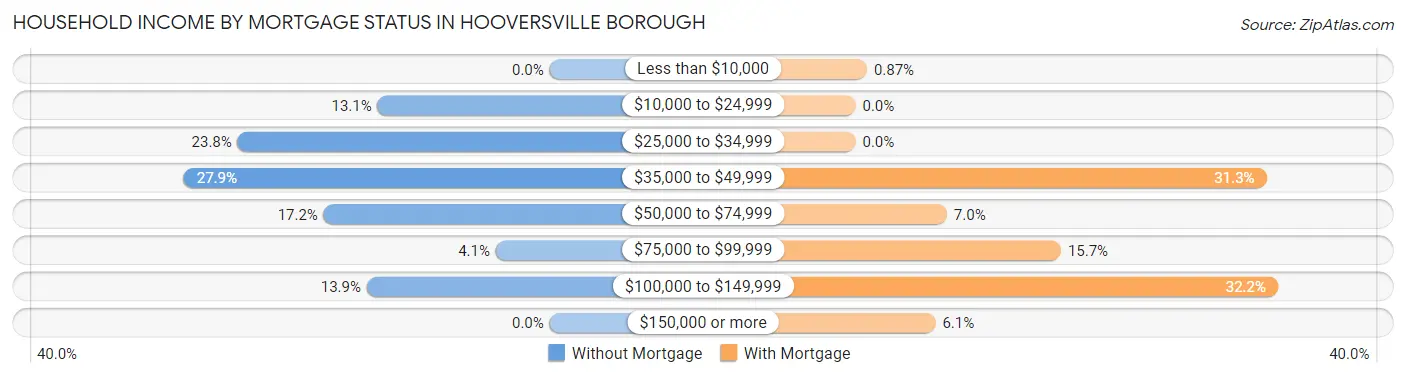
| Household Income | Without Mortgage | With Mortgage |
| Less than $10,000 | 0 (0.0%) | 1 (0.9%) |
| $10,000 to $24,999 | 16 (13.1%) | 0 (0.0%) |
| $25,000 to $34,999 | 29 (23.8%) | 0 (0.0%) |
| $35,000 to $49,999 | 34 (27.9%) | 36 (31.3%) |
| $50,000 to $74,999 | 21 (17.2%) | 8 (7.0%) |
| $75,000 to $99,999 | 5 (4.1%) | 18 (15.7%) |
| $100,000 to $149,999 | 17 (13.9%) | 37 (32.2%) |
| $150,000 or more | 0 (0.0%) | 7 (6.1%) |
| Total | 122 (100.0%) | 115 (100.0%) |
Property Value to Household Income Ratio in Hooversville borough
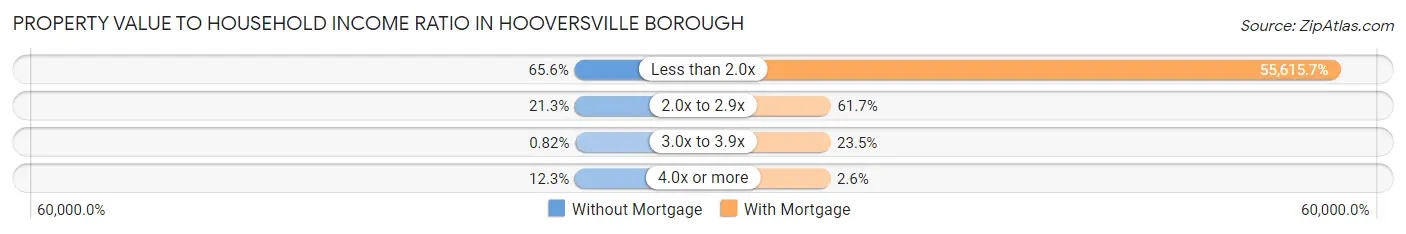
| Value-to-Income Ratio | Without Mortgage | With Mortgage |
| Less than 2.0x | 80 (65.6%) | 63,958 (55,615.7%) |
| 2.0x to 2.9x | 26 (21.3%) | 71 (61.7%) |
| 3.0x to 3.9x | 1 (0.8%) | 27 (23.5%) |
| 4.0x or more | 15 (12.3%) | 3 (2.6%) |
| Total | 122 (100.0%) | 115 (100.0%) |
Real Estate Taxes by Mortgage Status in Hooversville borough
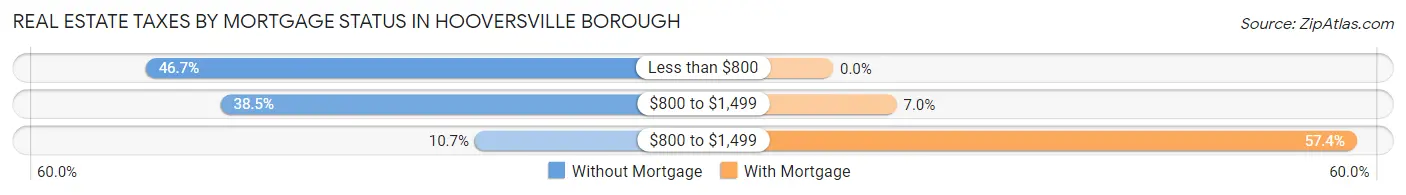
| Property Taxes | Without Mortgage | With Mortgage |
| Less than $800 | 57 (46.7%) | 0 (0.0%) |
| $800 to $1,499 | 47 (38.5%) | 8 (7.0%) |
| $800 to $1,499 | 13 (10.7%) | 66 (57.4%) |
| Total | 122 (100.0%) | 115 (100.0%) |
Health & Disability in Hooversville borough
Health Insurance Coverage by Age in Hooversville borough
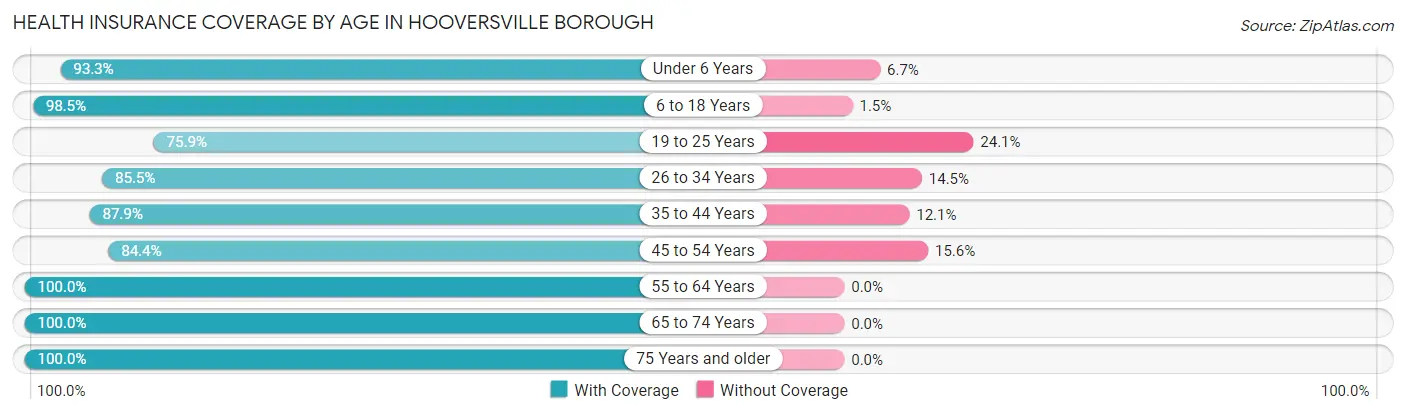
| Age Bracket | With Coverage | Without Coverage |
| Under 6 Years | 28 (93.3%) | 2 (6.7%) |
| 6 to 18 Years | 129 (98.5%) | 2 (1.5%) |
| 19 to 25 Years | 41 (75.9%) | 13 (24.1%) |
| 26 to 34 Years | 71 (85.5%) | 12 (14.5%) |
| 35 to 44 Years | 58 (87.9%) | 8 (12.1%) |
| 45 to 54 Years | 81 (84.4%) | 15 (15.6%) |
| 55 to 64 Years | 79 (100.0%) | 0 (0.0%) |
| 65 to 74 Years | 124 (100.0%) | 0 (0.0%) |
| 75 Years and older | 57 (100.0%) | 0 (0.0%) |
| Total | 668 (92.8%) | 52 (7.2%) |
Health Insurance Coverage by Citizenship Status in Hooversville borough
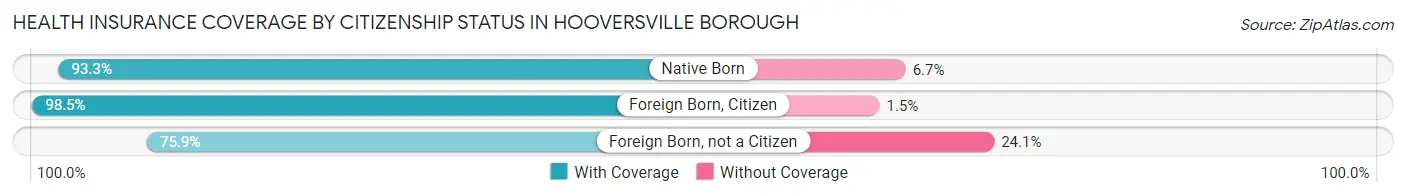
| Citizenship Status | With Coverage | Without Coverage |
| Native Born | 28 (93.3%) | 2 (6.7%) |
| Foreign Born, Citizen | 129 (98.5%) | 2 (1.5%) |
| Foreign Born, not a Citizen | 41 (75.9%) | 13 (24.1%) |
Health Insurance Coverage by Household Income in Hooversville borough
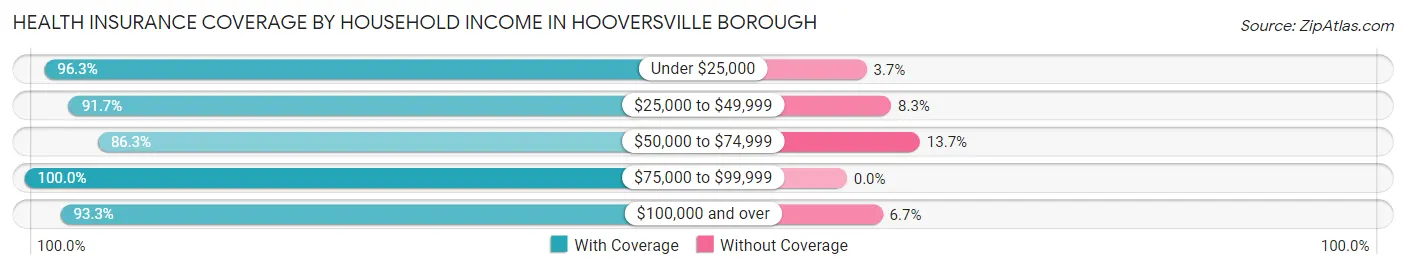
| Household Income | With Coverage | Without Coverage |
| Under $25,000 | 52 (96.3%) | 2 (3.7%) |
| $25,000 to $49,999 | 232 (91.7%) | 21 (8.3%) |
| $50,000 to $74,999 | 126 (86.3%) | 20 (13.7%) |
| $75,000 to $99,999 | 133 (100.0%) | 0 (0.0%) |
| $100,000 and over | 125 (93.3%) | 9 (6.7%) |
Public vs Private Health Insurance Coverage by Age in Hooversville borough
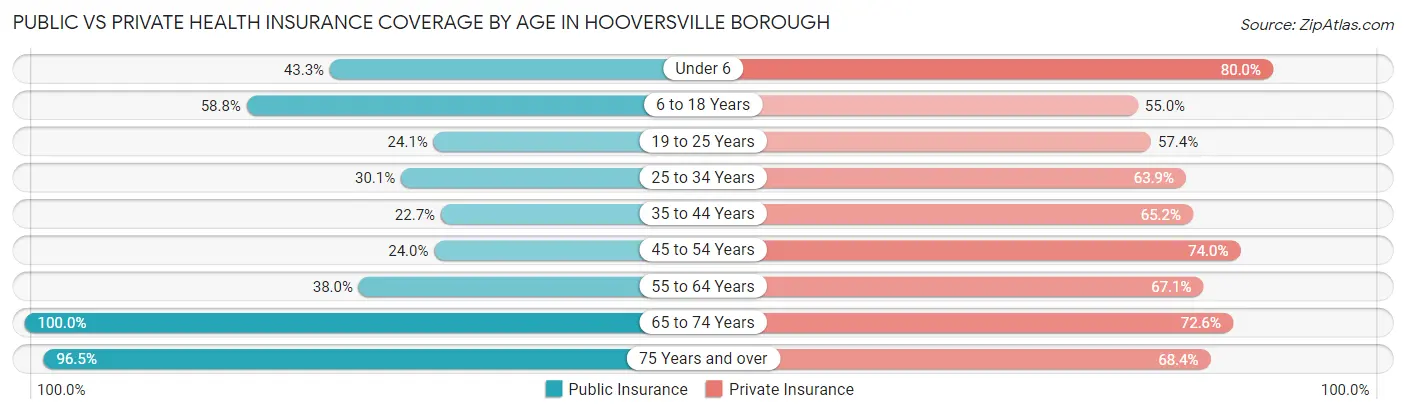
| Age Bracket | Public Insurance | Private Insurance |
| Under 6 | 13 (43.3%) | 24 (80.0%) |
| 6 to 18 Years | 77 (58.8%) | 72 (55.0%) |
| 19 to 25 Years | 13 (24.1%) | 31 (57.4%) |
| 25 to 34 Years | 25 (30.1%) | 53 (63.9%) |
| 35 to 44 Years | 15 (22.7%) | 43 (65.1%) |
| 45 to 54 Years | 23 (24.0%) | 71 (74.0%) |
| 55 to 64 Years | 30 (38.0%) | 53 (67.1%) |
| 65 to 74 Years | 124 (100.0%) | 90 (72.6%) |
| 75 Years and over | 55 (96.5%) | 39 (68.4%) |
| Total | 375 (52.1%) | 476 (66.1%) |
Disability Status by Sex by Age in Hooversville borough
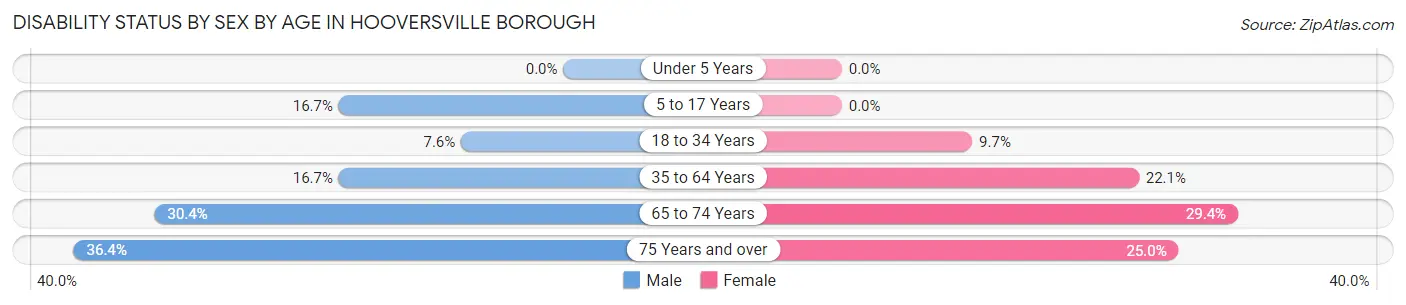
| Age Bracket | Male | Female |
| Under 5 Years | 0 (0.0%) | 0 (0.0%) |
| 5 to 17 Years | 16 (16.7%) | 0 (0.0%) |
| 18 to 34 Years | 6 (7.6%) | 6 (9.7%) |
| 35 to 64 Years | 19 (16.7%) | 28 (22.1%) |
| 65 to 74 Years | 17 (30.4%) | 20 (29.4%) |
| 75 Years and over | 12 (36.4%) | 6 (25.0%) |
Disability Class by Sex by Age in Hooversville borough
Disability Class: Hearing Difficulty
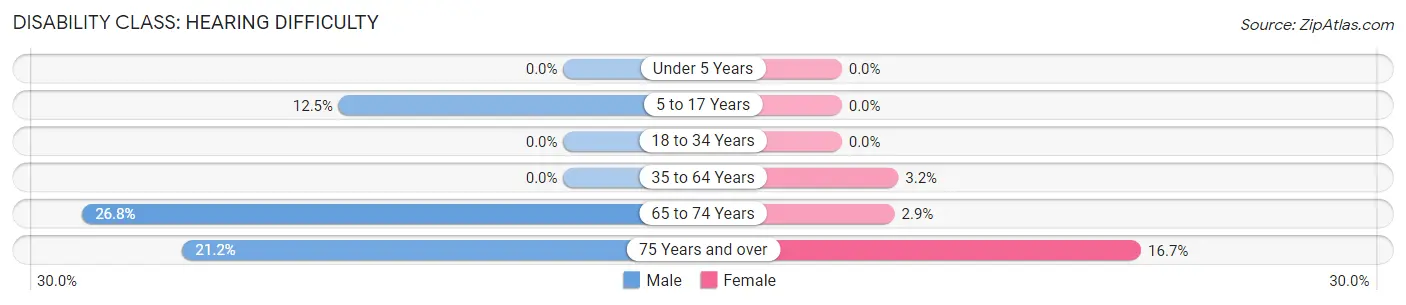
| Age Bracket | Male | Female |
| Under 5 Years | 0 (0.0%) | 0 (0.0%) |
| 5 to 17 Years | 12 (12.5%) | 0 (0.0%) |
| 18 to 34 Years | 0 (0.0%) | 0 (0.0%) |
| 35 to 64 Years | 0 (0.0%) | 4 (3.2%) |
| 65 to 74 Years | 15 (26.8%) | 2 (2.9%) |
| 75 Years and over | 7 (21.2%) | 4 (16.7%) |
Disability Class: Vision Difficulty
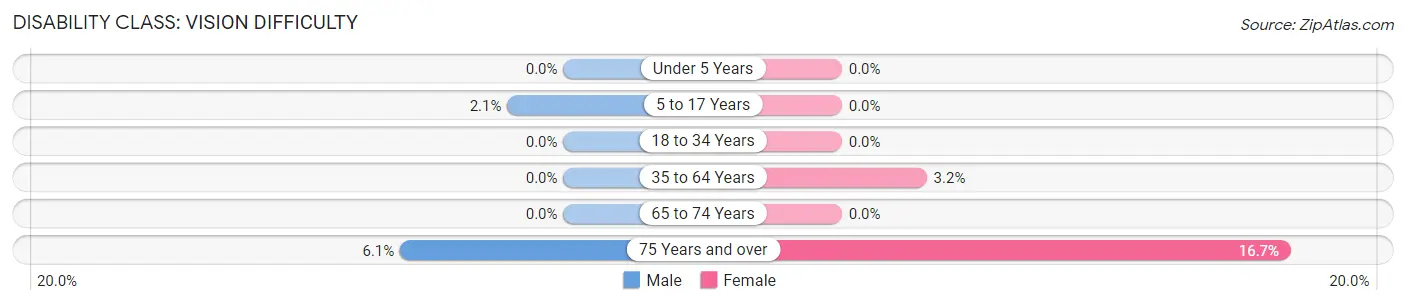
| Age Bracket | Male | Female |
| Under 5 Years | 0 (0.0%) | 0 (0.0%) |
| 5 to 17 Years | 2 (2.1%) | 0 (0.0%) |
| 18 to 34 Years | 0 (0.0%) | 0 (0.0%) |
| 35 to 64 Years | 0 (0.0%) | 4 (3.2%) |
| 65 to 74 Years | 0 (0.0%) | 0 (0.0%) |
| 75 Years and over | 2 (6.1%) | 4 (16.7%) |
Disability Class: Cognitive Difficulty
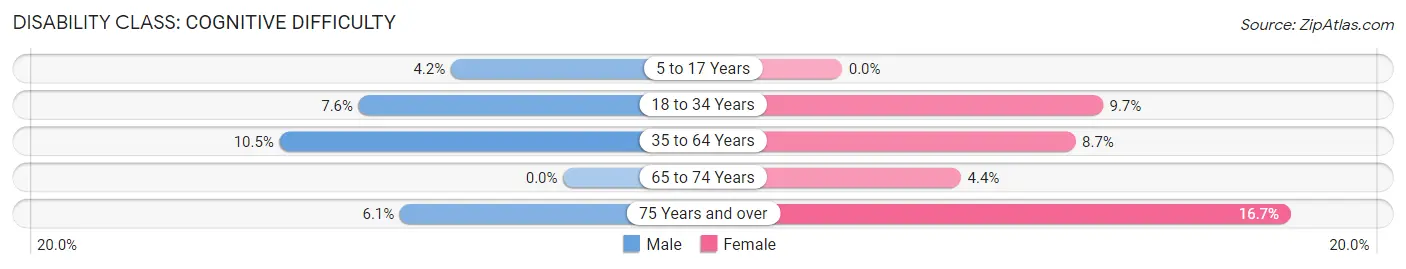
| Age Bracket | Male | Female |
| 5 to 17 Years | 4 (4.2%) | 0 (0.0%) |
| 18 to 34 Years | 6 (7.6%) | 6 (9.7%) |
| 35 to 64 Years | 12 (10.5%) | 11 (8.7%) |
| 65 to 74 Years | 0 (0.0%) | 3 (4.4%) |
| 75 Years and over | 2 (6.1%) | 4 (16.7%) |
Disability Class: Ambulatory Difficulty
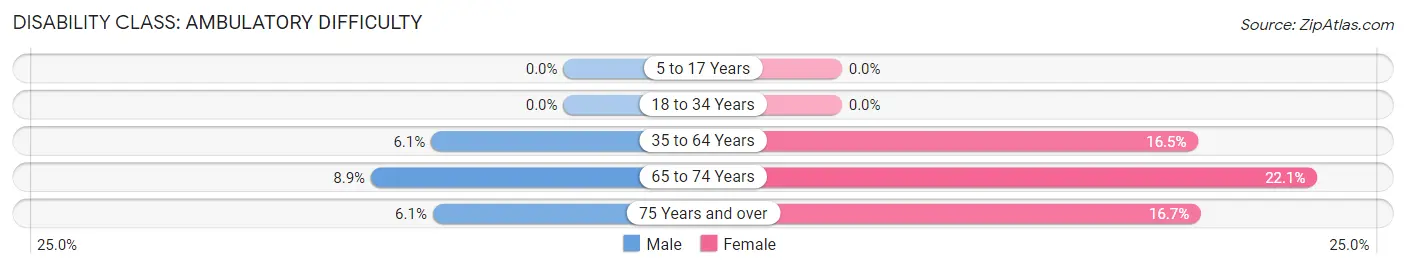
| Age Bracket | Male | Female |
| 5 to 17 Years | 0 (0.0%) | 0 (0.0%) |
| 18 to 34 Years | 0 (0.0%) | 0 (0.0%) |
| 35 to 64 Years | 7 (6.1%) | 21 (16.5%) |
| 65 to 74 Years | 5 (8.9%) | 15 (22.1%) |
| 75 Years and over | 2 (6.1%) | 4 (16.7%) |
Disability Class: Self-Care Difficulty
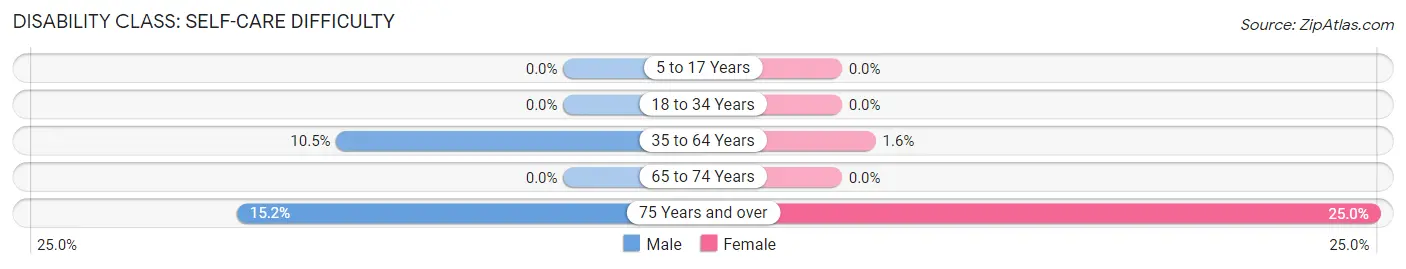
| Age Bracket | Male | Female |
| 5 to 17 Years | 0 (0.0%) | 0 (0.0%) |
| 18 to 34 Years | 0 (0.0%) | 0 (0.0%) |
| 35 to 64 Years | 12 (10.5%) | 2 (1.6%) |
| 65 to 74 Years | 0 (0.0%) | 0 (0.0%) |
| 75 Years and over | 5 (15.1%) | 6 (25.0%) |
Technology Access in Hooversville borough
Computing Device Access in Hooversville borough
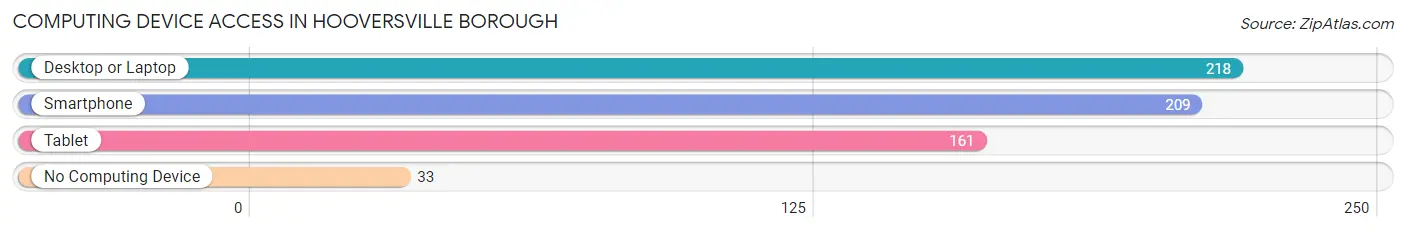
| Device Type | # Households | % Households |
| Desktop or Laptop | 218 | 76.5% |
| Smartphone | 209 | 73.3% |
| Tablet | 161 | 56.5% |
| No Computing Device | 33 | 11.6% |
| Total | 285 | 100.0% |
Internet Access in Hooversville borough
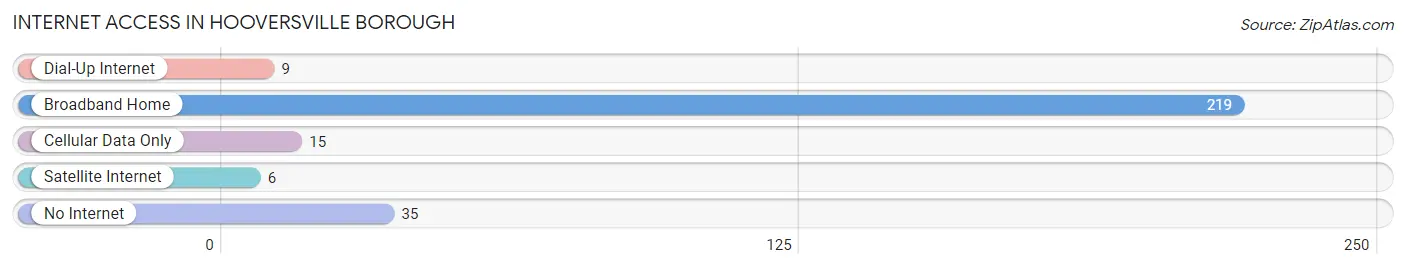
| Internet Type | # Households | % Households |
| Dial-Up Internet | 9 | 3.2% |
| Broadband Home | 219 | 76.8% |
| Cellular Data Only | 15 | 5.3% |
| Satellite Internet | 6 | 2.1% |
| No Internet | 35 | 12.3% |
| Total | 285 | 100.0% |
Hooversville borough Summary
Hooversville Borough is a small borough located in Somerset County, Pennsylvania. It is situated in the foothills of the Allegheny Mountains and is part of the Johnstown Metropolitan Statistical Area. The borough has a population of approximately 1,000 people and covers an area of 0.3 square miles.
History
Hooversville Borough was founded in 1845 by John Hoover, a German immigrant who had settled in the area in 1835. He purchased a tract of land from the local Native Americans and established a small village. The village was named after him and was incorporated as a borough in 1876.
The borough was originally a farming community, but it soon developed into a small industrial center. The first industry to be established in the borough was a sawmill, which was built in 1845. This was followed by a gristmill, a tannery, and a woolen mill. The borough also had a number of small businesses, including a general store, a blacksmith shop, and a hotel.
The borough experienced a period of growth in the late 19th and early 20th centuries. The population increased from just over 500 in 1880 to nearly 1,000 in 1910. This growth was due in part to the construction of the Pennsylvania Railroad, which ran through the borough. The railroad provided a convenient way for people to travel to and from the borough and allowed for the shipment of goods to and from the area.
The borough experienced a decline in the mid-20th century as the local industries began to close. The last industry to close was the woolen mill in the 1960s. The population of the borough also declined during this time, falling to just over 500 by the 2000 census.
Geography
Hooversville Borough is located in the foothills of the Allegheny Mountains in Somerset County, Pennsylvania. The borough is situated at an elevation of 1,400 feet and covers an area of 0.3 square miles. The borough is bordered to the north by Quemahoning Township, to the east by Stonycreek Township, to the south by Conemaugh Township, and to the west by Paint Township.
The borough is located in a rural area and is surrounded by farmland. The nearest major city is Johnstown, which is located approximately 20 miles to the east. The borough is also located near several state parks, including Laurel Hill State Park, Laurel Ridge State Park, and Kooser State Park.
Economy
Hooversville Borough has a small economy that is largely based on agriculture and tourism. The borough is home to several small businesses, including a general store, a hardware store, and a restaurant. The borough also has a number of bed and breakfast establishments.
The borough is also home to a number of small manufacturing companies, including a furniture manufacturer and a metal fabrication company. The borough is also home to a number of small farms, which produce a variety of crops, including corn, soybeans, and hay.
Demographics
According to the 2010 census, the population of Hooversville Borough was 1,000. The racial makeup of the borough was 97.2% White, 0.7% African American, 0.2% Native American, 0.2% Asian, and 1.7% from other races. The median household income was $37,500 and the median family income was $45,000.
The borough has a high rate of poverty, with 24.2% of the population living below the poverty line. The unemployment rate was 8.2%. The largest age group in the borough was 45-64, which made up 33.2% of the population. The median age was 43.7 years.
Common Questions
What is the Total Population of Hooversville borough?
Total Population of Hooversville borough is 722.
What is the Total Male Population of Hooversville borough?
Total Male Population of Hooversville borough is 396.
What is the Total Female Population of Hooversville borough?
Total Female Population of Hooversville borough is 326.
What is the Ratio of Males per 100 Females in Hooversville borough?
There are 121.47 Males per 100 Females in Hooversville borough.
What is the Ratio of Females per 100 Males in Hooversville borough?
There are 82.32 Females per 100 Males in Hooversville borough.
What is the Median Population Age in Hooversville borough?
Median Population Age in Hooversville borough is 43.5 Years.
What is the Average Family Size in Hooversville borough
Average Family Size in Hooversville borough is 3.2 People.
What is the Average Household Size in Hooversville borough
Average Household Size in Hooversville borough is 2.5 People.
What is Per Capita Income in Hooversville borough?
Per Capita income in Hooversville borough is $23,719.
What is the Median Family Income in Hooversville borough?
Median Family Income in Hooversville borough is $61,319.
What is the Median Household income in Hooversville borough?
Median Household Income in Hooversville borough is $43,750.
What is Income or Wage Gap in Hooversville borough?
Income or Wage Gap in Hooversville borough is 13.4%.
Women in Hooversville borough earn 86.6 cents for every dollar earned by a man.
What is Inequality or Gini Index in Hooversville borough?
Inequality or Gini Index in Hooversville borough is 0.35.
How Large is the Labor Force in Hooversville borough?
There are 352 People in the Labor Forcein in Hooversville borough.
What is the Percentage of People in the Labor Force in Hooversville borough?
58.9% of People are in the Labor Force in Hooversville borough.
What is the Unemployment Rate in Hooversville borough?
Unemployment Rate in Hooversville borough is 3.1%.