Nittany, PA
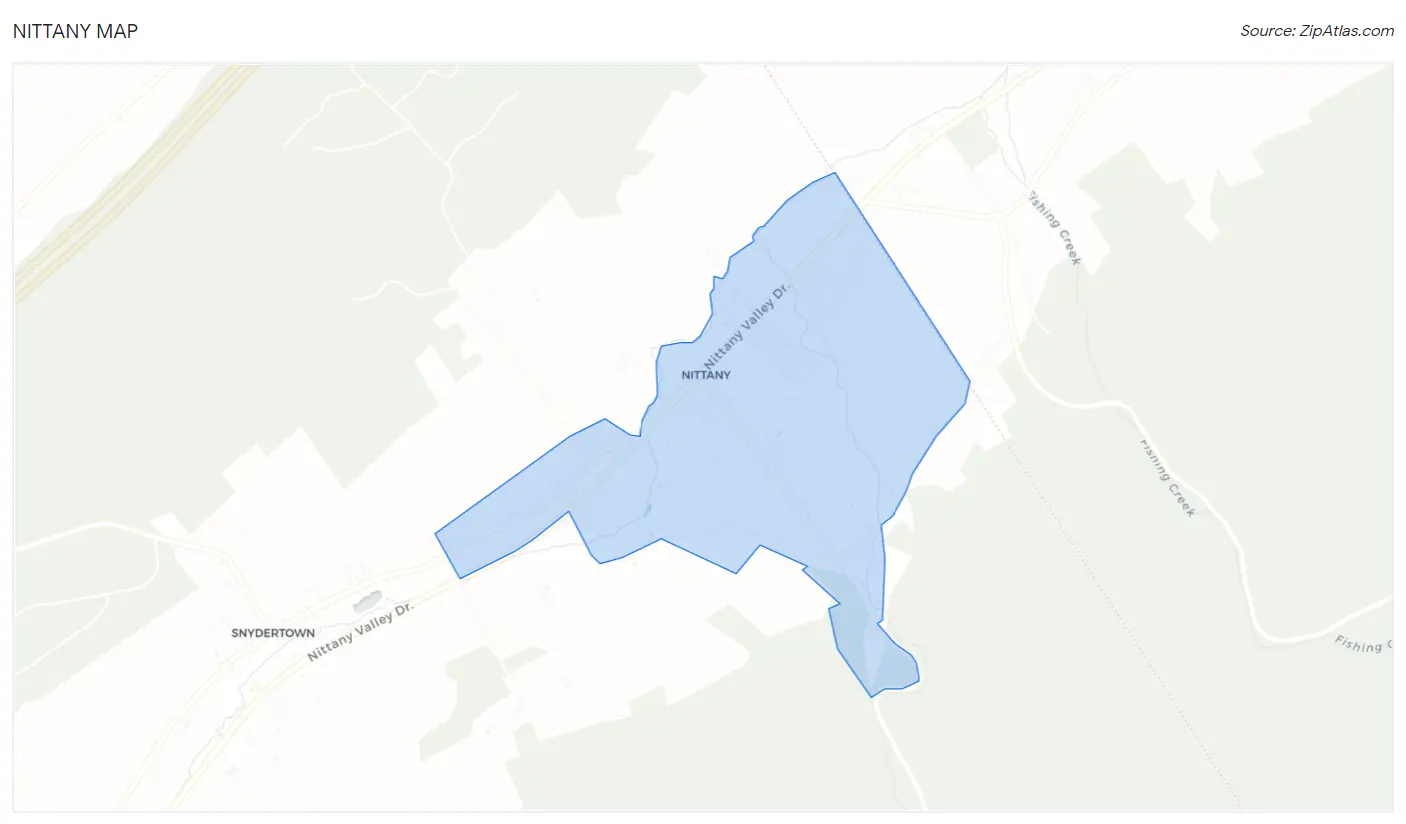
Nittany Map
Nittany Overview
849
TOTAL POPULATION
349
MALE POPULATION
500
FEMALE POPULATION
69.80
MALES / 100 FEMALES
143.27
FEMALES / 100 MALES
37.5
MEDIAN AGE
4.7
AVG FAMILY SIZE
5.1
AVG HOUSEHOLD SIZE
$24,940
PER CAPITA INCOME
$103,500
AVG FAMILY INCOME
$103,500
AVG HOUSEHOLD INCOME
40.9%
WAGE / INCOME GAP [ % ]
59.1¢/ $1
WAGE / INCOME GAP [ $ ]
0.38
INEQUALITY / GINI INDEX
457
LABOR FORCE [ PEOPLE ]
67.2%
PERCENT IN LABOR FORCE
Race in Nittany
The most populous races in Nittany are White / Caucasian (630 | 74.2%), Hispanic or Latino (125 | 14.7%), and Two or more Races (125 | 14.7%).
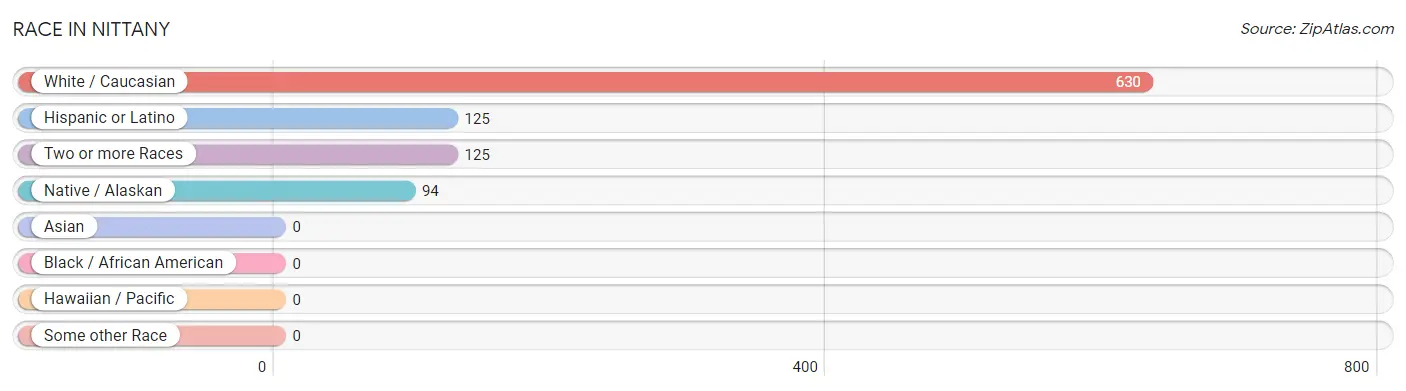
| Race | # Population | % Population |
| Asian | 0 | 0.0% |
| Black / African American | 0 | 0.0% |
| Hawaiian / Pacific | 0 | 0.0% |
| Hispanic or Latino | 125 | 14.7% |
| Native / Alaskan | 94 | 11.1% |
| White / Caucasian | 630 | 74.2% |
| Two or more Races | 125 | 14.7% |
| Some other Race | 0 | 0.0% |
| Total | 849 | 100.0% |
Ancestry in Nittany
The most populous ancestries reported in Nittany are German (278 | 32.7%), English (217 | 25.6%), Navajo (166 | 19.6%), Spanish (125 | 14.7%), and American (106 | 12.5%), together accounting for 105.1% of all Nittany residents.
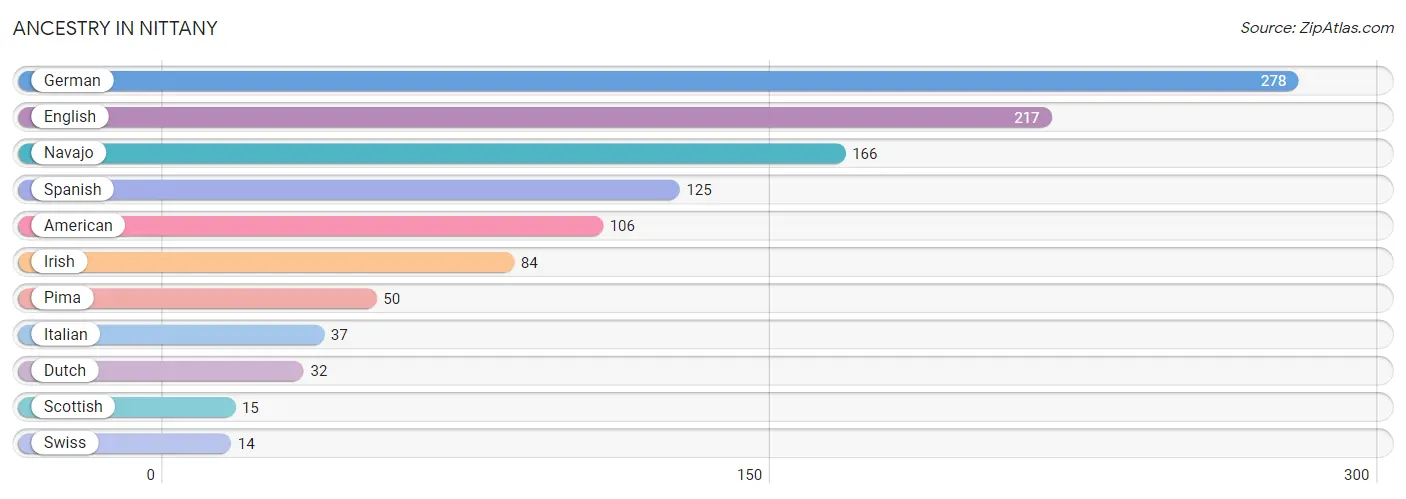
| Ancestry | # Population | % Population |
| American | 106 | 12.5% |
| Dutch | 32 | 3.8% |
| English | 217 | 25.6% |
| German | 278 | 32.7% |
| Irish | 84 | 9.9% |
| Italian | 37 | 4.4% |
| Navajo | 166 | 19.6% |
| Pima | 50 | 5.9% |
| Scottish | 15 | 1.8% |
| Spanish | 125 | 14.7% |
| Swiss | 14 | 1.7% | View All 11 Rows |
Immigrants in Nittany

| Immigration Origin | # Population | % Population | View All 0 Rows |
Sex and Age in Nittany
Sex and Age in Nittany
The most populous age groups in Nittany are 20 to 24 Years (70 | 20.1%) for men and 25 to 29 Years (66 | 13.2%) for women.
| Age Bracket | Male | Female |
| Under 5 Years | 17 (4.9%) | 0 (0.0%) |
| 5 to 9 Years | 0 (0.0%) | 64 (12.8%) |
| 10 to 14 Years | 29 (8.3%) | 59 (11.8%) |
| 15 to 19 Years | 22 (6.3%) | 43 (8.6%) |
| 20 to 24 Years | 70 (20.1%) | 25 (5.0%) |
| 25 to 29 Years | 0 (0.0%) | 66 (13.2%) |
| 30 to 34 Years | 23 (6.6%) | 0 (0.0%) |
| 35 to 39 Years | 53 (15.2%) | 38 (7.6%) |
| 40 to 44 Years | 0 (0.0%) | 38 (7.6%) |
| 45 to 49 Years | 46 (13.2%) | 33 (6.6%) |
| 50 to 54 Years | 20 (5.7%) | 29 (5.8%) |
| 55 to 59 Years | 37 (10.6%) | 21 (4.2%) |
| 60 to 64 Years | 17 (4.9%) | 32 (6.4%) |
| 65 to 69 Years | 0 (0.0%) | 15 (3.0%) |
| 70 to 74 Years | 0 (0.0%) | 0 (0.0%) |
| 75 to 79 Years | 0 (0.0%) | 22 (4.4%) |
| 80 to 84 Years | 15 (4.3%) | 15 (3.0%) |
| 85 Years and over | 0 (0.0%) | 0 (0.0%) |
| Total | 349 (100.0%) | 500 (100.0%) |
Families and Households in Nittany
Median Family Size in Nittany
| Family Type | # Families | Family Size |
| Married-Couple | 150 (90.4%) | 5.01 |
| Single Male/Father | 0 (0.0%) | - |
| Single Female/Mother | 16 (9.6%) | 1.88 |
| Total Families | 166 (100.0%) | 4.70 |
Median Household Size in Nittany
| Household Type | # Households | Household Size |
| Married-Couple | 150 (90.4%) | 5.46 |
| Single Male/Father | 0 (0.0%) | - |
| Single Female/Mother | 16 (9.6%) | 1.88 |
| Non-family | 0 (0.0%) | - |
| Total Households | 166 (100.0%) | 5.11 |
Household Size by Marriage Status in Nittany
| Household Size | Family Households | Nonfamily Households |
| 1-Person Households | - | 0 (0.0%) |
| 2-Person Households | 48 (28.9%) | 0 (0.0%) |
| 3-Person Households | 15 (9.0%) | 0 (0.0%) |
| 4-Person Households | 51 (30.7%) | 0 (0.0%) |
| 5-Person Households | 20 (12.0%) | 0 (0.0%) |
| 6-Person Households | 0 (0.0%) | 0 (0.0%) |
| 7+ Person Households | 32 (19.3%) | 0 (0.0%) |
| Total | 166 (100.0%) | 0 (0.0%) |
Female Fertility in Nittany
Fertility by Age in Nittany
| Age Bracket | Women with Births | Births / 1,000 Women |
| 15 to 19 years | 0 (0.0%) | 0.0 |
| 20 to 34 years | 0 (0.0%) | 0.0 |
| 35 to 50 years | 0 (0.0%) | 0.0 |
| Total | 0 (0.0%) | 0.0 |
Fertility by Age by Marriage Status in Nittany
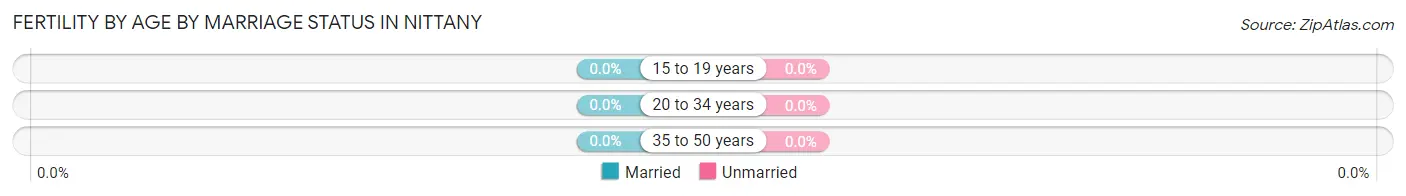
| Age Bracket | Married | Unmarried |
| 15 to 19 years | 0 (0.0%) | 0 (0.0%) |
| 20 to 34 years | 0 (0.0%) | 0 (0.0%) |
| 35 to 50 years | 0 (0.0%) | 0 (0.0%) |
| Total | 0 (0.0%) | 0 (0.0%) |
Fertility by Education in Nittany
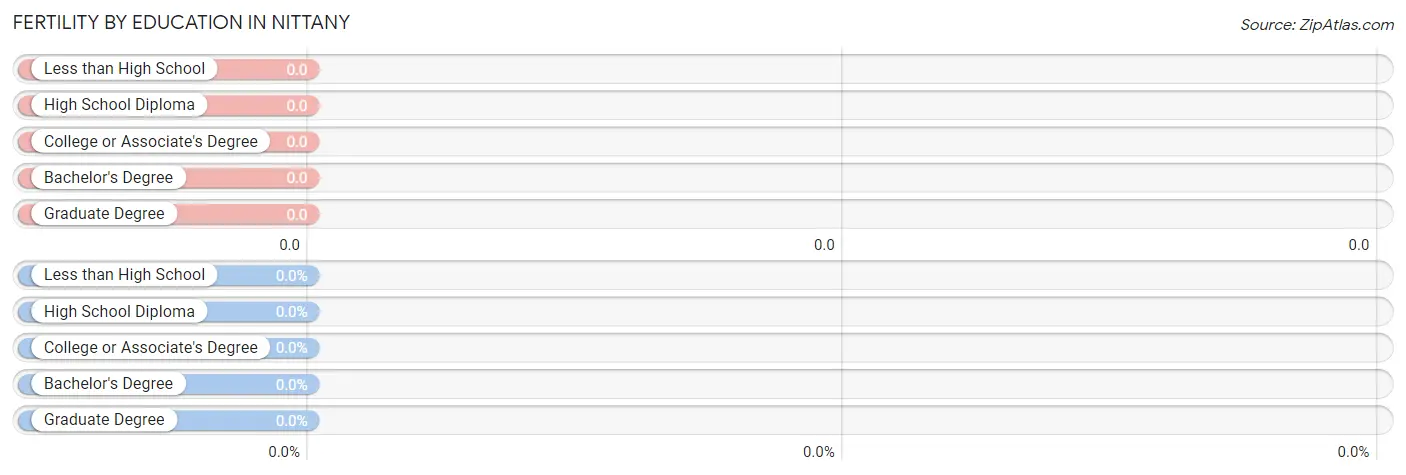
| Educational Attainment | Women with Births | Births / 1,000 Women |
| Less than High School | 0 (0.0%) | 0.0 |
| High School Diploma | 0 (0.0%) | 0.0 |
| College or Associate's Degree | 0 (0.0%) | 0.0 |
| Bachelor's Degree | 0 (0.0%) | 0.0 |
| Graduate Degree | 0 (0.0%) | 0.0 |
| Total | 0 (0.0%) | 0.0 |
Fertility by Education by Marriage Status in Nittany
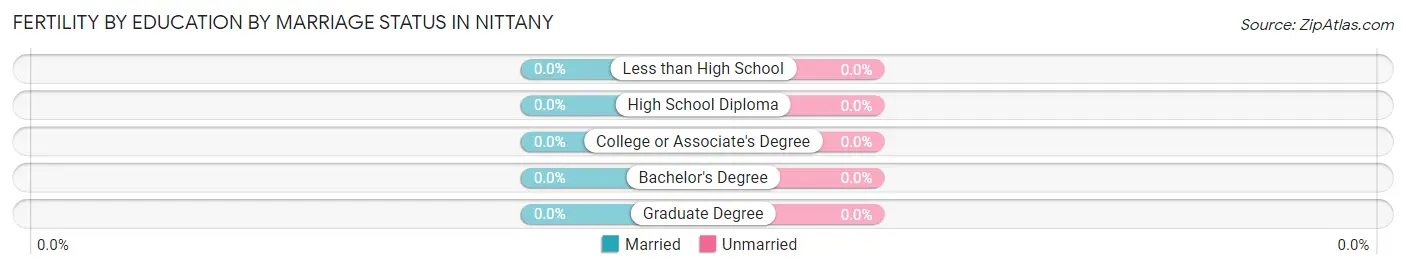
| Educational Attainment | Married | Unmarried |
| Less than High School | 0 (0.0%) | 0 (0.0%) |
| High School Diploma | 0 (0.0%) | 0 (0.0%) |
| College or Associate's Degree | 0 (0.0%) | 0 (0.0%) |
| Bachelor's Degree | 0 (0.0%) | 0 (0.0%) |
| Graduate Degree | 0 (0.0%) | 0 (0.0%) |
| Total | 0 (0.0%) | 0 (0.0%) |
Income in Nittany
Income Overview in Nittany
Per Capita Income in Nittany is $24,940, while median incomes of families and households are $103,500 and $103,500 respectively.
| Characteristic | Number | Measure |
| Per Capita Income | 849 | $24,940 |
| Median Family Income | 166 | $103,500 |
| Mean Family Income | 166 | $97,372 |
| Median Household Income | 166 | $103,500 |
| Mean Household Income | 166 | $102,725 |
| Income Deficit | 166 | $0 |
| Wage / Income Gap (%) | 849 | 40.94% |
| Wage / Income Gap ($) | 849 | 59.06¢ per $1 |
| Gini / Inequality Index | 849 | 0.38 |
Earnings by Sex in Nittany
Average Earnings in Nittany are $34,972, $43,920 for men and $25,938 for women, a difference of 40.9%.
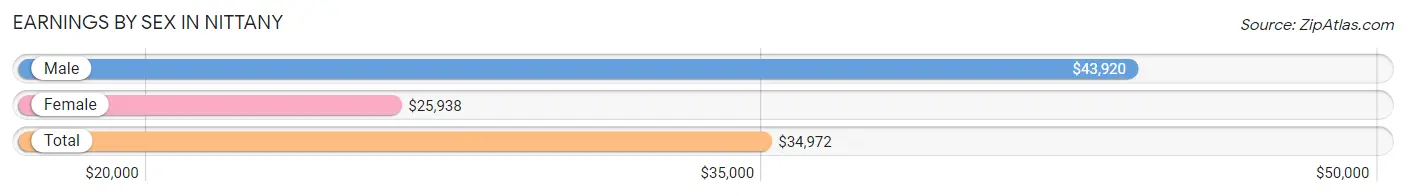
| Sex | Number | Average Earnings |
| Male | 231 (45.0%) | $43,920 |
| Female | 282 (55.0%) | $25,938 |
| Total | 513 (100.0%) | $34,972 |
Earnings by Sex by Income Bracket in Nittany
The most common earnings brackets in Nittany are $65,000 to $74,999 for men (53 | 22.9%) and $40,000 to $44,999 for women (81 | 28.7%).
| Income | Male | Female |
| $2,499 or less | 23 (10.0%) | 13 (4.6%) |
| $2,500 to $4,999 | 0 (0.0%) | 46 (16.3%) |
| $5,000 to $7,499 | 0 (0.0%) | 15 (5.3%) |
| $7,500 to $9,999 | 15 (6.5%) | 11 (3.9%) |
| $10,000 to $12,499 | 0 (0.0%) | 0 (0.0%) |
| $12,500 to $14,999 | 0 (0.0%) | 0 (0.0%) |
| $15,000 to $17,499 | 0 (0.0%) | 0 (0.0%) |
| $17,500 to $19,999 | 0 (0.0%) | 0 (0.0%) |
| $20,000 to $22,499 | 0 (0.0%) | 0 (0.0%) |
| $22,500 to $24,999 | 0 (0.0%) | 50 (17.7%) |
| $25,000 to $29,999 | 0 (0.0%) | 16 (5.7%) |
| $30,000 to $34,999 | 48 (20.8%) | 20 (7.1%) |
| $35,000 to $39,999 | 17 (7.4%) | 12 (4.3%) |
| $40,000 to $44,999 | 22 (9.5%) | 81 (28.7%) |
| $45,000 to $49,999 | 22 (9.5%) | 0 (0.0%) |
| $50,000 to $54,999 | 14 (6.1%) | 0 (0.0%) |
| $55,000 to $64,999 | 0 (0.0%) | 0 (0.0%) |
| $65,000 to $74,999 | 53 (22.9%) | 0 (0.0%) |
| $75,000 to $99,999 | 0 (0.0%) | 18 (6.4%) |
| $100,000+ | 17 (7.4%) | 0 (0.0%) |
| Total | 231 (100.0%) | 282 (100.0%) |
Earnings by Sex by Educational Attainment in Nittany
Average earnings in Nittany are $53,125 for men and $27,344 for women, a difference of 48.5%. Men with an educational attainment of high school diploma enjoy the highest average annual earnings of $65,778, while those with high school diploma education earn the least with $65,778. Women with an educational attainment of college or associate's degree earn the most with the average annual earnings of $26,484, while those with college or associate's degree education have the smallest earnings of $26,484.
| Educational Attainment | Male Income | Female Income |
| Less than High School | - | - |
| High School Diploma | $65,778 | $0 |
| College or Associate's Degree | - | - |
| Bachelor's Degree | - | - |
| Graduate Degree | - | - |
| Total | $53,125 | $27,344 |
Family Income in Nittany
Family Income Brackets in Nittany
According to the Nittany family income data, there are 62 families falling into the $150,000 to $199,999 income range, which is the most common income bracket and makes up 37.3% of all families.
| Income Bracket | # Families | % Families |
| Less than $10,000 | 15 | 9.0% |
| $10,000 to $14,999 | 0 | 0.0% |
| $15,000 to $24,999 | 0 | 0.0% |
| $25,000 to $34,999 | 31 | 18.7% |
| $35,000 to $49,999 | 0 | 0.0% |
| $50,000 to $74,999 | 31 | 18.7% |
| $75,000 to $99,999 | 0 | 0.0% |
| $100,000 to $149,999 | 27 | 16.3% |
| $150,000 to $199,999 | 62 | 37.3% |
| $200,000+ | 0 | 0.0% |
Family Income by Famaliy Size in Nittany
2-person families (48 | 28.9%) account for the highest median family income in Nittany with $33,833 per family, while 2-person families (48 | 28.9%) have the highest median income of $16,916 per family member.
| Income Bracket | # Families | Median Income |
| 2-Person Families | 48 (28.9%) | $33,833 |
| 3-Person Families | 30 (18.1%) | $0 |
| 4-Person Families | 36 (21.7%) | $0 |
| 5-Person Families | 40 (24.1%) | $0 |
| 6-Person Families | 0 (0.0%) | $0 |
| 7+ Person Families | 12 (7.2%) | $0 |
| Total | 166 (100.0%) | $103,500 |
Family Income by Number of Earners in Nittany
| Number of Earners | # Families | Median Income |
| No Earners | 15 (9.0%) | $0 |
| 1 Earner | 0 (0.0%) | $0 |
| 2 Earners | 89 (53.6%) | $51,985 |
| 3+ Earners | 62 (37.3%) | $168,750 |
| Total | 166 (100.0%) | $103,500 |
Household Income in Nittany
Household Income Brackets in Nittany
With 42 households falling in the category, the $150,000 to $199,999 income range is the most frequent in Nittany, accounting for 25.3% of all households.
| Income Bracket | # Households | % Households |
| Less than $10,000 | 15 | 9.0% |
| $10,000 to $14,999 | 0 | 0.0% |
| $15,000 to $24,999 | 0 | 0.0% |
| $25,000 to $34,999 | 31 | 18.7% |
| $35,000 to $49,999 | 0 | 0.0% |
| $50,000 to $74,999 | 31 | 18.7% |
| $75,000 to $99,999 | 0 | 0.0% |
| $100,000 to $149,999 | 27 | 16.3% |
| $150,000 to $199,999 | 42 | 25.3% |
| $200,000+ | 20 | 12.0% |
Household Income by Householder Age in Nittany
| Income Bracket | # Households | Median Income |
| 15 to 24 Years | 0 (0.0%) | $0 |
| 25 to 44 Years | 32 (19.3%) | $0 |
| 45 to 64 Years | 119 (71.7%) | $0 |
| 65+ Years | 15 (9.0%) | $0 |
| Total | 166 (100.0%) | $103,500 |
Poverty in Nittany
Income Below Poverty by Sex and Age in Nittany
With 11.5% poverty level for males and 7.8% for females among the residents of Nittany, 25 to 34 year old males and 35 to 44 year old females are the most vulnerable to poverty, with 23 males (100.0%) and 26 females (34.2%) in their respective age groups living below the poverty level.
| Age Bracket | Male | Female |
| Under 5 Years | 0 (0.0%) | 0 (0.0%) |
| 5 Years | 0 (0.0%) | 0 (0.0%) |
| 6 to 11 Years | 0 (0.0%) | 0 (0.0%) |
| 12 to 14 Years | 0 (0.0%) | 0 (0.0%) |
| 15 Years | 0 (0.0%) | 0 (0.0%) |
| 16 and 17 Years | 0 (0.0%) | 0 (0.0%) |
| 18 to 24 Years | 0 (0.0%) | 0 (0.0%) |
| 25 to 34 Years | 23 (100.0%) | 0 (0.0%) |
| 35 to 44 Years | 0 (0.0%) | 26 (34.2%) |
| 45 to 54 Years | 0 (0.0%) | 13 (21.0%) |
| 55 to 64 Years | 15 (27.8%) | 0 (0.0%) |
| 65 to 74 Years | 0 (0.0%) | 0 (0.0%) |
| 75 Years and over | 0 (0.0%) | 0 (0.0%) |
| Total | 38 (11.5%) | 39 (7.8%) |
Income Above Poverty by Sex and Age in Nittany
According to the poverty statistics in Nittany, males aged 12 to 14 years and females aged 6 to 11 years are the age groups that are most secure financially, with 100.0% of males and 100.0% of females in these age groups living above the poverty line.
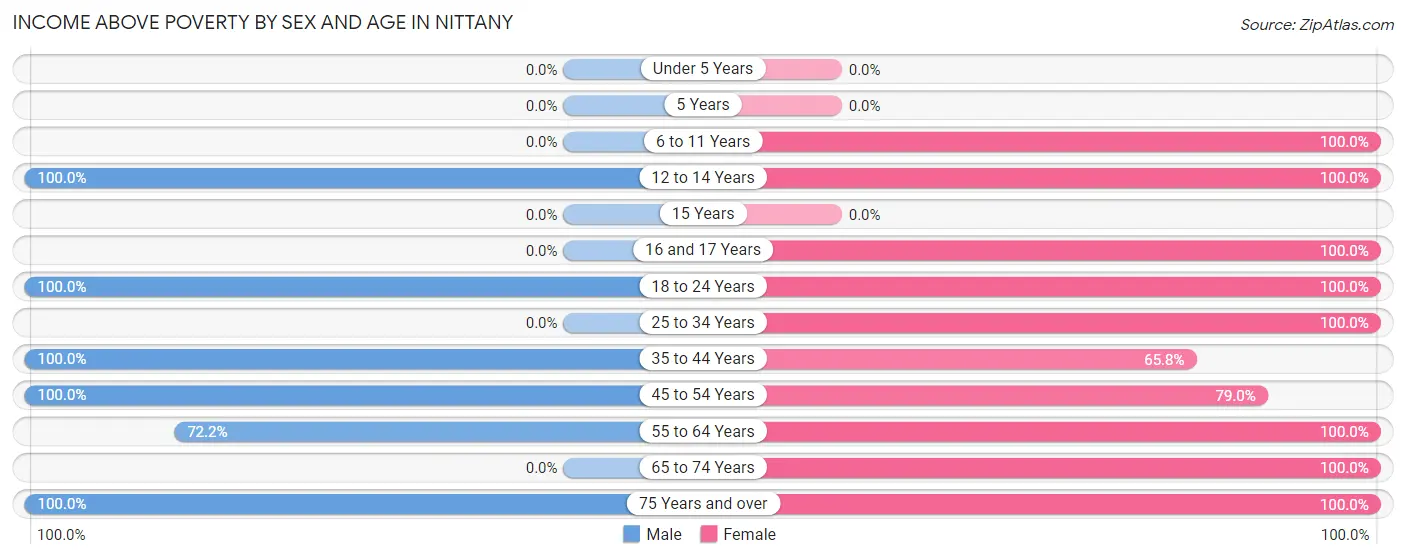
| Age Bracket | Male | Female |
| Under 5 Years | 0 (0.0%) | 0 (0.0%) |
| 5 Years | 0 (0.0%) | 0 (0.0%) |
| 6 to 11 Years | 0 (0.0%) | 77 (100.0%) |
| 12 to 14 Years | 29 (100.0%) | 46 (100.0%) |
| 15 Years | 0 (0.0%) | 0 (0.0%) |
| 16 and 17 Years | 0 (0.0%) | 32 (100.0%) |
| 18 to 24 Years | 92 (100.0%) | 36 (100.0%) |
| 25 to 34 Years | 0 (0.0%) | 66 (100.0%) |
| 35 to 44 Years | 53 (100.0%) | 50 (65.8%) |
| 45 to 54 Years | 66 (100.0%) | 49 (79.0%) |
| 55 to 64 Years | 39 (72.2%) | 53 (100.0%) |
| 65 to 74 Years | 0 (0.0%) | 15 (100.0%) |
| 75 Years and over | 15 (100.0%) | 37 (100.0%) |
| Total | 294 (88.5%) | 461 (92.2%) |
Income Below Poverty Among Married-Couple Families in Nittany
The poverty statistics for married-couple families in Nittany show that 10.0% or 15 of the total 150 families live below the poverty line. Families with no children have the highest poverty rate of 16.9%, comprising of 15 families. On the other hand, families with 1 or 2 children have the lowest poverty rate of 0.0%, which includes 0 families.

| Children | Above Poverty | Below Poverty |
| No Children | 74 (83.2%) | 15 (16.9%) |
| 1 or 2 Children | 49 (100.0%) | 0 (0.0%) |
| 3 or 4 Children | 0 (0.0%) | 0 (0.0%) |
| 5 or more Children | 12 (100.0%) | 0 (0.0%) |
| Total | 135 (90.0%) | 15 (10.0%) |
Income Below Poverty Among Single-Parent Households in Nittany
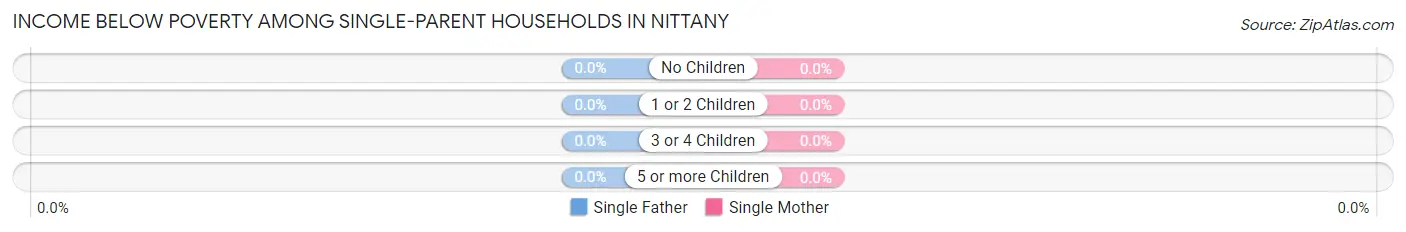
| Children | Single Father | Single Mother |
| No Children | 0 (0.0%) | 0 (0.0%) |
| 1 or 2 Children | 0 (0.0%) | 0 (0.0%) |
| 3 or 4 Children | 0 (0.0%) | 0 (0.0%) |
| 5 or more Children | 0 (0.0%) | 0 (0.0%) |
| Total | 0 (0.0%) | 0 (0.0%) |
Income Below Poverty Among Married-Couple vs Single-Parent Households in Nittany
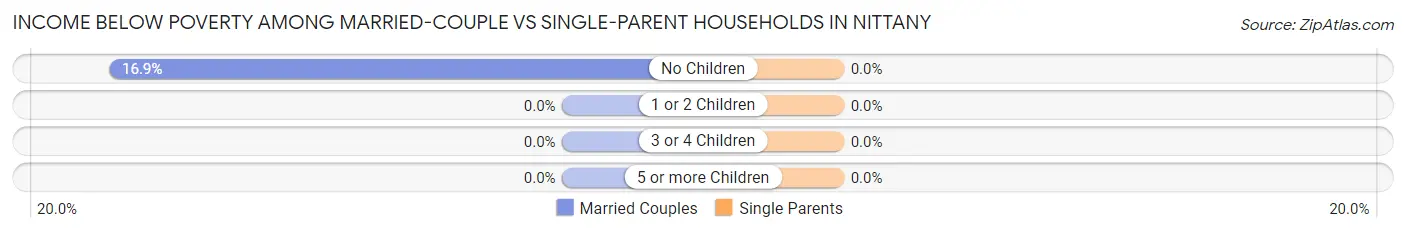
| Children | Married-Couple Families | Single-Parent Households |
| No Children | 15 (16.9%) | 0 (0.0%) |
| 1 or 2 Children | 0 (0.0%) | 0 (0.0%) |
| 3 or 4 Children | 0 (0.0%) | 0 (0.0%) |
| 5 or more Children | 0 (0.0%) | 0 (0.0%) |
| Total | 15 (10.0%) | 0 (0.0%) |
Employment Characteristics in Nittany
Employment by Class of Employer in Nittany
Among the 457 employed individuals in Nittany, private company employees (260 | 56.9%), state government employees (102 | 22.3%), and local government employees (52 | 11.4%) make up the most common classes of employment.
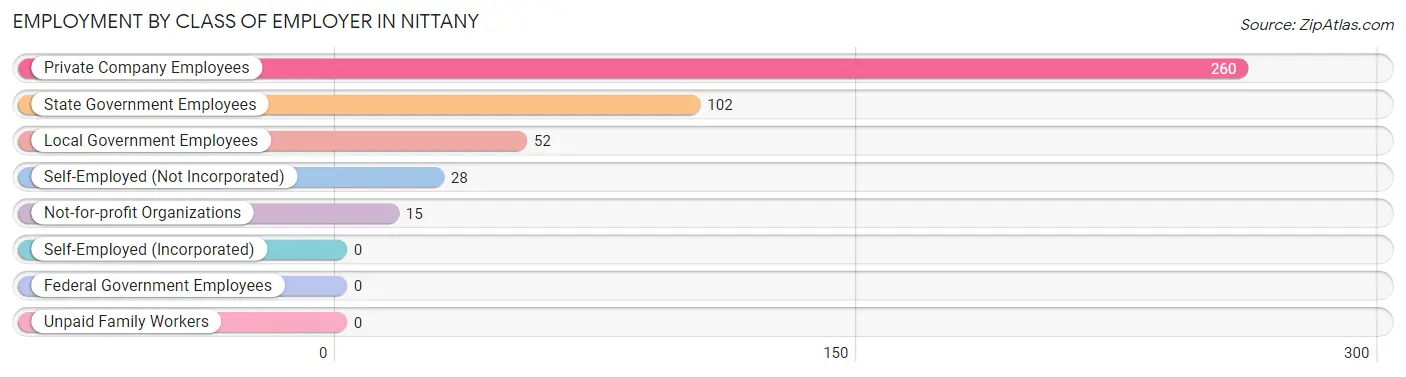
| Employer Class | # Employees | % Employees |
| Private Company Employees | 260 | 56.9% |
| Self-Employed (Incorporated) | 0 | 0.0% |
| Self-Employed (Not Incorporated) | 28 | 6.1% |
| Not-for-profit Organizations | 15 | 3.3% |
| Local Government Employees | 52 | 11.4% |
| State Government Employees | 102 | 22.3% |
| Federal Government Employees | 0 | 0.0% |
| Unpaid Family Workers | 0 | 0.0% |
| Total | 457 | 100.0% |
Employment Status by Age in Nittany
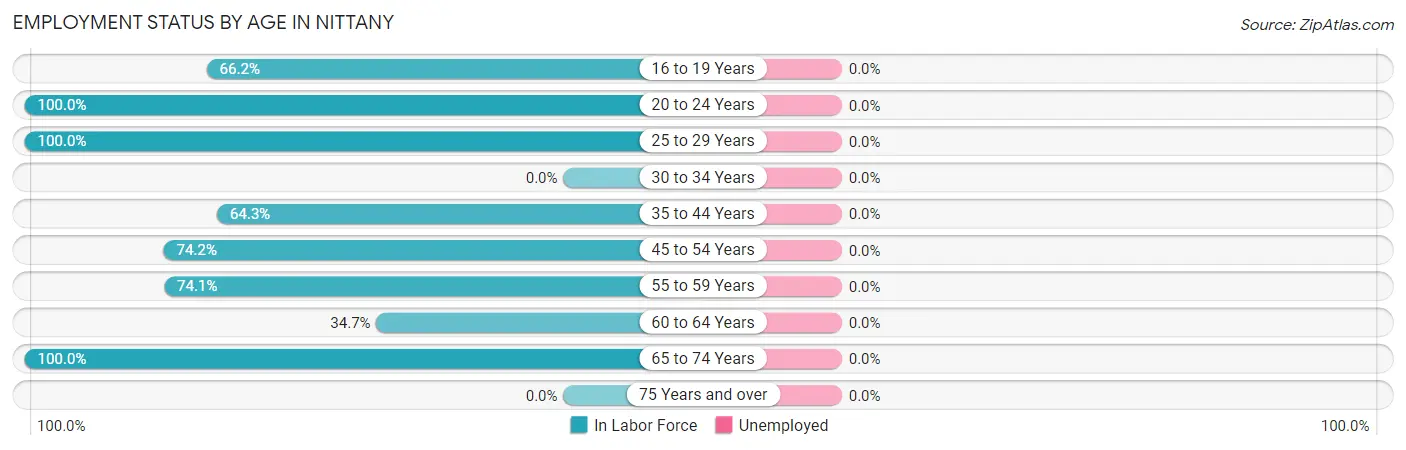
| Age Bracket | In Labor Force | Unemployed |
| 16 to 19 Years | 43 (66.2%) | 0 (0.0%) |
| 20 to 24 Years | 95 (100.0%) | 0 (0.0%) |
| 25 to 29 Years | 66 (100.0%) | 0 (0.0%) |
| 30 to 34 Years | 0 (0.0%) | 0 (0.0%) |
| 35 to 44 Years | 83 (64.3%) | 0 (0.0%) |
| 45 to 54 Years | 95 (74.2%) | 0 (0.0%) |
| 55 to 59 Years | 43 (74.1%) | 0 (0.0%) |
| 60 to 64 Years | 17 (34.7%) | 0 (0.0%) |
| 65 to 74 Years | 15 (100.0%) | 0 (0.0%) |
| 75 Years and over | 0 (0.0%) | 0 (0.0%) |
| Total | 457 (67.2%) | 0 (0.0%) |
Employment Status by Educational Attainment in Nittany
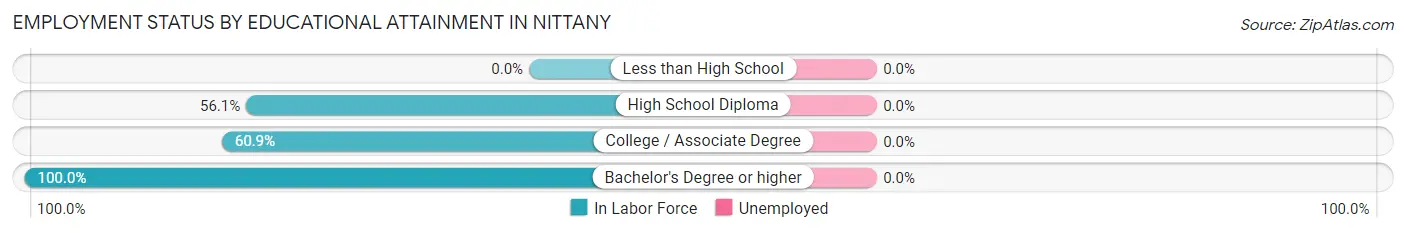
| Educational Attainment | In Labor Force | Unemployed |
| Less than High School | 0 (0.0%) | 0 (0.0%) |
| High School Diploma | 124 (56.1%) | 0 (0.0%) |
| College / Associate Degree | 81 (60.9%) | 0 (0.0%) |
| Bachelor's Degree or higher | 99 (100.0%) | 0 (0.0%) |
| Total | 304 (67.1%) | 0 (0.0%) |
Employment Occupations by Sex in Nittany
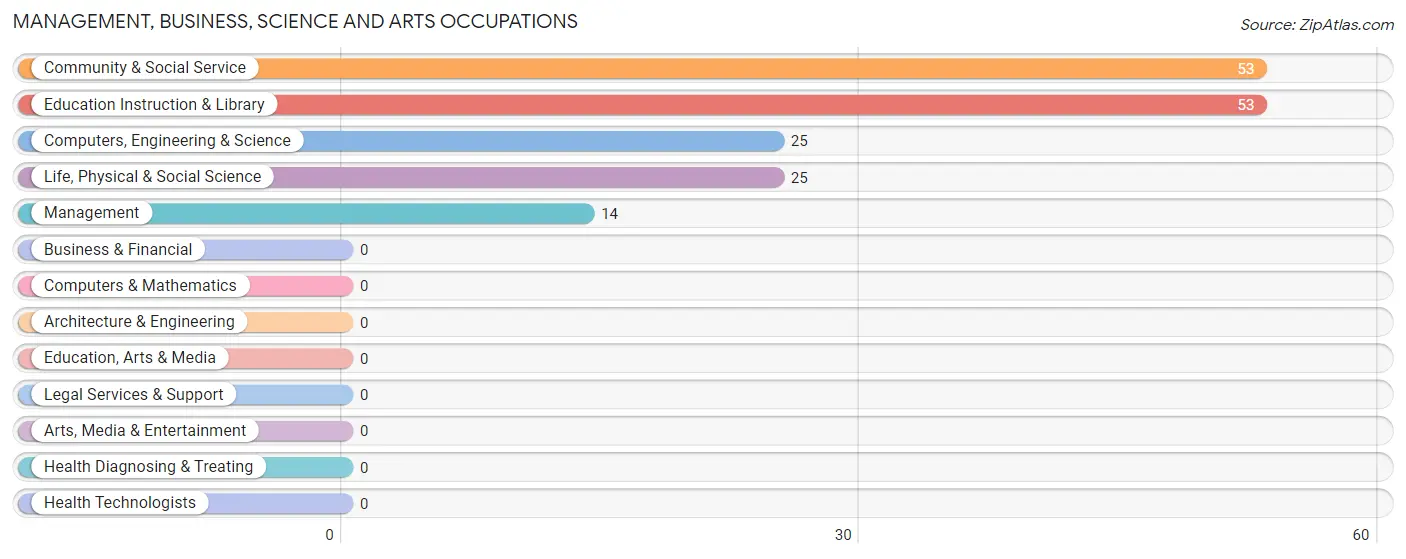
Management, Business, Science and Arts Occupations
The most common Management, Business, Science and Arts occupations in Nittany are Community & Social Service (53 | 11.6%), Education Instruction & Library (53 | 11.6%), Computers, Engineering & Science (25 | 5.5%), Life, Physical & Social Science (25 | 5.5%), and Management (14 | 3.1%).
Management, Business, Science and Arts Occupations by Sex
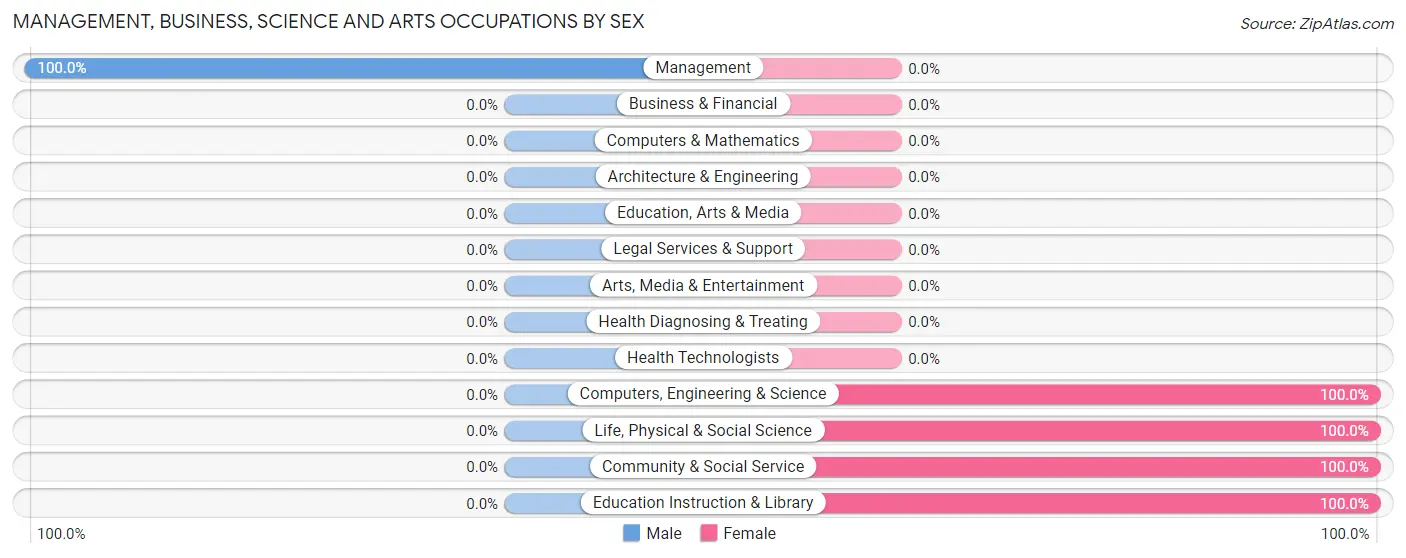
| Occupation | Male | Female |
| Management | 14 (100.0%) | 0 (0.0%) |
| Business & Financial | 0 (0.0%) | 0 (0.0%) |
| Computers, Engineering & Science | 0 (0.0%) | 25 (100.0%) |
| Computers & Mathematics | 0 (0.0%) | 0 (0.0%) |
| Architecture & Engineering | 0 (0.0%) | 0 (0.0%) |
| Life, Physical & Social Science | 0 (0.0%) | 25 (100.0%) |
| Community & Social Service | 0 (0.0%) | 53 (100.0%) |
| Education, Arts & Media | 0 (0.0%) | 0 (0.0%) |
| Legal Services & Support | 0 (0.0%) | 0 (0.0%) |
| Education Instruction & Library | 0 (0.0%) | 53 (100.0%) |
| Arts, Media & Entertainment | 0 (0.0%) | 0 (0.0%) |
| Health Diagnosing & Treating | 0 (0.0%) | 0 (0.0%) |
| Health Technologists | 0 (0.0%) | 0 (0.0%) |
| Total (Category) | 14 (15.2%) | 78 (84.8%) |
| Total (Overall) | 208 (45.5%) | 249 (54.5%) |
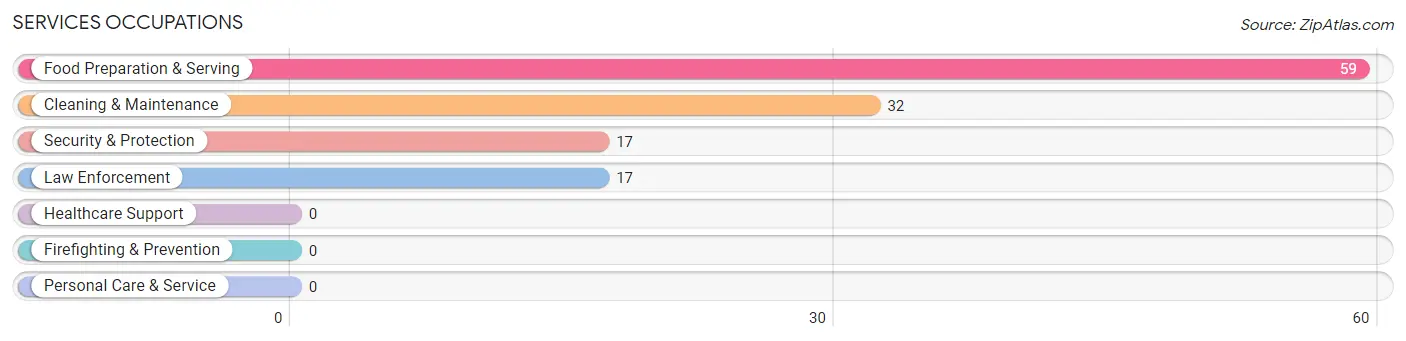
Services Occupations
The most common Services occupations in Nittany are Food Preparation & Serving (59 | 12.9%), Cleaning & Maintenance (32 | 7.0%), Security & Protection (17 | 3.7%), and Law Enforcement (17 | 3.7%).
Services Occupations by Sex
Within the Services occupations in Nittany, the most male-oriented occupations are Security & Protection (100.0%), Law Enforcement (100.0%), and Cleaning & Maintenance (53.1%), while the most female-oriented occupations are Food Preparation & Serving (100.0%), and Cleaning & Maintenance (46.9%).
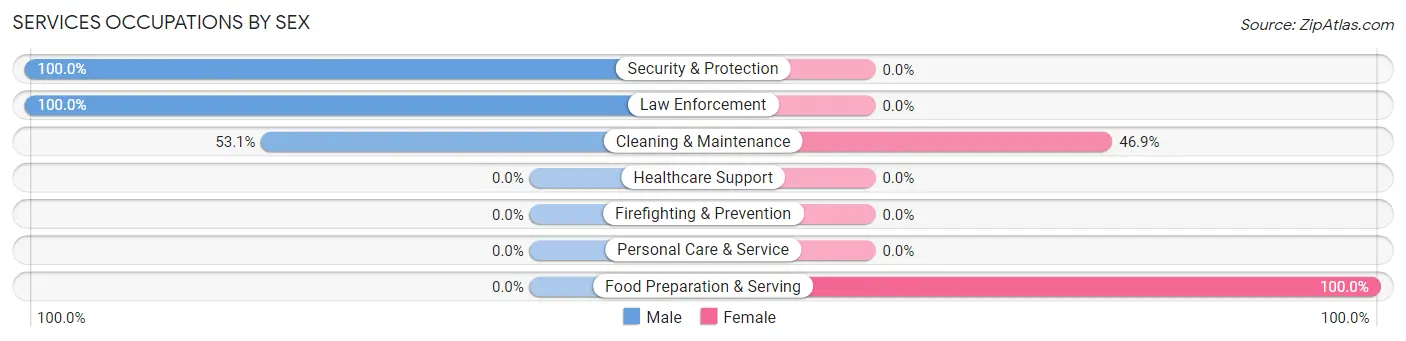
| Occupation | Male | Female |
| Healthcare Support | 0 (0.0%) | 0 (0.0%) |
| Security & Protection | 17 (100.0%) | 0 (0.0%) |
| Firefighting & Prevention | 0 (0.0%) | 0 (0.0%) |
| Law Enforcement | 17 (100.0%) | 0 (0.0%) |
| Food Preparation & Serving | 0 (0.0%) | 59 (100.0%) |
| Cleaning & Maintenance | 17 (53.1%) | 15 (46.9%) |
| Personal Care & Service | 0 (0.0%) | 0 (0.0%) |
| Total (Category) | 34 (31.5%) | 74 (68.5%) |
| Total (Overall) | 208 (45.5%) | 249 (54.5%) |
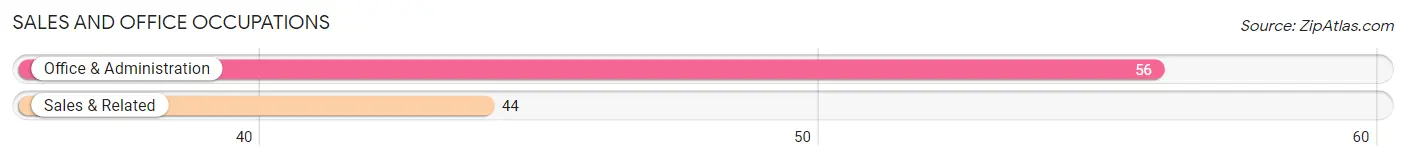
Sales and Office Occupations
The most common Sales and Office occupations in Nittany are Office & Administration (56 | 12.2%), and Sales & Related (44 | 9.6%).
Sales and Office Occupations by Sex
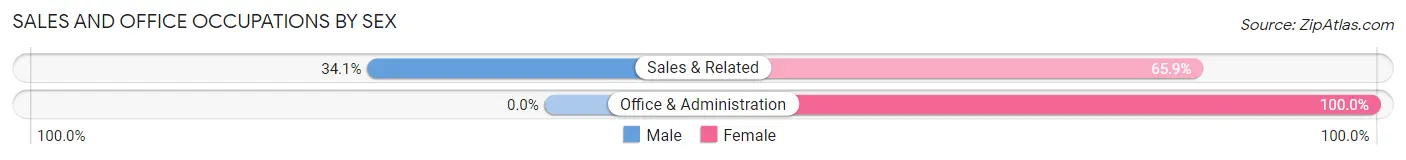
| Occupation | Male | Female |
| Sales & Related | 15 (34.1%) | 29 (65.9%) |
| Office & Administration | 0 (0.0%) | 56 (100.0%) |
| Total (Category) | 15 (15.0%) | 85 (85.0%) |
| Total (Overall) | 208 (45.5%) | 249 (54.5%) |
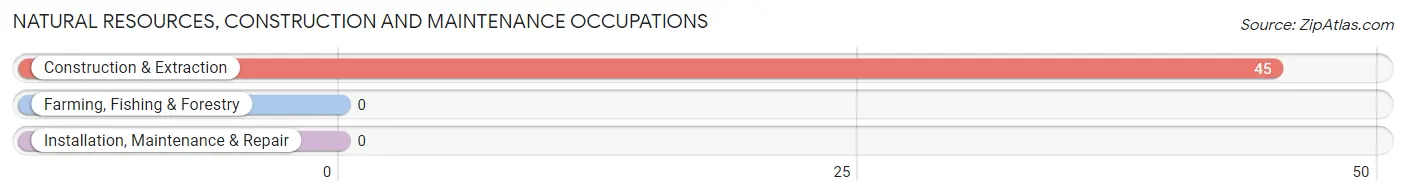
Natural Resources, Construction and Maintenance Occupations
The most common Natural Resources, Construction and Maintenance occupations in Nittany are , and Construction & Extraction (45 | 9.9%).
Natural Resources, Construction and Maintenance Occupations by Sex
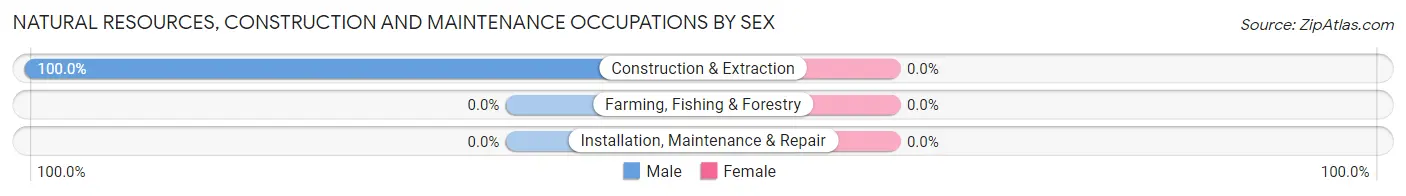
| Occupation | Male | Female |
| Farming, Fishing & Forestry | 0 (0.0%) | 0 (0.0%) |
| Construction & Extraction | 45 (100.0%) | 0 (0.0%) |
| Installation, Maintenance & Repair | 0 (0.0%) | 0 (0.0%) |
| Total (Category) | 45 (100.0%) | 0 (0.0%) |
| Total (Overall) | 208 (45.5%) | 249 (54.5%) |
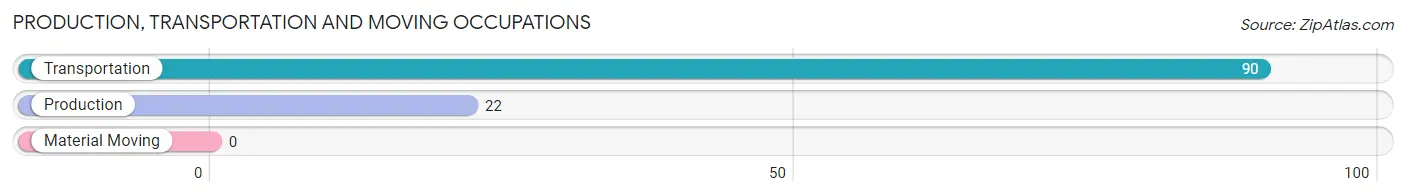
Production, Transportation and Moving Occupations
The most common Production, Transportation and Moving occupations in Nittany are Transportation (90 | 19.7%), and Production (22 | 4.8%).
Production, Transportation and Moving Occupations by Sex
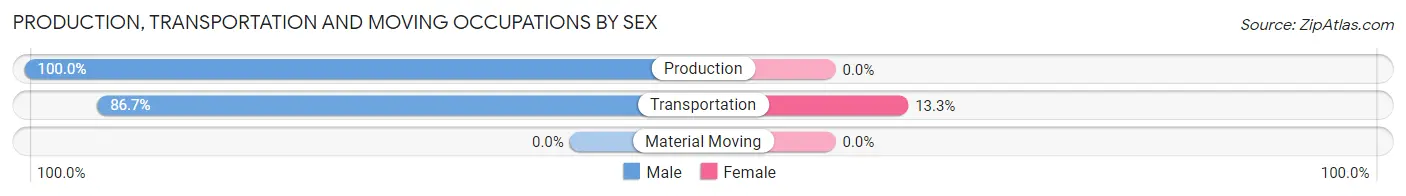
| Occupation | Male | Female |
| Production | 22 (100.0%) | 0 (0.0%) |
| Transportation | 78 (86.7%) | 12 (13.3%) |
| Material Moving | 0 (0.0%) | 0 (0.0%) |
| Total (Category) | 100 (89.3%) | 12 (10.7%) |
| Total (Overall) | 208 (45.5%) | 249 (54.5%) |
Employment Industries by Sex in Nittany
Employment Industries in Nittany
The major employment industries in Nittany include Educational Services (89 | 19.5%), Accommodation & Food Services (77 | 16.9%), Transportation & Warehousing (65 | 14.2%), Retail Trade (57 | 12.5%), and Professional & Scientific (55 | 12.0%).
Employment Industries by Sex in Nittany
The Nittany industries that see more men than women are Construction (100.0%), Manufacturing (100.0%), and Public Administration (100.0%), whereas the industries that tend to have a higher number of women are Accommodation & Food Services (100.0%), Educational Services (80.9%), and Professional & Scientific (74.6%).
| Industry | Male | Female |
| Agriculture, Fishing & Hunting | 0 (0.0%) | 0 (0.0%) |
| Mining, Quarrying, & Extraction | 0 (0.0%) | 0 (0.0%) |
| Construction | 45 (100.0%) | 0 (0.0%) |
| Manufacturing | 37 (100.0%) | 0 (0.0%) |
| Wholesale Trade | 0 (0.0%) | 0 (0.0%) |
| Retail Trade | 25 (43.9%) | 32 (56.1%) |
| Transportation & Warehousing | 53 (81.5%) | 12 (18.5%) |
| Utilities | 0 (0.0%) | 0 (0.0%) |
| Information | 0 (0.0%) | 0 (0.0%) |
| Finance & Insurance | 0 (0.0%) | 0 (0.0%) |
| Real Estate, Rental & Leasing | 0 (0.0%) | 0 (0.0%) |
| Professional & Scientific | 14 (25.5%) | 41 (74.6%) |
| Enterprise Management | 0 (0.0%) | 0 (0.0%) |
| Administrative & Support | 0 (0.0%) | 0 (0.0%) |
| Educational Services | 17 (19.1%) | 72 (80.9%) |
| Health Care & Social Assistance | 0 (0.0%) | 0 (0.0%) |
| Arts, Entertainment & Recreation | 0 (0.0%) | 0 (0.0%) |
| Accommodation & Food Services | 0 (0.0%) | 77 (100.0%) |
| Public Administration | 17 (100.0%) | 0 (0.0%) |
| Total | 208 (45.5%) | 249 (54.5%) |
Education in Nittany
School Enrollment in Nittany
The most common levels of schooling among the 215 students in Nittany are elementary school (64 | 29.8%), high school (61 | 28.4%), and middle school (59 | 27.4%).
| School Level | # Students | % Students |
| Nursery / Preschool | 0 | 0.0% |
| Kindergarten | 0 | 0.0% |
| Elementary School | 64 | 29.8% |
| Middle School | 59 | 27.4% |
| High School | 61 | 28.4% |
| College / Undergraduate | 31 | 14.4% |
| Graduate / Professional | 0 | 0.0% |
| Total | 215 | 100.0% |
School Enrollment by Age by Funding Source in Nittany
Out of a total of 215 students who are enrolled in schools in Nittany, 18 (8.4%) attend a private institution, while the remaining 197 (91.6%) are enrolled in public schools. The age group of 5 to 9 year old has the highest likelihood of being enrolled in private schools, with 18 (28.1% in the age bracket) enrolled. Conversely, the age group of 10 to 14 year olds has the lowest likelihood of being enrolled in a private school, with 88 (100.0% in the age bracket) attending a public institution.
| Age Bracket | Public School | Private School |
| 3 to 4 Year Olds | 0 (0.0%) | 0 (0.0%) |
| 5 to 9 Year Old | 46 (71.9%) | 18 (28.1%) |
| 10 to 14 Year Olds | 88 (100.0%) | 0 (0.0%) |
| 15 to 17 Year Olds | 32 (100.0%) | 0 (0.0%) |
| 18 to 19 Year Olds | 11 (100.0%) | 0 (0.0%) |
| 20 to 24 Year Olds | 0 (0.0%) | 0 (0.0%) |
| 25 to 34 Year Olds | 0 (0.0%) | 0 (0.0%) |
| 35 Years and over | 20 (100.0%) | 0 (0.0%) |
| Total | 197 (91.6%) | 18 (8.4%) |
Educational Attainment by Field of Study in Nittany
Education (35 | 30.7%), business (31 | 27.2%), bio, nature & agricultural (30 | 26.3%), and arts & humanities (18 | 15.8%) are the most common fields of study among 114 individuals in Nittany who have obtained a bachelor's degree or higher.
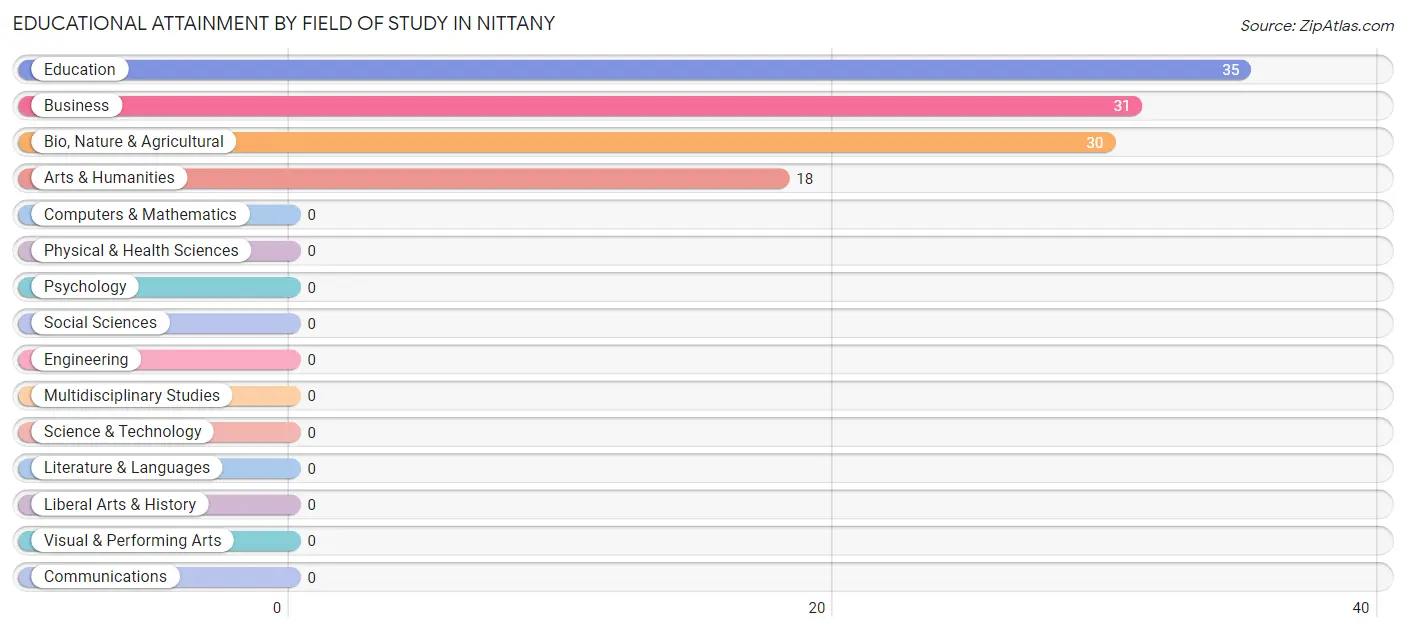
| Field of Study | # Graduates | % Graduates |
| Computers & Mathematics | 0 | 0.0% |
| Bio, Nature & Agricultural | 30 | 26.3% |
| Physical & Health Sciences | 0 | 0.0% |
| Psychology | 0 | 0.0% |
| Social Sciences | 0 | 0.0% |
| Engineering | 0 | 0.0% |
| Multidisciplinary Studies | 0 | 0.0% |
| Science & Technology | 0 | 0.0% |
| Business | 31 | 27.2% |
| Education | 35 | 30.7% |
| Literature & Languages | 0 | 0.0% |
| Liberal Arts & History | 0 | 0.0% |
| Visual & Performing Arts | 0 | 0.0% |
| Communications | 0 | 0.0% |
| Arts & Humanities | 18 | 15.8% |
| Total | 114 | 100.0% |
Transportation & Commute in Nittany
Vehicle Availability by Sex in Nittany
The most prevalent vehicle ownership categories in Nittany are males with 5 or more vehicles (123, accounting for 59.1%) and females with 5 or more vehicles (174, making up 49.4%).
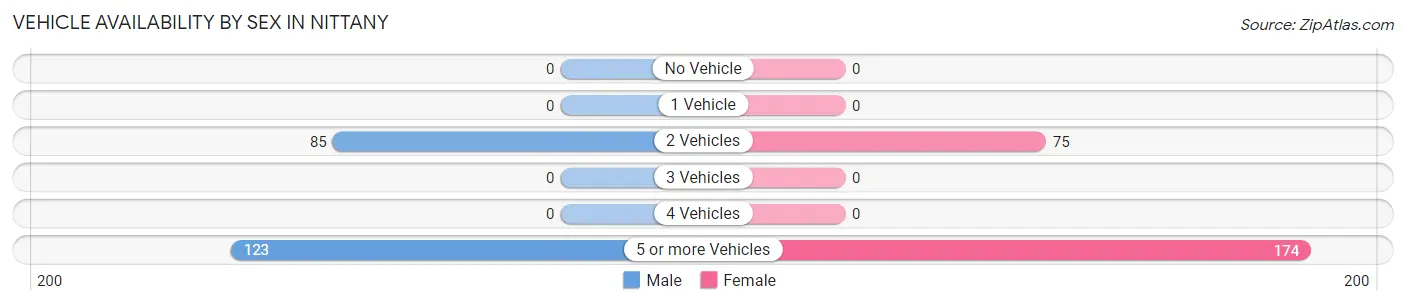
| Vehicles Available | Male | Female |
| No Vehicle | 0 (0.0%) | 0 (0.0%) |
| 1 Vehicle | 0 (0.0%) | 0 (0.0%) |
| 2 Vehicles | 85 (40.9%) | 75 (30.1%) |
| 3 Vehicles | 0 (0.0%) | 0 (0.0%) |
| 4 Vehicles | 0 (0.0%) | 0 (0.0%) |
| 5 or more Vehicles | 123 (59.1%) | 174 (69.9%) |
| Total | 208 (100.0%) | 249 (100.0%) |
Commute Time in Nittany
The most frequently occuring commute durations in Nittany are 15 to 19 minutes (97 commuters, 21.2%), 30 to 34 minutes (97 commuters, 21.2%), and 35 to 39 minutes (64 commuters, 14.0%).
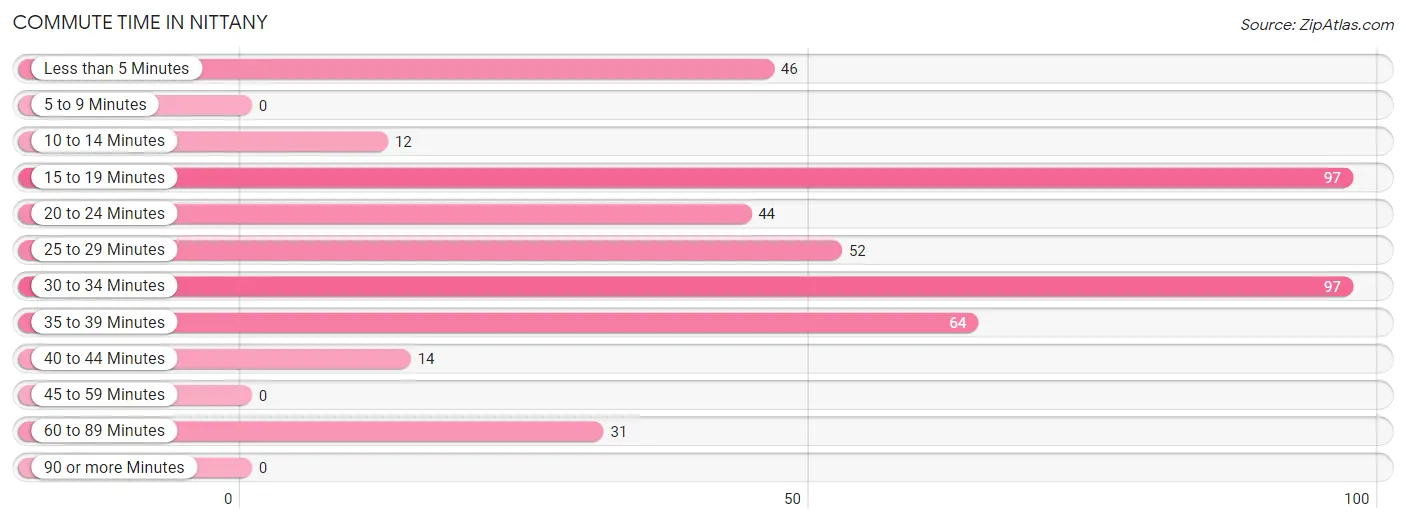
| Commute Time | # Commuters | % Commuters |
| Less than 5 Minutes | 46 | 10.1% |
| 5 to 9 Minutes | 0 | 0.0% |
| 10 to 14 Minutes | 12 | 2.6% |
| 15 to 19 Minutes | 97 | 21.2% |
| 20 to 24 Minutes | 44 | 9.6% |
| 25 to 29 Minutes | 52 | 11.4% |
| 30 to 34 Minutes | 97 | 21.2% |
| 35 to 39 Minutes | 64 | 14.0% |
| 40 to 44 Minutes | 14 | 3.1% |
| 45 to 59 Minutes | 0 | 0.0% |
| 60 to 89 Minutes | 31 | 6.8% |
| 90 or more Minutes | 0 | 0.0% |
Commute Time by Sex in Nittany
The most common commute times in Nittany are 30 to 34 minutes (54 commuters, 26.0%) for males and 35 to 39 minutes (64 commuters, 25.7%) for females.
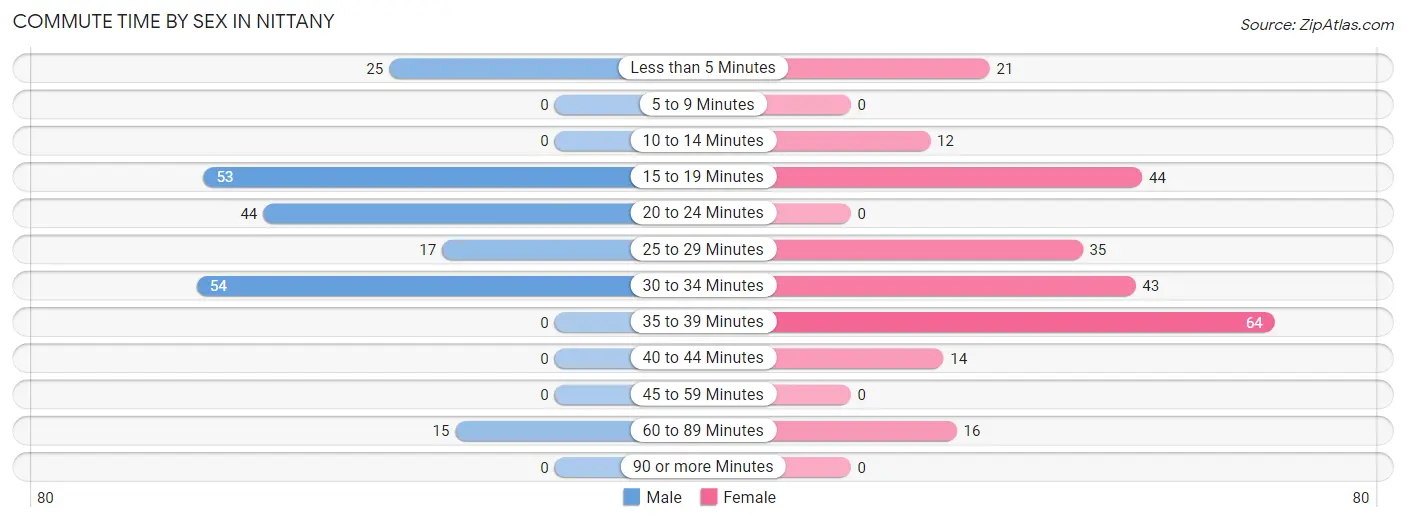
| Commute Time | Male | Female |
| Less than 5 Minutes | 25 (12.0%) | 21 (8.4%) |
| 5 to 9 Minutes | 0 (0.0%) | 0 (0.0%) |
| 10 to 14 Minutes | 0 (0.0%) | 12 (4.8%) |
| 15 to 19 Minutes | 53 (25.5%) | 44 (17.7%) |
| 20 to 24 Minutes | 44 (21.1%) | 0 (0.0%) |
| 25 to 29 Minutes | 17 (8.2%) | 35 (14.1%) |
| 30 to 34 Minutes | 54 (26.0%) | 43 (17.3%) |
| 35 to 39 Minutes | 0 (0.0%) | 64 (25.7%) |
| 40 to 44 Minutes | 0 (0.0%) | 14 (5.6%) |
| 45 to 59 Minutes | 0 (0.0%) | 0 (0.0%) |
| 60 to 89 Minutes | 15 (7.2%) | 16 (6.4%) |
| 90 or more Minutes | 0 (0.0%) | 0 (0.0%) |
Time of Departure to Work by Sex in Nittany
The most frequent times of departure to work in Nittany are 5:30 AM to 5:59 AM (76, 36.5%) for males and 7:00 AM to 7:29 AM (56, 22.5%) for females.
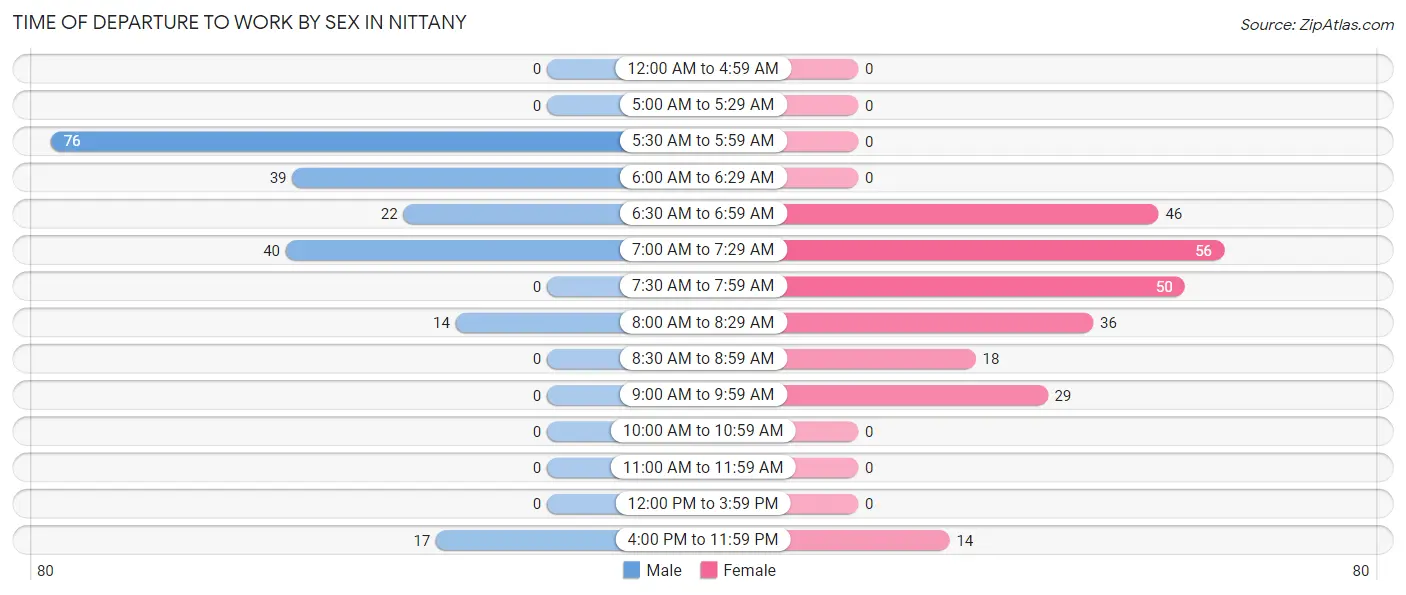
| Time of Departure | Male | Female |
| 12:00 AM to 4:59 AM | 0 (0.0%) | 0 (0.0%) |
| 5:00 AM to 5:29 AM | 0 (0.0%) | 0 (0.0%) |
| 5:30 AM to 5:59 AM | 76 (36.5%) | 0 (0.0%) |
| 6:00 AM to 6:29 AM | 39 (18.8%) | 0 (0.0%) |
| 6:30 AM to 6:59 AM | 22 (10.6%) | 46 (18.5%) |
| 7:00 AM to 7:29 AM | 40 (19.2%) | 56 (22.5%) |
| 7:30 AM to 7:59 AM | 0 (0.0%) | 50 (20.1%) |
| 8:00 AM to 8:29 AM | 14 (6.7%) | 36 (14.5%) |
| 8:30 AM to 8:59 AM | 0 (0.0%) | 18 (7.2%) |
| 9:00 AM to 9:59 AM | 0 (0.0%) | 29 (11.7%) |
| 10:00 AM to 10:59 AM | 0 (0.0%) | 0 (0.0%) |
| 11:00 AM to 11:59 AM | 0 (0.0%) | 0 (0.0%) |
| 12:00 PM to 3:59 PM | 0 (0.0%) | 0 (0.0%) |
| 4:00 PM to 11:59 PM | 17 (8.2%) | 14 (5.6%) |
| Total | 208 (100.0%) | 249 (100.0%) |
Housing Occupancy in Nittany
Occupancy by Ownership in Nittany
Of the total 166 dwellings in Nittany, owner-occupied units account for 150 (90.4%), while renter-occupied units make up 16 (9.6%).
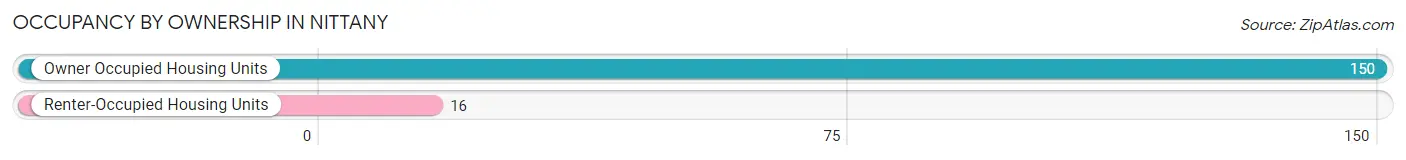
| Occupancy | # Housing Units | % Housing Units |
| Owner Occupied Housing Units | 150 | 90.4% |
| Renter-Occupied Housing Units | 16 | 9.6% |
| Total Occupied Housing Units | 166 | 100.0% |
Occupancy by Household Size in Nittany
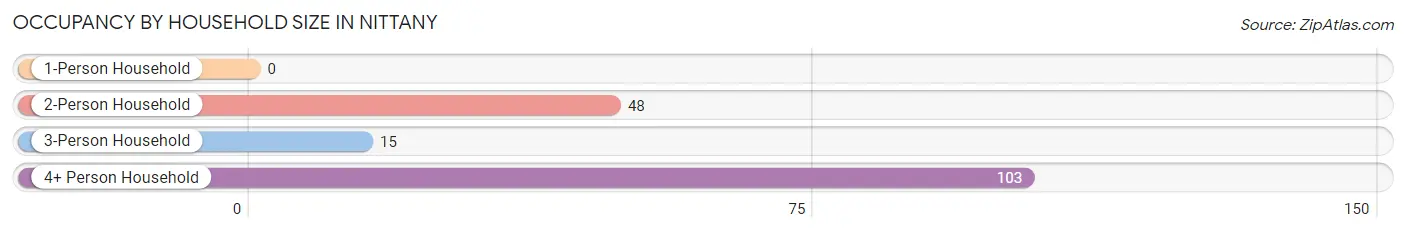
| Household Size | # Housing Units | % Housing Units |
| 1-Person Household | 0 | 0.0% |
| 2-Person Household | 48 | 28.9% |
| 3-Person Household | 15 | 9.0% |
| 4+ Person Household | 103 | 62.1% |
| Total Housing Units | 166 | 100.0% |
Occupancy by Ownership by Household Size in Nittany
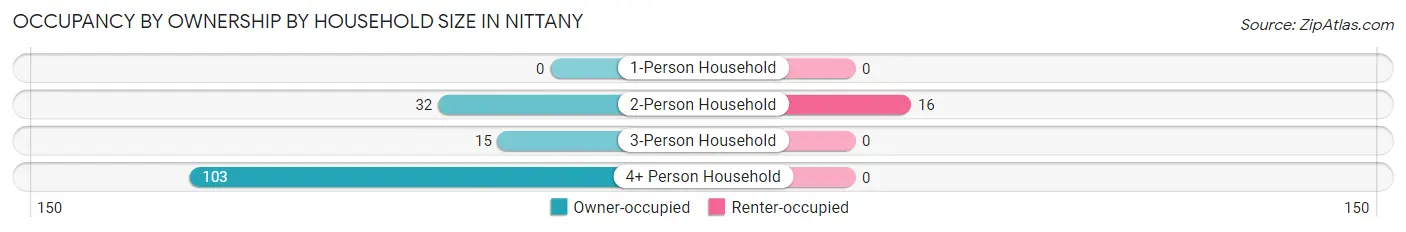
| Household Size | Owner-occupied | Renter-occupied |
| 1-Person Household | 0 (0.0%) | 0 (0.0%) |
| 2-Person Household | 32 (66.7%) | 16 (33.3%) |
| 3-Person Household | 15 (100.0%) | 0 (0.0%) |
| 4+ Person Household | 103 (100.0%) | 0 (0.0%) |
| Total Housing Units | 150 (90.4%) | 16 (9.6%) |
Occupancy by Educational Attainment in Nittany
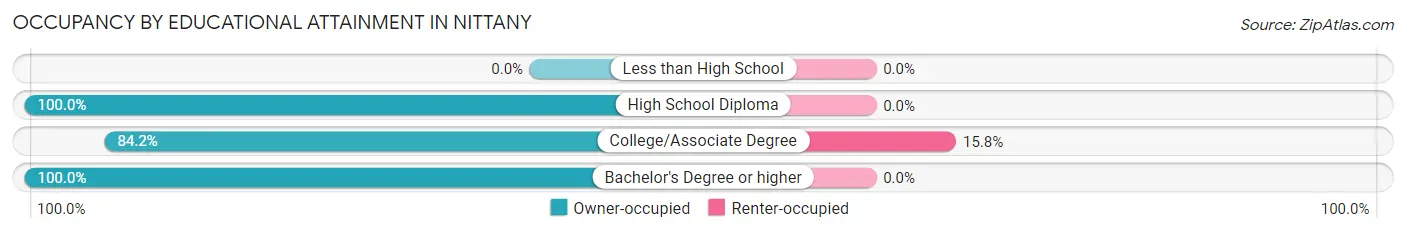
| Household Size | Owner-occupied | Renter-occupied |
| Less than High School | 0 (0.0%) | 0 (0.0%) |
| High School Diploma | 50 (100.0%) | 0 (0.0%) |
| College/Associate Degree | 85 (84.2%) | 16 (15.8%) |
| Bachelor's Degree or higher | 15 (100.0%) | 0 (0.0%) |
Occupancy by Age of Householder in Nittany
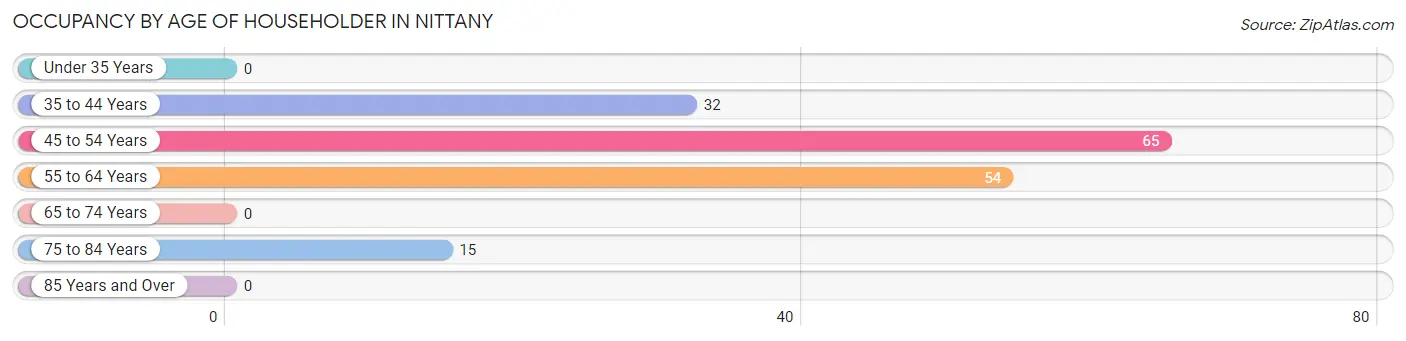
| Age Bracket | # Households | % Households |
| Under 35 Years | 0 | 0.0% |
| 35 to 44 Years | 32 | 19.3% |
| 45 to 54 Years | 65 | 39.2% |
| 55 to 64 Years | 54 | 32.5% |
| 65 to 74 Years | 0 | 0.0% |
| 75 to 84 Years | 15 | 9.0% |
| 85 Years and Over | 0 | 0.0% |
| Total | 166 | 100.0% |
Housing Finances in Nittany
Median Income by Occupancy in Nittany
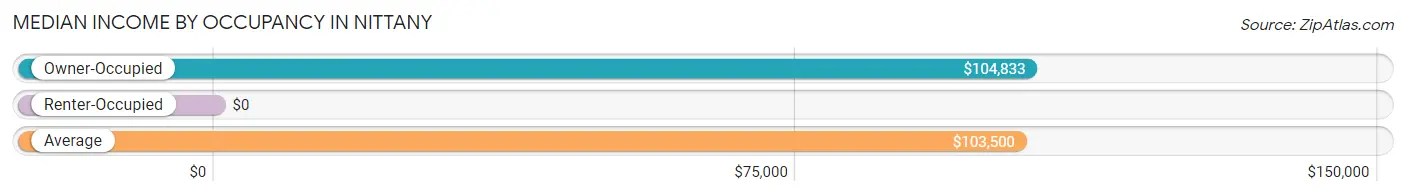
| Occupancy Type | # Households | Median Income |
| Owner-Occupied | 150 (90.4%) | $104,833 |
| Renter-Occupied | 16 (9.6%) | $0 |
| Average | 166 (100.0%) | $103,500 |
Occupancy by Householder Income Bracket in Nittany
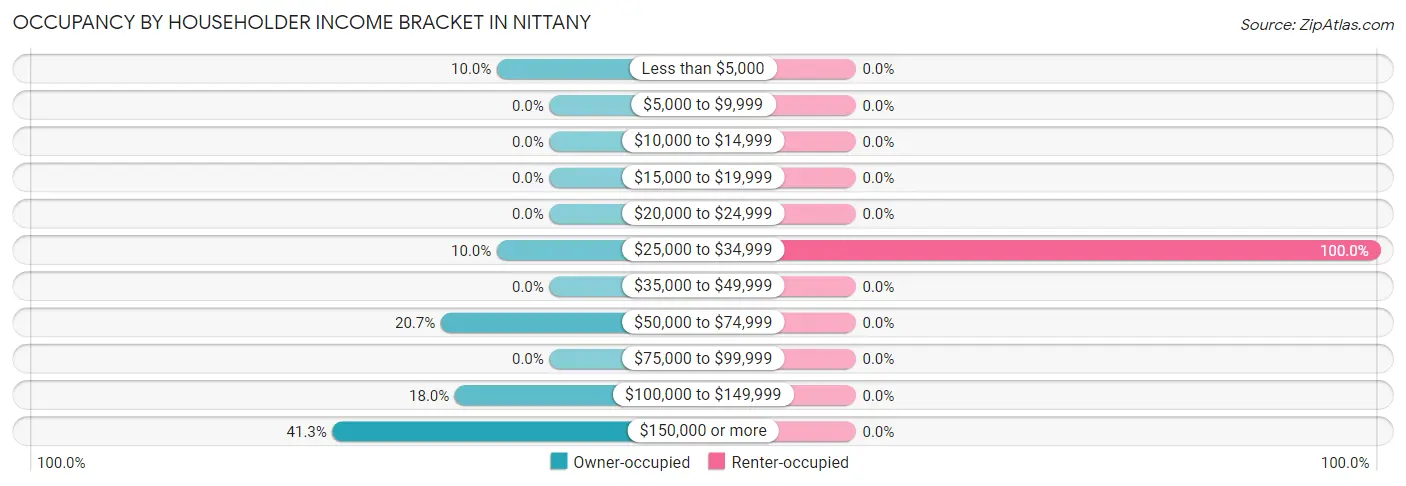
| Income Bracket | Owner-occupied | Renter-occupied |
| Less than $5,000 | 15 (10.0%) | 0 (0.0%) |
| $5,000 to $9,999 | 0 (0.0%) | 0 (0.0%) |
| $10,000 to $14,999 | 0 (0.0%) | 0 (0.0%) |
| $15,000 to $19,999 | 0 (0.0%) | 0 (0.0%) |
| $20,000 to $24,999 | 0 (0.0%) | 0 (0.0%) |
| $25,000 to $34,999 | 15 (10.0%) | 16 (100.0%) |
| $35,000 to $49,999 | 0 (0.0%) | 0 (0.0%) |
| $50,000 to $74,999 | 31 (20.7%) | 0 (0.0%) |
| $75,000 to $99,999 | 0 (0.0%) | 0 (0.0%) |
| $100,000 to $149,999 | 27 (18.0%) | 0 (0.0%) |
| $150,000 or more | 62 (41.3%) | 0 (0.0%) |
| Total | 150 (100.0%) | 16 (100.0%) |
Monthly Housing Cost Tiers in Nittany
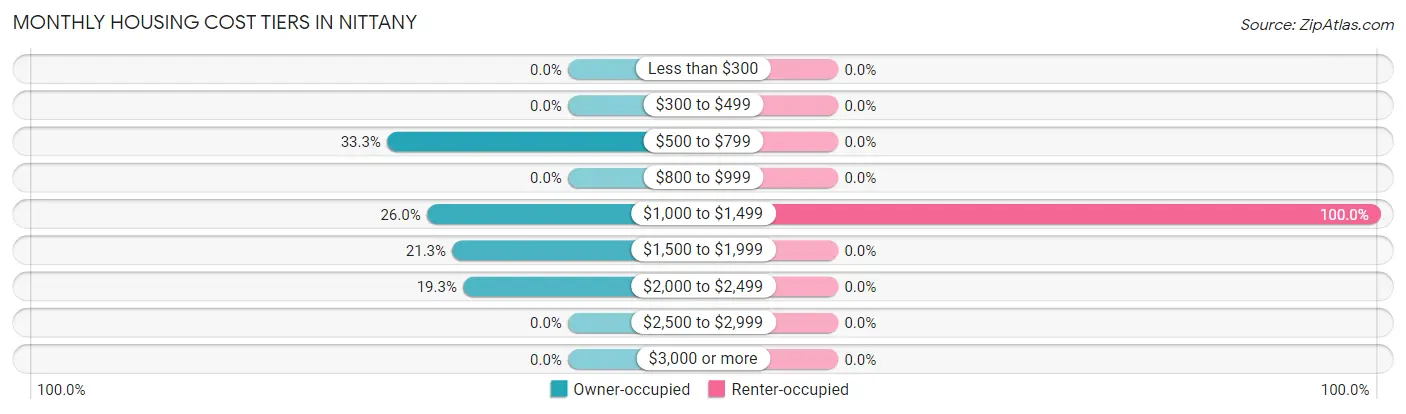
| Monthly Cost | Owner-occupied | Renter-occupied |
| Less than $300 | 0 (0.0%) | 0 (0.0%) |
| $300 to $499 | 0 (0.0%) | 0 (0.0%) |
| $500 to $799 | 50 (33.3%) | 0 (0.0%) |
| $800 to $999 | 0 (0.0%) | 0 (0.0%) |
| $1,000 to $1,499 | 39 (26.0%) | 16 (100.0%) |
| $1,500 to $1,999 | 32 (21.3%) | 0 (0.0%) |
| $2,000 to $2,499 | 29 (19.3%) | 0 (0.0%) |
| $2,500 to $2,999 | 0 (0.0%) | 0 (0.0%) |
| $3,000 or more | 0 (0.0%) | 0 (0.0%) |
| Total | 150 (100.0%) | 16 (100.0%) |
Physical Housing Characteristics in Nittany
Housing Structures in Nittany
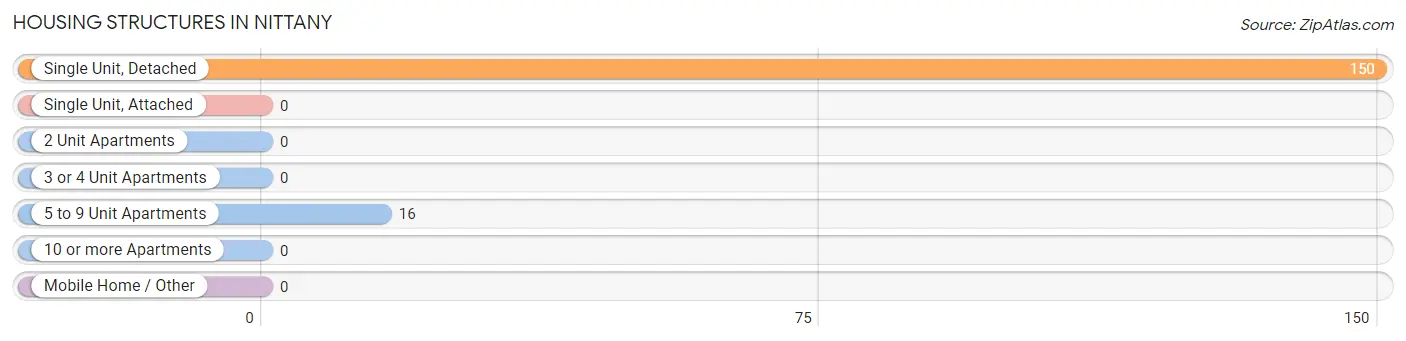
| Structure Type | # Housing Units | % Housing Units |
| Single Unit, Detached | 150 | 90.4% |
| Single Unit, Attached | 0 | 0.0% |
| 2 Unit Apartments | 0 | 0.0% |
| 3 or 4 Unit Apartments | 0 | 0.0% |
| 5 to 9 Unit Apartments | 16 | 9.6% |
| 10 or more Apartments | 0 | 0.0% |
| Mobile Home / Other | 0 | 0.0% |
| Total | 166 | 100.0% |
Housing Structures by Occupancy in Nittany
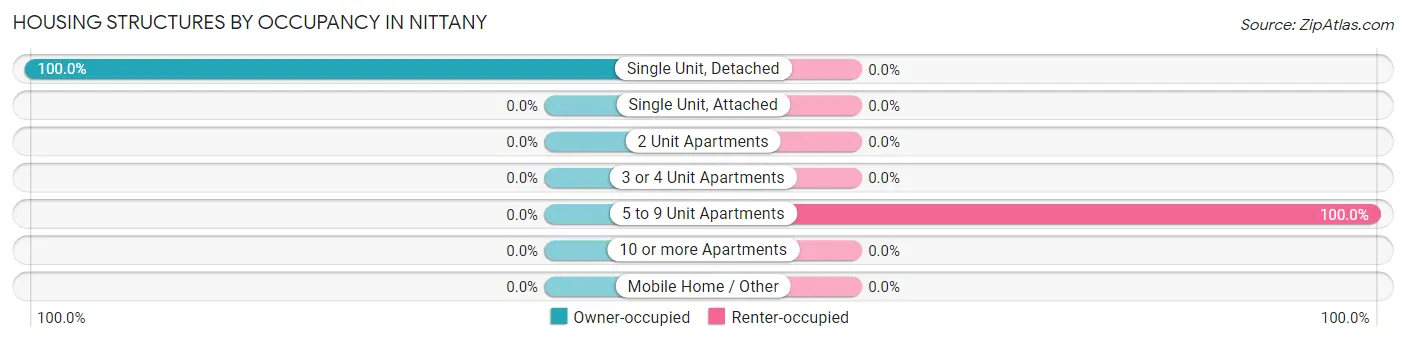
| Structure Type | Owner-occupied | Renter-occupied |
| Single Unit, Detached | 150 (100.0%) | 0 (0.0%) |
| Single Unit, Attached | 0 (0.0%) | 0 (0.0%) |
| 2 Unit Apartments | 0 (0.0%) | 0 (0.0%) |
| 3 or 4 Unit Apartments | 0 (0.0%) | 0 (0.0%) |
| 5 to 9 Unit Apartments | 0 (0.0%) | 16 (100.0%) |
| 10 or more Apartments | 0 (0.0%) | 0 (0.0%) |
| Mobile Home / Other | 0 (0.0%) | 0 (0.0%) |
| Total | 150 (90.4%) | 16 (9.6%) |
Housing Structures by Number of Rooms in Nittany
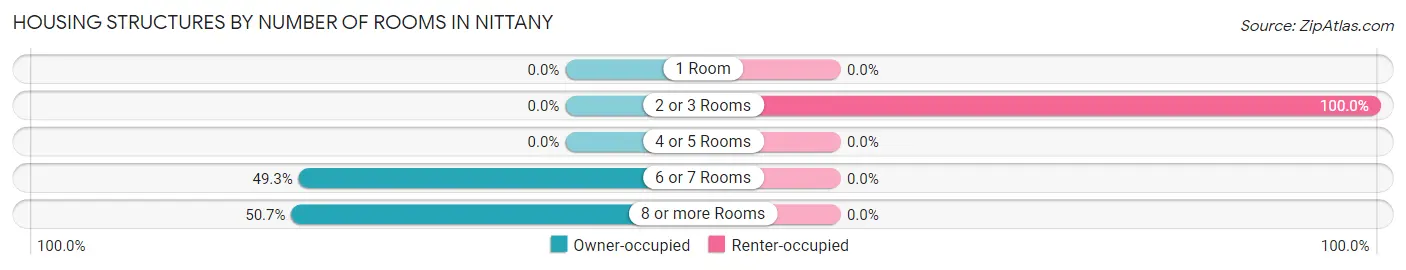
| Number of Rooms | Owner-occupied | Renter-occupied |
| 1 Room | 0 (0.0%) | 0 (0.0%) |
| 2 or 3 Rooms | 0 (0.0%) | 16 (100.0%) |
| 4 or 5 Rooms | 0 (0.0%) | 0 (0.0%) |
| 6 or 7 Rooms | 74 (49.3%) | 0 (0.0%) |
| 8 or more Rooms | 76 (50.7%) | 0 (0.0%) |
| Total | 150 (100.0%) | 16 (100.0%) |
Housing Structure by Heating Type in Nittany
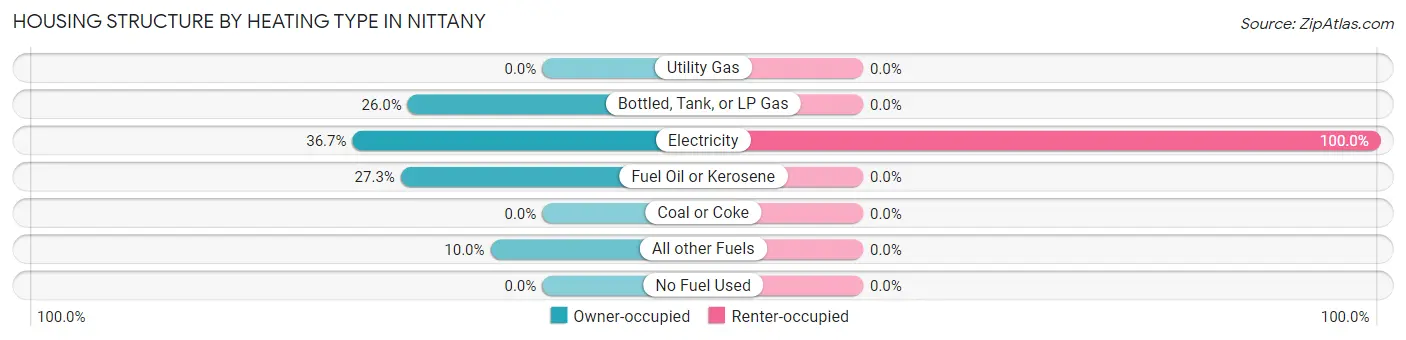
| Heating Type | Owner-occupied | Renter-occupied |
| Utility Gas | 0 (0.0%) | 0 (0.0%) |
| Bottled, Tank, or LP Gas | 39 (26.0%) | 0 (0.0%) |
| Electricity | 55 (36.7%) | 16 (100.0%) |
| Fuel Oil or Kerosene | 41 (27.3%) | 0 (0.0%) |
| Coal or Coke | 0 (0.0%) | 0 (0.0%) |
| All other Fuels | 15 (10.0%) | 0 (0.0%) |
| No Fuel Used | 0 (0.0%) | 0 (0.0%) |
| Total | 150 (100.0%) | 16 (100.0%) |
Household Vehicle Usage in Nittany
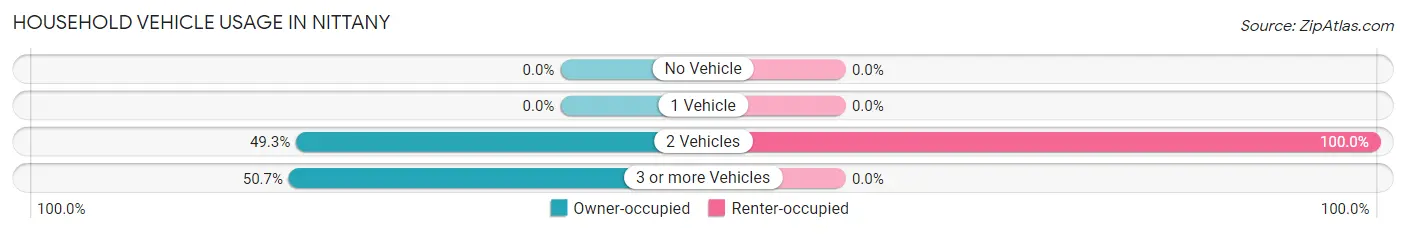
| Vehicles per Household | Owner-occupied | Renter-occupied |
| No Vehicle | 0 (0.0%) | 0 (0.0%) |
| 1 Vehicle | 0 (0.0%) | 0 (0.0%) |
| 2 Vehicles | 74 (49.3%) | 16 (100.0%) |
| 3 or more Vehicles | 76 (50.7%) | 0 (0.0%) |
| Total | 150 (100.0%) | 16 (100.0%) |
Real Estate & Mortgages in Nittany
Real Estate and Mortgage Overview in Nittany
| Characteristic | Without Mortgage | With Mortgage |
| Housing Units | 67 | 83 |
| Median Property Value | $226,400 | $267,000 |
| Median Household Income | - | - |
| Monthly Housing Costs | $718 | $0 |
| Real Estate Taxes | $2,529 | $0 |
Property Value by Mortgage Status in Nittany
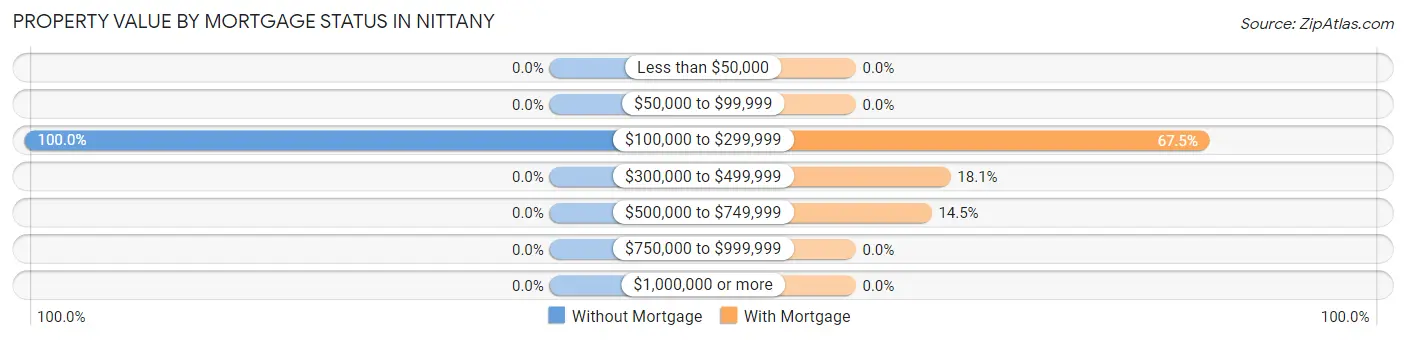
| Property Value | Without Mortgage | With Mortgage |
| Less than $50,000 | 0 (0.0%) | 0 (0.0%) |
| $50,000 to $99,999 | 0 (0.0%) | 0 (0.0%) |
| $100,000 to $299,999 | 67 (100.0%) | 56 (67.5%) |
| $300,000 to $499,999 | 0 (0.0%) | 15 (18.1%) |
| $500,000 to $749,999 | 0 (0.0%) | 12 (14.5%) |
| $750,000 to $999,999 | 0 (0.0%) | 0 (0.0%) |
| $1,000,000 or more | 0 (0.0%) | 0 (0.0%) |
| Total | 67 (100.0%) | 83 (100.0%) |
Household Income by Mortgage Status in Nittany
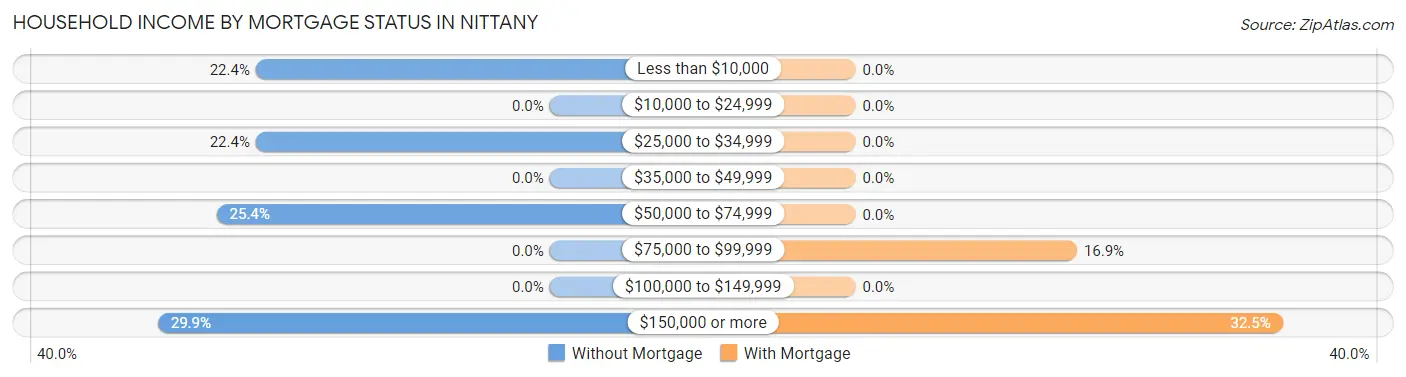
| Household Income | Without Mortgage | With Mortgage |
| Less than $10,000 | 15 (22.4%) | 0 (0.0%) |
| $10,000 to $24,999 | 0 (0.0%) | 0 (0.0%) |
| $25,000 to $34,999 | 15 (22.4%) | 0 (0.0%) |
| $35,000 to $49,999 | 0 (0.0%) | 0 (0.0%) |
| $50,000 to $74,999 | 17 (25.4%) | 0 (0.0%) |
| $75,000 to $99,999 | 0 (0.0%) | 14 (16.9%) |
| $100,000 to $149,999 | 0 (0.0%) | 0 (0.0%) |
| $150,000 or more | 20 (29.8%) | 27 (32.5%) |
| Total | 67 (100.0%) | 83 (100.0%) |
Property Value to Household Income Ratio in Nittany
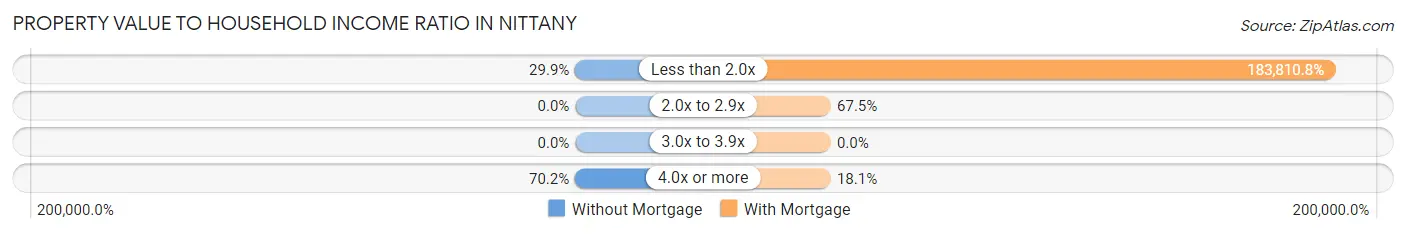
| Value-to-Income Ratio | Without Mortgage | With Mortgage |
| Less than 2.0x | 20 (29.8%) | 152,563 (183,810.8%) |
| 2.0x to 2.9x | 0 (0.0%) | 56 (67.5%) |
| 3.0x to 3.9x | 0 (0.0%) | 0 (0.0%) |
| 4.0x or more | 47 (70.2%) | 15 (18.1%) |
| Total | 67 (100.0%) | 83 (100.0%) |
Real Estate Taxes by Mortgage Status in Nittany
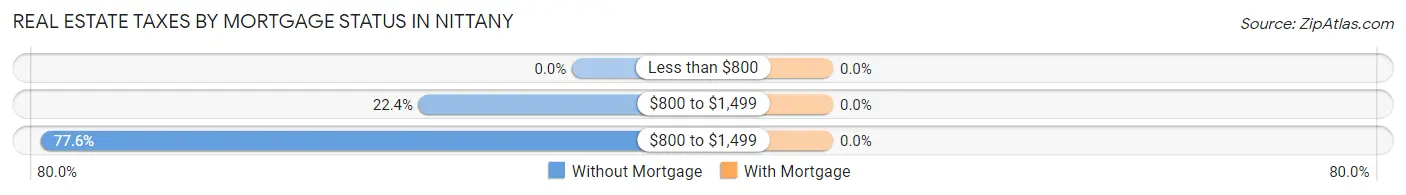
| Property Taxes | Without Mortgage | With Mortgage |
| Less than $800 | 0 (0.0%) | 0 (0.0%) |
| $800 to $1,499 | 15 (22.4%) | 0 (0.0%) |
| $800 to $1,499 | 52 (77.6%) | 0 (0.0%) |
| Total | 67 (100.0%) | 83 (100.0%) |
Health & Disability in Nittany
Health Insurance Coverage by Age in Nittany
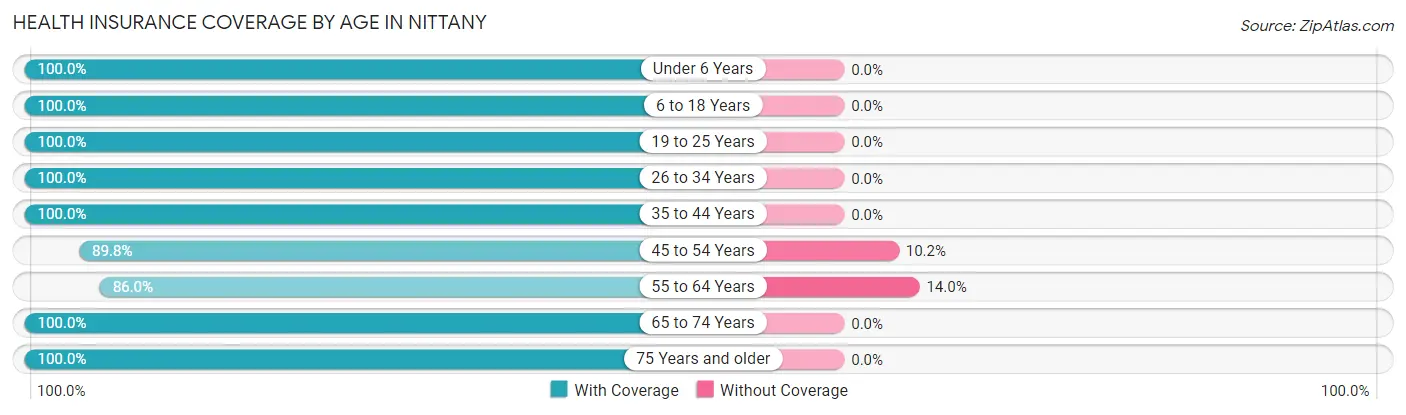
| Age Bracket | With Coverage | Without Coverage |
| Under 6 Years | 17 (100.0%) | 0 (0.0%) |
| 6 to 18 Years | 217 (100.0%) | 0 (0.0%) |
| 19 to 25 Years | 95 (100.0%) | 0 (0.0%) |
| 26 to 34 Years | 89 (100.0%) | 0 (0.0%) |
| 35 to 44 Years | 129 (100.0%) | 0 (0.0%) |
| 45 to 54 Years | 115 (89.8%) | 13 (10.2%) |
| 55 to 64 Years | 92 (86.0%) | 15 (14.0%) |
| 65 to 74 Years | 15 (100.0%) | 0 (0.0%) |
| 75 Years and older | 52 (100.0%) | 0 (0.0%) |
| Total | 821 (96.7%) | 28 (3.3%) |
Health Insurance Coverage by Citizenship Status in Nittany
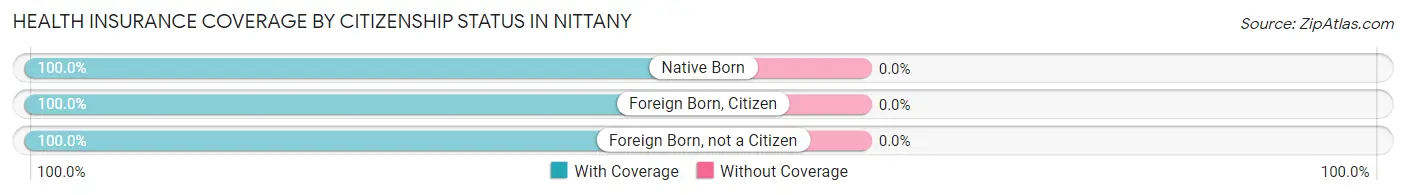
| Citizenship Status | With Coverage | Without Coverage |
| Native Born | 17 (100.0%) | 0 (0.0%) |
| Foreign Born, Citizen | 217 (100.0%) | 0 (0.0%) |
| Foreign Born, not a Citizen | 95 (100.0%) | 0 (0.0%) |
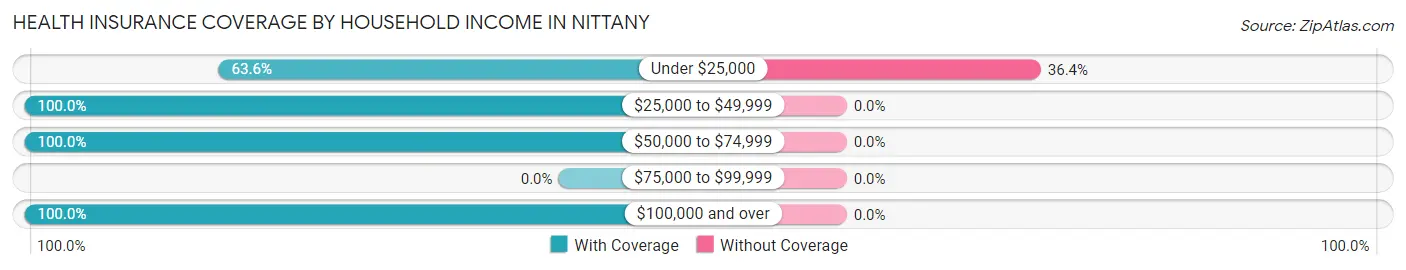
Health Insurance Coverage by Household Income in Nittany
| Household Income | With Coverage | Without Coverage |
| Under $25,000 | 49 (63.6%) | 28 (36.4%) |
| $25,000 to $49,999 | 60 (100.0%) | 0 (0.0%) |
| $50,000 to $74,999 | 97 (100.0%) | 0 (0.0%) |
| $75,000 to $99,999 | 0 (0.0%) | 0 (0.0%) |
| $100,000 and over | 615 (100.0%) | 0 (0.0%) |
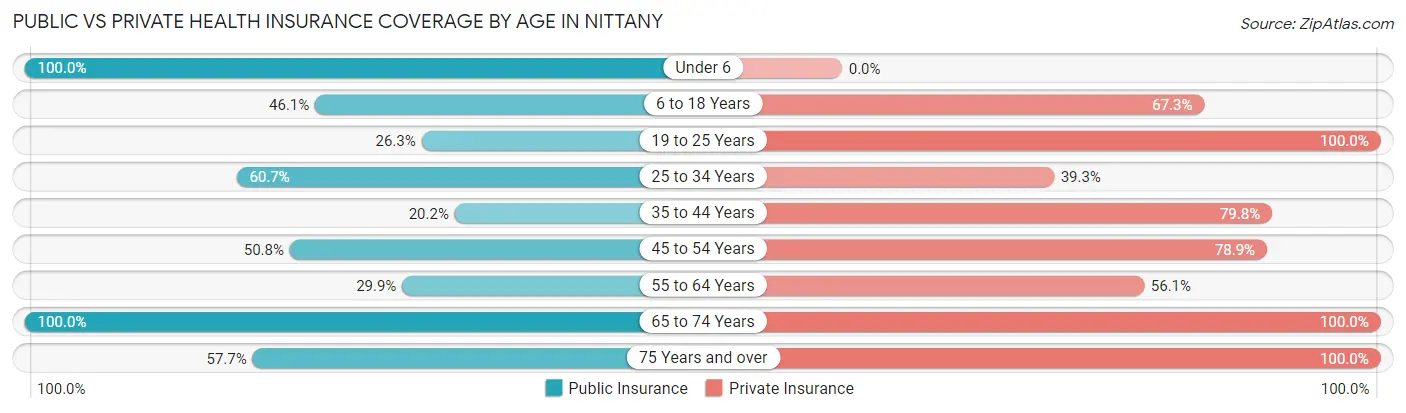
Public vs Private Health Insurance Coverage by Age in Nittany
| Age Bracket | Public Insurance | Private Insurance |
| Under 6 | 17 (100.0%) | 0 (0.0%) |
| 6 to 18 Years | 100 (46.1%) | 146 (67.3%) |
| 19 to 25 Years | 25 (26.3%) | 95 (100.0%) |
| 25 to 34 Years | 54 (60.7%) | 35 (39.3%) |
| 35 to 44 Years | 26 (20.2%) | 103 (79.8%) |
| 45 to 54 Years | 65 (50.8%) | 101 (78.9%) |
| 55 to 64 Years | 32 (29.9%) | 60 (56.1%) |
| 65 to 74 Years | 15 (100.0%) | 15 (100.0%) |
| 75 Years and over | 30 (57.7%) | 52 (100.0%) |
| Total | 364 (42.9%) | 607 (71.5%) |
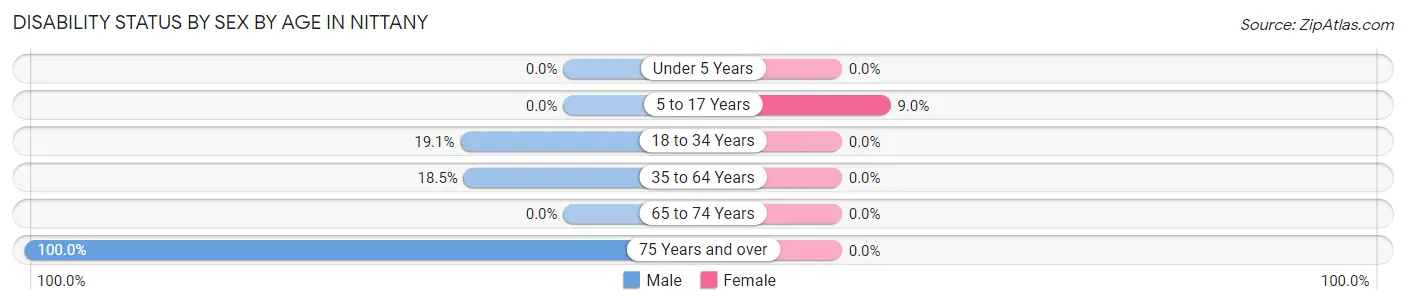
Disability Status by Sex by Age in Nittany
| Age Bracket | Male | Female |
| Under 5 Years | 0 (0.0%) | 0 (0.0%) |
| 5 to 17 Years | 0 (0.0%) | 14 (9.0%) |
| 18 to 34 Years | 22 (19.1%) | 0 (0.0%) |
| 35 to 64 Years | 32 (18.5%) | 0 (0.0%) |
| 65 to 74 Years | 0 (0.0%) | 0 (0.0%) |
| 75 Years and over | 15 (100.0%) | 0 (0.0%) |
Disability Class by Sex by Age in Nittany
Disability Class: Hearing Difficulty
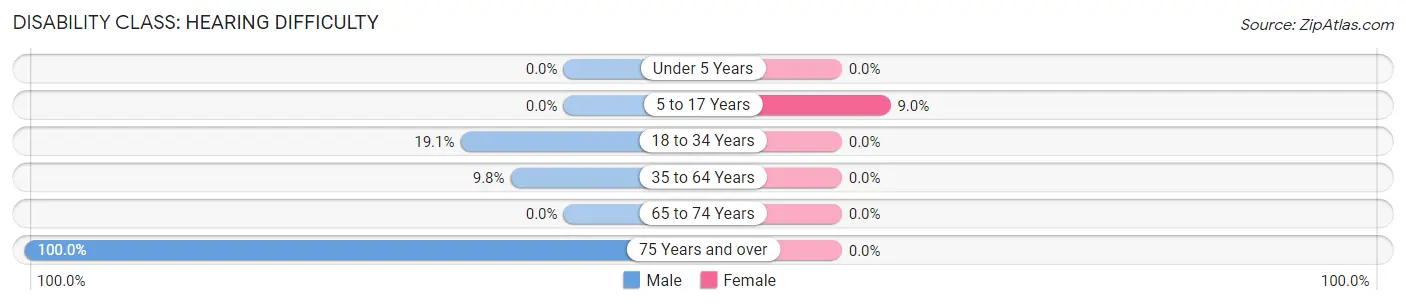
| Age Bracket | Male | Female |
| Under 5 Years | 0 (0.0%) | 0 (0.0%) |
| 5 to 17 Years | 0 (0.0%) | 14 (9.0%) |
| 18 to 34 Years | 22 (19.1%) | 0 (0.0%) |
| 35 to 64 Years | 17 (9.8%) | 0 (0.0%) |
| 65 to 74 Years | 0 (0.0%) | 0 (0.0%) |
| 75 Years and over | 15 (100.0%) | 0 (0.0%) |
Disability Class: Vision Difficulty
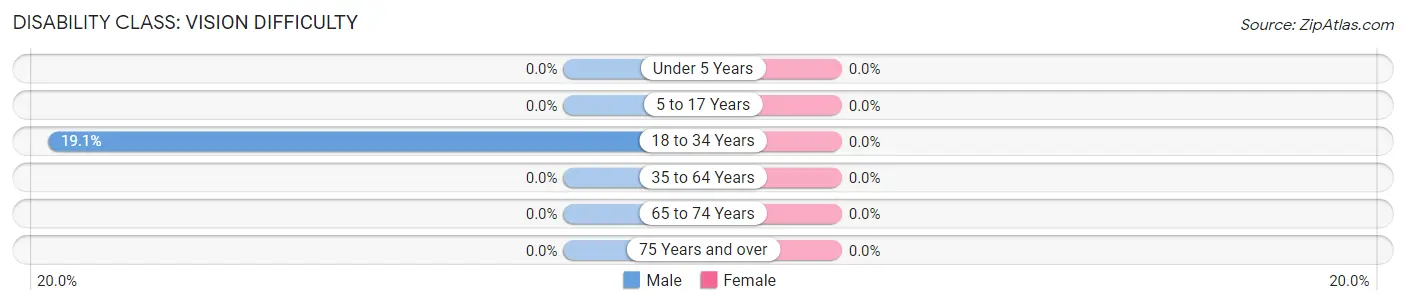
| Age Bracket | Male | Female |
| Under 5 Years | 0 (0.0%) | 0 (0.0%) |
| 5 to 17 Years | 0 (0.0%) | 0 (0.0%) |
| 18 to 34 Years | 22 (19.1%) | 0 (0.0%) |
| 35 to 64 Years | 0 (0.0%) | 0 (0.0%) |
| 65 to 74 Years | 0 (0.0%) | 0 (0.0%) |
| 75 Years and over | 0 (0.0%) | 0 (0.0%) |
Disability Class: Cognitive Difficulty
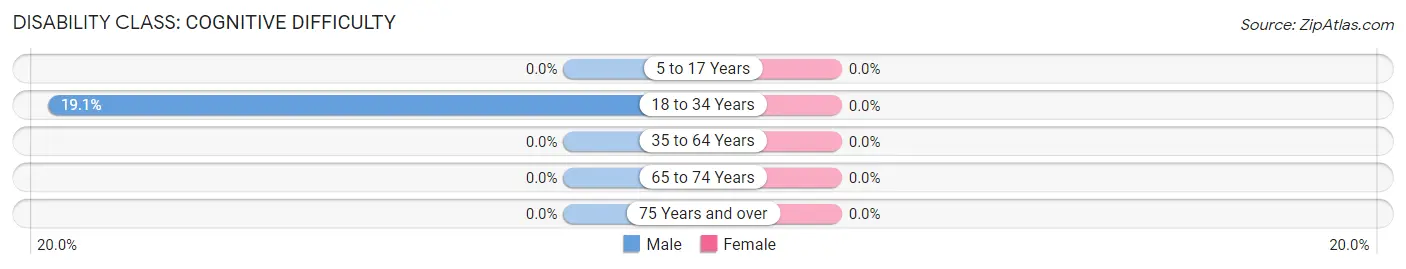
| Age Bracket | Male | Female |
| 5 to 17 Years | 0 (0.0%) | 0 (0.0%) |
| 18 to 34 Years | 22 (19.1%) | 0 (0.0%) |
| 35 to 64 Years | 0 (0.0%) | 0 (0.0%) |
| 65 to 74 Years | 0 (0.0%) | 0 (0.0%) |
| 75 Years and over | 0 (0.0%) | 0 (0.0%) |
Disability Class: Ambulatory Difficulty
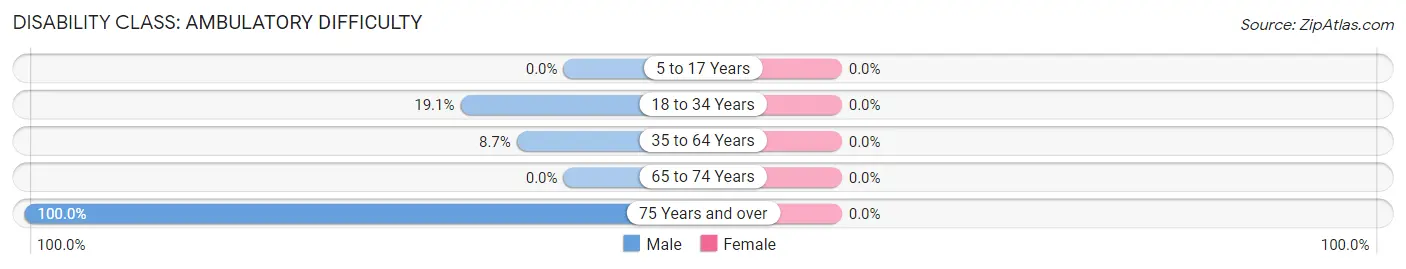
| Age Bracket | Male | Female |
| 5 to 17 Years | 0 (0.0%) | 0 (0.0%) |
| 18 to 34 Years | 22 (19.1%) | 0 (0.0%) |
| 35 to 64 Years | 15 (8.7%) | 0 (0.0%) |
| 65 to 74 Years | 0 (0.0%) | 0 (0.0%) |
| 75 Years and over | 15 (100.0%) | 0 (0.0%) |
Disability Class: Self-Care Difficulty
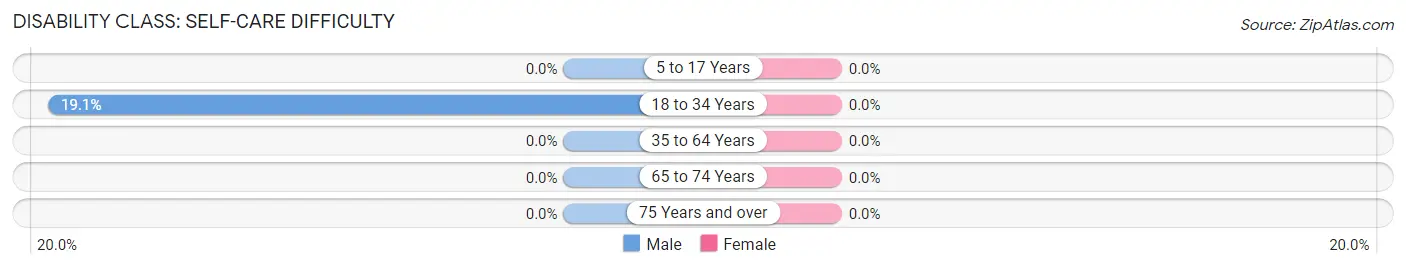
| Age Bracket | Male | Female |
| 5 to 17 Years | 0 (0.0%) | 0 (0.0%) |
| 18 to 34 Years | 22 (19.1%) | 0 (0.0%) |
| 35 to 64 Years | 0 (0.0%) | 0 (0.0%) |
| 65 to 74 Years | 0 (0.0%) | 0 (0.0%) |
| 75 Years and over | 0 (0.0%) | 0 (0.0%) |
Technology Access in Nittany
Computing Device Access in Nittany
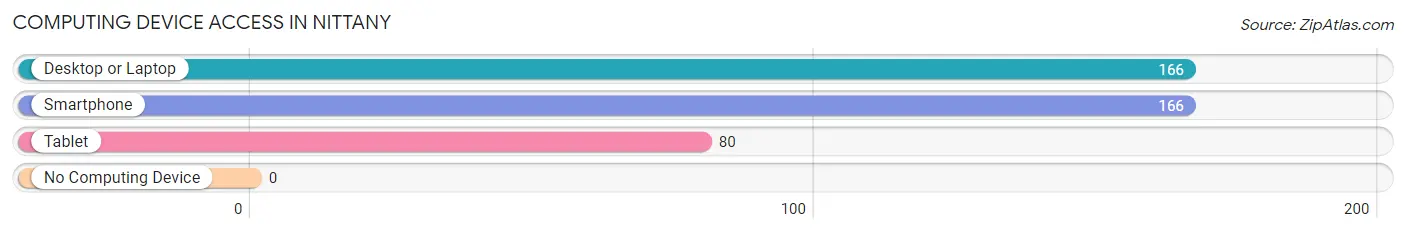
| Device Type | # Households | % Households |
| Desktop or Laptop | 166 | 100.0% |
| Smartphone | 166 | 100.0% |
| Tablet | 80 | 48.2% |
| No Computing Device | 0 | 0.0% |
| Total | 166 | 100.0% |
Internet Access in Nittany
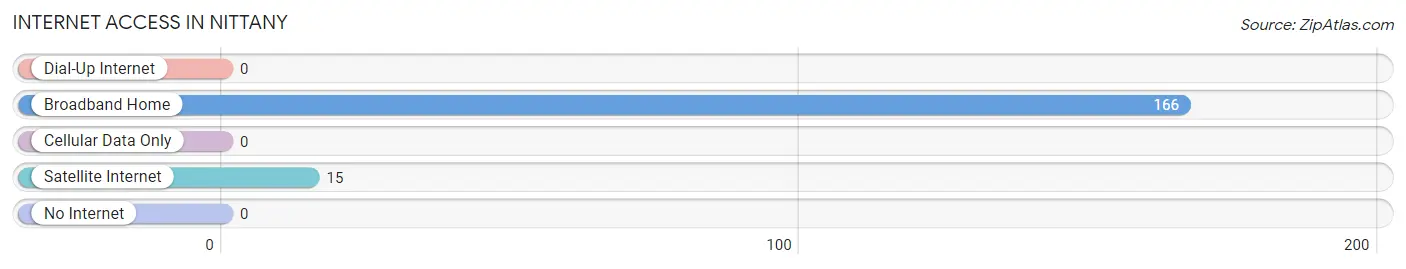
| Internet Type | # Households | % Households |
| Dial-Up Internet | 0 | 0.0% |
| Broadband Home | 166 | 100.0% |
| Cellular Data Only | 0 | 0.0% |
| Satellite Internet | 15 | 9.0% |
| No Internet | 0 | 0.0% |
| Total | 166 | 100.0% |
Nittany Summary
Nittany, Pennsylvania is a small borough located in Centre County, Pennsylvania. It is situated in the Nittany Valley, which is part of the Ridge and Valley physiographic province of the Appalachian Mountains. The borough is located approximately 8 miles from State College, the home of Penn State University. The population of Nittany was 545 at the 2010 census.
History
The area that is now Nittany was first settled in the late 1700s by German and Scots-Irish immigrants. The town was originally known as Nittany Valley, and was incorporated as a borough in 1875. The name Nittany is derived from the Native American word “Nittawee”, which means “single mountain”. The mountain in question is Mount Nittany, which is located just outside of town.
The town was originally a farming community, and the main crops were wheat, oats, and corn. In the late 1800s, the town began to develop into a small industrial center, with several small factories and mills. The most notable of these was the Nittany Woolen Mill, which was established in 1883 and operated until the 1950s.
Geography
Nittany is located in the Nittany Valley, which is part of the Ridge and Valley physiographic province of the Appalachian Mountains. The borough is located approximately 8 miles from State College, the home of Penn State University. The town is situated at an elevation of 1,000 feet above sea level.
The borough is located in the Nittany Valley, which is a narrow valley that runs from the Allegheny Front to the Bald Eagle Valley. The valley is surrounded by steep hills and mountains, including Mount Nittany, which is located just outside of town. The Nittany Valley is known for its scenic beauty and is a popular destination for outdoor recreation.
Economy
The economy of Nittany is largely based on agriculture and tourism. The town is home to several small farms, which produce a variety of crops, including wheat, oats, corn, and hay. The town is also home to several small businesses, including restaurants, shops, and a bed and breakfast.
The town is also a popular destination for outdoor recreation. The Nittany Valley is known for its scenic beauty and is a popular destination for hiking, camping, fishing, and hunting. The town is also home to several parks, including Nittany Mountain State Park, which offers a variety of outdoor activities.
Demographics
As of the 2010 census, the population of Nittany was 545. The racial makeup of the borough was 97.3% White, 0.7% African American, 0.2% Native American, 0.2% Asian, and 1.6% from two or more races. The median household income was $45,833, and the median family income was $50,833. The per capita income was $20,917.
Conclusion
Nittany, Pennsylvania is a small borough located in Centre County, Pennsylvania. It is situated in the Nittany Valley, which is part of the Ridge and Valley physiographic province of the Appalachian Mountains. The borough is located approximately 8 miles from State College, the home of Penn State University. The population of Nittany was 545 at the 2010 census. The economy of Nittany is largely based on agriculture and tourism, and the town is a popular destination for outdoor recreation. The racial makeup of the borough was 97.3% White, 0.7% African American, 0.2% Native American, 0.2% Asian, and 1.6% from two or more races. The median household income was $45,833, and the median family income was $50,833. The per capita income was $20,917.
Common Questions
What is the Total Population of Nittany?
Total Population of Nittany is 849.
What is the Total Male Population of Nittany?
Total Male Population of Nittany is 349.
What is the Total Female Population of Nittany?
Total Female Population of Nittany is 500.
What is the Ratio of Males per 100 Females in Nittany?
There are 69.80 Males per 100 Females in Nittany.
What is the Ratio of Females per 100 Males in Nittany?
There are 143.27 Females per 100 Males in Nittany.
What is the Median Population Age in Nittany?
Median Population Age in Nittany is 37.5 Years.
What is the Average Family Size in Nittany
Average Family Size in Nittany is 4.7 People.
What is the Average Household Size in Nittany
Average Household Size in Nittany is 5.1 People.
What is Per Capita Income in Nittany?
Per Capita income in Nittany is $24,940.
What is the Median Family Income in Nittany?
Median Family Income in Nittany is $103,500.
What is the Median Household income in Nittany?
Median Household Income in Nittany is $103,500.
What is Income or Wage Gap in Nittany?
Income or Wage Gap in Nittany is 40.9%.
Women in Nittany earn 59.1 cents for every dollar earned by a man.
What is Inequality or Gini Index in Nittany?
Inequality or Gini Index in Nittany is 0.38.
How Large is the Labor Force in Nittany?
There are 457 People in the Labor Forcein in Nittany.
What is the Percentage of People in the Labor Force in Nittany?
67.2% of People are in the Labor Force in Nittany.