Zip Codes with the Highest Percentage of Population Employed in Accommodation & Food Services in Scranton, PA
RELATED REPORTS & OPTIONS
Accommodation & Food Services
Scranton
Compare Zip Codes
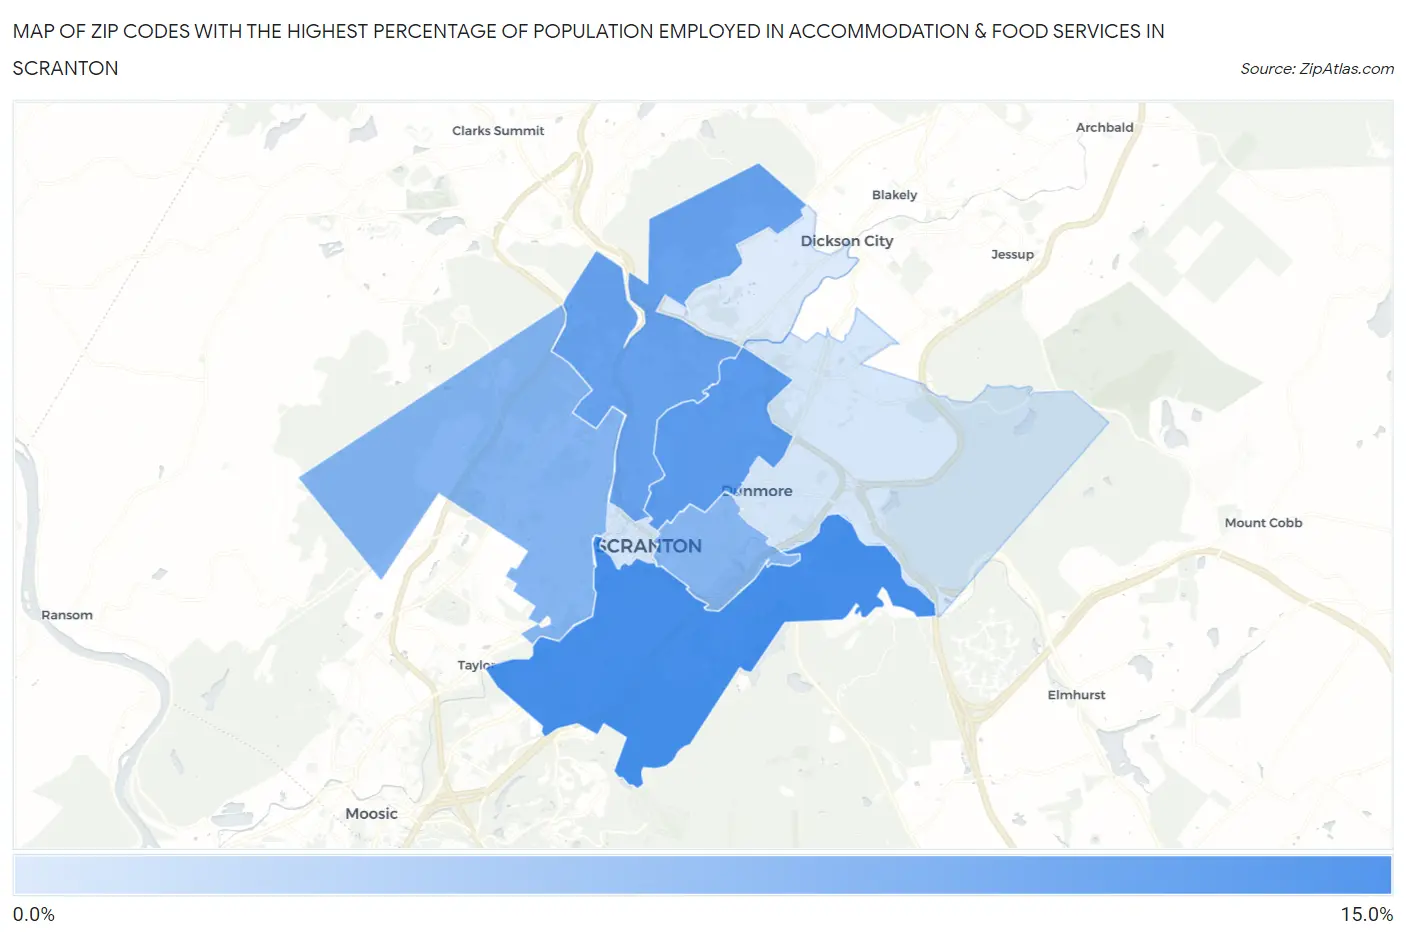
Map of Zip Codes with the Highest Percentage of Population Employed in Accommodation & Food Services in Scranton
0.0%
15.0%
Zip Codes with the Highest Percentage of Population Employed in Accommodation & Food Services in Scranton, PA
| Zip Code | % Employed | vs State | vs National | |
| 1. | 18505 | 10.5% | 5.9%(+4.57)#192 | 6.9%(+3.58)#4,037 |
| 2. | 18509 | 9.6% | 5.9%(+3.70)#229 | 6.9%(+2.71)#5,090 |
| 3. | 18508 | 9.1% | 5.9%(+3.20)#255 | 6.9%(+2.20)#5,825 |
| 4. | 18504 | 7.7% | 5.9%(+1.85)#370 | 6.9%(+0.860)#8,395 |
| 5. | 18510 | 7.7% | 5.9%(+1.76)#386 | 6.9%(+0.770)#8,622 |
| 6. | 18503 | 4.4% | 5.9%(-1.47)#995 | 6.9%(-2.47)#18,775 |
| 7. | 18512 | 4.3% | 5.9%(-1.63)#1,030 | 6.9%(-2.62)#19,319 |
| 8. | 18519 | 4.0% | 5.9%(-1.88)#1,089 | 6.9%(-2.87)#20,124 |
1
Common Questions
What are the Top 5 Zip Codes with the Highest Percentage of Population Employed in Accommodation & Food Services in Scranton, PA?
Top 5 Zip Codes with the Highest Percentage of Population Employed in Accommodation & Food Services in Scranton, PA are:
What zip code has the Highest Percentage of Population Employed in Accommodation & Food Services in Scranton, PA?
18505 has the Highest Percentage of Population Employed in Accommodation & Food Services in Scranton, PA with 10.5%.
What is the Percentage of Population Employed in Accommodation & Food Services in Scranton, PA?
Percentage of Population Employed in Accommodation & Food Services in Scranton is 9.2%.
What is the Percentage of Population Employed in Accommodation & Food Services in Pennsylvania?
Percentage of Population Employed in Accommodation & Food Services in Pennsylvania is 5.9%.
What is the Percentage of Population Employed in Accommodation & Food Services in the United States?
Percentage of Population Employed in Accommodation & Food Services in the United States is 6.9%.