Allison, PA
Allison Map
Allison Overview
344
TOTAL POPULATION
169
MALE POPULATION
175
FEMALE POPULATION
96.57
MALES / 100 FEMALES
103.55
FEMALES / 100 MALES
49.3
MEDIAN AGE
2.8
AVG FAMILY SIZE
2.1
AVG HOUSEHOLD SIZE
$34,056
PER CAPITA INCOME
$90,625
AVG FAMILY INCOME
$88,580
AVG HOUSEHOLD INCOME
0.27
INEQUALITY / GINI INDEX
133
LABOR FORCE [ PEOPLE ]
42.6%
PERCENT IN LABOR FORCE
Allison Zip Codes
Allison Area Codes
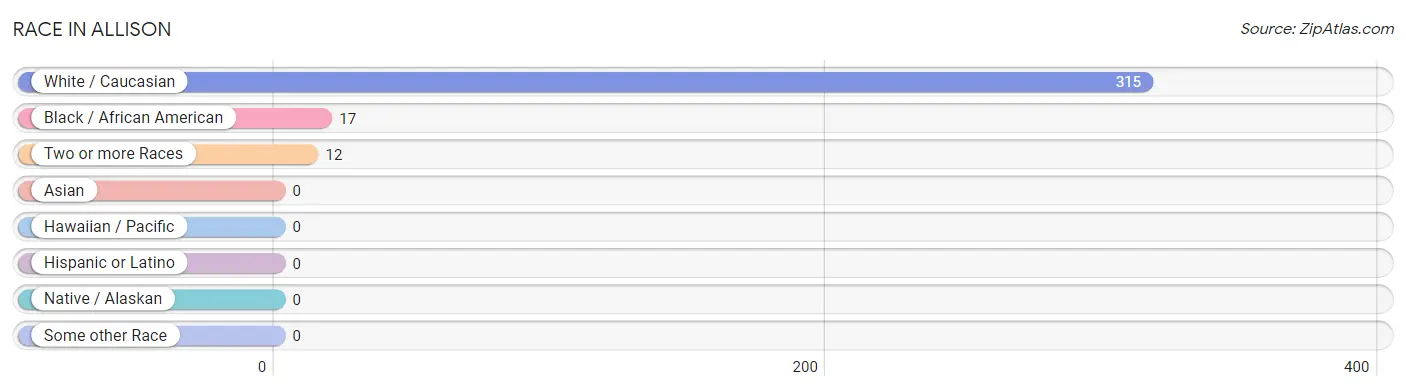
Race in Allison
The most populous races in Allison are White / Caucasian (315 | 91.6%), Black / African American (17 | 4.9%), and Two or more Races (12 | 3.5%).
| Race | # Population | % Population |
| Asian | 0 | 0.0% |
| Black / African American | 17 | 4.9% |
| Hawaiian / Pacific | 0 | 0.0% |
| Hispanic or Latino | 0 | 0.0% |
| Native / Alaskan | 0 | 0.0% |
| White / Caucasian | 315 | 91.6% |
| Two or more Races | 12 | 3.5% |
| Some other Race | 0 | 0.0% |
| Total | 344 | 100.0% |
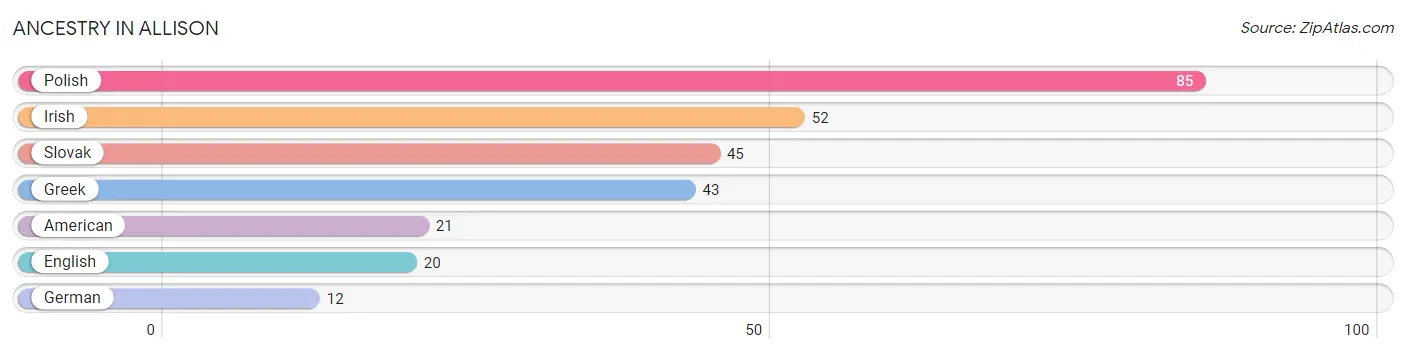
Ancestry in Allison
The most populous ancestries reported in Allison are Polish (85 | 24.7%), Irish (52 | 15.1%), Slovak (45 | 13.1%), Greek (43 | 12.5%), and American (21 | 6.1%), together accounting for 71.5% of all Allison residents.
| Ancestry | # Population | % Population |
| American | 21 | 6.1% |
| English | 20 | 5.8% |
| German | 12 | 3.5% |
| Greek | 43 | 12.5% |
| Irish | 52 | 15.1% |
| Polish | 85 | 24.7% |
| Slovak | 45 | 13.1% | View All 7 Rows |
Immigrants in Allison

| Immigration Origin | # Population | % Population | View All 0 Rows |
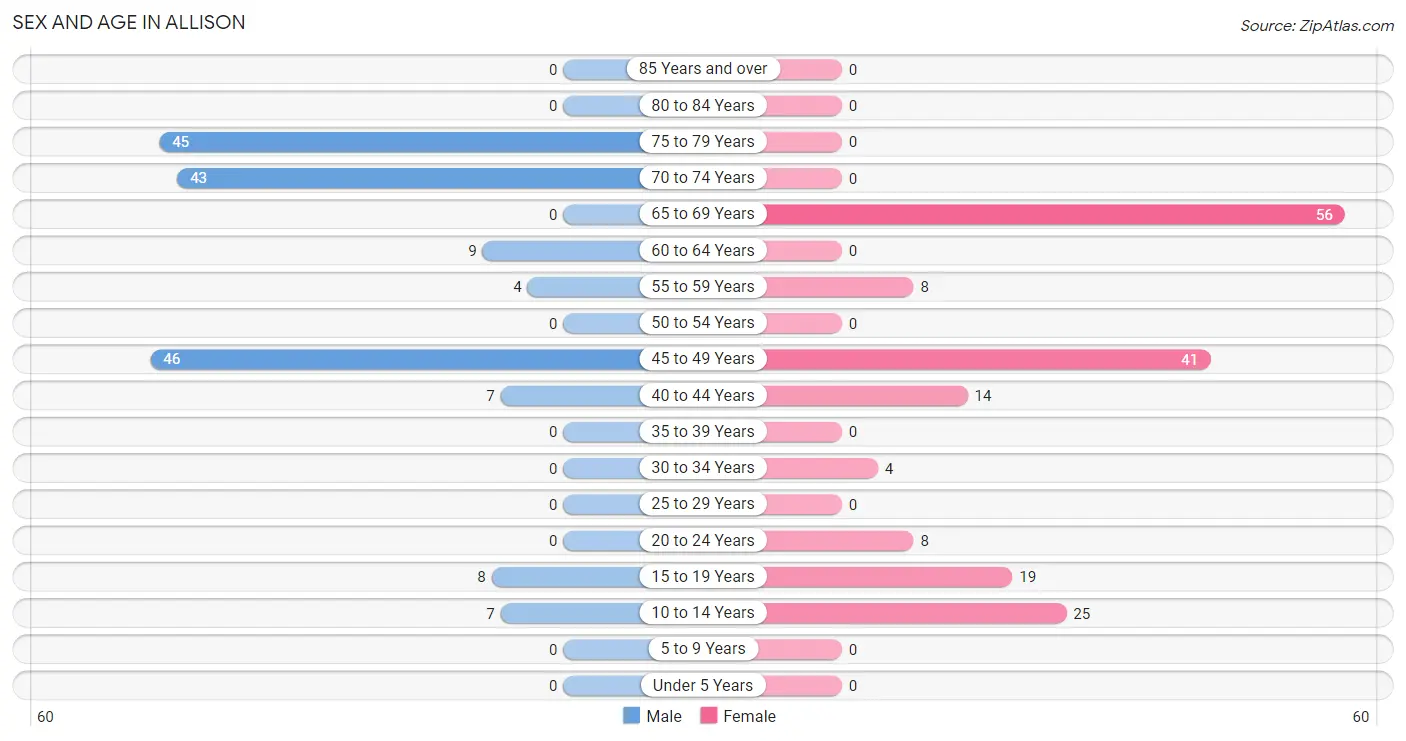
Sex and Age in Allison
Sex and Age in Allison
The most populous age groups in Allison are 45 to 49 Years (46 | 27.2%) for men and 65 to 69 Years (56 | 32.0%) for women.
| Age Bracket | Male | Female |
| Under 5 Years | 0 (0.0%) | 0 (0.0%) |
| 5 to 9 Years | 0 (0.0%) | 0 (0.0%) |
| 10 to 14 Years | 7 (4.1%) | 25 (14.3%) |
| 15 to 19 Years | 8 (4.7%) | 19 (10.9%) |
| 20 to 24 Years | 0 (0.0%) | 8 (4.6%) |
| 25 to 29 Years | 0 (0.0%) | 0 (0.0%) |
| 30 to 34 Years | 0 (0.0%) | 4 (2.3%) |
| 35 to 39 Years | 0 (0.0%) | 0 (0.0%) |
| 40 to 44 Years | 7 (4.1%) | 14 (8.0%) |
| 45 to 49 Years | 46 (27.2%) | 41 (23.4%) |
| 50 to 54 Years | 0 (0.0%) | 0 (0.0%) |
| 55 to 59 Years | 4 (2.4%) | 8 (4.6%) |
| 60 to 64 Years | 9 (5.3%) | 0 (0.0%) |
| 65 to 69 Years | 0 (0.0%) | 56 (32.0%) |
| 70 to 74 Years | 43 (25.4%) | 0 (0.0%) |
| 75 to 79 Years | 45 (26.6%) | 0 (0.0%) |
| 80 to 84 Years | 0 (0.0%) | 0 (0.0%) |
| 85 Years and over | 0 (0.0%) | 0 (0.0%) |
| Total | 169 (100.0%) | 175 (100.0%) |
Families and Households in Allison
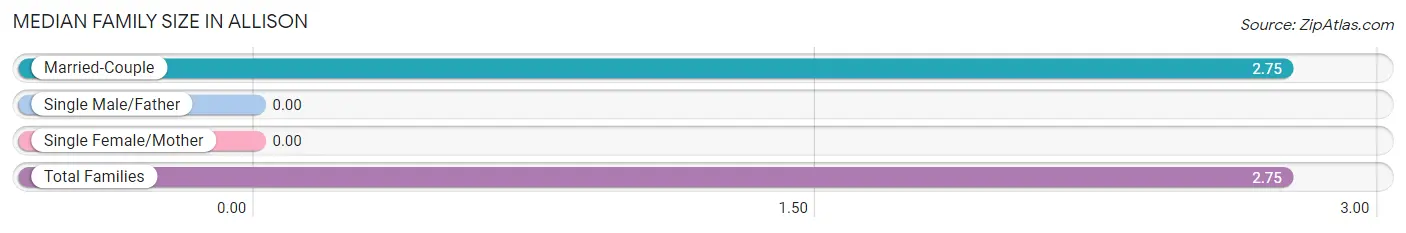
Median Family Size in Allison
| Family Type | # Families | Family Size |
| Married-Couple | 102 (100.0%) | 2.75 |
| Single Male/Father | 0 (0.0%) | - |
| Single Female/Mother | 0 (0.0%) | - |
| Total Families | 102 (100.0%) | 2.75 |
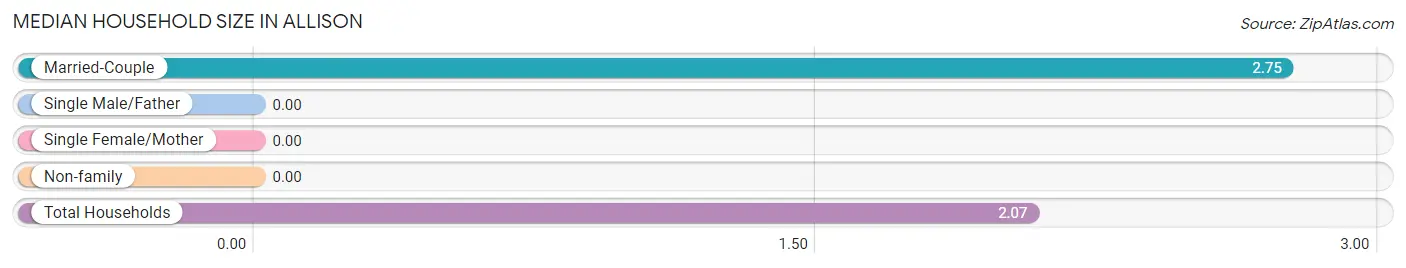
Median Household Size in Allison
| Household Type | # Households | Household Size |
| Married-Couple | 102 (61.5%) | 2.75 |
| Single Male/Father | 0 (0.0%) | - |
| Single Female/Mother | 0 (0.0%) | - |
| Non-family | 64 (38.6%) | - |
| Total Households | 166 (100.0%) | 2.07 |
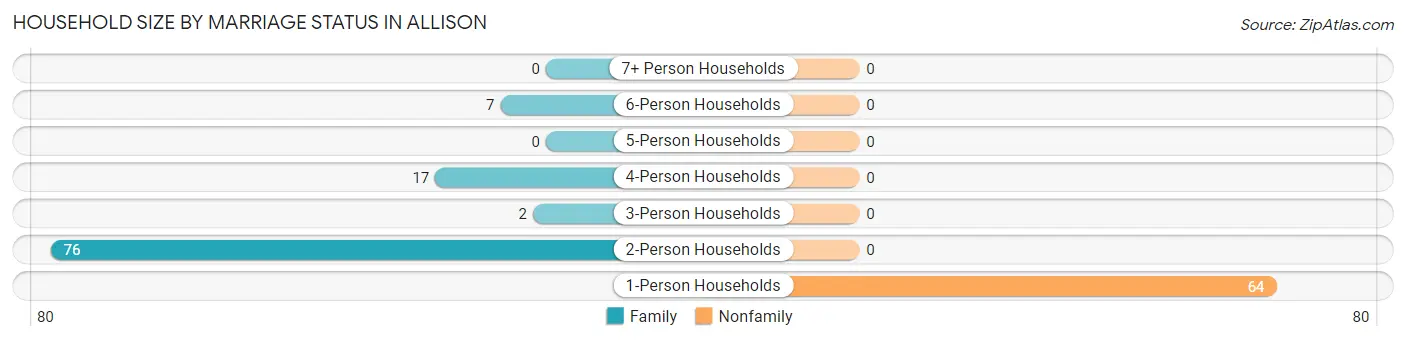
Household Size by Marriage Status in Allison
Out of a total of 166 households in Allison, 102 (61.5%) are family households, while 64 (38.6%) are nonfamily households. The most numerous type of family households are 2-person households, comprising 76, and the most common type of nonfamily households are 1-person households, comprising 64.
| Household Size | Family Households | Nonfamily Households |
| 1-Person Households | - | 64 (38.6%) |
| 2-Person Households | 76 (45.8%) | 0 (0.0%) |
| 3-Person Households | 2 (1.2%) | 0 (0.0%) |
| 4-Person Households | 17 (10.2%) | 0 (0.0%) |
| 5-Person Households | 0 (0.0%) | 0 (0.0%) |
| 6-Person Households | 7 (4.2%) | 0 (0.0%) |
| 7+ Person Households | 0 (0.0%) | 0 (0.0%) |
| Total | 102 (61.5%) | 64 (38.6%) |
Female Fertility in Allison
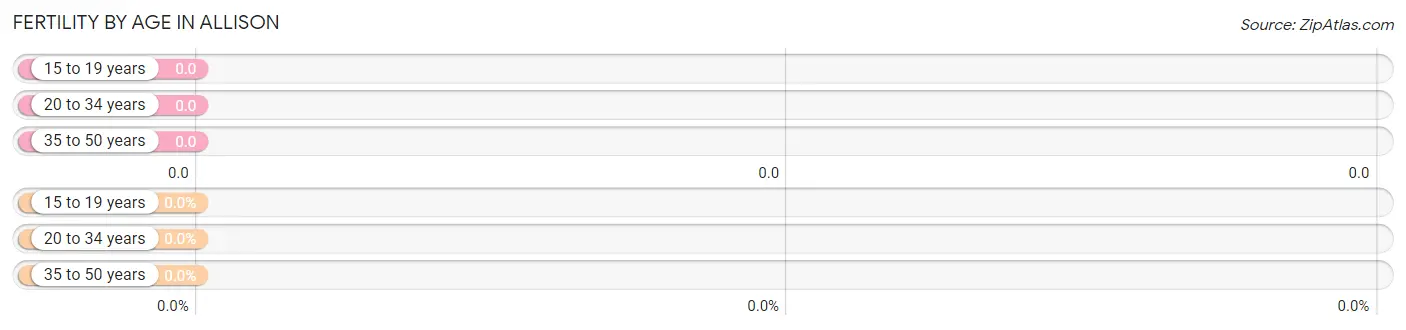
Fertility by Age in Allison
| Age Bracket | Women with Births | Births / 1,000 Women |
| 15 to 19 years | 0 (0.0%) | 0.0 |
| 20 to 34 years | 0 (0.0%) | 0.0 |
| 35 to 50 years | 0 (0.0%) | 0.0 |
| Total | 0 (0.0%) | 0.0 |
Fertility by Age by Marriage Status in Allison
| Age Bracket | Married | Unmarried |
| 15 to 19 years | 0 (0.0%) | 0 (0.0%) |
| 20 to 34 years | 0 (0.0%) | 0 (0.0%) |
| 35 to 50 years | 0 (0.0%) | 0 (0.0%) |
| Total | 0 (0.0%) | 0 (0.0%) |
Fertility by Education in Allison
| Educational Attainment | Women with Births | Births / 1,000 Women |
| Less than High School | 0 (0.0%) | 0.0 |
| High School Diploma | 0 (0.0%) | 0.0 |
| College or Associate's Degree | 0 (0.0%) | 0.0 |
| Bachelor's Degree | 0 (0.0%) | 0.0 |
| Graduate Degree | 0 (0.0%) | 0.0 |
| Total | 0 (0.0%) | 0.0 |
Fertility by Education by Marriage Status in Allison
| Educational Attainment | Married | Unmarried |
| Less than High School | 0 (0.0%) | 0 (0.0%) |
| High School Diploma | 0 (0.0%) | 0 (0.0%) |
| College or Associate's Degree | 0 (0.0%) | 0 (0.0%) |
| Bachelor's Degree | 0 (0.0%) | 0 (0.0%) |
| Graduate Degree | 0 (0.0%) | 0 (0.0%) |
| Total | 0 (0.0%) | 0 (0.0%) |
Income in Allison
Income Overview in Allison
Per Capita Income in Allison is $34,056, while median incomes of families and households are $90,625 and $88,580 respectively.
| Characteristic | Number | Measure |
| Per Capita Income | 344 | $34,056 |
| Median Family Income | 102 | $90,625 |
| Mean Family Income | 102 | $96,059 |
| Median Household Income | 166 | $88,580 |
| Mean Household Income | 166 | $68,821 |
| Income Deficit | 102 | $0 |
| Wage / Income Gap (%) | 344 | 0.00% |
| Wage / Income Gap ($) | 344 | 100.00¢ per $1 |
| Gini / Inequality Index | 344 | 0.27 |
Earnings by Sex in Allison
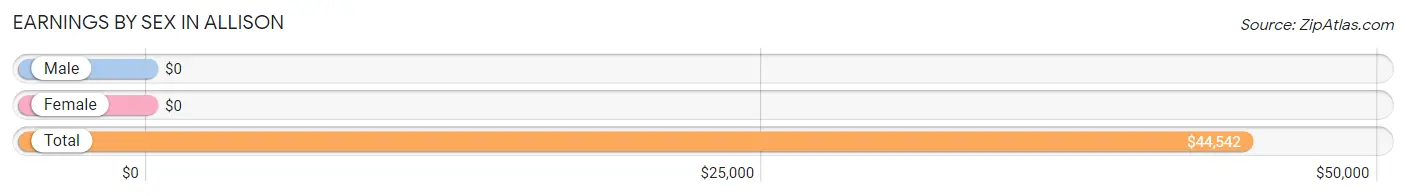
| Sex | Number | Average Earnings |
| Male | 64 (48.1%) | $0 |
| Female | 69 (51.9%) | $0 |
| Total | 133 (100.0%) | $44,542 |
Earnings by Sex by Income Bracket in Allison
The most common earnings brackets in Allison are $45,000 to $49,999 for men (28 | 43.8%) and $40,000 to $44,999 for women (30 | 43.5%).
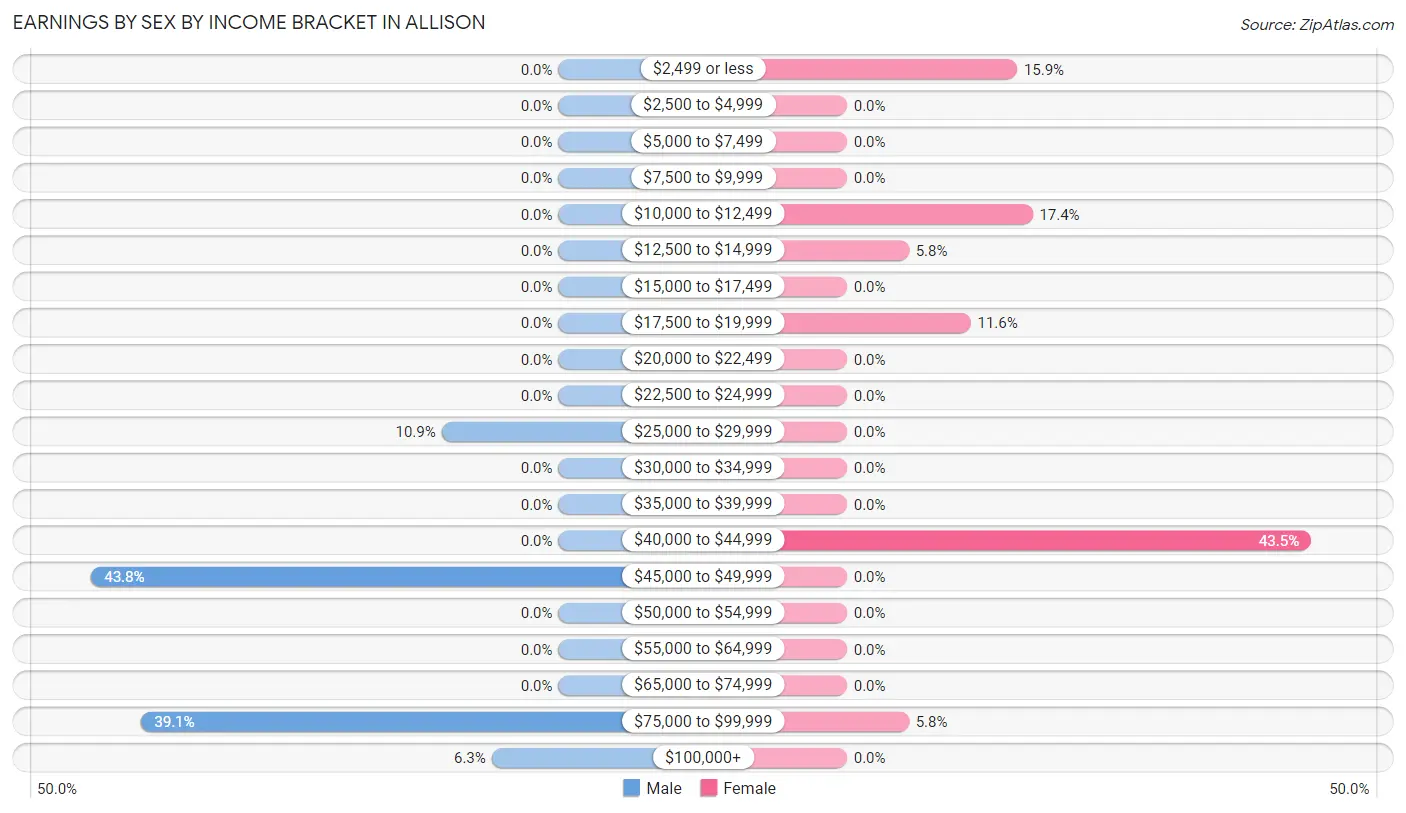
| Income | Male | Female |
| $2,499 or less | 0 (0.0%) | 11 (15.9%) |
| $2,500 to $4,999 | 0 (0.0%) | 0 (0.0%) |
| $5,000 to $7,499 | 0 (0.0%) | 0 (0.0%) |
| $7,500 to $9,999 | 0 (0.0%) | 0 (0.0%) |
| $10,000 to $12,499 | 0 (0.0%) | 12 (17.4%) |
| $12,500 to $14,999 | 0 (0.0%) | 4 (5.8%) |
| $15,000 to $17,499 | 0 (0.0%) | 0 (0.0%) |
| $17,500 to $19,999 | 0 (0.0%) | 8 (11.6%) |
| $20,000 to $22,499 | 0 (0.0%) | 0 (0.0%) |
| $22,500 to $24,999 | 0 (0.0%) | 0 (0.0%) |
| $25,000 to $29,999 | 7 (10.9%) | 0 (0.0%) |
| $30,000 to $34,999 | 0 (0.0%) | 0 (0.0%) |
| $35,000 to $39,999 | 0 (0.0%) | 0 (0.0%) |
| $40,000 to $44,999 | 0 (0.0%) | 30 (43.5%) |
| $45,000 to $49,999 | 28 (43.8%) | 0 (0.0%) |
| $50,000 to $54,999 | 0 (0.0%) | 0 (0.0%) |
| $55,000 to $64,999 | 0 (0.0%) | 0 (0.0%) |
| $65,000 to $74,999 | 0 (0.0%) | 0 (0.0%) |
| $75,000 to $99,999 | 25 (39.1%) | 4 (5.8%) |
| $100,000+ | 4 (6.2%) | 0 (0.0%) |
| Total | 64 (100.0%) | 69 (100.0%) |
Earnings by Sex by Educational Attainment in Allison
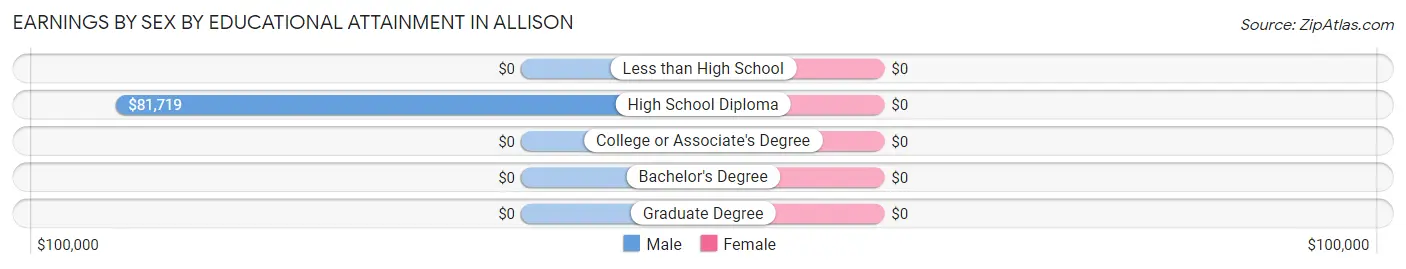
| Educational Attainment | Male Income | Female Income |
| Less than High School | - | - |
| High School Diploma | $81,719 | $0 |
| College or Associate's Degree | - | - |
| Bachelor's Degree | - | - |
| Graduate Degree | - | - |
| Total | - | - |
Family Income in Allison
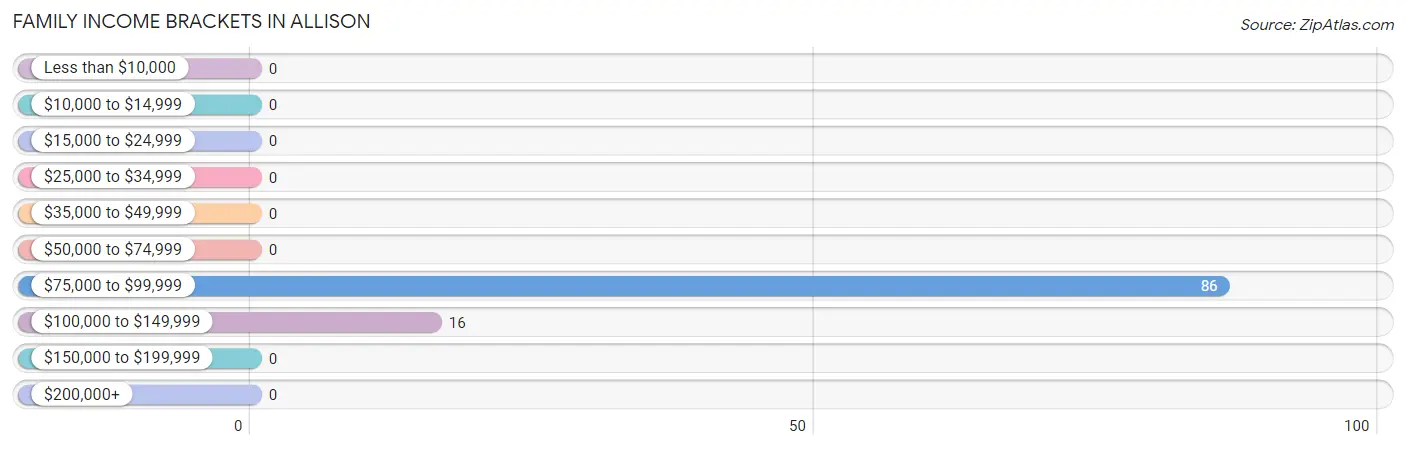
Family Income Brackets in Allison
According to the Allison family income data, there are 86 families falling into the $75,000 to $99,999 income range, which is the most common income bracket and makes up 84.3% of all families.
| Income Bracket | # Families | % Families |
| Less than $10,000 | 0 | 0.0% |
| $10,000 to $14,999 | 0 | 0.0% |
| $15,000 to $24,999 | 0 | 0.0% |
| $25,000 to $34,999 | 0 | 0.0% |
| $35,000 to $49,999 | 0 | 0.0% |
| $50,000 to $74,999 | 0 | 0.0% |
| $75,000 to $99,999 | 86 | 84.3% |
| $100,000 to $149,999 | 16 | 15.7% |
| $150,000 to $199,999 | 0 | 0.0% |
| $200,000+ | 0 | 0.0% |
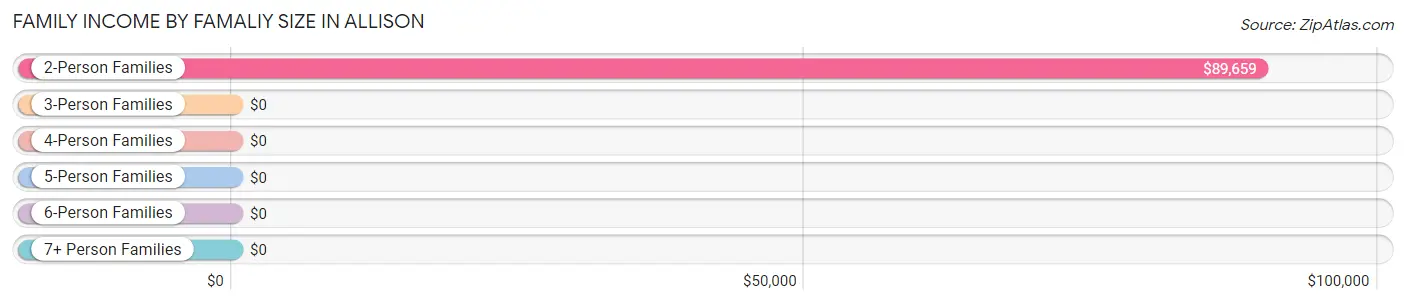
Family Income by Famaliy Size in Allison
2-person families (76 | 74.5%) account for the highest median family income in Allison with $89,659 per family, while 2-person families (76 | 74.5%) have the highest median income of $44,830 per family member.
| Income Bracket | # Families | Median Income |
| 2-Person Families | 76 (74.5%) | $89,659 |
| 3-Person Families | 2 (2.0%) | $0 |
| 4-Person Families | 17 (16.7%) | $0 |
| 5-Person Families | 0 (0.0%) | $0 |
| 6-Person Families | 7 (6.9%) | $0 |
| 7+ Person Families | 0 (0.0%) | $0 |
| Total | 102 (100.0%) | $90,625 |
Family Income by Number of Earners in Allison
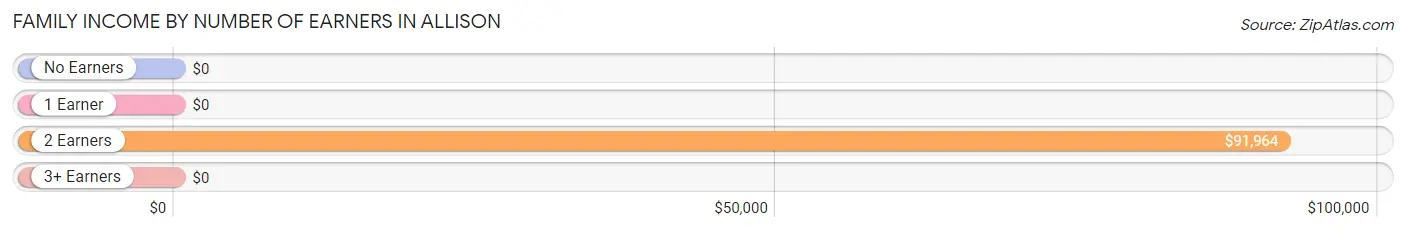
| Number of Earners | # Families | Median Income |
| No Earners | 44 (43.1%) | $0 |
| 1 Earner | 7 (6.9%) | $0 |
| 2 Earners | 44 (43.1%) | $91,964 |
| 3+ Earners | 7 (6.9%) | $0 |
| Total | 102 (100.0%) | $90,625 |
Household Income in Allison
Household Income Brackets in Allison
With 86 households falling in the category, the $75,000 to $99,999 income range is the most frequent in Allison, accounting for 51.8% of all households.
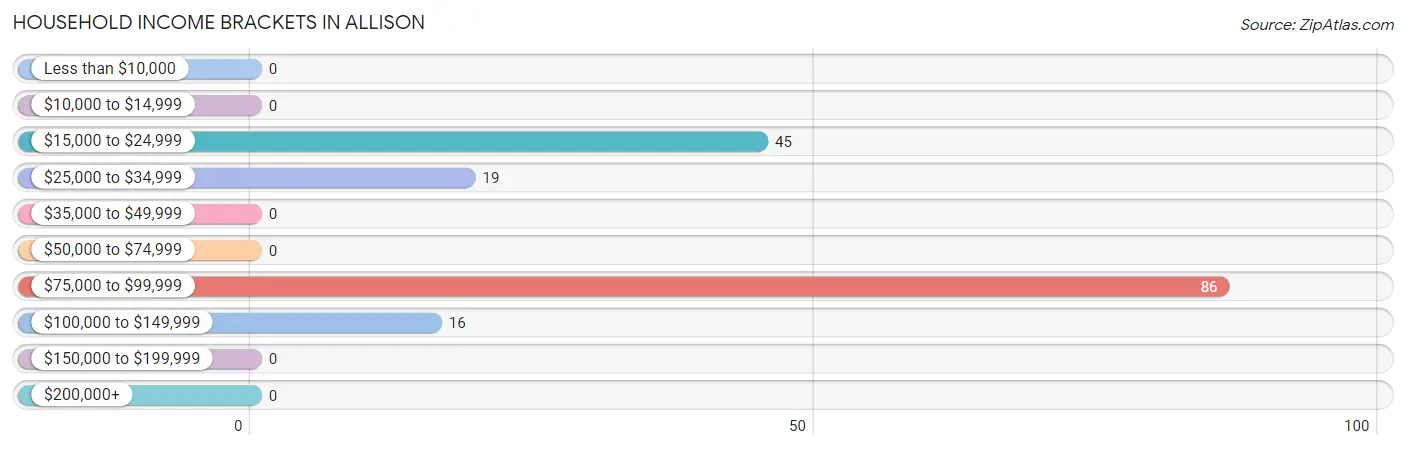
| Income Bracket | # Households | % Households |
| Less than $10,000 | 0 | 0.0% |
| $10,000 to $14,999 | 0 | 0.0% |
| $15,000 to $24,999 | 45 | 27.1% |
| $25,000 to $34,999 | 19 | 11.4% |
| $35,000 to $49,999 | 0 | 0.0% |
| $50,000 to $74,999 | 0 | 0.0% |
| $75,000 to $99,999 | 86 | 51.8% |
| $100,000 to $149,999 | 16 | 9.6% |
| $150,000 to $199,999 | 0 | 0.0% |
| $200,000+ | 0 | 0.0% |
Household Income by Householder Age in Allison
The median household income in Allison is $88,580, with the highest median household income of $91,652 found in the 45 to 64 years age bracket for the primary householder. A total of 51 households (30.7%) fall into this category.
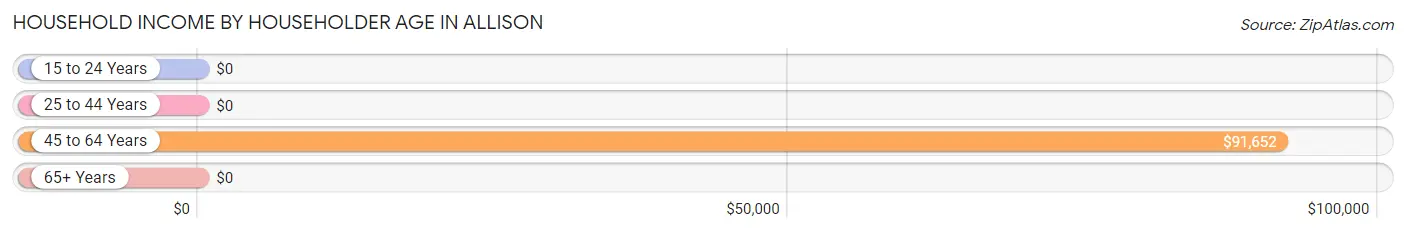
| Income Bracket | # Households | Median Income |
| 15 to 24 Years | 0 (0.0%) | $0 |
| 25 to 44 Years | 14 (8.4%) | $0 |
| 45 to 64 Years | 51 (30.7%) | $91,652 |
| 65+ Years | 101 (60.8%) | $0 |
| Total | 166 (100.0%) | $88,580 |
Poverty in Allison
Income Below Poverty by Sex and Age in Allison
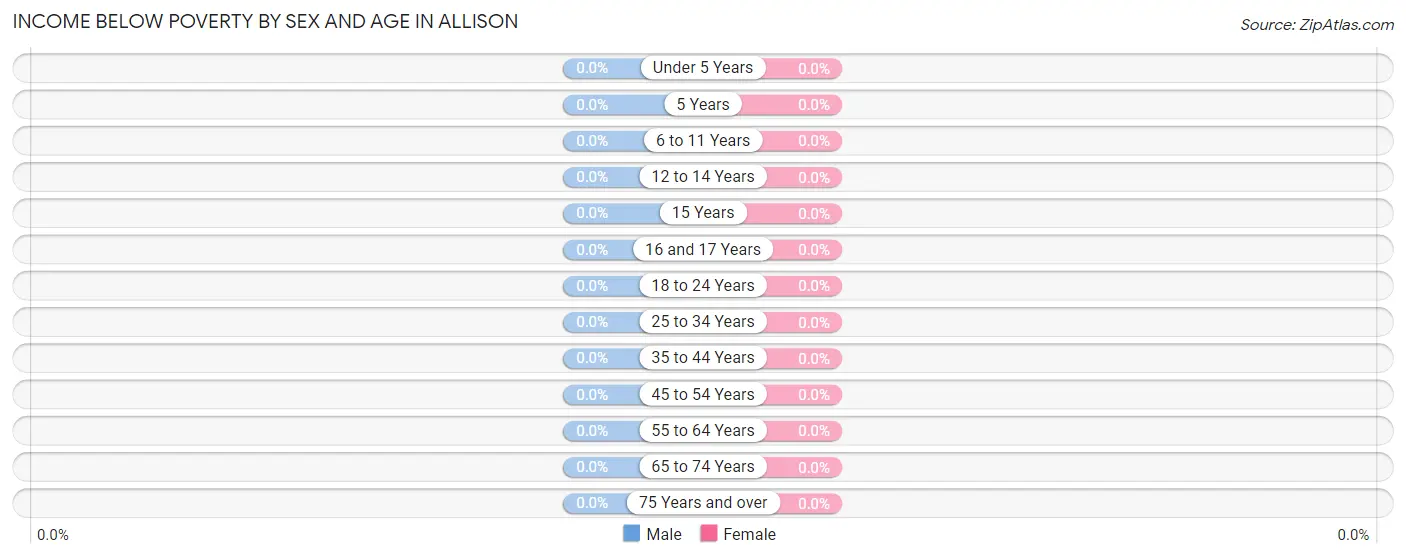
| Age Bracket | Male | Female |
| Under 5 Years | 0 (0.0%) | 0 (0.0%) |
| 5 Years | 0 (0.0%) | 0 (0.0%) |
| 6 to 11 Years | 0 (0.0%) | 0 (0.0%) |
| 12 to 14 Years | 0 (0.0%) | 0 (0.0%) |
| 15 Years | 0 (0.0%) | 0 (0.0%) |
| 16 and 17 Years | 0 (0.0%) | 0 (0.0%) |
| 18 to 24 Years | 0 (0.0%) | 0 (0.0%) |
| 25 to 34 Years | 0 (0.0%) | 0 (0.0%) |
| 35 to 44 Years | 0 (0.0%) | 0 (0.0%) |
| 45 to 54 Years | 0 (0.0%) | 0 (0.0%) |
| 55 to 64 Years | 0 (0.0%) | 0 (0.0%) |
| 65 to 74 Years | 0 (0.0%) | 0 (0.0%) |
| 75 Years and over | 0 (0.0%) | 0 (0.0%) |
| Total | 0 (0.0%) | 0 (0.0%) |
Income Above Poverty by Sex and Age in Allison
According to the poverty statistics in Allison, males aged 12 to 14 years and females aged 6 to 11 years are the age groups that are most secure financially, with 100.0% of males and 100.0% of females in these age groups living above the poverty line.
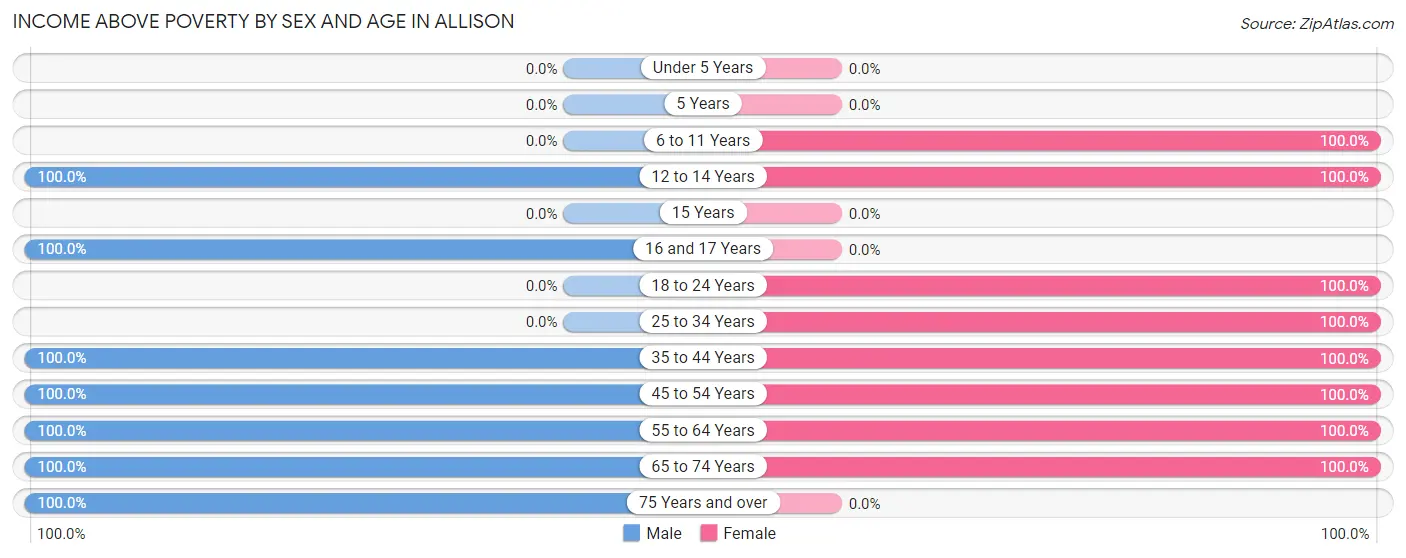
| Age Bracket | Male | Female |
| Under 5 Years | 0 (0.0%) | 0 (0.0%) |
| 5 Years | 0 (0.0%) | 0 (0.0%) |
| 6 to 11 Years | 0 (0.0%) | 18 (100.0%) |
| 12 to 14 Years | 7 (100.0%) | 7 (100.0%) |
| 15 Years | 0 (0.0%) | 0 (0.0%) |
| 16 and 17 Years | 8 (100.0%) | 0 (0.0%) |
| 18 to 24 Years | 0 (0.0%) | 27 (100.0%) |
| 25 to 34 Years | 0 (0.0%) | 4 (100.0%) |
| 35 to 44 Years | 7 (100.0%) | 14 (100.0%) |
| 45 to 54 Years | 46 (100.0%) | 41 (100.0%) |
| 55 to 64 Years | 13 (100.0%) | 8 (100.0%) |
| 65 to 74 Years | 43 (100.0%) | 56 (100.0%) |
| 75 Years and over | 45 (100.0%) | 0 (0.0%) |
| Total | 169 (100.0%) | 175 (100.0%) |
Income Below Poverty Among Married-Couple Families in Allison
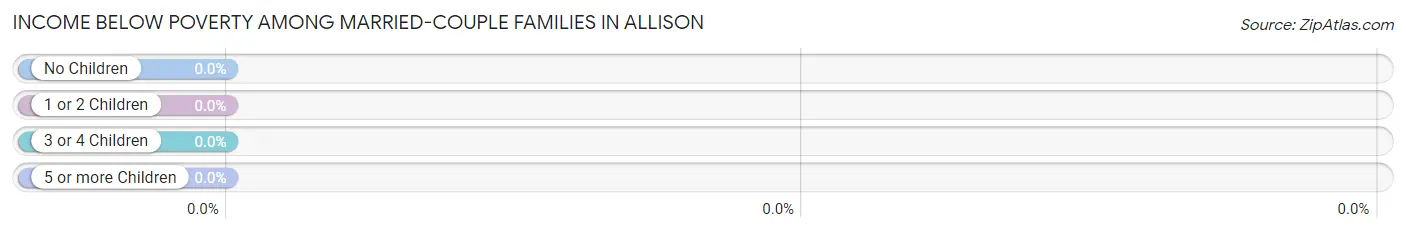
| Children | Above Poverty | Below Poverty |
| No Children | 78 (100.0%) | 0 (0.0%) |
| 1 or 2 Children | 17 (100.0%) | 0 (0.0%) |
| 3 or 4 Children | 7 (100.0%) | 0 (0.0%) |
| 5 or more Children | 0 (0.0%) | 0 (0.0%) |
| Total | 102 (100.0%) | 0 (0.0%) |
Income Below Poverty Among Single-Parent Households in Allison
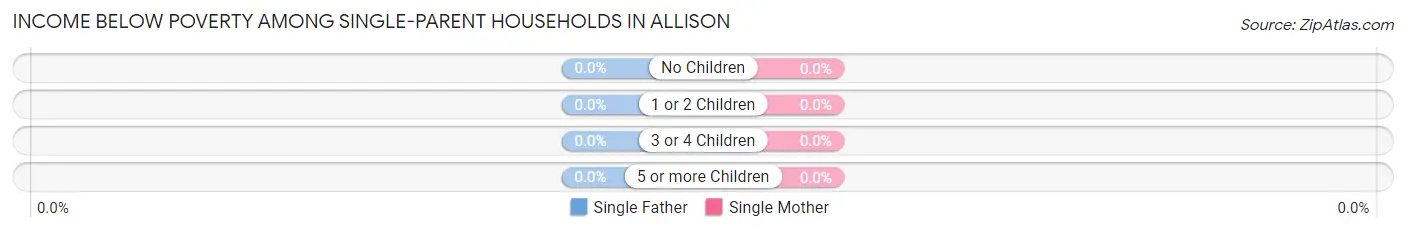
| Children | Single Father | Single Mother |
| No Children | 0 (0.0%) | 0 (0.0%) |
| 1 or 2 Children | 0 (0.0%) | 0 (0.0%) |
| 3 or 4 Children | 0 (0.0%) | 0 (0.0%) |
| 5 or more Children | 0 (0.0%) | 0 (0.0%) |
| Total | 0 (0.0%) | 0 (0.0%) |
Income Below Poverty Among Married-Couple vs Single-Parent Households in Allison
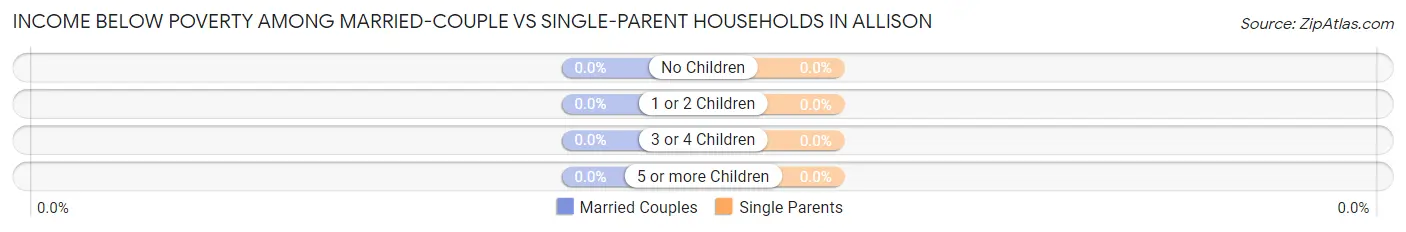
| Children | Married-Couple Families | Single-Parent Households |
| No Children | 0 (0.0%) | 0 (0.0%) |
| 1 or 2 Children | 0 (0.0%) | 0 (0.0%) |
| 3 or 4 Children | 0 (0.0%) | 0 (0.0%) |
| 5 or more Children | 0 (0.0%) | 0 (0.0%) |
| Total | 0 (0.0%) | 0 (0.0%) |
Employment Characteristics in Allison
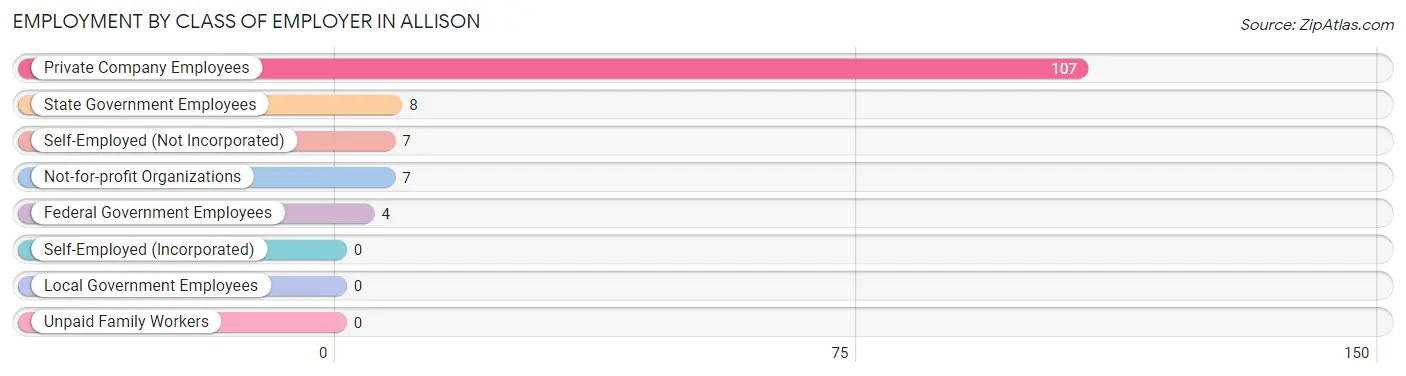
Employment by Class of Employer in Allison
Among the 133 employed individuals in Allison, private company employees (107 | 80.4%), state government employees (8 | 6.0%), and self-employed (not incorporated) (7 | 5.3%) make up the most common classes of employment.
| Employer Class | # Employees | % Employees |
| Private Company Employees | 107 | 80.4% |
| Self-Employed (Incorporated) | 0 | 0.0% |
| Self-Employed (Not Incorporated) | 7 | 5.3% |
| Not-for-profit Organizations | 7 | 5.3% |
| Local Government Employees | 0 | 0.0% |
| State Government Employees | 8 | 6.0% |
| Federal Government Employees | 4 | 3.0% |
| Unpaid Family Workers | 0 | 0.0% |
| Total | 133 | 100.0% |
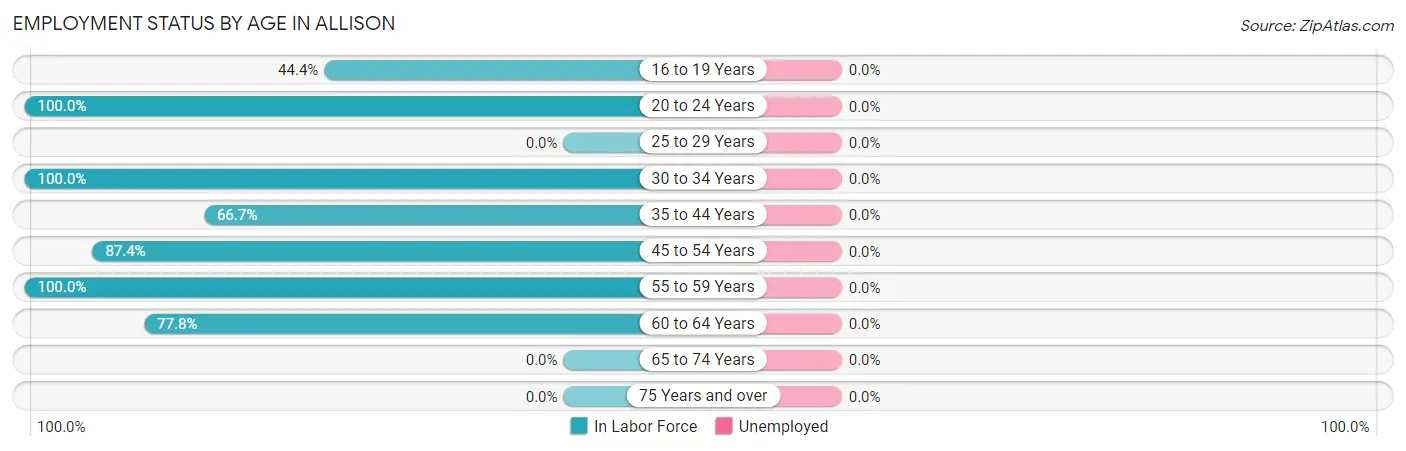
Employment Status by Age in Allison
| Age Bracket | In Labor Force | Unemployed |
| 16 to 19 Years | 12 (44.4%) | 0 (0.0%) |
| 20 to 24 Years | 8 (100.0%) | 0 (0.0%) |
| 25 to 29 Years | 0 (0.0%) | 0 (0.0%) |
| 30 to 34 Years | 4 (100.0%) | 0 (0.0%) |
| 35 to 44 Years | 14 (66.7%) | 0 (0.0%) |
| 45 to 54 Years | 76 (87.4%) | 0 (0.0%) |
| 55 to 59 Years | 12 (100.0%) | 0 (0.0%) |
| 60 to 64 Years | 7 (77.8%) | 0 (0.0%) |
| 65 to 74 Years | 0 (0.0%) | 0 (0.0%) |
| 75 Years and over | 0 (0.0%) | 0 (0.0%) |
| Total | 133 (42.6%) | 0 (0.0%) |
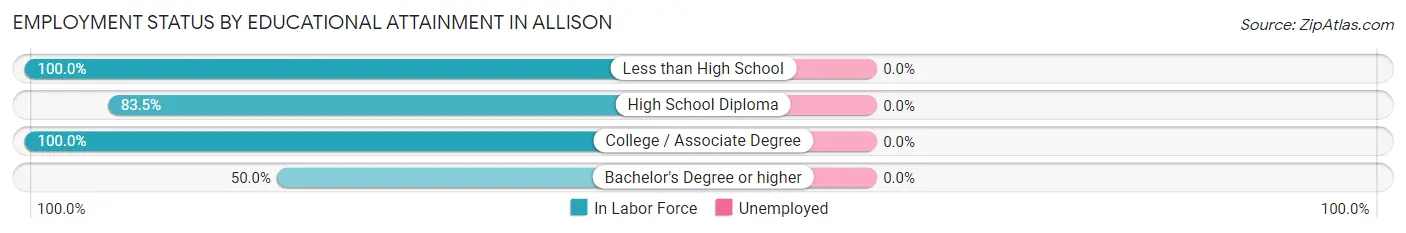
Employment Status by Educational Attainment in Allison
| Educational Attainment | In Labor Force | Unemployed |
| Less than High School | 32 (100.0%) | 0 (0.0%) |
| High School Diploma | 66 (83.5%) | 0 (0.0%) |
| College / Associate Degree | 8 (100.0%) | 0 (0.0%) |
| Bachelor's Degree or higher | 7 (50.0%) | 0 (0.0%) |
| Total | 113 (85.0%) | 0 (0.0%) |
Employment Occupations by Sex in Allison
Management, Business, Science and Arts Occupations
The most common Management, Business, Science and Arts occupations in Allison are Management (11 | 8.3%), and Health Diagnosing & Treating (4 | 3.0%).
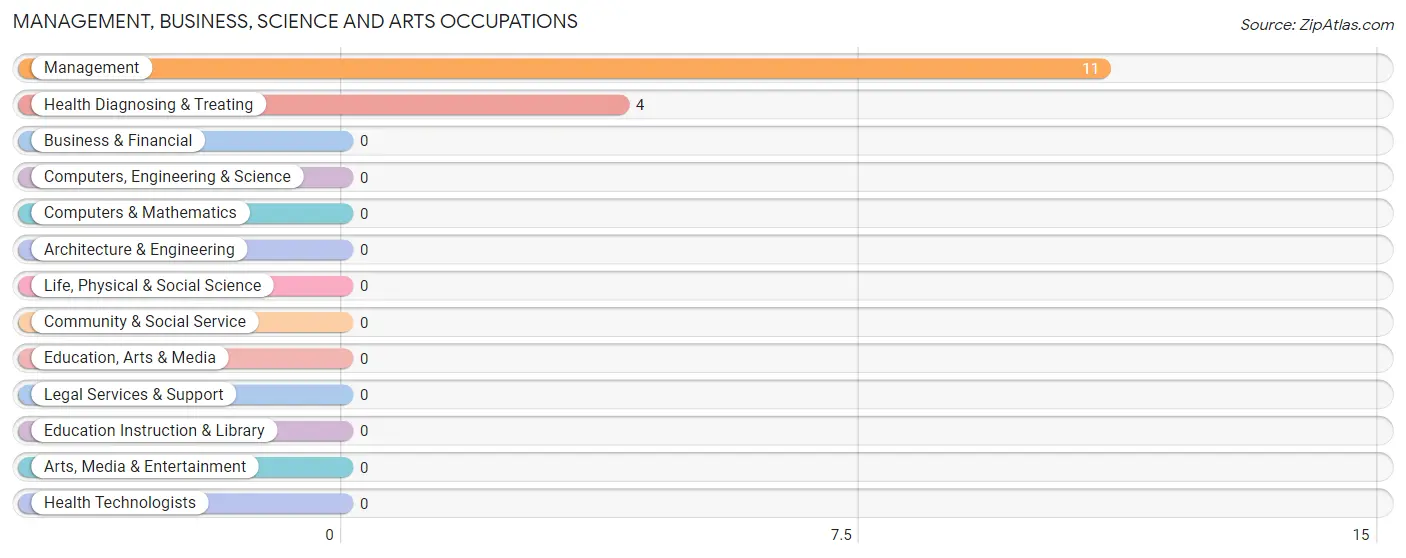
Management, Business, Science and Arts Occupations by Sex
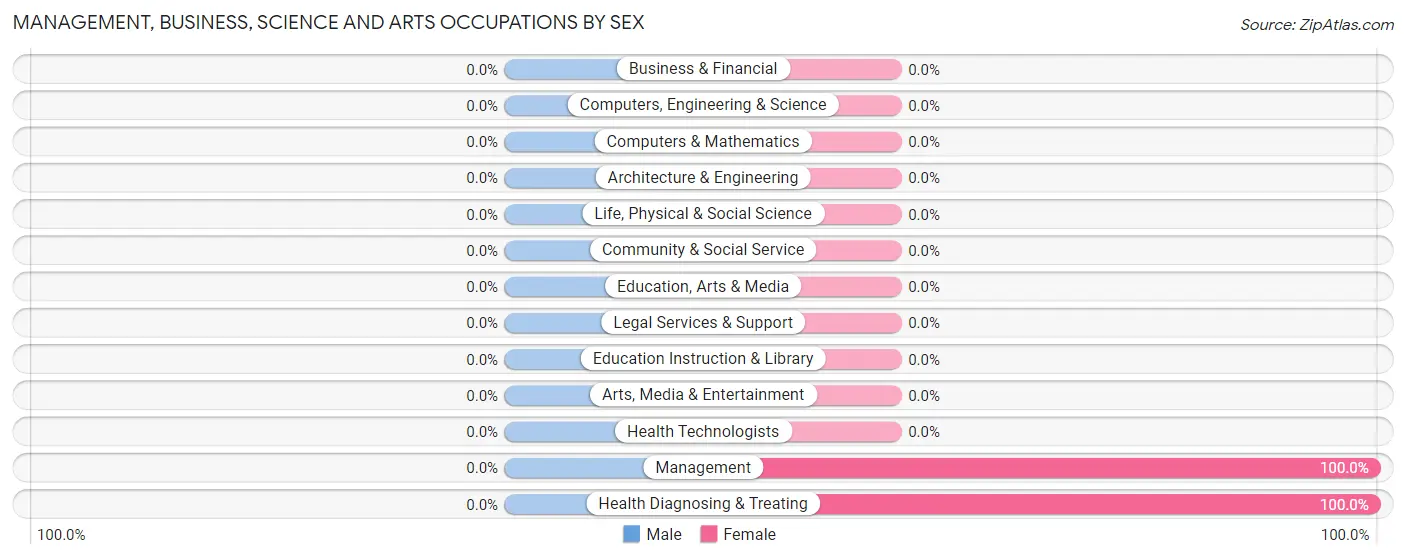
| Occupation | Male | Female |
| Management | 0 (0.0%) | 11 (100.0%) |
| Business & Financial | 0 (0.0%) | 0 (0.0%) |
| Computers, Engineering & Science | 0 (0.0%) | 0 (0.0%) |
| Computers & Mathematics | 0 (0.0%) | 0 (0.0%) |
| Architecture & Engineering | 0 (0.0%) | 0 (0.0%) |
| Life, Physical & Social Science | 0 (0.0%) | 0 (0.0%) |
| Community & Social Service | 0 (0.0%) | 0 (0.0%) |
| Education, Arts & Media | 0 (0.0%) | 0 (0.0%) |
| Legal Services & Support | 0 (0.0%) | 0 (0.0%) |
| Education Instruction & Library | 0 (0.0%) | 0 (0.0%) |
| Arts, Media & Entertainment | 0 (0.0%) | 0 (0.0%) |
| Health Diagnosing & Treating | 0 (0.0%) | 4 (100.0%) |
| Health Technologists | 0 (0.0%) | 0 (0.0%) |
| Total (Category) | 0 (0.0%) | 15 (100.0%) |
| Total (Overall) | 64 (48.1%) | 69 (51.9%) |
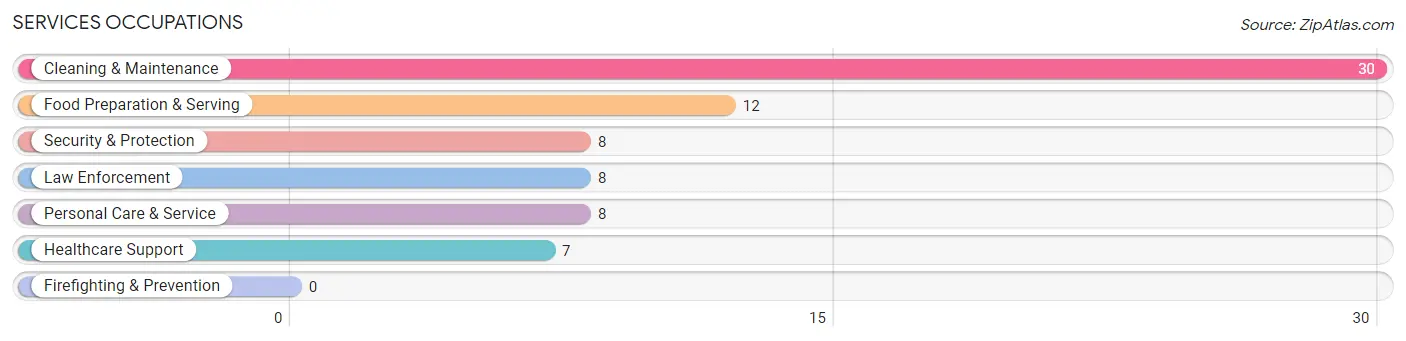
Services Occupations
The most common Services occupations in Allison are Cleaning & Maintenance (30 | 22.6%), Food Preparation & Serving (12 | 9.0%), Security & Protection (8 | 6.0%), Law Enforcement (8 | 6.0%), and Personal Care & Service (8 | 6.0%).
Services Occupations by Sex
Within the Services occupations in Allison, the most male-oriented occupations are Healthcare Support (100.0%), Security & Protection (100.0%), and Law Enforcement (100.0%), while the most female-oriented occupations are Food Preparation & Serving (100.0%), Cleaning & Maintenance (100.0%), and Personal Care & Service (100.0%).
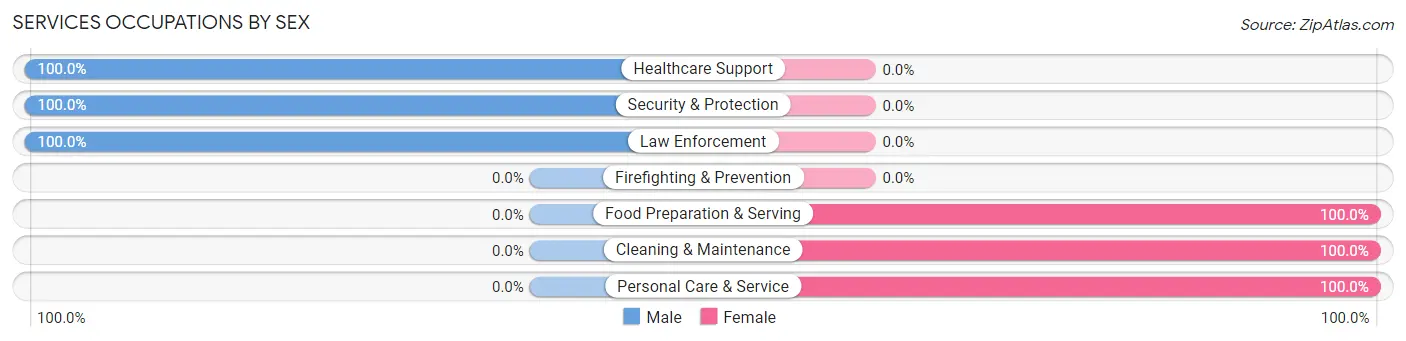
| Occupation | Male | Female |
| Healthcare Support | 7 (100.0%) | 0 (0.0%) |
| Security & Protection | 8 (100.0%) | 0 (0.0%) |
| Firefighting & Prevention | 0 (0.0%) | 0 (0.0%) |
| Law Enforcement | 8 (100.0%) | 0 (0.0%) |
| Food Preparation & Serving | 0 (0.0%) | 12 (100.0%) |
| Cleaning & Maintenance | 0 (0.0%) | 30 (100.0%) |
| Personal Care & Service | 0 (0.0%) | 8 (100.0%) |
| Total (Category) | 15 (23.1%) | 50 (76.9%) |
| Total (Overall) | 64 (48.1%) | 69 (51.9%) |
Sales and Office Occupations
The most common Sales and Office occupations in Allison are , and Sales & Related (4 | 3.0%).
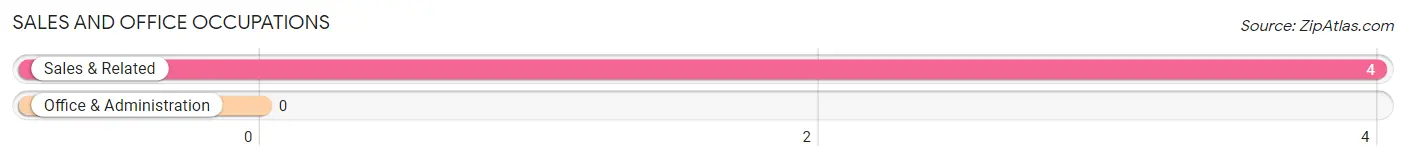
Sales and Office Occupations by Sex
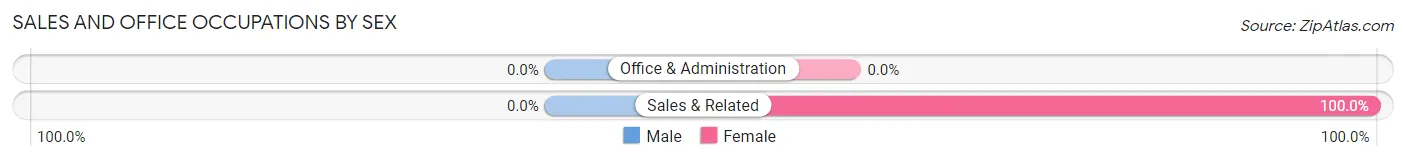
| Occupation | Male | Female |
| Sales & Related | 0 (0.0%) | 4 (100.0%) |
| Office & Administration | 0 (0.0%) | 0 (0.0%) |
| Total (Category) | 0 (0.0%) | 4 (100.0%) |
| Total (Overall) | 64 (48.1%) | 69 (51.9%) |
Natural Resources, Construction and Maintenance Occupations
The most common Natural Resources, Construction and Maintenance occupations in Allison are , and Construction & Extraction (11 | 8.3%).
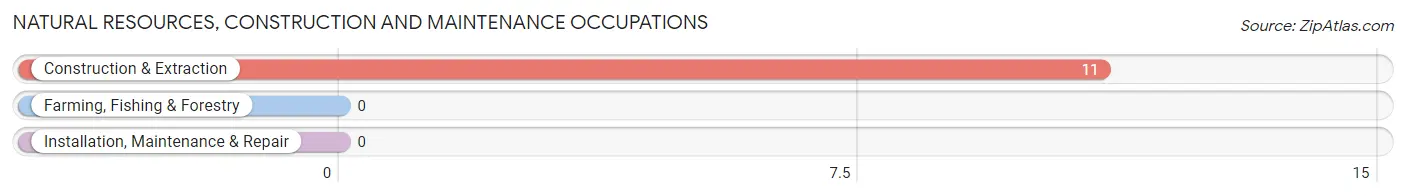
Natural Resources, Construction and Maintenance Occupations by Sex
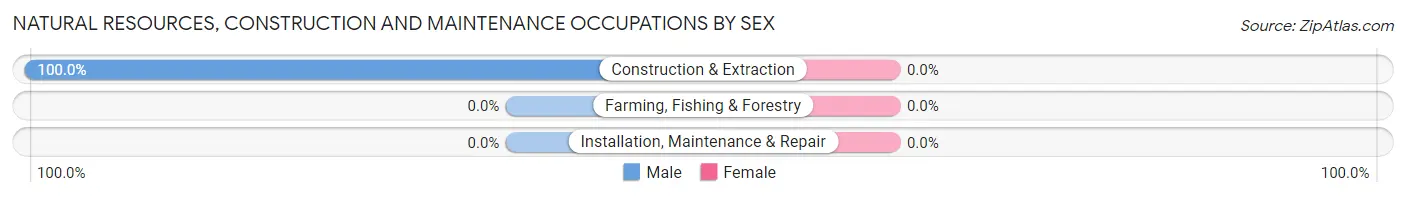
| Occupation | Male | Female |
| Farming, Fishing & Forestry | 0 (0.0%) | 0 (0.0%) |
| Construction & Extraction | 11 (100.0%) | 0 (0.0%) |
| Installation, Maintenance & Repair | 0 (0.0%) | 0 (0.0%) |
| Total (Category) | 11 (100.0%) | 0 (0.0%) |
| Total (Overall) | 64 (48.1%) | 69 (51.9%) |
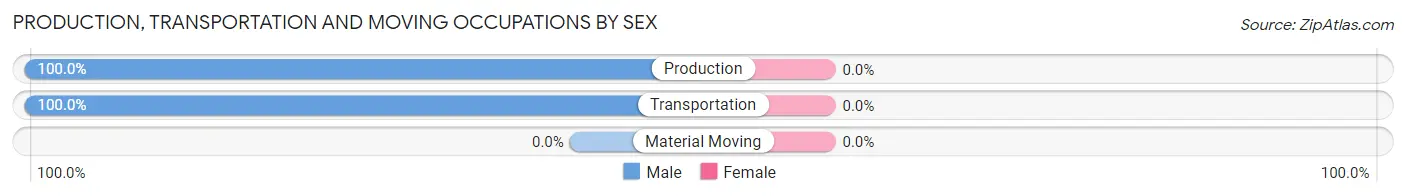
Production, Transportation and Moving Occupations
The most common Production, Transportation and Moving occupations in Allison are Transportation (28 | 21.0%), and Production (10 | 7.5%).
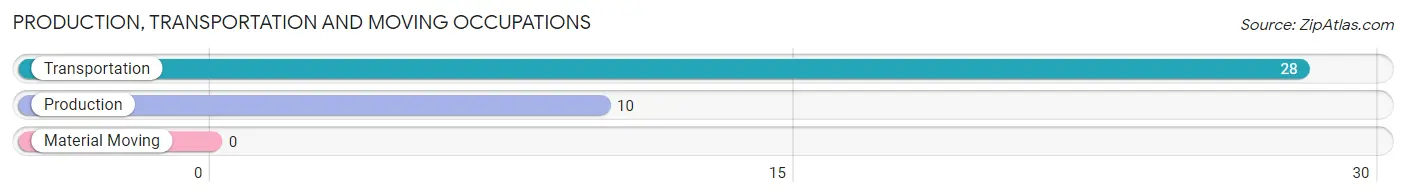
Production, Transportation and Moving Occupations by Sex
| Occupation | Male | Female |
| Production | 10 (100.0%) | 0 (0.0%) |
| Transportation | 28 (100.0%) | 0 (0.0%) |
| Material Moving | 0 (0.0%) | 0 (0.0%) |
| Total (Category) | 38 (100.0%) | 0 (0.0%) |
| Total (Overall) | 64 (48.1%) | 69 (51.9%) |
Employment Industries by Sex in Allison
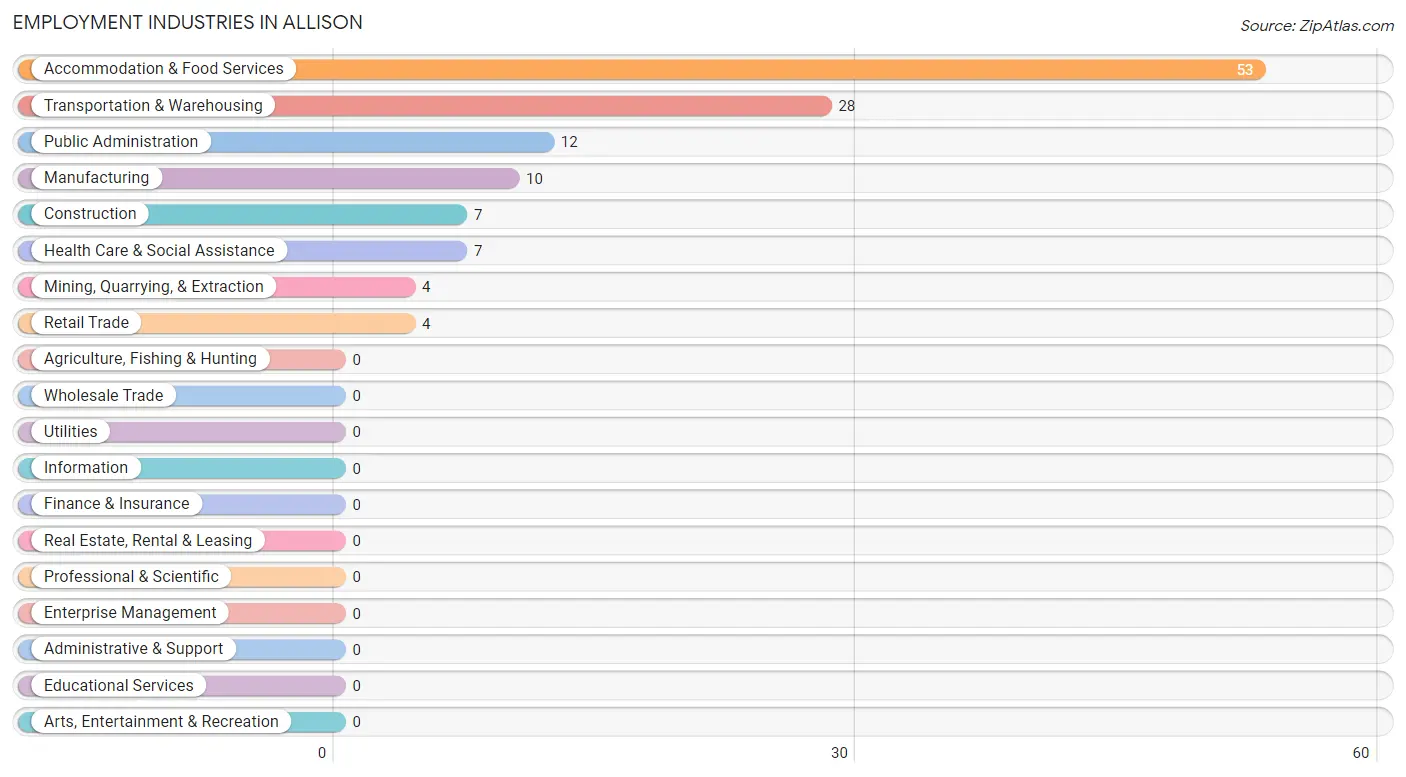
Employment Industries in Allison
The major employment industries in Allison include Accommodation & Food Services (53 | 39.9%), Transportation & Warehousing (28 | 21.0%), Public Administration (12 | 9.0%), Manufacturing (10 | 7.5%), and Construction (7 | 5.3%).
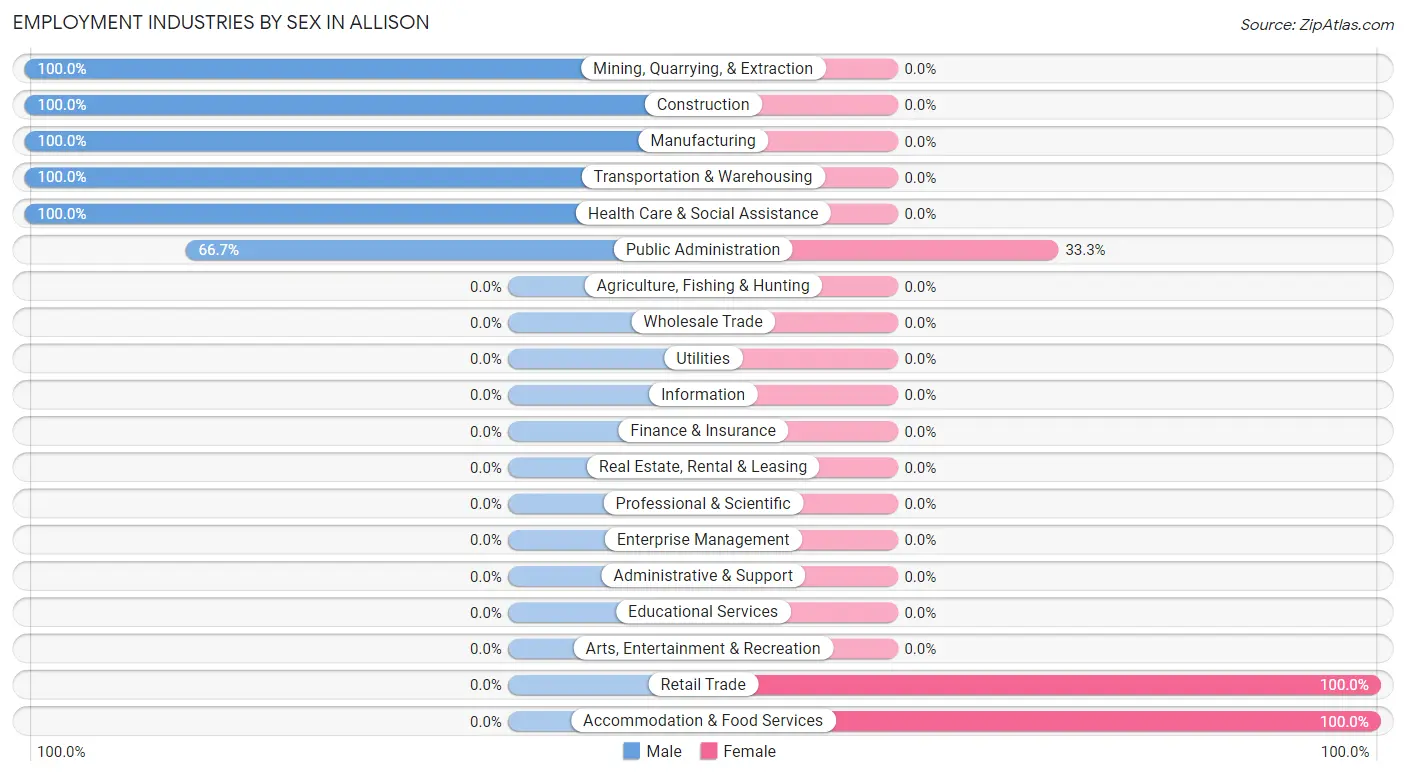
Employment Industries by Sex in Allison
The Allison industries that see more men than women are Mining, Quarrying, & Extraction (100.0%), Construction (100.0%), and Manufacturing (100.0%), whereas the industries that tend to have a higher number of women are Retail Trade (100.0%), Accommodation & Food Services (100.0%), and Public Administration (33.3%).
| Industry | Male | Female |
| Agriculture, Fishing & Hunting | 0 (0.0%) | 0 (0.0%) |
| Mining, Quarrying, & Extraction | 4 (100.0%) | 0 (0.0%) |
| Construction | 7 (100.0%) | 0 (0.0%) |
| Manufacturing | 10 (100.0%) | 0 (0.0%) |
| Wholesale Trade | 0 (0.0%) | 0 (0.0%) |
| Retail Trade | 0 (0.0%) | 4 (100.0%) |
| Transportation & Warehousing | 28 (100.0%) | 0 (0.0%) |
| Utilities | 0 (0.0%) | 0 (0.0%) |
| Information | 0 (0.0%) | 0 (0.0%) |
| Finance & Insurance | 0 (0.0%) | 0 (0.0%) |
| Real Estate, Rental & Leasing | 0 (0.0%) | 0 (0.0%) |
| Professional & Scientific | 0 (0.0%) | 0 (0.0%) |
| Enterprise Management | 0 (0.0%) | 0 (0.0%) |
| Administrative & Support | 0 (0.0%) | 0 (0.0%) |
| Educational Services | 0 (0.0%) | 0 (0.0%) |
| Health Care & Social Assistance | 7 (100.0%) | 0 (0.0%) |
| Arts, Entertainment & Recreation | 0 (0.0%) | 0 (0.0%) |
| Accommodation & Food Services | 0 (0.0%) | 53 (100.0%) |
| Public Administration | 8 (66.7%) | 4 (33.3%) |
| Total | 64 (48.1%) | 69 (51.9%) |
Education in Allison
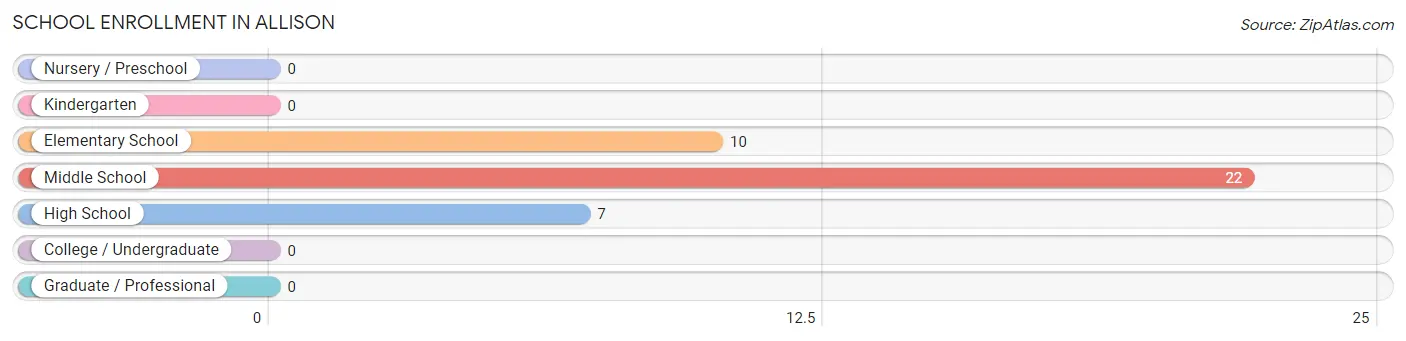
School Enrollment in Allison
The most common levels of schooling among the 39 students in Allison are middle school (22 | 56.4%), elementary school (10 | 25.6%), and high school (7 | 17.9%).
| School Level | # Students | % Students |
| Nursery / Preschool | 0 | 0.0% |
| Kindergarten | 0 | 0.0% |
| Elementary School | 10 | 25.6% |
| Middle School | 22 | 56.4% |
| High School | 7 | 17.9% |
| College / Undergraduate | 0 | 0.0% |
| Graduate / Professional | 0 | 0.0% |
| Total | 39 | 100.0% |
School Enrollment by Age by Funding Source in Allison
Out of a total of 39 students who are enrolled in schools in Allison, 10 (25.6%) attend a private institution, while the remaining 29 (74.4%) are enrolled in public schools. The age group of 10 to 14 year olds has the highest likelihood of being enrolled in private schools, with 10 (31.2% in the age bracket) enrolled. Conversely, the age group of 18 to 19 year olds has the lowest likelihood of being enrolled in a private school, with 7 (100.0% in the age bracket) attending a public institution.
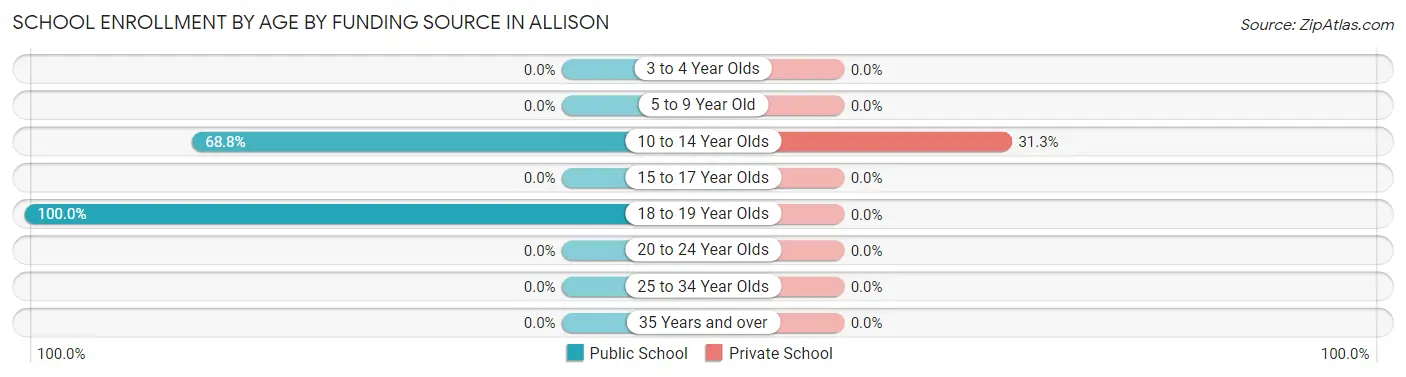
| Age Bracket | Public School | Private School |
| 3 to 4 Year Olds | 0 (0.0%) | 0 (0.0%) |
| 5 to 9 Year Old | 0 (0.0%) | 0 (0.0%) |
| 10 to 14 Year Olds | 22 (68.8%) | 10 (31.2%) |
| 15 to 17 Year Olds | 0 (0.0%) | 0 (0.0%) |
| 18 to 19 Year Olds | 7 (100.0%) | 0 (0.0%) |
| 20 to 24 Year Olds | 0 (0.0%) | 0 (0.0%) |
| 25 to 34 Year Olds | 0 (0.0%) | 0 (0.0%) |
| 35 Years and over | 0 (0.0%) | 0 (0.0%) |
| Total | 29 (74.4%) | 10 (25.6%) |
Educational Attainment by Field of Study in Allison
Education (43 | 75.4%), business (7 | 12.3%), and liberal arts & history (7 | 12.3%) are the most common fields of study among 57 individuals in Allison who have obtained a bachelor's degree or higher.
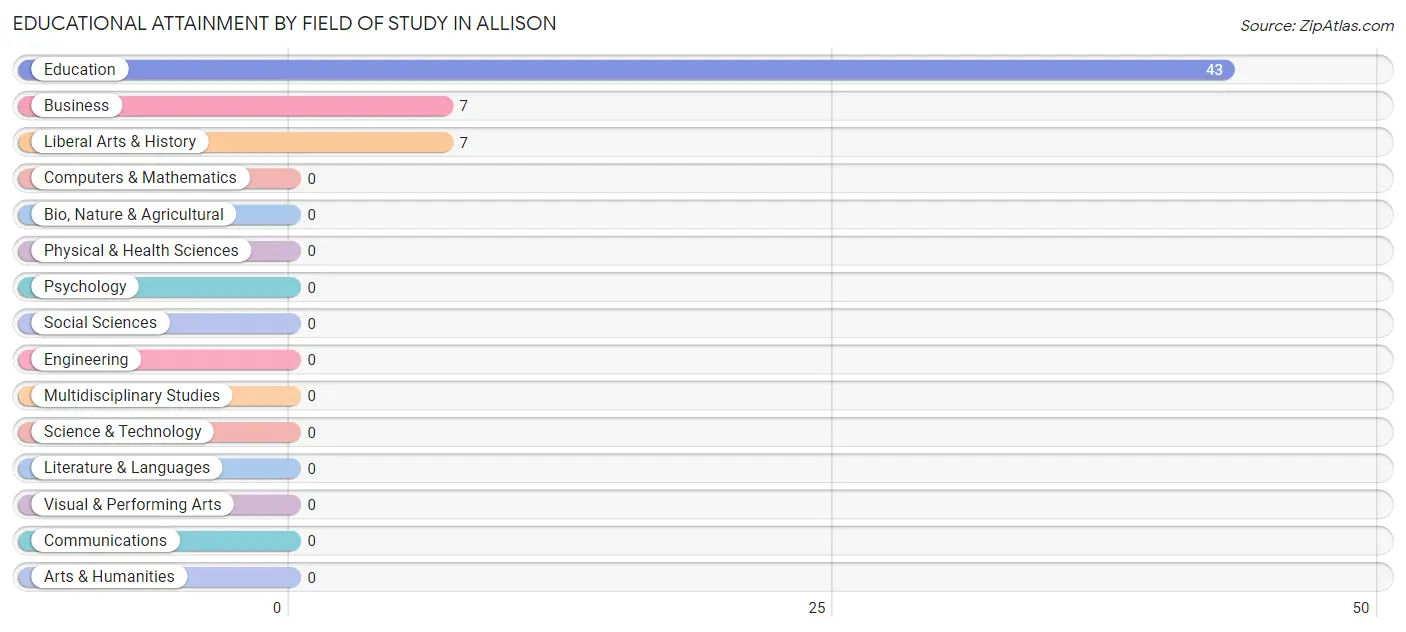
| Field of Study | # Graduates | % Graduates |
| Computers & Mathematics | 0 | 0.0% |
| Bio, Nature & Agricultural | 0 | 0.0% |
| Physical & Health Sciences | 0 | 0.0% |
| Psychology | 0 | 0.0% |
| Social Sciences | 0 | 0.0% |
| Engineering | 0 | 0.0% |
| Multidisciplinary Studies | 0 | 0.0% |
| Science & Technology | 0 | 0.0% |
| Business | 7 | 12.3% |
| Education | 43 | 75.4% |
| Literature & Languages | 0 | 0.0% |
| Liberal Arts & History | 7 | 12.3% |
| Visual & Performing Arts | 0 | 0.0% |
| Communications | 0 | 0.0% |
| Arts & Humanities | 0 | 0.0% |
| Total | 57 | 100.0% |
Transportation & Commute in Allison
Vehicle Availability by Sex in Allison
The most prevalent vehicle ownership categories in Allison are males with 3 vehicles (32, accounting for 50.0%) and females with 3 vehicles (27, making up 46.4%).
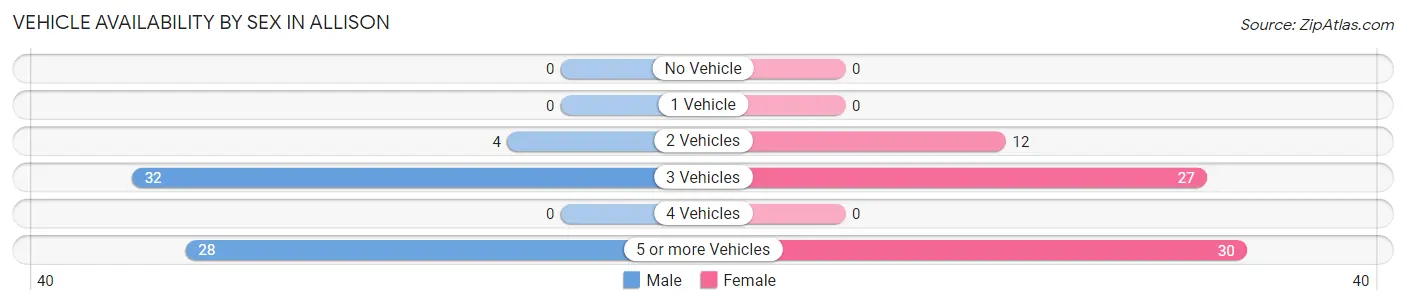
| Vehicles Available | Male | Female |
| No Vehicle | 0 (0.0%) | 0 (0.0%) |
| 1 Vehicle | 0 (0.0%) | 0 (0.0%) |
| 2 Vehicles | 4 (6.2%) | 12 (17.4%) |
| 3 Vehicles | 32 (50.0%) | 27 (39.1%) |
| 4 Vehicles | 0 (0.0%) | 0 (0.0%) |
| 5 or more Vehicles | 28 (43.8%) | 30 (43.5%) |
| Total | 64 (100.0%) | 69 (100.0%) |
Commute Time in Allison
The most frequently occuring commute durations in Allison are 45 to 59 minutes (47 commuters, 35.3%), 30 to 34 minutes (35 commuters, 26.3%), and 15 to 19 minutes (23 commuters, 17.3%).
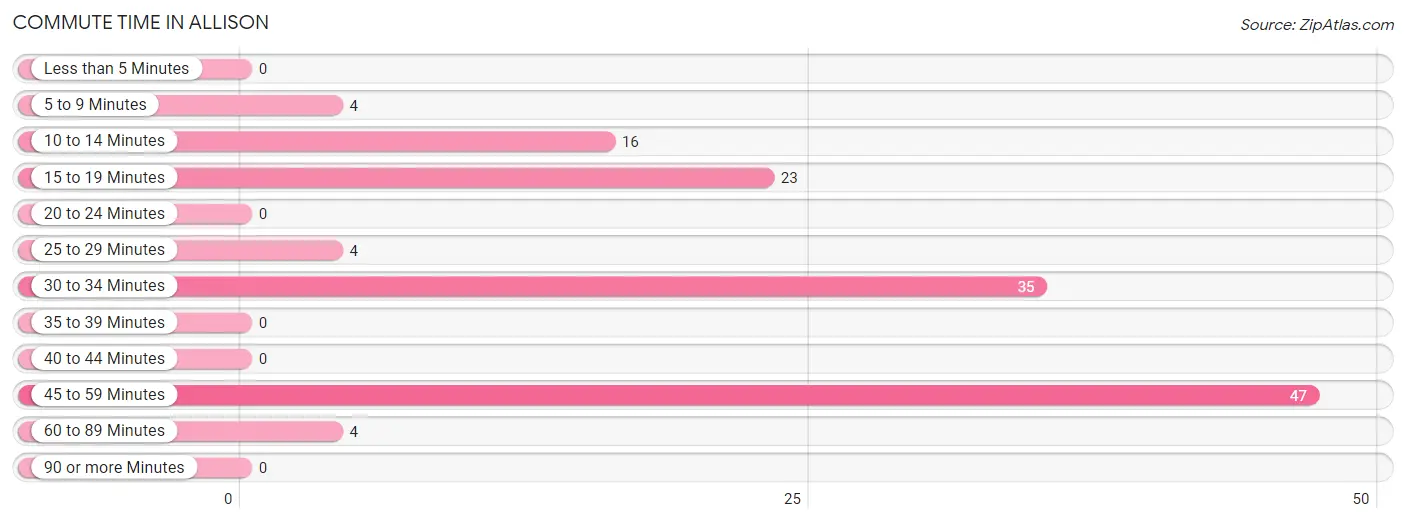
| Commute Time | # Commuters | % Commuters |
| Less than 5 Minutes | 0 | 0.0% |
| 5 to 9 Minutes | 4 | 3.0% |
| 10 to 14 Minutes | 16 | 12.0% |
| 15 to 19 Minutes | 23 | 17.3% |
| 20 to 24 Minutes | 0 | 0.0% |
| 25 to 29 Minutes | 4 | 3.0% |
| 30 to 34 Minutes | 35 | 26.3% |
| 35 to 39 Minutes | 0 | 0.0% |
| 40 to 44 Minutes | 0 | 0.0% |
| 45 to 59 Minutes | 47 | 35.3% |
| 60 to 89 Minutes | 4 | 3.0% |
| 90 or more Minutes | 0 | 0.0% |
Commute Time by Sex in Allison
The most common commute times in Allison are 30 to 34 minutes (35 commuters, 54.7%) for males and 45 to 59 minutes (30 commuters, 43.5%) for females.
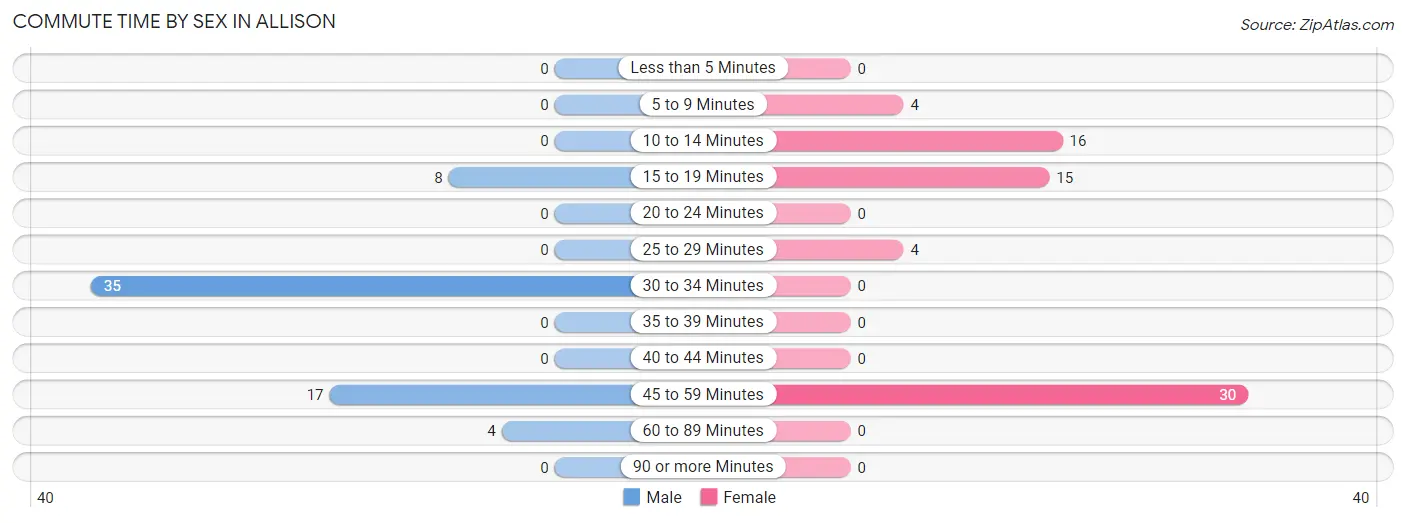
| Commute Time | Male | Female |
| Less than 5 Minutes | 0 (0.0%) | 0 (0.0%) |
| 5 to 9 Minutes | 0 (0.0%) | 4 (5.8%) |
| 10 to 14 Minutes | 0 (0.0%) | 16 (23.2%) |
| 15 to 19 Minutes | 8 (12.5%) | 15 (21.7%) |
| 20 to 24 Minutes | 0 (0.0%) | 0 (0.0%) |
| 25 to 29 Minutes | 0 (0.0%) | 4 (5.8%) |
| 30 to 34 Minutes | 35 (54.7%) | 0 (0.0%) |
| 35 to 39 Minutes | 0 (0.0%) | 0 (0.0%) |
| 40 to 44 Minutes | 0 (0.0%) | 0 (0.0%) |
| 45 to 59 Minutes | 17 (26.6%) | 30 (43.5%) |
| 60 to 89 Minutes | 4 (6.2%) | 0 (0.0%) |
| 90 or more Minutes | 0 (0.0%) | 0 (0.0%) |
Time of Departure to Work by Sex in Allison
The most frequent times of departure to work in Allison are 6:30 AM to 6:59 AM (35, 54.7%) for males and 6:30 AM to 6:59 AM (34, 49.3%) for females.
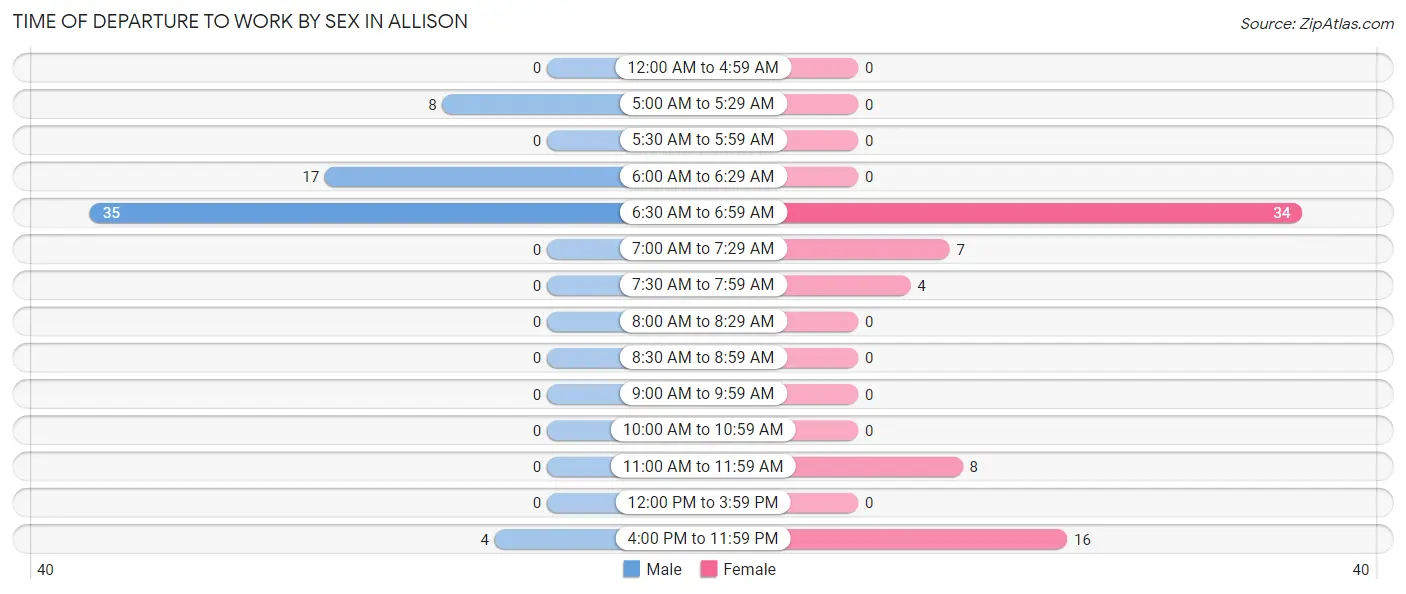
| Time of Departure | Male | Female |
| 12:00 AM to 4:59 AM | 0 (0.0%) | 0 (0.0%) |
| 5:00 AM to 5:29 AM | 8 (12.5%) | 0 (0.0%) |
| 5:30 AM to 5:59 AM | 0 (0.0%) | 0 (0.0%) |
| 6:00 AM to 6:29 AM | 17 (26.6%) | 0 (0.0%) |
| 6:30 AM to 6:59 AM | 35 (54.7%) | 34 (49.3%) |
| 7:00 AM to 7:29 AM | 0 (0.0%) | 7 (10.1%) |
| 7:30 AM to 7:59 AM | 0 (0.0%) | 4 (5.8%) |
| 8:00 AM to 8:29 AM | 0 (0.0%) | 0 (0.0%) |
| 8:30 AM to 8:59 AM | 0 (0.0%) | 0 (0.0%) |
| 9:00 AM to 9:59 AM | 0 (0.0%) | 0 (0.0%) |
| 10:00 AM to 10:59 AM | 0 (0.0%) | 0 (0.0%) |
| 11:00 AM to 11:59 AM | 0 (0.0%) | 8 (11.6%) |
| 12:00 PM to 3:59 PM | 0 (0.0%) | 0 (0.0%) |
| 4:00 PM to 11:59 PM | 4 (6.2%) | 16 (23.2%) |
| Total | 64 (100.0%) | 69 (100.0%) |
Housing Occupancy in Allison
Occupancy by Ownership in Allison
Of the total 166 dwellings in Allison, owner-occupied units account for 122 (73.5%), while renter-occupied units make up 44 (26.5%).
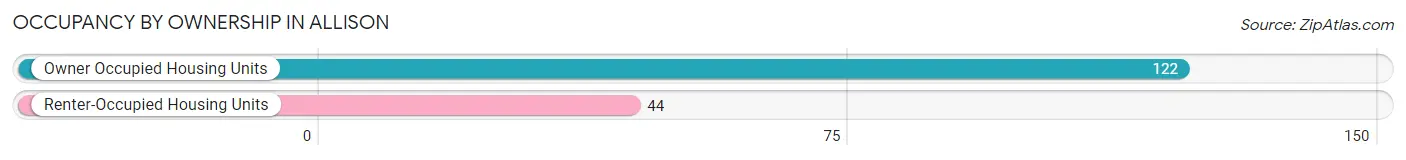
| Occupancy | # Housing Units | % Housing Units |
| Owner Occupied Housing Units | 122 | 73.5% |
| Renter-Occupied Housing Units | 44 | 26.5% |
| Total Occupied Housing Units | 166 | 100.0% |
Occupancy by Household Size in Allison
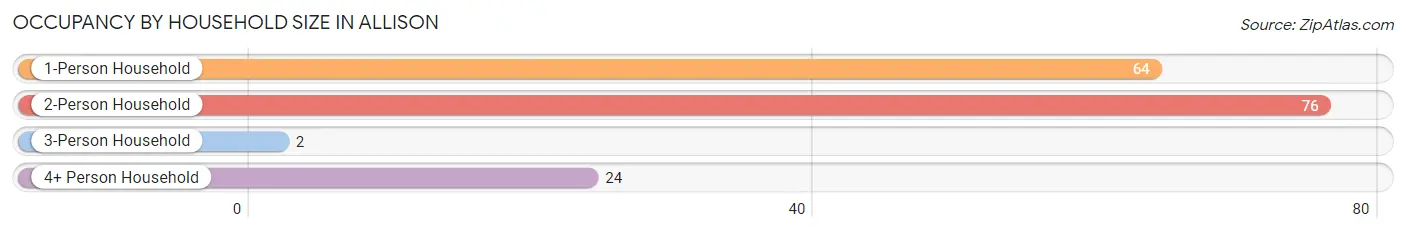
| Household Size | # Housing Units | % Housing Units |
| 1-Person Household | 64 | 38.6% |
| 2-Person Household | 76 | 45.8% |
| 3-Person Household | 2 | 1.2% |
| 4+ Person Household | 24 | 14.5% |
| Total Housing Units | 166 | 100.0% |
Occupancy by Ownership by Household Size in Allison
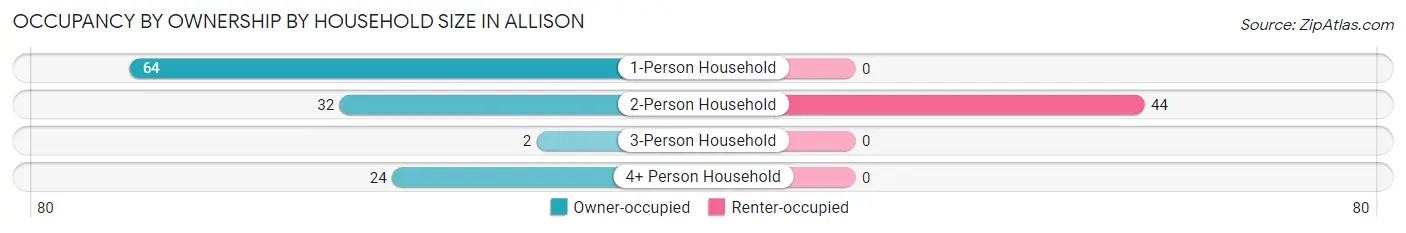
| Household Size | Owner-occupied | Renter-occupied |
| 1-Person Household | 64 (100.0%) | 0 (0.0%) |
| 2-Person Household | 32 (42.1%) | 44 (57.9%) |
| 3-Person Household | 2 (100.0%) | 0 (0.0%) |
| 4+ Person Household | 24 (100.0%) | 0 (0.0%) |
| Total Housing Units | 122 (73.5%) | 44 (26.5%) |
Occupancy by Educational Attainment in Allison
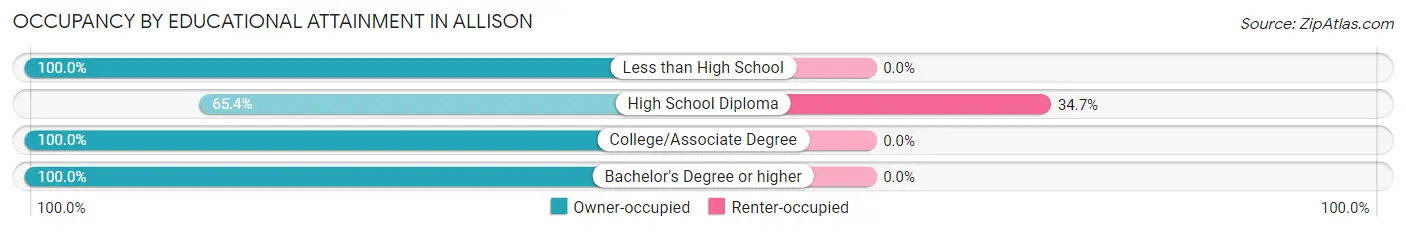
| Household Size | Owner-occupied | Renter-occupied |
| Less than High School | 28 (100.0%) | 0 (0.0%) |
| High School Diploma | 83 (65.3%) | 44 (34.6%) |
| College/Associate Degree | 4 (100.0%) | 0 (0.0%) |
| Bachelor's Degree or higher | 7 (100.0%) | 0 (0.0%) |
Occupancy by Age of Householder in Allison
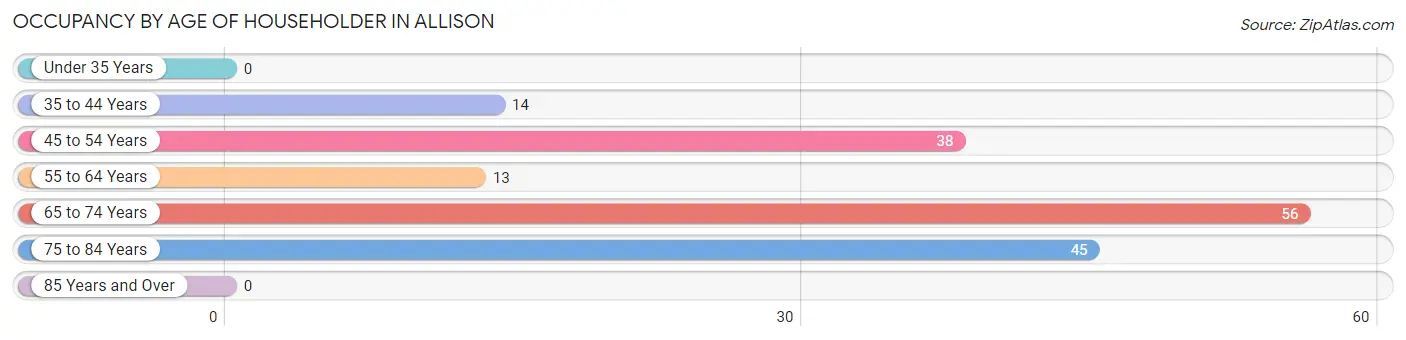
| Age Bracket | # Households | % Households |
| Under 35 Years | 0 | 0.0% |
| 35 to 44 Years | 14 | 8.4% |
| 45 to 54 Years | 38 | 22.9% |
| 55 to 64 Years | 13 | 7.8% |
| 65 to 74 Years | 56 | 33.7% |
| 75 to 84 Years | 45 | 27.1% |
| 85 Years and Over | 0 | 0.0% |
| Total | 166 | 100.0% |
Housing Finances in Allison
Median Income by Occupancy in Allison
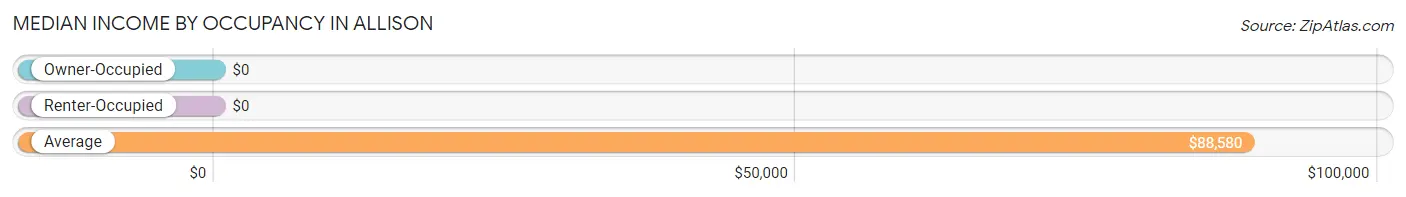
| Occupancy Type | # Households | Median Income |
| Owner-Occupied | 122 (73.5%) | $0 |
| Renter-Occupied | 44 (26.5%) | $0 |
| Average | 166 (100.0%) | $88,580 |
Occupancy by Householder Income Bracket in Allison
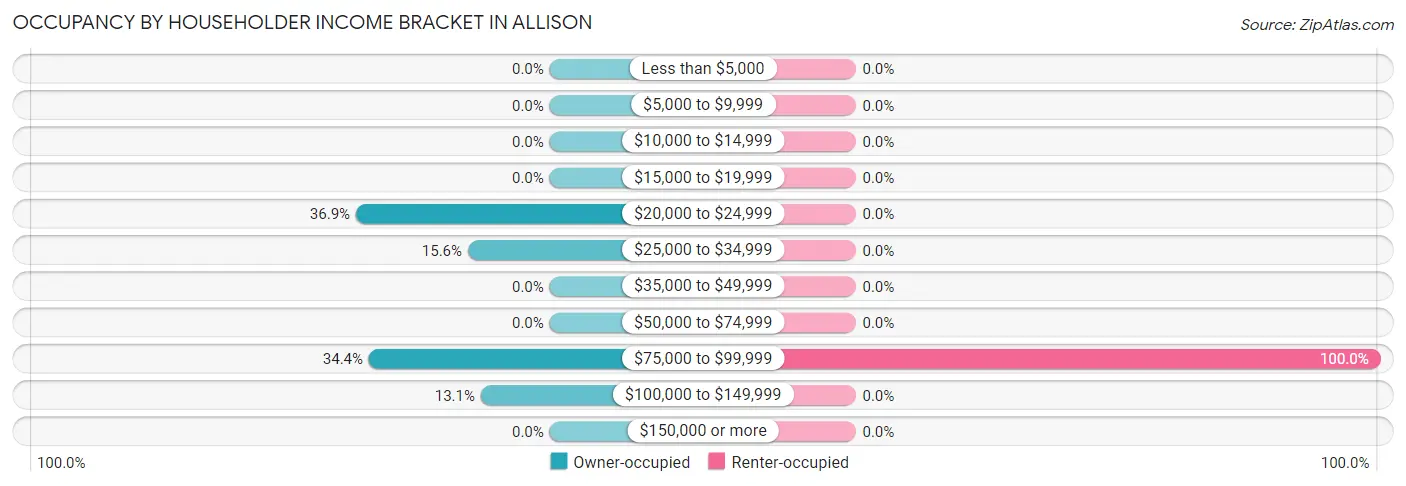
| Income Bracket | Owner-occupied | Renter-occupied |
| Less than $5,000 | 0 (0.0%) | 0 (0.0%) |
| $5,000 to $9,999 | 0 (0.0%) | 0 (0.0%) |
| $10,000 to $14,999 | 0 (0.0%) | 0 (0.0%) |
| $15,000 to $19,999 | 0 (0.0%) | 0 (0.0%) |
| $20,000 to $24,999 | 45 (36.9%) | 0 (0.0%) |
| $25,000 to $34,999 | 19 (15.6%) | 0 (0.0%) |
| $35,000 to $49,999 | 0 (0.0%) | 0 (0.0%) |
| $50,000 to $74,999 | 0 (0.0%) | 0 (0.0%) |
| $75,000 to $99,999 | 42 (34.4%) | 44 (100.0%) |
| $100,000 to $149,999 | 16 (13.1%) | 0 (0.0%) |
| $150,000 or more | 0 (0.0%) | 0 (0.0%) |
| Total | 122 (100.0%) | 44 (100.0%) |
Monthly Housing Cost Tiers in Allison
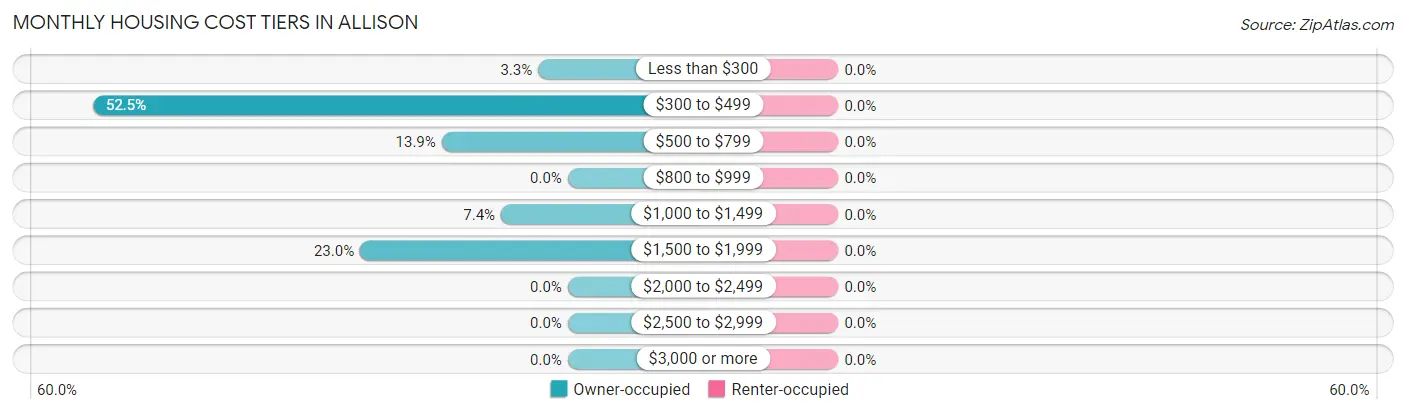
| Monthly Cost | Owner-occupied | Renter-occupied |
| Less than $300 | 4 (3.3%) | 0 (0.0%) |
| $300 to $499 | 64 (52.5%) | 0 (0.0%) |
| $500 to $799 | 17 (13.9%) | 0 (0.0%) |
| $800 to $999 | 0 (0.0%) | 0 (0.0%) |
| $1,000 to $1,499 | 9 (7.4%) | 0 (0.0%) |
| $1,500 to $1,999 | 28 (23.0%) | 0 (0.0%) |
| $2,000 to $2,499 | 0 (0.0%) | 0 (0.0%) |
| $2,500 to $2,999 | 0 (0.0%) | 0 (0.0%) |
| $3,000 or more | 0 (0.0%) | 0 (0.0%) |
| Total | 122 (100.0%) | 44 (100.0%) |
Physical Housing Characteristics in Allison
Housing Structures in Allison
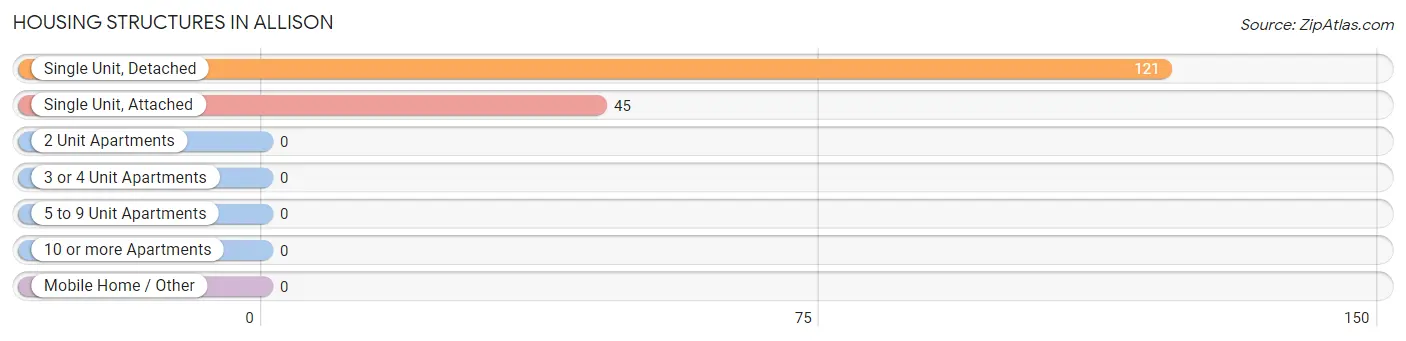
| Structure Type | # Housing Units | % Housing Units |
| Single Unit, Detached | 121 | 72.9% |
| Single Unit, Attached | 45 | 27.1% |
| 2 Unit Apartments | 0 | 0.0% |
| 3 or 4 Unit Apartments | 0 | 0.0% |
| 5 to 9 Unit Apartments | 0 | 0.0% |
| 10 or more Apartments | 0 | 0.0% |
| Mobile Home / Other | 0 | 0.0% |
| Total | 166 | 100.0% |
Housing Structures by Occupancy in Allison
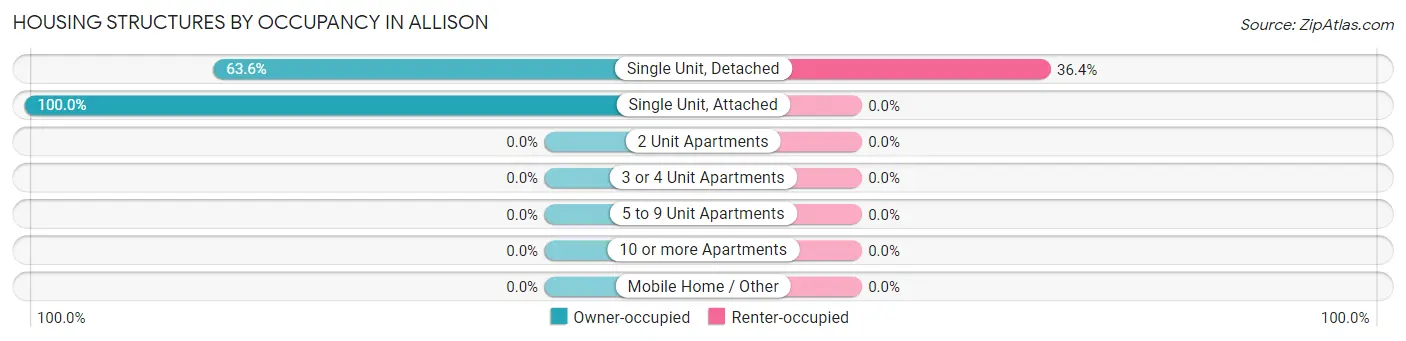
| Structure Type | Owner-occupied | Renter-occupied |
| Single Unit, Detached | 77 (63.6%) | 44 (36.4%) |
| Single Unit, Attached | 45 (100.0%) | 0 (0.0%) |
| 2 Unit Apartments | 0 (0.0%) | 0 (0.0%) |
| 3 or 4 Unit Apartments | 0 (0.0%) | 0 (0.0%) |
| 5 to 9 Unit Apartments | 0 (0.0%) | 0 (0.0%) |
| 10 or more Apartments | 0 (0.0%) | 0 (0.0%) |
| Mobile Home / Other | 0 (0.0%) | 0 (0.0%) |
| Total | 122 (73.5%) | 44 (26.5%) |
Housing Structures by Number of Rooms in Allison
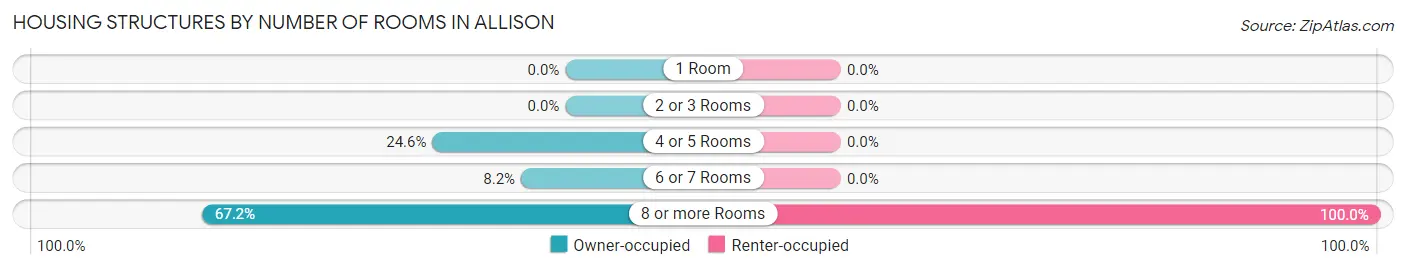
| Number of Rooms | Owner-occupied | Renter-occupied |
| 1 Room | 0 (0.0%) | 0 (0.0%) |
| 2 or 3 Rooms | 0 (0.0%) | 0 (0.0%) |
| 4 or 5 Rooms | 30 (24.6%) | 0 (0.0%) |
| 6 or 7 Rooms | 10 (8.2%) | 0 (0.0%) |
| 8 or more Rooms | 82 (67.2%) | 44 (100.0%) |
| Total | 122 (100.0%) | 44 (100.0%) |
Housing Structure by Heating Type in Allison
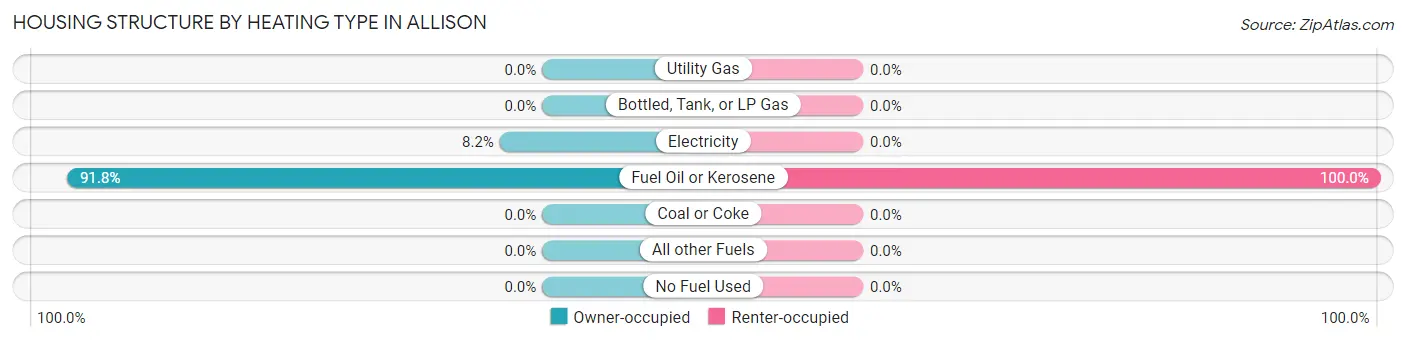
| Heating Type | Owner-occupied | Renter-occupied |
| Utility Gas | 0 (0.0%) | 0 (0.0%) |
| Bottled, Tank, or LP Gas | 0 (0.0%) | 0 (0.0%) |
| Electricity | 10 (8.2%) | 0 (0.0%) |
| Fuel Oil or Kerosene | 112 (91.8%) | 44 (100.0%) |
| Coal or Coke | 0 (0.0%) | 0 (0.0%) |
| All other Fuels | 0 (0.0%) | 0 (0.0%) |
| No Fuel Used | 0 (0.0%) | 0 (0.0%) |
| Total | 122 (100.0%) | 44 (100.0%) |
Household Vehicle Usage in Allison
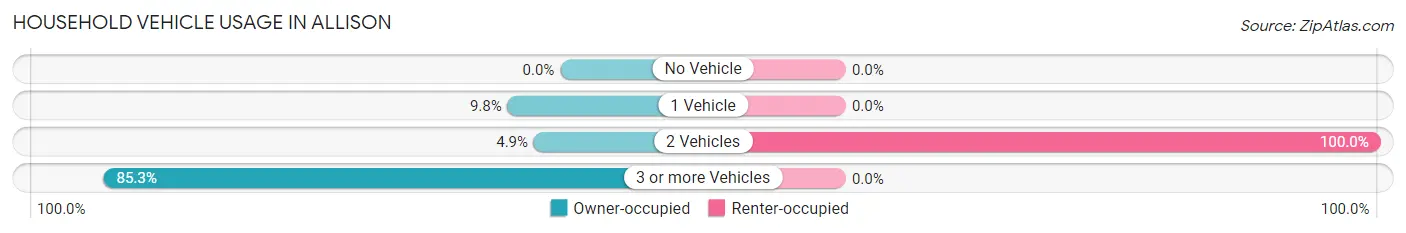
| Vehicles per Household | Owner-occupied | Renter-occupied |
| No Vehicle | 0 (0.0%) | 0 (0.0%) |
| 1 Vehicle | 12 (9.8%) | 0 (0.0%) |
| 2 Vehicles | 6 (4.9%) | 44 (100.0%) |
| 3 or more Vehicles | 104 (85.3%) | 0 (0.0%) |
| Total | 122 (100.0%) | 44 (100.0%) |
Real Estate & Mortgages in Allison
Real Estate and Mortgage Overview in Allison
| Characteristic | Without Mortgage | With Mortgage |
| Housing Units | 85 | 37 |
| Median Property Value | $33,700 | $158,500 |
| Median Household Income | - | - |
| Monthly Housing Costs | $443 | $0 |
| Real Estate Taxes | - | - |
Property Value by Mortgage Status in Allison
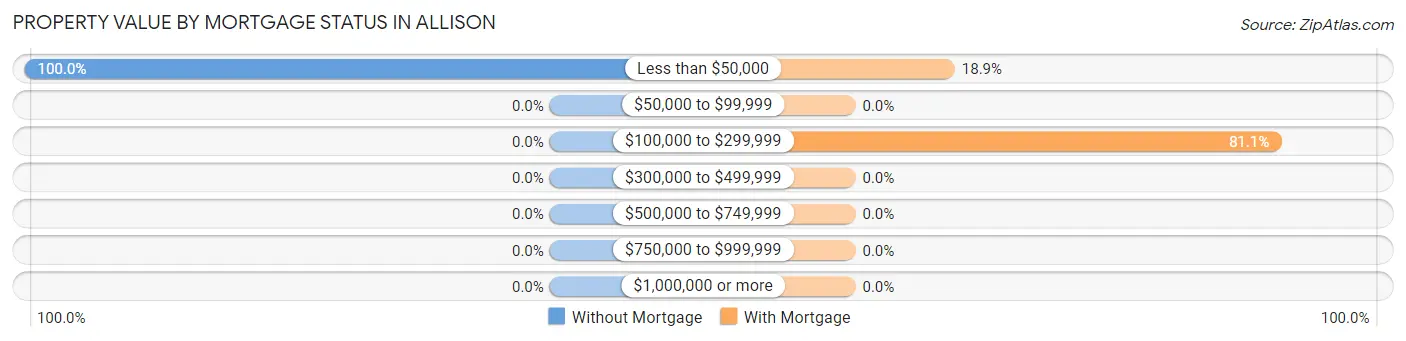
| Property Value | Without Mortgage | With Mortgage |
| Less than $50,000 | 85 (100.0%) | 7 (18.9%) |
| $50,000 to $99,999 | 0 (0.0%) | 0 (0.0%) |
| $100,000 to $299,999 | 0 (0.0%) | 30 (81.1%) |
| $300,000 to $499,999 | 0 (0.0%) | 0 (0.0%) |
| $500,000 to $749,999 | 0 (0.0%) | 0 (0.0%) |
| $750,000 to $999,999 | 0 (0.0%) | 0 (0.0%) |
| $1,000,000 or more | 0 (0.0%) | 0 (0.0%) |
| Total | 85 (100.0%) | 37 (100.0%) |
Household Income by Mortgage Status in Allison
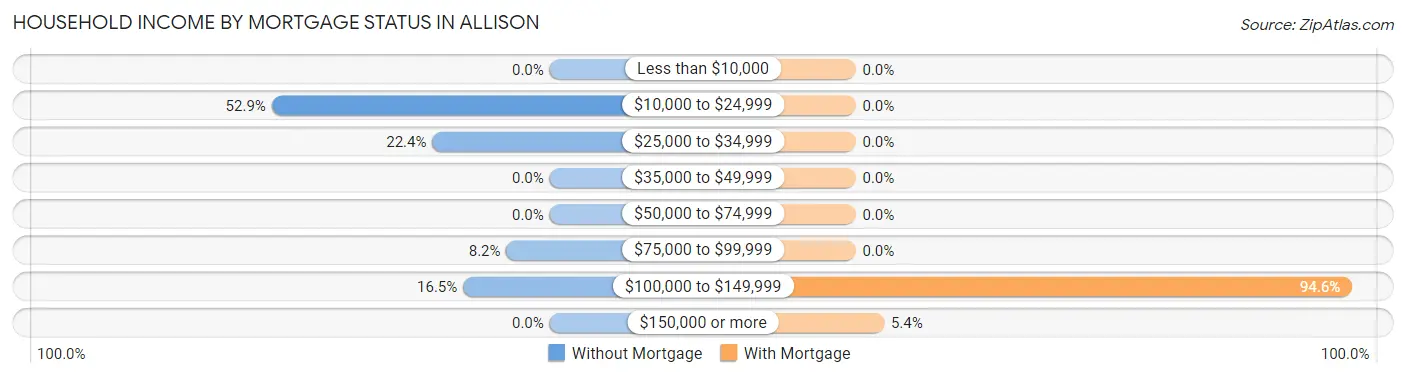
| Household Income | Without Mortgage | With Mortgage |
| Less than $10,000 | 0 (0.0%) | 0 (0.0%) |
| $10,000 to $24,999 | 45 (52.9%) | 0 (0.0%) |
| $25,000 to $34,999 | 19 (22.4%) | 0 (0.0%) |
| $35,000 to $49,999 | 0 (0.0%) | 0 (0.0%) |
| $50,000 to $74,999 | 0 (0.0%) | 0 (0.0%) |
| $75,000 to $99,999 | 7 (8.2%) | 0 (0.0%) |
| $100,000 to $149,999 | 14 (16.5%) | 35 (94.6%) |
| $150,000 or more | 0 (0.0%) | 2 (5.4%) |
| Total | 85 (100.0%) | 37 (100.0%) |
Property Value to Household Income Ratio in Allison
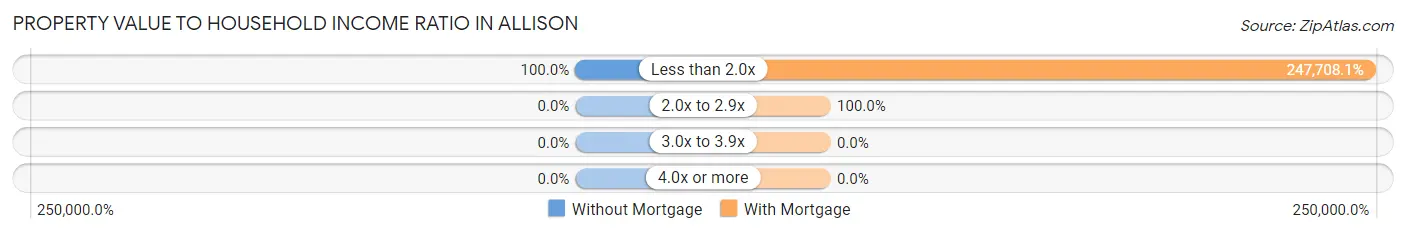
| Value-to-Income Ratio | Without Mortgage | With Mortgage |
| Less than 2.0x | 85 (100.0%) | 91,652 (247,708.1%) |
| 2.0x to 2.9x | 0 (0.0%) | 37 (100.0%) |
| 3.0x to 3.9x | 0 (0.0%) | 0 (0.0%) |
| 4.0x or more | 0 (0.0%) | 0 (0.0%) |
| Total | 85 (100.0%) | 37 (100.0%) |
Real Estate Taxes by Mortgage Status in Allison
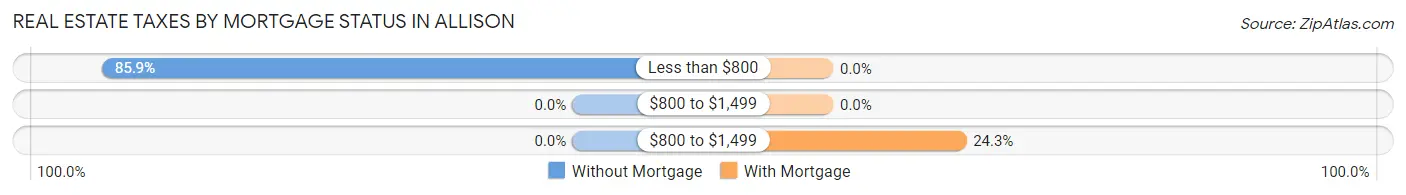
| Property Taxes | Without Mortgage | With Mortgage |
| Less than $800 | 73 (85.9%) | 0 (0.0%) |
| $800 to $1,499 | 0 (0.0%) | 0 (0.0%) |
| $800 to $1,499 | 0 (0.0%) | 9 (24.3%) |
| Total | 85 (100.0%) | 37 (100.0%) |
Health & Disability in Allison
Health Insurance Coverage by Age in Allison
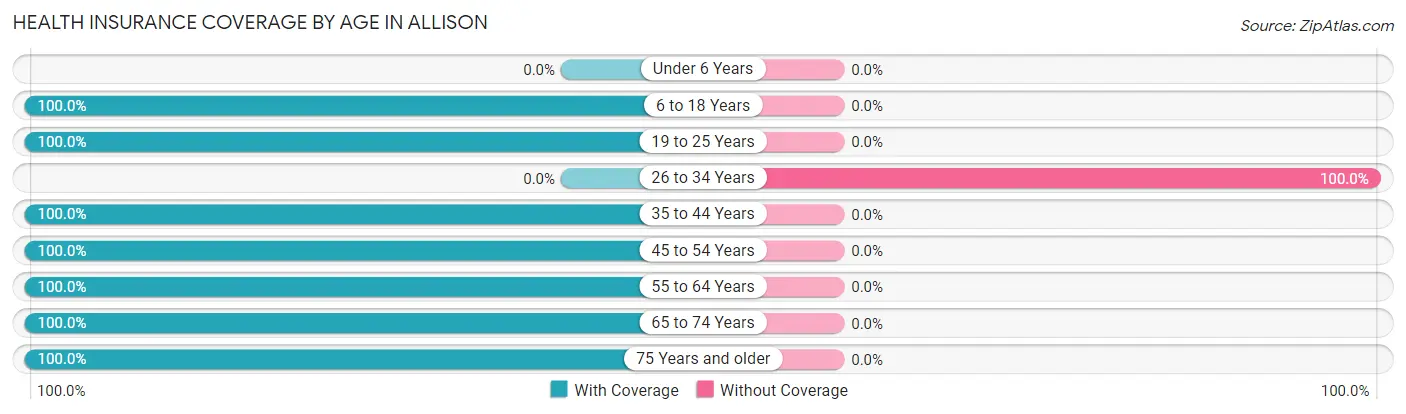
| Age Bracket | With Coverage | Without Coverage |
| Under 6 Years | 0 (0.0%) | 0 (0.0%) |
| 6 to 18 Years | 59 (100.0%) | 0 (0.0%) |
| 19 to 25 Years | 8 (100.0%) | 0 (0.0%) |
| 26 to 34 Years | 0 (0.0%) | 4 (100.0%) |
| 35 to 44 Years | 21 (100.0%) | 0 (0.0%) |
| 45 to 54 Years | 87 (100.0%) | 0 (0.0%) |
| 55 to 64 Years | 21 (100.0%) | 0 (0.0%) |
| 65 to 74 Years | 99 (100.0%) | 0 (0.0%) |
| 75 Years and older | 45 (100.0%) | 0 (0.0%) |
| Total | 340 (98.8%) | 4 (1.2%) |
Health Insurance Coverage by Citizenship Status in Allison
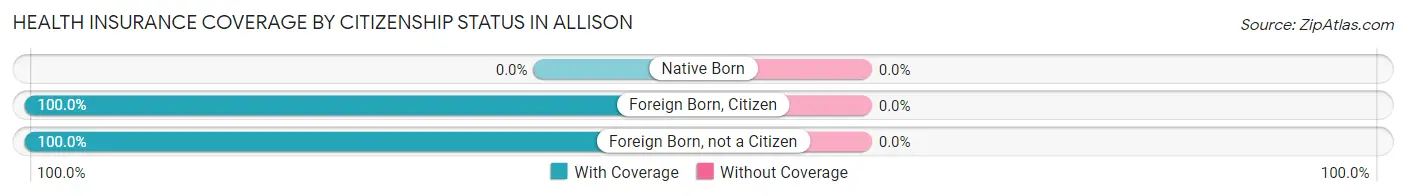
| Citizenship Status | With Coverage | Without Coverage |
| Native Born | 0 (0.0%) | 0 (0.0%) |
| Foreign Born, Citizen | 59 (100.0%) | 0 (0.0%) |
| Foreign Born, not a Citizen | 8 (100.0%) | 0 (0.0%) |
Health Insurance Coverage by Household Income in Allison
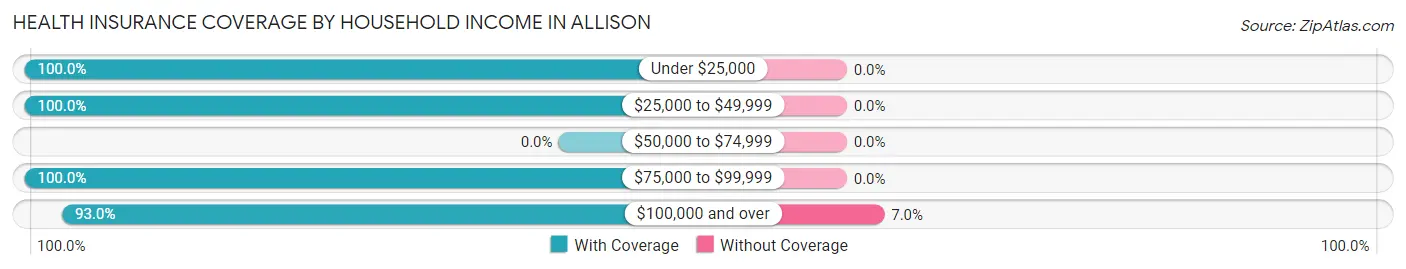
| Household Income | With Coverage | Without Coverage |
| Under $25,000 | 45 (100.0%) | 0 (0.0%) |
| $25,000 to $49,999 | 19 (100.0%) | 0 (0.0%) |
| $50,000 to $74,999 | 0 (0.0%) | 0 (0.0%) |
| $75,000 to $99,999 | 223 (100.0%) | 0 (0.0%) |
| $100,000 and over | 53 (93.0%) | 4 (7.0%) |
Public vs Private Health Insurance Coverage by Age in Allison
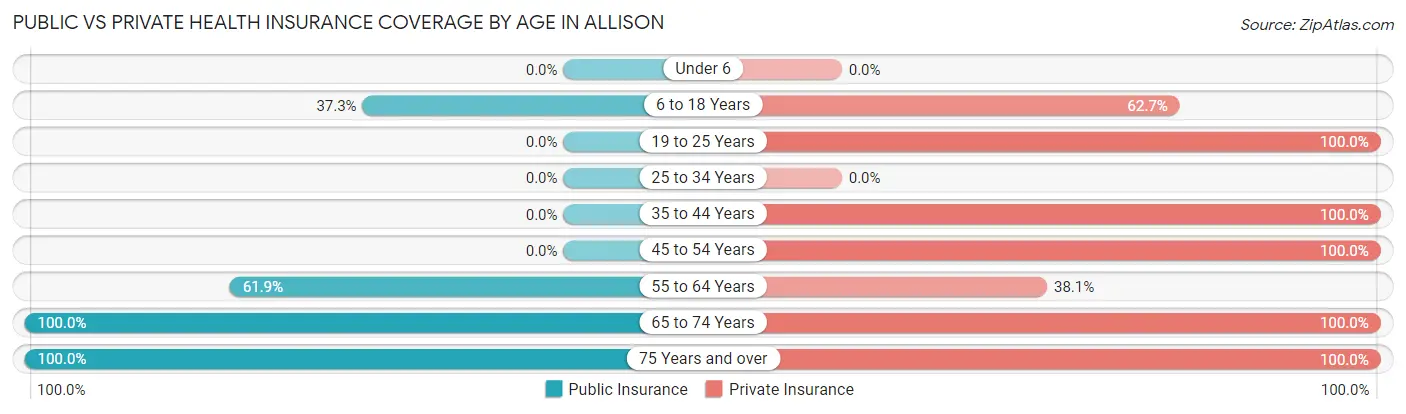
| Age Bracket | Public Insurance | Private Insurance |
| Under 6 | 0 (0.0%) | 0 (0.0%) |
| 6 to 18 Years | 22 (37.3%) | 37 (62.7%) |
| 19 to 25 Years | 0 (0.0%) | 8 (100.0%) |
| 25 to 34 Years | 0 (0.0%) | 0 (0.0%) |
| 35 to 44 Years | 0 (0.0%) | 21 (100.0%) |
| 45 to 54 Years | 0 (0.0%) | 87 (100.0%) |
| 55 to 64 Years | 13 (61.9%) | 8 (38.1%) |
| 65 to 74 Years | 99 (100.0%) | 99 (100.0%) |
| 75 Years and over | 45 (100.0%) | 45 (100.0%) |
| Total | 179 (52.0%) | 305 (88.7%) |
Disability Status by Sex by Age in Allison
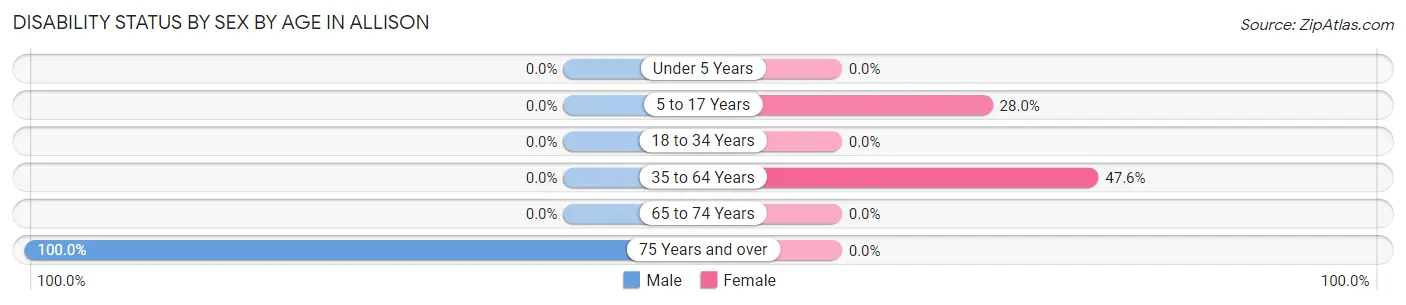
| Age Bracket | Male | Female |
| Under 5 Years | 0 (0.0%) | 0 (0.0%) |
| 5 to 17 Years | 0 (0.0%) | 7 (28.0%) |
| 18 to 34 Years | 0 (0.0%) | 0 (0.0%) |
| 35 to 64 Years | 0 (0.0%) | 30 (47.6%) |
| 65 to 74 Years | 0 (0.0%) | 0 (0.0%) |
| 75 Years and over | 45 (100.0%) | 0 (0.0%) |
Disability Class by Sex by Age in Allison
Disability Class: Hearing Difficulty
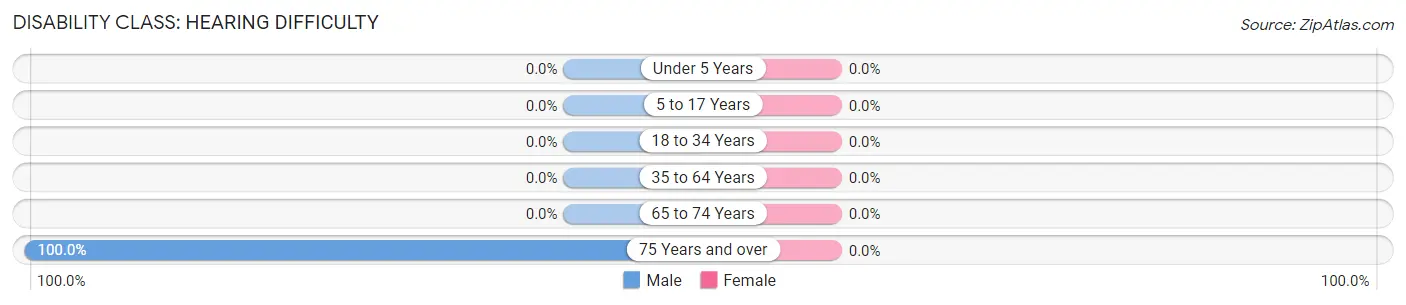
| Age Bracket | Male | Female |
| Under 5 Years | 0 (0.0%) | 0 (0.0%) |
| 5 to 17 Years | 0 (0.0%) | 0 (0.0%) |
| 18 to 34 Years | 0 (0.0%) | 0 (0.0%) |
| 35 to 64 Years | 0 (0.0%) | 0 (0.0%) |
| 65 to 74 Years | 0 (0.0%) | 0 (0.0%) |
| 75 Years and over | 45 (100.0%) | 0 (0.0%) |
Disability Class: Vision Difficulty
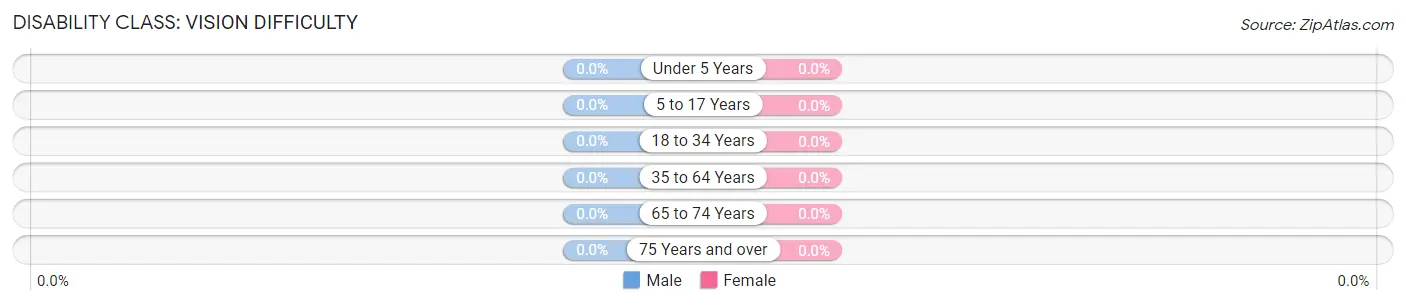
| Age Bracket | Male | Female |
| Under 5 Years | 0 (0.0%) | 0 (0.0%) |
| 5 to 17 Years | 0 (0.0%) | 0 (0.0%) |
| 18 to 34 Years | 0 (0.0%) | 0 (0.0%) |
| 35 to 64 Years | 0 (0.0%) | 0 (0.0%) |
| 65 to 74 Years | 0 (0.0%) | 0 (0.0%) |
| 75 Years and over | 0 (0.0%) | 0 (0.0%) |
Disability Class: Cognitive Difficulty
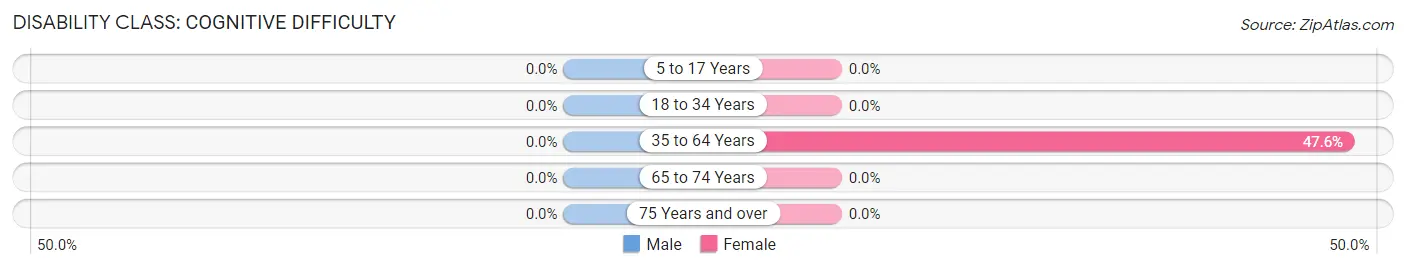
| Age Bracket | Male | Female |
| 5 to 17 Years | 0 (0.0%) | 0 (0.0%) |
| 18 to 34 Years | 0 (0.0%) | 0 (0.0%) |
| 35 to 64 Years | 0 (0.0%) | 30 (47.6%) |
| 65 to 74 Years | 0 (0.0%) | 0 (0.0%) |
| 75 Years and over | 0 (0.0%) | 0 (0.0%) |
Disability Class: Ambulatory Difficulty
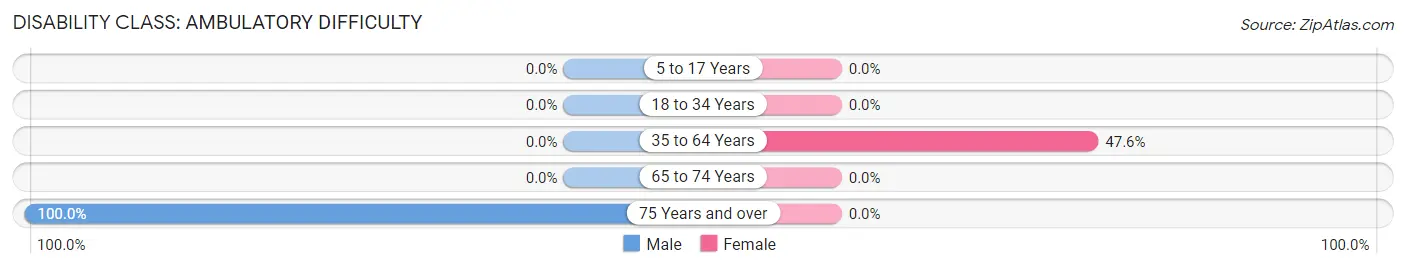
| Age Bracket | Male | Female |
| 5 to 17 Years | 0 (0.0%) | 0 (0.0%) |
| 18 to 34 Years | 0 (0.0%) | 0 (0.0%) |
| 35 to 64 Years | 0 (0.0%) | 30 (47.6%) |
| 65 to 74 Years | 0 (0.0%) | 0 (0.0%) |
| 75 Years and over | 45 (100.0%) | 0 (0.0%) |
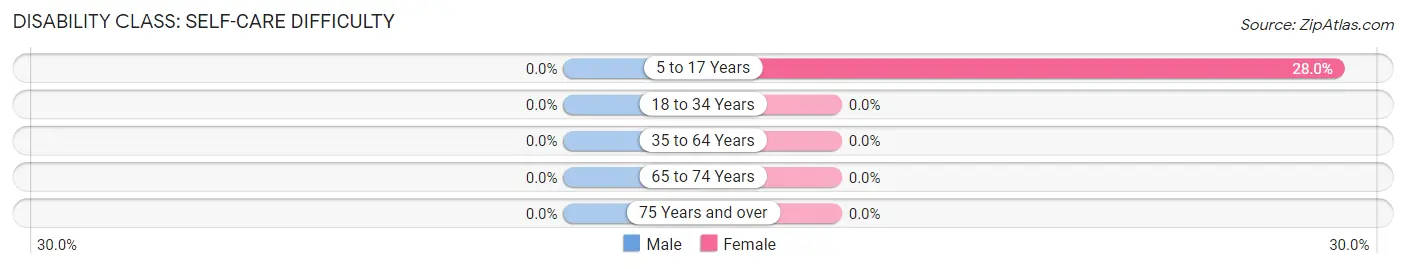
Disability Class: Self-Care Difficulty
| Age Bracket | Male | Female |
| 5 to 17 Years | 0 (0.0%) | 7 (28.0%) |
| 18 to 34 Years | 0 (0.0%) | 0 (0.0%) |
| 35 to 64 Years | 0 (0.0%) | 0 (0.0%) |
| 65 to 74 Years | 0 (0.0%) | 0 (0.0%) |
| 75 Years and over | 0 (0.0%) | 0 (0.0%) |
Technology Access in Allison
Computing Device Access in Allison
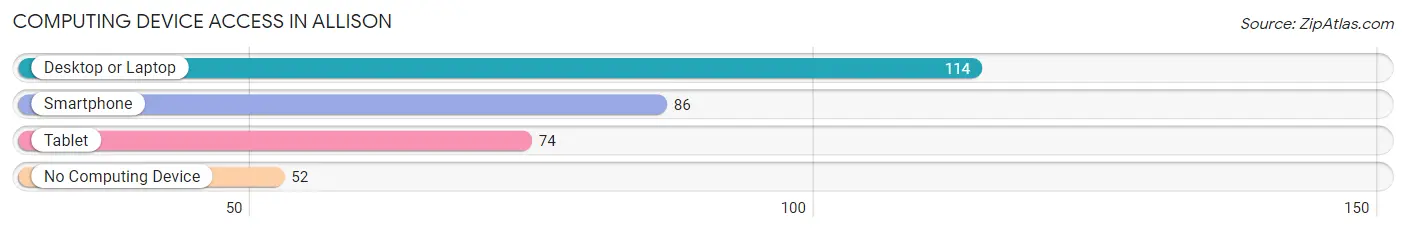
| Device Type | # Households | % Households |
| Desktop or Laptop | 114 | 68.7% |
| Smartphone | 86 | 51.8% |
| Tablet | 74 | 44.6% |
| No Computing Device | 52 | 31.3% |
| Total | 166 | 100.0% |
Internet Access in Allison
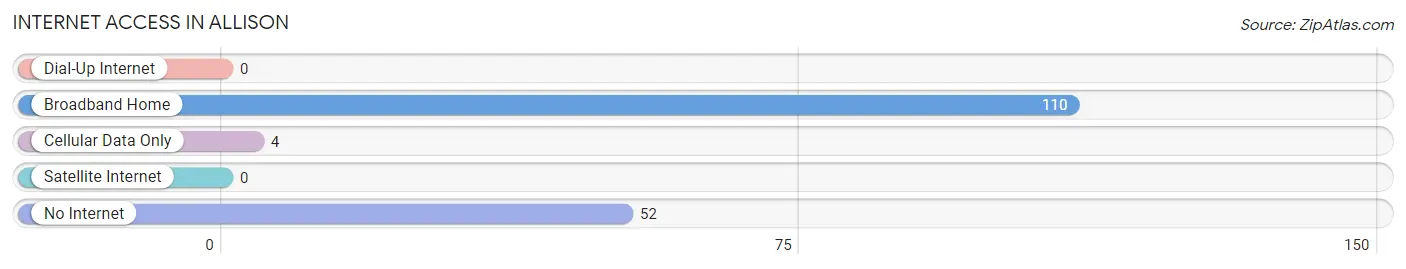
| Internet Type | # Households | % Households |
| Dial-Up Internet | 0 | 0.0% |
| Broadband Home | 110 | 66.3% |
| Cellular Data Only | 4 | 2.4% |
| Satellite Internet | 0 | 0.0% |
| No Internet | 52 | 31.3% |
| Total | 166 | 100.0% |
Allison Summary
Allison, Pennsylvania is a small borough located in the Allegheny Mountains of western Pennsylvania. It is situated in the northern part of Westmoreland County, approximately 40 miles east of Pittsburgh. The borough was founded in 1876 and named after William Allison, a local landowner. As of the 2010 census, the population of Allison was 1,093.
Geography
Allison is located at 40°19'N 79°37'W (40.3167, -79.6167). It is situated in the northern part of Westmoreland County, approximately 40 miles east of Pittsburgh. The borough is bordered by the townships of Bell, Derry, and Ligonier. The terrain is mostly hilly, with the highest point being 1,890 feet above sea level. The climate is humid continental, with cold winters and hot summers.
Economy
The economy of Allison is largely based on agriculture and tourism. The borough is home to several small businesses, including a grocery store, a hardware store, and a few restaurants. The nearby town of Ligonier is home to a number of larger businesses, including a hospital, a college, and a number of retail stores.
Demographics
As of the 2010 census, the population of Allison was 1,093. The racial makeup of the borough was 97.3% White, 0.7% African American, 0.2% Native American, 0.2% Asian, 0.2% from other races, and 1.4% from two or more races. Hispanic or Latino of any race were 0.7% of the population.
The median income for a household in the borough was $37,500, and the median income for a family was $45,000. The per capita income for the borough was $17,845. About 8.3% of families and 10.2% of the population were below the poverty line, including 14.3% of those under age 18 and 8.3% of those age 65 or over.
Education
Allison is served by the Derry Area School District. The borough is home to the Derry Area High School, which serves students in grades 9-12. The school offers a variety of academic and extracurricular activities, including sports, clubs, and other activities.
Conclusion
Allison, Pennsylvania is a small borough located in the Allegheny Mountains of western Pennsylvania. It is situated in the northern part of Westmoreland County, approximately 40 miles east of Pittsburgh. The borough was founded in 1876 and named after William Allison, a local landowner. The economy of Allison is largely based on agriculture and tourism, and the borough is home to several small businesses. As of the 2010 census, the population of Allison was 1,093. The borough is served by the Derry Area School District, and is home to the Derry Area High School.
Common Questions
What is the Total Population of Allison?
Total Population of Allison is 344.
What is the Total Male Population of Allison?
Total Male Population of Allison is 169.
What is the Total Female Population of Allison?
Total Female Population of Allison is 175.
What is the Ratio of Males per 100 Females in Allison?
There are 96.57 Males per 100 Females in Allison.
What is the Ratio of Females per 100 Males in Allison?
There are 103.55 Females per 100 Males in Allison.
What is the Median Population Age in Allison?
Median Population Age in Allison is 49.3 Years.
What is the Average Family Size in Allison
Average Family Size in Allison is 2.8 People.
What is the Average Household Size in Allison
Average Household Size in Allison is 2.1 People.
What is Per Capita Income in Allison?
Per Capita income in Allison is $34,056.
What is the Median Family Income in Allison?
Median Family Income in Allison is $90,625.
What is the Median Household income in Allison?
Median Household Income in Allison is $88,580.
What is Inequality or Gini Index in Allison?
Inequality or Gini Index in Allison is 0.27.
How Large is the Labor Force in Allison?
There are 133 People in the Labor Forcein in Allison.
What is the Percentage of People in the Labor Force in Allison?
42.6% of People are in the Labor Force in Allison.