Zip Codes with the Highest Percentage of Population Employed in Accommodation & Food Services in Levittown, PA
RELATED REPORTS & OPTIONS
Accommodation & Food Services
Levittown
Compare Zip Codes
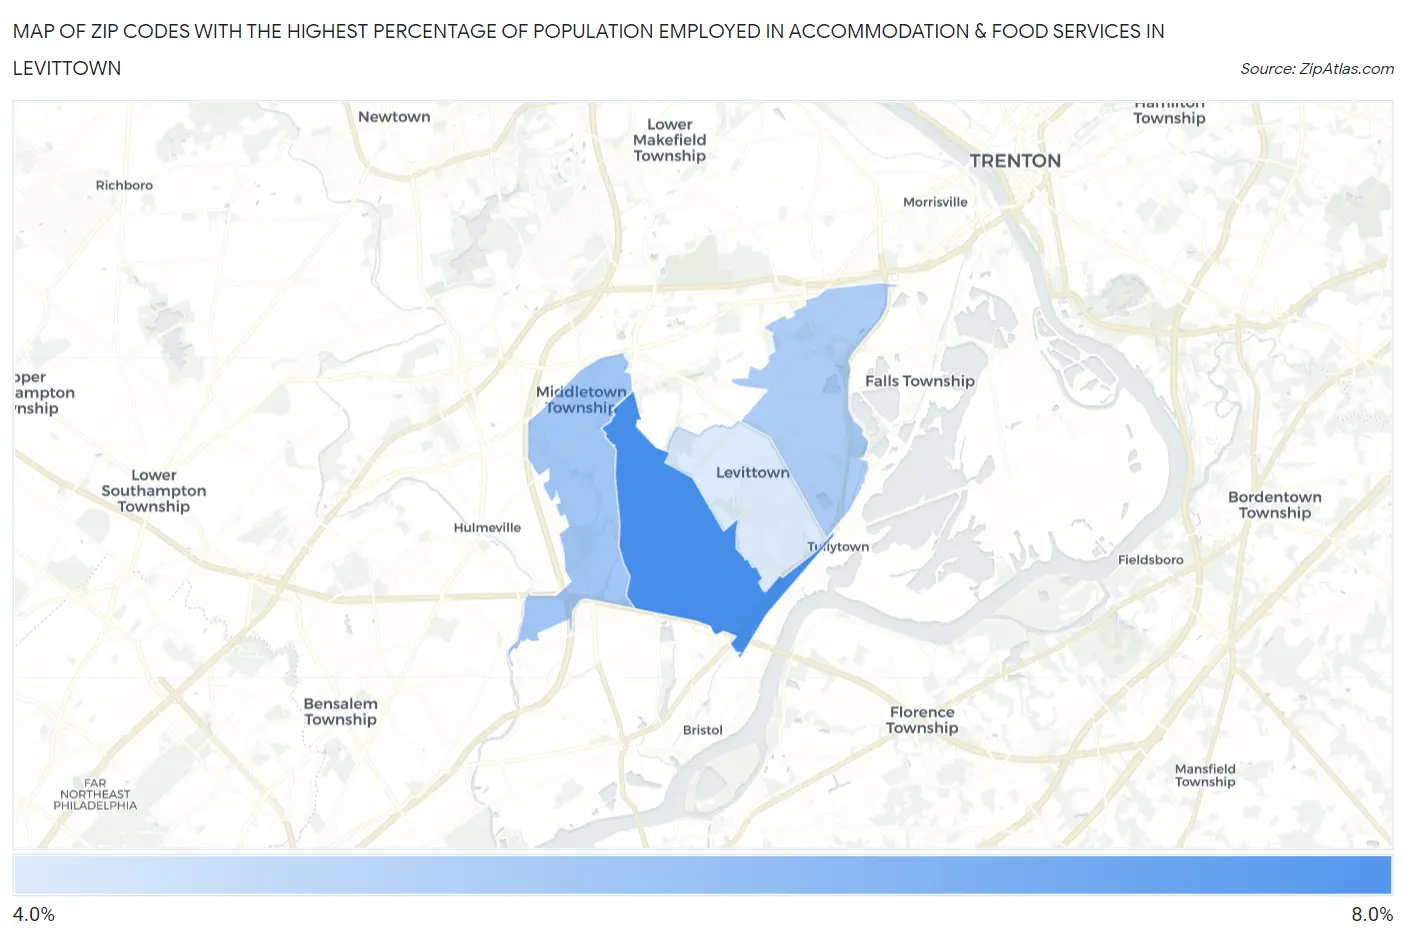
Map of Zip Codes with the Highest Percentage of Population Employed in Accommodation & Food Services in Levittown
0.0%
8.0%
Zip Codes with the Highest Percentage of Population Employed in Accommodation & Food Services in Levittown, PA
| Zip Code | % Employed | vs State | vs National | |
| 1. | 19057 | 7.0% | 5.9%(+1.15)#463 | 6.9%(+0.159)#10,204 |
| 2. | 19056 | 5.3% | 5.9%(-0.610)#810 | 6.9%(-1.60)#15,848 |
| 3. | 19054 | 5.1% | 5.9%(-0.826)#860 | 6.9%(-1.82)#16,599 |
| 4. | 19055 | 4.1% | 5.9%(-1.74)#1,051 | 6.9%(-2.73)#19,677 |
1
Common Questions
What are the Top 3 Zip Codes with the Highest Percentage of Population Employed in Accommodation & Food Services in Levittown, PA?
Top 3 Zip Codes with the Highest Percentage of Population Employed in Accommodation & Food Services in Levittown, PA are:
What zip code has the Highest Percentage of Population Employed in Accommodation & Food Services in Levittown, PA?
19057 has the Highest Percentage of Population Employed in Accommodation & Food Services in Levittown, PA with 7.0%.
What is the Percentage of Population Employed in Accommodation & Food Services in Levittown, PA?
Percentage of Population Employed in Accommodation & Food Services in Levittown is 6.2%.
What is the Percentage of Population Employed in Accommodation & Food Services in Pennsylvania?
Percentage of Population Employed in Accommodation & Food Services in Pennsylvania is 5.9%.
What is the Percentage of Population Employed in Accommodation & Food Services in the United States?
Percentage of Population Employed in Accommodation & Food Services in the United States is 6.9%.