Millvale borough, PA
Millvale borough Overview
3,377
TOTAL POPULATION
1,687
MALE POPULATION
1,690
FEMALE POPULATION
99.82
MALES / 100 FEMALES
100.18
FEMALES / 100 MALES
42.7
MEDIAN AGE
3.1
AVG FAMILY SIZE
2.0
AVG HOUSEHOLD SIZE
$32,803
PER CAPITA INCOME
$75,038
AVG FAMILY INCOME
$59,250
AVG HOUSEHOLD INCOME
18.6%
WAGE / INCOME GAP [ % ]
81.4¢/ $1
WAGE / INCOME GAP [ $ ]
0.38
INEQUALITY / GINI INDEX
2,136
LABOR FORCE [ PEOPLE ]
71.8%
PERCENT IN LABOR FORCE
5.2%
UNEMPLOYMENT RATE
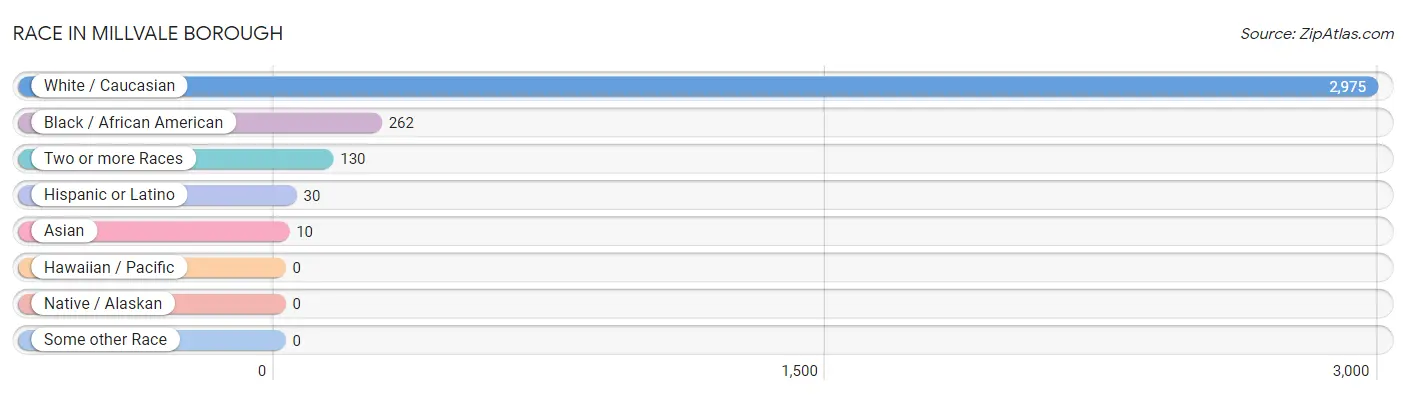
Race in Millvale borough
The most populous races in Millvale borough are White / Caucasian (2,975 | 88.1%), Black / African American (262 | 7.8%), and Two or more Races (130 | 3.8%).
| Race | # Population | % Population |
| Asian | 10 | 0.3% |
| Black / African American | 262 | 7.8% |
| Hawaiian / Pacific | 0 | 0.0% |
| Hispanic or Latino | 30 | 0.9% |
| Native / Alaskan | 0 | 0.0% |
| White / Caucasian | 2,975 | 88.1% |
| Two or more Races | 130 | 3.8% |
| Some other Race | 0 | 0.0% |
| Total | 3,377 | 100.0% |
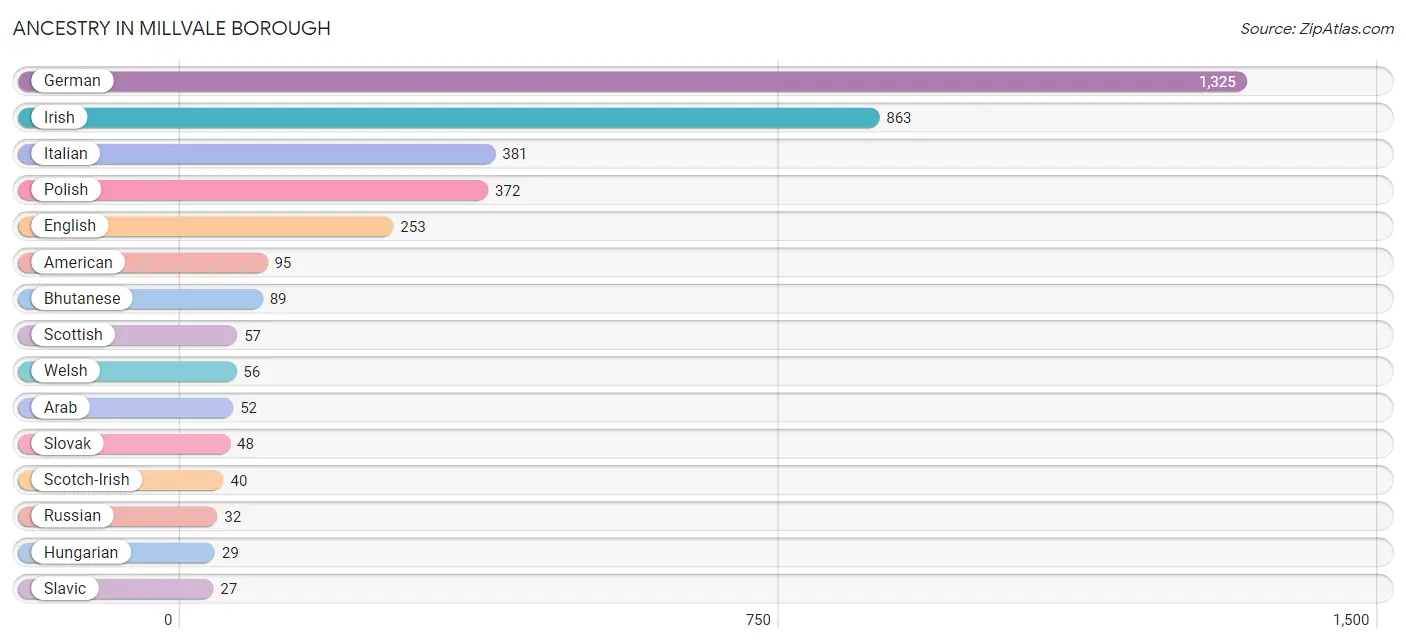
Ancestry in Millvale borough
The most populous ancestries reported in Millvale borough are German (1,325 | 39.2%), Irish (863 | 25.6%), Italian (381 | 11.3%), Polish (372 | 11.0%), and English (253 | 7.5%), together accounting for 94.6% of all Millvale borough residents.
| Ancestry | # Population | % Population |
| American | 95 | 2.8% |
| Arab | 52 | 1.5% |
| Australian | 10 | 0.3% |
| Austrian | 7 | 0.2% |
| Bhutanese | 89 | 2.6% |
| British | 10 | 0.3% |
| Carpatho Rusyn | 8 | 0.2% |
| Croatian | 22 | 0.6% |
| Czech | 19 | 0.6% |
| Dutch | 11 | 0.3% |
| Eastern European | 18 | 0.5% |
| English | 253 | 7.5% |
| European | 8 | 0.2% |
| French | 6 | 0.2% |
| French Canadian | 14 | 0.4% |
| German | 1,325 | 39.2% |
| Hungarian | 29 | 0.9% |
| Indian (Asian) | 3 | 0.1% |
| Iraqi | 20 | 0.6% |
| Irish | 863 | 25.6% |
| Italian | 381 | 11.3% |
| Maltese | 14 | 0.4% |
| Norwegian | 9 | 0.3% |
| Polish | 372 | 11.0% |
| Puerto Rican | 22 | 0.6% |
| Russian | 32 | 0.9% |
| Scotch-Irish | 40 | 1.2% |
| Scottish | 57 | 1.7% |
| Slavic | 27 | 0.8% |
| Slovak | 48 | 1.4% |
| Swedish | 16 | 0.5% |
| Welsh | 56 | 1.7% | View All 32 Rows |
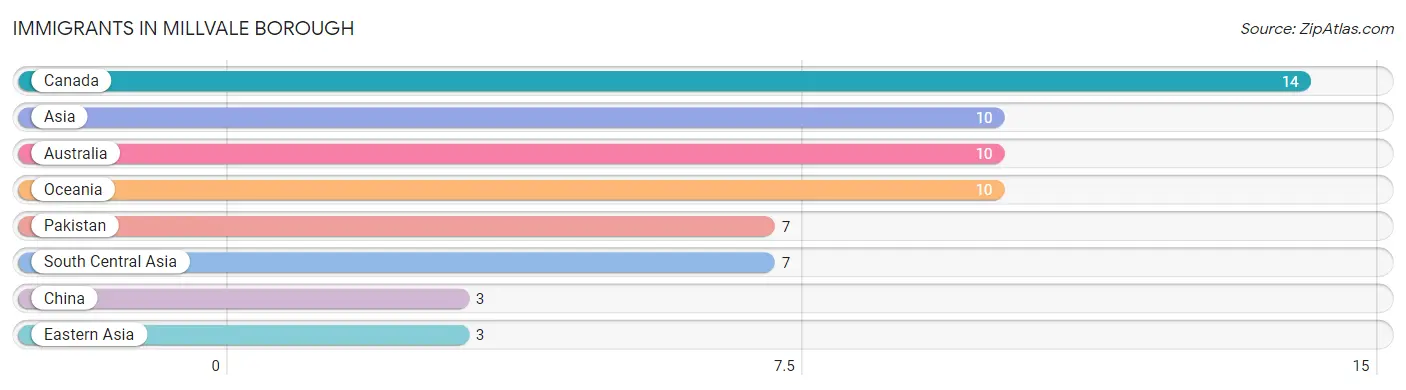
Immigrants in Millvale borough
The most numerous immigrant groups reported in Millvale borough came from Canada (14 | 0.4%), Asia (10 | 0.3%), Australia (10 | 0.3%), Oceania (10 | 0.3%), and Pakistan (7 | 0.2%), together accounting for 1.5% of all Millvale borough residents.
| Immigration Origin | # Population | % Population |
| Asia | 10 | 0.3% |
| Australia | 10 | 0.3% |
| Canada | 14 | 0.4% |
| China | 3 | 0.1% |
| Eastern Asia | 3 | 0.1% |
| Oceania | 10 | 0.3% |
| Pakistan | 7 | 0.2% |
| South Central Asia | 7 | 0.2% | View All 8 Rows |
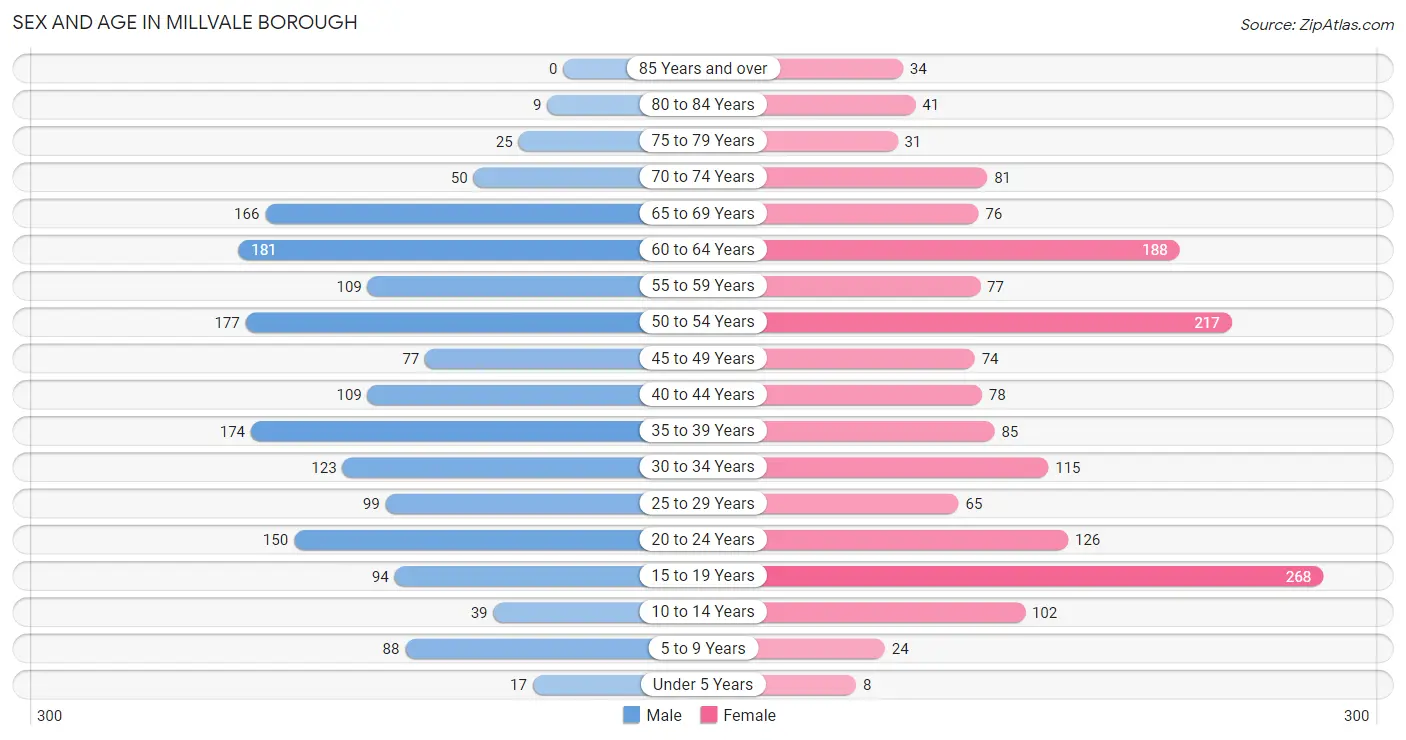
Sex and Age in Millvale borough
Sex and Age in Millvale borough
The most populous age groups in Millvale borough are 60 to 64 Years (181 | 10.7%) for men and 15 to 19 Years (268 | 15.9%) for women.
| Age Bracket | Male | Female |
| Under 5 Years | 17 (1.0%) | 8 (0.5%) |
| 5 to 9 Years | 88 (5.2%) | 24 (1.4%) |
| 10 to 14 Years | 39 (2.3%) | 102 (6.0%) |
| 15 to 19 Years | 94 (5.6%) | 268 (15.9%) |
| 20 to 24 Years | 150 (8.9%) | 126 (7.5%) |
| 25 to 29 Years | 99 (5.9%) | 65 (3.8%) |
| 30 to 34 Years | 123 (7.3%) | 115 (6.8%) |
| 35 to 39 Years | 174 (10.3%) | 85 (5.0%) |
| 40 to 44 Years | 109 (6.5%) | 78 (4.6%) |
| 45 to 49 Years | 77 (4.6%) | 74 (4.4%) |
| 50 to 54 Years | 177 (10.5%) | 217 (12.8%) |
| 55 to 59 Years | 109 (6.5%) | 77 (4.6%) |
| 60 to 64 Years | 181 (10.7%) | 188 (11.1%) |
| 65 to 69 Years | 166 (9.8%) | 76 (4.5%) |
| 70 to 74 Years | 50 (3.0%) | 81 (4.8%) |
| 75 to 79 Years | 25 (1.5%) | 31 (1.8%) |
| 80 to 84 Years | 9 (0.5%) | 41 (2.4%) |
| 85 Years and over | 0 (0.0%) | 34 (2.0%) |
| Total | 1,687 (100.0%) | 1,690 (100.0%) |
Families and Households in Millvale borough
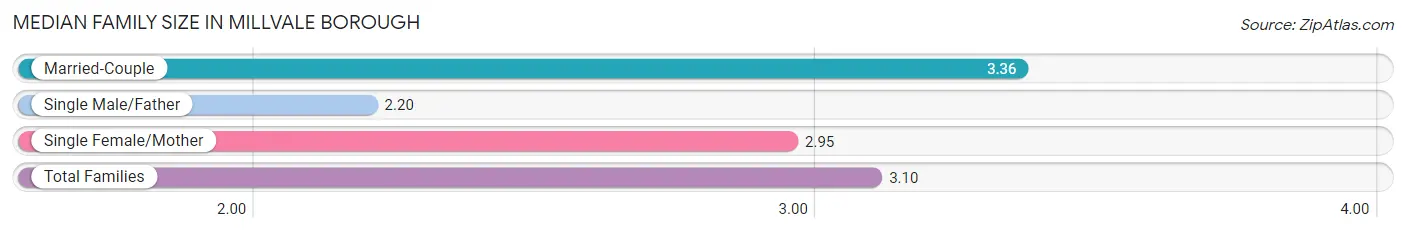
Median Family Size in Millvale borough
The median family size in Millvale borough is 3.10 persons per family, with married-couple families (375 | 54.6%) accounting for the largest median family size of 3.36 persons per family. On the other hand, single male/father families (64 | 9.3%) represent the smallest median family size with 2.20 persons per family.
| Family Type | # Families | Family Size |
| Married-Couple | 375 (54.6%) | 3.36 |
| Single Male/Father | 64 (9.3%) | 2.20 |
| Single Female/Mother | 248 (36.1%) | 2.95 |
| Total Families | 687 (100.0%) | 3.10 |
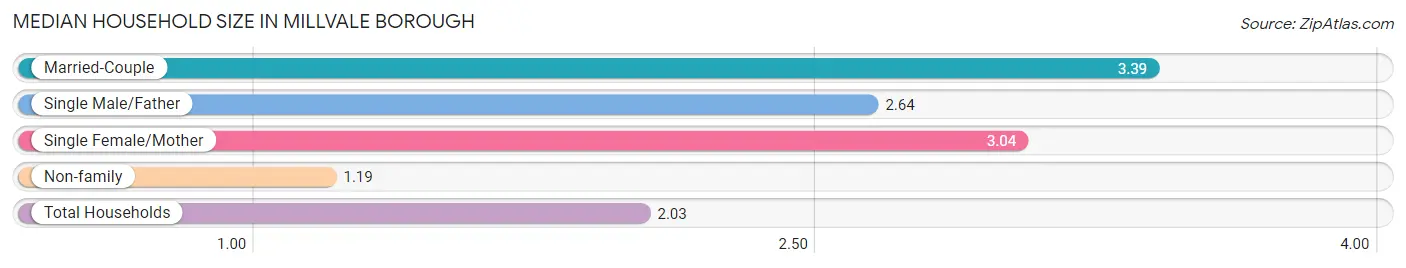
Median Household Size in Millvale borough
The median household size in Millvale borough is 2.03 persons per household, with married-couple households (375 | 23.0%) accounting for the largest median household size of 3.39 persons per household. non-family households (944 | 57.9%) represent the smallest median household size with 1.19 persons per household.
| Household Type | # Households | Household Size |
| Married-Couple | 375 (23.0%) | 3.39 |
| Single Male/Father | 64 (3.9%) | 2.64 |
| Single Female/Mother | 248 (15.2%) | 3.04 |
| Non-family | 944 (57.9%) | 1.19 |
| Total Households | 1,631 (100.0%) | 2.03 |
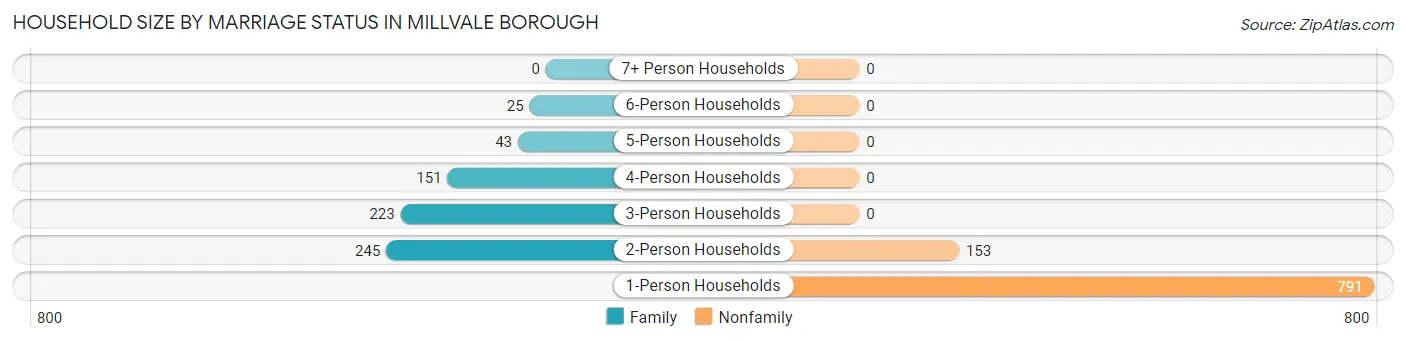
Household Size by Marriage Status in Millvale borough
Out of a total of 1,631 households in Millvale borough, 687 (42.1%) are family households, while 944 (57.9%) are nonfamily households. The most numerous type of family households are 2-person households, comprising 245, and the most common type of nonfamily households are 1-person households, comprising 791.
| Household Size | Family Households | Nonfamily Households |
| 1-Person Households | - | 791 (48.5%) |
| 2-Person Households | 245 (15.0%) | 153 (9.4%) |
| 3-Person Households | 223 (13.7%) | 0 (0.0%) |
| 4-Person Households | 151 (9.3%) | 0 (0.0%) |
| 5-Person Households | 43 (2.6%) | 0 (0.0%) |
| 6-Person Households | 25 (1.5%) | 0 (0.0%) |
| 7+ Person Households | 0 (0.0%) | 0 (0.0%) |
| Total | 687 (42.1%) | 944 (57.9%) |
Female Fertility in Millvale borough
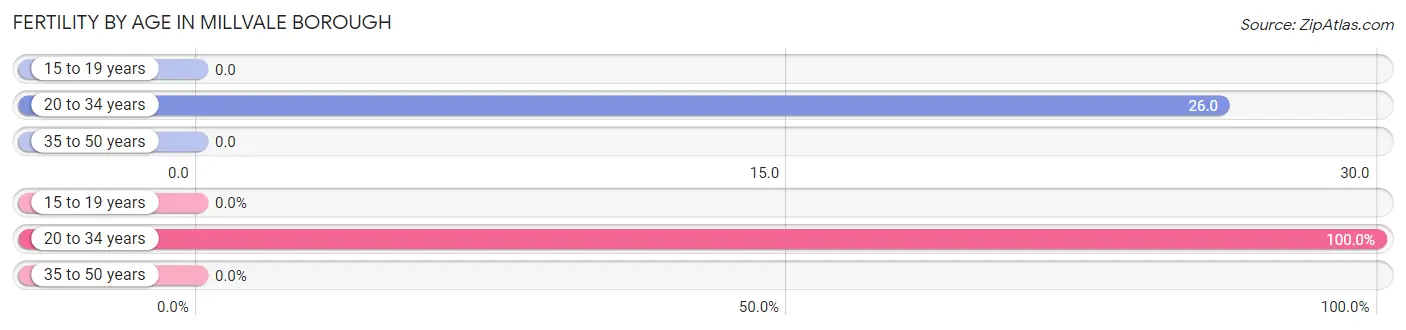
Fertility by Age in Millvale borough
Average fertility rate in Millvale borough is 10.0 births per 1,000 women. Women in the age bracket of 20 to 34 years have the highest fertility rate with 26.0 births per 1,000 women. Women in the age bracket of 20 to 34 years acount for 100.0% of all women with births.
| Age Bracket | Women with Births | Births / 1,000 Women |
| 15 to 19 years | 0 (0.0%) | 0.0 |
| 20 to 34 years | 8 (100.0%) | 26.0 |
| 35 to 50 years | 0 (0.0%) | 0.0 |
| Total | 8 (100.0%) | 10.0 |
Fertility by Age by Marriage Status in Millvale borough
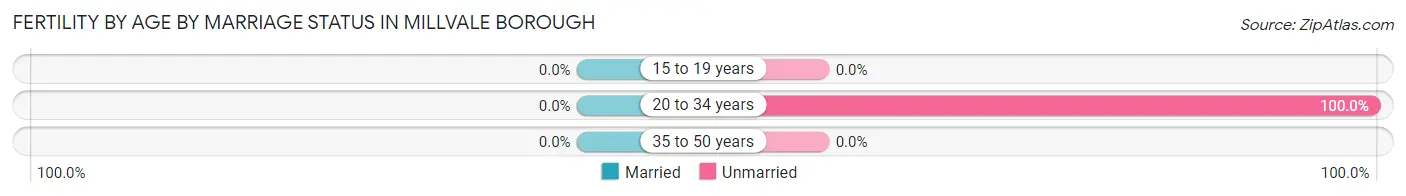
| Age Bracket | Married | Unmarried |
| 15 to 19 years | 0 (0.0%) | 0 (0.0%) |
| 20 to 34 years | 0 (0.0%) | 8 (100.0%) |
| 35 to 50 years | 0 (0.0%) | 0 (0.0%) |
| Total | 0 (0.0%) | 8 (100.0%) |
Fertility by Education in Millvale borough
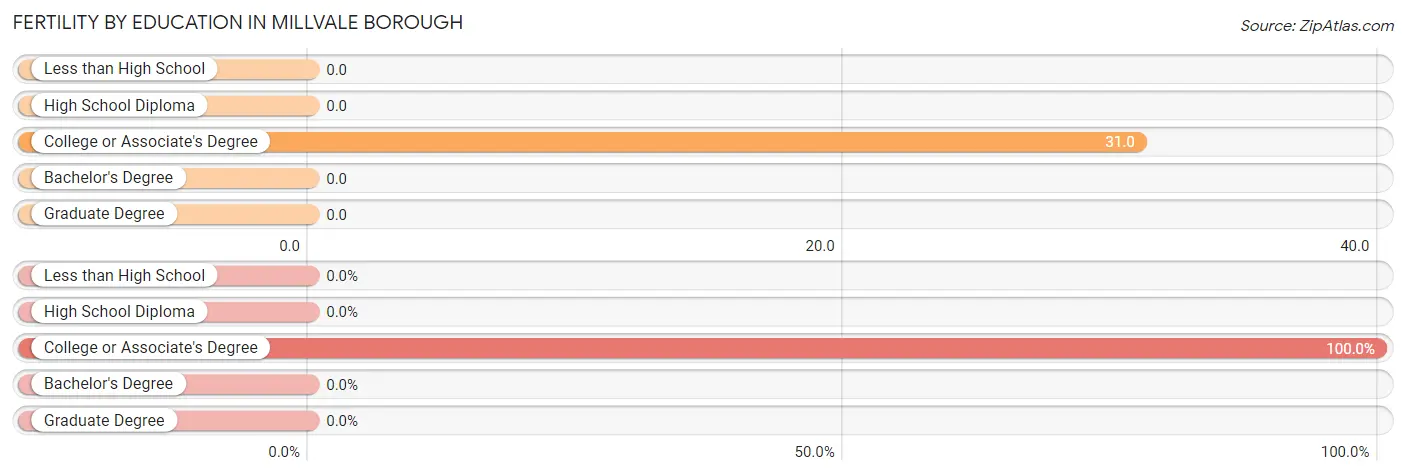
| Educational Attainment | Women with Births | Births / 1,000 Women |
| Less than High School | 0 (0.0%) | 0.0 |
| High School Diploma | 0 (0.0%) | 0.0 |
| College or Associate's Degree | 8 (100.0%) | 31.0 |
| Bachelor's Degree | 0 (0.0%) | 0.0 |
| Graduate Degree | 0 (0.0%) | 0.0 |
| Total | 8 (100.0%) | 10.0 |
Fertility by Education by Marriage Status in Millvale borough
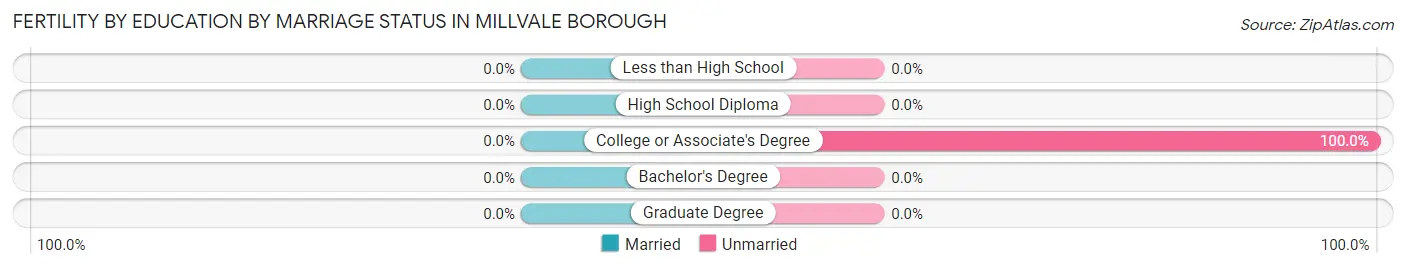
| Educational Attainment | Married | Unmarried |
| Less than High School | 0 (0.0%) | 0 (0.0%) |
| High School Diploma | 0 (0.0%) | 0 (0.0%) |
| College or Associate's Degree | 0 (0.0%) | 8 (100.0%) |
| Bachelor's Degree | 0 (0.0%) | 0 (0.0%) |
| Graduate Degree | 0 (0.0%) | 0 (0.0%) |
| Total | 0 (0.0%) | 8 (100.0%) |
Income in Millvale borough
Income Overview in Millvale borough
Per Capita Income in Millvale borough is $32,803, while median incomes of families and households are $75,038 and $59,250 respectively.
| Characteristic | Number | Measure |
| Per Capita Income | 3,377 | $32,803 |
| Median Family Income | 687 | $75,038 |
| Mean Family Income | 687 | $83,301 |
| Median Household Income | 1,631 | $59,250 |
| Mean Household Income | 1,631 | $65,871 |
| Income Deficit | 687 | $0 |
| Wage / Income Gap (%) | 3,377 | 18.60% |
| Wage / Income Gap ($) | 3,377 | 81.40¢ per $1 |
| Gini / Inequality Index | 3,377 | 0.38 |
Earnings by Sex in Millvale borough
Average Earnings in Millvale borough are $35,769, $37,047 for men and $30,156 for women, a difference of 18.6%.
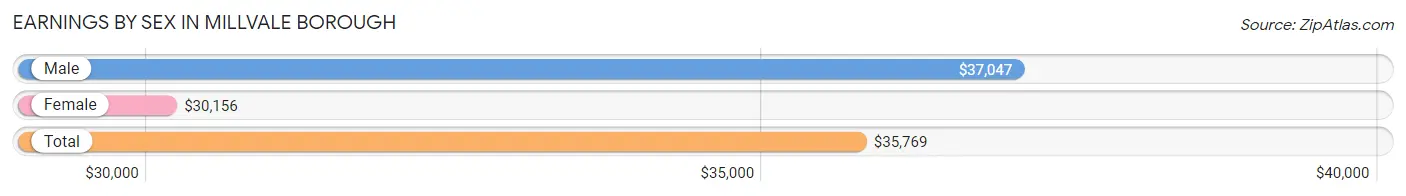
| Sex | Number | Average Earnings |
| Male | 1,202 (53.9%) | $37,047 |
| Female | 1,028 (46.1%) | $30,156 |
| Total | 2,230 (100.0%) | $35,769 |
Earnings by Sex by Income Bracket in Millvale borough
The most common earnings brackets in Millvale borough are $35,000 to $39,999 for men (164 | 13.6%) and $65,000 to $74,999 for women (158 | 15.4%).
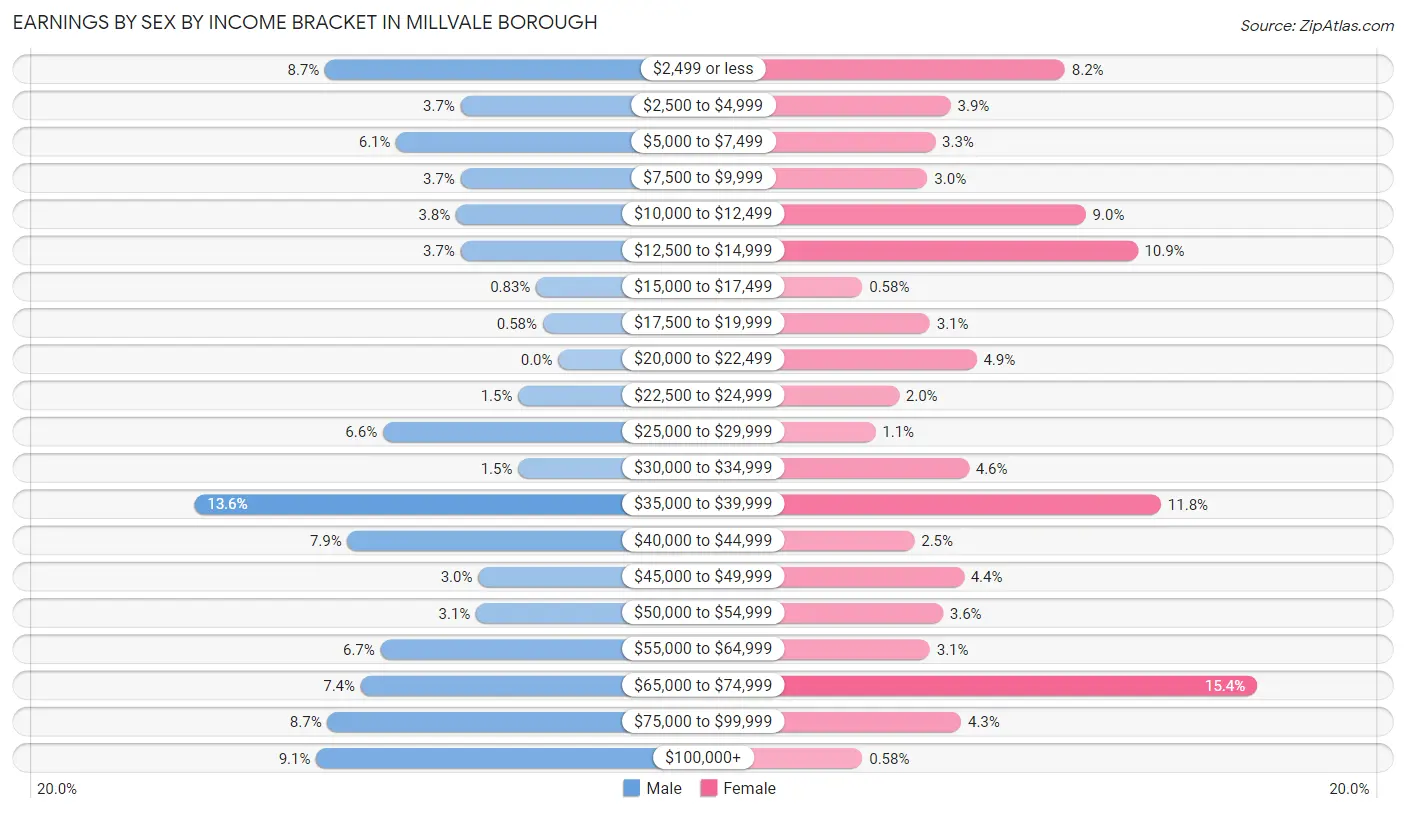
| Income | Male | Female |
| $2,499 or less | 105 (8.7%) | 84 (8.2%) |
| $2,500 to $4,999 | 44 (3.7%) | 40 (3.9%) |
| $5,000 to $7,499 | 73 (6.1%) | 34 (3.3%) |
| $7,500 to $9,999 | 44 (3.7%) | 31 (3.0%) |
| $10,000 to $12,499 | 46 (3.8%) | 92 (8.9%) |
| $12,500 to $14,999 | 44 (3.7%) | 112 (10.9%) |
| $15,000 to $17,499 | 10 (0.8%) | 6 (0.6%) |
| $17,500 to $19,999 | 7 (0.6%) | 32 (3.1%) |
| $20,000 to $22,499 | 0 (0.0%) | 50 (4.9%) |
| $22,500 to $24,999 | 18 (1.5%) | 20 (1.9%) |
| $25,000 to $29,999 | 79 (6.6%) | 11 (1.1%) |
| $30,000 to $34,999 | 18 (1.5%) | 47 (4.6%) |
| $35,000 to $39,999 | 164 (13.6%) | 121 (11.8%) |
| $40,000 to $44,999 | 95 (7.9%) | 26 (2.5%) |
| $45,000 to $49,999 | 36 (3.0%) | 45 (4.4%) |
| $50,000 to $54,999 | 37 (3.1%) | 37 (3.6%) |
| $55,000 to $64,999 | 80 (6.7%) | 32 (3.1%) |
| $65,000 to $74,999 | 89 (7.4%) | 158 (15.4%) |
| $75,000 to $99,999 | 104 (8.6%) | 44 (4.3%) |
| $100,000+ | 109 (9.1%) | 6 (0.6%) |
| Total | 1,202 (100.0%) | 1,028 (100.0%) |
Earnings by Sex by Educational Attainment in Millvale borough
Average earnings in Millvale borough are $42,795 for men and $35,576 for women, a difference of 16.9%. Men with an educational attainment of graduate degree enjoy the highest average annual earnings of $106,328, while those with high school diploma education earn the least with $27,500. Women with an educational attainment of graduate degree earn the most with the average annual earnings of $65,543, while those with less than high school education have the smallest earnings of $11,591.
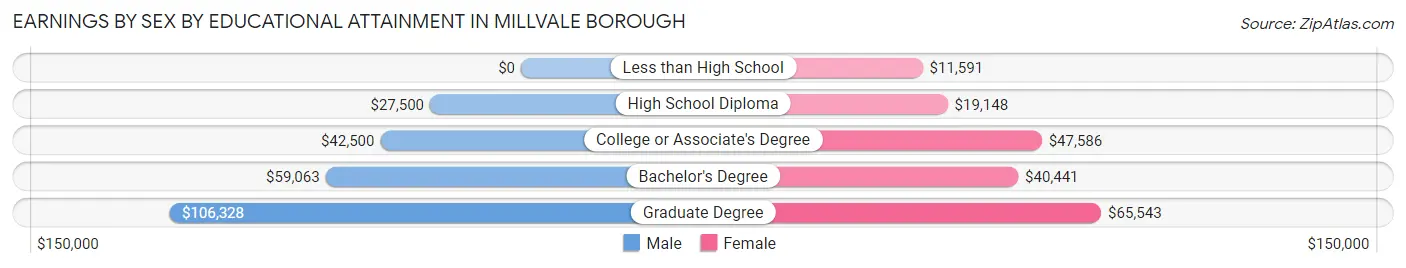
| Educational Attainment | Male Income | Female Income |
| Less than High School | - | - |
| High School Diploma | $27,500 | $19,148 |
| College or Associate's Degree | $42,500 | $47,586 |
| Bachelor's Degree | $59,063 | $40,441 |
| Graduate Degree | $106,328 | $65,543 |
| Total | $42,795 | $35,576 |
Family Income in Millvale borough
Family Income Brackets in Millvale borough
According to the Millvale borough family income data, there are 174 families falling into the $100,000 to $149,999 income range, which is the most common income bracket and makes up 25.3% of all families.
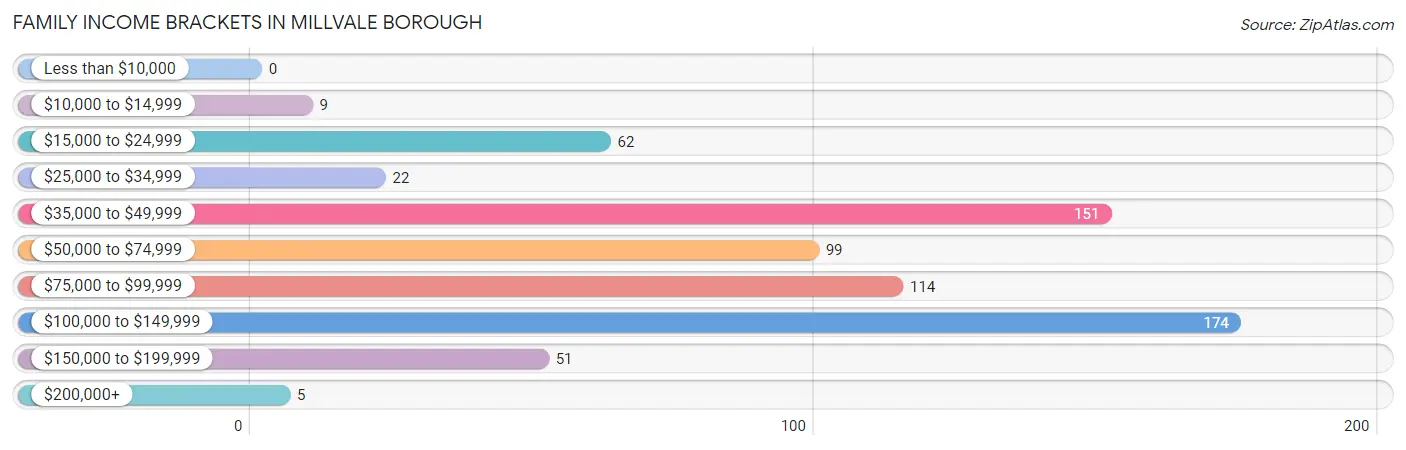
| Income Bracket | # Families | % Families |
| Less than $10,000 | 0 | 0.0% |
| $10,000 to $14,999 | 9 | 1.3% |
| $15,000 to $24,999 | 62 | 9.0% |
| $25,000 to $34,999 | 22 | 3.2% |
| $35,000 to $49,999 | 151 | 22.0% |
| $50,000 to $74,999 | 99 | 14.4% |
| $75,000 to $99,999 | 114 | 16.6% |
| $100,000 to $149,999 | 174 | 25.3% |
| $150,000 to $199,999 | 51 | 7.4% |
| $200,000+ | 5 | 0.7% |
Family Income by Famaliy Size in Millvale borough
4-person families (150 | 21.8%) account for the highest median family income in Millvale borough with $130,343 per family, while 2-person families (281 | 40.9%) have the highest median income of $35,642 per family member.
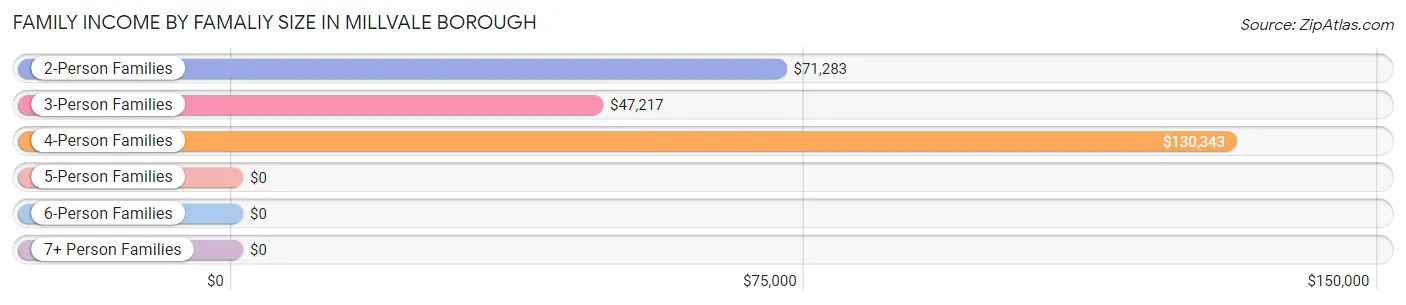
| Income Bracket | # Families | Median Income |
| 2-Person Families | 281 (40.9%) | $71,283 |
| 3-Person Families | 196 (28.5%) | $47,217 |
| 4-Person Families | 150 (21.8%) | $130,343 |
| 5-Person Families | 35 (5.1%) | $0 |
| 6-Person Families | 25 (3.6%) | $0 |
| 7+ Person Families | 0 (0.0%) | $0 |
| Total | 687 (100.0%) | $75,038 |
Family Income by Number of Earners in Millvale borough
The median family income in Millvale borough is $75,038, with families comprising 3+ earners (166) having the highest median family income of $130,686, while families with 1 earner (171) have the lowest median family income of $46,640, accounting for 24.2% and 24.9% of families, respectively.
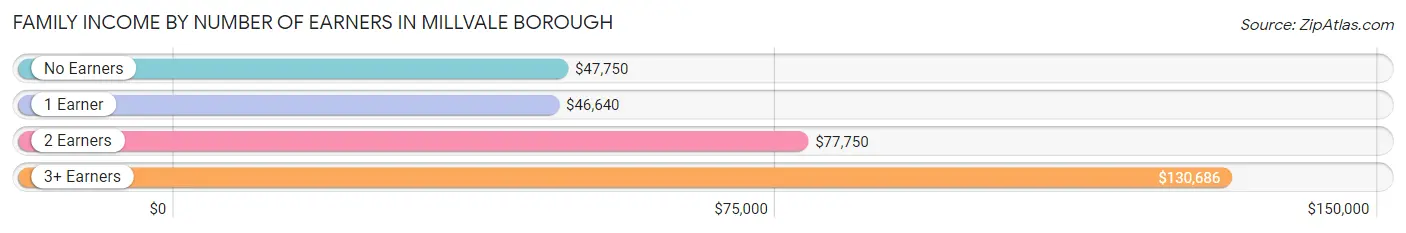
| Number of Earners | # Families | Median Income |
| No Earners | 53 (7.7%) | $47,750 |
| 1 Earner | 171 (24.9%) | $46,640 |
| 2 Earners | 297 (43.2%) | $77,750 |
| 3+ Earners | 166 (24.2%) | $130,686 |
| Total | 687 (100.0%) | $75,038 |
Household Income in Millvale borough
Household Income Brackets in Millvale borough
With 316 households falling in the category, the $50,000 to $74,999 income range is the most frequent in Millvale borough, accounting for 19.4% of all households. In contrast, only 10 households (0.6%) fall into the $200,000+ income bracket, making it the least populous group.
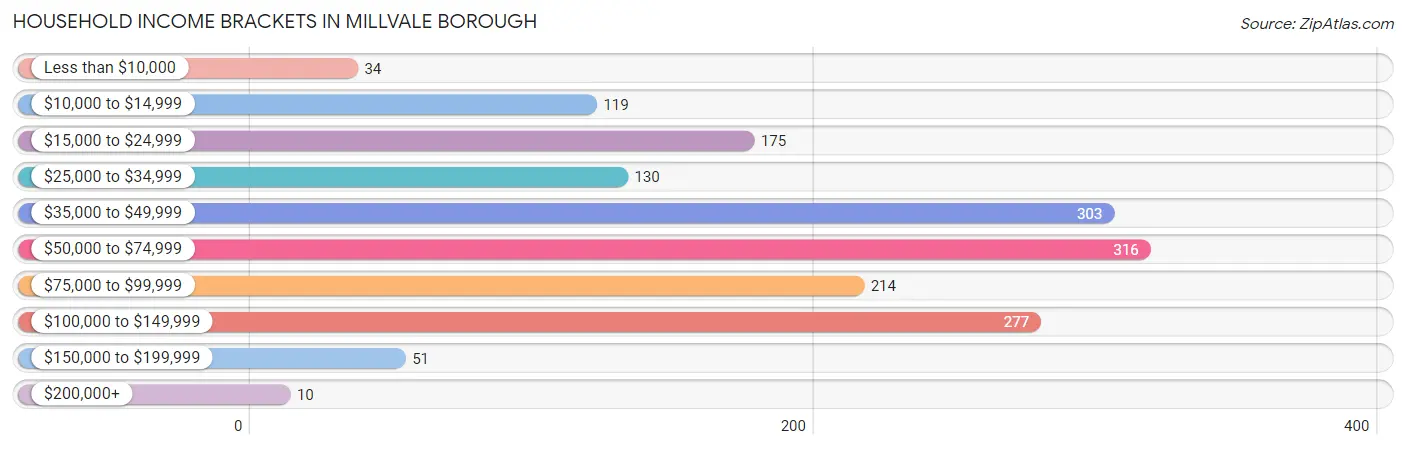
| Income Bracket | # Households | % Households |
| Less than $10,000 | 34 | 2.1% |
| $10,000 to $14,999 | 119 | 7.3% |
| $15,000 to $24,999 | 175 | 10.7% |
| $25,000 to $34,999 | 130 | 8.0% |
| $35,000 to $49,999 | 303 | 18.6% |
| $50,000 to $74,999 | 316 | 19.4% |
| $75,000 to $99,999 | 214 | 13.1% |
| $100,000 to $149,999 | 277 | 17.0% |
| $150,000 to $199,999 | 51 | 3.1% |
| $200,000+ | 10 | 0.6% |
Household Income by Householder Age in Millvale borough
The median household income in Millvale borough is $59,250, with the highest median household income of $67,963 found in the 45 to 64 years age bracket for the primary householder. A total of 768 households (47.1%) fall into this category. Meanwhile, the 15 to 24 years age bracket for the primary householder has the lowest median household income of $0, with 36 households (2.2%) in this group.
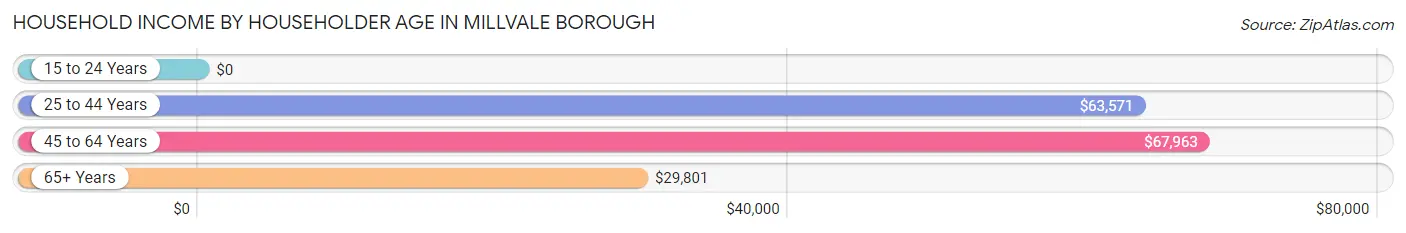
| Income Bracket | # Households | Median Income |
| 15 to 24 Years | 36 (2.2%) | $0 |
| 25 to 44 Years | 468 (28.7%) | $63,571 |
| 45 to 64 Years | 768 (47.1%) | $67,963 |
| 65+ Years | 359 (22.0%) | $29,801 |
| Total | 1,631 (100.0%) | $59,250 |
Poverty in Millvale borough
Income Below Poverty by Sex and Age in Millvale borough
With 12.6% poverty level for males and 15.0% for females among the residents of Millvale borough, 12 to 14 year old males and 75 year old and over females are the most vulnerable to poverty, with 9 males (100.0%) and 43 females (40.6%) in their respective age groups living below the poverty level.
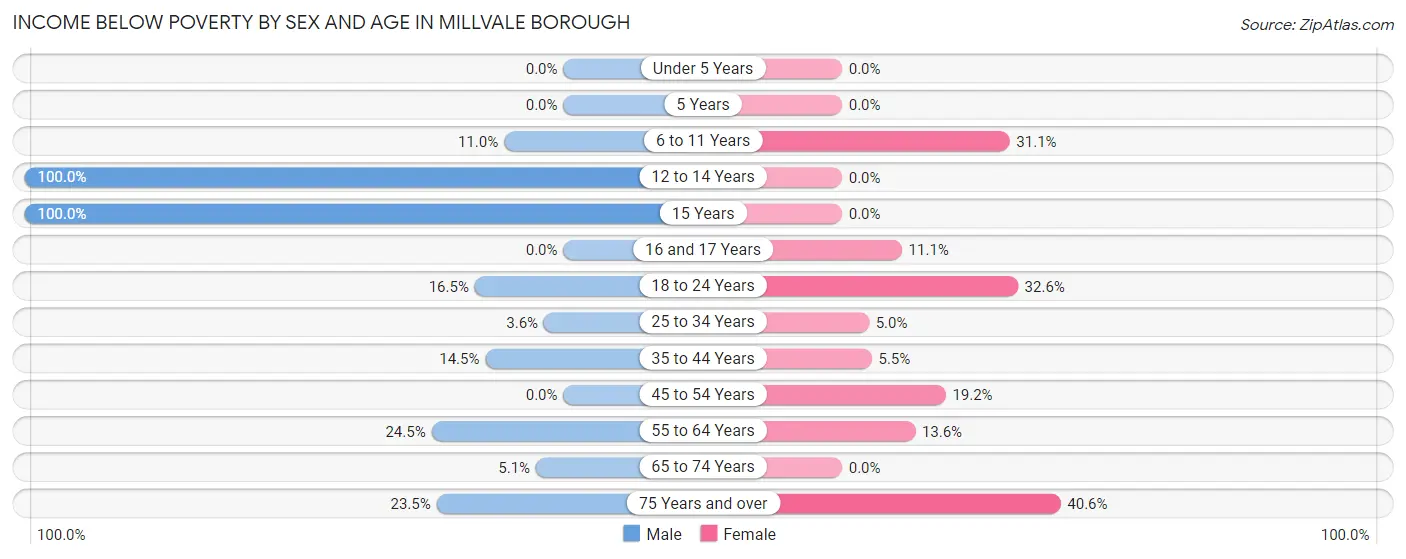
| Age Bracket | Male | Female |
| Under 5 Years | 0 (0.0%) | 0 (0.0%) |
| 5 Years | 0 (0.0%) | 0 (0.0%) |
| 6 to 11 Years | 13 (11.0%) | 28 (31.1%) |
| 12 to 14 Years | 9 (100.0%) | 0 (0.0%) |
| 15 Years | 13 (100.0%) | 0 (0.0%) |
| 16 and 17 Years | 0 (0.0%) | 10 (11.1%) |
| 18 to 24 Years | 38 (16.5%) | 63 (32.6%) |
| 25 to 34 Years | 8 (3.6%) | 9 (5.0%) |
| 35 to 44 Years | 41 (14.5%) | 9 (5.5%) |
| 45 to 54 Years | 0 (0.0%) | 56 (19.2%) |
| 55 to 64 Years | 71 (24.5%) | 36 (13.6%) |
| 65 to 74 Years | 11 (5.1%) | 0 (0.0%) |
| 75 Years and over | 8 (23.5%) | 43 (40.6%) |
| Total | 212 (12.6%) | 254 (15.0%) |
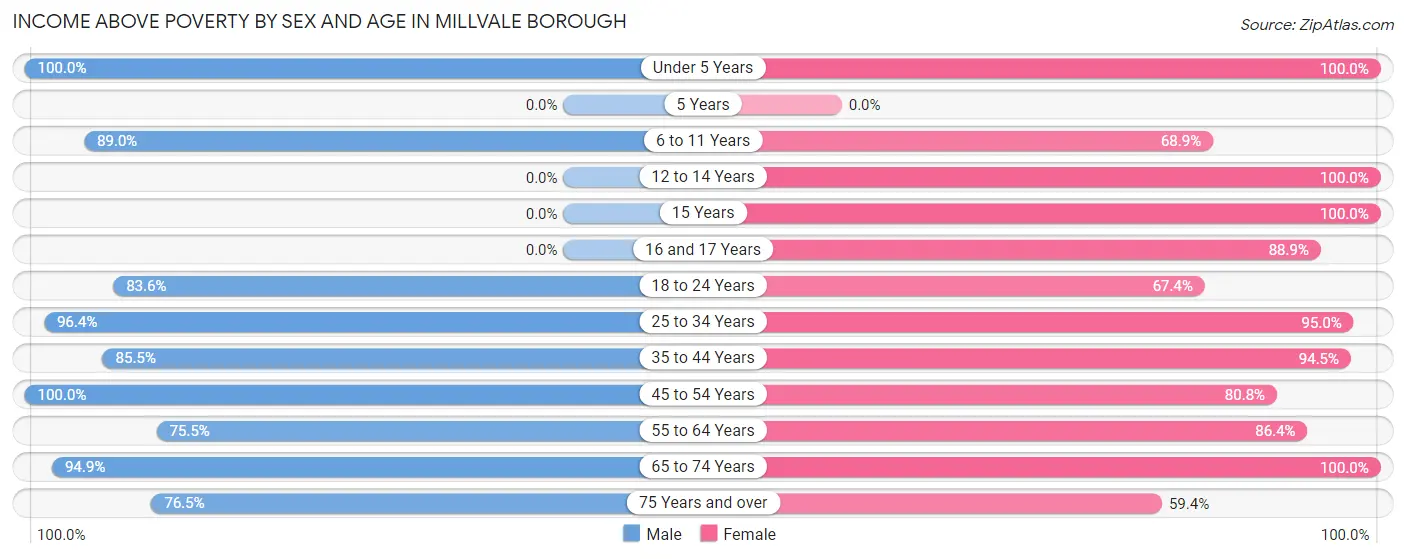
Income Above Poverty by Sex and Age in Millvale borough
According to the poverty statistics in Millvale borough, males aged under 5 years and females aged under 5 years are the age groups that are most secure financially, with 100.0% of males and 100.0% of females in these age groups living above the poverty line.
| Age Bracket | Male | Female |
| Under 5 Years | 17 (100.0%) | 8 (100.0%) |
| 5 Years | 0 (0.0%) | 0 (0.0%) |
| 6 to 11 Years | 105 (89.0%) | 62 (68.9%) |
| 12 to 14 Years | 0 (0.0%) | 36 (100.0%) |
| 15 Years | 0 (0.0%) | 111 (100.0%) |
| 16 and 17 Years | 0 (0.0%) | 80 (88.9%) |
| 18 to 24 Years | 193 (83.6%) | 130 (67.4%) |
| 25 to 34 Years | 214 (96.4%) | 171 (95.0%) |
| 35 to 44 Years | 242 (85.5%) | 154 (94.5%) |
| 45 to 54 Years | 254 (100.0%) | 235 (80.8%) |
| 55 to 64 Years | 219 (75.5%) | 229 (86.4%) |
| 65 to 74 Years | 205 (94.9%) | 157 (100.0%) |
| 75 Years and over | 26 (76.5%) | 63 (59.4%) |
| Total | 1,475 (87.4%) | 1,436 (85.0%) |
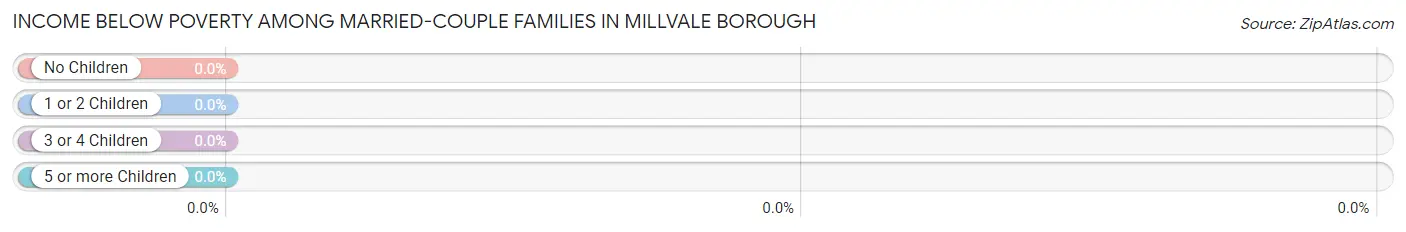
Income Below Poverty Among Married-Couple Families in Millvale borough
| Children | Above Poverty | Below Poverty |
| No Children | 196 (100.0%) | 0 (0.0%) |
| 1 or 2 Children | 167 (100.0%) | 0 (0.0%) |
| 3 or 4 Children | 12 (100.0%) | 0 (0.0%) |
| 5 or more Children | 0 (0.0%) | 0 (0.0%) |
| Total | 375 (100.0%) | 0 (0.0%) |
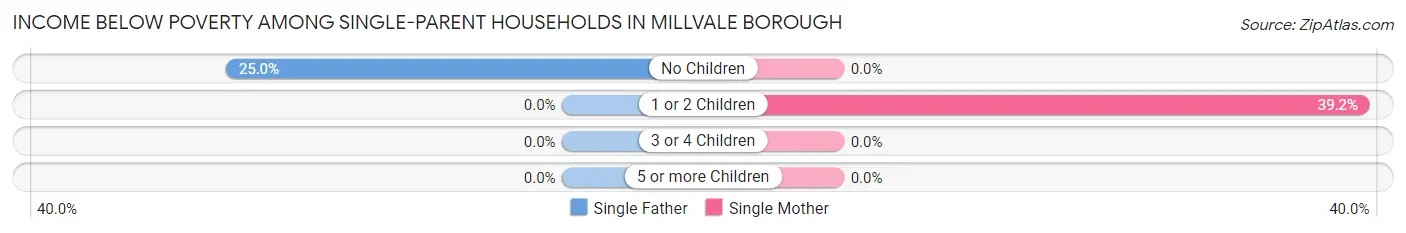
Income Below Poverty Among Single-Parent Households in Millvale borough
According to the poverty data in Millvale borough, 17.2% or 11 single-father households and 19.8% or 49 single-mother households are living below the poverty line. Among single-father households, those with no children have the highest poverty rate, with 11 households (25.0%) experiencing poverty. Likewise, among single-mother households, those with 1 or 2 children have the highest poverty rate, with 49 households (39.2%) falling below the poverty line.
| Children | Single Father | Single Mother |
| No Children | 11 (25.0%) | 0 (0.0%) |
| 1 or 2 Children | 0 (0.0%) | 49 (39.2%) |
| 3 or 4 Children | 0 (0.0%) | 0 (0.0%) |
| 5 or more Children | 0 (0.0%) | 0 (0.0%) |
| Total | 11 (17.2%) | 49 (19.8%) |
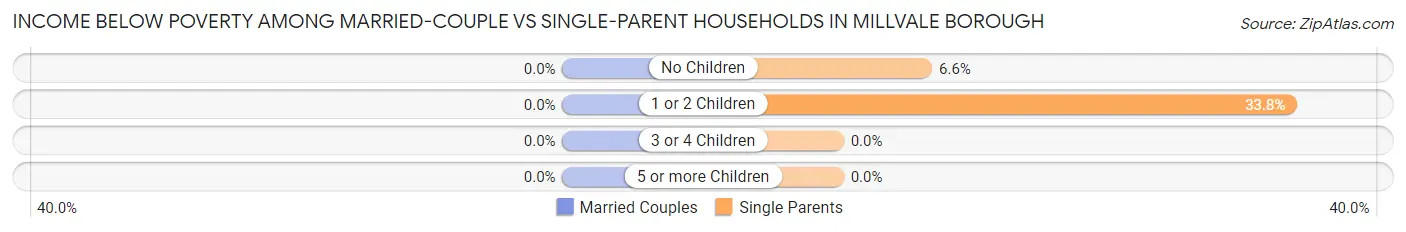
Income Below Poverty Among Married-Couple vs Single-Parent Households in Millvale borough
| Children | Married-Couple Families | Single-Parent Households |
| No Children | 0 (0.0%) | 11 (6.6%) |
| 1 or 2 Children | 0 (0.0%) | 49 (33.8%) |
| 3 or 4 Children | 0 (0.0%) | 0 (0.0%) |
| 5 or more Children | 0 (0.0%) | 0 (0.0%) |
| Total | 0 (0.0%) | 60 (19.2%) |
Employment Characteristics in Millvale borough
Employment by Class of Employer in Millvale borough
Among the 2,005 employed individuals in Millvale borough, private company employees (1,332 | 66.4%), not-for-profit organizations (342 | 17.1%), and local government employees (148 | 7.4%) make up the most common classes of employment.
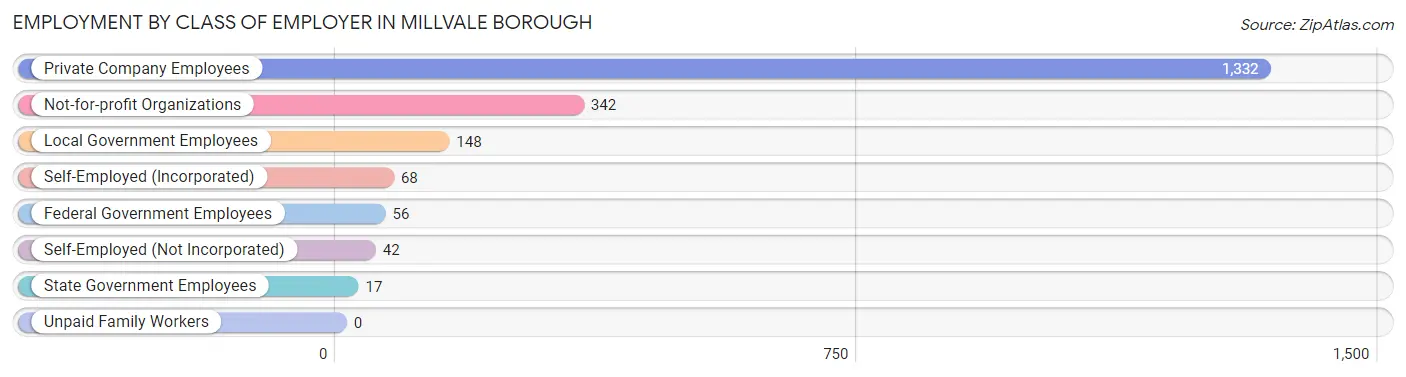
| Employer Class | # Employees | % Employees |
| Private Company Employees | 1,332 | 66.4% |
| Self-Employed (Incorporated) | 68 | 3.4% |
| Self-Employed (Not Incorporated) | 42 | 2.1% |
| Not-for-profit Organizations | 342 | 17.1% |
| Local Government Employees | 148 | 7.4% |
| State Government Employees | 17 | 0.9% |
| Federal Government Employees | 56 | 2.8% |
| Unpaid Family Workers | 0 | 0.0% |
| Total | 2,005 | 100.0% |
Employment Status by Age in Millvale borough
According to the labor force statistics for Millvale borough, out of the total population over 16 years of age (2,975), 71.8% or 2,136 individuals are in the labor force, with 5.2% or 111 of them unemployed. The age group with the highest labor force participation rate is 30 to 34 years, with 91.6% or 218 individuals in the labor force. Within the labor force, the 75 years and over age range has the highest percentage of unemployed individuals, with 100.0% or 10 of them being unemployed.
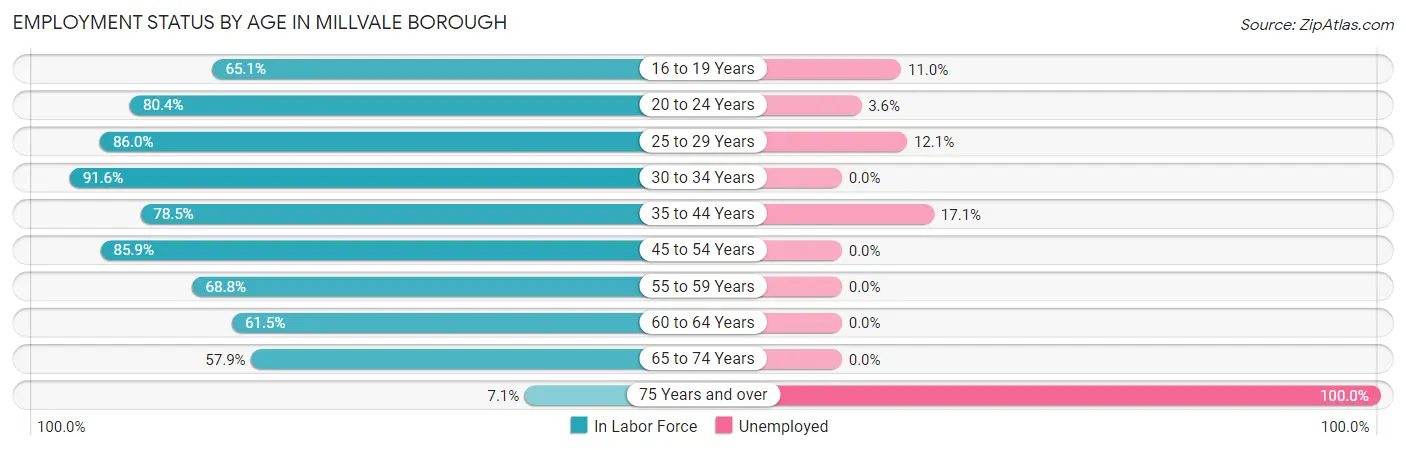
| Age Bracket | In Labor Force | Unemployed |
| 16 to 19 Years | 155 (65.1%) | 17 (11.0%) |
| 20 to 24 Years | 222 (80.4%) | 8 (3.6%) |
| 25 to 29 Years | 141 (86.0%) | 17 (12.1%) |
| 30 to 34 Years | 218 (91.6%) | 0 (0.0%) |
| 35 to 44 Years | 350 (78.5%) | 60 (17.1%) |
| 45 to 54 Years | 468 (85.9%) | 0 (0.0%) |
| 55 to 59 Years | 128 (68.8%) | 0 (0.0%) |
| 60 to 64 Years | 227 (61.5%) | 0 (0.0%) |
| 65 to 74 Years | 216 (57.9%) | 0 (0.0%) |
| 75 Years and over | 10 (7.1%) | 10 (100.0%) |
| Total | 2,136 (71.8%) | 111 (5.2%) |
Employment Status by Educational Attainment in Millvale borough
According to labor force statistics for Millvale borough, 78.6% of individuals (1,531) out of the total population between 25 and 64 years of age (1,948) are in the labor force, with 5.0% or 77 of them being unemployed. The group with the highest labor force participation rate are those with the educational attainment of bachelor's degree or higher, with 93.9% or 540 individuals in the labor force. Within the labor force, individuals with high school diploma education have the highest percentage of unemployment, with 16.1% or 60 of them being unemployed.
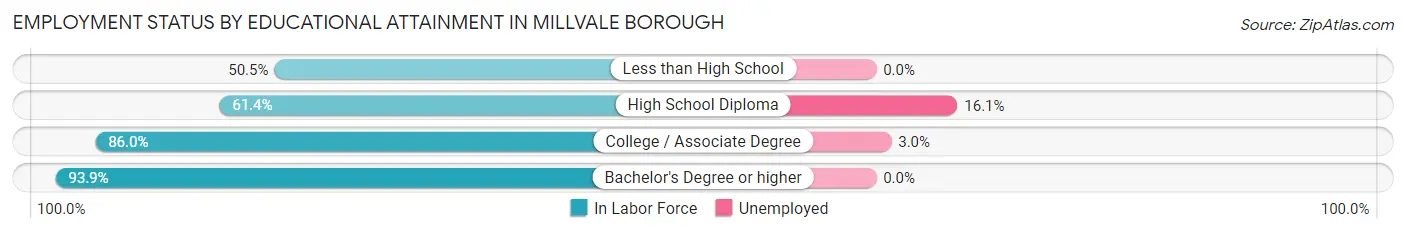
| Educational Attainment | In Labor Force | Unemployed |
| Less than High School | 56 (50.5%) | 0 (0.0%) |
| High School Diploma | 372 (61.4%) | 98 (16.1%) |
| College / Associate Degree | 564 (86.0%) | 20 (3.0%) |
| Bachelor's Degree or higher | 540 (93.9%) | 0 (0.0%) |
| Total | 1,531 (78.6%) | 97 (5.0%) |
Employment Occupations by Sex in Millvale borough
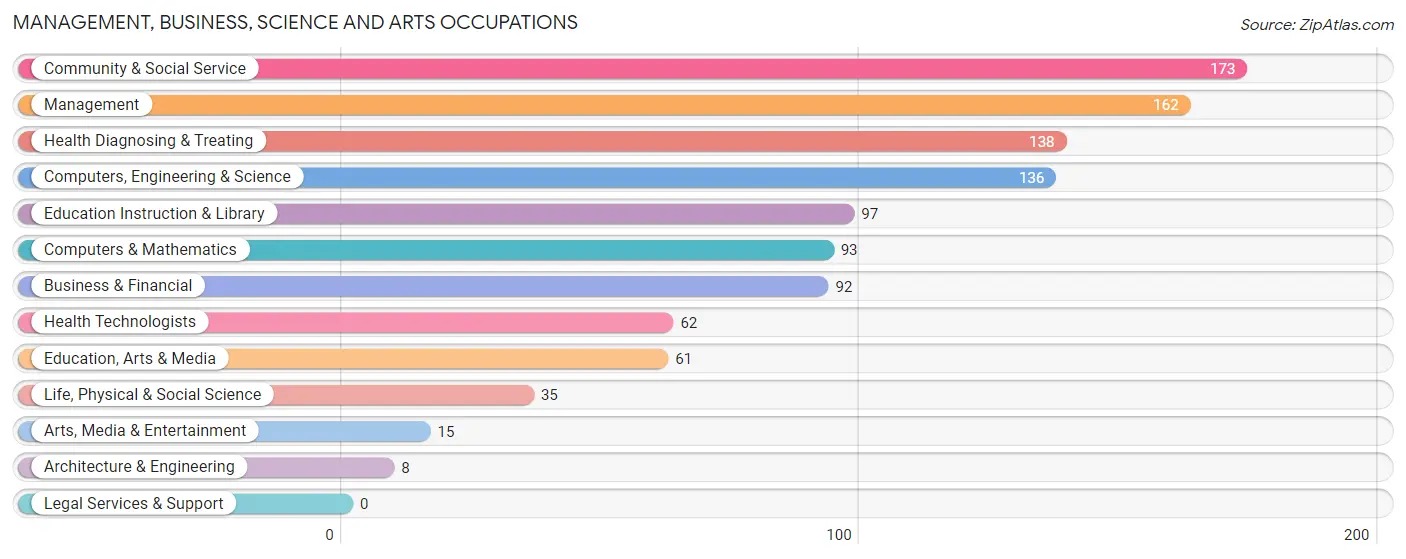
Management, Business, Science and Arts Occupations
The most common Management, Business, Science and Arts occupations in Millvale borough are Community & Social Service (173 | 8.6%), Management (162 | 8.0%), Health Diagnosing & Treating (138 | 6.8%), Computers, Engineering & Science (136 | 6.7%), and Education Instruction & Library (97 | 4.8%).
Management, Business, Science and Arts Occupations by Sex
Within the Management, Business, Science and Arts occupations in Millvale borough, the most male-oriented occupations are Computers & Mathematics (100.0%), Architecture & Engineering (100.0%), and Computers, Engineering & Science (86.0%), while the most female-oriented occupations are Education, Arts & Media (100.0%), Arts, Media & Entertainment (100.0%), and Health Technologists (100.0%).
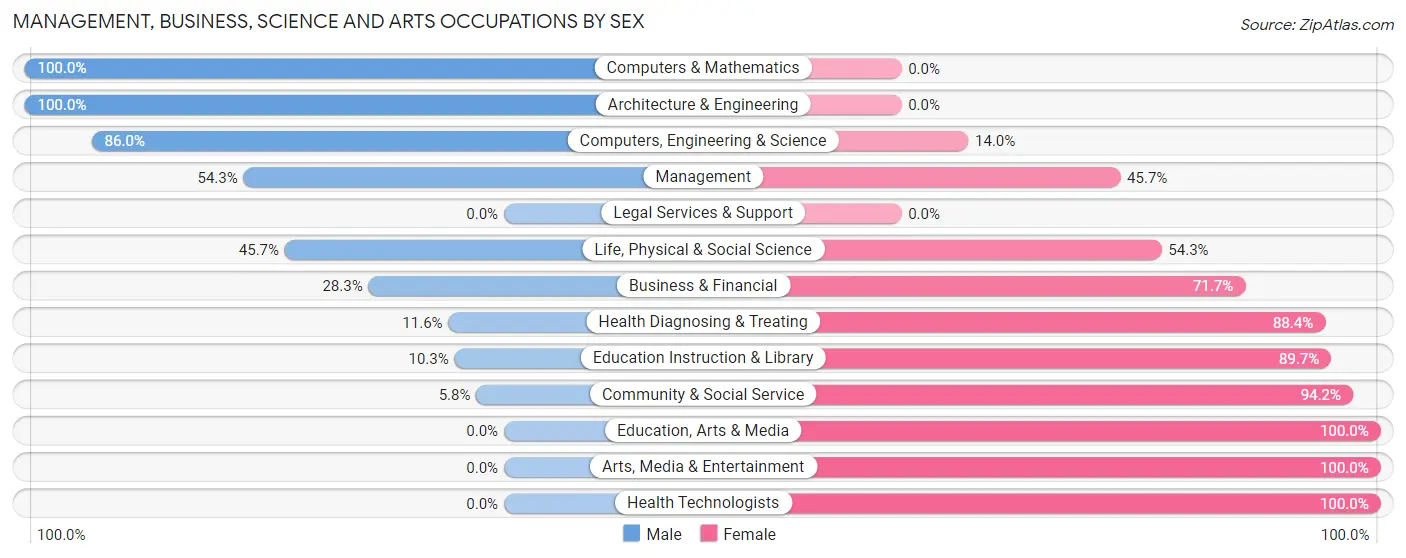
| Occupation | Male | Female |
| Management | 88 (54.3%) | 74 (45.7%) |
| Business & Financial | 26 (28.3%) | 66 (71.7%) |
| Computers, Engineering & Science | 117 (86.0%) | 19 (14.0%) |
| Computers & Mathematics | 93 (100.0%) | 0 (0.0%) |
| Architecture & Engineering | 8 (100.0%) | 0 (0.0%) |
| Life, Physical & Social Science | 16 (45.7%) | 19 (54.3%) |
| Community & Social Service | 10 (5.8%) | 163 (94.2%) |
| Education, Arts & Media | 0 (0.0%) | 61 (100.0%) |
| Legal Services & Support | 0 (0.0%) | 0 (0.0%) |
| Education Instruction & Library | 10 (10.3%) | 87 (89.7%) |
| Arts, Media & Entertainment | 0 (0.0%) | 15 (100.0%) |
| Health Diagnosing & Treating | 16 (11.6%) | 122 (88.4%) |
| Health Technologists | 0 (0.0%) | 62 (100.0%) |
| Total (Category) | 257 (36.7%) | 444 (63.3%) |
| Total (Overall) | 1,057 (52.2%) | 966 (47.7%) |
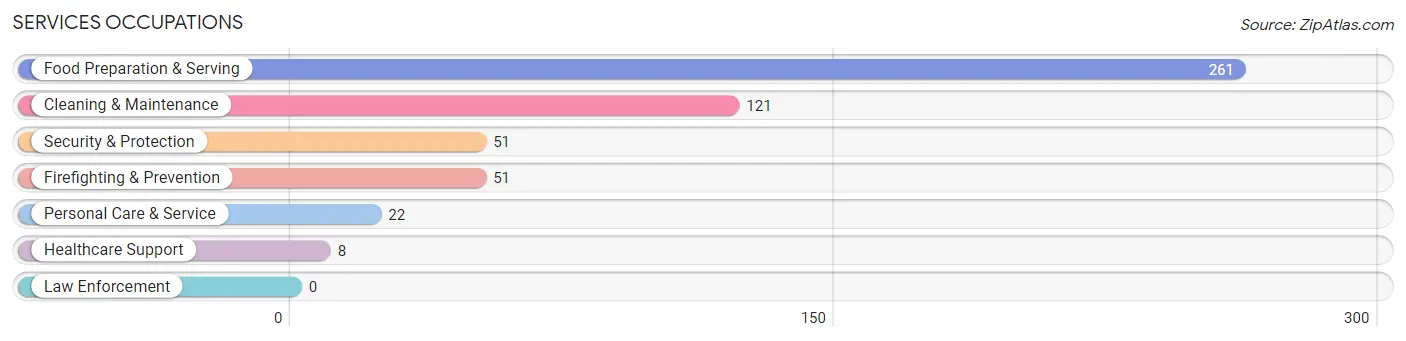
Services Occupations
The most common Services occupations in Millvale borough are Food Preparation & Serving (261 | 12.9%), Cleaning & Maintenance (121 | 6.0%), Security & Protection (51 | 2.5%), Firefighting & Prevention (51 | 2.5%), and Personal Care & Service (22 | 1.1%).
Services Occupations by Sex
Within the Services occupations in Millvale borough, the most male-oriented occupations are Cleaning & Maintenance (82.6%), Security & Protection (54.9%), and Firefighting & Prevention (54.9%), while the most female-oriented occupations are Healthcare Support (100.0%), Personal Care & Service (100.0%), and Food Preparation & Serving (71.7%).
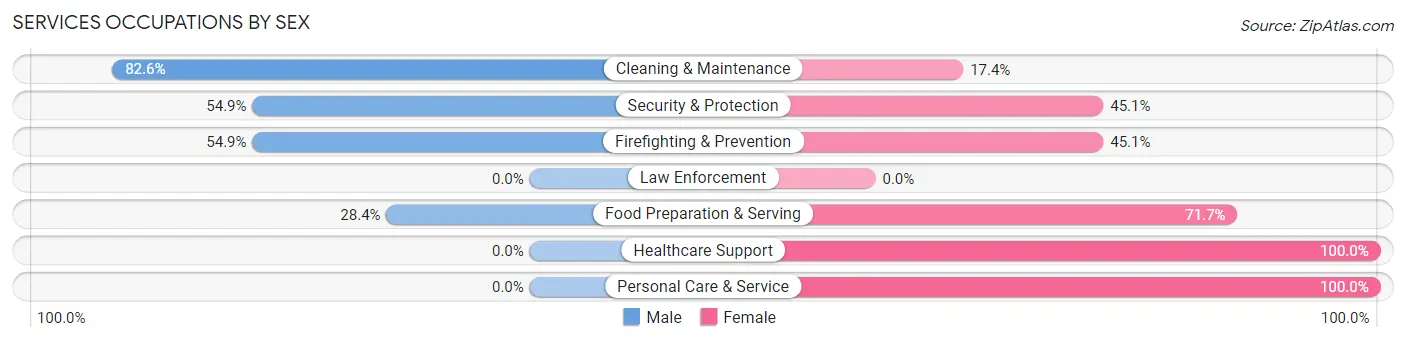
| Occupation | Male | Female |
| Healthcare Support | 0 (0.0%) | 8 (100.0%) |
| Security & Protection | 28 (54.9%) | 23 (45.1%) |
| Firefighting & Prevention | 28 (54.9%) | 23 (45.1%) |
| Law Enforcement | 0 (0.0%) | 0 (0.0%) |
| Food Preparation & Serving | 74 (28.3%) | 187 (71.7%) |
| Cleaning & Maintenance | 100 (82.6%) | 21 (17.4%) |
| Personal Care & Service | 0 (0.0%) | 22 (100.0%) |
| Total (Category) | 202 (43.6%) | 261 (56.4%) |
| Total (Overall) | 1,057 (52.2%) | 966 (47.7%) |
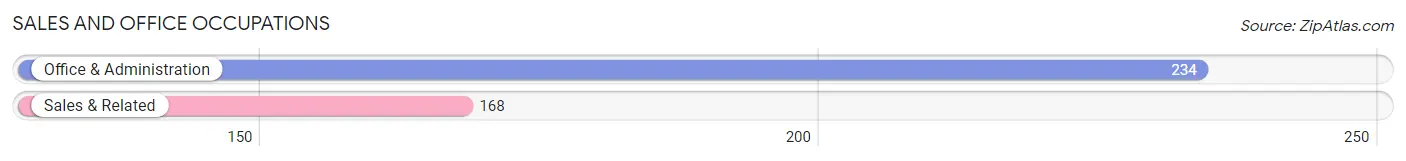
Sales and Office Occupations
The most common Sales and Office occupations in Millvale borough are Office & Administration (234 | 11.6%), and Sales & Related (168 | 8.3%).
Sales and Office Occupations by Sex
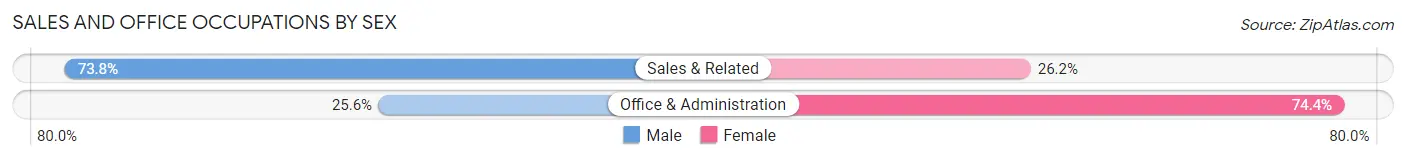
| Occupation | Male | Female |
| Sales & Related | 124 (73.8%) | 44 (26.2%) |
| Office & Administration | 60 (25.6%) | 174 (74.4%) |
| Total (Category) | 184 (45.8%) | 218 (54.2%) |
| Total (Overall) | 1,057 (52.2%) | 966 (47.7%) |
Natural Resources, Construction and Maintenance Occupations
The most common Natural Resources, Construction and Maintenance occupations in Millvale borough are Construction & Extraction (64 | 3.2%), and Installation, Maintenance & Repair (45 | 2.2%).

Natural Resources, Construction and Maintenance Occupations by Sex

| Occupation | Male | Female |
| Farming, Fishing & Forestry | 0 (0.0%) | 0 (0.0%) |
| Construction & Extraction | 57 (89.1%) | 7 (10.9%) |
| Installation, Maintenance & Repair | 45 (100.0%) | 0 (0.0%) |
| Total (Category) | 102 (93.6%) | 7 (6.4%) |
| Total (Overall) | 1,057 (52.2%) | 966 (47.7%) |
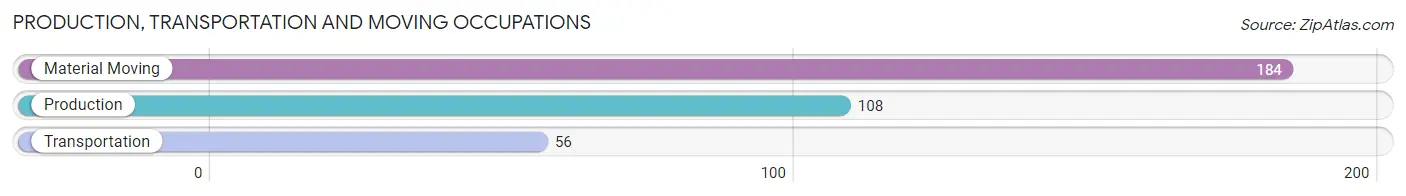
Production, Transportation and Moving Occupations
The most common Production, Transportation and Moving occupations in Millvale borough are Material Moving (184 | 9.1%), Production (108 | 5.3%), and Transportation (56 | 2.8%).
Production, Transportation and Moving Occupations by Sex
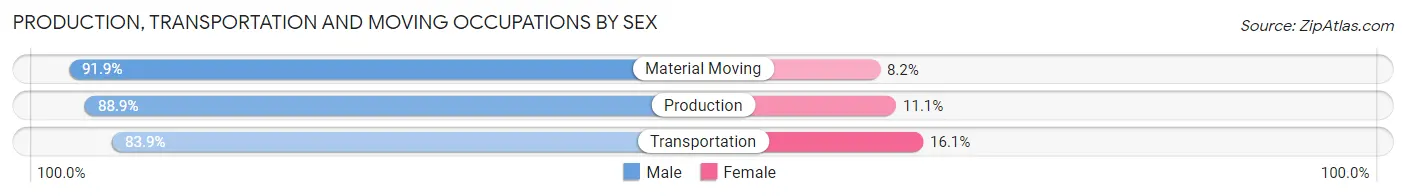
| Occupation | Male | Female |
| Production | 96 (88.9%) | 12 (11.1%) |
| Transportation | 47 (83.9%) | 9 (16.1%) |
| Material Moving | 169 (91.8%) | 15 (8.2%) |
| Total (Category) | 312 (89.7%) | 36 (10.3%) |
| Total (Overall) | 1,057 (52.2%) | 966 (47.7%) |
Employment Industries by Sex in Millvale borough
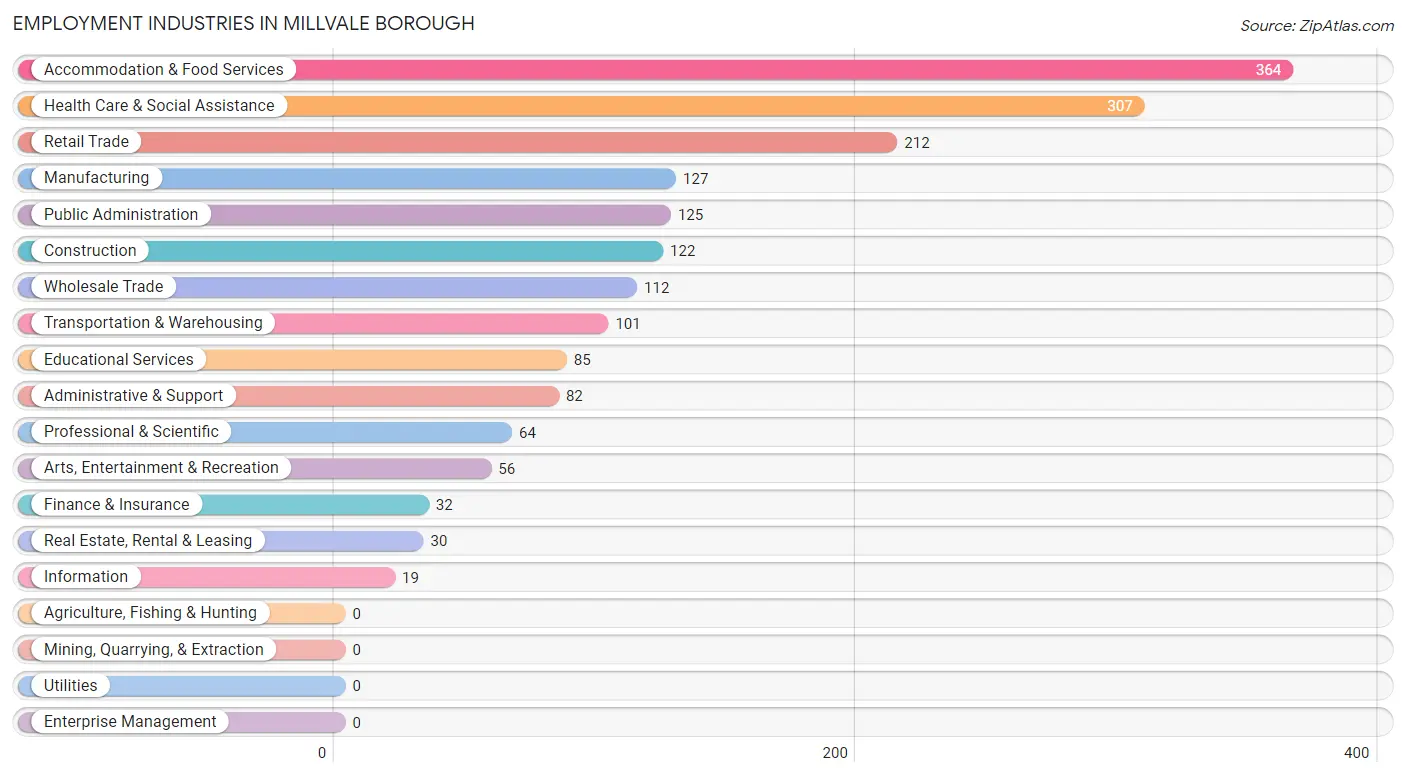
Employment Industries in Millvale borough
The major employment industries in Millvale borough include Accommodation & Food Services (364 | 18.0%), Health Care & Social Assistance (307 | 15.2%), Retail Trade (212 | 10.5%), Manufacturing (127 | 6.3%), and Public Administration (125 | 6.2%).
Employment Industries by Sex in Millvale borough
The Millvale borough industries that see more men than women are Administrative & Support (89.0%), Transportation & Warehousing (84.2%), and Manufacturing (83.5%), whereas the industries that tend to have a higher number of women are Information (100.0%), Health Care & Social Assistance (80.1%), and Educational Services (69.4%).
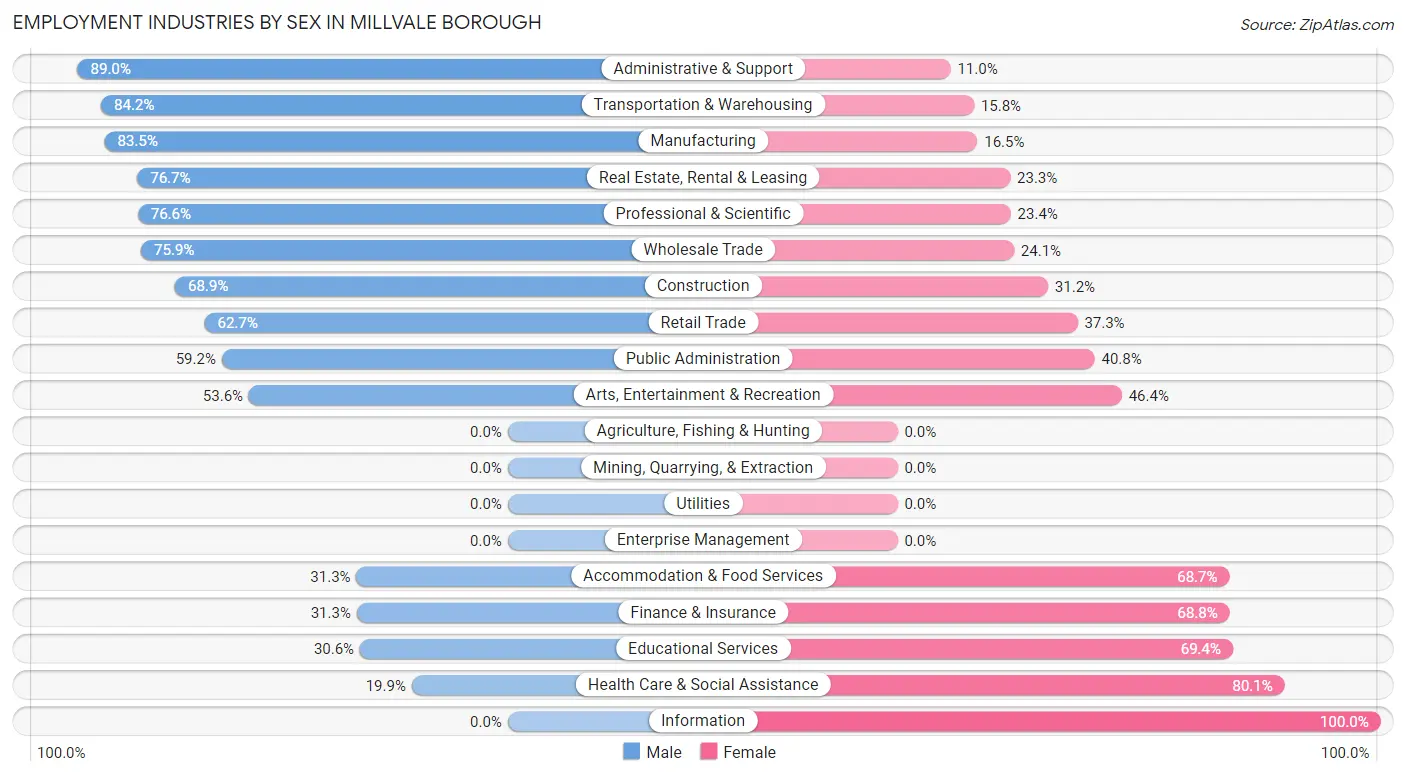
| Industry | Male | Female |
| Agriculture, Fishing & Hunting | 0 (0.0%) | 0 (0.0%) |
| Mining, Quarrying, & Extraction | 0 (0.0%) | 0 (0.0%) |
| Construction | 84 (68.9%) | 38 (31.1%) |
| Manufacturing | 106 (83.5%) | 21 (16.5%) |
| Wholesale Trade | 85 (75.9%) | 27 (24.1%) |
| Retail Trade | 133 (62.7%) | 79 (37.3%) |
| Transportation & Warehousing | 85 (84.2%) | 16 (15.8%) |
| Utilities | 0 (0.0%) | 0 (0.0%) |
| Information | 0 (0.0%) | 19 (100.0%) |
| Finance & Insurance | 10 (31.2%) | 22 (68.8%) |
| Real Estate, Rental & Leasing | 23 (76.7%) | 7 (23.3%) |
| Professional & Scientific | 49 (76.6%) | 15 (23.4%) |
| Enterprise Management | 0 (0.0%) | 0 (0.0%) |
| Administrative & Support | 73 (89.0%) | 9 (11.0%) |
| Educational Services | 26 (30.6%) | 59 (69.4%) |
| Health Care & Social Assistance | 61 (19.9%) | 246 (80.1%) |
| Arts, Entertainment & Recreation | 30 (53.6%) | 26 (46.4%) |
| Accommodation & Food Services | 114 (31.3%) | 250 (68.7%) |
| Public Administration | 74 (59.2%) | 51 (40.8%) |
| Total | 1,057 (52.2%) | 966 (47.7%) |
Education in Millvale borough
School Enrollment in Millvale borough
The most common levels of schooling among the 721 students in Millvale borough are high school (249 | 34.5%), elementary school (152 | 21.1%), and college / undergraduate (148 | 20.5%).
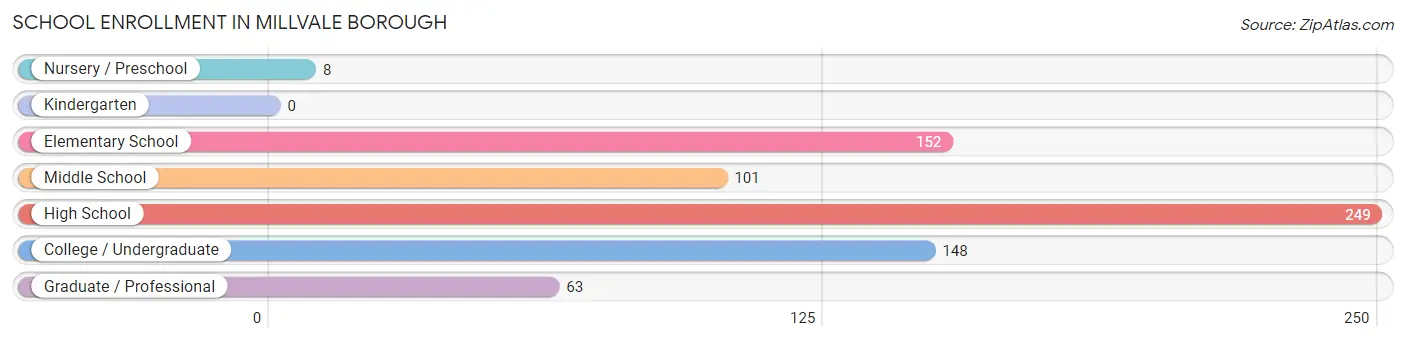
| School Level | # Students | % Students |
| Nursery / Preschool | 8 | 1.1% |
| Kindergarten | 0 | 0.0% |
| Elementary School | 152 | 21.1% |
| Middle School | 101 | 14.0% |
| High School | 249 | 34.5% |
| College / Undergraduate | 148 | 20.5% |
| Graduate / Professional | 63 | 8.7% |
| Total | 721 | 100.0% |
School Enrollment by Age by Funding Source in Millvale borough
Out of a total of 721 students who are enrolled in schools in Millvale borough, 134 (18.6%) attend a private institution, while the remaining 587 (81.4%) are enrolled in public schools. The age group of 3 to 4 year olds has the highest likelihood of being enrolled in private schools, with 8 (100.0% in the age bracket) enrolled. Conversely, the age group of 5 to 9 year old has the lowest likelihood of being enrolled in a private school, with 112 (100.0% in the age bracket) attending a public institution.
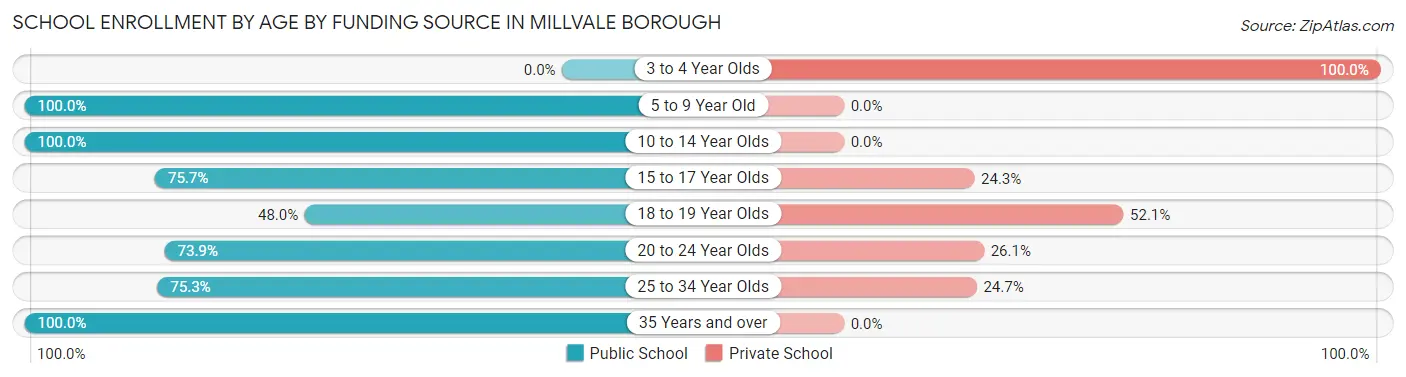
| Age Bracket | Public School | Private School |
| 3 to 4 Year Olds | 0 (0.0%) | 8 (100.0%) |
| 5 to 9 Year Old | 112 (100.0%) | 0 (0.0%) |
| 10 to 14 Year Olds | 141 (100.0%) | 0 (0.0%) |
| 15 to 17 Year Olds | 162 (75.7%) | 52 (24.3%) |
| 18 to 19 Year Olds | 35 (47.9%) | 38 (52.0%) |
| 20 to 24 Year Olds | 34 (73.9%) | 12 (26.1%) |
| 25 to 34 Year Olds | 73 (75.3%) | 24 (24.7%) |
| 35 Years and over | 30 (100.0%) | 0 (0.0%) |
| Total | 587 (81.4%) | 134 (18.6%) |
Educational Attainment by Field of Study in Millvale borough
Business (178 | 25.4%), social sciences (72 | 10.3%), bio, nature & agricultural (69 | 9.8%), science & technology (69 | 9.8%), and education (49 | 7.0%) are the most common fields of study among 701 individuals in Millvale borough who have obtained a bachelor's degree or higher.
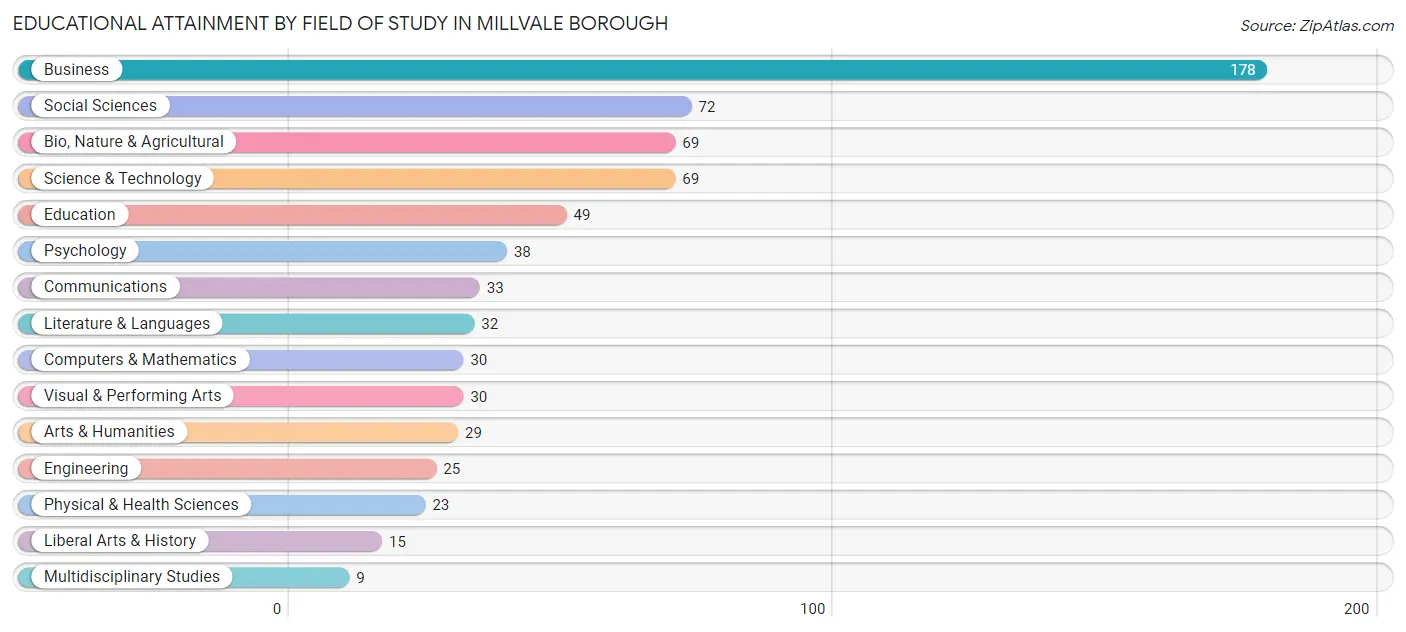
| Field of Study | # Graduates | % Graduates |
| Computers & Mathematics | 30 | 4.3% |
| Bio, Nature & Agricultural | 69 | 9.8% |
| Physical & Health Sciences | 23 | 3.3% |
| Psychology | 38 | 5.4% |
| Social Sciences | 72 | 10.3% |
| Engineering | 25 | 3.6% |
| Multidisciplinary Studies | 9 | 1.3% |
| Science & Technology | 69 | 9.8% |
| Business | 178 | 25.4% |
| Education | 49 | 7.0% |
| Literature & Languages | 32 | 4.6% |
| Liberal Arts & History | 15 | 2.1% |
| Visual & Performing Arts | 30 | 4.3% |
| Communications | 33 | 4.7% |
| Arts & Humanities | 29 | 4.1% |
| Total | 701 | 100.0% |
Transportation & Commute in Millvale borough
Vehicle Availability by Sex in Millvale borough
The most prevalent vehicle ownership categories in Millvale borough are males with 1 vehicle (412, accounting for 39.0%) and females with 1 vehicle (368, making up 44.4%).
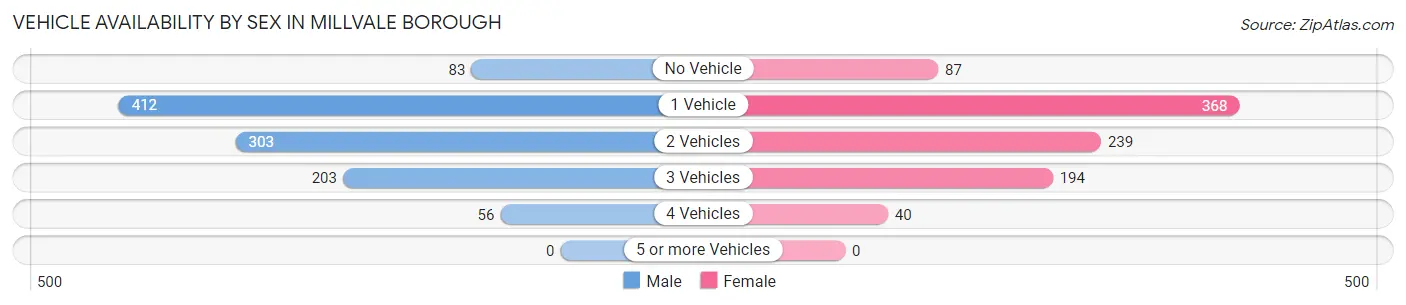
| Vehicles Available | Male | Female |
| No Vehicle | 83 (7.9%) | 87 (9.4%) |
| 1 Vehicle | 412 (39.0%) | 368 (39.7%) |
| 2 Vehicles | 303 (28.7%) | 239 (25.8%) |
| 3 Vehicles | 203 (19.2%) | 194 (20.9%) |
| 4 Vehicles | 56 (5.3%) | 40 (4.3%) |
| 5 or more Vehicles | 0 (0.0%) | 0 (0.0%) |
| Total | 1,057 (100.0%) | 928 (100.0%) |
Commute Time in Millvale borough
The most frequently occuring commute durations in Millvale borough are 15 to 19 minutes (483 commuters, 25.9%), 10 to 14 minutes (393 commuters, 21.0%), and 20 to 24 minutes (231 commuters, 12.4%).
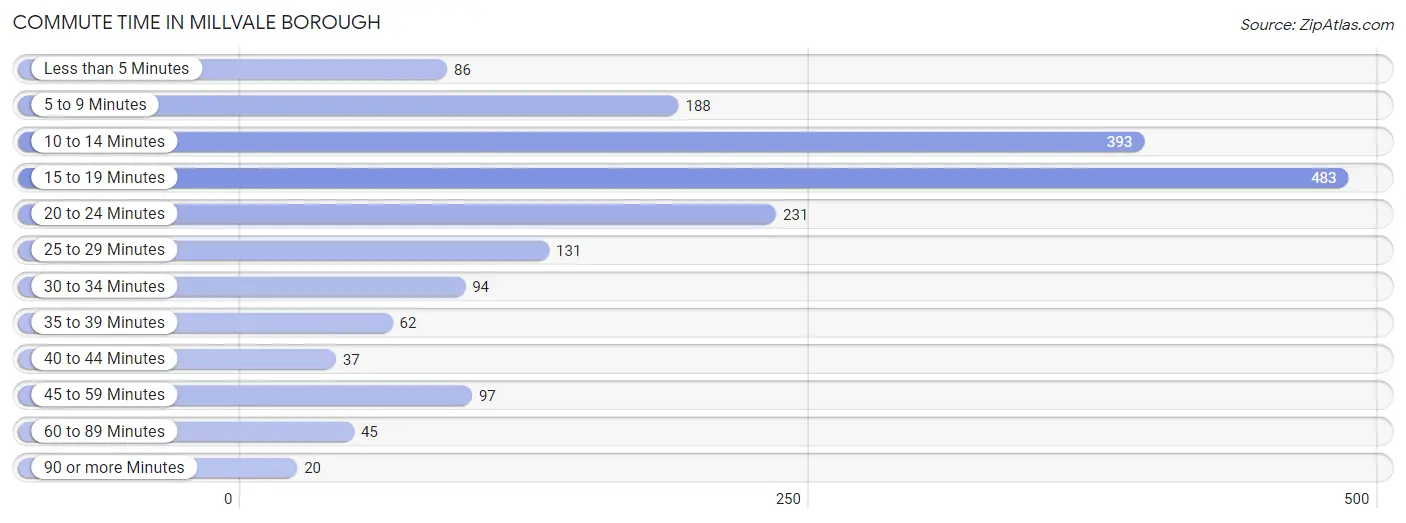
| Commute Time | # Commuters | % Commuters |
| Less than 5 Minutes | 86 | 4.6% |
| 5 to 9 Minutes | 188 | 10.1% |
| 10 to 14 Minutes | 393 | 21.0% |
| 15 to 19 Minutes | 483 | 25.9% |
| 20 to 24 Minutes | 231 | 12.4% |
| 25 to 29 Minutes | 131 | 7.0% |
| 30 to 34 Minutes | 94 | 5.0% |
| 35 to 39 Minutes | 62 | 3.3% |
| 40 to 44 Minutes | 37 | 2.0% |
| 45 to 59 Minutes | 97 | 5.2% |
| 60 to 89 Minutes | 45 | 2.4% |
| 90 or more Minutes | 20 | 1.1% |
Commute Time by Sex in Millvale borough
The most common commute times in Millvale borough are 15 to 19 minutes (267 commuters, 26.6%) for males and 10 to 14 minutes (220 commuters, 25.5%) for females.
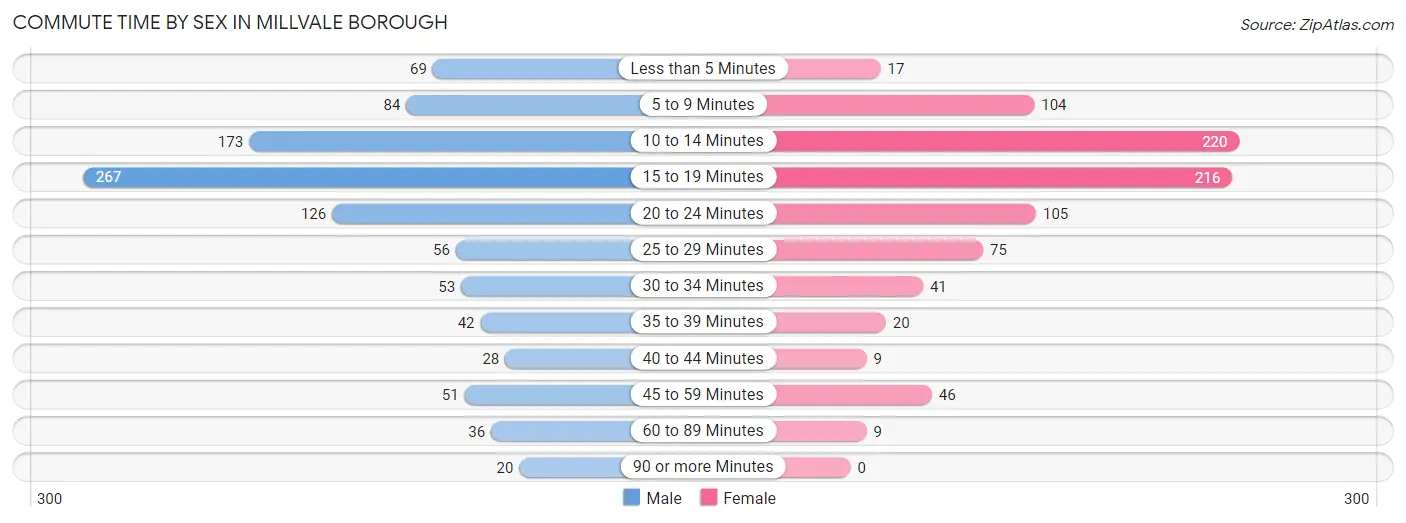
| Commute Time | Male | Female |
| Less than 5 Minutes | 69 (6.9%) | 17 (2.0%) |
| 5 to 9 Minutes | 84 (8.4%) | 104 (12.1%) |
| 10 to 14 Minutes | 173 (17.2%) | 220 (25.5%) |
| 15 to 19 Minutes | 267 (26.6%) | 216 (25.1%) |
| 20 to 24 Minutes | 126 (12.5%) | 105 (12.2%) |
| 25 to 29 Minutes | 56 (5.6%) | 75 (8.7%) |
| 30 to 34 Minutes | 53 (5.3%) | 41 (4.8%) |
| 35 to 39 Minutes | 42 (4.2%) | 20 (2.3%) |
| 40 to 44 Minutes | 28 (2.8%) | 9 (1.0%) |
| 45 to 59 Minutes | 51 (5.1%) | 46 (5.3%) |
| 60 to 89 Minutes | 36 (3.6%) | 9 (1.0%) |
| 90 or more Minutes | 20 (2.0%) | 0 (0.0%) |
Time of Departure to Work by Sex in Millvale borough
The most frequent times of departure to work in Millvale borough are 7:00 AM to 7:29 AM (154, 15.3%) for males and 7:30 AM to 7:59 AM (187, 21.7%) for females.
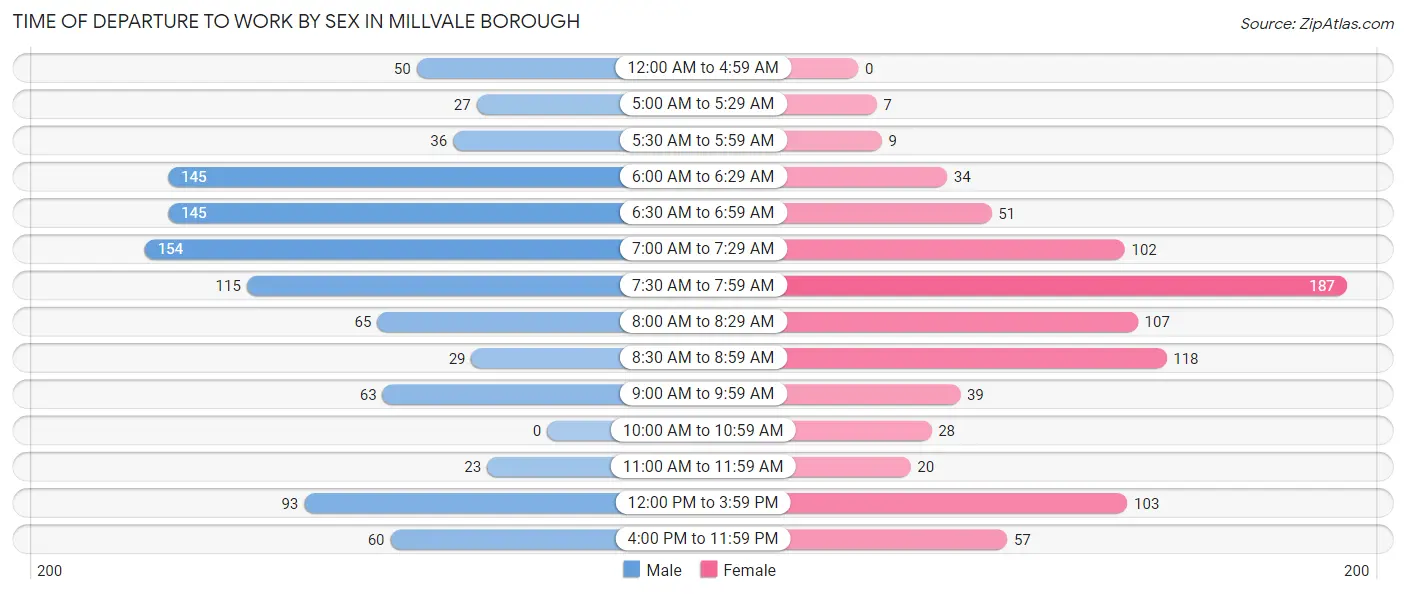
| Time of Departure | Male | Female |
| 12:00 AM to 4:59 AM | 50 (5.0%) | 0 (0.0%) |
| 5:00 AM to 5:29 AM | 27 (2.7%) | 7 (0.8%) |
| 5:30 AM to 5:59 AM | 36 (3.6%) | 9 (1.0%) |
| 6:00 AM to 6:29 AM | 145 (14.4%) | 34 (3.9%) |
| 6:30 AM to 6:59 AM | 145 (14.4%) | 51 (5.9%) |
| 7:00 AM to 7:29 AM | 154 (15.3%) | 102 (11.8%) |
| 7:30 AM to 7:59 AM | 115 (11.4%) | 187 (21.7%) |
| 8:00 AM to 8:29 AM | 65 (6.5%) | 107 (12.4%) |
| 8:30 AM to 8:59 AM | 29 (2.9%) | 118 (13.7%) |
| 9:00 AM to 9:59 AM | 63 (6.3%) | 39 (4.5%) |
| 10:00 AM to 10:59 AM | 0 (0.0%) | 28 (3.3%) |
| 11:00 AM to 11:59 AM | 23 (2.3%) | 20 (2.3%) |
| 12:00 PM to 3:59 PM | 93 (9.2%) | 103 (11.9%) |
| 4:00 PM to 11:59 PM | 60 (6.0%) | 57 (6.6%) |
| Total | 1,005 (100.0%) | 862 (100.0%) |
Housing Occupancy in Millvale borough
Occupancy by Ownership in Millvale borough
Of the total 1,631 dwellings in Millvale borough, owner-occupied units account for 688 (42.2%), while renter-occupied units make up 943 (57.8%).
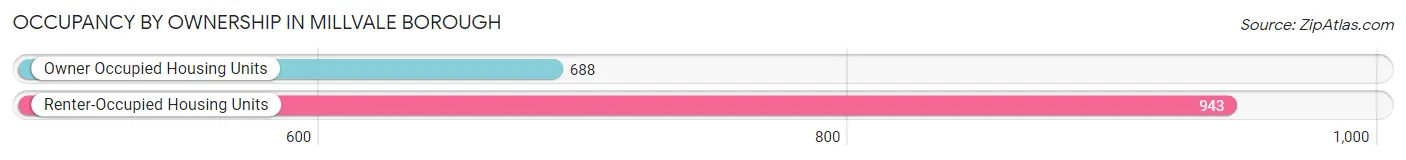
| Occupancy | # Housing Units | % Housing Units |
| Owner Occupied Housing Units | 688 | 42.2% |
| Renter-Occupied Housing Units | 943 | 57.8% |
| Total Occupied Housing Units | 1,631 | 100.0% |
Occupancy by Household Size in Millvale borough
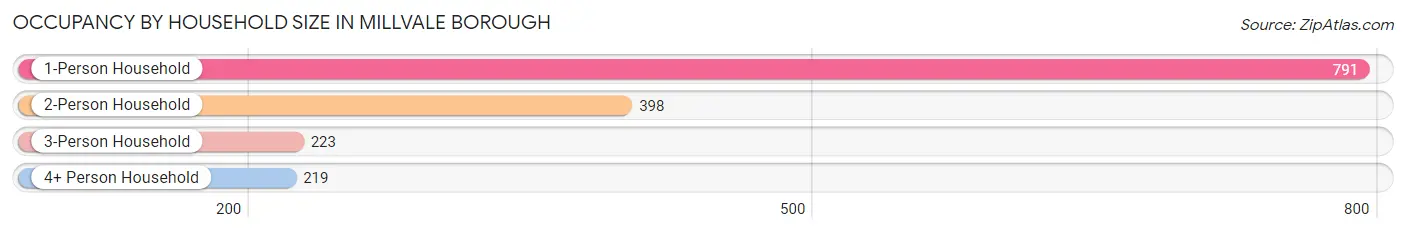
| Household Size | # Housing Units | % Housing Units |
| 1-Person Household | 791 | 48.5% |
| 2-Person Household | 398 | 24.4% |
| 3-Person Household | 223 | 13.7% |
| 4+ Person Household | 219 | 13.4% |
| Total Housing Units | 1,631 | 100.0% |
Occupancy by Ownership by Household Size in Millvale borough
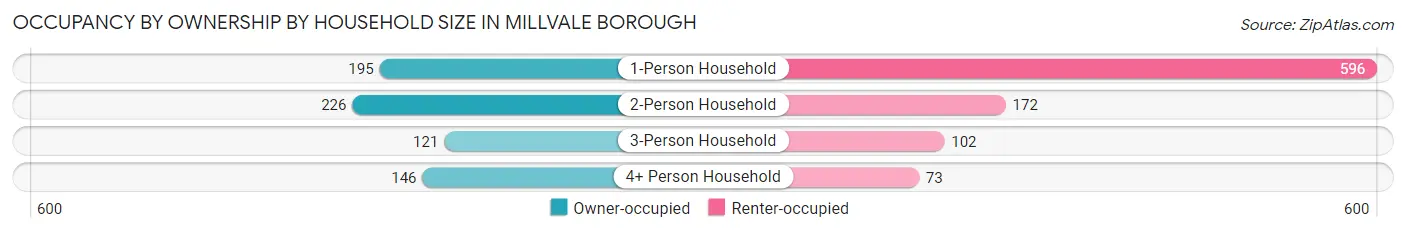
| Household Size | Owner-occupied | Renter-occupied |
| 1-Person Household | 195 (24.6%) | 596 (75.3%) |
| 2-Person Household | 226 (56.8%) | 172 (43.2%) |
| 3-Person Household | 121 (54.3%) | 102 (45.7%) |
| 4+ Person Household | 146 (66.7%) | 73 (33.3%) |
| Total Housing Units | 688 (42.2%) | 943 (57.8%) |
Occupancy by Educational Attainment in Millvale borough
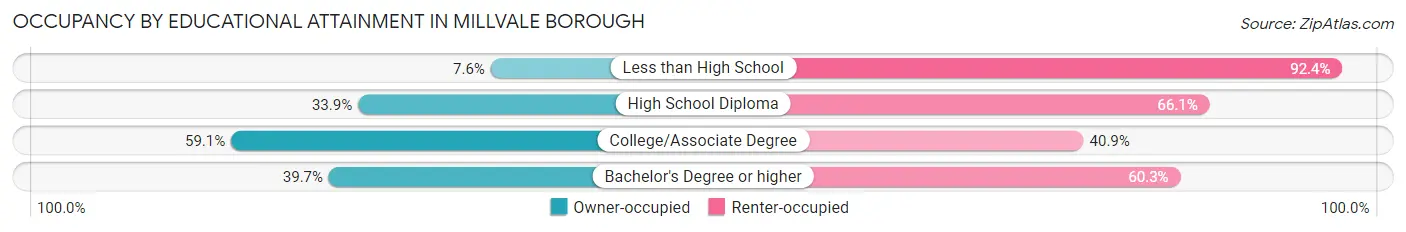
| Household Size | Owner-occupied | Renter-occupied |
| Less than High School | 6 (7.6%) | 73 (92.4%) |
| High School Diploma | 201 (33.9%) | 392 (66.1%) |
| College/Associate Degree | 306 (59.1%) | 212 (40.9%) |
| Bachelor's Degree or higher | 175 (39.7%) | 266 (60.3%) |
Occupancy by Age of Householder in Millvale borough
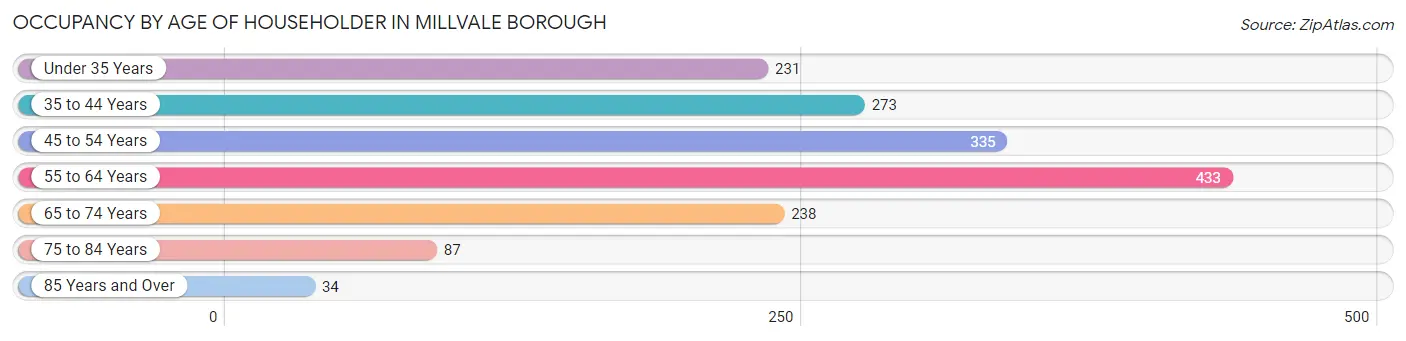
| Age Bracket | # Households | % Households |
| Under 35 Years | 231 | 14.2% |
| 35 to 44 Years | 273 | 16.7% |
| 45 to 54 Years | 335 | 20.5% |
| 55 to 64 Years | 433 | 26.6% |
| 65 to 74 Years | 238 | 14.6% |
| 75 to 84 Years | 87 | 5.3% |
| 85 Years and Over | 34 | 2.1% |
| Total | 1,631 | 100.0% |
Housing Finances in Millvale borough
Median Income by Occupancy in Millvale borough
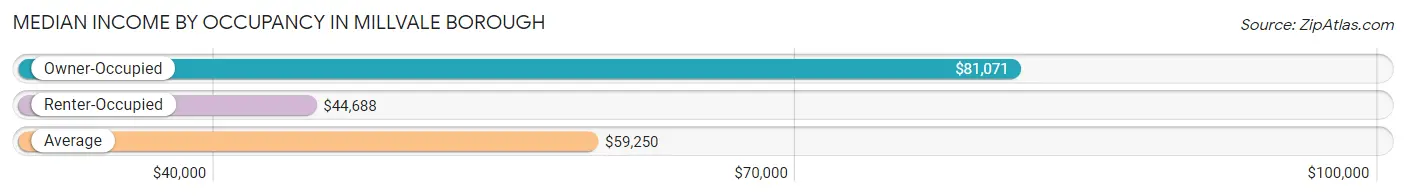
| Occupancy Type | # Households | Median Income |
| Owner-Occupied | 688 (42.2%) | $81,071 |
| Renter-Occupied | 943 (57.8%) | $44,688 |
| Average | 1,631 (100.0%) | $59,250 |
Occupancy by Householder Income Bracket in Millvale borough
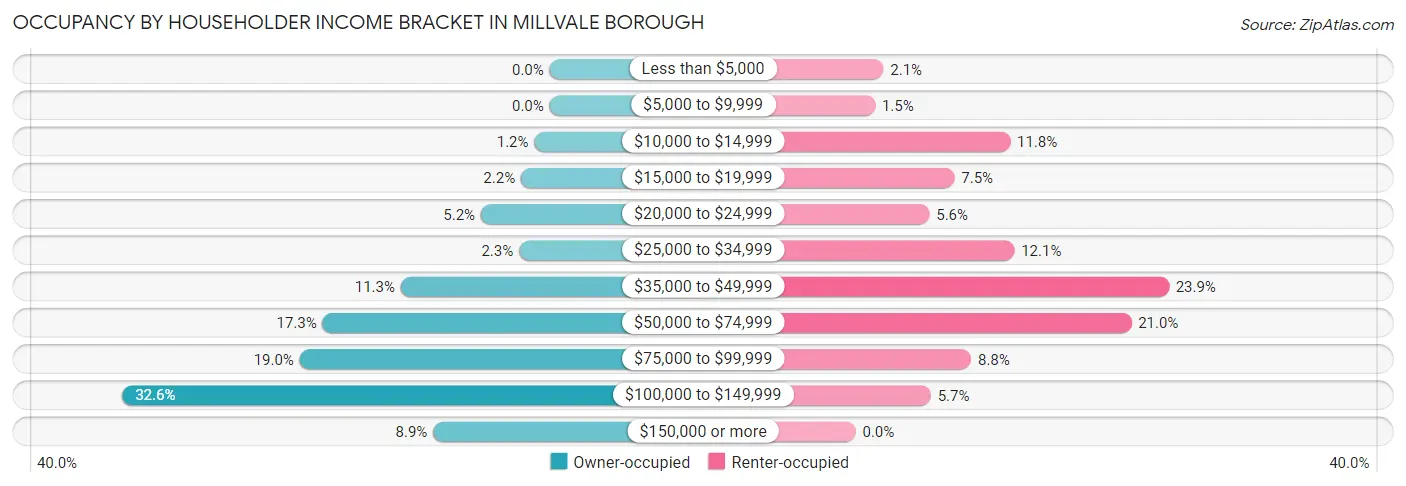
| Income Bracket | Owner-occupied | Renter-occupied |
| Less than $5,000 | 0 (0.0%) | 20 (2.1%) |
| $5,000 to $9,999 | 0 (0.0%) | 14 (1.5%) |
| $10,000 to $14,999 | 8 (1.2%) | 111 (11.8%) |
| $15,000 to $19,999 | 15 (2.2%) | 71 (7.5%) |
| $20,000 to $24,999 | 36 (5.2%) | 53 (5.6%) |
| $25,000 to $34,999 | 16 (2.3%) | 114 (12.1%) |
| $35,000 to $49,999 | 78 (11.3%) | 225 (23.9%) |
| $50,000 to $74,999 | 119 (17.3%) | 198 (21.0%) |
| $75,000 to $99,999 | 131 (19.0%) | 83 (8.8%) |
| $100,000 to $149,999 | 224 (32.6%) | 54 (5.7%) |
| $150,000 or more | 61 (8.9%) | 0 (0.0%) |
| Total | 688 (100.0%) | 943 (100.0%) |
Monthly Housing Cost Tiers in Millvale borough
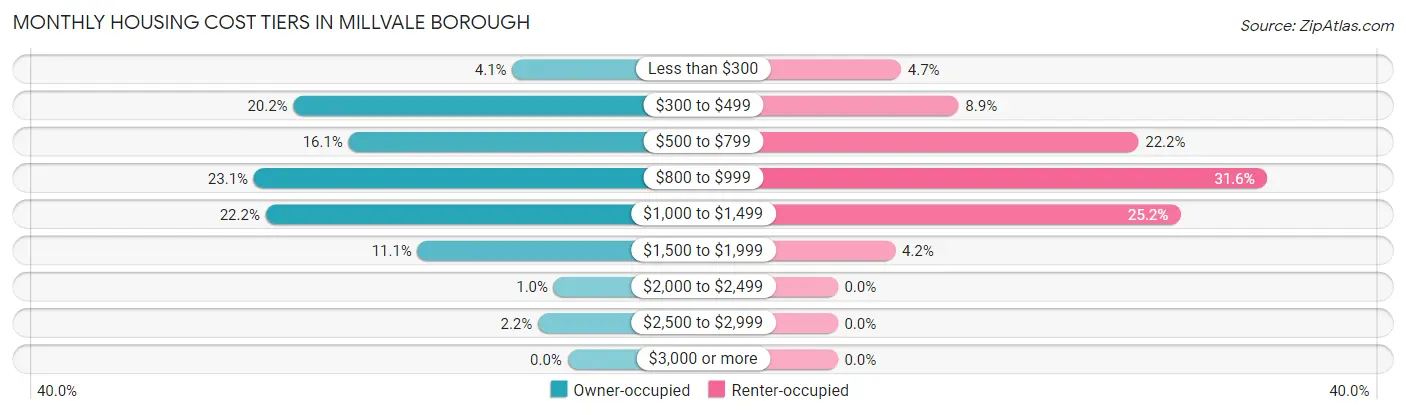
| Monthly Cost | Owner-occupied | Renter-occupied |
| Less than $300 | 28 (4.1%) | 44 (4.7%) |
| $300 to $499 | 139 (20.2%) | 84 (8.9%) |
| $500 to $799 | 111 (16.1%) | 209 (22.2%) |
| $800 to $999 | 159 (23.1%) | 298 (31.6%) |
| $1,000 to $1,499 | 153 (22.2%) | 238 (25.2%) |
| $1,500 to $1,999 | 76 (11.1%) | 40 (4.2%) |
| $2,000 to $2,499 | 7 (1.0%) | 0 (0.0%) |
| $2,500 to $2,999 | 15 (2.2%) | 0 (0.0%) |
| $3,000 or more | 0 (0.0%) | 0 (0.0%) |
| Total | 688 (100.0%) | 943 (100.0%) |
Physical Housing Characteristics in Millvale borough
Housing Structures in Millvale borough
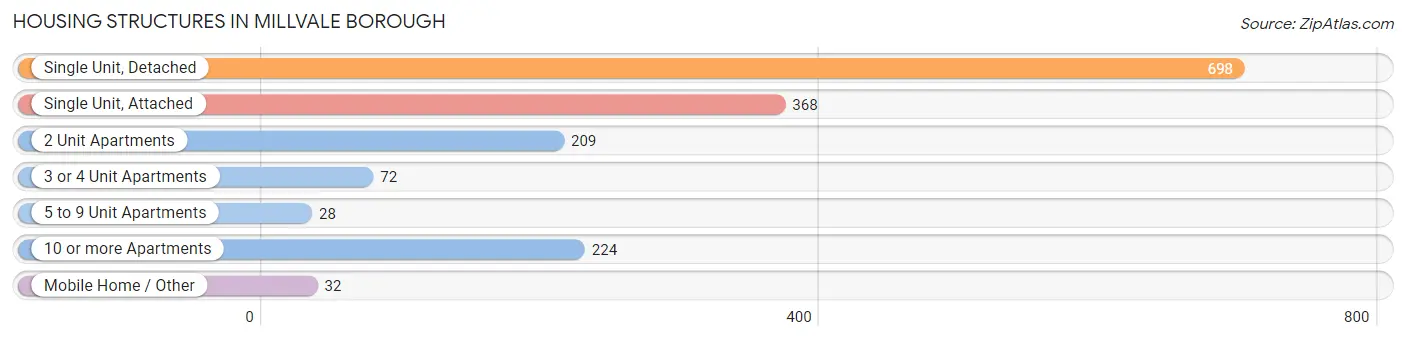
| Structure Type | # Housing Units | % Housing Units |
| Single Unit, Detached | 698 | 42.8% |
| Single Unit, Attached | 368 | 22.6% |
| 2 Unit Apartments | 209 | 12.8% |
| 3 or 4 Unit Apartments | 72 | 4.4% |
| 5 to 9 Unit Apartments | 28 | 1.7% |
| 10 or more Apartments | 224 | 13.7% |
| Mobile Home / Other | 32 | 2.0% |
| Total | 1,631 | 100.0% |
Housing Structures by Occupancy in Millvale borough
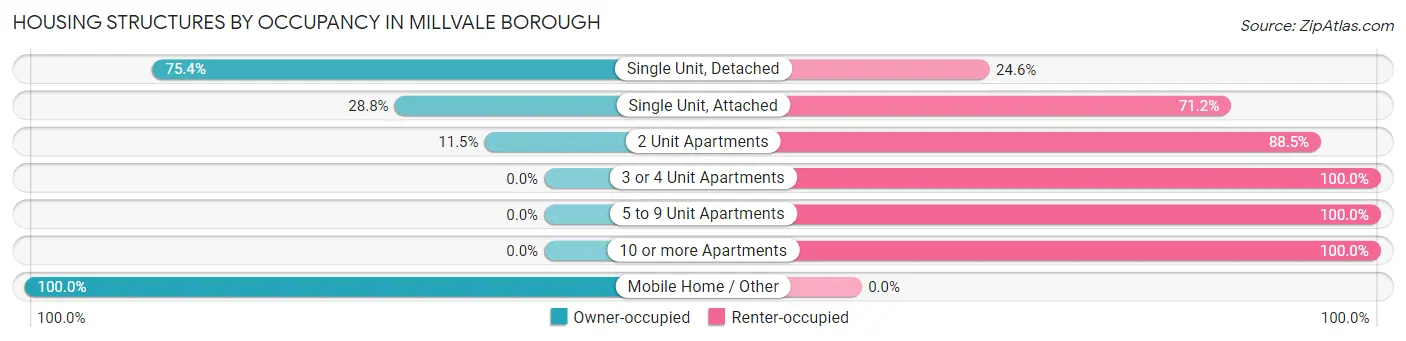
| Structure Type | Owner-occupied | Renter-occupied |
| Single Unit, Detached | 526 (75.4%) | 172 (24.6%) |
| Single Unit, Attached | 106 (28.8%) | 262 (71.2%) |
| 2 Unit Apartments | 24 (11.5%) | 185 (88.5%) |
| 3 or 4 Unit Apartments | 0 (0.0%) | 72 (100.0%) |
| 5 to 9 Unit Apartments | 0 (0.0%) | 28 (100.0%) |
| 10 or more Apartments | 0 (0.0%) | 224 (100.0%) |
| Mobile Home / Other | 32 (100.0%) | 0 (0.0%) |
| Total | 688 (42.2%) | 943 (57.8%) |
Housing Structures by Number of Rooms in Millvale borough
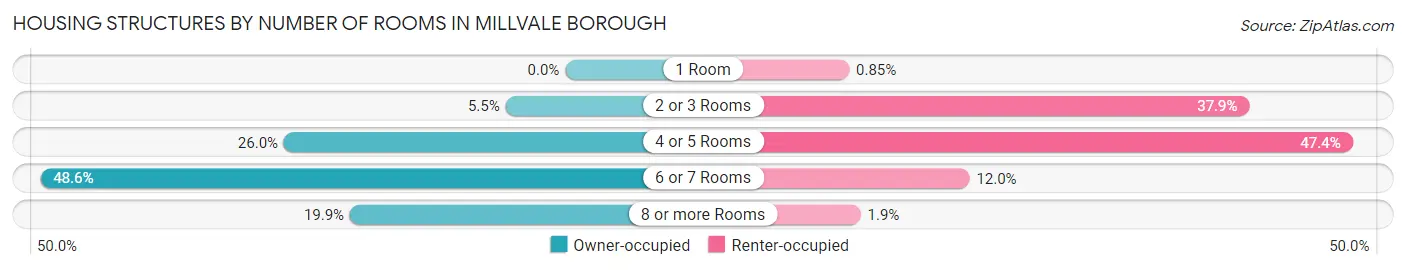
| Number of Rooms | Owner-occupied | Renter-occupied |
| 1 Room | 0 (0.0%) | 8 (0.9%) |
| 2 or 3 Rooms | 38 (5.5%) | 357 (37.9%) |
| 4 or 5 Rooms | 179 (26.0%) | 447 (47.4%) |
| 6 or 7 Rooms | 334 (48.5%) | 113 (12.0%) |
| 8 or more Rooms | 137 (19.9%) | 18 (1.9%) |
| Total | 688 (100.0%) | 943 (100.0%) |
Housing Structure by Heating Type in Millvale borough
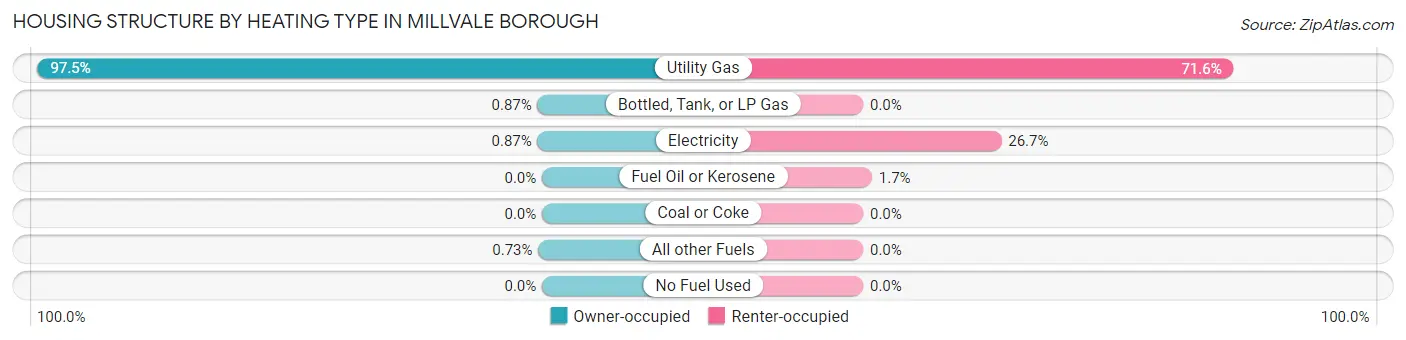
| Heating Type | Owner-occupied | Renter-occupied |
| Utility Gas | 671 (97.5%) | 675 (71.6%) |
| Bottled, Tank, or LP Gas | 6 (0.9%) | 0 (0.0%) |
| Electricity | 6 (0.9%) | 252 (26.7%) |
| Fuel Oil or Kerosene | 0 (0.0%) | 16 (1.7%) |
| Coal or Coke | 0 (0.0%) | 0 (0.0%) |
| All other Fuels | 5 (0.7%) | 0 (0.0%) |
| No Fuel Used | 0 (0.0%) | 0 (0.0%) |
| Total | 688 (100.0%) | 943 (100.0%) |
Household Vehicle Usage in Millvale borough
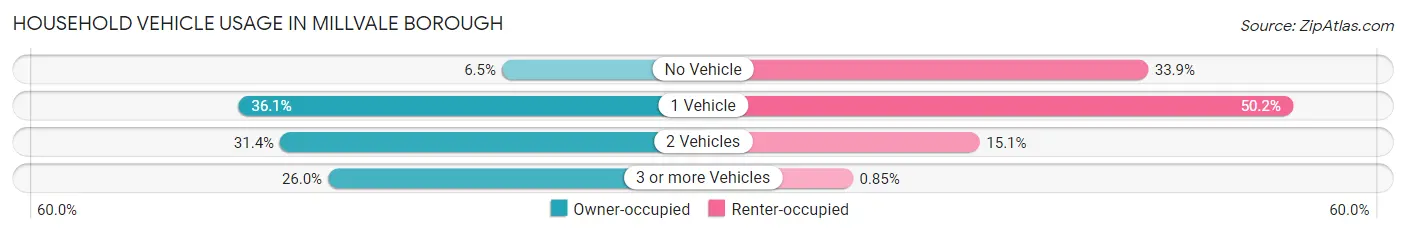
| Vehicles per Household | Owner-occupied | Renter-occupied |
| No Vehicle | 45 (6.5%) | 320 (33.9%) |
| 1 Vehicle | 248 (36.0%) | 473 (50.2%) |
| 2 Vehicles | 216 (31.4%) | 142 (15.1%) |
| 3 or more Vehicles | 179 (26.0%) | 8 (0.9%) |
| Total | 688 (100.0%) | 943 (100.0%) |
Real Estate & Mortgages in Millvale borough
Real Estate and Mortgage Overview in Millvale borough
| Characteristic | Without Mortgage | With Mortgage |
| Housing Units | 259 | 429 |
| Median Property Value | - | - |
| Median Household Income | $75,450 | $42 |
| Monthly Housing Costs | $396 | $0 |
| Real Estate Taxes | - | - |
Property Value by Mortgage Status in Millvale borough
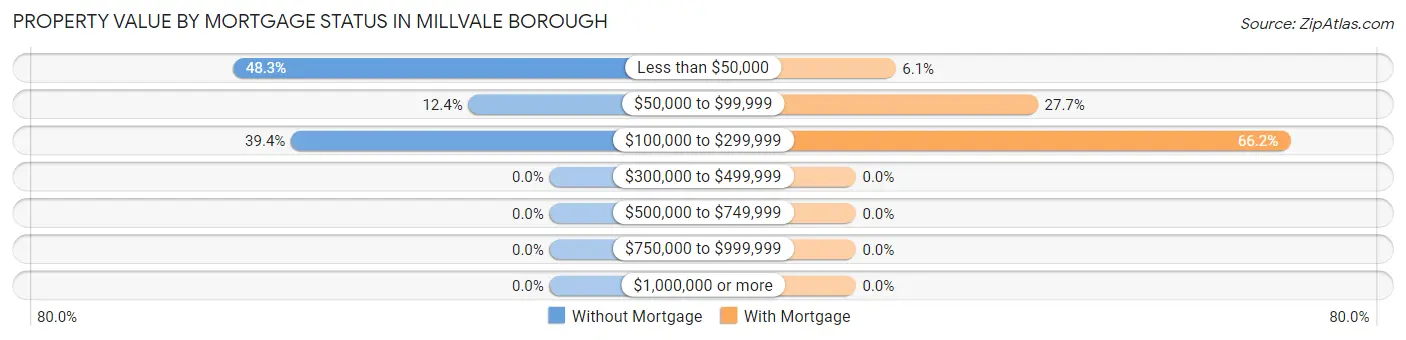
| Property Value | Without Mortgage | With Mortgage |
| Less than $50,000 | 125 (48.3%) | 26 (6.1%) |
| $50,000 to $99,999 | 32 (12.4%) | 119 (27.7%) |
| $100,000 to $299,999 | 102 (39.4%) | 284 (66.2%) |
| $300,000 to $499,999 | 0 (0.0%) | 0 (0.0%) |
| $500,000 to $749,999 | 0 (0.0%) | 0 (0.0%) |
| $750,000 to $999,999 | 0 (0.0%) | 0 (0.0%) |
| $1,000,000 or more | 0 (0.0%) | 0 (0.0%) |
| Total | 259 (100.0%) | 429 (100.0%) |
Household Income by Mortgage Status in Millvale borough
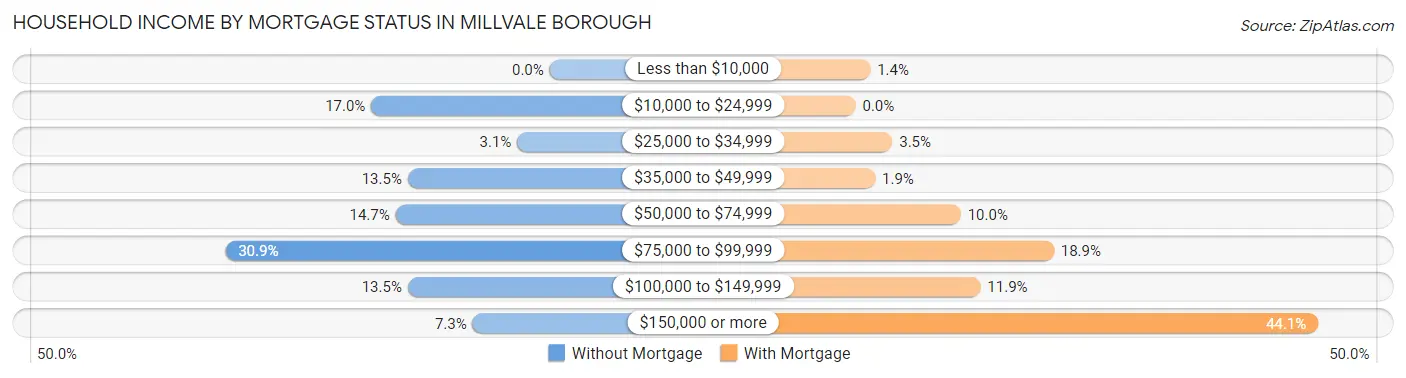
| Household Income | Without Mortgage | With Mortgage |
| Less than $10,000 | 0 (0.0%) | 6 (1.4%) |
| $10,000 to $24,999 | 44 (17.0%) | 0 (0.0%) |
| $25,000 to $34,999 | 8 (3.1%) | 15 (3.5%) |
| $35,000 to $49,999 | 35 (13.5%) | 8 (1.9%) |
| $50,000 to $74,999 | 38 (14.7%) | 43 (10.0%) |
| $75,000 to $99,999 | 80 (30.9%) | 81 (18.9%) |
| $100,000 to $149,999 | 35 (13.5%) | 51 (11.9%) |
| $150,000 or more | 19 (7.3%) | 189 (44.1%) |
| Total | 259 (100.0%) | 429 (100.0%) |
Property Value to Household Income Ratio in Millvale borough
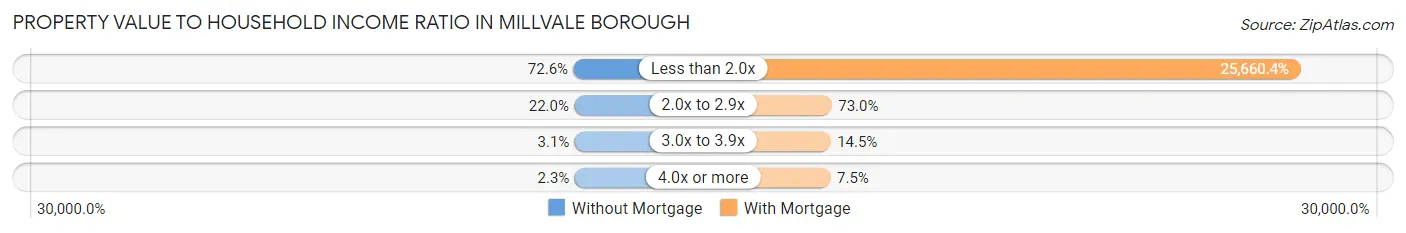
| Value-to-Income Ratio | Without Mortgage | With Mortgage |
| Less than 2.0x | 188 (72.6%) | 110,083 (25,660.4%) |
| 2.0x to 2.9x | 57 (22.0%) | 313 (73.0%) |
| 3.0x to 3.9x | 8 (3.1%) | 62 (14.4%) |
| 4.0x or more | 6 (2.3%) | 32 (7.5%) |
| Total | 259 (100.0%) | 429 (100.0%) |
Real Estate Taxes by Mortgage Status in Millvale borough
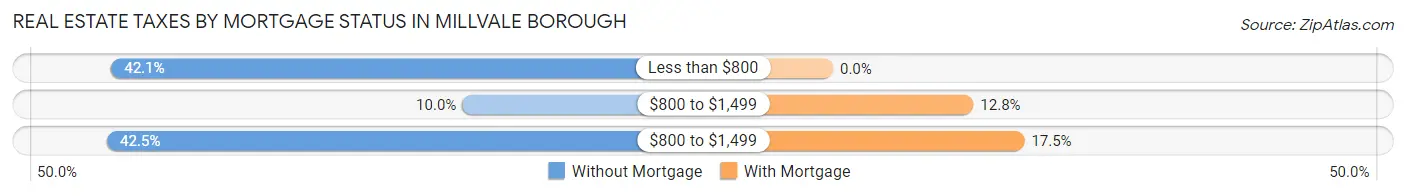
| Property Taxes | Without Mortgage | With Mortgage |
| Less than $800 | 109 (42.1%) | 0 (0.0%) |
| $800 to $1,499 | 26 (10.0%) | 55 (12.8%) |
| $800 to $1,499 | 110 (42.5%) | 75 (17.5%) |
| Total | 259 (100.0%) | 429 (100.0%) |
Health & Disability in Millvale borough
Health Insurance Coverage by Age in Millvale borough
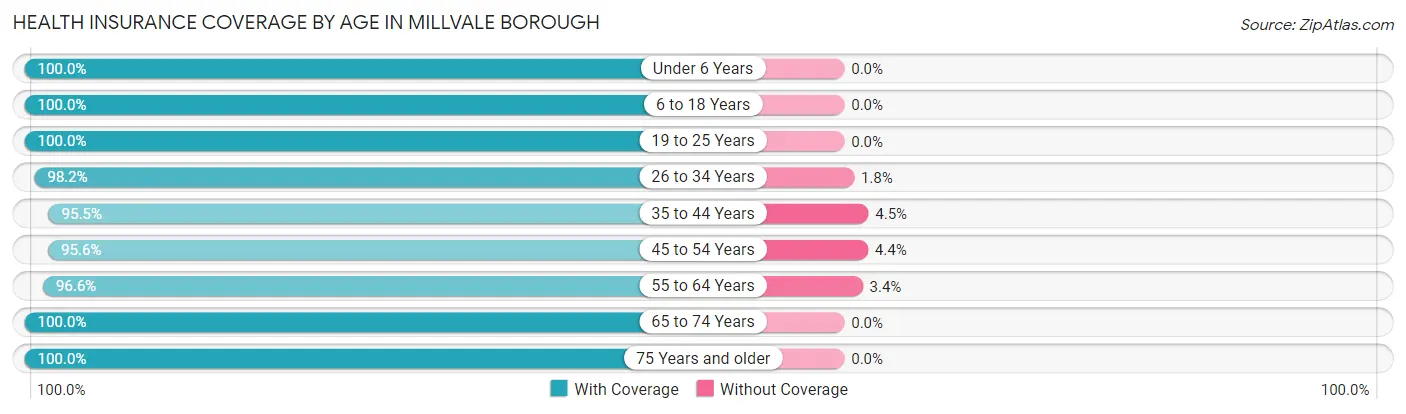
| Age Bracket | With Coverage | Without Coverage |
| Under 6 Years | 25 (100.0%) | 0 (0.0%) |
| 6 to 18 Years | 520 (100.0%) | 0 (0.0%) |
| 19 to 25 Years | 387 (100.0%) | 0 (0.0%) |
| 26 to 34 Years | 379 (98.2%) | 7 (1.8%) |
| 35 to 44 Years | 426 (95.5%) | 20 (4.5%) |
| 45 to 54 Years | 521 (95.6%) | 24 (4.4%) |
| 55 to 64 Years | 536 (96.6%) | 19 (3.4%) |
| 65 to 74 Years | 373 (100.0%) | 0 (0.0%) |
| 75 Years and older | 140 (100.0%) | 0 (0.0%) |
| Total | 3,307 (97.9%) | 70 (2.1%) |
Health Insurance Coverage by Citizenship Status in Millvale borough
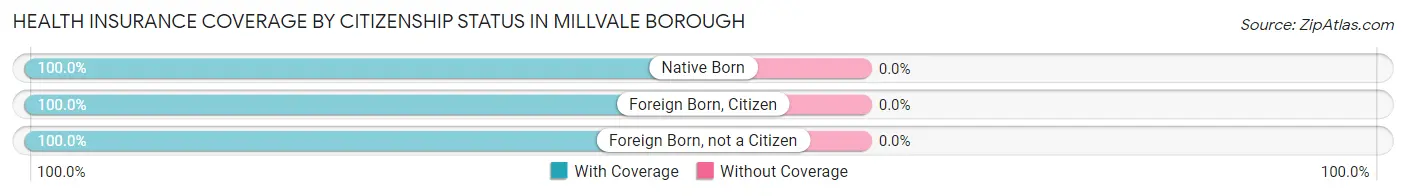
| Citizenship Status | With Coverage | Without Coverage |
| Native Born | 25 (100.0%) | 0 (0.0%) |
| Foreign Born, Citizen | 520 (100.0%) | 0 (0.0%) |
| Foreign Born, not a Citizen | 387 (100.0%) | 0 (0.0%) |
Health Insurance Coverage by Household Income in Millvale borough
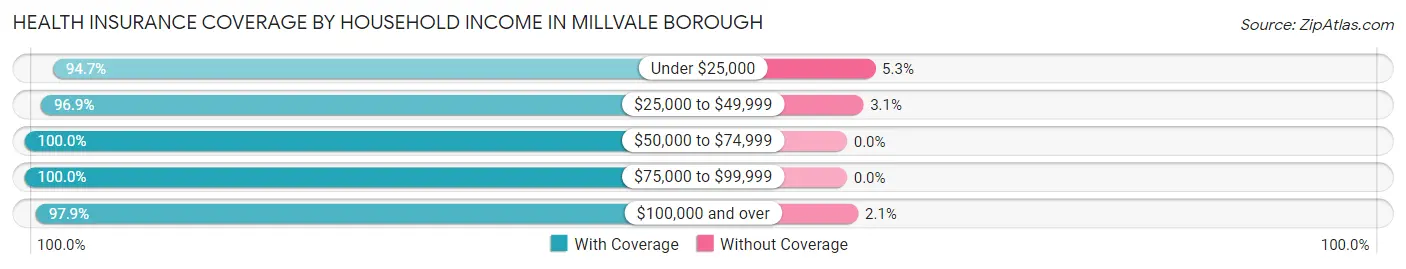
| Household Income | With Coverage | Without Coverage |
| Under $25,000 | 410 (94.7%) | 23 (5.3%) |
| $25,000 to $49,999 | 849 (96.9%) | 27 (3.1%) |
| $50,000 to $74,999 | 478 (100.0%) | 0 (0.0%) |
| $75,000 to $99,999 | 582 (100.0%) | 0 (0.0%) |
| $100,000 and over | 925 (97.9%) | 20 (2.1%) |
Public vs Private Health Insurance Coverage by Age in Millvale borough
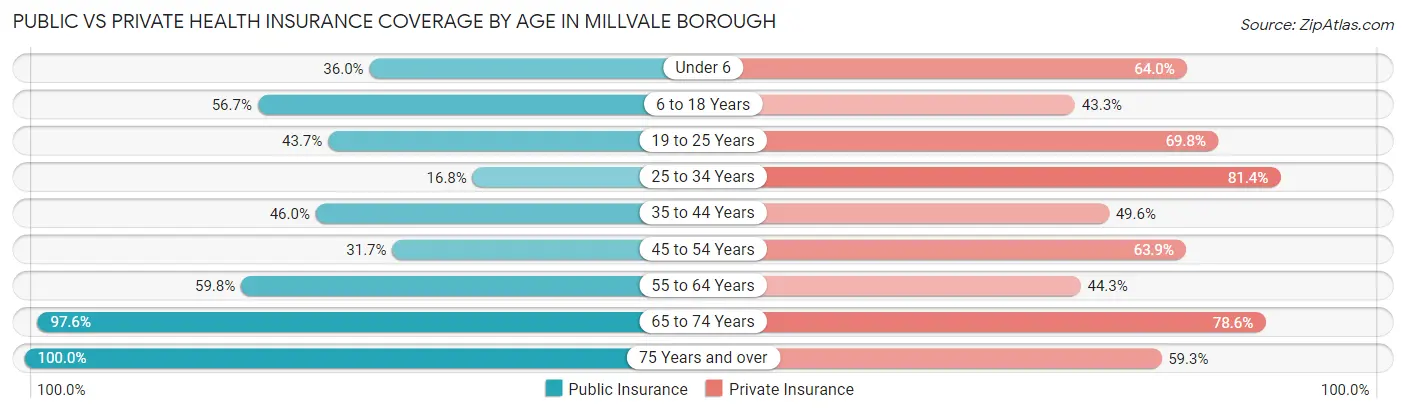
| Age Bracket | Public Insurance | Private Insurance |
| Under 6 | 9 (36.0%) | 16 (64.0%) |
| 6 to 18 Years | 295 (56.7%) | 225 (43.3%) |
| 19 to 25 Years | 169 (43.7%) | 270 (69.8%) |
| 25 to 34 Years | 65 (16.8%) | 314 (81.4%) |
| 35 to 44 Years | 205 (46.0%) | 221 (49.5%) |
| 45 to 54 Years | 173 (31.7%) | 348 (63.8%) |
| 55 to 64 Years | 332 (59.8%) | 246 (44.3%) |
| 65 to 74 Years | 364 (97.6%) | 293 (78.5%) |
| 75 Years and over | 140 (100.0%) | 83 (59.3%) |
| Total | 1,752 (51.9%) | 2,016 (59.7%) |
Disability Status by Sex by Age in Millvale borough
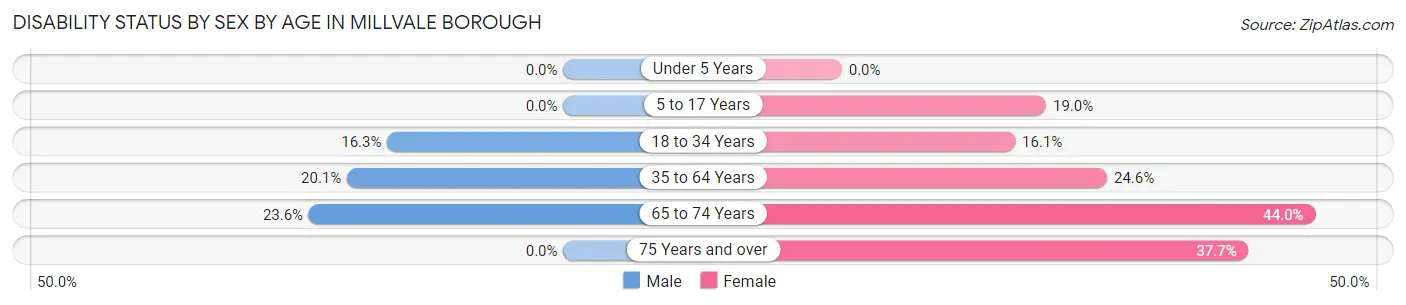
| Age Bracket | Male | Female |
| Under 5 Years | 0 (0.0%) | 0 (0.0%) |
| 5 to 17 Years | 0 (0.0%) | 62 (19.0%) |
| 18 to 34 Years | 74 (16.3%) | 60 (16.1%) |
| 35 to 64 Years | 166 (20.1%) | 177 (24.6%) |
| 65 to 74 Years | 51 (23.6%) | 69 (44.0%) |
| 75 Years and over | 0 (0.0%) | 40 (37.7%) |
Disability Class by Sex by Age in Millvale borough
Disability Class: Hearing Difficulty
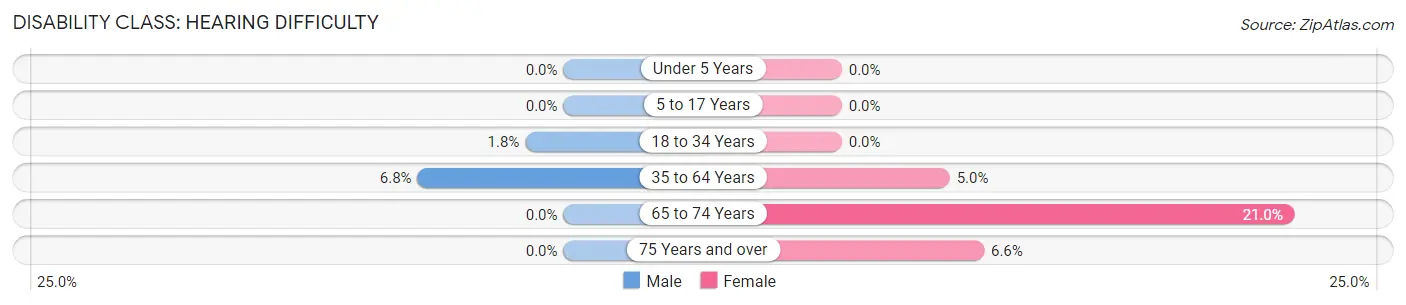
| Age Bracket | Male | Female |
| Under 5 Years | 0 (0.0%) | 0 (0.0%) |
| 5 to 17 Years | 0 (0.0%) | 0 (0.0%) |
| 18 to 34 Years | 8 (1.8%) | 0 (0.0%) |
| 35 to 64 Years | 56 (6.8%) | 36 (5.0%) |
| 65 to 74 Years | 0 (0.0%) | 33 (21.0%) |
| 75 Years and over | 0 (0.0%) | 7 (6.6%) |
Disability Class: Vision Difficulty
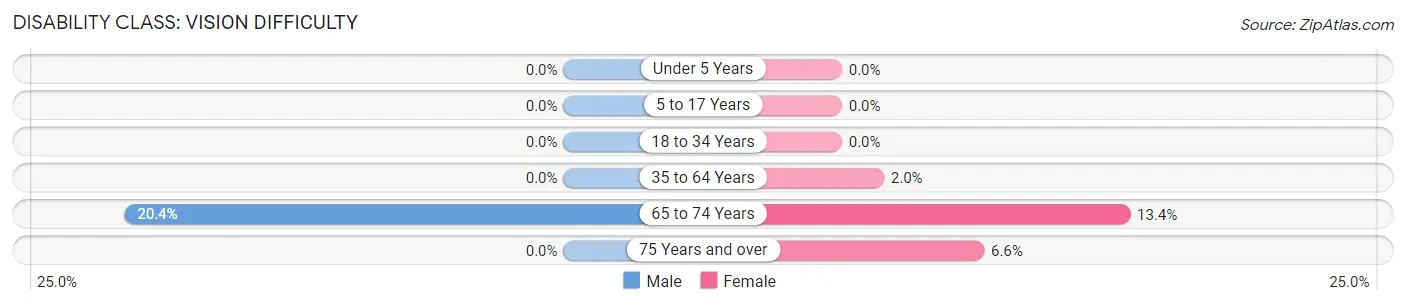
| Age Bracket | Male | Female |
| Under 5 Years | 0 (0.0%) | 0 (0.0%) |
| 5 to 17 Years | 0 (0.0%) | 0 (0.0%) |
| 18 to 34 Years | 0 (0.0%) | 0 (0.0%) |
| 35 to 64 Years | 0 (0.0%) | 14 (1.9%) |
| 65 to 74 Years | 44 (20.4%) | 21 (13.4%) |
| 75 Years and over | 0 (0.0%) | 7 (6.6%) |
Disability Class: Cognitive Difficulty
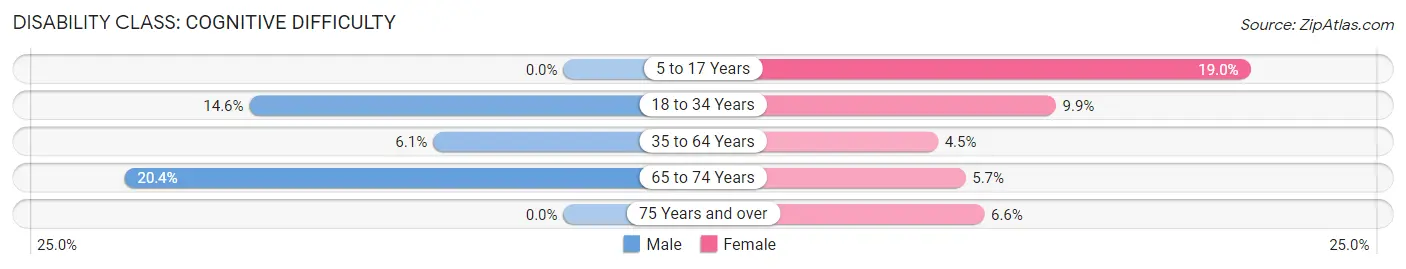
| Age Bracket | Male | Female |
| 5 to 17 Years | 0 (0.0%) | 62 (19.0%) |
| 18 to 34 Years | 66 (14.6%) | 37 (9.9%) |
| 35 to 64 Years | 50 (6.0%) | 32 (4.4%) |
| 65 to 74 Years | 44 (20.4%) | 9 (5.7%) |
| 75 Years and over | 0 (0.0%) | 7 (6.6%) |
Disability Class: Ambulatory Difficulty
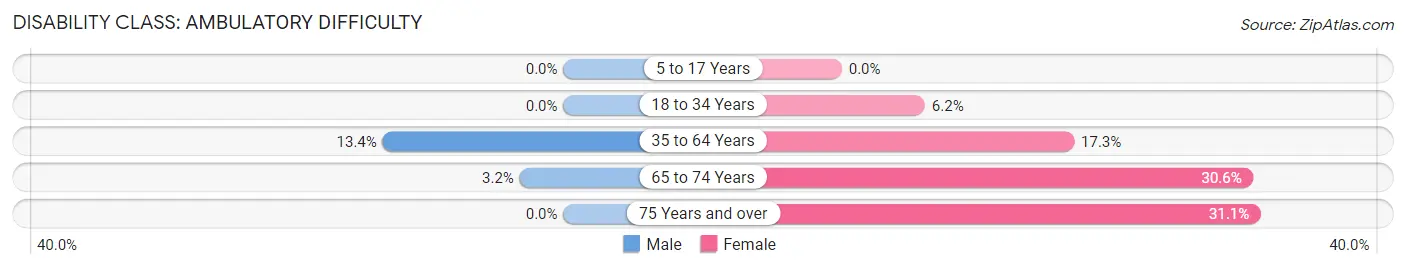
| Age Bracket | Male | Female |
| 5 to 17 Years | 0 (0.0%) | 0 (0.0%) |
| 18 to 34 Years | 0 (0.0%) | 23 (6.2%) |
| 35 to 64 Years | 111 (13.4%) | 124 (17.2%) |
| 65 to 74 Years | 7 (3.2%) | 48 (30.6%) |
| 75 Years and over | 0 (0.0%) | 33 (31.1%) |
Disability Class: Self-Care Difficulty
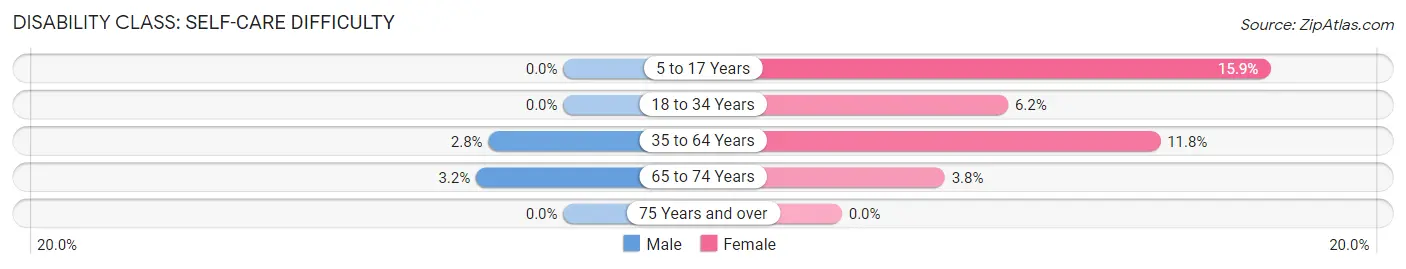
| Age Bracket | Male | Female |
| 5 to 17 Years | 0 (0.0%) | 52 (15.9%) |
| 18 to 34 Years | 0 (0.0%) | 23 (6.2%) |
| 35 to 64 Years | 23 (2.8%) | 85 (11.8%) |
| 65 to 74 Years | 7 (3.2%) | 6 (3.8%) |
| 75 Years and over | 0 (0.0%) | 0 (0.0%) |
Technology Access in Millvale borough
Computing Device Access in Millvale borough
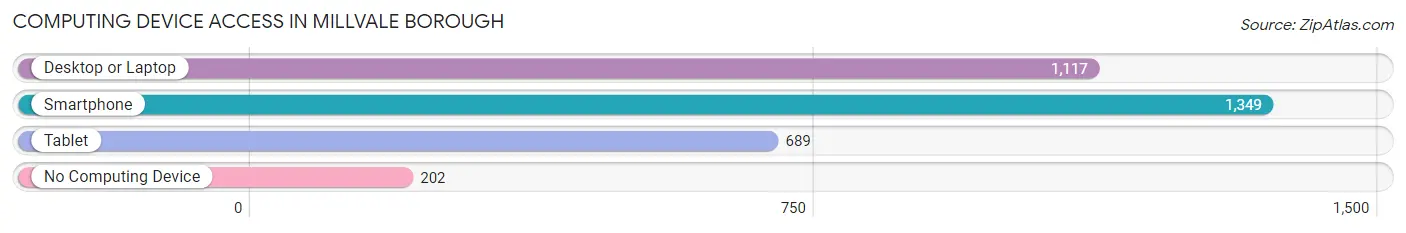
| Device Type | # Households | % Households |
| Desktop or Laptop | 1,117 | 68.5% |
| Smartphone | 1,349 | 82.7% |
| Tablet | 689 | 42.2% |
| No Computing Device | 202 | 12.4% |
| Total | 1,631 | 100.0% |
Internet Access in Millvale borough
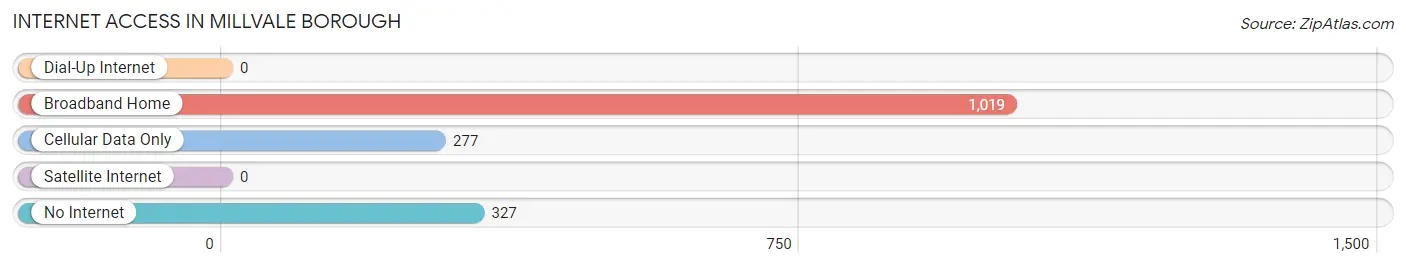
| Internet Type | # Households | % Households |
| Dial-Up Internet | 0 | 0.0% |
| Broadband Home | 1,019 | 62.5% |
| Cellular Data Only | 277 | 17.0% |
| Satellite Internet | 0 | 0.0% |
| No Internet | 327 | 20.1% |
| Total | 1,631 | 100.0% |
Millvale borough Summary
Introduction
Millvale Borough is a small borough located in Allegheny County, Pennsylvania. It is situated along the Allegheny River, just north of the City of Pittsburgh. The borough is home to a population of approximately 3,000 people, and is known for its small-town charm and close-knit community.
History
Millvale Borough was founded in 1868, when a group of settlers from the nearby town of Sharpsburg purchased land along the Allegheny River. The settlers named the area Millvale, after the nearby mill that was located on the river. The mill was owned by the local Sharpsburg family, and was used to grind grain for the local farmers.
In 1872, the borough was officially incorporated, and the first mayor was elected. The borough quickly grew, and by the early 1900s, it had become a thriving community. The population was largely made up of immigrants from Germany, Ireland, and Italy, who had come to the area to work in the local mills and factories.
The borough continued to grow throughout the 20th century, and by the 1950s, it had become a bustling community. The population had grown to over 5,000 people, and the borough had become a popular destination for tourists and visitors.
Geography
Millvale Borough is located in Allegheny County, Pennsylvania. It is situated along the Allegheny River, just north of the City of Pittsburgh. The borough is bordered by the boroughs of Etna, Shaler, and Reserve, as well as the townships of Ross and McCandless.
The borough covers an area of 1.2 square miles, and is home to a population of approximately 3,000 people. The terrain of the borough is mostly flat, with some rolling hills in the northern part of the borough. The borough is located in the Allegheny Plateau region of Pennsylvania, and is part of the Pittsburgh metropolitan area.
Economy
The economy of Millvale Borough is largely based on the service industry. The borough is home to a variety of restaurants, bars, and other businesses that cater to the local population and visitors. The borough is also home to a number of small manufacturing companies, as well as a few larger companies that employ a significant number of people.
The borough is also home to a number of small retail stores, as well as a few larger stores. The borough is home to a number of banks, as well as a few other financial institutions. The borough is also home to a number of churches, as well as a few other religious organizations.
Demographics
As of the 2010 census, the population of Millvale Borough was 3,073. The racial makeup of the borough was 94.3% White, 2.2% African American, 0.3% Native American, 0.7% Asian, 0.1% Pacific Islander, 0.7% from other races, and 1.7% from two or more races. Hispanic or Latino of any race were 1.7% of the population.
The median income for a household in the borough was $37,917, and the median income for a family was $45,938. The per capita income for the borough was $19,945. About 11.2% of families and 13.2% of the population were below the poverty line, including 18.2% of those under age 18 and 8.2% of those age 65 or over.
Conclusion
Millvale Borough is a small borough located in Allegheny County, Pennsylvania. It is situated along the Allegheny River, just north of the City of Pittsburgh. The borough is home to a population of approximately 3,000 people, and is known for its small-town charm and close-knit community. The economy of the borough is largely based on the service industry, and the population is largely made up of White, African American, Native American, Asian, and Pacific Islander residents. The median income for a household in the borough is $37,917, and the per capita income is $19,945. Millvale Borough is a vibrant community that is full of history and culture, and is a great place to live and work.
Common Questions
What is the Total Population of Millvale borough?
Total Population of Millvale borough is 3,377.
What is the Total Male Population of Millvale borough?
Total Male Population of Millvale borough is 1,687.
What is the Total Female Population of Millvale borough?
Total Female Population of Millvale borough is 1,690.
What is the Ratio of Males per 100 Females in Millvale borough?
There are 99.82 Males per 100 Females in Millvale borough.
What is the Ratio of Females per 100 Males in Millvale borough?
There are 100.18 Females per 100 Males in Millvale borough.
What is the Median Population Age in Millvale borough?
Median Population Age in Millvale borough is 42.7 Years.
What is the Average Family Size in Millvale borough
Average Family Size in Millvale borough is 3.1 People.
What is the Average Household Size in Millvale borough
Average Household Size in Millvale borough is 2.0 People.
What is Per Capita Income in Millvale borough?
Per Capita income in Millvale borough is $32,803.
What is the Median Family Income in Millvale borough?
Median Family Income in Millvale borough is $75,038.
What is the Median Household income in Millvale borough?
Median Household Income in Millvale borough is $59,250.
What is Income or Wage Gap in Millvale borough?
Income or Wage Gap in Millvale borough is 18.6%.
Women in Millvale borough earn 81.4 cents for every dollar earned by a man.
What is Inequality or Gini Index in Millvale borough?
Inequality or Gini Index in Millvale borough is 0.38.
How Large is the Labor Force in Millvale borough?
There are 2,136 People in the Labor Forcein in Millvale borough.
What is the Percentage of People in the Labor Force in Millvale borough?
71.8% of People are in the Labor Force in Millvale borough.
What is the Unemployment Rate in Millvale borough?
Unemployment Rate in Millvale borough is 5.2%.