Bayside Gardens, OR
Bayside Gardens Map
Bayside Gardens Overview
980
TOTAL POPULATION
537
MALE POPULATION
443
FEMALE POPULATION
121.22
MALES / 100 FEMALES
82.50
FEMALES / 100 MALES
58.3
MEDIAN AGE
2.1
AVG FAMILY SIZE
1.8
AVG HOUSEHOLD SIZE
$47,984
PER CAPITA INCOME
$74,900
AVG FAMILY INCOME
$73,813
AVG HOUSEHOLD INCOME
25.2%
WAGE / INCOME GAP [ % ]
74.8¢/ $1
WAGE / INCOME GAP [ $ ]
0.36
INEQUALITY / GINI INDEX
475
LABOR FORCE [ PEOPLE ]
52.1%
PERCENT IN LABOR FORCE
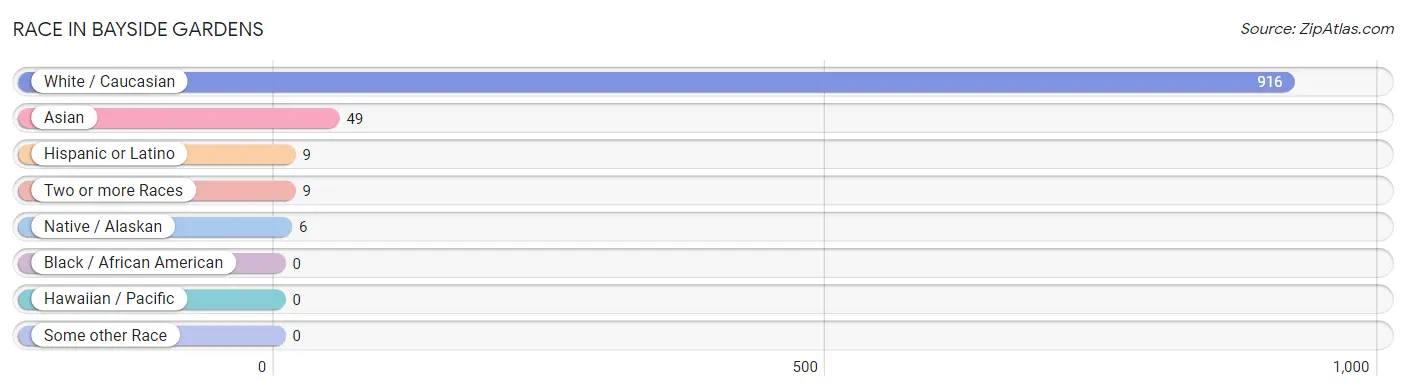
Race in Bayside Gardens
The most populous races in Bayside Gardens are White / Caucasian (916 | 93.5%), Asian (49 | 5.0%), and Hispanic or Latino (9 | 0.9%).
| Race | # Population | % Population |
| Asian | 49 | 5.0% |
| Black / African American | 0 | 0.0% |
| Hawaiian / Pacific | 0 | 0.0% |
| Hispanic or Latino | 9 | 0.9% |
| Native / Alaskan | 6 | 0.6% |
| White / Caucasian | 916 | 93.5% |
| Two or more Races | 9 | 0.9% |
| Some other Race | 0 | 0.0% |
| Total | 980 | 100.0% |
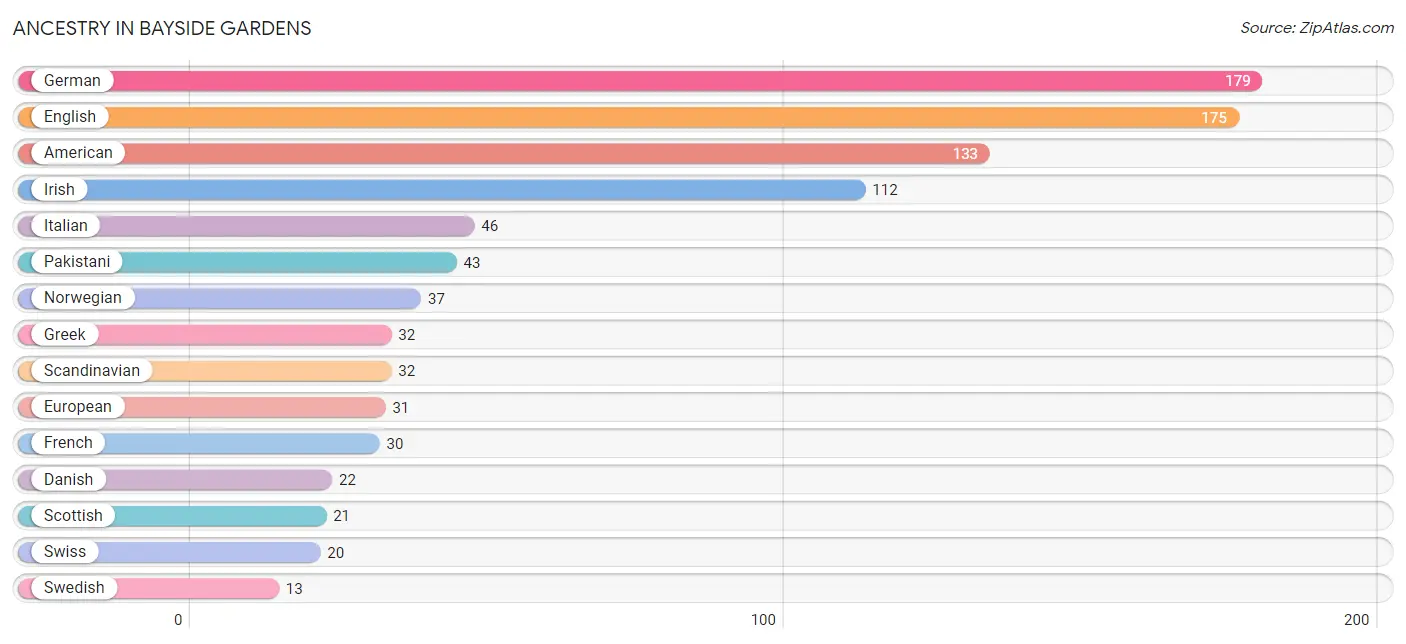
Ancestry in Bayside Gardens
The most populous ancestries reported in Bayside Gardens are German (179 | 18.3%), English (175 | 17.9%), American (133 | 13.6%), Irish (112 | 11.4%), and Italian (46 | 4.7%), together accounting for 65.8% of all Bayside Gardens residents.
| Ancestry | # Population | % Population |
| American | 133 | 13.6% |
| Cherokee | 5 | 0.5% |
| Danish | 22 | 2.2% |
| Dutch | 7 | 0.7% |
| English | 175 | 17.9% |
| European | 31 | 3.2% |
| French | 30 | 3.1% |
| German | 179 | 18.3% |
| Greek | 32 | 3.3% |
| Irish | 112 | 11.4% |
| Italian | 46 | 4.7% |
| Korean | 6 | 0.6% |
| Mexican | 9 | 0.9% |
| Native Hawaiian | 1 | 0.1% |
| Norwegian | 37 | 3.8% |
| Pakistani | 43 | 4.4% |
| Polish | 10 | 1.0% |
| Scandinavian | 32 | 3.3% |
| Scottish | 21 | 2.1% |
| Swedish | 13 | 1.3% |
| Swiss | 20 | 2.0% | View All 21 Rows |
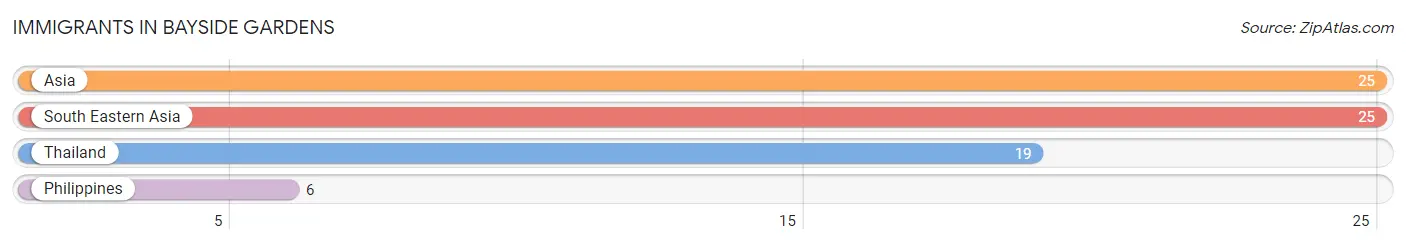
Immigrants in Bayside Gardens
The most numerous immigrant groups reported in Bayside Gardens came from Asia (25 | 2.5%), South Eastern Asia (25 | 2.5%), Thailand (19 | 1.9%), and Philippines (6 | 0.6%), together accounting for 7.6% of all Bayside Gardens residents.
| Immigration Origin | # Population | % Population |
| Asia | 25 | 2.5% |
| Philippines | 6 | 0.6% |
| South Eastern Asia | 25 | 2.5% |
| Thailand | 19 | 1.9% | View All 4 Rows |
Sex and Age in Bayside Gardens
Sex and Age in Bayside Gardens
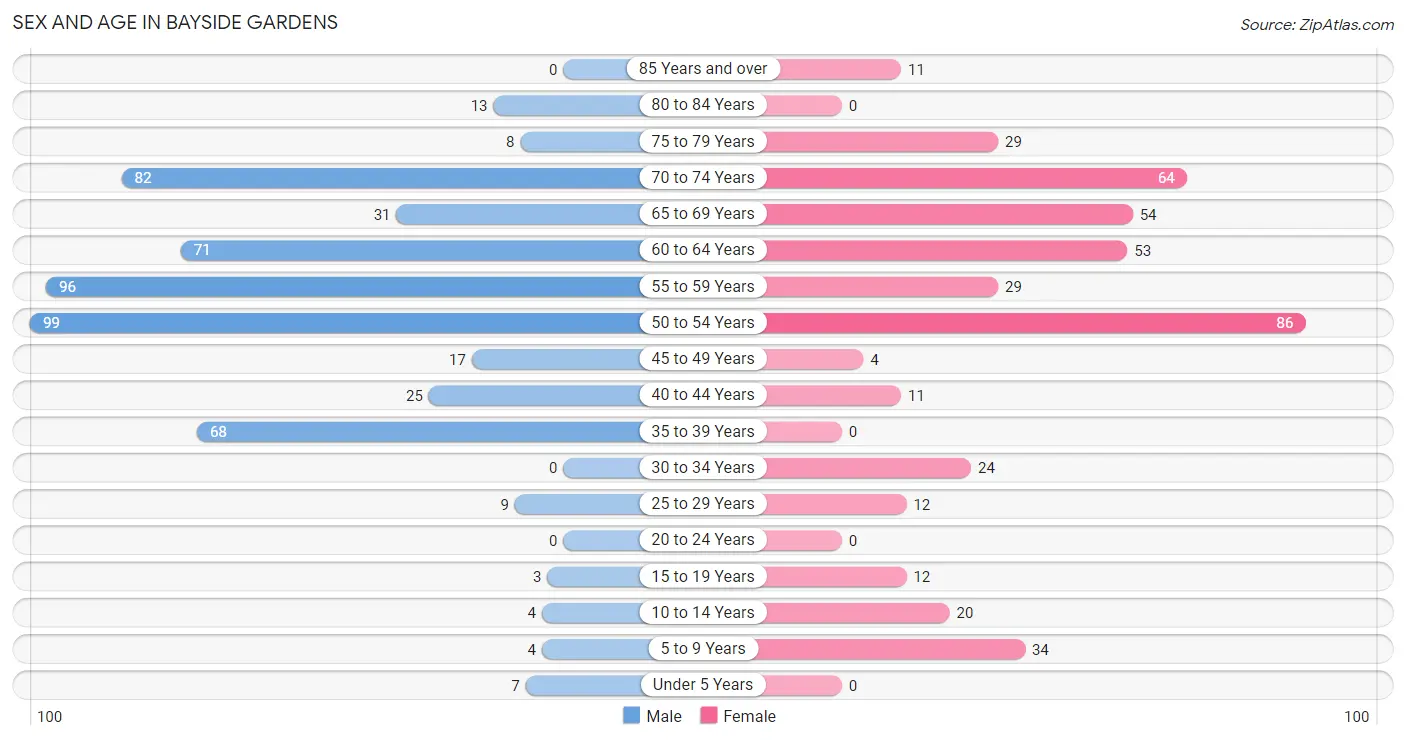
The most populous age groups in Bayside Gardens are 50 to 54 Years (99 | 18.4%) for men and 50 to 54 Years (86 | 19.4%) for women.
| Age Bracket | Male | Female |
| Under 5 Years | 7 (1.3%) | 0 (0.0%) |
| 5 to 9 Years | 4 (0.7%) | 34 (7.7%) |
| 10 to 14 Years | 4 (0.7%) | 20 (4.5%) |
| 15 to 19 Years | 3 (0.6%) | 12 (2.7%) |
| 20 to 24 Years | 0 (0.0%) | 0 (0.0%) |
| 25 to 29 Years | 9 (1.7%) | 12 (2.7%) |
| 30 to 34 Years | 0 (0.0%) | 24 (5.4%) |
| 35 to 39 Years | 68 (12.7%) | 0 (0.0%) |
| 40 to 44 Years | 25 (4.7%) | 11 (2.5%) |
| 45 to 49 Years | 17 (3.2%) | 4 (0.9%) |
| 50 to 54 Years | 99 (18.4%) | 86 (19.4%) |
| 55 to 59 Years | 96 (17.9%) | 29 (6.6%) |
| 60 to 64 Years | 71 (13.2%) | 53 (12.0%) |
| 65 to 69 Years | 31 (5.8%) | 54 (12.2%) |
| 70 to 74 Years | 82 (15.3%) | 64 (14.4%) |
| 75 to 79 Years | 8 (1.5%) | 29 (6.6%) |
| 80 to 84 Years | 13 (2.4%) | 0 (0.0%) |
| 85 Years and over | 0 (0.0%) | 11 (2.5%) |
| Total | 537 (100.0%) | 443 (100.0%) |
Families and Households in Bayside Gardens
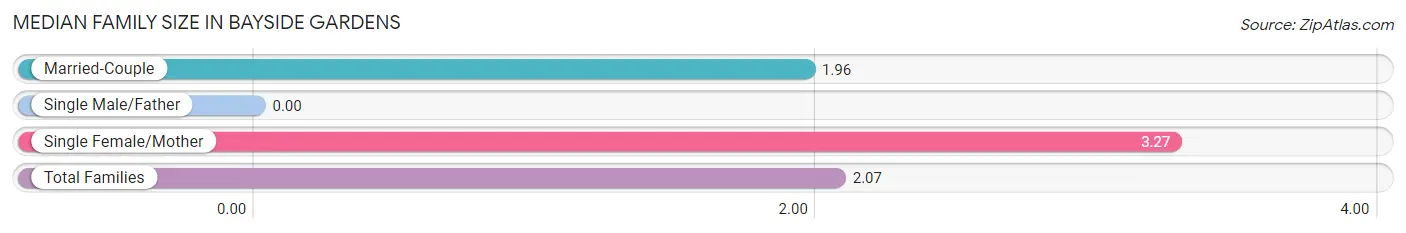
Median Family Size in Bayside Gardens
| Family Type | # Families | Family Size |
| Married-Couple | 334 (91.8%) | 1.96 |
| Single Male/Father | 0 (0.0%) | - |
| Single Female/Mother | 30 (8.2%) | 3.27 |
| Total Families | 364 (100.0%) | 2.07 |
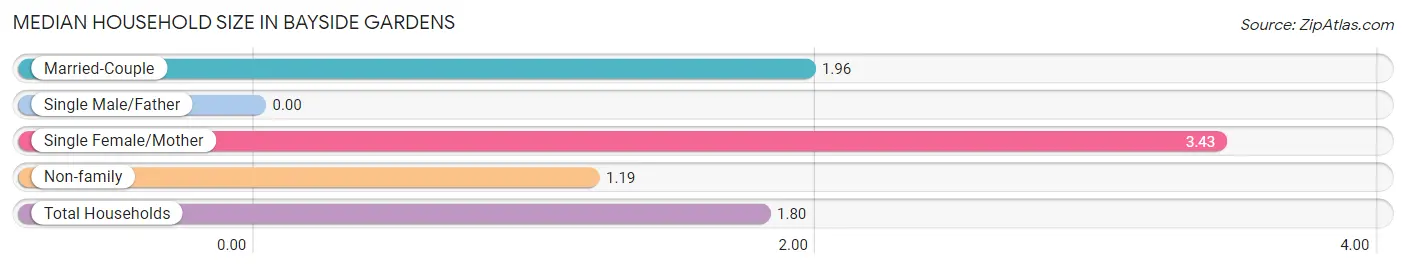
Median Household Size in Bayside Gardens
| Household Type | # Households | Household Size |
| Married-Couple | 334 (62.9%) | 1.96 |
| Single Male/Father | 0 (0.0%) | - |
| Single Female/Mother | 30 (5.7%) | 3.43 |
| Non-family | 167 (31.5%) | 1.19 |
| Total Households | 531 (100.0%) | 1.80 |
Household Size by Marriage Status in Bayside Gardens
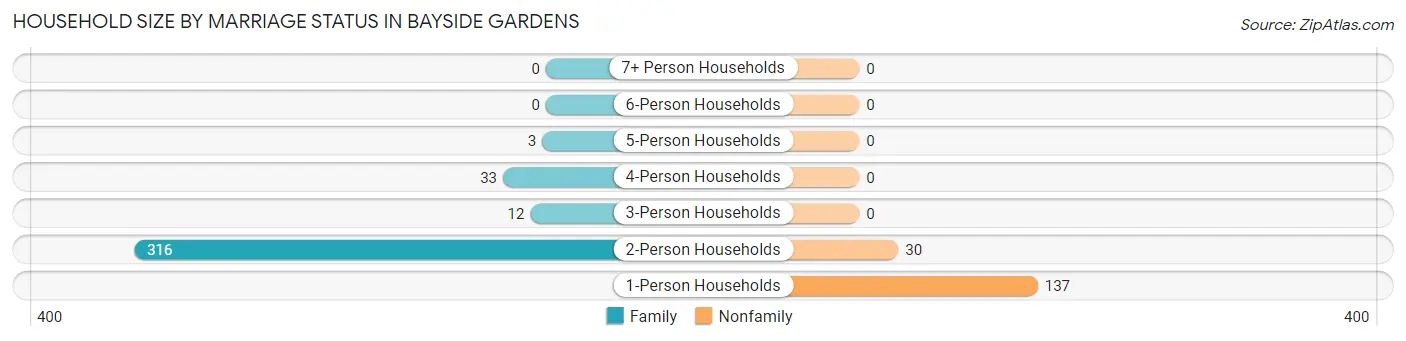
Out of a total of 531 households in Bayside Gardens, 364 (68.5%) are family households, while 167 (31.5%) are nonfamily households. The most numerous type of family households are 2-person households, comprising 316, and the most common type of nonfamily households are 1-person households, comprising 137.
| Household Size | Family Households | Nonfamily Households |
| 1-Person Households | - | 137 (25.8%) |
| 2-Person Households | 316 (59.5%) | 30 (5.7%) |
| 3-Person Households | 12 (2.3%) | 0 (0.0%) |
| 4-Person Households | 33 (6.2%) | 0 (0.0%) |
| 5-Person Households | 3 (0.6%) | 0 (0.0%) |
| 6-Person Households | 0 (0.0%) | 0 (0.0%) |
| 7+ Person Households | 0 (0.0%) | 0 (0.0%) |
| Total | 364 (68.5%) | 167 (31.5%) |
Female Fertility in Bayside Gardens
Fertility by Age in Bayside Gardens
| Age Bracket | Women with Births | Births / 1,000 Women |
| 15 to 19 years | 0 (0.0%) | 0.0 |
| 20 to 34 years | 0 (0.0%) | 0.0 |
| 35 to 50 years | 0 (0.0%) | 0.0 |
| Total | 0 (0.0%) | 0.0 |
Fertility by Age by Marriage Status in Bayside Gardens
| Age Bracket | Married | Unmarried |
| 15 to 19 years | 0 (0.0%) | 0 (0.0%) |
| 20 to 34 years | 0 (0.0%) | 0 (0.0%) |
| 35 to 50 years | 0 (0.0%) | 0 (0.0%) |
| Total | 0 (0.0%) | 0 (0.0%) |
Fertility by Education in Bayside Gardens
| Educational Attainment | Women with Births | Births / 1,000 Women |
| Less than High School | 0 (0.0%) | 0.0 |
| High School Diploma | 0 (0.0%) | 0.0 |
| College or Associate's Degree | 0 (0.0%) | 0.0 |
| Bachelor's Degree | 0 (0.0%) | 0.0 |
| Graduate Degree | 0 (0.0%) | 0.0 |
| Total | 0 (0.0%) | 0.0 |
Fertility by Education by Marriage Status in Bayside Gardens
| Educational Attainment | Married | Unmarried |
| Less than High School | 0 (0.0%) | 0 (0.0%) |
| High School Diploma | 0 (0.0%) | 0 (0.0%) |
| College or Associate's Degree | 0 (0.0%) | 0 (0.0%) |
| Bachelor's Degree | 0 (0.0%) | 0 (0.0%) |
| Graduate Degree | 0 (0.0%) | 0 (0.0%) |
| Total | 0 (0.0%) | 0 (0.0%) |
Income in Bayside Gardens
Income Overview in Bayside Gardens
Per Capita Income in Bayside Gardens is $47,984, while median incomes of families and households are $74,900 and $73,813 respectively.
| Characteristic | Number | Measure |
| Per Capita Income | 980 | $47,984 |
| Median Family Income | 364 | $74,900 |
| Mean Family Income | 364 | $107,483 |
| Median Household Income | 531 | $73,813 |
| Mean Household Income | 531 | $92,751 |
| Income Deficit | 364 | $0 |
| Wage / Income Gap (%) | 980 | 25.23% |
| Wage / Income Gap ($) | 980 | 74.77¢ per $1 |
| Gini / Inequality Index | 980 | 0.36 |
Earnings by Sex in Bayside Gardens
Average Earnings in Bayside Gardens are $54,402, $66,944 for men and $50,052 for women, a difference of 25.2%.
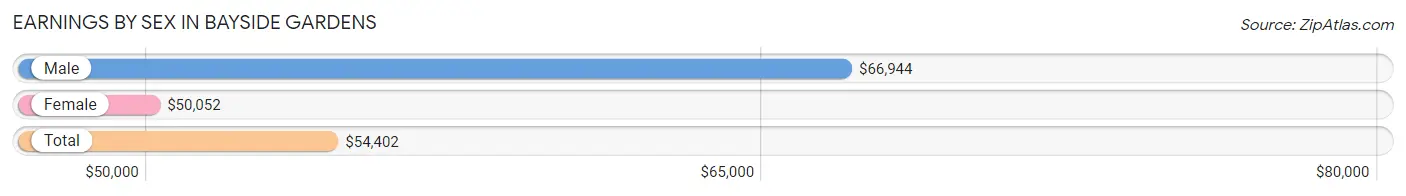
| Sex | Number | Average Earnings |
| Male | 326 (64.8%) | $66,944 |
| Female | 177 (35.2%) | $50,052 |
| Total | 503 (100.0%) | $54,402 |
Earnings by Sex by Income Bracket in Bayside Gardens
The most common earnings brackets in Bayside Gardens are $65,000 to $74,999 for men (118 | 36.2%) and $40,000 to $44,999 for women (54 | 30.5%).
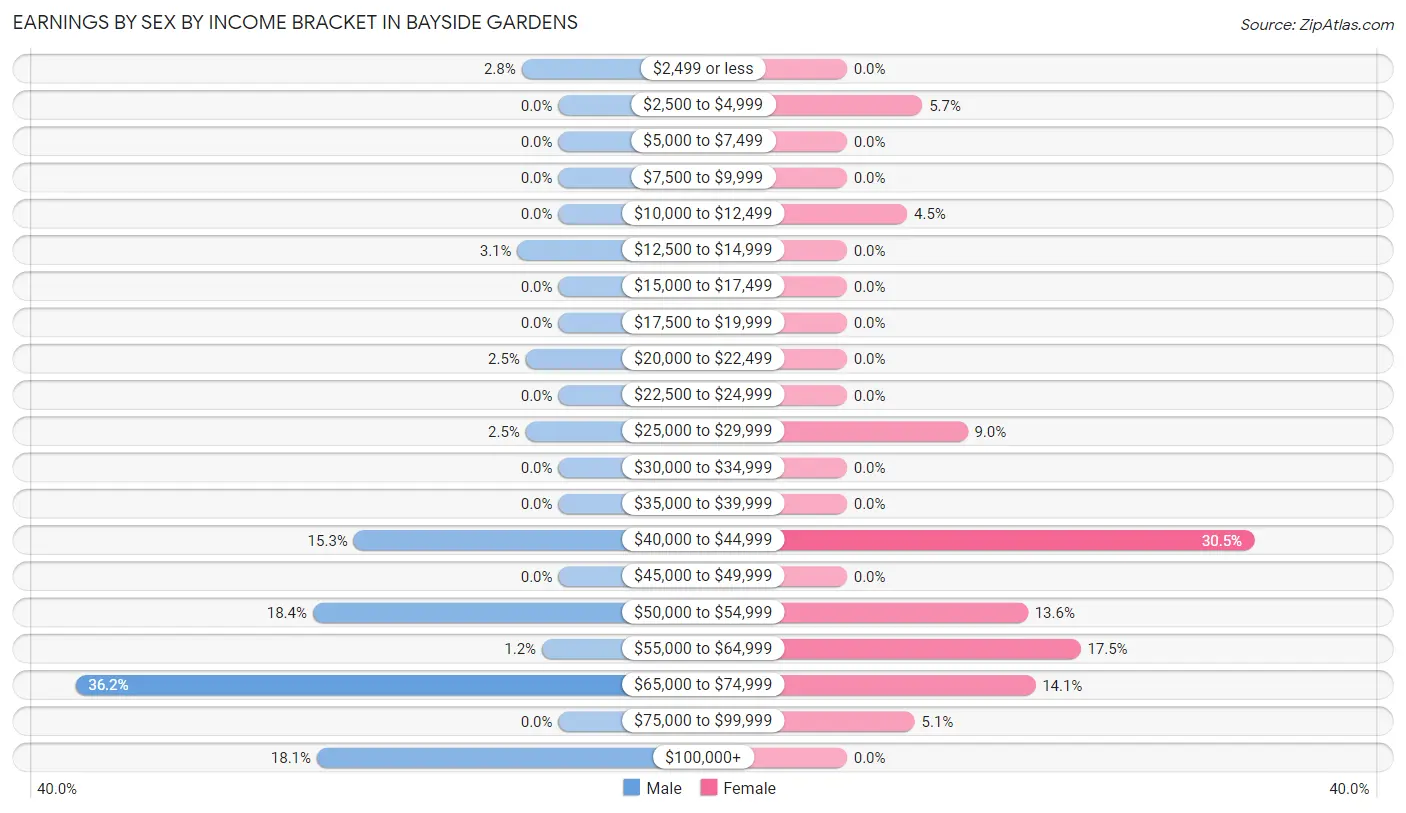
| Income | Male | Female |
| $2,499 or less | 9 (2.8%) | 0 (0.0%) |
| $2,500 to $4,999 | 0 (0.0%) | 10 (5.7%) |
| $5,000 to $7,499 | 0 (0.0%) | 0 (0.0%) |
| $7,500 to $9,999 | 0 (0.0%) | 0 (0.0%) |
| $10,000 to $12,499 | 0 (0.0%) | 8 (4.5%) |
| $12,500 to $14,999 | 10 (3.1%) | 0 (0.0%) |
| $15,000 to $17,499 | 0 (0.0%) | 0 (0.0%) |
| $17,500 to $19,999 | 0 (0.0%) | 0 (0.0%) |
| $20,000 to $22,499 | 8 (2.5%) | 0 (0.0%) |
| $22,500 to $24,999 | 0 (0.0%) | 0 (0.0%) |
| $25,000 to $29,999 | 8 (2.5%) | 16 (9.0%) |
| $30,000 to $34,999 | 0 (0.0%) | 0 (0.0%) |
| $35,000 to $39,999 | 0 (0.0%) | 0 (0.0%) |
| $40,000 to $44,999 | 50 (15.3%) | 54 (30.5%) |
| $45,000 to $49,999 | 0 (0.0%) | 0 (0.0%) |
| $50,000 to $54,999 | 60 (18.4%) | 24 (13.6%) |
| $55,000 to $64,999 | 4 (1.2%) | 31 (17.5%) |
| $65,000 to $74,999 | 118 (36.2%) | 25 (14.1%) |
| $75,000 to $99,999 | 0 (0.0%) | 9 (5.1%) |
| $100,000+ | 59 (18.1%) | 0 (0.0%) |
| Total | 326 (100.0%) | 177 (100.0%) |
Earnings by Sex by Educational Attainment in Bayside Gardens
Average earnings in Bayside Gardens are $66,944 for men and $50,208 for women, a difference of 25.0%. Men with an educational attainment of high school diploma enjoy the highest average annual earnings of $73,582, while those with college or associate's degree education earn the least with $52,115. Women with an educational attainment of bachelor's degree earn the most with the average annual earnings of $52,031, while those with college or associate's degree education have the smallest earnings of $41,995.
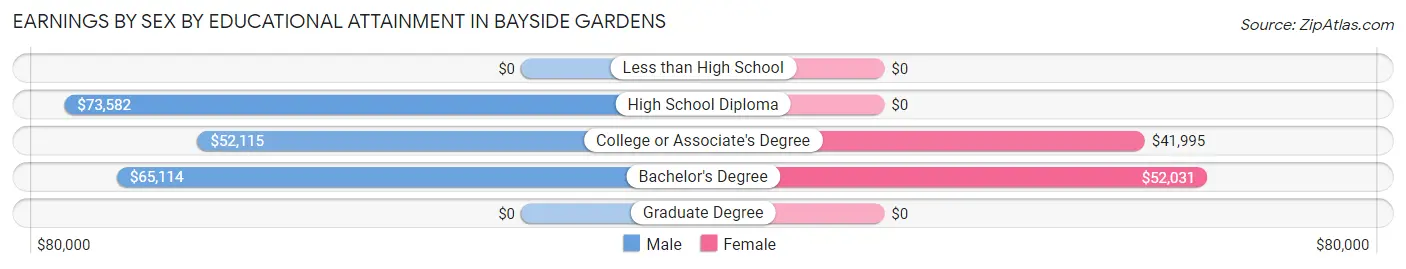
| Educational Attainment | Male Income | Female Income |
| Less than High School | - | - |
| High School Diploma | $73,582 | $0 |
| College or Associate's Degree | $52,115 | $41,995 |
| Bachelor's Degree | $65,114 | $52,031 |
| Graduate Degree | - | - |
| Total | $66,944 | $50,208 |
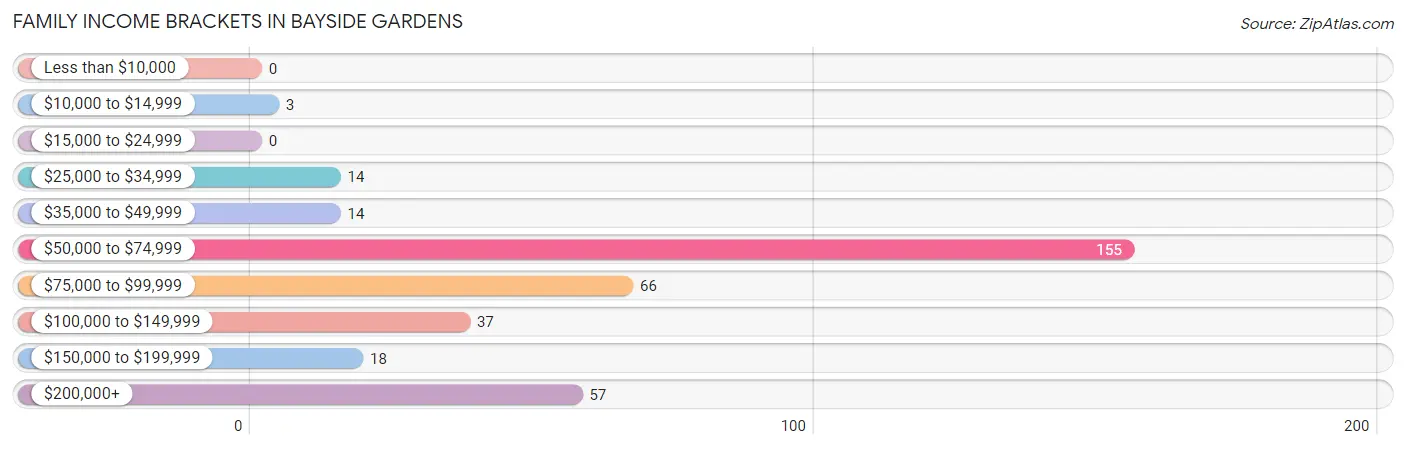
Family Income in Bayside Gardens
Family Income Brackets in Bayside Gardens
According to the Bayside Gardens family income data, there are 155 families falling into the $50,000 to $74,999 income range, which is the most common income bracket and makes up 42.6% of all families.
| Income Bracket | # Families | % Families |
| Less than $10,000 | 0 | 0.0% |
| $10,000 to $14,999 | 3 | 0.8% |
| $15,000 to $24,999 | 0 | 0.0% |
| $25,000 to $34,999 | 14 | 3.8% |
| $35,000 to $49,999 | 14 | 3.8% |
| $50,000 to $74,999 | 155 | 42.6% |
| $75,000 to $99,999 | 66 | 18.1% |
| $100,000 to $149,999 | 37 | 10.2% |
| $150,000 to $199,999 | 18 | 4.9% |
| $200,000+ | 57 | 15.7% |
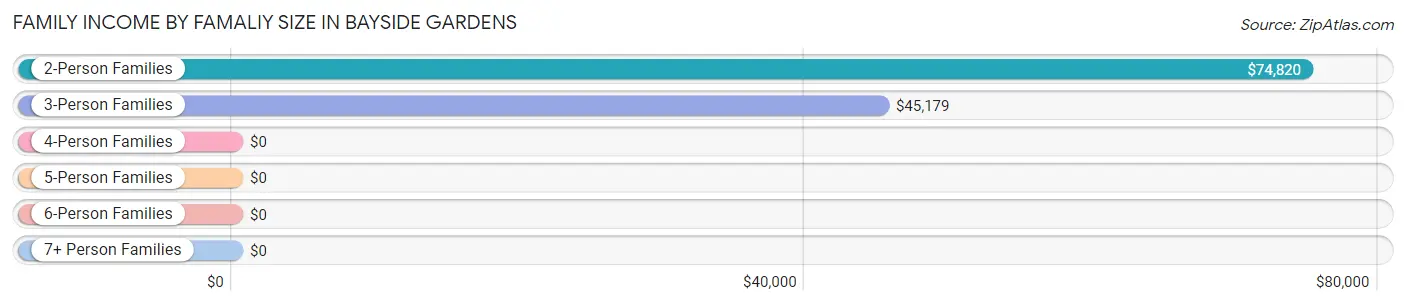
Family Income by Famaliy Size in Bayside Gardens
2-person families (316 | 86.8%) account for the highest median family income in Bayside Gardens with $74,820 per family, while 2-person families (316 | 86.8%) have the highest median income of $37,410 per family member.
| Income Bracket | # Families | Median Income |
| 2-Person Families | 316 (86.8%) | $74,820 |
| 3-Person Families | 23 (6.3%) | $45,179 |
| 4-Person Families | 22 (6.0%) | $0 |
| 5-Person Families | 3 (0.8%) | $0 |
| 6-Person Families | 0 (0.0%) | $0 |
| 7+ Person Families | 0 (0.0%) | $0 |
| Total | 364 (100.0%) | $74,900 |
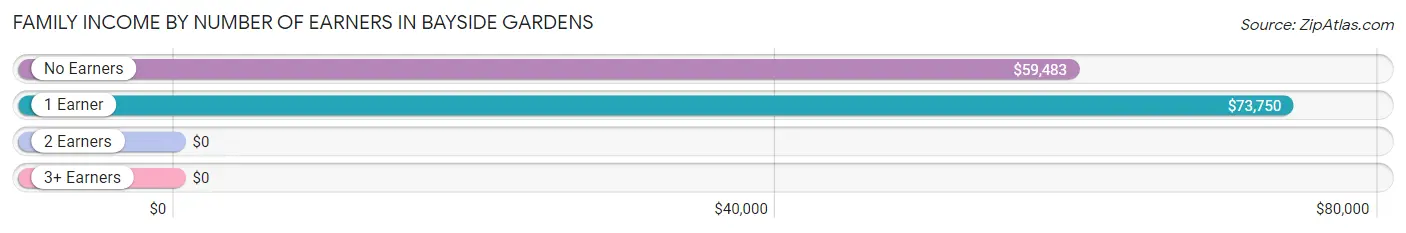
Family Income by Number of Earners in Bayside Gardens
| Number of Earners | # Families | Median Income |
| No Earners | 72 (19.8%) | $59,483 |
| 1 Earner | 133 (36.5%) | $73,750 |
| 2 Earners | 136 (37.4%) | $0 |
| 3+ Earners | 23 (6.3%) | $0 |
| Total | 364 (100.0%) | $74,900 |
Household Income in Bayside Gardens
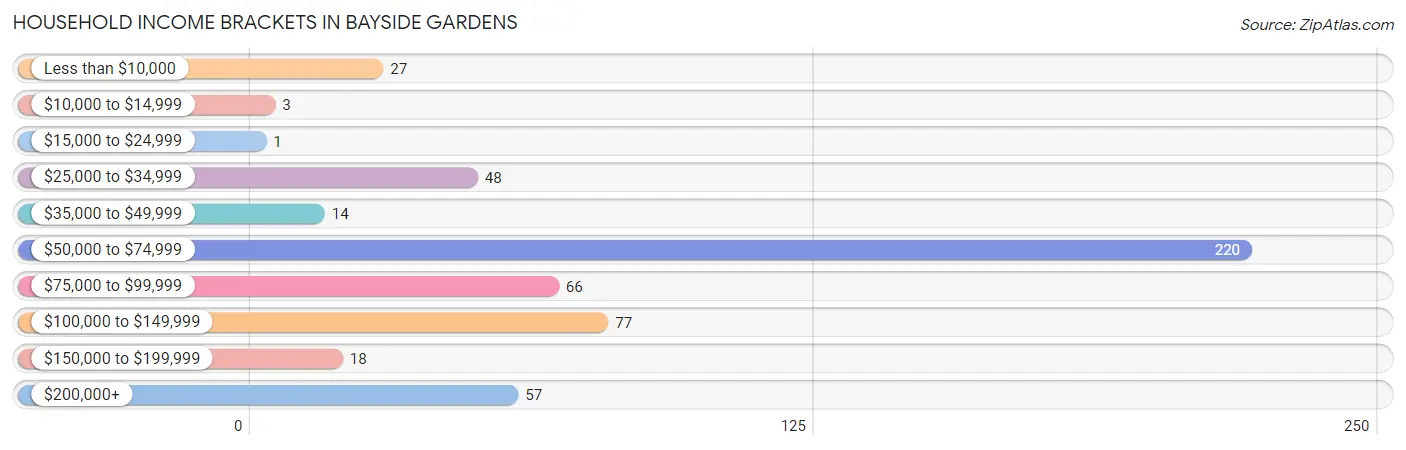
Household Income Brackets in Bayside Gardens
With 220 households falling in the category, the $50,000 to $74,999 income range is the most frequent in Bayside Gardens, accounting for 41.4% of all households. In contrast, only 1 households (0.2%) fall into the $15,000 to $24,999 income bracket, making it the least populous group.
| Income Bracket | # Households | % Households |
| Less than $10,000 | 27 | 5.1% |
| $10,000 to $14,999 | 3 | 0.6% |
| $15,000 to $24,999 | 1 | 0.2% |
| $25,000 to $34,999 | 48 | 9.0% |
| $35,000 to $49,999 | 14 | 2.6% |
| $50,000 to $74,999 | 220 | 41.4% |
| $75,000 to $99,999 | 66 | 12.4% |
| $100,000 to $149,999 | 77 | 14.5% |
| $150,000 to $199,999 | 18 | 3.4% |
| $200,000+ | 57 | 10.7% |
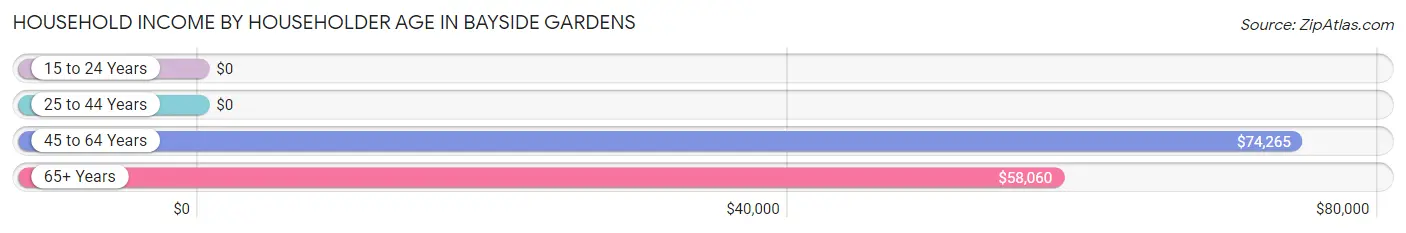
Household Income by Householder Age in Bayside Gardens
The median household income in Bayside Gardens is $73,813, with the highest median household income of $74,265 found in the 45 to 64 years age bracket for the primary householder. A total of 283 households (53.3%) fall into this category.
| Income Bracket | # Households | Median Income |
| 15 to 24 Years | 0 (0.0%) | $0 |
| 25 to 44 Years | 63 (11.9%) | $0 |
| 45 to 64 Years | 283 (53.3%) | $74,265 |
| 65+ Years | 185 (34.8%) | $58,060 |
| Total | 531 (100.0%) | $73,813 |
Poverty in Bayside Gardens
Income Below Poverty by Sex and Age in Bayside Gardens
With 6.9% poverty level for males and 1.3% for females among the residents of Bayside Gardens, 18 to 24 year old males and 6 to 11 year old females are the most vulnerable to poverty, with 3 males (100.0%) and 3 females (5.6%) in their respective age groups living below the poverty level.
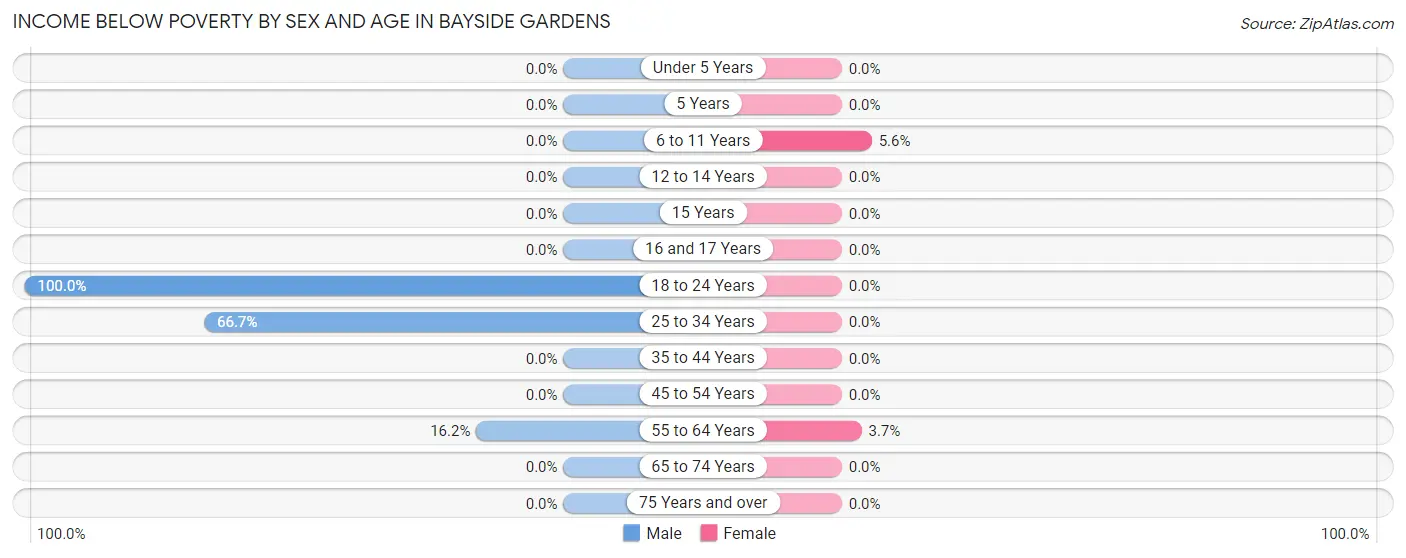
| Age Bracket | Male | Female |
| Under 5 Years | 0 (0.0%) | 0 (0.0%) |
| 5 Years | 0 (0.0%) | 0 (0.0%) |
| 6 to 11 Years | 0 (0.0%) | 3 (5.6%) |
| 12 to 14 Years | 0 (0.0%) | 0 (0.0%) |
| 15 Years | 0 (0.0%) | 0 (0.0%) |
| 16 and 17 Years | 0 (0.0%) | 0 (0.0%) |
| 18 to 24 Years | 3 (100.0%) | 0 (0.0%) |
| 25 to 34 Years | 6 (66.7%) | 0 (0.0%) |
| 35 to 44 Years | 0 (0.0%) | 0 (0.0%) |
| 45 to 54 Years | 0 (0.0%) | 0 (0.0%) |
| 55 to 64 Years | 27 (16.2%) | 3 (3.7%) |
| 65 to 74 Years | 0 (0.0%) | 0 (0.0%) |
| 75 Years and over | 0 (0.0%) | 0 (0.0%) |
| Total | 36 (6.9%) | 6 (1.3%) |
Income Above Poverty by Sex and Age in Bayside Gardens
According to the poverty statistics in Bayside Gardens, males aged under 5 years and females aged 16 and 17 years are the age groups that are most secure financially, with 100.0% of males and 100.0% of females in these age groups living above the poverty line.
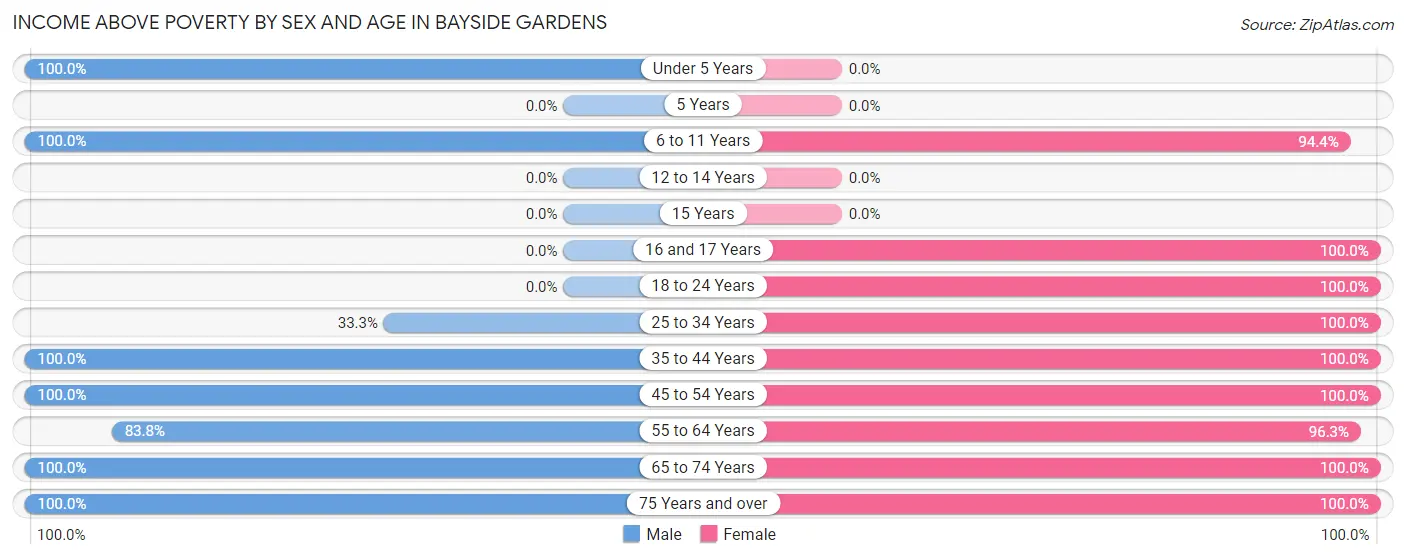
| Age Bracket | Male | Female |
| Under 5 Years | 7 (100.0%) | 0 (0.0%) |
| 5 Years | 0 (0.0%) | 0 (0.0%) |
| 6 to 11 Years | 8 (100.0%) | 51 (94.4%) |
| 12 to 14 Years | 0 (0.0%) | 0 (0.0%) |
| 15 Years | 0 (0.0%) | 0 (0.0%) |
| 16 and 17 Years | 0 (0.0%) | 9 (100.0%) |
| 18 to 24 Years | 0 (0.0%) | 3 (100.0%) |
| 25 to 34 Years | 3 (33.3%) | 36 (100.0%) |
| 35 to 44 Years | 93 (100.0%) | 11 (100.0%) |
| 45 to 54 Years | 116 (100.0%) | 90 (100.0%) |
| 55 to 64 Years | 140 (83.8%) | 79 (96.3%) |
| 65 to 74 Years | 106 (100.0%) | 118 (100.0%) |
| 75 Years and over | 13 (100.0%) | 40 (100.0%) |
| Total | 486 (93.1%) | 437 (98.7%) |
Income Below Poverty Among Married-Couple Families in Bayside Gardens
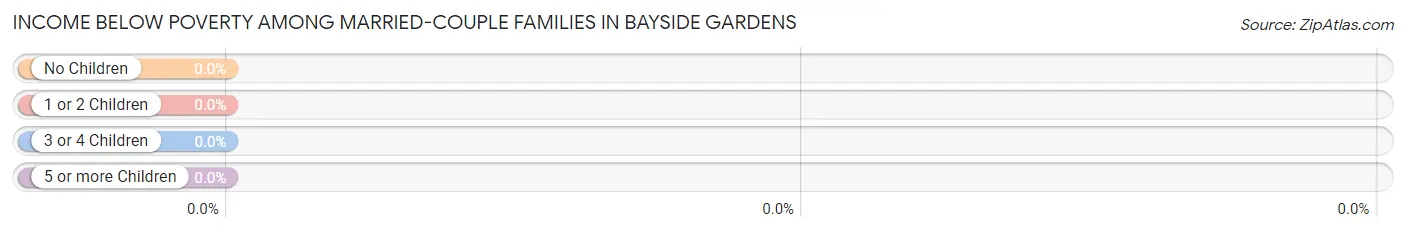
| Children | Above Poverty | Below Poverty |
| No Children | 327 (100.0%) | 0 (0.0%) |
| 1 or 2 Children | 4 (100.0%) | 0 (0.0%) |
| 3 or 4 Children | 3 (100.0%) | 0 (0.0%) |
| 5 or more Children | 0 (0.0%) | 0 (0.0%) |
| Total | 334 (100.0%) | 0 (0.0%) |
Income Below Poverty Among Single-Parent Households in Bayside Gardens
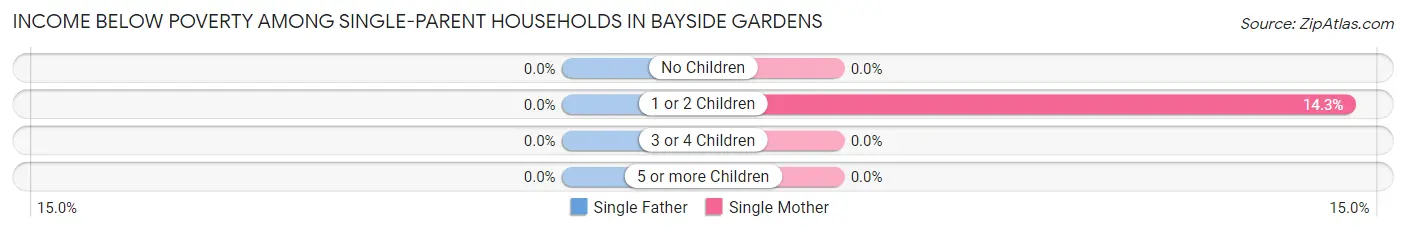
| Children | Single Father | Single Mother |
| No Children | 0 (0.0%) | 0 (0.0%) |
| 1 or 2 Children | 0 (0.0%) | 3 (14.3%) |
| 3 or 4 Children | 0 (0.0%) | 0 (0.0%) |
| 5 or more Children | 0 (0.0%) | 0 (0.0%) |
| Total | 0 (0.0%) | 3 (10.0%) |
Income Below Poverty Among Married-Couple vs Single-Parent Households in Bayside Gardens
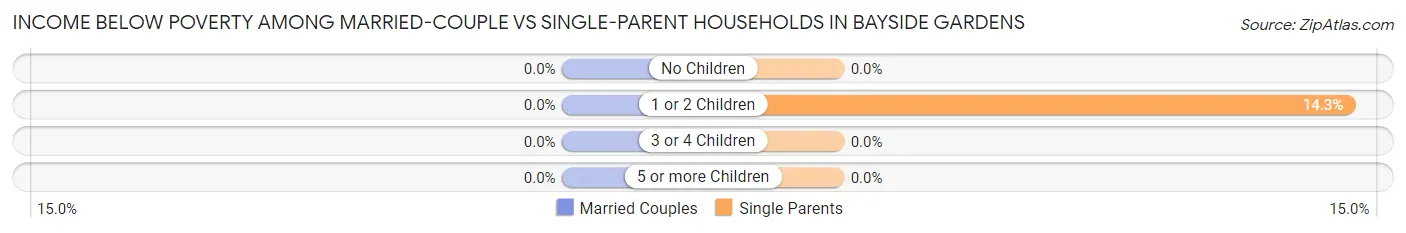
| Children | Married-Couple Families | Single-Parent Households |
| No Children | 0 (0.0%) | 0 (0.0%) |
| 1 or 2 Children | 0 (0.0%) | 3 (14.3%) |
| 3 or 4 Children | 0 (0.0%) | 0 (0.0%) |
| 5 or more Children | 0 (0.0%) | 0 (0.0%) |
| Total | 0 (0.0%) | 3 (10.0%) |
Employment Characteristics in Bayside Gardens
Employment by Class of Employer in Bayside Gardens
Among the 475 employed individuals in Bayside Gardens, private company employees (298 | 62.7%), state government employees (60 | 12.6%), and self-employed (not incorporated) (46 | 9.7%) make up the most common classes of employment.
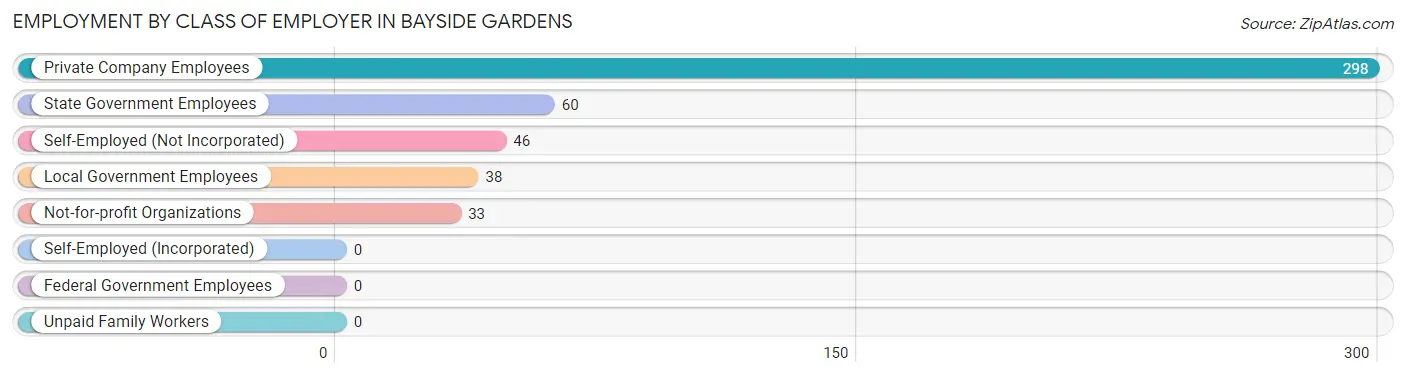
| Employer Class | # Employees | % Employees |
| Private Company Employees | 298 | 62.7% |
| Self-Employed (Incorporated) | 0 | 0.0% |
| Self-Employed (Not Incorporated) | 46 | 9.7% |
| Not-for-profit Organizations | 33 | 7.0% |
| Local Government Employees | 38 | 8.0% |
| State Government Employees | 60 | 12.6% |
| Federal Government Employees | 0 | 0.0% |
| Unpaid Family Workers | 0 | 0.0% |
| Total | 475 | 100.0% |
Employment Status by Age in Bayside Gardens
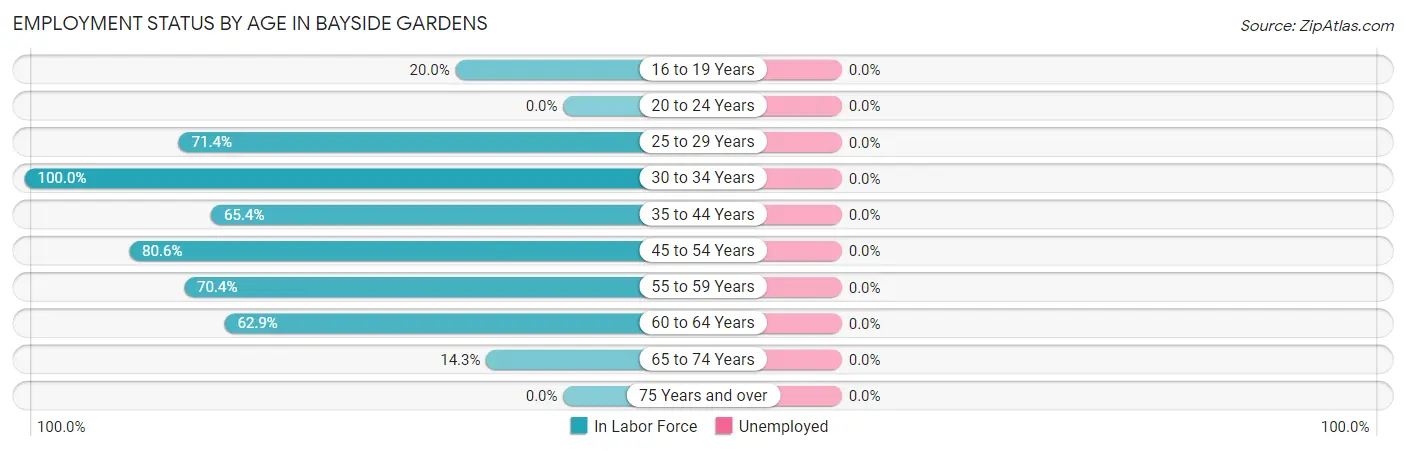
| Age Bracket | In Labor Force | Unemployed |
| 16 to 19 Years | 3 (20.0%) | 0 (0.0%) |
| 20 to 24 Years | 0 (0.0%) | 0 (0.0%) |
| 25 to 29 Years | 15 (71.4%) | 0 (0.0%) |
| 30 to 34 Years | 24 (100.0%) | 0 (0.0%) |
| 35 to 44 Years | 68 (65.4%) | 0 (0.0%) |
| 45 to 54 Years | 166 (80.6%) | 0 (0.0%) |
| 55 to 59 Years | 88 (70.4%) | 0 (0.0%) |
| 60 to 64 Years | 78 (62.9%) | 0 (0.0%) |
| 65 to 74 Years | 33 (14.3%) | 0 (0.0%) |
| 75 Years and over | 0 (0.0%) | 0 (0.0%) |
| Total | 475 (52.1%) | 0 (0.0%) |
Employment Status by Educational Attainment in Bayside Gardens
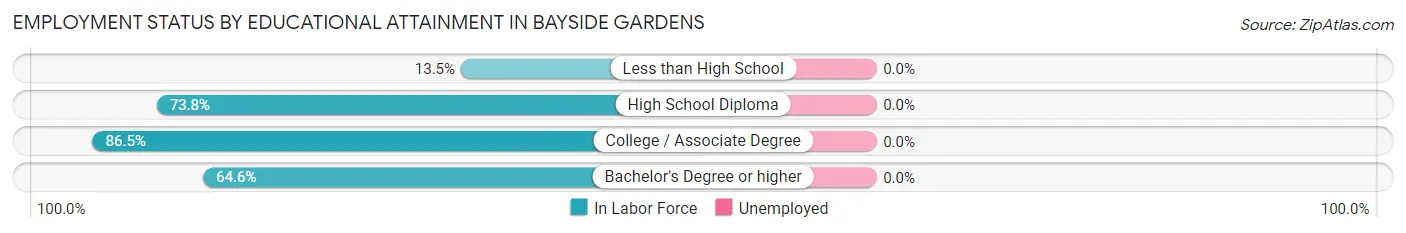
| Educational Attainment | In Labor Force | Unemployed |
| Less than High School | 7 (13.5%) | 0 (0.0%) |
| High School Diploma | 121 (73.8%) | 0 (0.0%) |
| College / Associate Degree | 238 (86.5%) | 0 (0.0%) |
| Bachelor's Degree or higher | 73 (64.6%) | 0 (0.0%) |
| Total | 439 (72.7%) | 0 (0.0%) |
Employment Occupations by Sex in Bayside Gardens
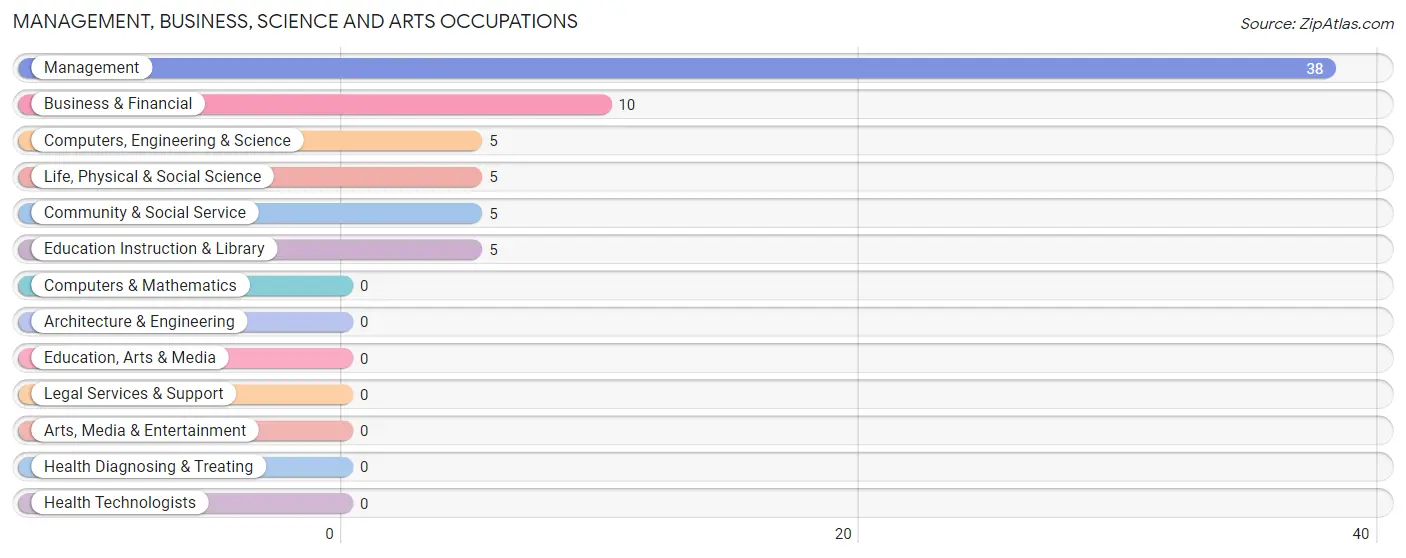
Management, Business, Science and Arts Occupations
The most common Management, Business, Science and Arts occupations in Bayside Gardens are Management (38 | 8.0%), Business & Financial (10 | 2.1%), Computers, Engineering & Science (5 | 1.1%), Life, Physical & Social Science (5 | 1.1%), and Community & Social Service (5 | 1.1%).
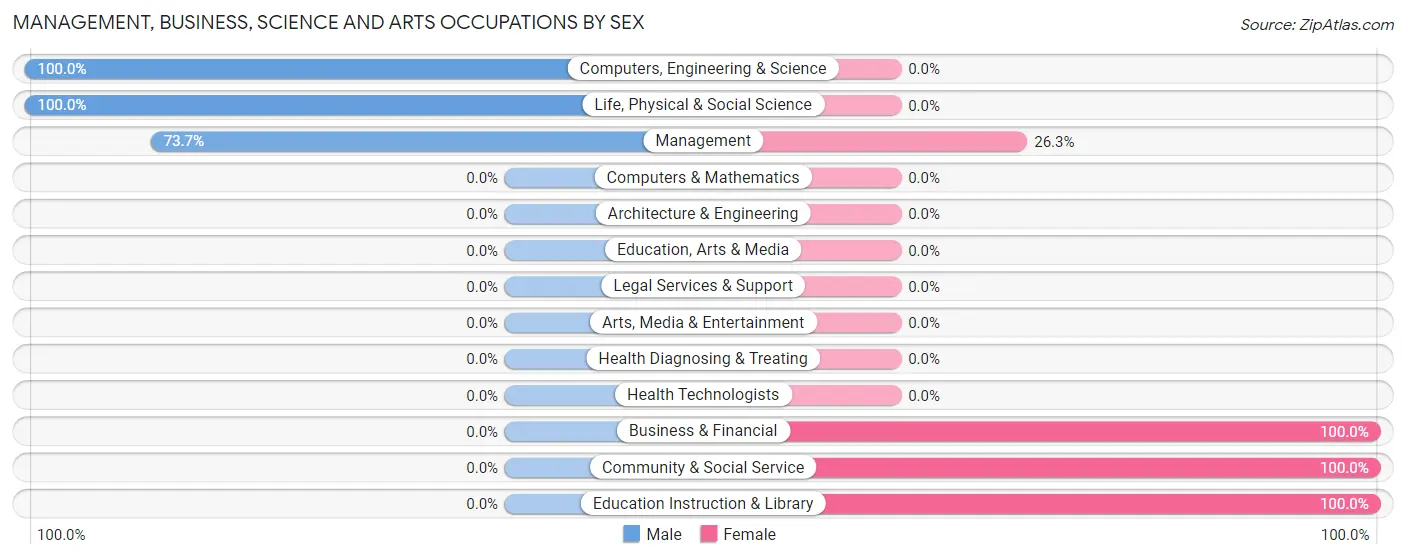
Management, Business, Science and Arts Occupations by Sex
Within the Management, Business, Science and Arts occupations in Bayside Gardens, the most male-oriented occupations are Computers, Engineering & Science (100.0%), Life, Physical & Social Science (100.0%), and Management (73.7%), while the most female-oriented occupations are Business & Financial (100.0%), Community & Social Service (100.0%), and Education Instruction & Library (100.0%).
| Occupation | Male | Female |
| Management | 28 (73.7%) | 10 (26.3%) |
| Business & Financial | 0 (0.0%) | 10 (100.0%) |
| Computers, Engineering & Science | 5 (100.0%) | 0 (0.0%) |
| Computers & Mathematics | 0 (0.0%) | 0 (0.0%) |
| Architecture & Engineering | 0 (0.0%) | 0 (0.0%) |
| Life, Physical & Social Science | 5 (100.0%) | 0 (0.0%) |
| Community & Social Service | 0 (0.0%) | 5 (100.0%) |
| Education, Arts & Media | 0 (0.0%) | 0 (0.0%) |
| Legal Services & Support | 0 (0.0%) | 0 (0.0%) |
| Education Instruction & Library | 0 (0.0%) | 5 (100.0%) |
| Arts, Media & Entertainment | 0 (0.0%) | 0 (0.0%) |
| Health Diagnosing & Treating | 0 (0.0%) | 0 (0.0%) |
| Health Technologists | 0 (0.0%) | 0 (0.0%) |
| Total (Category) | 33 (56.9%) | 25 (43.1%) |
| Total (Overall) | 309 (65.0%) | 166 (34.9%) |
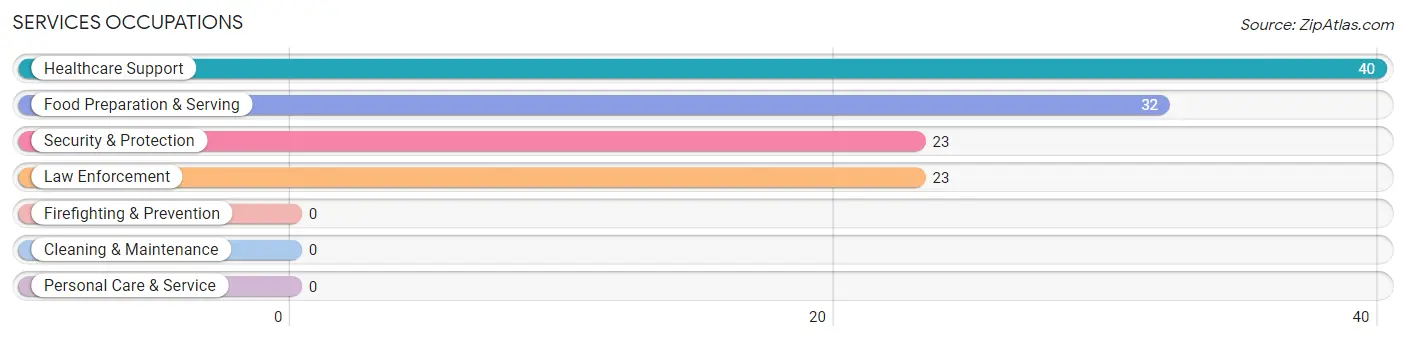
Services Occupations
The most common Services occupations in Bayside Gardens are Healthcare Support (40 | 8.4%), Food Preparation & Serving (32 | 6.7%), Security & Protection (23 | 4.8%), and Law Enforcement (23 | 4.8%).
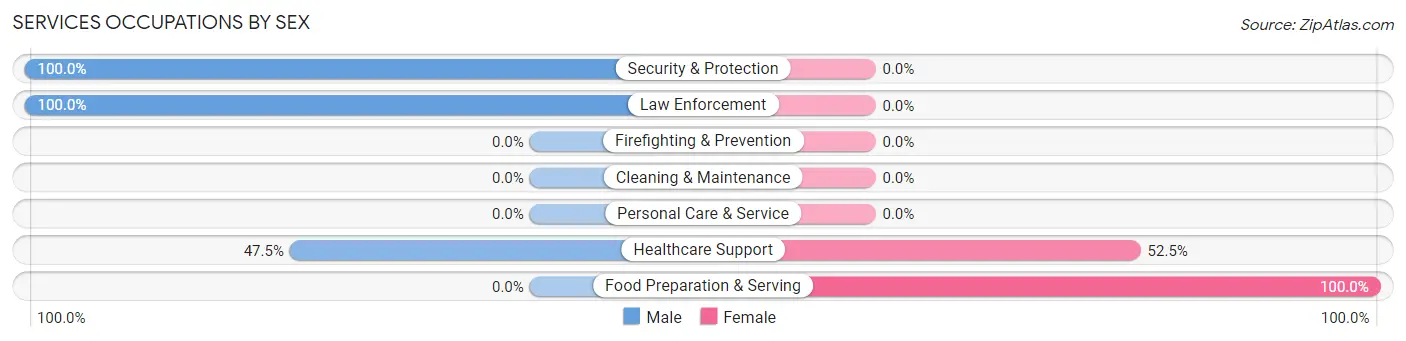
Services Occupations by Sex
Within the Services occupations in Bayside Gardens, the most male-oriented occupations are Security & Protection (100.0%), Law Enforcement (100.0%), and Healthcare Support (47.5%), while the most female-oriented occupations are Food Preparation & Serving (100.0%), and Healthcare Support (52.5%).
| Occupation | Male | Female |
| Healthcare Support | 19 (47.5%) | 21 (52.5%) |
| Security & Protection | 23 (100.0%) | 0 (0.0%) |
| Firefighting & Prevention | 0 (0.0%) | 0 (0.0%) |
| Law Enforcement | 23 (100.0%) | 0 (0.0%) |
| Food Preparation & Serving | 0 (0.0%) | 32 (100.0%) |
| Cleaning & Maintenance | 0 (0.0%) | 0 (0.0%) |
| Personal Care & Service | 0 (0.0%) | 0 (0.0%) |
| Total (Category) | 42 (44.2%) | 53 (55.8%) |
| Total (Overall) | 309 (65.0%) | 166 (34.9%) |
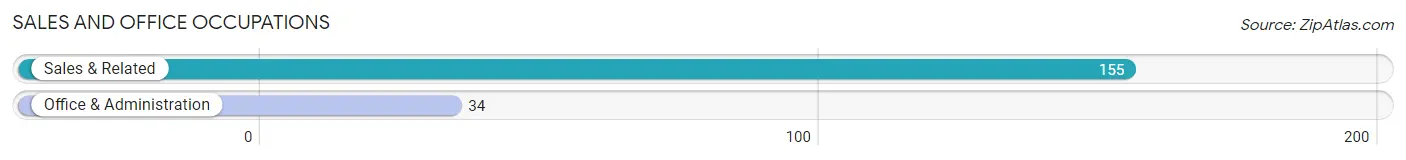
Sales and Office Occupations
The most common Sales and Office occupations in Bayside Gardens are Sales & Related (155 | 32.6%), and Office & Administration (34 | 7.2%).
Sales and Office Occupations by Sex
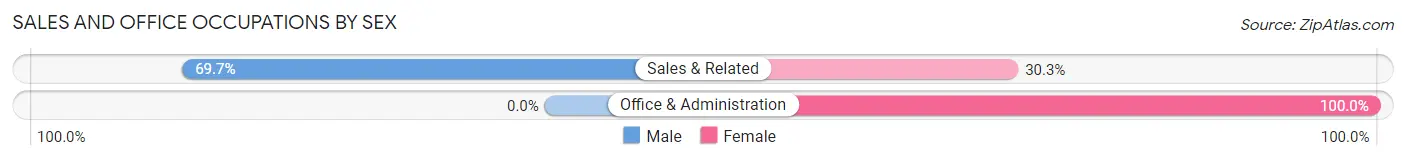
| Occupation | Male | Female |
| Sales & Related | 108 (69.7%) | 47 (30.3%) |
| Office & Administration | 0 (0.0%) | 34 (100.0%) |
| Total (Category) | 108 (57.1%) | 81 (42.9%) |
| Total (Overall) | 309 (65.0%) | 166 (34.9%) |
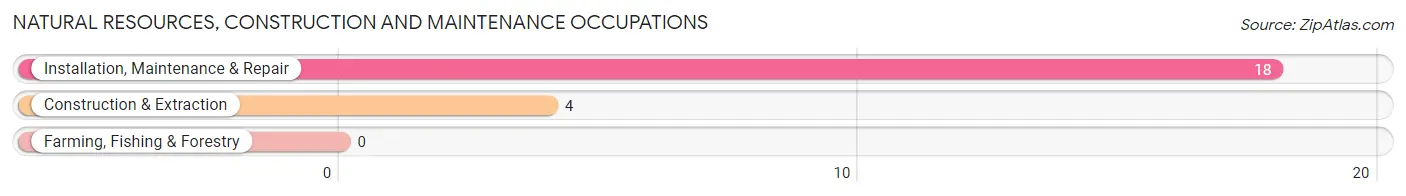
Natural Resources, Construction and Maintenance Occupations
The most common Natural Resources, Construction and Maintenance occupations in Bayside Gardens are Installation, Maintenance & Repair (18 | 3.8%), and Construction & Extraction (4 | 0.8%).
Natural Resources, Construction and Maintenance Occupations by Sex
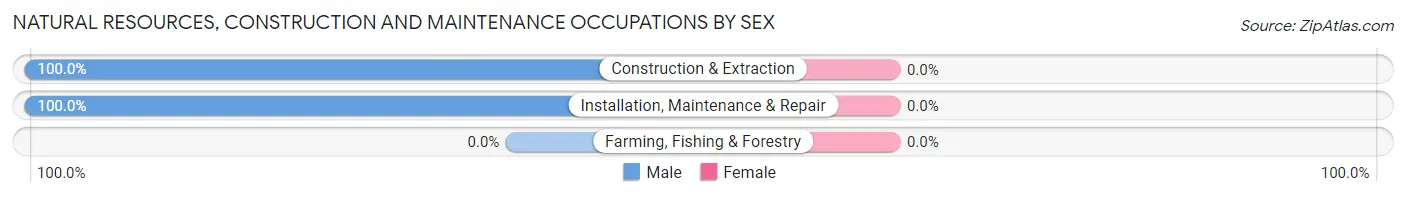
| Occupation | Male | Female |
| Farming, Fishing & Forestry | 0 (0.0%) | 0 (0.0%) |
| Construction & Extraction | 4 (100.0%) | 0 (0.0%) |
| Installation, Maintenance & Repair | 18 (100.0%) | 0 (0.0%) |
| Total (Category) | 22 (100.0%) | 0 (0.0%) |
| Total (Overall) | 309 (65.0%) | 166 (34.9%) |
Production, Transportation and Moving Occupations
The most common Production, Transportation and Moving occupations in Bayside Gardens are Transportation (45 | 9.5%), Production (34 | 7.2%), and Material Moving (32 | 6.7%).
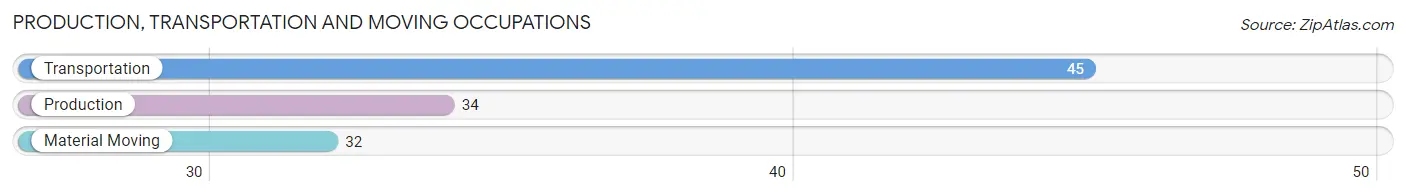
Production, Transportation and Moving Occupations by Sex
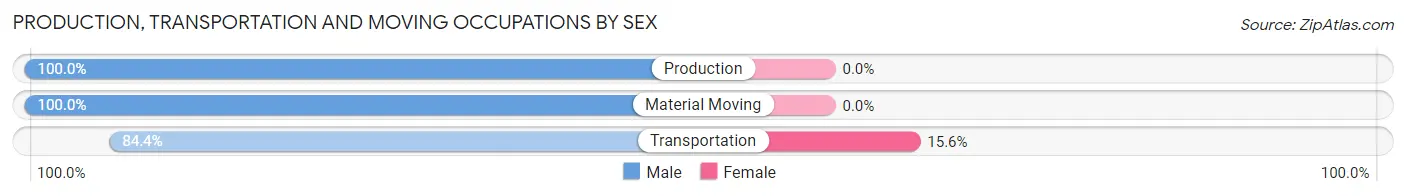
| Occupation | Male | Female |
| Production | 34 (100.0%) | 0 (0.0%) |
| Transportation | 38 (84.4%) | 7 (15.6%) |
| Material Moving | 32 (100.0%) | 0 (0.0%) |
| Total (Category) | 104 (93.7%) | 7 (6.3%) |
| Total (Overall) | 309 (65.0%) | 166 (34.9%) |
Employment Industries by Sex in Bayside Gardens
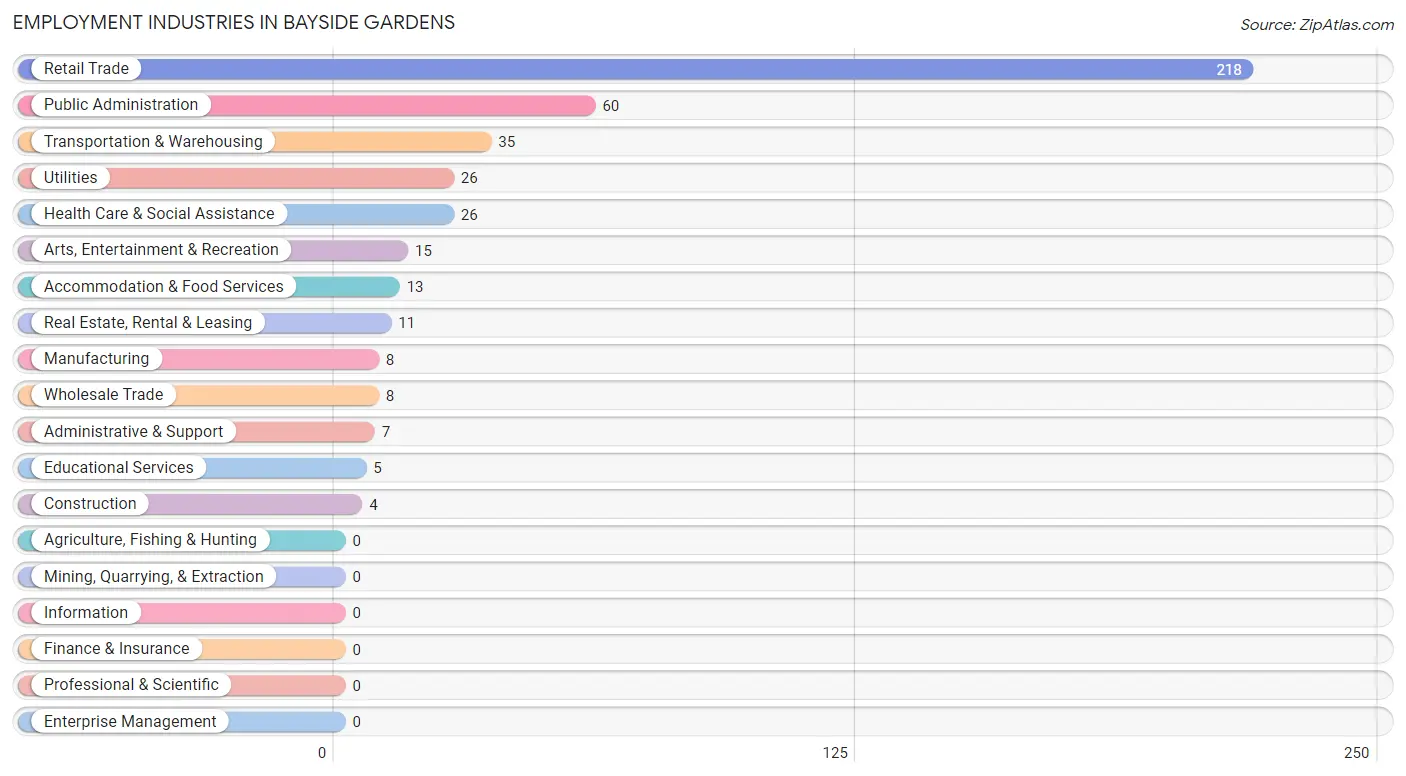
Employment Industries in Bayside Gardens
The major employment industries in Bayside Gardens include Retail Trade (218 | 45.9%), Public Administration (60 | 12.6%), Transportation & Warehousing (35 | 7.4%), Utilities (26 | 5.5%), and Health Care & Social Assistance (26 | 5.5%).
Employment Industries by Sex in Bayside Gardens
The Bayside Gardens industries that see more men than women are Construction (100.0%), Wholesale Trade (100.0%), and Transportation & Warehousing (100.0%), whereas the industries that tend to have a higher number of women are Educational Services (100.0%), Arts, Entertainment & Recreation (100.0%), and Manufacturing (62.5%).
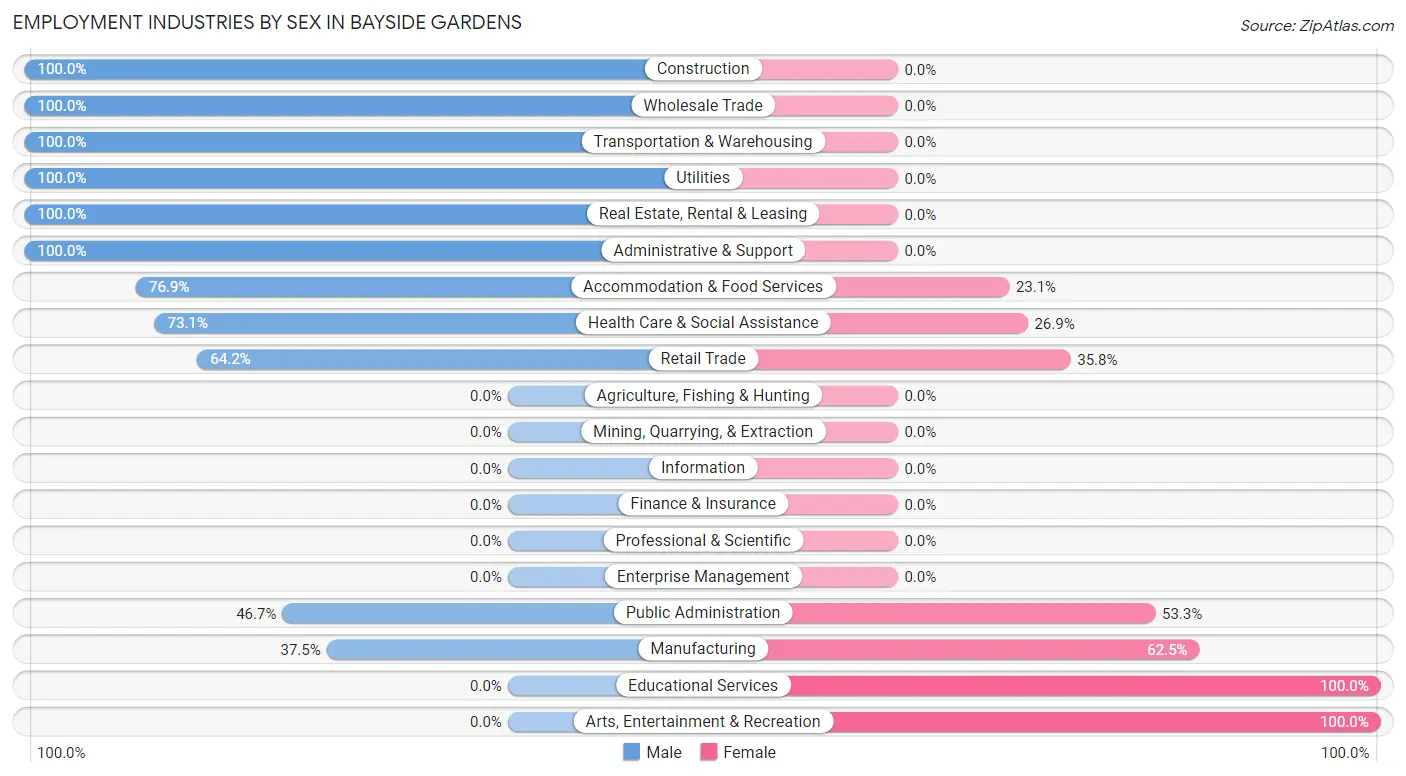
| Industry | Male | Female |
| Agriculture, Fishing & Hunting | 0 (0.0%) | 0 (0.0%) |
| Mining, Quarrying, & Extraction | 0 (0.0%) | 0 (0.0%) |
| Construction | 4 (100.0%) | 0 (0.0%) |
| Manufacturing | 3 (37.5%) | 5 (62.5%) |
| Wholesale Trade | 8 (100.0%) | 0 (0.0%) |
| Retail Trade | 140 (64.2%) | 78 (35.8%) |
| Transportation & Warehousing | 35 (100.0%) | 0 (0.0%) |
| Utilities | 26 (100.0%) | 0 (0.0%) |
| Information | 0 (0.0%) | 0 (0.0%) |
| Finance & Insurance | 0 (0.0%) | 0 (0.0%) |
| Real Estate, Rental & Leasing | 11 (100.0%) | 0 (0.0%) |
| Professional & Scientific | 0 (0.0%) | 0 (0.0%) |
| Enterprise Management | 0 (0.0%) | 0 (0.0%) |
| Administrative & Support | 7 (100.0%) | 0 (0.0%) |
| Educational Services | 0 (0.0%) | 5 (100.0%) |
| Health Care & Social Assistance | 19 (73.1%) | 7 (26.9%) |
| Arts, Entertainment & Recreation | 0 (0.0%) | 15 (100.0%) |
| Accommodation & Food Services | 10 (76.9%) | 3 (23.1%) |
| Public Administration | 28 (46.7%) | 32 (53.3%) |
| Total | 309 (65.0%) | 166 (34.9%) |
Education in Bayside Gardens
School Enrollment in Bayside Gardens
The most common levels of schooling among the 84 students in Bayside Gardens are elementary school (42 | 50.0%), middle school (20 | 23.8%), and high school (12 | 14.3%).
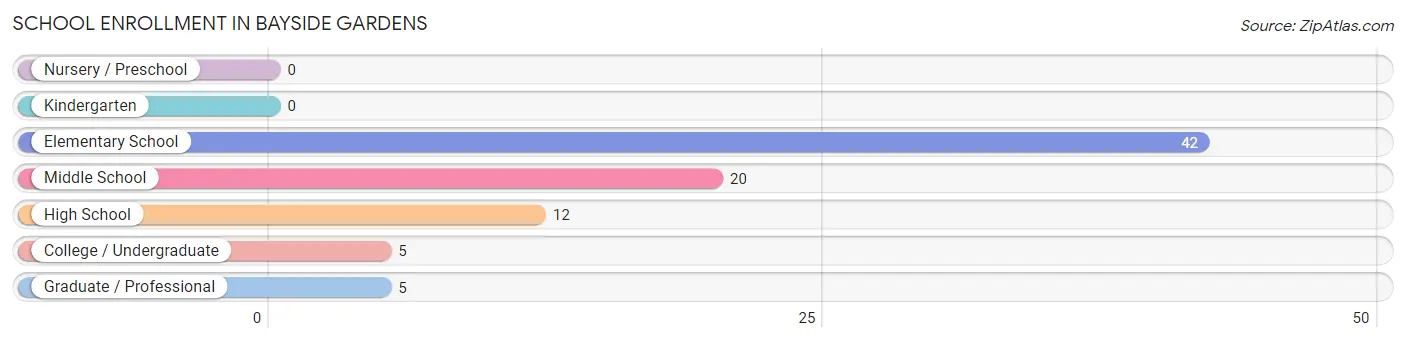
| School Level | # Students | % Students |
| Nursery / Preschool | 0 | 0.0% |
| Kindergarten | 0 | 0.0% |
| Elementary School | 42 | 50.0% |
| Middle School | 20 | 23.8% |
| High School | 12 | 14.3% |
| College / Undergraduate | 5 | 5.9% |
| Graduate / Professional | 5 | 5.9% |
| Total | 84 | 100.0% |
School Enrollment by Age by Funding Source in Bayside Gardens
Out of a total of 84 students who are enrolled in schools in Bayside Gardens, 34 (40.5%) attend a private institution, while the remaining 50 (59.5%) are enrolled in public schools. The age group of 15 to 17 year olds has the highest likelihood of being enrolled in private schools, with 9 (100.0% in the age bracket) enrolled. Conversely, the age group of 10 to 14 year olds has the lowest likelihood of being enrolled in a private school, with 24 (100.0% in the age bracket) attending a public institution.
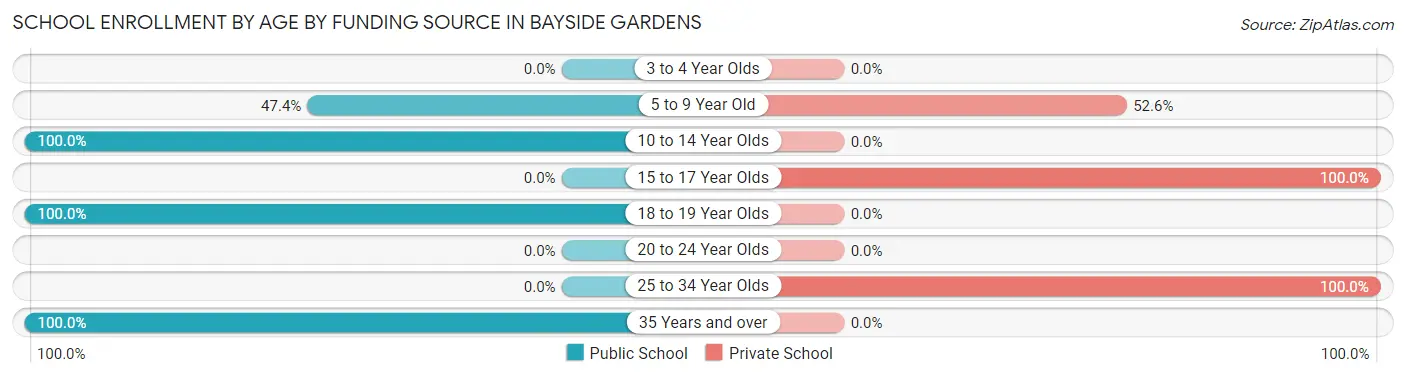
| Age Bracket | Public School | Private School |
| 3 to 4 Year Olds | 0 (0.0%) | 0 (0.0%) |
| 5 to 9 Year Old | 18 (47.4%) | 20 (52.6%) |
| 10 to 14 Year Olds | 24 (100.0%) | 0 (0.0%) |
| 15 to 17 Year Olds | 0 (0.0%) | 9 (100.0%) |
| 18 to 19 Year Olds | 3 (100.0%) | 0 (0.0%) |
| 20 to 24 Year Olds | 0 (0.0%) | 0 (0.0%) |
| 25 to 34 Year Olds | 0 (0.0%) | 5 (100.0%) |
| 35 Years and over | 5 (100.0%) | 0 (0.0%) |
| Total | 50 (59.5%) | 34 (40.5%) |
Educational Attainment by Field of Study in Bayside Gardens
Education (47 | 21.8%), psychology (41 | 19.0%), science & technology (35 | 16.2%), physical & health sciences (29 | 13.4%), and social sciences (15 | 6.9%) are the most common fields of study among 216 individuals in Bayside Gardens who have obtained a bachelor's degree or higher.
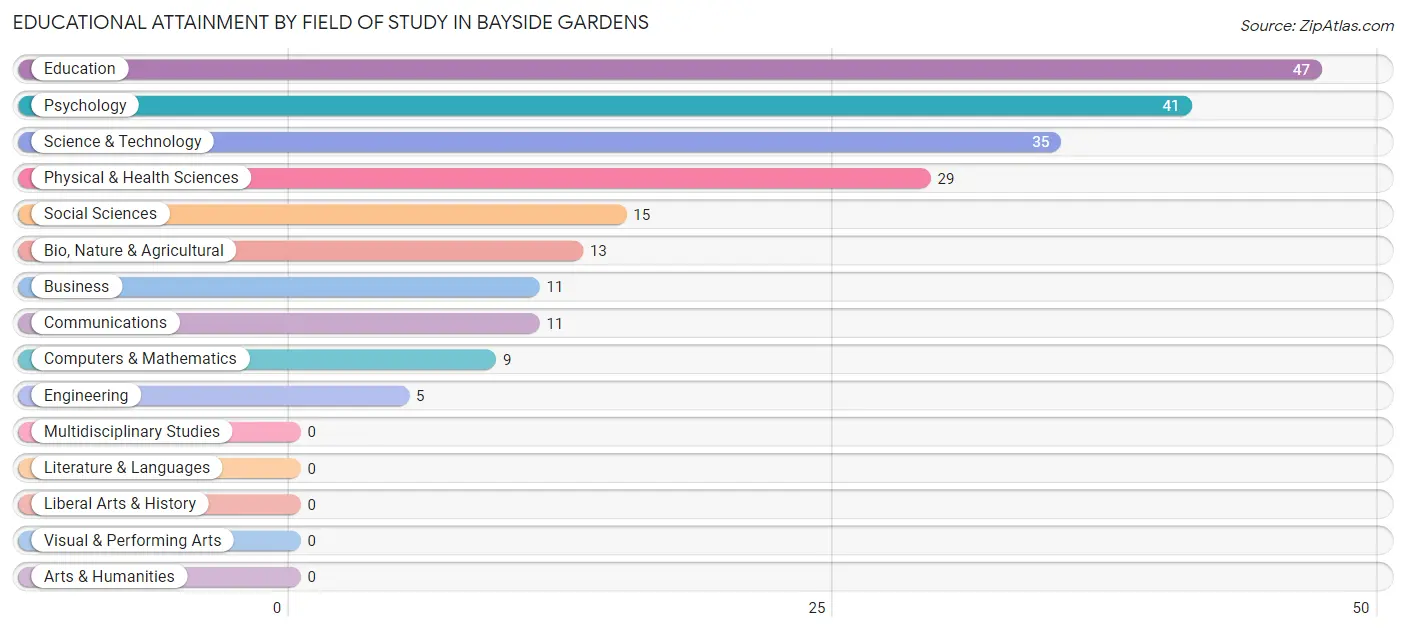
| Field of Study | # Graduates | % Graduates |
| Computers & Mathematics | 9 | 4.2% |
| Bio, Nature & Agricultural | 13 | 6.0% |
| Physical & Health Sciences | 29 | 13.4% |
| Psychology | 41 | 19.0% |
| Social Sciences | 15 | 6.9% |
| Engineering | 5 | 2.3% |
| Multidisciplinary Studies | 0 | 0.0% |
| Science & Technology | 35 | 16.2% |
| Business | 11 | 5.1% |
| Education | 47 | 21.8% |
| Literature & Languages | 0 | 0.0% |
| Liberal Arts & History | 0 | 0.0% |
| Visual & Performing Arts | 0 | 0.0% |
| Communications | 11 | 5.1% |
| Arts & Humanities | 0 | 0.0% |
| Total | 216 | 100.0% |
Transportation & Commute in Bayside Gardens
Vehicle Availability by Sex in Bayside Gardens
The most prevalent vehicle ownership categories in Bayside Gardens are males with 1 vehicle (145, accounting for 46.9%) and females with 1 vehicle (15, making up 87.4%).
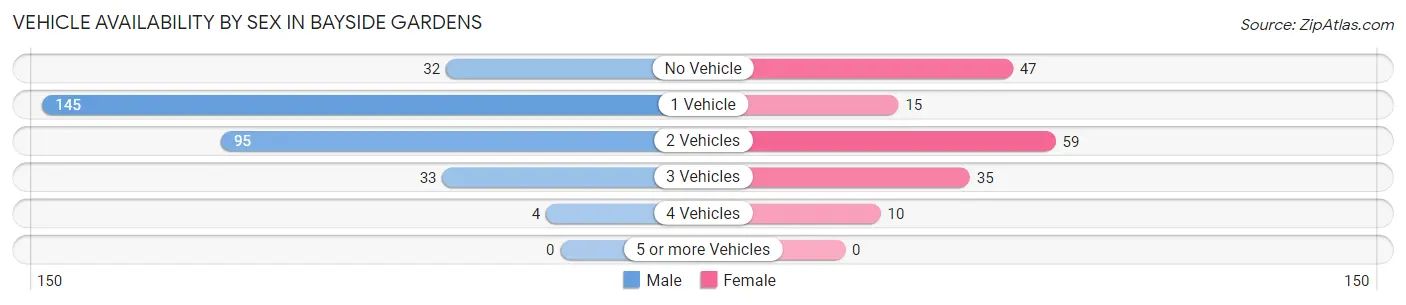
| Vehicles Available | Male | Female |
| No Vehicle | 32 (10.4%) | 47 (28.3%) |
| 1 Vehicle | 145 (46.9%) | 15 (9.0%) |
| 2 Vehicles | 95 (30.7%) | 59 (35.5%) |
| 3 Vehicles | 33 (10.7%) | 35 (21.1%) |
| 4 Vehicles | 4 (1.3%) | 10 (6.0%) |
| 5 or more Vehicles | 0 (0.0%) | 0 (0.0%) |
| Total | 309 (100.0%) | 166 (100.0%) |
Commute Time in Bayside Gardens
The most frequently occuring commute durations in Bayside Gardens are 5 to 9 minutes (147 commuters, 42.9%), less than 5 minutes (87 commuters, 25.4%), and 20 to 24 minutes (44 commuters, 12.8%).
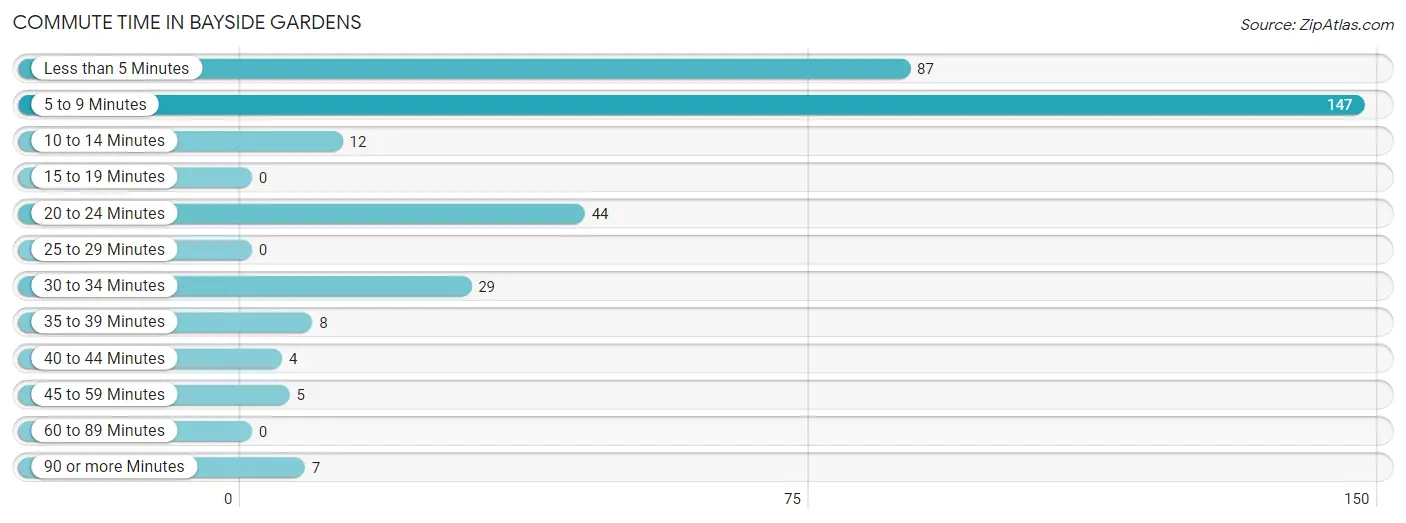
| Commute Time | # Commuters | % Commuters |
| Less than 5 Minutes | 87 | 25.4% |
| 5 to 9 Minutes | 147 | 42.9% |
| 10 to 14 Minutes | 12 | 3.5% |
| 15 to 19 Minutes | 0 | 0.0% |
| 20 to 24 Minutes | 44 | 12.8% |
| 25 to 29 Minutes | 0 | 0.0% |
| 30 to 34 Minutes | 29 | 8.5% |
| 35 to 39 Minutes | 8 | 2.3% |
| 40 to 44 Minutes | 4 | 1.2% |
| 45 to 59 Minutes | 5 | 1.5% |
| 60 to 89 Minutes | 0 | 0.0% |
| 90 or more Minutes | 7 | 2.0% |
Commute Time by Sex in Bayside Gardens
The most common commute times in Bayside Gardens are 5 to 9 minutes (81 commuters, 43.3%) for males and 5 to 9 minutes (66 commuters, 42.3%) for females.
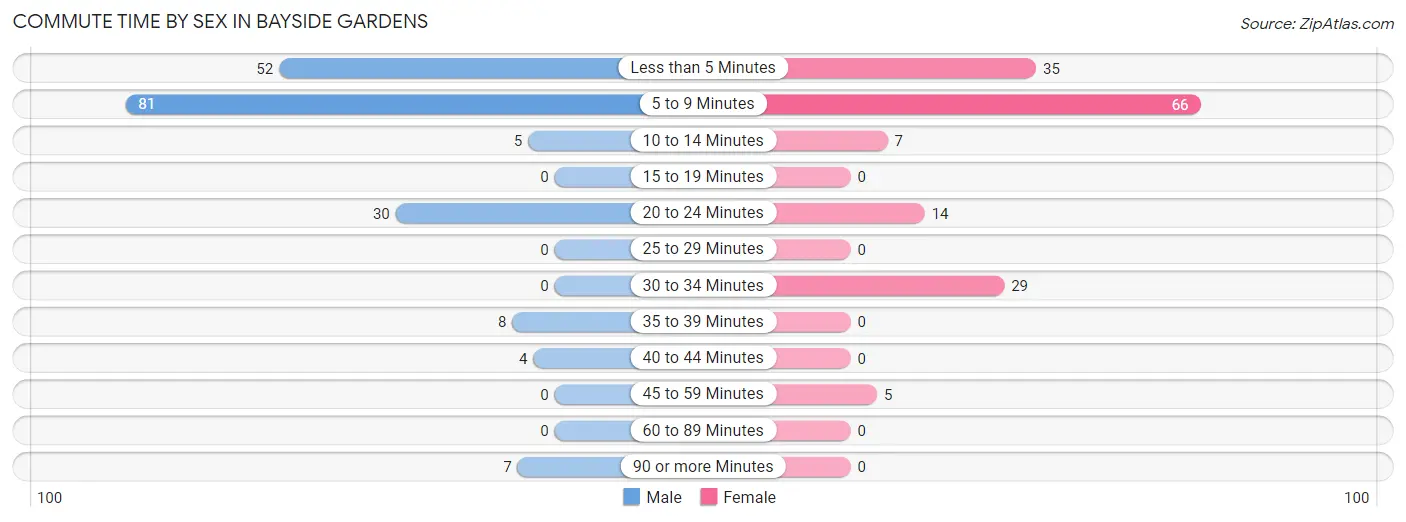
| Commute Time | Male | Female |
| Less than 5 Minutes | 52 (27.8%) | 35 (22.4%) |
| 5 to 9 Minutes | 81 (43.3%) | 66 (42.3%) |
| 10 to 14 Minutes | 5 (2.7%) | 7 (4.5%) |
| 15 to 19 Minutes | 0 (0.0%) | 0 (0.0%) |
| 20 to 24 Minutes | 30 (16.0%) | 14 (9.0%) |
| 25 to 29 Minutes | 0 (0.0%) | 0 (0.0%) |
| 30 to 34 Minutes | 0 (0.0%) | 29 (18.6%) |
| 35 to 39 Minutes | 8 (4.3%) | 0 (0.0%) |
| 40 to 44 Minutes | 4 (2.1%) | 0 (0.0%) |
| 45 to 59 Minutes | 0 (0.0%) | 5 (3.2%) |
| 60 to 89 Minutes | 0 (0.0%) | 0 (0.0%) |
| 90 or more Minutes | 7 (3.7%) | 0 (0.0%) |
Time of Departure to Work by Sex in Bayside Gardens
The most frequent times of departure to work in Bayside Gardens are 6:30 AM to 6:59 AM (55, 29.4%) for males and 5:30 AM to 5:59 AM (90, 57.7%) for females.
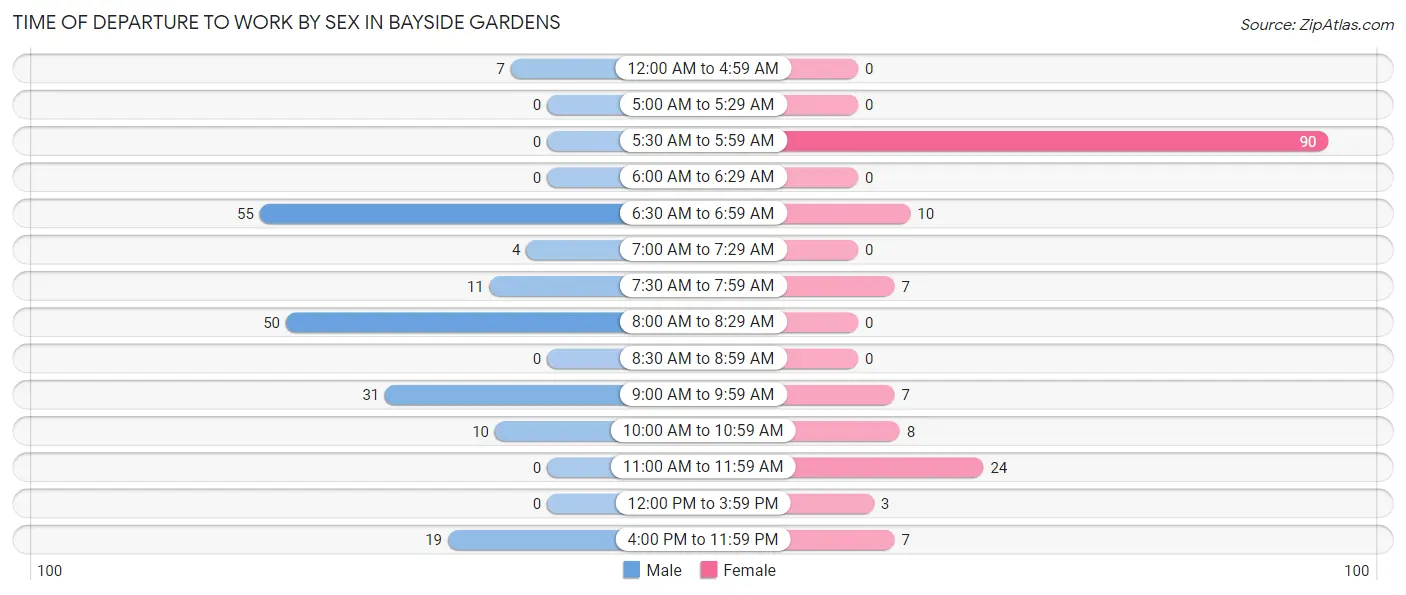
| Time of Departure | Male | Female |
| 12:00 AM to 4:59 AM | 7 (3.7%) | 0 (0.0%) |
| 5:00 AM to 5:29 AM | 0 (0.0%) | 0 (0.0%) |
| 5:30 AM to 5:59 AM | 0 (0.0%) | 90 (57.7%) |
| 6:00 AM to 6:29 AM | 0 (0.0%) | 0 (0.0%) |
| 6:30 AM to 6:59 AM | 55 (29.4%) | 10 (6.4%) |
| 7:00 AM to 7:29 AM | 4 (2.1%) | 0 (0.0%) |
| 7:30 AM to 7:59 AM | 11 (5.9%) | 7 (4.5%) |
| 8:00 AM to 8:29 AM | 50 (26.7%) | 0 (0.0%) |
| 8:30 AM to 8:59 AM | 0 (0.0%) | 0 (0.0%) |
| 9:00 AM to 9:59 AM | 31 (16.6%) | 7 (4.5%) |
| 10:00 AM to 10:59 AM | 10 (5.3%) | 8 (5.1%) |
| 11:00 AM to 11:59 AM | 0 (0.0%) | 24 (15.4%) |
| 12:00 PM to 3:59 PM | 0 (0.0%) | 3 (1.9%) |
| 4:00 PM to 11:59 PM | 19 (10.2%) | 7 (4.5%) |
| Total | 187 (100.0%) | 156 (100.0%) |
Housing Occupancy in Bayside Gardens
Occupancy by Ownership in Bayside Gardens
Of the total 531 dwellings in Bayside Gardens, owner-occupied units account for 528 (99.4%), while renter-occupied units make up 3 (0.6%).
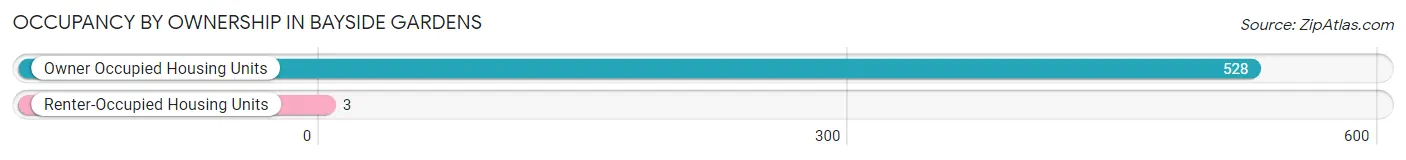
| Occupancy | # Housing Units | % Housing Units |
| Owner Occupied Housing Units | 528 | 99.4% |
| Renter-Occupied Housing Units | 3 | 0.6% |
| Total Occupied Housing Units | 531 | 100.0% |
Occupancy by Household Size in Bayside Gardens
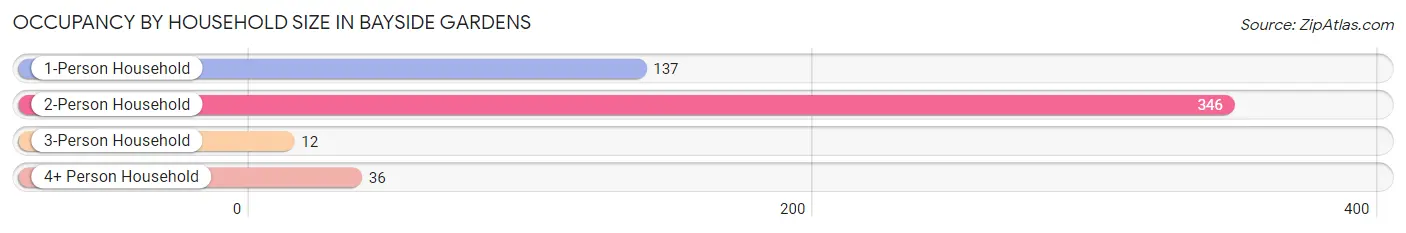
| Household Size | # Housing Units | % Housing Units |
| 1-Person Household | 137 | 25.8% |
| 2-Person Household | 346 | 65.2% |
| 3-Person Household | 12 | 2.3% |
| 4+ Person Household | 36 | 6.8% |
| Total Housing Units | 531 | 100.0% |
Occupancy by Ownership by Household Size in Bayside Gardens
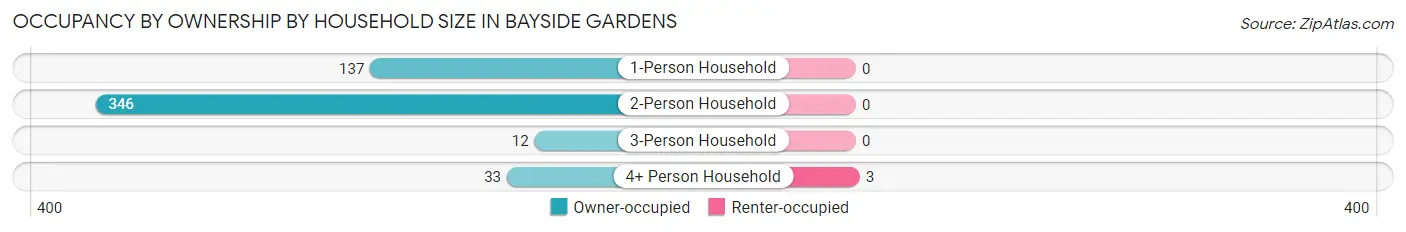
| Household Size | Owner-occupied | Renter-occupied |
| 1-Person Household | 137 (100.0%) | 0 (0.0%) |
| 2-Person Household | 346 (100.0%) | 0 (0.0%) |
| 3-Person Household | 12 (100.0%) | 0 (0.0%) |
| 4+ Person Household | 33 (91.7%) | 3 (8.3%) |
| Total Housing Units | 528 (99.4%) | 3 (0.6%) |
Occupancy by Educational Attainment in Bayside Gardens
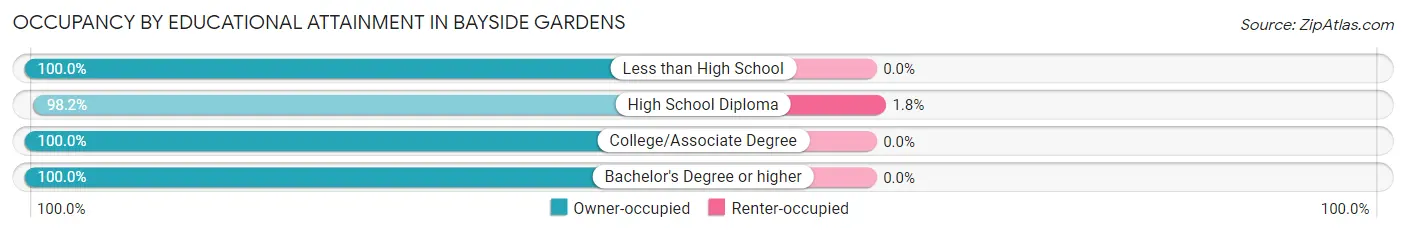
| Household Size | Owner-occupied | Renter-occupied |
| Less than High School | 9 (100.0%) | 0 (0.0%) |
| High School Diploma | 160 (98.2%) | 3 (1.8%) |
| College/Associate Degree | 248 (100.0%) | 0 (0.0%) |
| Bachelor's Degree or higher | 111 (100.0%) | 0 (0.0%) |
Occupancy by Age of Householder in Bayside Gardens
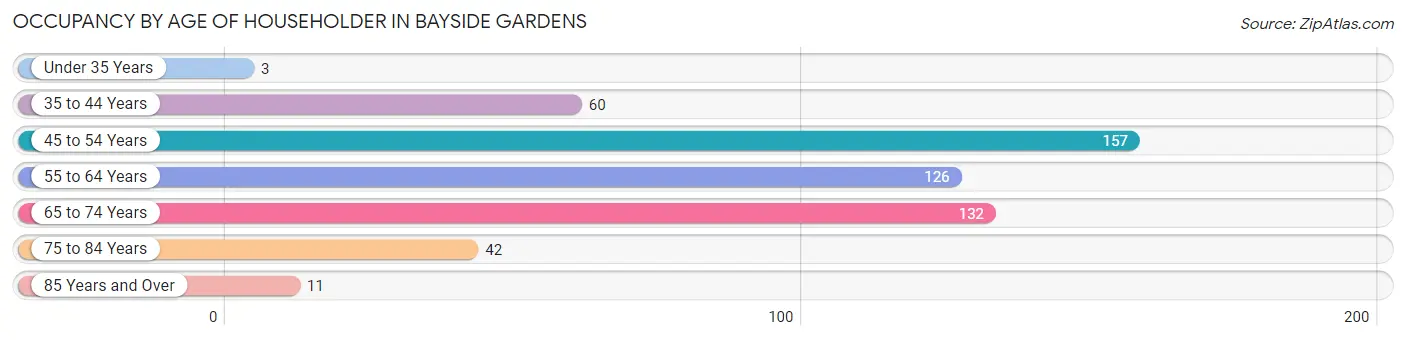
| Age Bracket | # Households | % Households |
| Under 35 Years | 3 | 0.6% |
| 35 to 44 Years | 60 | 11.3% |
| 45 to 54 Years | 157 | 29.6% |
| 55 to 64 Years | 126 | 23.7% |
| 65 to 74 Years | 132 | 24.9% |
| 75 to 84 Years | 42 | 7.9% |
| 85 Years and Over | 11 | 2.1% |
| Total | 531 | 100.0% |
Housing Finances in Bayside Gardens
Median Income by Occupancy in Bayside Gardens
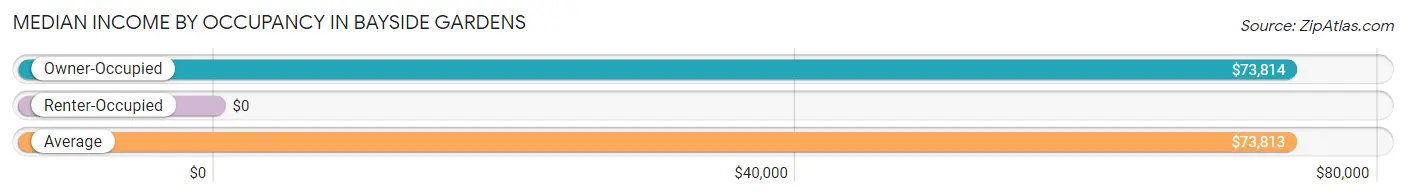
| Occupancy Type | # Households | Median Income |
| Owner-Occupied | 528 (99.4%) | $73,814 |
| Renter-Occupied | 3 (0.6%) | $0 |
| Average | 531 (100.0%) | $73,813 |
Occupancy by Householder Income Bracket in Bayside Gardens
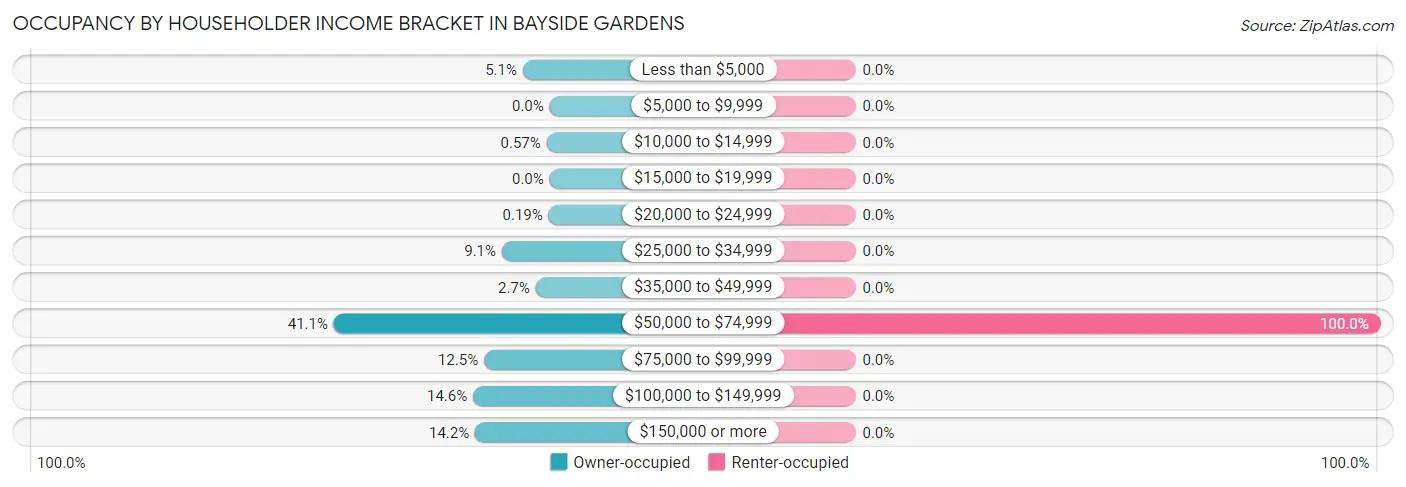
| Income Bracket | Owner-occupied | Renter-occupied |
| Less than $5,000 | 27 (5.1%) | 0 (0.0%) |
| $5,000 to $9,999 | 0 (0.0%) | 0 (0.0%) |
| $10,000 to $14,999 | 3 (0.6%) | 0 (0.0%) |
| $15,000 to $19,999 | 0 (0.0%) | 0 (0.0%) |
| $20,000 to $24,999 | 1 (0.2%) | 0 (0.0%) |
| $25,000 to $34,999 | 48 (9.1%) | 0 (0.0%) |
| $35,000 to $49,999 | 14 (2.6%) | 0 (0.0%) |
| $50,000 to $74,999 | 217 (41.1%) | 3 (100.0%) |
| $75,000 to $99,999 | 66 (12.5%) | 0 (0.0%) |
| $100,000 to $149,999 | 77 (14.6%) | 0 (0.0%) |
| $150,000 or more | 75 (14.2%) | 0 (0.0%) |
| Total | 528 (100.0%) | 3 (100.0%) |
Monthly Housing Cost Tiers in Bayside Gardens
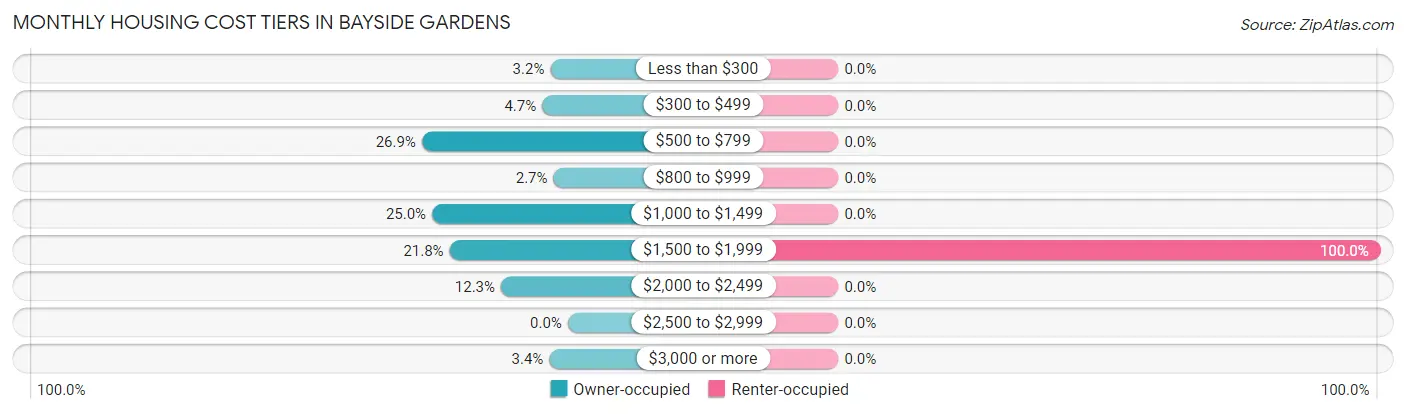
| Monthly Cost | Owner-occupied | Renter-occupied |
| Less than $300 | 17 (3.2%) | 0 (0.0%) |
| $300 to $499 | 25 (4.7%) | 0 (0.0%) |
| $500 to $799 | 142 (26.9%) | 0 (0.0%) |
| $800 to $999 | 14 (2.6%) | 0 (0.0%) |
| $1,000 to $1,499 | 132 (25.0%) | 0 (0.0%) |
| $1,500 to $1,999 | 115 (21.8%) | 3 (100.0%) |
| $2,000 to $2,499 | 65 (12.3%) | 0 (0.0%) |
| $2,500 to $2,999 | 0 (0.0%) | 0 (0.0%) |
| $3,000 or more | 18 (3.4%) | 0 (0.0%) |
| Total | 528 (100.0%) | 3 (100.0%) |
Physical Housing Characteristics in Bayside Gardens
Housing Structures in Bayside Gardens
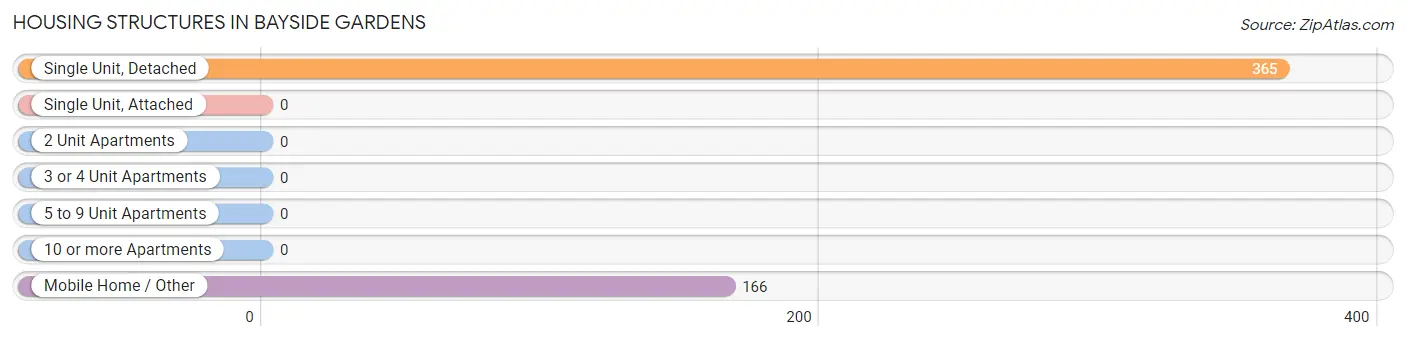
| Structure Type | # Housing Units | % Housing Units |
| Single Unit, Detached | 365 | 68.7% |
| Single Unit, Attached | 0 | 0.0% |
| 2 Unit Apartments | 0 | 0.0% |
| 3 or 4 Unit Apartments | 0 | 0.0% |
| 5 to 9 Unit Apartments | 0 | 0.0% |
| 10 or more Apartments | 0 | 0.0% |
| Mobile Home / Other | 166 | 31.3% |
| Total | 531 | 100.0% |
Housing Structures by Occupancy in Bayside Gardens
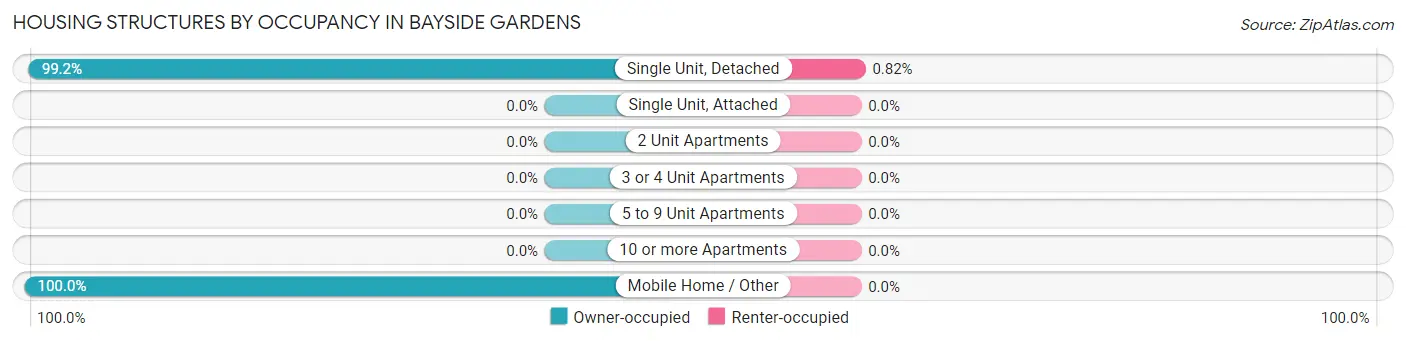
| Structure Type | Owner-occupied | Renter-occupied |
| Single Unit, Detached | 362 (99.2%) | 3 (0.8%) |
| Single Unit, Attached | 0 (0.0%) | 0 (0.0%) |
| 2 Unit Apartments | 0 (0.0%) | 0 (0.0%) |
| 3 or 4 Unit Apartments | 0 (0.0%) | 0 (0.0%) |
| 5 to 9 Unit Apartments | 0 (0.0%) | 0 (0.0%) |
| 10 or more Apartments | 0 (0.0%) | 0 (0.0%) |
| Mobile Home / Other | 166 (100.0%) | 0 (0.0%) |
| Total | 528 (99.4%) | 3 (0.6%) |
Housing Structures by Number of Rooms in Bayside Gardens
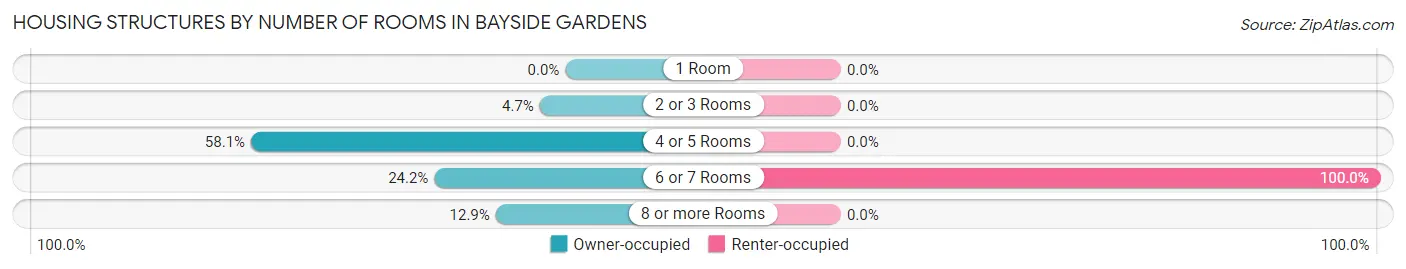
| Number of Rooms | Owner-occupied | Renter-occupied |
| 1 Room | 0 (0.0%) | 0 (0.0%) |
| 2 or 3 Rooms | 25 (4.7%) | 0 (0.0%) |
| 4 or 5 Rooms | 307 (58.1%) | 0 (0.0%) |
| 6 or 7 Rooms | 128 (24.2%) | 3 (100.0%) |
| 8 or more Rooms | 68 (12.9%) | 0 (0.0%) |
| Total | 528 (100.0%) | 3 (100.0%) |
Housing Structure by Heating Type in Bayside Gardens
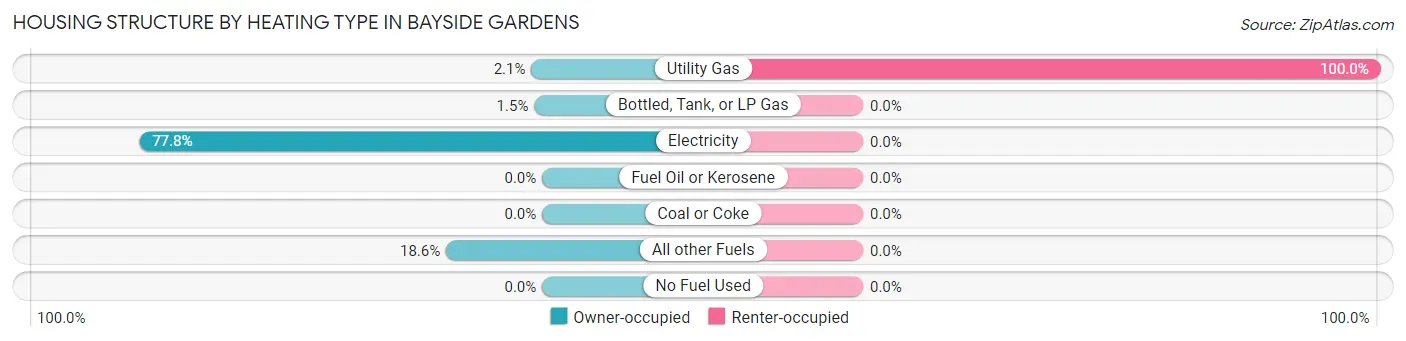
| Heating Type | Owner-occupied | Renter-occupied |
| Utility Gas | 11 (2.1%) | 3 (100.0%) |
| Bottled, Tank, or LP Gas | 8 (1.5%) | 0 (0.0%) |
| Electricity | 411 (77.8%) | 0 (0.0%) |
| Fuel Oil or Kerosene | 0 (0.0%) | 0 (0.0%) |
| Coal or Coke | 0 (0.0%) | 0 (0.0%) |
| All other Fuels | 98 (18.6%) | 0 (0.0%) |
| No Fuel Used | 0 (0.0%) | 0 (0.0%) |
| Total | 528 (100.0%) | 3 (100.0%) |
Household Vehicle Usage in Bayside Gardens
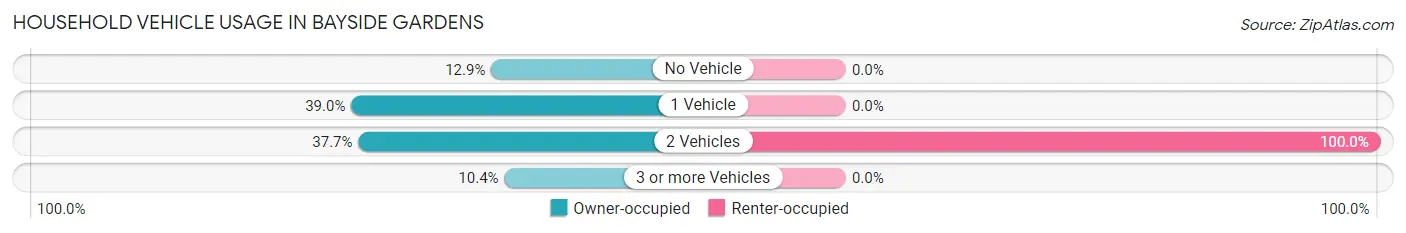
| Vehicles per Household | Owner-occupied | Renter-occupied |
| No Vehicle | 68 (12.9%) | 0 (0.0%) |
| 1 Vehicle | 206 (39.0%) | 0 (0.0%) |
| 2 Vehicles | 199 (37.7%) | 3 (100.0%) |
| 3 or more Vehicles | 55 (10.4%) | 0 (0.0%) |
| Total | 528 (100.0%) | 3 (100.0%) |
Real Estate & Mortgages in Bayside Gardens
Real Estate and Mortgage Overview in Bayside Gardens
| Characteristic | Without Mortgage | With Mortgage |
| Housing Units | 304 | 224 |
| Median Property Value | - | - |
| Median Household Income | $71,944 | $75 |
| Monthly Housing Costs | $736 | $18 |
| Real Estate Taxes | - | - |
Property Value by Mortgage Status in Bayside Gardens
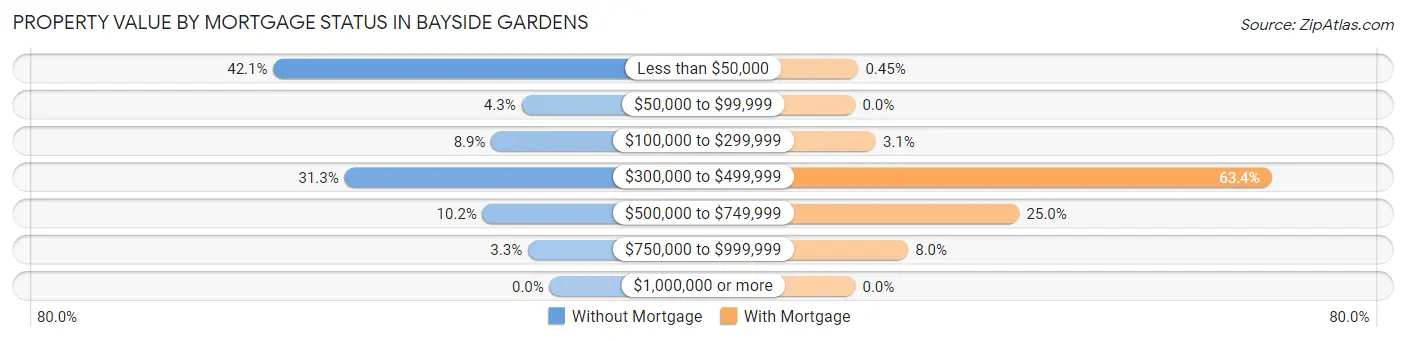
| Property Value | Without Mortgage | With Mortgage |
| Less than $50,000 | 128 (42.1%) | 1 (0.4%) |
| $50,000 to $99,999 | 13 (4.3%) | 0 (0.0%) |
| $100,000 to $299,999 | 27 (8.9%) | 7 (3.1%) |
| $300,000 to $499,999 | 95 (31.2%) | 142 (63.4%) |
| $500,000 to $749,999 | 31 (10.2%) | 56 (25.0%) |
| $750,000 to $999,999 | 10 (3.3%) | 18 (8.0%) |
| $1,000,000 or more | 0 (0.0%) | 0 (0.0%) |
| Total | 304 (100.0%) | 224 (100.0%) |
Household Income by Mortgage Status in Bayside Gardens
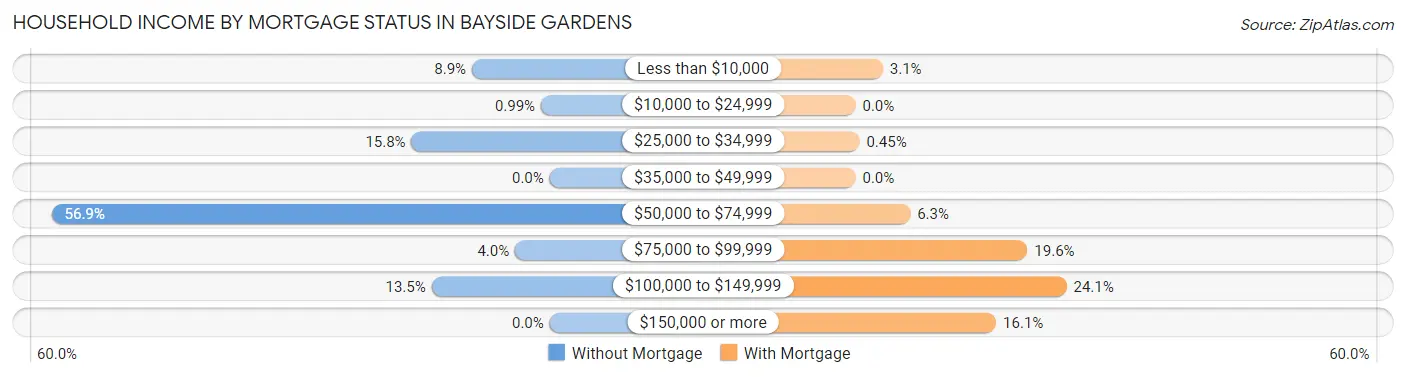
| Household Income | Without Mortgage | With Mortgage |
| Less than $10,000 | 27 (8.9%) | 7 (3.1%) |
| $10,000 to $24,999 | 3 (1.0%) | 0 (0.0%) |
| $25,000 to $34,999 | 48 (15.8%) | 1 (0.4%) |
| $35,000 to $49,999 | 0 (0.0%) | 0 (0.0%) |
| $50,000 to $74,999 | 173 (56.9%) | 14 (6.2%) |
| $75,000 to $99,999 | 12 (4.0%) | 44 (19.6%) |
| $100,000 to $149,999 | 41 (13.5%) | 54 (24.1%) |
| $150,000 or more | 0 (0.0%) | 36 (16.1%) |
| Total | 304 (100.0%) | 224 (100.0%) |
Property Value to Household Income Ratio in Bayside Gardens
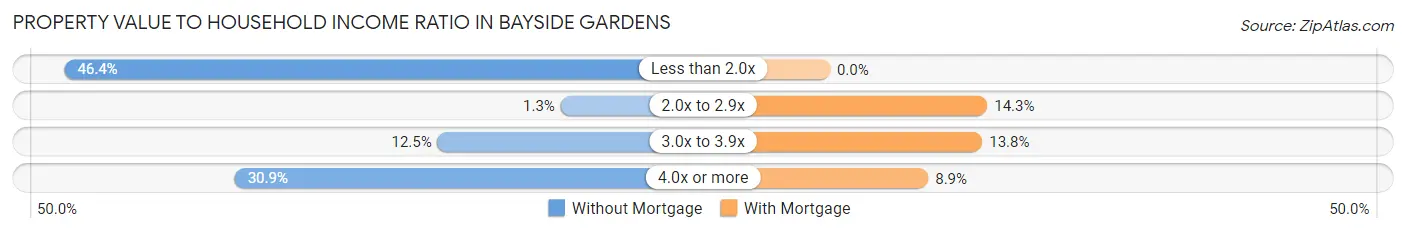
| Value-to-Income Ratio | Without Mortgage | With Mortgage |
| Less than 2.0x | 141 (46.4%) | 0 (0.0%) |
| 2.0x to 2.9x | 4 (1.3%) | 32 (14.3%) |
| 3.0x to 3.9x | 38 (12.5%) | 31 (13.8%) |
| 4.0x or more | 94 (30.9%) | 20 (8.9%) |
| Total | 304 (100.0%) | 224 (100.0%) |
Real Estate Taxes by Mortgage Status in Bayside Gardens
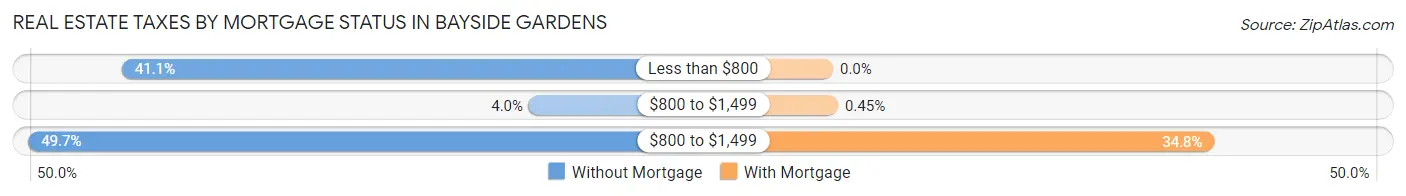
| Property Taxes | Without Mortgage | With Mortgage |
| Less than $800 | 125 (41.1%) | 0 (0.0%) |
| $800 to $1,499 | 12 (4.0%) | 1 (0.4%) |
| $800 to $1,499 | 151 (49.7%) | 78 (34.8%) |
| Total | 304 (100.0%) | 224 (100.0%) |
Health & Disability in Bayside Gardens
Health Insurance Coverage by Age in Bayside Gardens
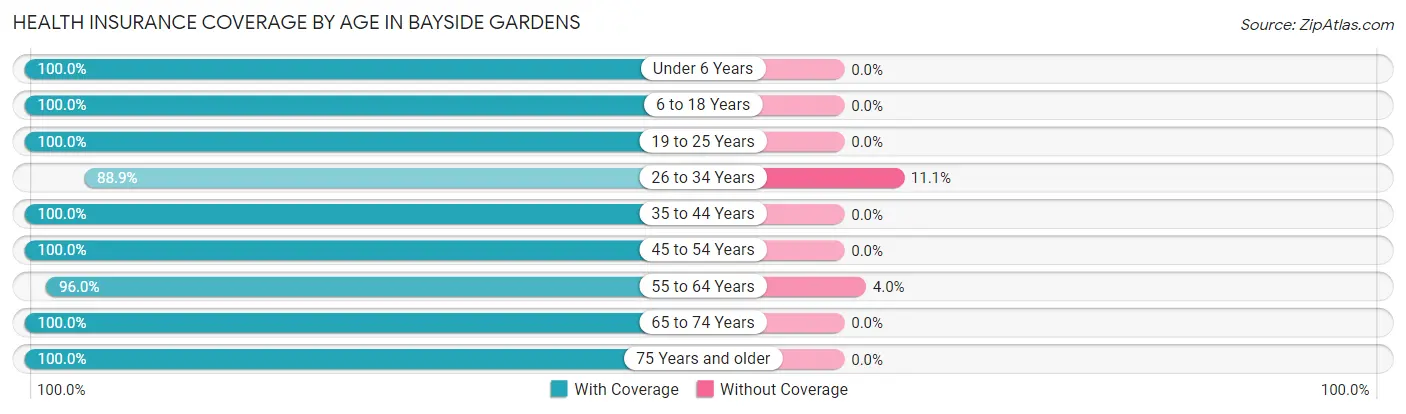
| Age Bracket | With Coverage | Without Coverage |
| Under 6 Years | 7 (100.0%) | 0 (0.0%) |
| 6 to 18 Years | 74 (100.0%) | 0 (0.0%) |
| 19 to 25 Years | 3 (100.0%) | 0 (0.0%) |
| 26 to 34 Years | 40 (88.9%) | 5 (11.1%) |
| 35 to 44 Years | 104 (100.0%) | 0 (0.0%) |
| 45 to 54 Years | 206 (100.0%) | 0 (0.0%) |
| 55 to 64 Years | 239 (96.0%) | 10 (4.0%) |
| 65 to 74 Years | 224 (100.0%) | 0 (0.0%) |
| 75 Years and older | 53 (100.0%) | 0 (0.0%) |
| Total | 950 (98.5%) | 15 (1.5%) |
Health Insurance Coverage by Citizenship Status in Bayside Gardens
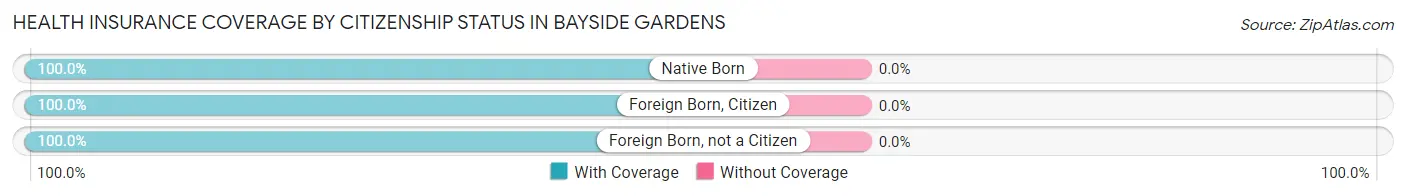
| Citizenship Status | With Coverage | Without Coverage |
| Native Born | 7 (100.0%) | 0 (0.0%) |
| Foreign Born, Citizen | 74 (100.0%) | 0 (0.0%) |
| Foreign Born, not a Citizen | 3 (100.0%) | 0 (0.0%) |
Health Insurance Coverage by Household Income in Bayside Gardens
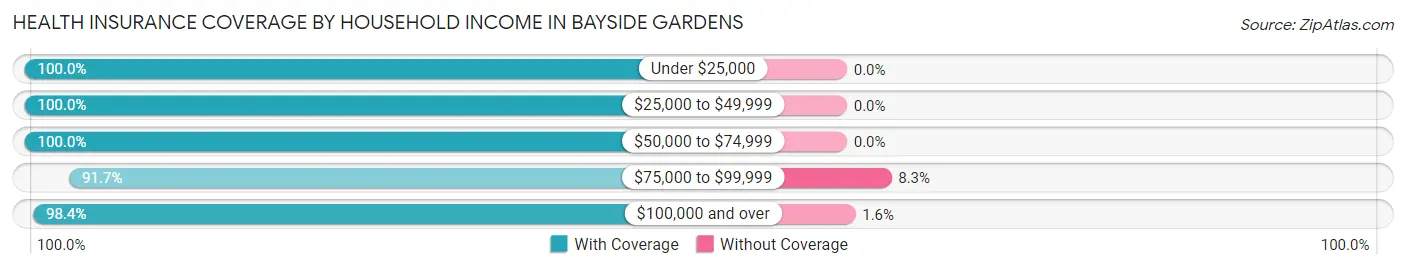
| Household Income | With Coverage | Without Coverage |
| Under $25,000 | 34 (100.0%) | 0 (0.0%) |
| $25,000 to $49,999 | 111 (100.0%) | 0 (0.0%) |
| $50,000 to $74,999 | 377 (100.0%) | 0 (0.0%) |
| $75,000 to $99,999 | 110 (91.7%) | 10 (8.3%) |
| $100,000 and over | 309 (98.4%) | 5 (1.6%) |
Public vs Private Health Insurance Coverage by Age in Bayside Gardens
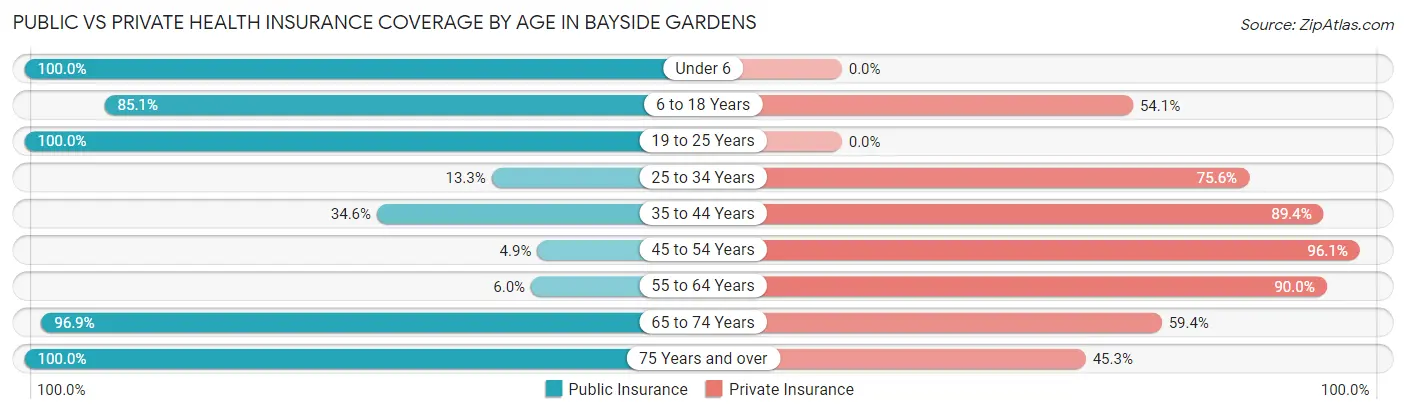
| Age Bracket | Public Insurance | Private Insurance |
| Under 6 | 7 (100.0%) | 0 (0.0%) |
| 6 to 18 Years | 63 (85.1%) | 40 (54.0%) |
| 19 to 25 Years | 3 (100.0%) | 0 (0.0%) |
| 25 to 34 Years | 6 (13.3%) | 34 (75.6%) |
| 35 to 44 Years | 36 (34.6%) | 93 (89.4%) |
| 45 to 54 Years | 10 (4.9%) | 198 (96.1%) |
| 55 to 64 Years | 15 (6.0%) | 224 (90.0%) |
| 65 to 74 Years | 217 (96.9%) | 133 (59.4%) |
| 75 Years and over | 53 (100.0%) | 24 (45.3%) |
| Total | 410 (42.5%) | 746 (77.3%) |
Disability Status by Sex by Age in Bayside Gardens
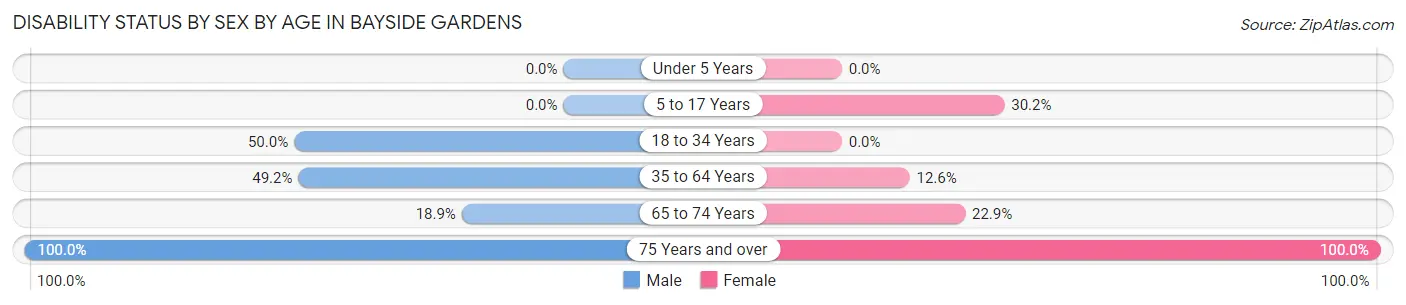
| Age Bracket | Male | Female |
| Under 5 Years | 0 (0.0%) | 0 (0.0%) |
| 5 to 17 Years | 0 (0.0%) | 19 (30.2%) |
| 18 to 34 Years | 6 (50.0%) | 0 (0.0%) |
| 35 to 64 Years | 185 (49.2%) | 23 (12.6%) |
| 65 to 74 Years | 20 (18.9%) | 27 (22.9%) |
| 75 Years and over | 13 (100.0%) | 40 (100.0%) |
Disability Class by Sex by Age in Bayside Gardens
Disability Class: Hearing Difficulty
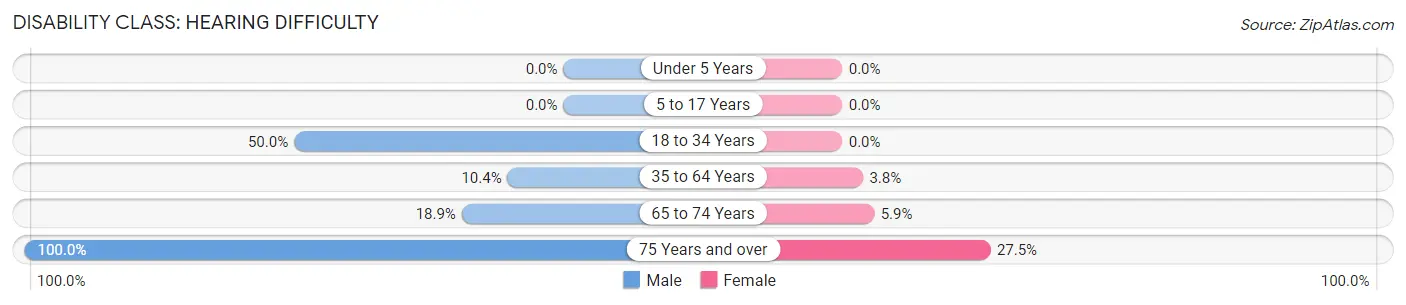
| Age Bracket | Male | Female |
| Under 5 Years | 0 (0.0%) | 0 (0.0%) |
| 5 to 17 Years | 0 (0.0%) | 0 (0.0%) |
| 18 to 34 Years | 6 (50.0%) | 0 (0.0%) |
| 35 to 64 Years | 39 (10.4%) | 7 (3.8%) |
| 65 to 74 Years | 20 (18.9%) | 7 (5.9%) |
| 75 Years and over | 13 (100.0%) | 11 (27.5%) |
Disability Class: Vision Difficulty
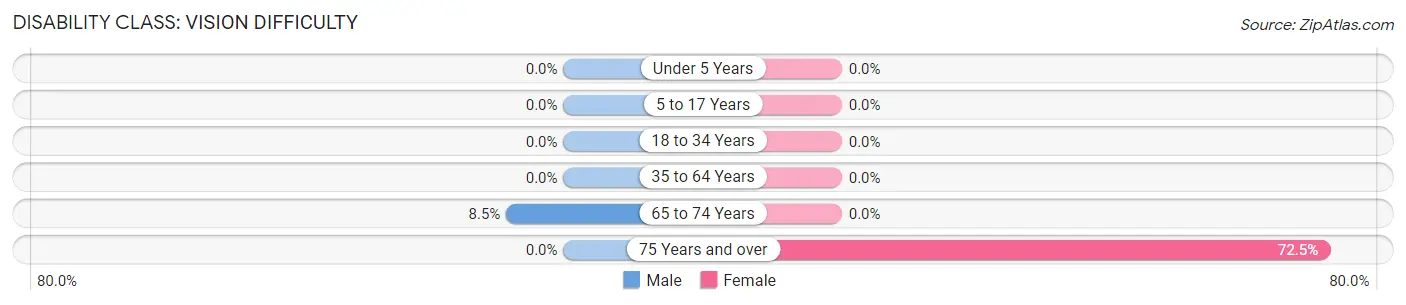
| Age Bracket | Male | Female |
| Under 5 Years | 0 (0.0%) | 0 (0.0%) |
| 5 to 17 Years | 0 (0.0%) | 0 (0.0%) |
| 18 to 34 Years | 0 (0.0%) | 0 (0.0%) |
| 35 to 64 Years | 0 (0.0%) | 0 (0.0%) |
| 65 to 74 Years | 9 (8.5%) | 0 (0.0%) |
| 75 Years and over | 0 (0.0%) | 29 (72.5%) |
Disability Class: Cognitive Difficulty
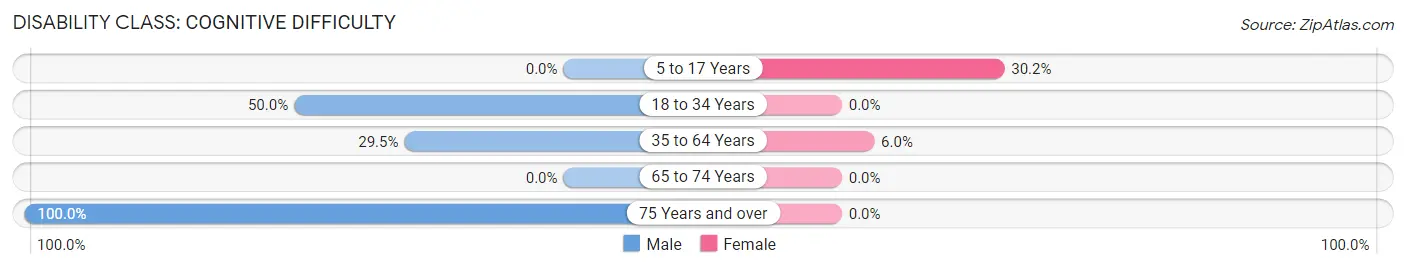
| Age Bracket | Male | Female |
| 5 to 17 Years | 0 (0.0%) | 19 (30.2%) |
| 18 to 34 Years | 6 (50.0%) | 0 (0.0%) |
| 35 to 64 Years | 111 (29.5%) | 11 (6.0%) |
| 65 to 74 Years | 0 (0.0%) | 0 (0.0%) |
| 75 Years and over | 13 (100.0%) | 0 (0.0%) |
Disability Class: Ambulatory Difficulty
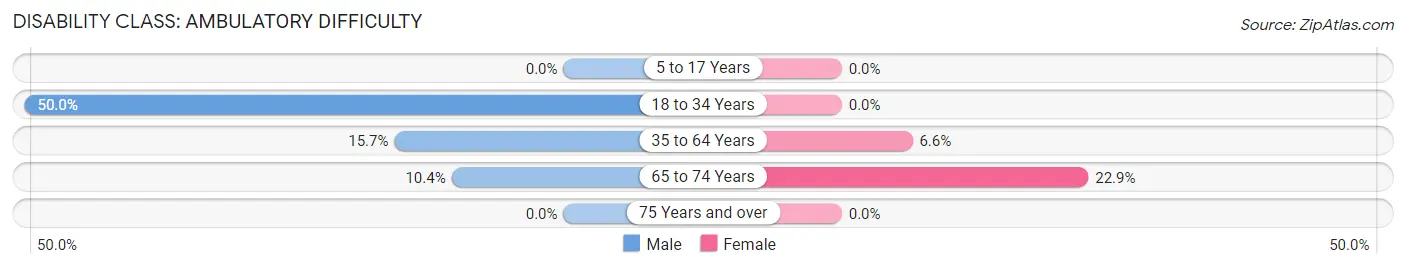
| Age Bracket | Male | Female |
| 5 to 17 Years | 0 (0.0%) | 0 (0.0%) |
| 18 to 34 Years | 6 (50.0%) | 0 (0.0%) |
| 35 to 64 Years | 59 (15.7%) | 12 (6.6%) |
| 65 to 74 Years | 11 (10.4%) | 27 (22.9%) |
| 75 Years and over | 0 (0.0%) | 0 (0.0%) |
Disability Class: Self-Care Difficulty
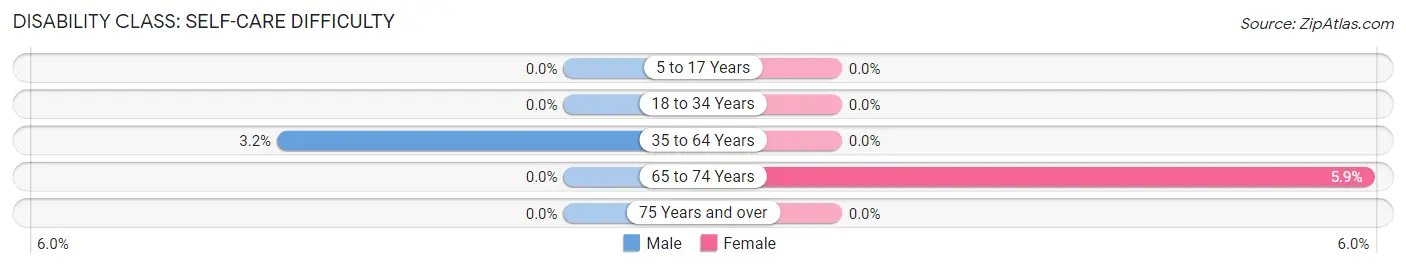
| Age Bracket | Male | Female |
| 5 to 17 Years | 0 (0.0%) | 0 (0.0%) |
| 18 to 34 Years | 0 (0.0%) | 0 (0.0%) |
| 35 to 64 Years | 12 (3.2%) | 0 (0.0%) |
| 65 to 74 Years | 0 (0.0%) | 7 (5.9%) |
| 75 Years and over | 0 (0.0%) | 0 (0.0%) |
Technology Access in Bayside Gardens
Computing Device Access in Bayside Gardens
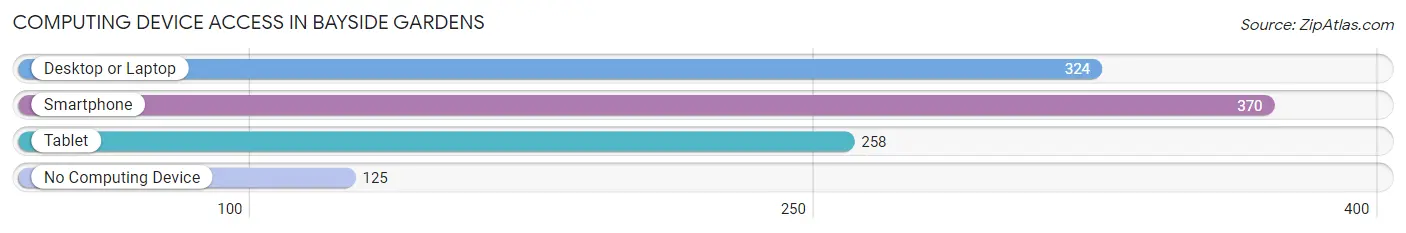
| Device Type | # Households | % Households |
| Desktop or Laptop | 324 | 61.0% |
| Smartphone | 370 | 69.7% |
| Tablet | 258 | 48.6% |
| No Computing Device | 125 | 23.5% |
| Total | 531 | 100.0% |
Internet Access in Bayside Gardens
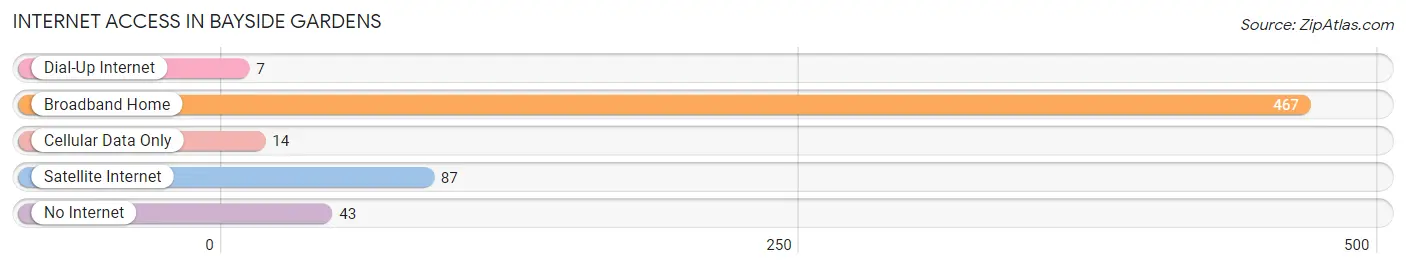
| Internet Type | # Households | % Households |
| Dial-Up Internet | 7 | 1.3% |
| Broadband Home | 467 | 87.9% |
| Cellular Data Only | 14 | 2.6% |
| Satellite Internet | 87 | 16.4% |
| No Internet | 43 | 8.1% |
| Total | 531 | 100.0% |
Bayside Gardens Summary
Bayside Gardens is a small, unincorporated community located in Clatsop County, Oregon. It is situated on the north bank of the Columbia River, just east of the city of Astoria. The community is home to a diverse population of approximately 1,000 people, and is known for its picturesque views of the river and its surrounding hills.
History
The area now known as Bayside Gardens was first settled in the late 19th century by a group of Scandinavian immigrants. The settlers were drawn to the area by its abundance of natural resources, including timber, fish, and game. The community was initially known as “Bayside”, and was home to a small fishing village. In the early 20th century, the area was developed into a residential community, and the name was changed to “Bayside Gardens”.
Geography
Bayside Gardens is located in Clatsop County, Oregon, on the north bank of the Columbia River. The community is situated on a small peninsula, surrounded by the river on three sides. The area is characterized by its rolling hills and lush forests, and is home to a variety of wildlife, including deer, elk, and bald eagles. The community is also known for its stunning views of the river and its surrounding hills.
Economy
The economy of Bayside Gardens is largely based on tourism and fishing. The community is home to several small businesses, including restaurants, shops, and marinas. The area is also known for its abundance of recreational activities, including fishing, boating, and hiking. Additionally, the community is home to a number of small farms, which produce a variety of fruits and vegetables.
Demographics
As of the 2010 census, the population of Bayside Gardens was 1,000. The population is largely composed of white (90%) and Hispanic (7%) individuals. The median household income is $45,000, and the median age is 44. The community is home to a variety of religious denominations, including Catholic, Lutheran, and Methodist.
Conclusion
Bayside Gardens is a small, unincorporated community located in Clatsop County, Oregon. It is situated on the north bank of the Columbia River, just east of the city of Astoria. The community is home to a diverse population of approximately 1,000 people, and is known for its picturesque views of the river and its surrounding hills. The economy of Bayside Gardens is largely based on tourism and fishing, and the area is home to a variety of recreational activities. The population is largely composed of white and Hispanic individuals, and the median household income is $45,000. Bayside Gardens is a unique and vibrant community, and is a great place to live and visit.
Common Questions
What is the Total Population of Bayside Gardens?
Total Population of Bayside Gardens is 980.
What is the Total Male Population of Bayside Gardens?
Total Male Population of Bayside Gardens is 537.
What is the Total Female Population of Bayside Gardens?
Total Female Population of Bayside Gardens is 443.
What is the Ratio of Males per 100 Females in Bayside Gardens?
There are 121.22 Males per 100 Females in Bayside Gardens.
What is the Ratio of Females per 100 Males in Bayside Gardens?
There are 82.50 Females per 100 Males in Bayside Gardens.
What is the Median Population Age in Bayside Gardens?
Median Population Age in Bayside Gardens is 58.3 Years.
What is the Average Family Size in Bayside Gardens
Average Family Size in Bayside Gardens is 2.1 People.
What is the Average Household Size in Bayside Gardens
Average Household Size in Bayside Gardens is 1.8 People.
What is Per Capita Income in Bayside Gardens?
Per Capita income in Bayside Gardens is $47,984.
What is the Median Family Income in Bayside Gardens?
Median Family Income in Bayside Gardens is $74,900.
What is the Median Household income in Bayside Gardens?
Median Household Income in Bayside Gardens is $73,813.
What is Income or Wage Gap in Bayside Gardens?
Income or Wage Gap in Bayside Gardens is 25.2%.
Women in Bayside Gardens earn 74.8 cents for every dollar earned by a man.
What is Inequality or Gini Index in Bayside Gardens?
Inequality or Gini Index in Bayside Gardens is 0.36.
How Large is the Labor Force in Bayside Gardens?
There are 475 People in the Labor Forcein in Bayside Gardens.
What is the Percentage of People in the Labor Force in Bayside Gardens?
52.1% of People are in the Labor Force in Bayside Gardens.